12 16 20 24
TRANSCRIPT
ANNuAl rEPort 2006
DoNG ENErGy A/s
Kraftværksvej 53skærbæk7000 FredericiaDenmark
tel. +45 9955 1111Fax +45 7556 4477
DoNG ENErGy A/sAnnual report 2006editorial offi ce: DONG energy, Group financeDesign, production and printing: DatagrafPhotos: Jasper Carlberg and Thomas PriskornThis report was printed by an ISO 14001 eco-certifi ed and eMAS-registered printing fi rm, using chlorine-free paperand vegatable inks.
editorial work was completed on 12 March 2007.
ISbN: 87-91906-04-0Annual report 2006 08.11.29.01
ConTenTS
mArKeTS dISTrIBuTIon
Markets sells DONG energy’s electricity, natural gas and related products to more than one million customers in Denmark, Sweden, Germany and the Netherlands. The customers include residential customers, industrial customers, public sector customers and wholesale customers.
Distribution takes care of DONG energy’s electricity and gas distribution and storage of natural gas in Denmark.The electricity distribution takes place in the metropolitan area and in North Zealand while the gas distribution covers southern Jutland and South and West Zealand.
generATIon
Generation produces energy from effi cient power stations and renewable energy sources. Generation is a market leader within design, construction and operation of offshore wind farms and clean coal technology.
exploration & Production creates value through oil and gas production and procurement of gas at competitive prices.The exploration and production activities are carried out in Danish, Norwegian, UK and faroese waters.
expLorATIon & produCTIon
DONG energy in brief CoverPreface 2Management’s review Consolidated fi nancial highlights 6 Major highlights and outlook for 2007 7 Generation 12 exploration & Production 16 Distribution 20 Markets 24 employees 28 Safety and environment 30 risk management 32 Corporate governance 38
DO
NG
eN
er
GY
/ AN
NU
AL r
eP
Or
T 200
6financial review 42Management statement and Auditors’ report 47Consolidated income statement 49Consolidated balance sheet 50Consolidated statement of changes in equity 52Consolidated cash fl ow statement 54Notes 55Company information Coverfinancial statements of the parent company Cover(CD-rOM enclosed*)
* The fi nancial statements of the parent company, DONG energy A/S, that appear
from the enclosed CD-rOM, form an integral part of the overall annual report.
the fi nancial statements of the parent company, DoNG Energy A/s,
that appear from the enclosed cD-roM, form an integral part of the overall
annual report. Parts of the parent company’s fi nancial statements
appear in the printed part of the annual report only, as these parts are
identical to the corresponding parts in the consolidated fi nancial
statements. the parts in question are: statement by the Executive
and supervisory boards, independent auditors’ report, management’s
review, and the parts of the accounting policies that are identical
for the Group and the parent company.
12 20 2416
Omslag arsrapport_UK.indd 1 30/03/07 11:19:17
dong energyIN brIef
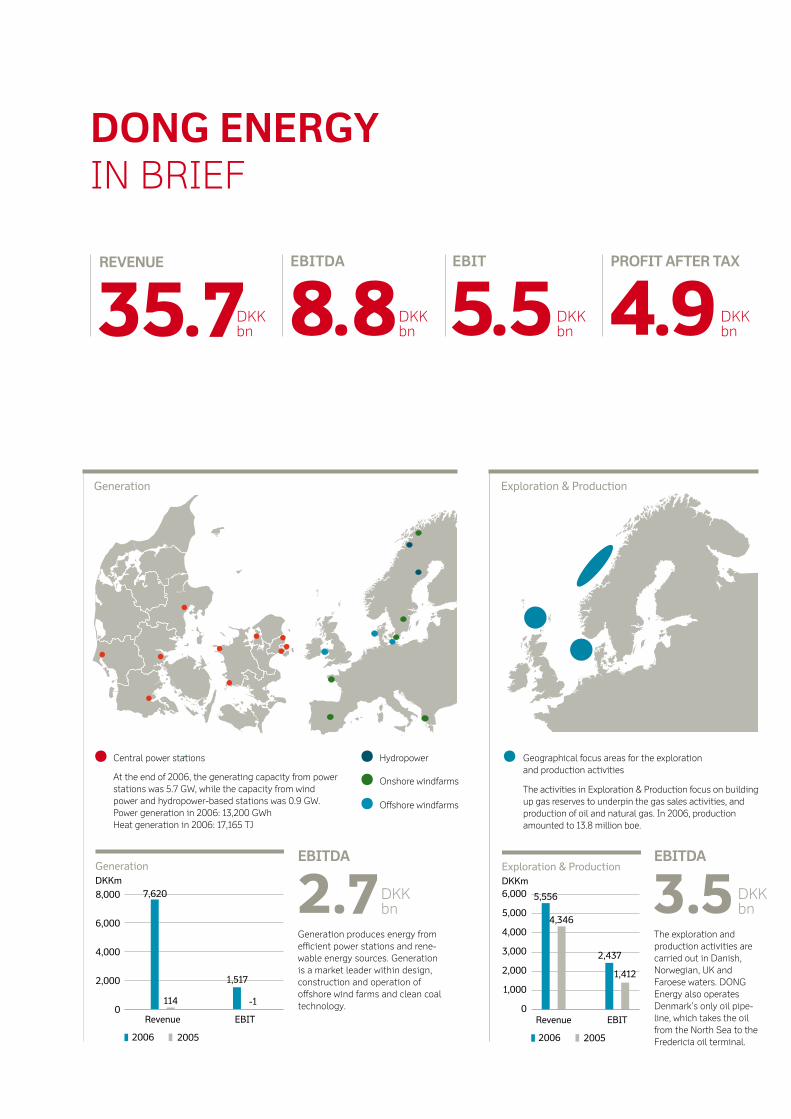
35.7revenue
8.8eBITdA
5.5eBIT
4.9profIT AfTer TAx
0
20
40
60
80
100
120
20052006
Assets at year end
105
47
DKKbn
0
500
1,000
1,500
2,000
2,500
3,000
EBITRevenue
Distribution
467
857
2,560
161
DKKm
20052006
0
5,000
10,000
15,000
20,000
25,000
EBITRevenue
Markets
1,217
13,885
24,115
2,582
DKKm
20052006
0
1,000
2,000
3,000
4,000
5,000
6,000
20052006
Number of employeesat year end
4,585
1,018
Distribution
electricity distribution
The electricity distribution customers are located in North Zealand, Copen-hagen and frederiksberg
Markets
EBITDA by segment
40%
18% 11%
31%
Markets
GenerationExploration & ProductionDistribution
Gas distribution
The gas distribution customers are located in southern Jutland and South and West Zealand
eBITdA
1.0Distribution takes care of DONG energy’s electricity and gas distribution and gas storage in Denmark.
Distribution serves approx. 956,000 customers with electricityand approx. 116,000 customers with natural gas. The gas storage capacity is 401 million m3.
eBITdA
1.6With around one million customers, Markets is Denmark’s largest electri-city and gas supplier.
The focus area is the Northern european market, where electricity, gas and related products are sold.
Exploration & Production
The activities in exploration & Production focus on buildingup gas reserves to underpin the gas sales activities, and production of oil and natural gas. In 2006, production amounted to 13.8 million boe.
Geographical focus areas for the exploration and production activities
0
1,000
2,000
3,000
4,000
5,000
6,000
EBITRevenue
Exploration & Production
20052006
2,437
4,346
5,556
1,412
DKKm
eBITdA
3.5The exploration and production activities are carried out in Danish, Norwegian, UK and faroese waters. DONG energy also operates Denmark’s only oil pipe-line, which takes the oil from the North Sea to the fredericia oil terminal.
Gas storage facility near Stenlille on Zealand
0
2,000
4,000
6,000
8,000
EBITRevenue
Generation
1,517
114
7,620
-1
DKKm
20052006
Offshore windfarms
Onshore windfarms
Central power stations Hydropower
At the end of 2006, the generating capacity from power stations was 5.7 GW, while the capacity from wind power and hydropower-based stations was 0.9 GW.Power generation in 2006: 13,200 GWhHeat generation in 2006: 17,165 TJ
eBITdA
2.7Generation produces energy from efficient power stations and rene-wable energy sources. Generation is a market leader within design, construction and operation of offshore wind farms and clean coal technology.
Generation
CompAny InformATIon AT 31 deCemBer 2006
Kresten philipsen, b. 1945. Joined the Supervisory board in 2006.
Term of office expires in 2007.
Other managerial posts and Supervisory board memberships:
Sydbank A/S (Chairman)
Privathospitalet A/S (Chairman)
DTL A/S Dansk-Tysk Landbrugsinvestering (member)
CSC Datalab A/S (Chairman)
CSC Scandihealth A/S (Chairman)
Dansk Affald A/S (Chairman)
Dansk retursystem A/S (Chairman)
Syd energi Holding A/S (Chairman)
Syd energi amba (Chairman)
Netsam A/S (member)
Det Danske Hedeselskab af 01.01.2002 A/S (member)
A/S Plantningsselskabet Sønderjylland (member)
Jesper magtengaard,**b. 1947. Joined the Supervisory board in 2003.
Term of office expires in 2007.
Jens Kampmann, b. 1937. Joined the Supervisory board in 2005.
Term of office expires in 2007.
Other managerial posts and Supervisory board memberships:
Sund og bælt Holding A/S (Chairman)
Öresundsbro Konsortiet Ab (Chairman)
HMK Holding A/S (Chairman)
retrocom Holding A/S (member)
Desmi A/S (Chairman)
frydenholm Holding A/S (Chairman)
Lars Torpe Christoffersen,b. 1964. Joined the Supervisory board in
2004, re-elected 2006.
Term of office expires in 2007.
Other managerial posts and Supervisory
board memberships:
Aktieselskabet Danatech engineering
(member)
LTC Holding A/S (member)
Telefaction A/S (member)
Actimizer A/S (member)
Capidea A/S (member)
poul Arne nielsen,b. 1944. Joined the Supervisory board in 2006.
Term of office expires in 2007.
Other managerial posts and Supervisory
board memberships:
Ny Stevns Municipality (Mayor)
SeAS-NVe a.m.b.A. (Chairman)
SeAS NVe Holding A/S (Chairman)
SeAS-NVe Strømmen A/S (Chairman)
SeAS Transmission A/S (Chairman)
Dagbladet/frederiksborg Amtsavis A/S (Chairman)
Østtrafik A/S (Deputy Chairman)
SAMPeNSION A/S (member)
suPErvisory boArD*
niels Berg-HansenOther managerial posts
and Supervisory board
memberships:
None
ExEcutivE boArD*
Carsten Krogsgaard Thomsen ***Other managerial posts
and Supervisory board
memberships:
energiGruppen Jylland
A/S (Deputy Chairman)
energiGruppen Jylland
Varme A/S (member)
NNIT A/S (member)
Kurt Bligaard pedersenOther managerial posts
and Supervisory board
memberships:
brfkredit A/S
(member)
Lars Clausen **** Other managerial
posts and Supervisory
board memberships:
None
Anders eldrup ***(CeO)
Other managerial
posts and Supervi-
sory board member-
ships:
None
Søren gath HansenOther managerial
posts and Supervisory
board memberships:
None
Bent Stubkjær pedersen,** b. 1953. Joined the Supervisory board in 2002, re-elected
2003. Term of office expires in 2007.
Other managerial posts and Supervisory board member-
ships: energiGruppen Jylland A/S (member)
Asbjørn Larsen,b. 1936. Joined the Supervisory board in 2003, re-elected
2005, 2006.
Term of office expires in 2007.
Other managerial posts and Supervisory board member-
ships:
belships ASA (Chairman)
fMC Technologies Inc. (member)
Saga fjordbase AS (Deputy Chairman)
Selvaag Gruppen AS (member)
Svend Sigaard, b. 1958. Joined the Supervisory board in 2002, re-elected
2004, 2006. Term of office expires in 2007.
Other managerial posts and Supervisory board member-
ships:
Nebraska ApS (CeO)
boConcept Holding A/S (Chairman)
Stjernholm A/S (Chairman)
DanTruck-Heden (Deputy Chairman)
Aalborg Industries Holding A/S (member)
Investering og Tryghed A/S (member)
Muehlhan A/S (member)
Thorkild meiner-Jensen,**b. 1944. Joined the Supervisory board in 1981, re-elected 1983,
1985, 1987, 1991, 1995, 1999, 2002, 2003.
Term of office expires in 2007.
Lars nørby Johansen (Deputy Chairman),
b. 1949. Joined the Supervisory board in 1997, re-elected 1998,
2000, Deputy Chairman 2001, 2003, 2005, 2006.
Term of office expires in 2007.
Other managerial posts and Supervisory board memberships:
falck A/S (Chairman)
TV2/Danmark A/S (Chairman)
William Demant Holding A/S (Deputy Chairman)
Stig Jørgensen og Partners AS (Chairman)
fritz H. Schur (Chairman),
b. 1951. Joined the Supervisory board in 2005 as Chairman.
Term of office expires in 2007.
Other managerial posts and Supervisory board memberships:
fritz Schur Gruppen (CeO)
CeO and/or Chairman in companies of the fritz Schur Group
Post Danmark A/S (Chairman)
f. Uhrenholt Holding A/S (Chairman)
brd. Klee A/S (Deputy Chairman)
byrumLabflex A/S (member)
SAS Ab (member)
De POST NV/LA POSTe SA (member) * Other managerial posts and Supervisory board memberships
refer solely to posts in Danish or foreign public limited companies.
** employee representative.
*** registered with the Danish Commerce and Companies Agency as CeO.
Carsten Krogsgaard Thomsen was registered at 1 January 2007 as CfO.
**** Joined the executive board at 1 January 2007.
AuDitorsKPMG c.Jespersen
statsautoriseret revisionsinteressentskab
Deloitte
statsautoriseret revisionsaktieselskab
DoNG ENErGy A/sKraftværksvej 53
skærbæk
7000 Fredericia
Denmark
tel. +45 9955 1111
Fax +45 7556 4477
www.dongenergy.com
reg. No. 36 21 37 28
shArEholDErsboE service A/s 1.16%
Energi horsens Net holding A/s 4.30%
Ess Net A/s 6.95%
Galten Elværk Net A/s 0.91%
GEv Net A/s 0.10%
Nyborg Elnet A/s 0.61%
Østjysk Energi Net A/s 2.11%
sEAs-NvE holding A/s 10.88%
the Danish state through the
Ministry of Finance 72.98%
electricity and gas markets
Sales offices
energy exchanges and hubs
DKKbn
DKKbn
DKKbn
DKKbn
DKKbn
DKKbn
DKKbn
DKKbn
electricity sales in 2006:5,870 GWh
Gas sales in 2006:8,202 million m3
Omslag arsrapport_UK.indd 2 26/03/07 17:21:23

dong energyIN brIef
35.7revenue
8.8eBITdA
5.5eBIT
4.9profIT AfTer TAx
0
20
40
60
80
100
120
20052006
Assets at year end
105
47
DKKbn
0
500
1,000
1,500
2,000
2,500
3,000
EBITRevenue
Distribution
467
857
2,560
161
DKKm
20052006
0
5,000
10,000
15,000
20,000
25,000
EBITRevenue
Markets
1,217
13,885
24,115
2,582
DKKm
20052006
0
1,000
2,000
3,000
4,000
5,000
6,000
20052006
Number of employeesat year end
4,585
1,018
Distribution
electricity distribution
The electricity distribution customers are located in North Zealand, Copen-hagen and frederiksberg
Markets
EBITDA by segment
40%
18% 11%
31%
Markets
GenerationExploration & ProductionDistribution
Gas distribution
The gas distribution customers are located in southern Jutland and South and West Zealand
eBITdA
1.0Distribution takes care of DONG energy’s electricity and gas distribution and gas storage in Denmark.
Distribution serves approx. 956,000 customers with electricityand approx. 116,000 customers with natural gas. The gas storage capacity is 401 million m3.
eBITdA
1.6With around one million customers, Markets is Denmark’s largest electri-city and gas supplier.
The focus area is the Northern european market, where electricity, gas and related products are sold.
Exploration & Production
The activities in exploration & Production focus on buildingup gas reserves to underpin the gas sales activities, and production of oil and natural gas. In 2006, production amounted to 13.8 million boe.
Geographical focus areas for the exploration and production activities
0
1,000
2,000
3,000
4,000
5,000
6,000
EBITRevenue
Exploration & Production
20052006
2,437
4,346
5,556
1,412
DKKm
eBITdA
3.5The exploration and production activities are carried out in Danish, Norwegian, UK and faroese waters. DONG energy also operates Denmark’s only oil pipe-line, which takes the oil from the North Sea to the fredericia oil terminal.
Gas storage facility near Stenlille on Zealand
0
2,000
4,000
6,000
8,000
EBITRevenue
Generation
1,517
114
7,620
-1
DKKm
20052006
Offshore windfarms
Onshore windfarms
Central power stations Hydropower
At the end of 2006, the generating capacity from power stations was 5.7 GW, while the capacity from wind power and hydropower-based stations was 0.9 GW.Power generation in 2006: 13,200 GWhHeat generation in 2006: 17,165 TJ
eBITdA
2.7Generation produces energy from efficient power stations and rene-wable energy sources. Generation is a market leader within design, construction and operation of offshore wind farms and clean coal technology.
Generation
CompAny InformATIon AT 31 deCemBer 2006
Kresten philipsen, b. 1945. Joined the Supervisory board in 2006.
Term of office expires in 2007.
Other managerial posts and Supervisory board memberships:
Sydbank A/S (Chairman)
Privathospitalet A/S (Chairman)
DTL A/S Dansk-Tysk Landbrugsinvestering (member)
CSC Datalab A/S (Chairman)
CSC Scandihealth A/S (Chairman)
Dansk Affald A/S (Chairman)
Dansk retursystem A/S (Chairman)
Syd energi Holding A/S (Chairman)
Syd energi amba (Chairman)
Netsam A/S (member)
Det Danske Hedeselskab af 01.01.2002 A/S (member)
A/S Plantningsselskabet Sønderjylland (member)
Jesper magtengaard,**b. 1947. Joined the Supervisory board in 2003.
Term of office expires in 2007.
Jens Kampmann, b. 1937. Joined the Supervisory board in 2005.
Term of office expires in 2007.
Other managerial posts and Supervisory board memberships:
Sund og bælt Holding A/S (Chairman)
Öresundsbro Konsortiet Ab (Chairman)
HMK Holding A/S (Chairman)
retrocom Holding A/S (member)
Desmi A/S (Chairman)
frydenholm Holding A/S (Chairman)
Lars Torpe Christoffersen,b. 1964. Joined the Supervisory board in
2004, re-elected 2006.
Term of office expires in 2007.
Other managerial posts and Supervisory
board memberships:
Aktieselskabet Danatech engineering
(member)
LTC Holding A/S (member)
Telefaction A/S (member)
Actimizer A/S (member)
Capidea A/S (member)
poul Arne nielsen,b. 1944. Joined the Supervisory board in 2006.
Term of office expires in 2007.
Other managerial posts and Supervisory
board memberships:
Ny Stevns Municipality (Mayor)
SeAS-NVe a.m.b.A. (Chairman)
SeAS NVe Holding A/S (Chairman)
SeAS-NVe Strømmen A/S (Chairman)
SeAS Transmission A/S (Chairman)
Dagbladet/frederiksborg Amtsavis A/S (Chairman)
Østtrafik A/S (Deputy Chairman)
SAMPeNSION A/S (member)
suPErvisory boArD*
niels Berg-HansenOther managerial posts
and Supervisory board
memberships:
None
ExEcutivE boArD*
Carsten Krogsgaard Thomsen ***Other managerial posts
and Supervisory board
memberships:
energiGruppen Jylland
A/S (Deputy Chairman)
energiGruppen Jylland
Varme A/S (member)
NNIT A/S (member)
Kurt Bligaard pedersenOther managerial posts
and Supervisory board
memberships:
brfkredit A/S
(member)
Lars Clausen **** Other managerial
posts and Supervisory
board memberships:
None
Anders eldrup ***(CeO)
Other managerial
posts and Supervi-
sory board member-
ships:
None
Søren gath HansenOther managerial
posts and Supervisory
board memberships:
None
Bent Stubkjær pedersen,** b. 1953. Joined the Supervisory board in 2002, re-elected
2003. Term of office expires in 2007.
Other managerial posts and Supervisory board member-
ships: energiGruppen Jylland A/S (member)
Asbjørn Larsen,b. 1936. Joined the Supervisory board in 2003, re-elected
2005, 2006.
Term of office expires in 2007.
Other managerial posts and Supervisory board member-
ships:
belships ASA (Chairman)
fMC Technologies Inc. (member)
Saga fjordbase AS (Deputy Chairman)
Selvaag Gruppen AS (member)
Svend Sigaard, b. 1958. Joined the Supervisory board in 2002, re-elected
2004, 2006. Term of office expires in 2007.
Other managerial posts and Supervisory board member-
ships:
Nebraska ApS (CeO)
boConcept Holding A/S (Chairman)
Stjernholm A/S (Chairman)
DanTruck-Heden (Deputy Chairman)
Aalborg Industries Holding A/S (member)
Investering og Tryghed A/S (member)
Muehlhan A/S (member)
Thorkild meiner-Jensen,**b. 1944. Joined the Supervisory board in 1981, re-elected 1983,
1985, 1987, 1991, 1995, 1999, 2002, 2003.
Term of office expires in 2007.
Lars nørby Johansen (Deputy Chairman),
b. 1949. Joined the Supervisory board in 1997, re-elected 1998,
2000, Deputy Chairman 2001, 2003, 2005, 2006.
Term of office expires in 2007.
Other managerial posts and Supervisory board memberships:
falck A/S (Chairman)
TV2/Danmark A/S (Chairman)
William Demant Holding A/S (Deputy Chairman)
Stig Jørgensen og Partners AS (Chairman)
fritz H. Schur (Chairman),
b. 1951. Joined the Supervisory board in 2005 as Chairman.
Term of office expires in 2007.
Other managerial posts and Supervisory board memberships:
fritz Schur Gruppen (CeO)
CeO and/or Chairman in companies of the fritz Schur Group
Post Danmark A/S (Chairman)
f. Uhrenholt Holding A/S (Chairman)
brd. Klee A/S (Deputy Chairman)
byrumLabflex A/S (member)
SAS Ab (member)
De POST NV/LA POSTe SA (member) * Other managerial posts and Supervisory board memberships
refer solely to posts in Danish or foreign public limited companies.
** employee representative.
*** registered with the Danish Commerce and Companies Agency as CeO.
Carsten Krogsgaard Thomsen was registered at 1 January 2007 as CfO.
**** Joined the executive board at 1 January 2007.
AuDitorsKPMG c.Jespersen
statsautoriseret revisionsinteressentskab
Deloitte
statsautoriseret revisionsaktieselskab
DoNG ENErGy A/sKraftværksvej 53
skærbæk
7000 Fredericia
Denmark
tel. +45 9955 1111
Fax +45 7556 4477
www.dongenergy.com
reg. No. 36 21 37 28
shArEholDErsboE service A/s 1.16%
Energi horsens Net holding A/s 4.30%
Ess Net A/s 6.95%
Galten Elværk Net A/s 0.91%
GEv Net A/s 0.10%
Nyborg Elnet A/s 0.61%
Østjysk Energi Net A/s 2.11%
sEAs-NvE holding A/s 10.88%
the Danish state through the
Ministry of Finance 72.98%
electricity and gas markets
Sales offices
energy exchanges and hubs
DKKbn
DKKbn
DKKbn
DKKbn
DKKbn
DKKbn
DKKbn
DKKbn
electricity sales in 2006:5,870 GWh
Gas sales in 2006:8,202 million m3
Omslag arsrapport_UK.indd 2 26/03/07 17:21:23

ANNuAl rEPort 2006
DoNG ENErGy A/s
Kraftværksvej 53skærbæk7000 FredericiaDenmark
tel. +45 9955 1111Fax +45 7556 4477
DoNG ENErGy A/sAnnual report 2006editorial offi ce: DONG energy, Group financeDesign, production and printing: DatagrafPhotos: Jasper Carlberg and Thomas PriskornThis report was printed by an ISO 14001 eco-certifi ed and eMAS-registered printing fi rm, using chlorine-free paperand vegatable inks.
editorial work was completed on 12 March 2007.
ISbN: 87-91906-04-0Annual report 2006 08.11.29.01
ConTenTS
mArKeTS dISTrIBuTIon
Markets sells DONG energy’s electricity, natural gas and related products to more than one million customers in Denmark, Sweden, Germany and the Netherlands. The customers include residential customers, industrial customers, public sector customers and wholesale customers.
Distribution takes care of DONG energy’s electricity and gas distribution and storage of natural gas in Denmark.The electricity distribution takes place in the metropolitan area and in North Zealand while the gas distribution covers southern Jutland and South and West Zealand.
generATIon
Generation produces energy from effi cient power stations and renewable energy sources. Generation is a market leader within design, construction and operation of offshore wind farms and clean coal technology.
exploration & Production creates value through oil and gas production and procurement of gas at competitive prices.The exploration and production activities are carried out in Danish, Norwegian, UK and faroese waters.
expLorATIon & produCTIon
DONG energy in brief CoverPreface 2Management’s review Consolidated fi nancial highlights 6 Major highlights and outlook for 2007 7 Generation 12 exploration & Production 16 Distribution 20 Markets 24 employees 28 Safety and environment 30 risk management 32 Corporate governance 38
DO
NG
eN
er
GY
/ AN
NU
AL r
eP
Or
T 200
6
financial review 42Management statement and Auditors’ report 47Consolidated income statement 49Consolidated balance sheet 50Consolidated statement of changes in equity 52Consolidated cash fl ow statement 54Notes 55Company information Coverfinancial statements of the parent company Cover(CD-rOM enclosed*)
* The fi nancial statements of the parent company, DONG energy A/S, that appear
from the enclosed CD-rOM, form an integral part of the overall annual report.
the fi nancial statements of the parent company, DoNG Energy A/s,
that appear from the enclosed cD-roM, form an integral part of the overall
annual report. Parts of the parent company’s fi nancial statements
appear in the printed part of the annual report only, as these parts are
identical to the corresponding parts in the consolidated fi nancial
statements. the parts in question are: statement by the Executive
and supervisory boards, independent auditors’ report, management’s
review, and the parts of the accounting policies that are identical
for the Group and the parent company.
12 20 2416
Omslag arsrapport_UK.indd 1 30/03/07 11:19:17

DONG Energy is one of the leading energy groups in the Nordic region. Our headquarter is in Denmark. Our business is based on procuring, producing, distributing, trading and selling energy and related products in Northern Europe. We employ approx. 4,500 people and generate DKK 36 billion in revenue. It is planned to list DONG Energy’s shares on the Copenhagen Stock Exchange in the second half of 2007, market conditions permitting.
�
DONG ENErGyDENmarK’S NEW ENErGy COmpaNy

DONG ENErGy aNNual rEpOrt 2006
2006 was the year in which Denmark’s new large energy company was created. the merger of DONG, Elsam, Energi E2, Nesa and electricity activities of Copenhagen Energy and Frederiksberg Forsyning is now a reality.
On 14 march 2006, the European Commission approved the merger of the six companies, and at the annual Gene-ral meeting on 19 april 2006 a number of former Elsam and Energi E2 shareholders elected to exchange their re-spective shares for shares in DONG Energy. the State’s ownership interest was thus reduced to approx. 73%.
On 1 July 2006, Vattenfall transferred its 35% stake in Elsam to DONG Energy in return for the simultaneous transfer of various assets from Elsam and Energi E2. By virtue of this last transaction, DONG Energy gained full control of all the acquired companies.
the Eu Commission’s approval was subject to two con-ditions: 1) sale of the gas storage facility near ll. torup, and 2) the introduction of a six-year gas auction pro-gramme under which DONG Energy is required to deli-ver 400 million m3 of gas per annum in Denmark in re-turn for the receipt of equivalent quantities abroad. the ll. torup gas storage facility has been sold to Energinet.dk, and the first of the six gas release auctions has taken place.
as a consequence of the acquisition of Nesa, DONG Energy must also sell the 132 kV transmission network in North Zealand to Energinet.dk. the sales process has not yet been completed.
Performance in 2006the financial results for the year were highly satisfactory. there were large increases in the price of oil, gas and electricity. the combination of a lack of rain in Norway and Sweden and the temporary closure of a number of nuclear power plants in Sweden was the main driver be-hind a significant increase in electricity prices that incre-ased earnings for Generation. Exploration & production benefited from the increase in oil prices, while markets benefited from time lags in natural gas purchase and sa-les contracts.
Competition in Denmark remains fierce, especially with-in the natural gas area, where liberalisation of the mar-ket is still leading to losses in market share. In volume terms, the loss of natural gas sales in Denmark was off-set by increased export sales, especially to Germany and the Netherlands. Competition in the electricity area has also increased, with Vattenfall acting as a new major supplier.
profit after tax was DKK 4,917 million, albeit assisted by the favourable price trends throughout the year. profit was eroded by non-recurring items of DKK 385 million. the results achieved were considerably higher than ori-ginally forecasted at the start of the year.
On the environmental front, major resources have been invested in a number of projects aimed at reducing emissions of CO2 equivalents. the number of lost time accidents per one million hours worked for employees and contractors’ employees was 10.3. the aim is to redu-ce the accident frequency significantly, and various mea-sures to this end have consequently been put in place.
Proposed dividendsthe Supervisory Board recommends that a dividend of 40% of profit after tax be paid for 2006, giving a divi-dend payment of DKK 1,967 million.
Updated strategyIn connection with the merger of the six companies a natural need arose for a review of the existing company strategy. the new strategy has three core elements:
procurement of competitive gas Establishment of stable and sustainable electricity generation Optimisation of the infrastructure and the existing market position
the strategic review resulted in the decision to dispose of the Spanish and Greek wind power activities, to de-emphasise investment in waste-fired power stations outside Denmark, and to invest in production of second-generation bioethanol.
■
■
■
PrEFACE
�
>>

prEFaCE
Chairman Fritz H. Schur and
CEO Anders Eldrup

DONG ENErGy aNNual rEpOrt 2006
Procurement of competitive gasthe strategy in this area is to increase production of equity gas, and to supplement that equity production with long-term purchase agreements. the aim is to ob-tain 30% self-sufficiency in gas.
DONG Energy has made significant headway in realising this strategy in 2006. On 19 June 2006, DONG Energy signed a 20-year agreement with the russian company Gazprom on gas supplies for delivery at the Danish-Ger-man border from and including 2011. under a separate agreement, DONG Energy must deliver gas in the uK, for a 15-year period beginning at the end of 2007.
On 5 February 2007, Wingas and DONG Energy signed a gas swap agreement under which DONG Energy is to deli-ver 5 billion m3 of gas to Wingas in the uK against recei-ving corresponding deliveries in Northern Germany. In ad-dition, DONG Energy and Wintershall Erdgas Handelshaus have signed an agreement on gas deliveries in Germany.
the Ormen lange project, in which DONG Energy has a 10.3% stake, remains on schedule and was 91% comple-te at the end of 2006. First gas from Ormen lange is anti-cipated in the fourth quarter of 2007. the project costs are in line with the original budget. Ormen lange is a key element in achieving a higher degree of self-sufficiency. DONG Energy is also investing in gas and oil exploration, both in the Danish and the Norwegian sectors of the
North Sea and in the area between the Shetland Islands and the Faroe Islands.
Establishment of stable and sustainable electricity generationthe strategy is to ensure maximum efficiency and flexibi-lity in the choice of fuels for thermal electricity and heat generation while at the same time building up substantial capacity with respect to renewable energy, especially in the wind power area. particularly high priority is given to the development of CO2-neutral plants.
Change was a major feature of 2006, with the transfer of part of Elsam’s and Energi E2’s generating capacity to Vattenfall at the end of June. the divestment took place without any major problems.
DONG Energy invested in several Danish power stations during the course of 2006, in order to extend the lifetime of the plants, optimise operations, and reduce emissions of nitrogen oxides.
Outside Denmark, the preparations for the construction of a 280 mW gas-fired power plant in mongstad in Norway commenced. In Germany, the possibility of constructing a large, 1,600 mW coal-fired power plant in Greifswald is being explored. Within renewable energy, the 90 mW Bar-row offshore wind farm in the uK was completed in 2006, and the construction of a similar 90 mW offshore wind
�

farm in Burbo, the uK, is scheduled for completion in 2007. Construction of a third offshore wind farm in the uK, the 108 mW Gunfleet Sands, will commence in 2007. the establishment of more offshore wind farms in Denmark is also being considered.
Optimisation of the infrastructure and the existing market positionOne of the biggest challenges the company faces is the in-tegration of the electricity distribution activities of Nesa and Copenhagen Energy. the integration has proceeded accor-ding to plan thus far, and the next step will be the integrati-on of Frederiksberg Forsyning’s electricity activities, which until now have operated as a separate entity. In parallel with this, efforts have been made to expand the product range and to ensure a continued high level of customer sa-tisfaction.
New initiatives include the establishment of an optical fibre network, which enables us to offer an array of attractive ser-vices from which customers will be able to benefit in future.
Within the natural gas area, a new three-year distribution agreement was entered into with HNG midt-Nord, begin-ning on 1 January 2007. the agreement covers approx. 60% of HNG midt-Nord’s existing gas sales, securing a good market position for DONG Energy in Denmark. regardless of this, DONG Energy’s share of the Danish market is ex-pected to continue to decline due to increased competition.
DONG Energy’s market position abroad, especially in Ger-many and the Netherlands, has been strengthened by a number of new sales contracts and collaboration agreements.
Management changestorkild Bentzen and poul lind both elected to resign from the Executive Board at the end of the year. poul lind was succeeded on the Executive Board by lars Clausen. Niels Bergh-Hansen has taken over responsibility for the area of which torkild Bentzen was previously in charge.
New reporting structure and pro forma figuresas mentioned in the 2005 annual report, a new reporting structure has been implemented. It consists of four seg-
ments: Generation, Exploration & production, Distribu-tion and markets.
pro forma figures for 2006 are expected to be published for the planned IpO prospectus.
Status of the integrationthe integration of the six companies is proceeding to plan. One of the milestones was achieved in connection with the divestment of assets to Vattenfall on 1 July 2006. the divestment took place without problems. the integra-tion of the two electricity companies Elsam and Energi E2 is proceeding to plan and no major impediments are fore-seen. another milestone is the integration of the electri-city customers of Copenhagen Energy and Nesa into a joint It system. the integration is expected to be comple-ted during the summer of 2007. the biggest challenges in connection with the merger are thus expected to be resol-ved by the end of 2007.
Synergiesthe previously approved synergy targets still apply, and the preliminary results demonstrate that the planned sy-nergies can be achieved. It is expected that the full effect of the synergies will have largely been realised in 2008. Further details of the scope and composition of the synergies will be given in the prospectus.
Financing and ratingthe financing of the large acquisitions is in place, and it is consequently considered that it will not be necessary to issue new loans, apart from loans relating to refinancing.
On 11 august 2006, moody’s revised its outlook on the company from Baa1 Stable Outlook to positive Outlook. On 31 august 2006, Standard & poor’s similarly changed its outlook from BBB+ Stable Outlook to BBB+ positive Outlook.
Privatisation and IPOIn 2007, management’s focus will centre on the realisati-on of synergies and the upcoming IpO, which is expected to take place in the second half of 2007, market conditi-ons permitting.
�
prEFaCE
�
DONG ENErGy aNNual rEpOrt 2006
DKKm �00� 2005 2004 2003 2002
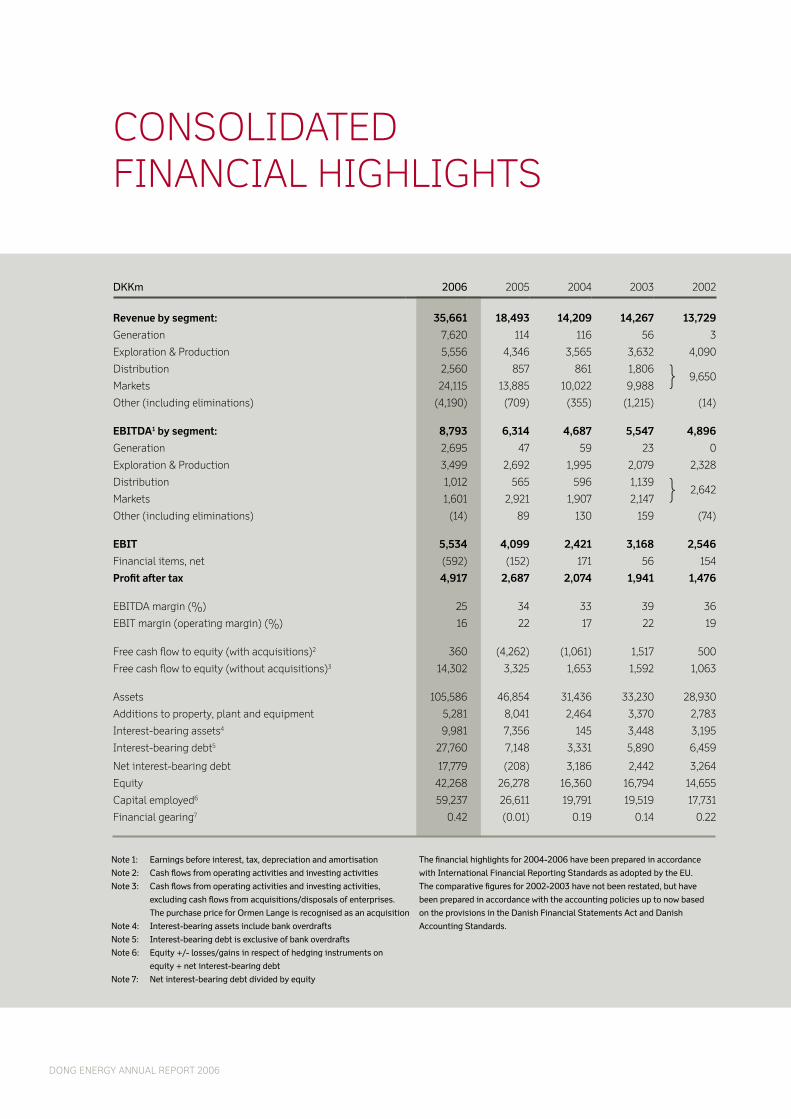
revenue by segment: 35,661 18,493 14,209 14,267 13,729
Generation 7,620 114 116 56 3
Exploration & production 5,556 4,346 3,565 3,632 4,090
Distribution 2,560 857 861 1,806 9,650
markets 24,115 13,885 10,022 9,988
Other (including eliminations) (4,190) (709) (355) (1,215) (14)
EBITDA1 by segment: 8,793 6,314 4,687 5,547 4,896
Generation 2,695 47 59 23 0
Exploration & production 3,499 2,692 1,995 2,079 2,328
Distribution 1,012 565 596 1,139 2,642
markets 1,601 2,921 1,907 2,147
Other (including eliminations) (14) 89 130 159 (74)
EBIT 5,534 4,099 2,421 3,168 2,546
Financial items, net (592) (152) 171 56 154
Profit after tax 4,917 2,687 2,074 1,941 1,476
EBItDa margin (%) 25 34 33 39 36
EBIt margin (operating margin) (%) 16 22 17 22 19
Free cash flow to equity (with acquisitions)2 360 (4,262) (1,061) 1,517 500
Free cash flow to equity (without acquisitions)3 14,302 3,325 1,653 1,592 1,063
assets 105,586 46,854 31,436 33,230 28,930
additions to property, plant and equipment 5,281 8,041 2,464 3,370 2,783
Interest-bearing assets4 9,981 7,356 145 3,448 3,195
Interest-bearing debt5 27,760 7,148 3,331 5,890 6,459
Net interest-bearing debt 17,779 (208) 3,186 2,442 3,264
Equity 42,268 26,278 16,360 16,794 14,655
Capital employed6 59,237 26,611 19,791 19,519 17,731
Financial gearing7 0.42 (0.01) 0.19 0.14 0.22
Note �: Earnings before interest, tax, depreciation and amortisation
Note �: Cash flows from operating activities and investing activities
Note 3: Cash flows from operating activities and investing activities,
excluding cash flows from acquisitions/disposals of enterprises.
The purchase price for Ormen Lange is recognised as an acquisition
Note �: Interest-bearing assets include bank overdrafts
Note �: Interest-bearing debt is exclusive of bank overdrafts
Note �: Equity +/- losses/gains in respect of hedging instruments on
equity + net interest-bearing debt
Note 7: Net interest-bearing debt divided by equity
The financial highlights for �00�-�00� have been prepared in accordance
with International Financial Reporting Standards as adopted by the EU.
The comparative figures for �00�-�003 have not been restated, but have
been prepared in accordance with the accounting policies up to now based
on the provisions in the Danish Financial Statements Act and Danish
Accounting Standards.
CONSOlIDatED FINaNCIal HIGHlIGHtS
7
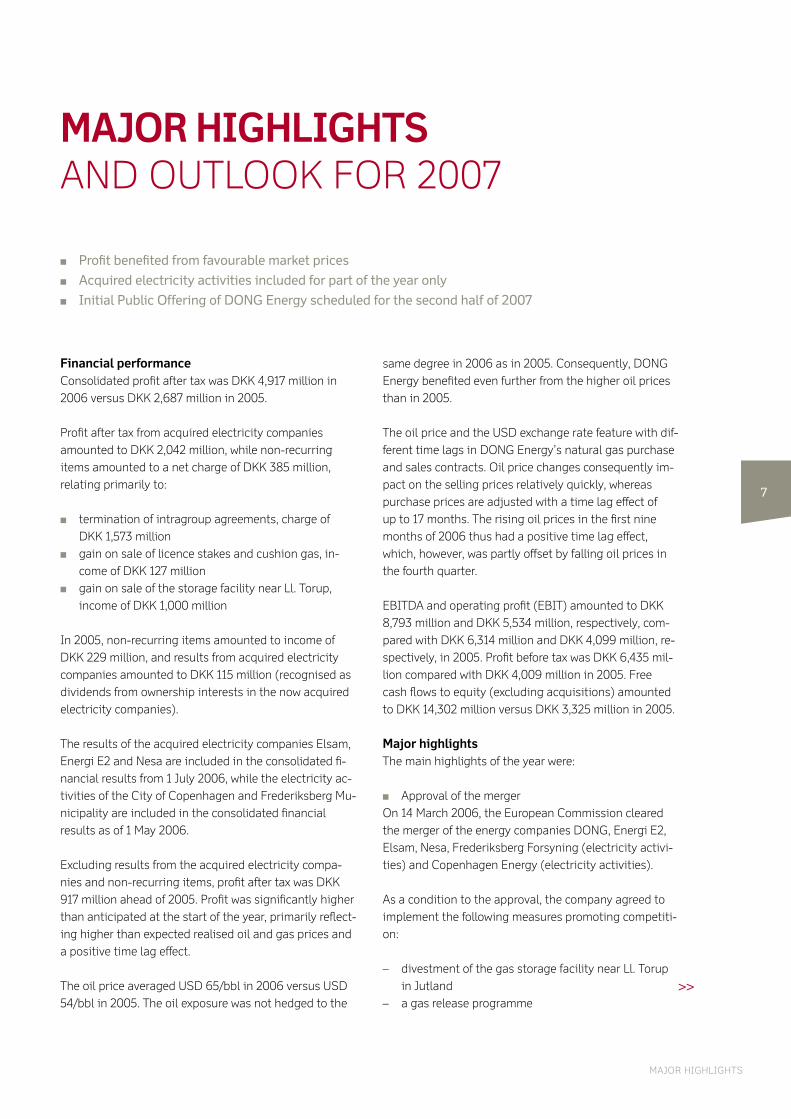
Financial performanceConsolidated profit after tax was DKK 4,917 million in 2006 versus DKK 2,687 million in 2005.
profit after tax from acquired electricity companies amounted to DKK 2,042 million, while non-recurring items amounted to a net charge of DKK 385 million, relating primarily to:
termination of intragroup agreements, charge of DKK 1,573 million
gain on sale of licence stakes and cushion gas, in-come of DKK 127 milliongain on sale of the storage facility near ll. torup,
income of DKK 1,000 million
In 2005, non-recurring items amounted to income of DKK 229 million, and results from acquired electricity companies amounted to DKK 115 million (recognised as dividends from ownership interests in the now acquired electricity companies).
the results of the acquired electricity companies Elsam, Energi E2 and Nesa are included in the consolidated fi-nancial results from 1 July 2006, while the electricity ac-tivities of the City of Copenhagen and Frederiksberg mu-nicipality are included in the consolidated financial results as of 1 may 2006.
Excluding results from the acquired electricity compa-nies and non-recurring items, profit after tax was DKK 917 million ahead of 2005. profit was significantly higher than anticipated at the start of the year, primarily reflect-ing higher than expected realised oil and gas prices and a positive time lag effect.
the oil price averaged uSD 65/bbl in 2006 versus uSD 54/bbl in 2005. the oil exposure was not hedged to the
■
■
■
same degree in 2006 as in 2005. Consequently, DONG Energy benefited even further from the higher oil prices than in 2005.
the oil price and the uSD exchange rate feature with dif-ferent time lags in DONG Energy’s natural gas purchase and sales contracts. Oil price changes consequently im-pact on the selling prices relatively quickly, whereas purchase prices are adjusted with a time lag effect of up to 17 months. the rising oil prices in the first nine months of 2006 thus had a positive time lag effect, which, however, was partly offset by falling oil prices in the fourth quarter.
EBItDa and operating profit (EBIt) amounted to DKK 8,793 million and DKK 5,534 million, respectively, com-pared with DKK 6,314 million and DKK 4,099 million, re-spectively, in 2005. profit before tax was DKK 6,435 mil-lion compared with DKK 4,009 million in 2005. Free cash flows to equity (excluding acquisitions) amounted to DKK 14,302 million versus DKK 3,325 million in 2005.
Major highlightsthe main highlights of the year were:
approval of the mergerOn 14 march 2006, the European Commission cleared the merger of the energy companies DONG, Energi E2, Elsam, Nesa, Frederiksberg Forsyning (electricity activi-ties) and Copenhagen Energy (electricity activities).
as a condition to the approval, the company agreed to implement the following measures promoting competiti-on:
– divestment of the gas storage facility near ll. torup in Jutland – a gas release programme
■
MAJOr HIGHLIGHTSaND OutlOOK FOr 2007
Profit benefited from favourable market prices
Acquired electricity activities included for part of the year only
Initial Public Offering of DONG Energy scheduled for the second half of �007
■
■
■
maJOr HIGHlIGHtS
>>
DONG ENErGy aNNual rEpOrt 2006
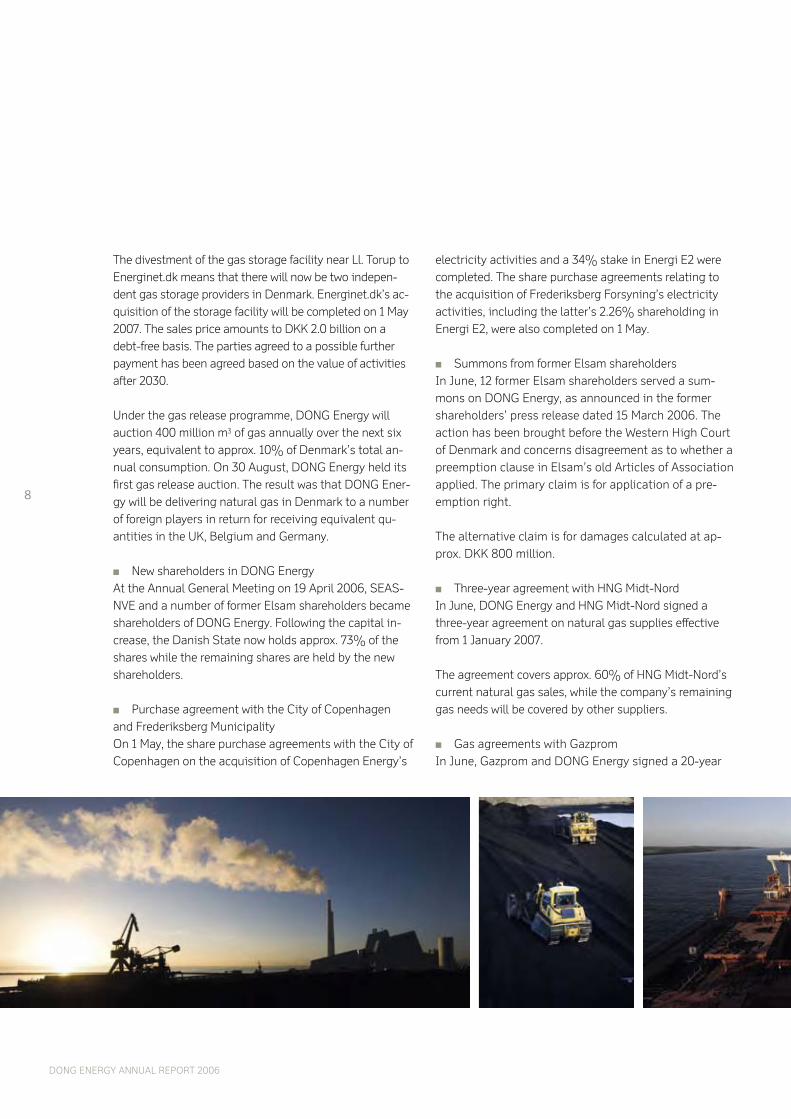
the divestment of the gas storage facility near ll. torup to Energinet.dk means that there will now be two indepen-dent gas storage providers in Denmark. Energinet.dk’s ac-quisition of the storage facility will be completed on 1 may 2007. the sales price amounts to DKK 2.0 billion on a debt-free basis. the parties agreed to a possible further payment has been agreed based on the value of activities after 2030.
under the gas release programme, DONG Energy will auction 400 million m3 of gas annually over the next six years, equivalent to approx. 10% of Denmark’s total an-nual consumption. On 30 august, DONG Energy held its first gas release auction. the result was that DONG Ener-gy will be delivering natural gas in Denmark to a number of foreign players in return for receiving equivalent qu-antities in the uK, Belgium and Germany.
New shareholders in DONG Energyat the annual General meeting on 19 april 2006, SEaS-NVE and a number of former Elsam shareholders became shareholders of DONG Energy. Following the capital in-crease, the Danish State now holds approx. 73% of the shares while the remaining shares are held by the new shareholders.
purchase agreement with the City of Copenhagenand Frederiksberg municipality On 1 may, the share purchase agreements with the City of Copenhagen on the acquisition of Copenhagen Energy’s
■
■
electricity activities and a 34% stake in Energi E2 were completed. the share purchase agreements relating to the acquisition of Frederiksberg Forsyning’s electricity activities, including the latter’s 2.26% shareholding in Energi E2, were also completed on 1 may.
Summons from former Elsam shareholdersIn June, 12 former Elsam shareholders served a sum-mons on DONG Energy, as announced in the former shareholders’ press release dated 15 march 2006. the action has been brought before the Western High Court of Denmark and concerns disagreement as to whether a preemption clause in Elsam’s old articles of association applied. the primary claim is for application of a pre-emption right.
the alternative claim is for damages calculated at ap-prox. DKK 800 million.
three-year agreement with HNG midt-NordIn June, DONG Energy and HNG midt-Nord signed a three-year agreement on natural gas supplies effective from 1 January 2007.
the agreement covers approx. 60% of HNG midt-Nord’s current natural gas sales, while the company’s remaining gas needs will be covered by other suppliers.
Gas agreements with GazpromIn June, Gazprom and DONG Energy signed a 20-year
■
■
■
�
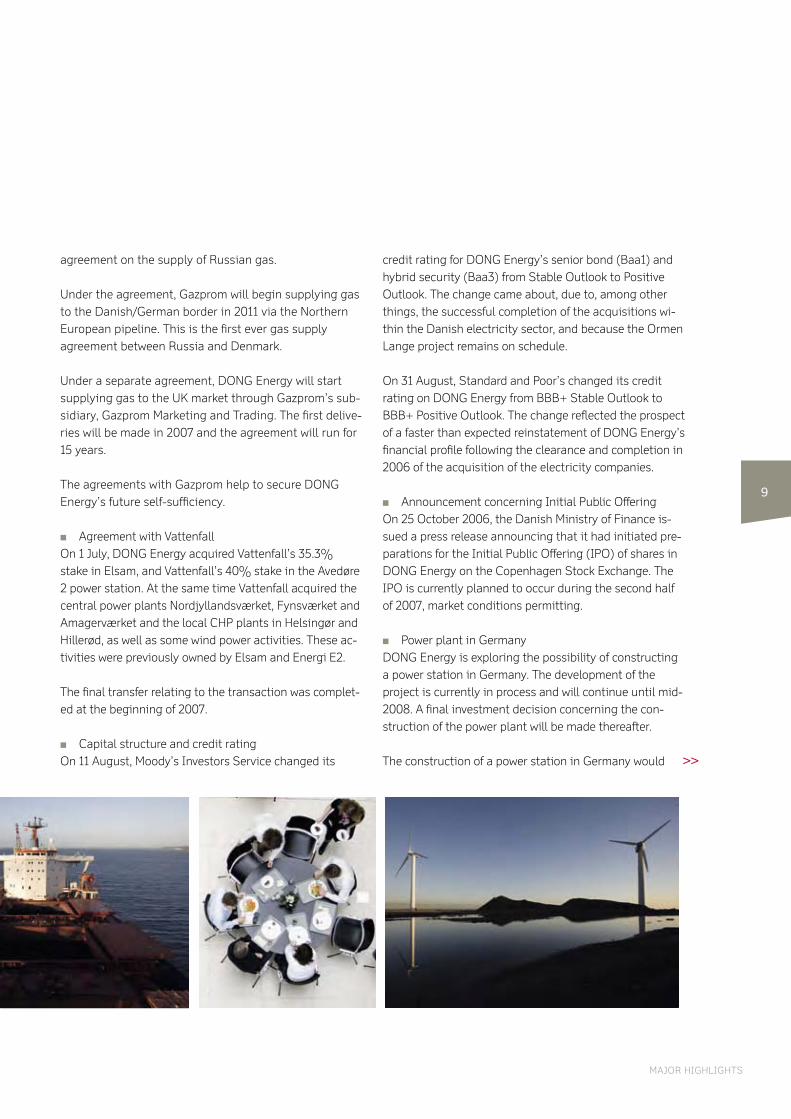
agreement on the supply of russian gas.
under the agreement, Gazprom will begin supplying gas to the Danish/German border in 2011 via the Northern European pipeline. this is the first ever gas supply agreement between russia and Denmark.
under a separate agreement, DONG Energy will start supplying gas to the uK market through Gazprom’s sub-sidiary, Gazprom marketing and trading. the first delive-ries will be made in 2007 and the agreement will run for 15 years.
the agreements with Gazprom help to secure DONG Energy’s future self-sufficiency.
agreement with VattenfallOn 1 July, DONG Energy acquired Vattenfall’s 35.3% stake in Elsam, and Vattenfall’s 40% stake in the avedøre 2 power station. at the same time Vattenfall acquired the central power plants Nordjyllandsværket, Fynsværket and amagerværket and the local CHp plants in Helsingør and Hillerød, as well as some wind power activities. these ac-tivities were previously owned by Elsam and Energi E2.
the final transfer relating to the transaction was complet-ed at the beginning of 2007.
Capital structure and credit ratingOn 11 august, moody’s Investors Service changed its
■
■
credit rating for DONG Energy’s senior bond (Baa1) and hybrid security (Baa3) from Stable Outlook to positive Outlook. the change came about, due to, among other things, the successful completion of the acquisitions wi-thin the Danish electricity sector, and because the Ormen lange project remains on schedule.
On 31 august, Standard and poor’s changed its credit rating on DONG Energy from BBB+ Stable Outlook to BBB+ positive Outlook. the change reflected the prospect of a faster than expected reinstatement of DONG Energy’s financial profile following the clearance and completion in 2006 of the acquisition of the electricity companies.
announcement concerning Initial public Offering On 25 October 2006, the Danish ministry of Finance is-sued a press release announcing that it had initiated pre-parations for the Initial public Offering (IpO) of shares in DONG Energy on the Copenhagen Stock Exchange. the IpO is currently planned to occur during the second half of 2007, market conditions permitting.
power plant in GermanyDONG Energy is exploring the possibility of constructing a power station in Germany. the development of the project is currently in process and will continue until mid-2008. a final investment decision concerning the con-struction of the power plant will be made thereafter.
the construction of a power station in Germany would
■
■
�
maJOr HIGHlIGHtS
>>

DONG ENErGy aNNual rEpOrt 2006
dated position will benefit from a full year contribution from the recently acquired power companies. Ormen lange is expected to go on stream in the fourth quarter, having only a small impact on the 2007 results, due to the limited production period.
Various assets are classified for sale in the 2006 closing balance sheet. the disposals are not expected to have a significant effect on the 2007 revenue and results.
Factors impacting the �007 outlookthe expected lower commodity prices in 2007 will have a negative impact on 2007 results compared with 2006. In addition to the effects of the underlying movement, DONG Energy is affected by two specific factors in relati-on to commodity price movements: the effect of time lags on contract prices, and DONG Energy’s manage-ment of its gas purchase contract portfolio. Changes in oil prices are reflected with different time lags in a number of DONG Energy’s natural gas purchase and sales contracts. Oil price changes impact selling prices relatively quickly, whereas purchase prices are adjusted with a lag of up to 17 months. as a conse-quence of the lower oil price that we expect to prevail in 2007 relative to 2006 the time lags have a negative ef-fect on profitability in 2007, whereas in 2006 due to rising oil prices the impact was positive.
DONG Energy buys gas under several types of contracts
�0
strengthen and support existing activities in Germany and is based on DONG Energy’s core competencies wi-thin clean coal technology.
Events after the balance sheet dateGas agreements with Wingas
In February 2007, Wingas and DONG Energy concluded a gas swap agreement. DONG Energy will deliver 5 billion m3 of gas to Wingas in the uK in the period from 2007 to 2017. In return, Wingas will deliver 5 billion m3 of gas to DONG Energy in Northern Germany in the period from 2010 to 2020. In addition, DONG Energy and Wintershall Erdgas Handelshaus have signed an agreement on gas deliveries in Germany under which Wintershall Erdgas Handelshaus will deliver up to 0.7 billion m3 of gas per annum in the period from 2010 to 2020.
Outlook for 2007AssumptionsDONG Energy’s financial results are affected by develop-ments in a number of commodity prices, including oil, gas, power, coal and CO2, as well as exchange rate move- ments, in particular the uS dollar. In 2006 oil, gas and electricity prices were considerably higher, on average, than the levels experienced so far in 2007. Our forecasts for oil, gas and electricity prices and the uSD exchange rate in 2007 are based on prices prevailing in early 2007.
Scope of operations2007 will be the first year that DONG Energy’s consoli-
■

with different price indexing. the purchases under the individual contracts are made within the gas year, which runs from 1 October to 30 September, although there is some flexibility with respect to which contracts purcha-ses are made under in the individual months during the gas year. Depending on current prices and the future price outlook, in some quarters the optimal solution is to buy gas under relatively costly contracts, and use the volumes available under less costly contracts in other quarters. Our expectations for prices in 2007 would make it advantageous to buy the relatively more costly gas in the 2007 calendar year.
In addition, whilst DONG Energy will continue to experi-ence restructuring costs these will be partially offset by synergies coming through in 2007.
the results from the power generation activities are also negatively impacted by the one-off depreciation of the 2007 CO2 allowances allocated to Elsam and Energi E2. these allowances are recognised and depreciated for ac-counting purposes as a result of the first time consolida-tion of the acquired companies. CO2 allowances used for own production do not normally impact the income statement and no such depreciation effect will occur in 2008 when new CO2 allocations are made. Finally, due to the increase in debt following the acquisi-tions of the power companies in 2006, DONG Energy will incur higher interest expenses.
Results outlookBased on the assumptions outlined above, DONG Ener-gy’s EBItDa for 2007 is expected to be slightly lower than in 2006. DONG Energy’s profit after tax for 2007, however, is expected to be substantially lower than in 2006 due to depreciation of CO2 quotas and higher interest expense.
STATEmENTS AbOUT THE FUTURE
The annual report contains statements about future conditi-
ons, including financial expectations for �007. These state-
ments are in their nature uncertain and associated with risks.
Several factors can result in the actual development differing
substantially from the expectations. Examples of such factors
include, but are not limited to, developments in the oil, gas,
power, coal, CO�, foreign exchange and interest rate markets,
changes in legislation, regulations or standards, changes in
the competitive situations on DONG Energy’s markets, secu-
rity of supply and the integration of acquired activities.
Reference is also made to the description of risks in the sec-
tion on Risk management on page 3�.
��
maJOr HIGHlIGHtS
��
DONG ENErGy aNNual rEpOrt 2006
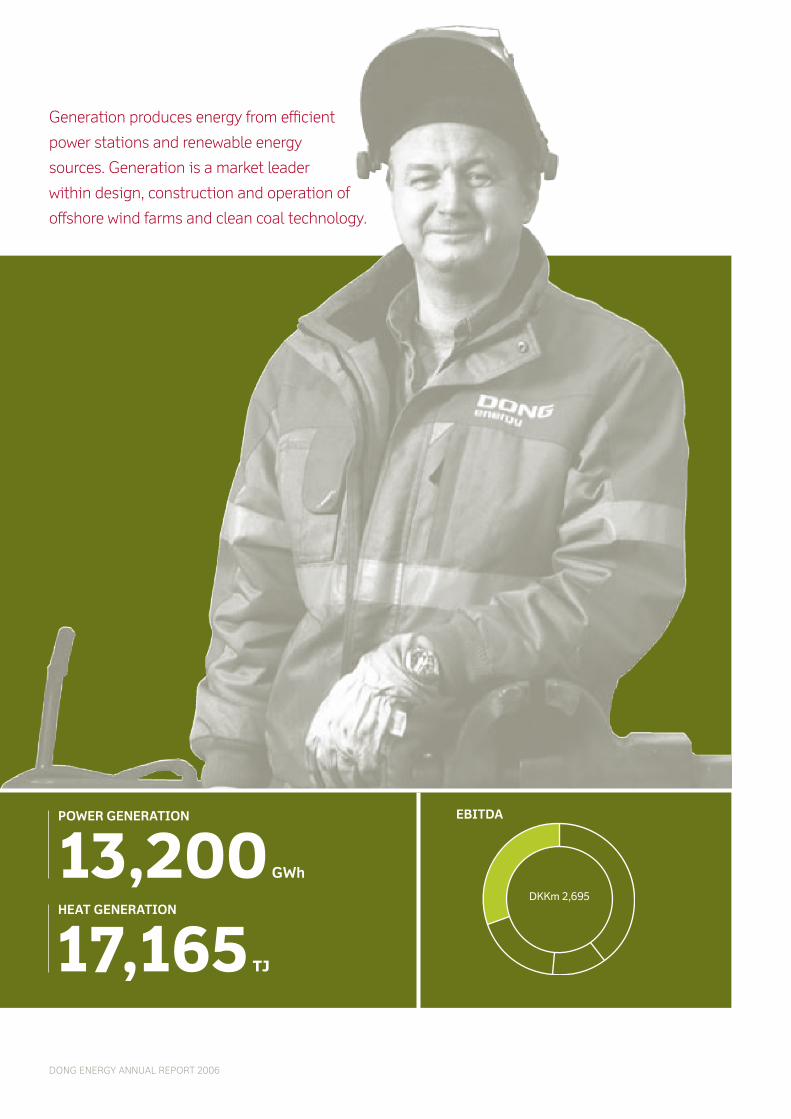
EBITDA
Generation produces energy from efficient
power stations and renewable energy
sources. Generation is a market leader
within design, construction and operation of
offshore wind farms and clean coal technology.
DKKm 2,695
13,200 GWh
POWEr GENErATION
17,165 TJ
HEAT GENErATION
�3
Generation’s core activities are construction, ownership and operation of power stations and CHp plants and sale of electricity and heat on the Northern European electrici-ty exchanges. Generation also undertakes activities wi-thin renewable energy, which account for 11% of total electricity generation.
power and heat generation takes place at ten central po-wer stations and a number of local and waste-fired power stations. the power stations have considerable flexibility with respect to choice of fuel, and can be fired by coal, na-tural gas, waste and a number of biofuels such as straw, wood pellets and wood chips.
DONG Energy has a strong position within renewable energy and is one of the world’s largest operators of off-shore wind farms. Within renewable energy the focus is on the construction and operation of onshore and offsho-re wind farms in Northern Europe. Besides electricity generation from wind farms, DONG Energy generates electricity at hydropower stations in Sweden and Nor-way. DONG Energy’s generating capacity from wind and hydro-based stations was 0.9 GW at the end of 2006, including 0.2 GW from hydropower stations. By compari-son, the total power station capacity was 5.7 GW.
Market conditionsIn June 2005, DONG and Vattenfall signed an agreement on the sale of power stations to Vattenfall in return for Vattenfall’s shareholdings in Elsam. the agreement was approved by the competition authorities in 2006.
With Vattenfall’s establishment as an important player in Denmark, a new competitive situation has arisen. DONG Energy now accounts for approx. 60% of total electricity generation in Denmark. Competition in the Northern European market has ensured that Danish electricity prices are, on average, among the lowest in Northern Europe.
the Danish Competition authority has analysed price formation in the electricity spot market in Western Den-mark. the Danish Competition Council previously impo-sed a price cap on Elsam, but the Danish Competition appeal tribunal found in its decision that a price cap is incompatible with a free electricity market. the price cap will therefore be discontinued. the Competition appeal tribunal has concluded that Elsam exploited its domi-nant position in Western Denmark to some extent in the period 1 July 2003 to 31 December 2004, by periodically charging excessive prices. DONG Energy has appealed the Competition appeal tribunal’s decision to the Da-nish maritime and Commercial Court. as a result of the appeal tribunal’s decision, customers have indicated that they will be advancing claims for compensation once such claims can be calculated. No provision has been made for any such claims.
regulatory issuesIn order to comply with the environmental targets of the Kyoto protocol, the Eu has laid down targets for CO2 emissions. a European market for CO2 quotas was there-fore established in 2005. On 17 January 2007, Denmark submitted the natio-nal allocation plan for the period 2008-2012 for the pur-pose of final approval in the Eu. the allocation plan di-stributes Denmark’s total number of CO2 quotas between the industrial sector, which will have its needs 92% covered, and the electricity sector, which will have to settle for having 57% of its needs covered. this is a reduction of about 30% compared with the allocation in the period 2005-2007. Despite the fact that DONG Ener-gy’s power stations are among the most efficient in the world, DONG Energy is among the companies that will be hardest hit by the CO2 regulation. DONG Energy’s reduction obligation will not imme-diately lead to higher prices for the consumers, as the Danish electricity prices are fixed in free competition on the Nord pool electricity exchange, where DONG Energy
GENErATIONOF pOWEr aND HEat
Possibility for construction of large power station in Greifswald being explored
more wind turbine projects planned
CO� allocation plan reduces DONG Energy’s quotas by about 30%
■
■
■
GENEratION
>>
��
DONG ENErGy aNNual rEpOrt 2006
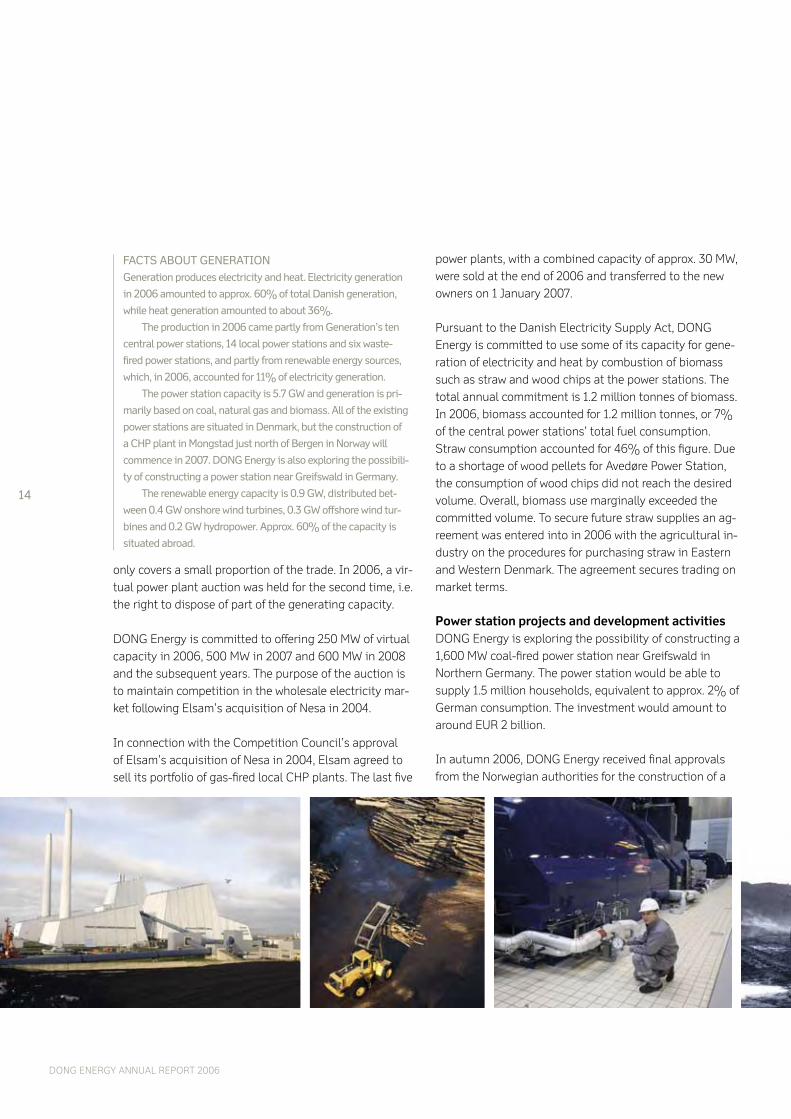
FACTS AbOUT GENERATIONGeneration produces electricity and heat. Electricity generation
in �00� amounted to approx. �0% of total Danish generation,
while heat generation amounted to about 3�%.
The production in �00� came partly from Generation’s ten
central power stations, �� local power stations and six waste-
fired power stations, and partly from renewable energy sources,
which, in �00�, accounted for ��% of electricity generation.
The power station capacity is �.7 GW and generation is pri-
marily based on coal, natural gas and biomass. All of the existing
power stations are situated in Denmark, but the construction of
a CHP plant in mongstad just north of bergen in Norway will
commence in �007. DONG Energy is also exploring the possibili-
ty of constructing a power station near Greifswald in Germany.
The renewable energy capacity is 0.� GW, distributed bet-
ween 0.� GW onshore wind turbines, 0.3 GW offshore wind tur-
bines and 0.� GW hydropower. Approx. �0% of the capacity is
situated abroad.
power plants, with a combined capacity of approx. 30 mW, were sold at the end of 2006 and transferred to the new owners on 1 January 2007.
pursuant to the Danish Electricity Supply act, DONG Energy is committed to use some of its capacity for gene-ration of electricity and heat by combustion of biomass such as straw and wood chips at the power stations. the total annual commitment is 1.2 million tonnes of biomass. In 2006, biomass accounted for 1.2 million tonnes, or 7% of the central power stations’ total fuel consumption. Straw consumption accounted for 46% of this figure. Due to a shortage of wood pellets for avedøre power Station, the consumption of wood chips did not reach the desired volume. Overall, biomass use marginally exceeded the committed volume. to secure future straw supplies an ag-reement was entered into in 2006 with the agricultural in-dustry on the procedures for purchasing straw in Eastern and Western Denmark. the agreement secures trading on market terms.
Power station projects and development activitiesDONG Energy is exploring the possibility of constructing a 1,600 mW coal-fired power station near Greifswald in Northern Germany. the power station would be able to supply 1.5 million households, equivalent to approx. 2% of German consumption. the investment would amount to around Eur 2 billion.
In autumn 2006, DONG Energy received final approvals from the Norwegian authorities for the construction of a
only covers a small proportion of the trade. In 2006, a vir-tual power plant auction was held for the second time, i.e. the right to dispose of part of the generating capacity. DONG Energy is committed to offering 250 mW of virtual capacity in 2006, 500 mW in 2007 and 600 mW in 2008 and the subsequent years. the purpose of the auction is to maintain competition in the wholesale electricity mar-ket following Elsam’s acquisition of Nesa in 2004. In connection with the Competition Council’s approval of Elsam’s acquisition of Nesa in 2004, Elsam agreed to sell its portfolio of gas-fired local CHp plants. the last five
��
GENEratION
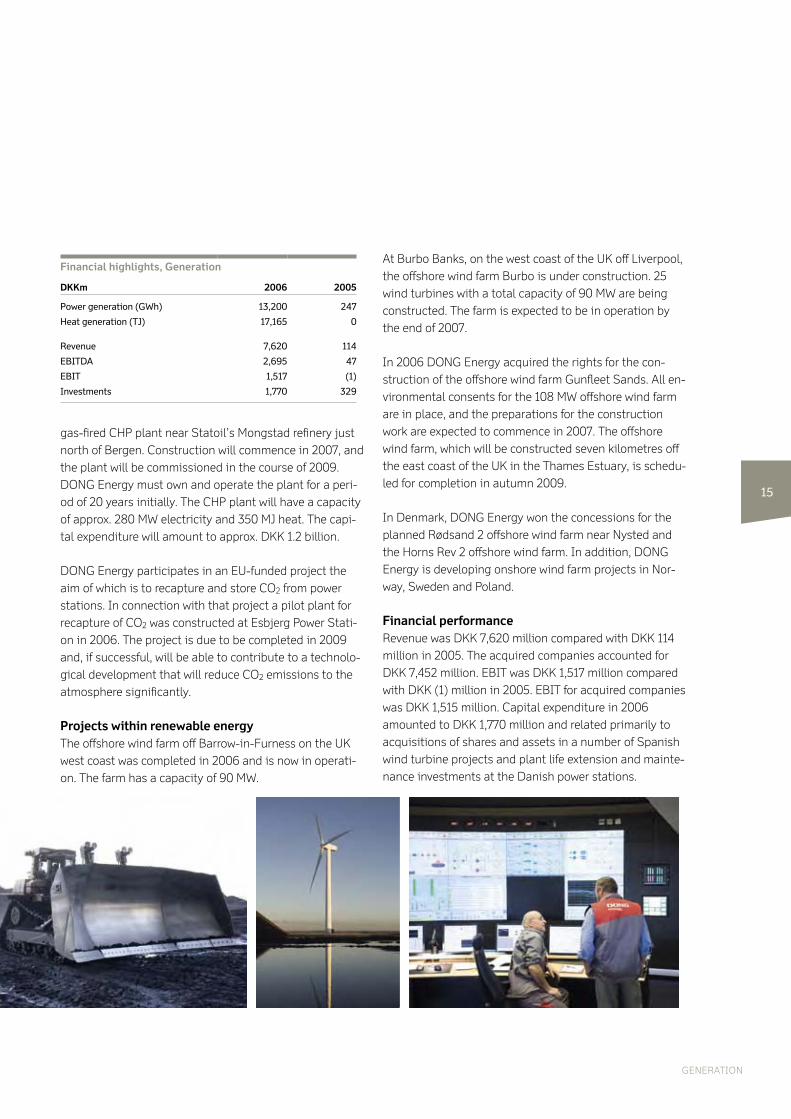
Financial highlights, Generation
DKKm 2006 2005
Power generation (GWh) �3,�00 ��7
Heat generation (TJ) �7,��� 0
Revenue 7,��0 ���
EbITDA �,��� �7
EbIT �,��7 (�)
Investments �,770 3��
at Burbo Banks, on the west coast of the uK off liverpool, the offshore wind farm Burbo is under construction. 25 wind turbines with a total capacity of 90 mW are being constructed. the farm is expected to be in operation by the end of 2007.
In 2006 DONG Energy acquired the rights for the con-struction of the offshore wind farm Gunfleet Sands. all en-vironmental consents for the 108 mW offshore wind farm are in place, and the preparations for the construction work are expected to commence in 2007. the offshore wind farm, which will be constructed seven kilometres off the east coast of the uK in the thames Estuary, is schedu-led for completion in autumn 2009.
In Denmark, DONG Energy won the concessions for the planned rødsand 2 offshore wind farm near Nysted and the Horns rev 2 offshore wind farm. In addition, DONG Energy is developing onshore wind farm projects in Nor-way, Sweden and poland.
Financial performancerevenue was DKK 7,620 million compared with DKK 114 million in 2005. the acquired companies accounted for DKK 7,452 million. EBIt was DKK 1,517 million compared with DKK (1) million in 2005. EBIt for acquired companies was DKK 1,515 million. Capital expenditure in 2006 amounted to DKK 1,770 million and related primarily to acquisitions of shares and assets in a number of Spanish wind turbine projects and plant life extension and mainte-nance investments at the Danish power stations.
gas-fired CHp plant near Statoil’s mongstad refinery just north of Bergen. Construction will commence in 2007, and the plant will be commissioned in the course of 2009. DONG Energy must own and operate the plant for a peri-od of 20 years initially. the CHp plant will have a capacity of approx. 280 mW electricity and 350 mJ heat. the capi-tal expenditure will amount to approx. DKK 1.2 billion.
DONG Energy participates in an Eu-funded project the aim of which is to recapture and store CO2 from power stations. In connection with that project a pilot plant for recapture of CO2 was constructed at Esbjerg power Stati-on in 2006. the project is due to be completed in 2009 and, if successful, will be able to contribute to a technolo-gical development that will reduce CO2 emissions to the atmosphere significantly.
Projects within renewable energythe offshore wind farm off Barrow-in-Furness on the uK west coast was completed in 2006 and is now in operati-on. the farm has a capacity of 90 mW.

��
DONG ENErGy aNNual rEpOrt 2006
EBITDA
DKKm 3,499
13.8 million boe
OIL & GAS PrODUCTION
107 million bbl
OIL TrANSPOrTATION
Exploration & production creates
value through oil and gas
production

�7
EXPLORATION & PRODUCTIONOF OIl aND GaS
Discovery of new reserves in the Syd Arne field
Co-ownership of Gassled strengthens supply flexibility
Development of Ormen Lange field on schedule
■
■
■
It is DONG Energy’s objective to produce sufficient volu-mes of equity natural gas to make up around 30% of its total sales volume. this is important in order to bolster DONG Energy’s competitiveness and secure supplies for the natural gas customers in Denmark and the Group’s markets in Europe.
the exploration and production activities consequently focus on building up a portfolio of gas reserves, and on production of oil and natural gas. reserves (2p) amounted to 350 million boe (barrels of oil equivalent) at the end of 2006 compared with 359 million boe at the end of 2005. production in 2006 amounted to 14 million boe, including 43% from the Norwegian activities. the ratio between reserves and production (r/p) was 25.
the oil price level in 2006 led to a continued high level of activity in the oil and gas industry and consequently shortages in equipment such as drilling rigs. a number of planned exploration and appraisal wells were therefo-re postponed. In order to ensure the continued develop-ment of reserves and production, agreements were ente-red into for rig capacity up to and including 2011, on an option basis, and also via long-term leasing of a rig. the rig under long-term lease will be operational from the second half of 2008.
In 2006, DONG Energy participated in ten exploration and appraisal wells compared with two in 2005. In Da-nish waters, exploration wells were drilled on the 1/02 Karlebo, 4/98 Stork and 11/98 ravn licenses. these were the last drilling obligations under the role as caretaker of the Danish State’s interests. the wells did not lead to any commercial oil or natural gas finds.
DONG Energy participated in an exploration well, Brug-dan, on the Faroese shelf in 2006. the well enhanced DONG Energy’s knowledge of the geology in the area,
but, due to technical problems, did not gain full clarity on the oil and natural gas potential in the area.
appraisal wells in the Syd arne field led to a new oil and natural gas find. the planning of the development of re-serves has commenced. DONG Energy supports a soluti-on whereby the find will be brought on stream as quickly as possible.
In Norway, DONG Energy participated in an appraisal well on licence pl301 (Krabbe/mime). the commercial potential will be appraised in conjunction with a well on the same licence to be drilled in 2007.
On the uK shelf in the area between the Faroe Islands and the Shetland Islands, appraisal wells were commen-ced in 2006 on licence p1026 rosebank, where a find was made in 2004. the appraisal activities are intended to increase knowledge concerning the extent of the find. DONG Energy participates in several activities on the uK shelf, and the area is considered a strategically im-portant region for both oil and natural gas exploration. together with other oil companies, DONG Energy parti-cipates in a task force appointed by the uK Government that is charged with exploring the possibilities for an overall infrastructure solution in the area.
the exploration portfolio was expanded in 2006. In Nor-way, DONG Energy was awarded five exploration licen-ces and the operatorship of two of these. the new licen-ces strengthen DONG Energy’s position on the mid-Norwegian shelf and in the area north of the Siri li-cence. after the end of the year, DONG Energy was awarded three licence stakes in Norway that all underpin the existing exploration portfolio.
ExplOratION & prODuCtION
>>

DONG ENErGy aNNual rEpOrt 2006
after the end of the year, DONG Energy was awarded five blocks distributed on two licences in the uK. the award-ed blocks are close to the laggan find, off the Shetland Islands, cementing DONG Energy’s position in that area. DONG Energy was awarded the operatorship of three of the awarded blocks.
the development of the Ormen lange field and the lan-geled pipeline proceeded to plan. the southern part of the langeled pipeline was commissioned in autumn 2006. the langeled pipeline was incorporated in the Norwegian gas transportation system, Gassled, of which DONG Energy is now a co-owner. the co-ownership of Gassled increases flexibility in supply and the possibility for bringing new gas volumes to the market. On the Ormen lange field, nine wells were commenced, and the field is expected to come on stream in the fourth quarter of 2007.
the development of the trym field was postponed as the Norwegian authorities did not approve the export condi-tions achievable by the licence partners in the Danish infrastructure.
In Norway, the licence partners have planned to develop the alve field, and production is planned from 2008. the alve field is situated in the Norwegian Sea, off the coast of mid-Norway, which is a focus area for gas pro-curement. DONG Energy’s share is 15%.
FACTS AbOUT THE EXPLORATION AND PRODUCTION
ACTIVITIES
The exploration and production activities are carried out in
Danish, Norwegian, UK and Faroese waters. Oil production
is predominant today, but the procurement of gas reserves
that can support DONG Energy’s gas sales activities is an
important objective for the future exploration and develop-
ment of fields.
most of the production is concentrated within three geogra-
phical locations: the Syd Arne field in Denmark (3�% of
production in �00�), the Ula-Gyda-Tambar-Glitne fields in
Norway (�3% of production in �00�) and the Siri-
Stine-Nini-Cecilie fields operated by DONG Energy on the
Danish-Norwegian border (��% of production in �00�).
Exploration activities are concentrated in Denmark, the
areas between the Faroe Islands and the Shetland Islands
and in the Norwegian Sea off the coast of mid-Norway. In
the area between the Faroe Islands and the Shetland
Islands DONG Energy participates in licences in the UK and
Faroe Islands sectors. The exploration activities in Norway
are carried out in the Norwegian Sea off mid-Norway and in
the southern part of the Norwegian North Sea.
��
In Denmark, DONG Energy was awarded four exploration licences, including two as operator. the licences enhan-ce the company’s position in the Central Graben.
the Enoch field, which is on the border between Norway (20%) and the uK (80%), is now being developed, and production is expected to commence in 2007. DONG Energy has a share of just under 2%.
In order to extend the lives of the producing fields in Norway and Denmark, efforts are being made to increase oil and gas extraction and to improve operational effi-ciency on the platforms. In 2006, four wells were drilled on the producing fields.
to optimise earnings from the Siri field and the life of the field DONG Energy has continued efforts to reduce ope-rating costs. the cost savings in 2006 are expected to place DONG Energy among the upper quartile of North Sea operators in terms of efficiency.
the Siri area is still estimated to have the potential to ensure further production in the future, thereby contri-buting to optimal utilisation of the infrastructure around the field. the infrastructure expenditure in connection with the Syd arne field can similarly be optimised by developing production from the adjoining finds.
In connection with the agreements in 2005 to sell 60% of the licence pl274 (Oselvar) in the Norwegian sector of the North Sea, the Norwegian authorities approved the agreement with pa resources Norway aS in 2006. the sale was recognised in 2006.
DONG Energy owns and operates the oil transportation system, which includes the Gorm E platform in the North Sea, the oil pipeline, a pump station at Filsø, and the crude oil terminal in Fredericia. In 2006, a total of 107 million barrels of crude oil were transported to the crude oil terminal in Fredericia compared with 114 million bar-rels in 2005.
Financial performancerevenue amounted to DKK 5,556 million, up from DKK 4,346 million in 2005 due to higher prices, a lower adverse impact from price hedging in 2006 than in 2005, and income from sale of licences in 2006, which more than offset the decline in the volume produced.
EBIt was DKK 2,437 million, up from DKK 1,412 million in 2005, due primarily to the increase in revenue, which, however, was partially offset by increased production costs related to production-enhancing activities aimed at countering the decline in production from mature fields.
Capital expenditure totalled DKK 2,150 million compared with DKK 7,097 million in 2005, when capital expendi-ture was affected by the purchase price for Ormen lange and the langeled pipeline. Capital expenditure on ex-pansion of the Ormen lange gas field and the langeled pipeline amounted to DKK 1,544 million in 2006.
��
ExplOratION & prODuCtION
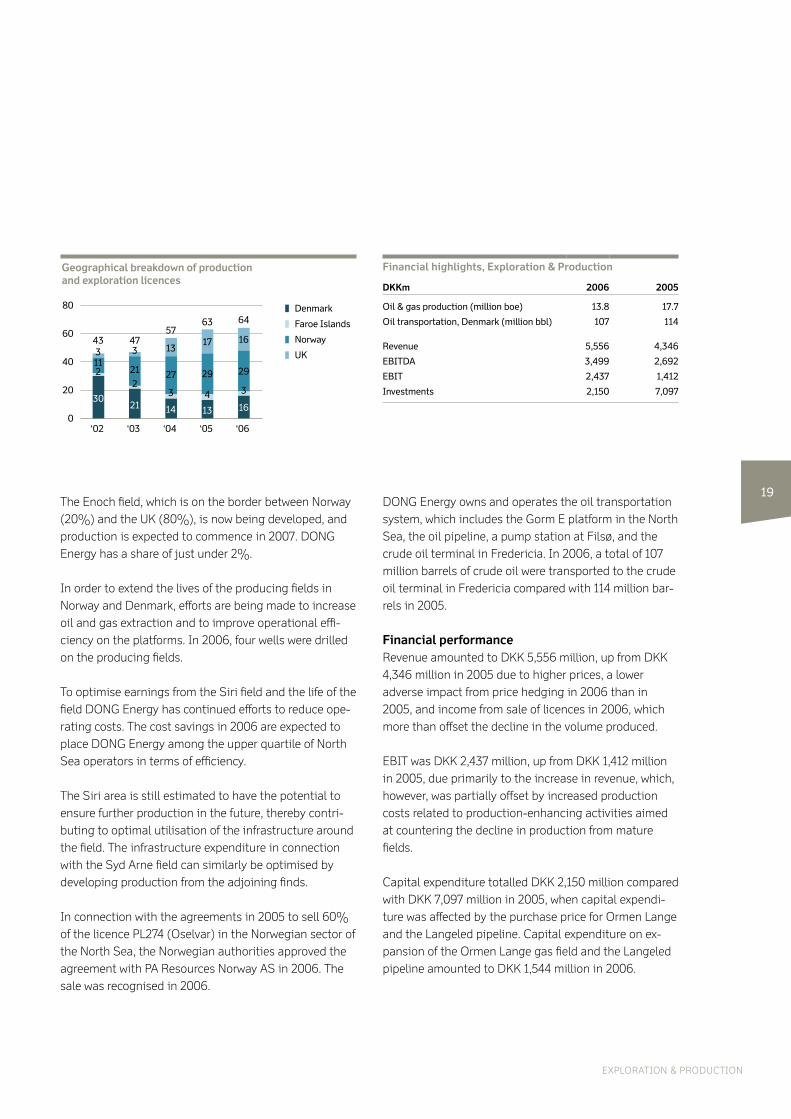
0
20
40
60
80
‘06‘05‘04‘03‘02
Geographical breakdown of production and exploration licences
Denmark
Faroe Islands
Norway
UK
3021 14 13 16
3
29
16
64
4
29
17
63
3
27
13
57
2
21
347
2113
43
Financial highlights, Exploration & Production
DKKm 2006 2005
Oil & gas production (million boe) �3.� �7.7
Oil transportation, Denmark (million bbl) �07 ���
Revenue �,��� �,3��
EbITDA 3,��� �,���
EbIT �,�37 �,���
Investments �,��0 7,0�7

DONG ENErGy aNNual rEpOrt 2006
EBITDA
�0
Distribution is responsible for DONG
Energy’s electricity and gas distribution
and gas storage in Denmark. DONG
Energy’s position is strong, especially in
the densely populated metropolitan area.
DKKm 1,012
5,116GWh
ELECTrICITy DISTrIBUTION
912 million m3
GAS DISTrIBUTION

Distribution serves approx. 956,000 customers with elec-tricity and approx. 116,000 customers with natural gas in Denmark. Distribution also owns and operates a natural gas storage facility near Stenlille on Zealand.
Distribution of electricitythe efforts to make the electricity supply less vulnerable to hurricane and storm damage continued in 2006, when ap-prox. 400 km of overhead lines were replaced by buried cables compared with approx. 225 km in 2005. the cable-laying commenced in 2003 with completion scheduled for 2012. the project comprises the replacement of a total of approx. 3,800 km of overhead lines by buried cables. Follow-ing the hurricane in January 2005, it was decided to accele-rate the project. the new target is completion of the cable-laying by the end of 2009.
according to the programme, 750 km of overhead lines should have been buried in 2006, but this target was not met due to a shortage of labour in the construction sector. Cable-laying depends on adequate manpower resources, but it is expected that the remaining approx. 2,500 km of overhead lines will have been buried by the end of 2010.
In step with the cable-laying an optical fibre network is being established to enable DONG Energy to offer its customers access to 100 mbit data connections.
In connection with the merger DONG Energy took over just under 3,000 cable boxes from Copenhagen Energy. the vast majority of the cable boxes were established in the 1950s and 1960s and constitute a safety risk. there have been ten fire or explosion incidents, two of them in 2006.
a project aimed at introducing temporary risk-reducing measures to the cable boxes was initiated in 2006. this will significantly alleviate the consequences of fire or ex-plosion in the boxes. the project is given high priority and is proceeding to plan, with completion scheduled for 2007.
the risk will not be completely eliminated until the box-es have been replaced with cable cabinets, which will require substantial manpower resources. the replace-ment with cable cabinets will be completed in the course of five years. the costs are expected to total approxim-ately half a billion Danish kroner.
Income from electricity distribution is subject to an in-come cap set by the Danish Energy regulatory authori-ty. the income cap was fixed based on budgets and transported volumes in 2004. Income depends, among other things, on transported volumes and a limit on the maximum return on the assets. From 2008, income may be affected by benchmarking requirements from the Danish Energy regulatory authority.
the six merged energy companies applied different prac-tices with respect to the use of subcontractors. DONG Energy strives to have employees in-house for tasks that are fundamental to the fulfilment of the Group’s objec-tives. On 2 January 2007, Distribution took over 37 employees from Eltel Networks. the relocated employees work with electricity meters, customer management and storage functions.
On 1 September 2006, DONG Energy co-founded the company powerSense a/S, which is a spin-off of the Discos division from DONG Energy. powerSense de-velops and manufactures Discos, a supervision and con-trol system for installation and integration in utility companies’ electricity distribution networks. DONG Energy installed the Discos system in a number of net-work transformer stations in 2006, and further installati-ons are planned. DONG Energy’s ownership interest in powerSense amounts to 44%. the purpose of spinning off this activity was to provide the Discos product line with optimal conditions for growth.
DISTrIBUTIONOF ElECtrICIty aND GaS
Gas storage facility near Ll. Torup sold to Energinet.dk
burying of overhead lines in North Zealand well underway
Cable boxes in Copenhagen being replaced by cable cabinets
■
■
■
��
DIStrIButION
>>
DONG ENErGy aNNual rEpOrt 2006
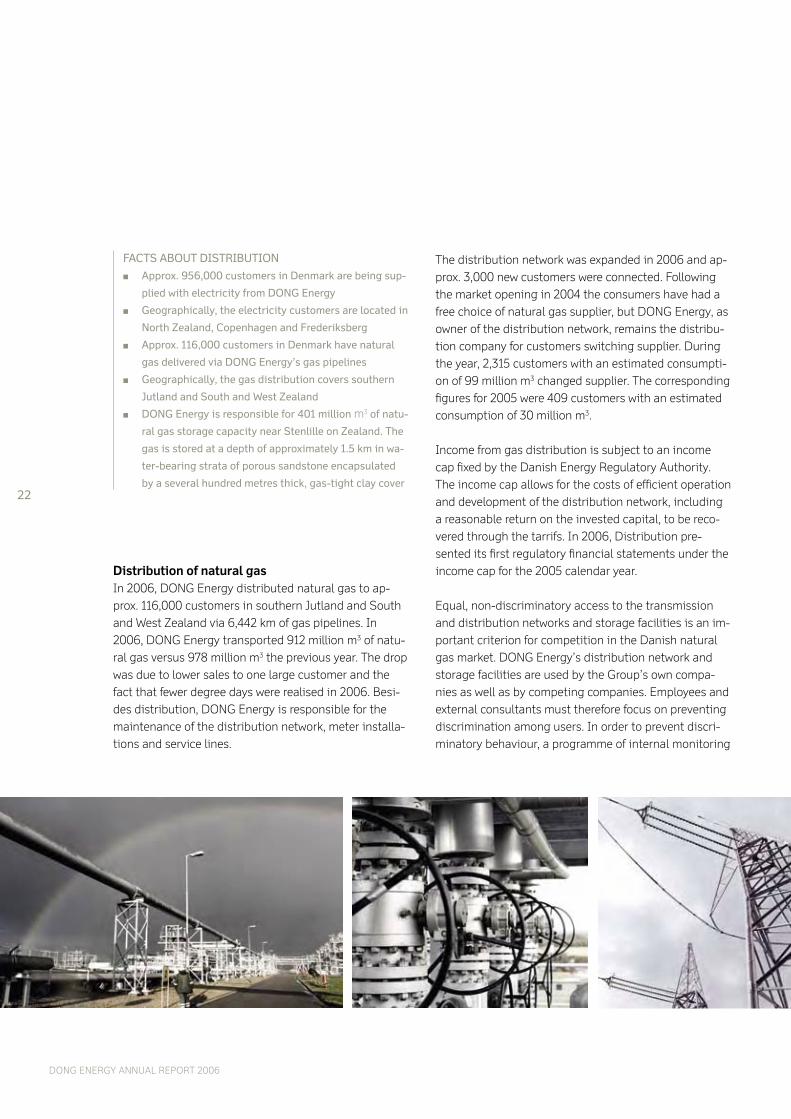
FACTS AbOUT DISTRIbUTION
Approx. ���,000 customers in Denmark are being sup-
plied with electricity from DONG Energy
Geographically, the electricity customers are located in
North Zealand, Copenhagen and Frederiksberg
Approx. ���,000 customers in Denmark have natural
gas delivered via DONG Energy’s gas pipelines
Geographically, the gas distribution covers southern
Jutland and South and West Zealand
DONG Energy is responsible for �0� million m3 of natu-
ral gas storage capacity near Stenlille on Zealand. The
gas is stored at a depth of approximately �.� km in wa-
ter-bearing strata of porous sandstone encapsulated
by a several hundred metres thick, gas-tight clay cover
■
■
■
■
■
Distribution of natural gasIn 2006, DONG Energy distributed natural gas to ap-prox. 116,000 customers in southern Jutland and South and West Zealand via 6,442 km of gas pipelines. In 2006, DONG Energy transported 912 million m3 of natu-ral gas versus 978 million m3 the previous year. the drop was due to lower sales to one large customer and the fact that fewer degree days were realised in 2006. Besi-des distribution, DONG Energy is responsible for the maintenance of the distribution network, meter installa-tions and service lines.
the distribution network was expanded in 2006 and ap-prox. 3,000 new customers were connected. Following the market opening in 2004 the consumers have had a free choice of natural gas supplier, but DONG Energy, as owner of the distribution network, remains the distribu-tion company for customers switching supplier. During the year, 2,315 customers with an estimated consumpti-on of 99 million m3 changed supplier. the corresponding figures for 2005 were 409 customers with an estimated consumption of 30 million m3.
Income from gas distribution is subject to an income cap fixed by the Danish Energy regulatory authority. the income cap allows for the costs of efficient operation and development of the distribution network, including a reasonable return on the invested capital, to be reco-vered through the tarrifs. In 2006, Distribution pre-sented its first regulatory financial statements under the income cap for the 2005 calendar year.
Equal, non-discriminatory access to the transmission and distribution networks and storage facilities is an im-portant criterion for competition in the Danish natural gas market. DONG Energy’s distribution network and storage facilities are used by the Group’s own compa-nies as well as by competing companies. Employees and external consultants must therefore focus on preventing discrimination among users. In order to prevent discri-minatory behaviour, a programme of internal monitoring
��

prepared on the basis of information meetings with the Danish Energy regulatory authority was adopted at the start of 2006. an annual report in which the programme and its implementation and control are described is published for each calendar year.
Storage of natural gasIn 2006, the storage activities were located at two facili-ties situated near ll. torup in Jutland and Stenlille on Zealand.
In connection with the European Commission’s clearan-ce of the merger of the energy companies the gas sto-rage facility near ll. torup was put up for sale. In august 2006, an agreement on sale of the gas storage facility to Energinet.dk was entered into, creating two independent and competing gas storage operators in Denmark. the selling price for the gas storage facility near ll. torup was DKK 2.0 billion on a debt-free basis, with a possible further payment based on the value of the activities after 2030. the gain was calculated on a preliminary basis at DKK 1.0 billion after tax and was recognised in 2006. Energinet.dk’s acquisition of the gas storage facility will be completed on 1 may 2007.
Both natural gas storage facilities were expanded in 2006 to accommodate a growing need for storage. the storage facility near Stenlille was expanded by 40 million m3, taking its volume at the end of 2006 to 401 million m3, equivalent to just under 10% of Denmark’s annual gas consumption. the storage facility near ll. torup was also expanded by 40 million m3 to 440 million m3 in total.
at the end of 2006, there were eight buyers of storage capacity compared with six in 2005. In 2006, it was necessary, for the first time, to turn down requests for storage capacity, as the existing storage capacity was fully taken up.
In 2006, an online storage management system was developed, enabling the individual storage customer to nominate injections and withdrawals from the storage facilities and to trade storage capacity with the other storage customers. the system will be further developed
in spring 2007 to enable it to handle two gas storage operators.
DONG Energy is in compliance with the Eu’s Guidelines for Good tpa practice for Storage System Operators (GpSSO).
Financial performancerevenue was DKK 2,560 million compared with DKK 857 million in 2005. the acquired companies contributed DKK 1,720 million. revenue from the gas activities was DKK 16 million down on 2005 due to lower distributed volumes and the disposal of the gas storage facility near ll. torup, which was only recognised up to and including 30 September 2006.
EBIt was DKK 467 million compared with DKK 161 milli-on in 2005. the acquired companies accounted for DKK 215 million. EBIt from the gas activities was DKK 91 mil-lion ahead of 2005, partly reflecting the extraordinary sale in march of excess cushion gas, which generated a DKK 43 million gain, but also reflecting increased sales of storage capacity, tariff increases and the fact that, in 2005, EBIt was depressed by an impairment loss on a service line in the distribution network that was no lon-ger in use.
Capital expenditure in 2006 amounted to DKK 758 milli-on and related primarily to underground installation of cables in North Zealand and reinvestments in the elec-tricity distribution network. Capital expenditure in 2006 also related to the expansion of the gas storage capacity near Stenlille.
�3
DIStrIButION
Financial highlights, Distribution
DKKm 2006 2005
Electricity distribution (GWh) �,��� 0
Gas distribution (million m3) ��� �7�
Revenue �,��0 ��7
EbITDA �,0�� ���
EbIT ��7 ���
Investments 7�� ��
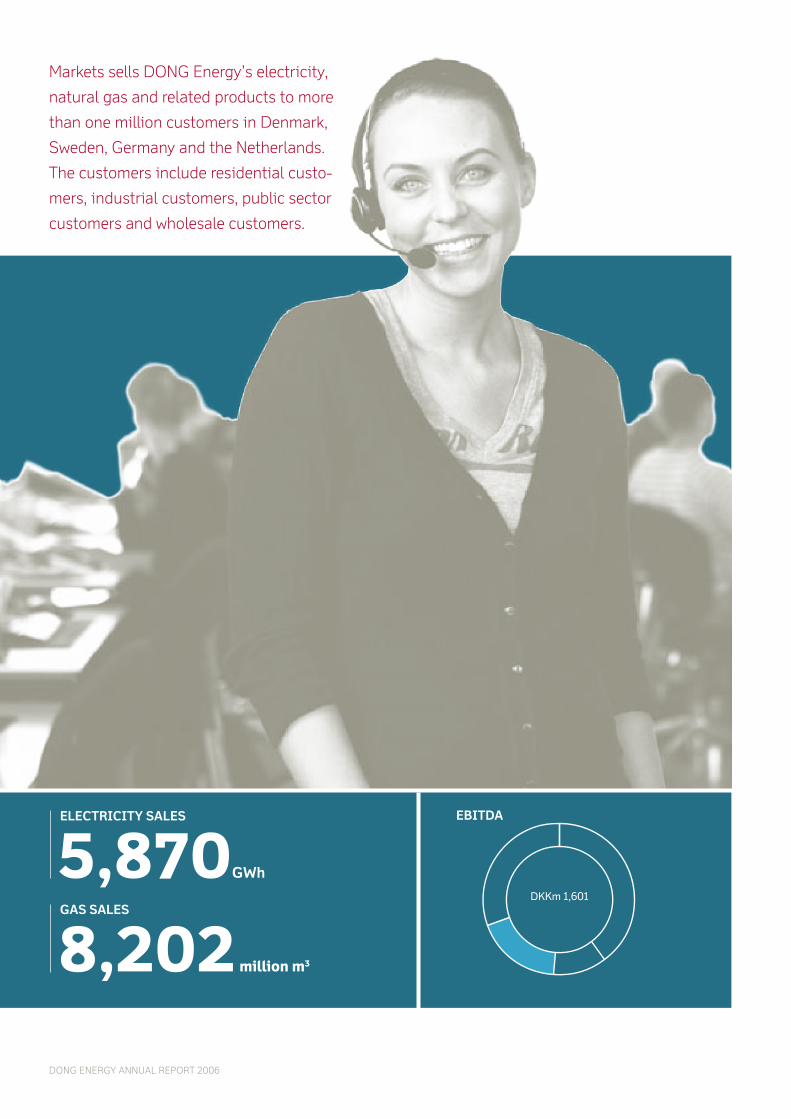
DONG ENErGy aNNual rEpOrt 2006
��
EBITDA
markets sells DONG Energy’s electricity,
natural gas and related products to more
than one million customers in Denmark,
Sweden, Germany and the Netherlands.
the customers include residential custo-
mers, industrial customers, public sector
customers and wholesale customers.
5,870GWh
ELECTrICITy SALES
8,202 million m3
GAS SALES DKKm 1,601
With around one million customers, markets is Denmark’s largest supplier of electricity and gas.
the focus area is the Northern European market, where elec-tricity, gas and related products are sold to customers in Denmark, Sweden, Germany and the Netherlands. as a na-tural extension of its sales activities, markets offers service contracts, energy savings advice and financial products.
markets includes DONG Energy’s ownership of North Sea pipelines and the gas pipelines that connect Denmark with the European gas infrastructure.
Energy supplymarkets secures supplies through power and heat genera-tion from the Generation segment, long-term purchase contracts with Danish and international partners and tra-ding in the Northern European energy markets.
In 2006, DONG Energy purchased approx. 90% of its gas supplies from Shell, mærsk and Chevron via the DuC con-tracts, supplementing these with gas purchases under long-term contracts from other energy companies and purchases from the Northern European gas hubs. the total portfolio of gas contracts consists of gas from the Danish, Norwegian and uK shelves and, from 2011, russia, following the conclusion of an agreement with Gazprom in 2006.
under the agreement with Gazprom, DONG Energy will re-ceive gas deliveries at the Danish/German border for a 20-year period from 2011.
In addition, DONG Energy will begin supplying gas to the uK market through Gazprom’s subsidiary, Gazprom mar-keting and trading, for a 15-year period from 2007 under a separate agreement. the natural gas will be transported through the approx. 1,200 km long pipeline that will con-nect the Ormen lange gas field off the Norwegian coast with the uK from 2007.
DONG Energy held its first annual gas release auction in 2006, offering 400 million m3 of natural gas, equivalent to approx. 10% of Denmark’s total gas consumption. the auction is part of DONG Energy’s commitment to the European Commission in connection with the lat-ter’s approval of the merged DONG Energy. the out-come of the auction was that DONG Energy sold the of-fered quantities in return for receiving corresponding deliveries of gas at hubs in the uK, Belgium and Ger-many.
Trading in the energy marketsmarkets trades actively in the Northern European energy markets. the physical trading volume in 2006 amounted to 8,202 billion m3 of gas and 5,870 GWh of electricity. the trading on electricity exchanges and gas hubs secu-res a balance between the supply sources and customer demand.
DONG Energy predominantly trades in physical and fi-nancial electricity, natural gas, coal, oil and CO2 quotas. Gas trading takes place at trading hubs in the Nether-lands, Belgium, Germany and the uK. In 2006, the tra-ding activity in the German market was increased to support supplies to a number of German customers. On the uK gas hub, NBp, a significant increase in trading activities is being prepared to enable gas from the Or-men lange field to be sold when it comes onshore at Ea-sington in the uK in 2007.
Electricity is traded physically and financially and under short-term and long-term contracts on the Nordic Nord pool exchange, the German EEx exchange and the Dutch apx exchange. It is also traded bilaterally with other energy companies and sales companies in Nor-thern Europe. like other Nordic electricity generators, DONG Energy sells its generated electricity on the ex-change each day. Customer demand is covered by elec-tricity purchases on the exchange.
MArKETSSalE OF ElECtrICIty aND GaS
Gazprom to supply gas to Denmark via Northern European pipeline
Gas release auction satisfies EU requirements and secures supplies in foreign markets
major capital expenditure plan for roll-out of optical fibre network
■
■
■
��
marKEtS
>>
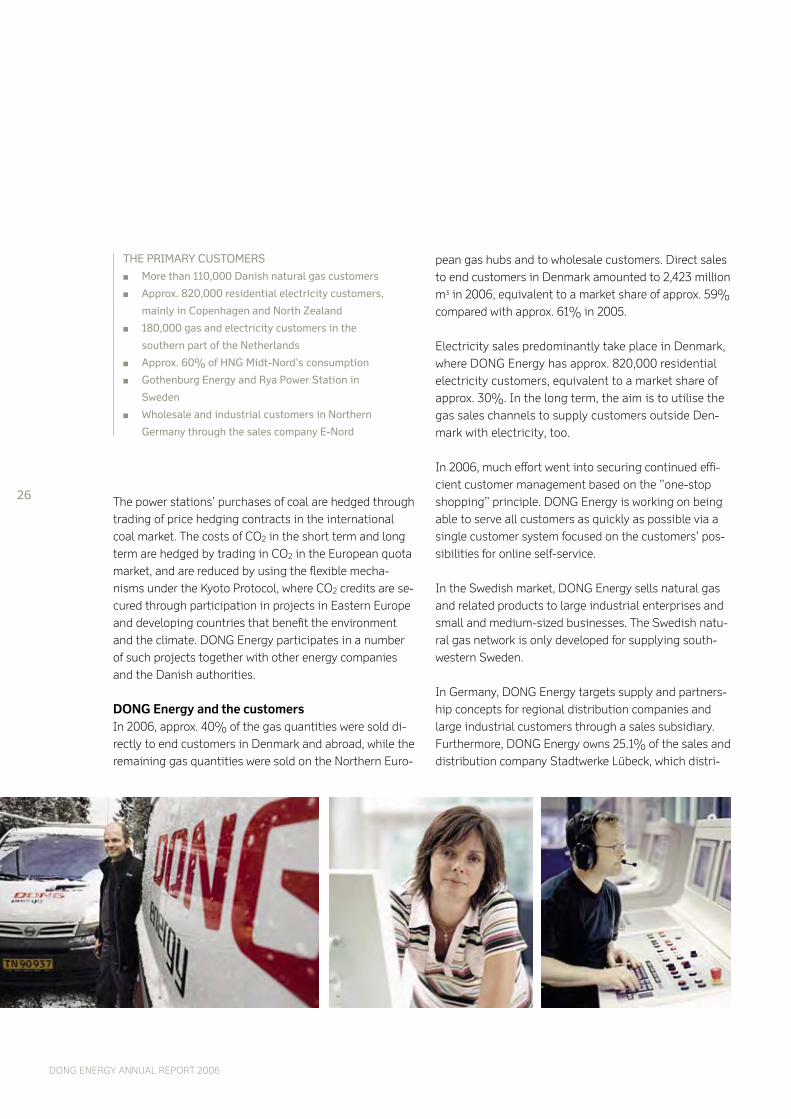
DONG ENErGy aNNual rEpOrt 2006
THE PRImARY CUSTOmERS
more than ��0,000 Danish natural gas customers
Approx. ��0,000 residential electricity customers,
mainly in Copenhagen and North Zealand
��0,000 gas and electricity customers in the
southern part of the Netherlands
Approx. �0% of HNG midt-Nord’s consumption
Gothenburg Energy and Rya Power Station in
Sweden
Wholesale and industrial customers in Northern
Germany through the sales company E-Nord
■
■
■
■
■
■
the power stations’ purchases of coal are hedged through trading of price hedging contracts in the international coal market. the costs of CO2 in the short term and long term are hedged by trading in CO2 in the European quota market, and are reduced by using the flexible mecha-nisms under the Kyoto protocol, where CO2 credits are se-cured through participation in projects in Eastern Europe and developing countries that benefit the environment and the climate. DONG Energy participates in a number of such projects together with other energy companies and the Danish authorities.
DONG Energy and the customersIn 2006, approx. 40% of the gas quantities were sold di-rectly to end customers in Denmark and abroad, while the remaining gas quantities were sold on the Northern Euro-
pean gas hubs and to wholesale customers. Direct sales to end customers in Denmark amounted to 2,423 million m3 in 2006, equivalent to a market share of approx. 59% compared with approx. 61% in 2005.
Electricity sales predominantly take place in Denmark, where DONG Energy has approx. 820,000 residential electricity customers, equivalent to a market share of approx. 30%. In the long term, the aim is to utilise the gas sales channels to supply customers outside Den-mark with electricity, too.
In 2006, much effort went into securing continued effi-cient customer management based on the ”one-stop shopping” principle. DONG Energy is working on being able to serve all customers as quickly as possible via a single customer system focused on the customers’ pos-sibilities for online self-service.
In the Swedish market, DONG Energy sells natural gas and related products to large industrial enterprises and small and medium-sized businesses. the Swedish natu-ral gas network is only developed for supplying south-western Sweden.
In Germany, DONG Energy targets supply and partners-hip concepts for regional distribution companies and large industrial customers through a sales subsidiary. Furthermore, DONG Energy owns 25.1% of the sales and distribution company Stadtwerke lübeck, which distri-
��
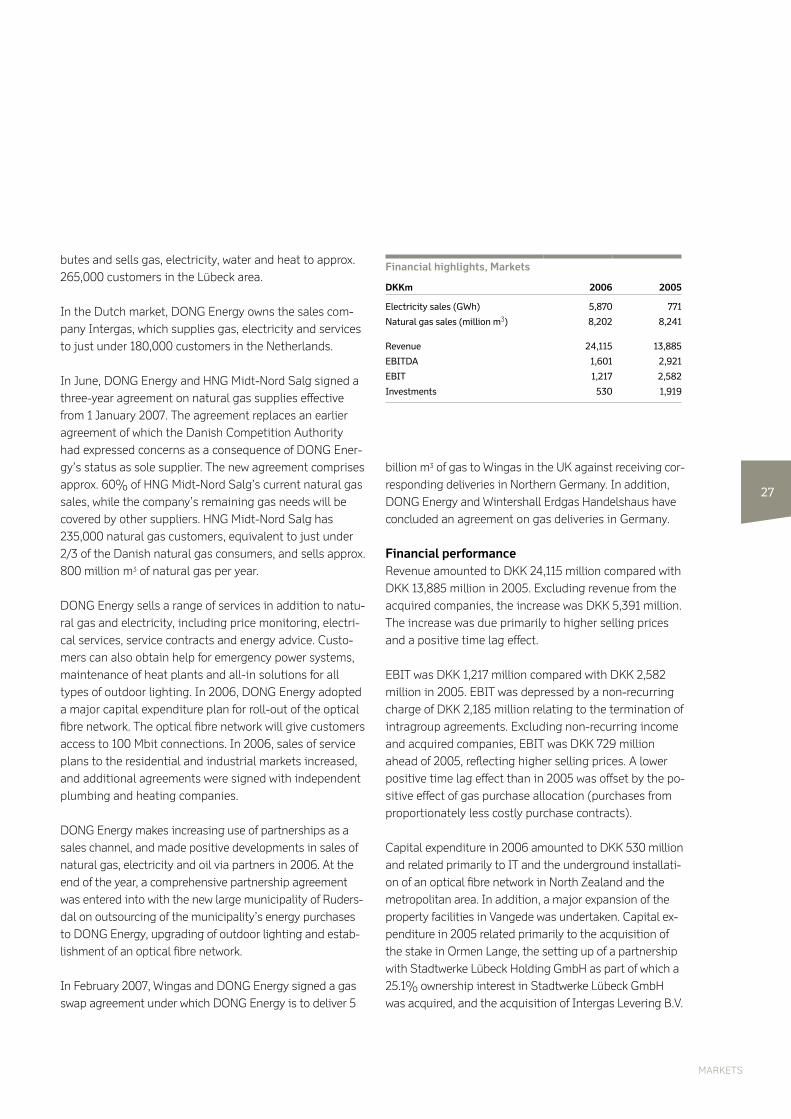
butes and sells gas, electricity, water and heat to approx. 265,000 customers in the lübeck area.
In the Dutch market, DONG Energy owns the sales com-pany Intergas, which supplies gas, electricity and services to just under 180,000 customers in the Netherlands.
In June, DONG Energy and HNG midt-Nord Salg signed a three-year agreement on natural gas supplies effective from 1 January 2007. the agreement replaces an earlier agreement of which the Danish Competition authority had expressed concerns as a consequence of DONG Ener-gy’s status as sole supplier. the new agreement comprises approx. 60% of HNG midt-Nord Salg’s current natural gas sales, while the company’s remaining gas needs will be covered by other suppliers. HNG midt-Nord Salg has 235,000 natural gas customers, equivalent to just under 2/3 of the Danish natural gas consumers, and sells approx. 800 million m3 of natural gas per year.
DONG Energy sells a range of services in addition to natu-ral gas and electricity, including price monitoring, electri-cal services, service contracts and energy advice. Custo-mers can also obtain help for emergency power systems, maintenance of heat plants and all-in solutions for all types of outdoor lighting. In 2006, DONG Energy adopted a major capital expenditure plan for roll-out of the optical fibre network. the optical fibre network will give customers access to 100 mbit connections. In 2006, sales of service plans to the residential and industrial markets increased, and additional agreements were signed with independent plumbing and heating companies.
DONG Energy makes increasing use of partnerships as a sales channel, and made positive developments in sales of natural gas, electricity and oil via partners in 2006. at the end of the year, a comprehensive partnership agreement was entered into with the new large municipality of ruders-dal on outsourcing of the municipality’s energy purchases to DONG Energy, upgrading of outdoor lighting and estab-lishment of an optical fibre network.
In February 2007, Wingas and DONG Energy signed a gas swap agreement under which DONG Energy is to deliver 5
�7
billion m3 of gas to Wingas in the uK against receiving cor-responding deliveries in Northern Germany. In addition, DONG Energy and Wintershall Erdgas Handelshaus have concluded an agreement on gas deliveries in Germany.
Financial performancerevenue amounted to DKK 24,115 million compared with DKK 13,885 million in 2005. Excluding revenue from the acquired companies, the increase was DKK 5,391 million. the increase was due primarily to higher selling prices and a positive time lag effect.
EBIt was DKK 1,217 million compared with DKK 2,582 million in 2005. EBIt was depressed by a non-recurring charge of DKK 2,185 million relating to the termination of intragroup agreements. Excluding non-recurring income and acquired companies, EBIt was DKK 729 million ahead of 2005, reflecting higher selling prices. a lower positive time lag effect than in 2005 was offset by the po-sitive effect of gas purchase allocation (purchases from proportionately less costly purchase contracts).
Capital expenditure in 2006 amounted to DKK 530 million and related primarily to It and the underground installati-on of an optical fibre network in North Zealand and the metropolitan area. In addition, a major expansion of the property facilities in Vangede was undertaken. Capital ex-penditure in 2005 related primarily to the acquisition of the stake in Ormen lange, the setting up of a partnership with Stadtwerke lübeck Holding GmbH as part of which a 25.1% ownership interest in Stadtwerke lübeck GmbH was acquired, and the acquisition of Intergas levering B.V.
marKEtS
Financial highlights, Markets
DKKm 2006 2005
Electricity sales (GWh) �,�70 77�
Natural gas sales (million m3) �,�0� �,���
Revenue ��,��� �3,���
EbITDA �,�0� �,���
EbIT �,��7 �,���
Investments �30 �,���
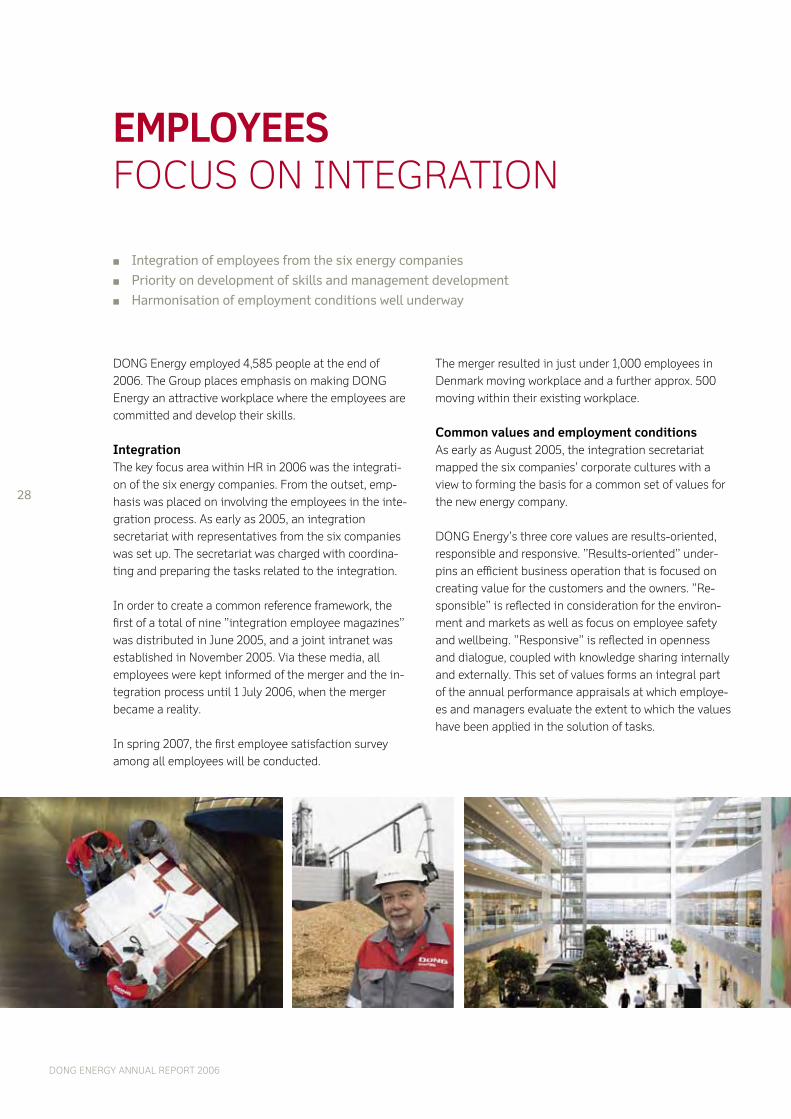
DONG ENErGy aNNual rEpOrt 2006
DONG Energy employed 4,585 people at the end of 2006. the Group places emphasis on making DONG Energy an attractive workplace where the employees are committed and develop their skills.
Integrationthe key focus area within Hr in 2006 was the integrati-on of the six energy companies. From the outset, emp-hasis was placed on involving the employees in the inte-gration process. as early as 2005, an integration secretariat with representatives from the six companies was set up. the secretariat was charged with coordina-ting and preparing the tasks related to the integration.
In order to create a common reference framework, the first of a total of nine ”integration employee magazines” was distributed in June 2005, and a joint intranet was established in November 2005. Via these media, all employees were kept informed of the merger and the in-tegration process until 1 July 2006, when the merger became a reality.
In spring 2007, the first employee satisfaction survey among all employees will be conducted.
the merger resulted in just under 1,000 employees in Denmark moving workplace and a further approx. 500 moving within their existing workplace.
Common values and employment conditionsas early as august 2005, the integration secretariat mapped the six companies’ corporate cultures with a view to forming the basis for a common set of values for the new energy company.
DONG Energy’s three core values are results-oriented, responsible and responsive. ”results-oriented” under-pins an efficient business operation that is focused on creating value for the customers and the owners. ”re-sponsible” is reflected in consideration for the environ-ment and markets as well as focus on employee safety and wellbeing. ”responsive” is reflected in openness and dialogue, coupled with knowledge sharing internally and externally. this set of values forms an integral part of the annual performance appraisals at which employe-es and managers evaluate the extent to which the values have been applied in the solution of tasks.
EMPLOyEESFOCuS ON INtEGratION
Integration of employees from the six energy companies
Priority on development of skills and management development
Harmonisation of employment conditions well underway
■
■
■
��

In autumn 2006, a process of harmonisation of the ge-neral employment conditions in DONG Energy was initi-ated.
Skills developmentDONG Energy focuses strongly on developing skills with-in procurement, production, distribution and trading in energy. this applies both internally and externally among students and researchers.
DONG Energy contributes to targeting research projects within energy technology and is involved in about 40 ph.D projects. moreover, specialists often make themsel-ves available to students writing bachelor projects or theses on practical problems in DONG Energy. participa-tion in career fairs and guest lectures at universities are another important part of the contact face with students.
Geologists and engineers are important skills within oil and gas exploration and development of new production methods to enhance extraction. Competent energy tech-nology engineers are also vital to enable the continued construction and operation of efficient power stations and to hold the leading position as one of the world’s largest operators of offshore wind farms. a group of employees is participating in the Eu CaStOr project, which is investigating the possibility for using the recap-tured CO2 from power stations for injection into oil fields, optimising the oil extraction.
trading in energy products on the Northern European energy exchanges and optimisation within purchasing and sale of energy call for competent employees with an educational background within business and economics. practical knowledge of the energy markets is built up via courses and on-the-job training.
Good customer service requires responsive employees with good communications skills. a high standard of customer service is also paramount within the distributi-on network, and it is therefore important to have good technicians, electricians, fitters, etc., that are able to sol-ve problems within a short time when customers experi-ence a loss of supply.
the employees’ wishes for training are met to a large extent, at all levels of the organisation, by both internal training and external courses.
Management developmentIn 2006, management development was in focus, with the start-up of two different programmes. as a conse-quence of the merger, the management structure was aligned to the new organisation, and in that connection a management development programme was introdu-ced. this programme is aimed at the top 200 managers, and the purpose is to develop personal leadership skills and to strengthen the interorganisational network.
the second programme is aimed at the Group’s young employees. twice a year, 20 talents are selected for a de-velopment programme comprising business skills, ma-nagement philosophy, personal development, etc. the programme includes self-study, individual training, and coaching with colleagues and own manager. the de-velopment programme takes place over eight months and ends with a presentation and evaluation of a project chosen in collaboration with the participant’s manager.
��
Employees by segment
273
345
7012.083
1.183
GenerationExploration & Production
Distribution
Corporate staff and othersMarkets
EmplOyEES
DONG ENErGy aNNual rEpOrt 2006
Environment and safety is an integrated action area in DONG Energy. Following the formation of DONG Energy in 2006 a common policy, strategy and guidelines have been adopted for quality, health, safety and environment. Implementation has commenced in the individual seg-ments and will be completed during the coming years.
Quality, health, safety and environment policies are based on international standards for quality (ISO 9001), occu-pational health and safety (OHSaS 18001) and environ-ment (ISO 14001). the use of management systems is plant and function-specific. In general, producing plants such as all central power stations have environmental and occupational health and safety certification.
In 2006, DONG Energy became a signatory to the uN ini-tiative to promote responsible corporate citizenship – the Global Compact. In continuation of this initiative, DONG Energy has prepared a corporate responsibility report for 2006. the report includes the Group’s environmental and occupational health and safety work as well as additional environmental and other data. reference is made to the corporate responsibility report, which is also available on www.dongenergy.com. Here, the statutory environmental accounts for the individual reporting plants can also be viewed.
Environmental and safety data are mainly computed as pro forma figures, i.e. data comprising twelve months for all activities owned by DONG Energy at 31 December 2006 - even where the activities have only been owned for part of the year. the presented data are subject to some uncertainty as there were no uniform guidelines for reporting environmental and safety data due to the diffe-rent calculation methods across the segments.
Greenhouse gases and climate impactGeneration of power and heat based on fossil fuels such as coal, natural gas and oil results in emissions of the greenhouse gas CO2, which is instrumental in global wam-ing. CO2 emissions from power and heat generation con-stitute 99% of DONG Energy’s total CO2 emissions. the remainder is accounted for by oil and gas production in the North Sea and other activities.
ENVIrONMENT AND SAFETy
DONG Energy has 29 plants that are subject to the Da-nish act on CO2 Quotas. the CO2 emissions from these plants are verified separately by an independent certifica-tion body and constituted 99% of DONG Energy’s total CO2 emissions in 2006. the CO2 emissions jointly ex-ceeded the allocated CO2 quotas, which was compensated for through acquisition of CO2 quotas.
Besides CO2, a number of other greenhouse gases are emitted that jointly account for less than 1% of the total greenhouse gas impact. DONG Energy is working on seve-ral fronts to reduce CO2 emissions from the power stati-ons’ energy production. the main action areas are:
enhanced energy efficiency at the power stationsincreased flexibility in the choice of fuels, including
co-combustion of CO2-neutral fuels such as certain types of waste
research into minimisation of the environmental impact from thermal production by CO2 capture and storage
Other atmospheric emissions Besides CO2, energy production generates other emissi-ons to the atmosphere such as nitrogen oxides (NOx), sulphur dioxide (SO2), particulate matter and volatile or-ganic compounds (VOCs).
the NOx emissions come primarily from the power stati-ons’ flue gases. In 2006, DONG Energy’s NOx emissions totalled 25,311 tonnes. NOx emissions from power stations were reduced by, on average, 19% per GJ fuel consumpti-on from 2006 to 2005 through specific reductions, plan-ning and optimisation. the principal source of SO2 emissi-ons is combustion of sulphurous coal and oil. DONG Energy’s SO2 emissions were 6,625 tonnes in 2006. De-sulphurisation systems have been installed at the vast ma-jority of DONG Energy’s coal-fired power stations. When operating optimally, the desulphurisation systems remove 80-99% of the sulphur dioxide contained in the power sta-tions’ flue gases. power station emissions also include par-ticulate matter and trace elements. these emissions are re-gulated through requirements in the individual stations’ environmental permits.
■
■
■
30
Focus on reduction of CO2 emissions
Action plan aimed at improving safety
Implementation of common guidelines well underway
■
■
■
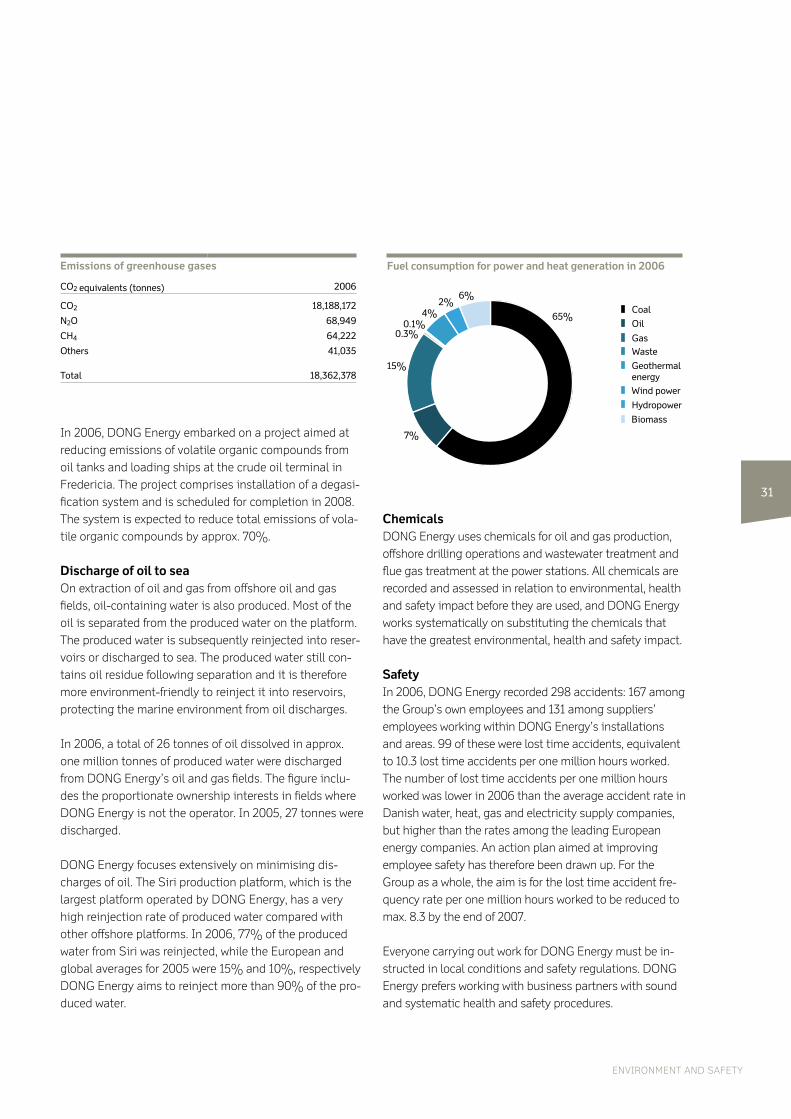
In 2006, DONG Energy embarked on a project aimed at reducing emissions of volatile organic compounds from oil tanks and loading ships at the crude oil terminal in Fredericia. the project comprises installation of a degasi-fication system and is scheduled for completion in 2008. the system is expected to reduce total emissions of vola-tile organic compounds by approx. 70%.
Discharge of oil to seaOn extraction of oil and gas from offshore oil and gas fields, oil-containing water is also produced. most of the oil is separated from the produced water on the platform. the produced water is subsequently reinjected into reser-voirs or discharged to sea. the produced water still con-tains oil residue following separation and it is therefore more environment-friendly to reinject it into reservoirs, protecting the marine environment from oil discharges.
In 2006, a total of 26 tonnes of oil dissolved in approx. one million tonnes of produced water were discharged from DONG Energy’s oil and gas fields. the figure inclu-des the proportionate ownership interests in fields where DONG Energy is not the operator. In 2005, 27 tonnes were discharged.
DONG Energy focuses extensively on minimising dis-charges of oil. the Siri production platform, which is the largest platform operated by DONG Energy, has a very high reinjection rate of produced water compared with other offshore platforms. In 2006, 77% of the produced water from Siri was reinjected, while the European and global averages for 2005 were 15% and 10%, respectively DONG Energy aims to reinject more than 90% of the pro-duced water.
3�
ENVIrONMENT AND SAFETy
ChemicalsDONG Energy uses chemicals for oil and gas production, offshore drilling operations and wastewater treatment and flue gas treatment at the power stations. all chemicals are recorded and assessed in relation to environmental, health and safety impact before they are used, and DONG Energy works systematically on substituting the chemicals that have the greatest environmental, health and safety impact.
SafetyIn 2006, DONG Energy recorded 298 accidents: 167 among the Group’s own employees and 131 among suppliers’ employees working within DONG Energy’s installations and areas. 99 of these were lost time accidents, equivalent to 10.3 lost time accidents per one million hours worked.the number of lost time accidents per one million hours worked was lower in 2006 than the average accident rate in Danish water, heat, gas and electricity supply companies, but higher than the rates among the leading European energy companies. an action plan aimed at improving employee safety has therefore been drawn up. For the Group as a whole, the aim is for the lost time accident fre-quency rate per one million hours worked to be reduced to max. 8.3 by the end of 2007.
Everyone carrying out work for DONG Energy must be in-structed in local conditions and safety regulations. DONG Energy prefers working with business partners with sound and systematic health and safety procedures.
ENVIrONmENt aND SaFEty
Emissions of greenhouse gases
CO� equivalents (tonnes) �00�
CO� ��,���,�7�
N�O ��,���
CH� ��,���
Others ��,03�
Total ��,3��,37�
Fuel consumption for power and heat generation in 2006
0.1%4%
6%2%
65%
7%
0.3%
15% GeothermalenergyWind power
Hydropower
Biomass
WasteGas
Oil
Coal

DONG ENErGy aNNual rEpOrt 2006
DONG Energy’s activities, financial position, results and fu-ture growth are affected by a number of non-financial and financial commercial risks. DONG Energy therefore regular-ly reviews its risk profile and the associated risk policies to ensure that there is always an appropriate balance between the risk exposure and DONG Energy’s activities.
Formalised risk management is divided into management of general commercial risks, management of financial risks, and management of insurable risks. Commercial risks are defined as events that may with a certain proba-bility have an adverse impact on the realisation of financi-al results or strategy.
In recent years, the business strategy has focused on creating an energy company comprising both electricity and gas supply. In Exploration & production, this has ma-nifested itself as a change of focus from oil to gas. a ma-jor step was taken with the acquisition of the stake in the Ormen lange field. the integration of the acquired elec-tricity companies has also given DONG Energy a precen-se across the electricity and gas value chain, i.e. the gene-ration, distribution and sales links. this allows for the spreading of risk across activities and for various types of natural hedging.
Non-financial risksthe management of commercial risks is anchored in the individual segments and consolidated at corporate level through the close monitoring of the 20 largest risks. the
identified commercial risks cover a wide range of risks, including market, physical safety and environmental scenarios. the main commercial risks are described below. In addition to these risks DONG Energy is or may become involved in litigation or arbitration proceedings the outcome of which may impact on its financial positi-on.
CO� quota allocation the Government’s plan for allocation of CO2 quotas means that the power generation from DONG Energy’s central power stations will be allocated about 30% fewer quotas in the period 2008-12 than in 2005-07. this will have an adverse impact on competitiveness, as DONG Energy’s competitors outside Denmark are subject to more lenient rules.
DONG Energy actively seeks to reduce CO2 emissions. For example, DONG Energy’s power stations are among the most efficient in the world in terms of energy effi-ciency. DONG Energy is examining the possibility of in-jecting CO2 into the ground, and is constructing and operating wind turbines and using biomass for power and heat generation.
Long-term gas procurementas gas resources in the Danish sector of the North Sea decline, DONG Energy focuses on procuring gas by en-tering into new long-term gas contracts and through owning new gas production. as an example of such new
rISK MANAGEMENT
3�
agreements, a 20-year gas supply agreement was signed with Gazprom in June 2006. the acquisition of the stake in the Ormen lange field and the expected development of the West of Shetland area are examples of increased gas production.
In order to secure future gas supplies to Denmark, DONG Energy is looking into various possibilities for establishing new gas infrastructure to Denmark.
Ormen Lange With the acquisition of the stake in Ormen lange, DONG Energy made a significant investment that will not produ-ce a return until the field goes on stream, probably in the fourth quarter of 2007. Due to the size of the investment delayed start-up would have an adverse financial impact. However, the probability of serious problems on this pro-ject is considered to be low, as the project is well advan-ced. the project was 91% complete at the end of 2006.
Technical problems on offshore wind turbines the establishment of wind farms is an important ele-ment in DONG Energy’s strategy to reduce CO2 emissi-ons. a significant part of the future wind turbines are ex-pected to be established offshore. It is generally more costly to correct faults in offshore wind turbines than in onshore wind turbines. the greatest risk is the risk of batch faults in the offshore wind turbines, where the same faults are carried over into several turbines, for example as a result of a defective component or unfore-seen wear. much attention is consequently being paid to the purchase of well-proven technology and to the purchase of prototype turbines prior to major invest-ments in specific turbine models. However, because off-shore wind turbine technology is still in its infancy, tur-bines that have been tested for a full service life are not yet available. possibilities for taking out additional insu-rance to cover this risk are being explored on a regular basis.
Integration risk the integration of the six companies is well underway. the work on migrating Copenhagen Energy’s electricity customers to Nesa’s systems, the establishment of a
joint Sap system for Energi E2 and Elsam, a joint tra-ding department, etc., are just a few examples of ongo-ing projects.
there will always be a risk of such an integration running into problems, for example in relation to integration of It systems, business processes, etc. all integration projects are being closely monitored, and much emphasis has been placed on ”safety first” in the planning of the inte-gration.
Regulatory risks activities that are subject to regulation by the Danish Energy regulatory authority or similar authorities abroad account for a part of DONG Energy’s income. the development of regulation in Denmark and abroad thus has a considerable impact on DONG Energy’s commer-cial opportunities. DONG Energy therefore invests consi-derable resources in continuously keeping abreast of the development in market regulation and regulatory issues. In addition, where required by the authorities, DONG Energy operates with strict separation of segments in various areas to prevent exchange of confidential infor-mation between regulated and non-regulated activities.
Retention and development of skillsDONG Energy’s business is generally highly complex, re-quiring special skills. Coupled with the growing demand for talent, this increases the challenge of attracting and retaining employees.
DONG Energy places much emphasis on making the company an attractive workplace, and various initiatives have been put in motion to this end. these include ma-nagement development, skills development, performan-ce systems, nurturing talent, and collaboration with edu-cational institutions.
Personal safetythe work at DONG Energy’s installations includes hand-ling of high pressures and temperatures as well as heavy lifting. Failure to pay attention, a poor safety culture, poor maintenance and failure to comply with safety pro-cedures can lead to serious accidents.
33
rISK maNaGEmENt
>>
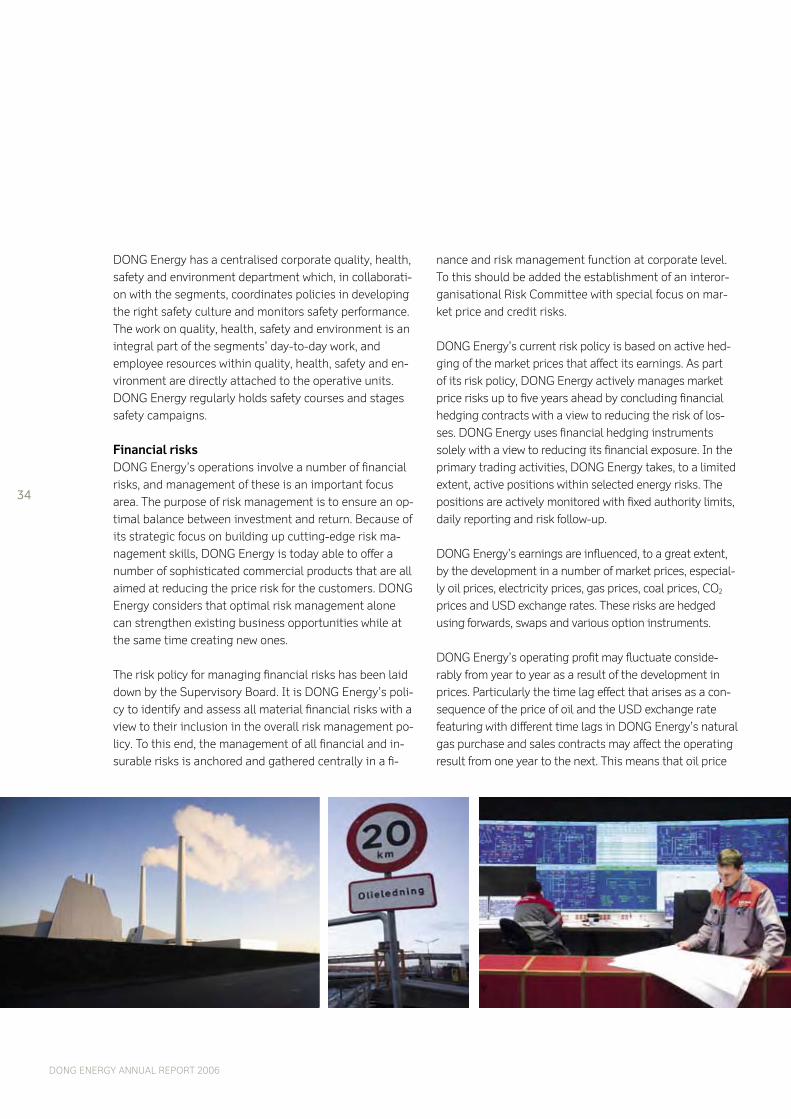
DONG ENErGy aNNual rEpOrt 2006
DONG Energy has a centralised corporate quality, health, safety and environment department which, in collaborati-on with the segments, coordinates policies in developing the right safety culture and monitors safety performance. the work on quality, health, safety and environment is an integral part of the segments’ day-to-day work, and employee resources within quality, health, safety and en-vironment are directly attached to the operative units. DONG Energy regularly holds safety courses and stages safety campaigns.
Financial risks DONG Energy’s operations involve a number of financial risks, and management of these is an important focus area. the purpose of risk management is to ensure an op-timal balance between investment and return. Because of its strategic focus on building up cutting-edge risk ma-nagement skills, DONG Energy is today able to offer a number of sophisticated commercial products that are all aimed at reducing the price risk for the customers. DONG Energy considers that optimal risk management alone can strengthen existing business opportunities while at the same time creating new ones.
the risk policy for managing financial risks has been laid down by the Supervisory Board. It is DONG Energy’s poli-cy to identify and assess all material financial risks with a view to their inclusion in the overall risk management po-licy. to this end, the management of all financial and in-surable risks is anchored and gathered centrally in a fi-
nance and risk management function at corporate level. to this should be added the establishment of an interor-ganisational risk Committee with special focus on mar-ket price and credit risks.
DONG Energy’s current risk policy is based on active hed-ging of the market prices that affect its earnings. as part of its risk policy, DONG Energy actively manages market price risks up to five years ahead by concluding financial hedging contracts with a view to reducing the risk of los-ses. DONG Energy uses financial hedging instruments solely with a view to reducing its financial exposure. In the primary trading activities, DONG Energy takes, to a limited extent, active positions within selected energy risks. the positions are actively monitored with fixed authority limits, daily reporting and risk follow-up.
DONG Energy’s earnings are influenced, to a great extent, by the development in a number of market prices, especial-ly oil prices, electricity prices, gas prices, coal prices, CO2 prices and uSD exchange rates. these risks are hedged using forwards, swaps and various option instruments.
DONG Energy’s operating profit may fluctuate conside-rably from year to year as a result of the development in prices. particularly the time lag effect that arises as a con-sequence of the price of oil and the uSD exchange rate featuring with different time lags in DONG Energy’s natural gas purchase and sales contracts may affect the operating result from one year to the next. this means that oil price
3�

changes and changes in the uSD exchange rate impact on selling prices relatively quickly, whereas purchase prices are adjusted with a delay of up to 17 months. For example, a change in the price of oil and/or the uSD exchange rate in January may thus affect DONG Energy’s selling prices in February, but will not be felt on purchase prices till June of the following year. For that reason, the effect of changes in the oil price and the uSD exchange rate may be felt in dif-ferent years for purchase contracts and sales contracts, re-spectively. However, the fluctuations will balance each other out over a number of years.
Oil and gas price risks DONG Energy’s oil and gas price risks relate primarily to equity oil and gas and differences in the indexing of purchase and selling prices for natural gas. DONG Ener-gy’s exposure is partly in crude oil and gas, and partly in various other oil types such as fuel oil and gas oil. Gas price risks relate primarily to the exposure from the Or-men lange field’s coming equity production. this exposu-re will be hedged as the production volume becomes cer-tain. the company engages in hedging activities in the underlying oil types to reduce the risk of price fluctuati-ons between the various types of oil. DONG Energy pri-marily hedges the oil price risk by buying put options and by forward sale contracts of oil. at the end of 2006, ap-prox. 40% of the expected oil and gas price risk for the coming five years had been hedged, primarily by acquisi-tion of options at a level corresponding to a crude oil pri-ce of uSD 30-50/bbl.
Green Dark Spread / Green Spark Spread production from power stations is primarily exposed to the electricity, coal (including freight) and CO2 prices. the diffe-rence between these three factors in the production of one mWh is called the Green Dark Spread. Green Spark Spread is when natural gas is used instead of coal.
In order to actively reduce this risk, DONG Energy pursues a price hedging strategy that hedges the components in the Green Dark Spread in the ratio required to produce one mWh, ensuring a more stable financial result. at the end of 2006, DONG Energy had financially hedged approx. 55% of its commercial electricity exposure for 2007.
3�
Development in oil price
USD/bbl
35
45
55
65
75
2005 2006
rISK maNaGEmENt
Electricity price, Nord Pool (EUR/MWh) Green Dark Spread (EUR/MWh)
15
25
35
45
55
65
75
85
(25)
(15)
(5)
5
15
25
35
45
2005 2006
Electricity price, Nord Pool Green Dark Spread
Development in electricity price and Green Dark Spread
Development in coal and CO 2
Coal price, API 2 (USD/tonne)
40
45
50
55
60
65
70
75
0
5
10
15
20
25
30
35
2005 2006
Coal price, API 2 CO quota price2
2
the price development in the Nordic electricity market is determined predominantly by the hydro balance. the hydro balance is a measure of the current snow and water quanti-ties in the Norwegian and Swedish reservoirs compared with what is normal for the particular time of year. >>
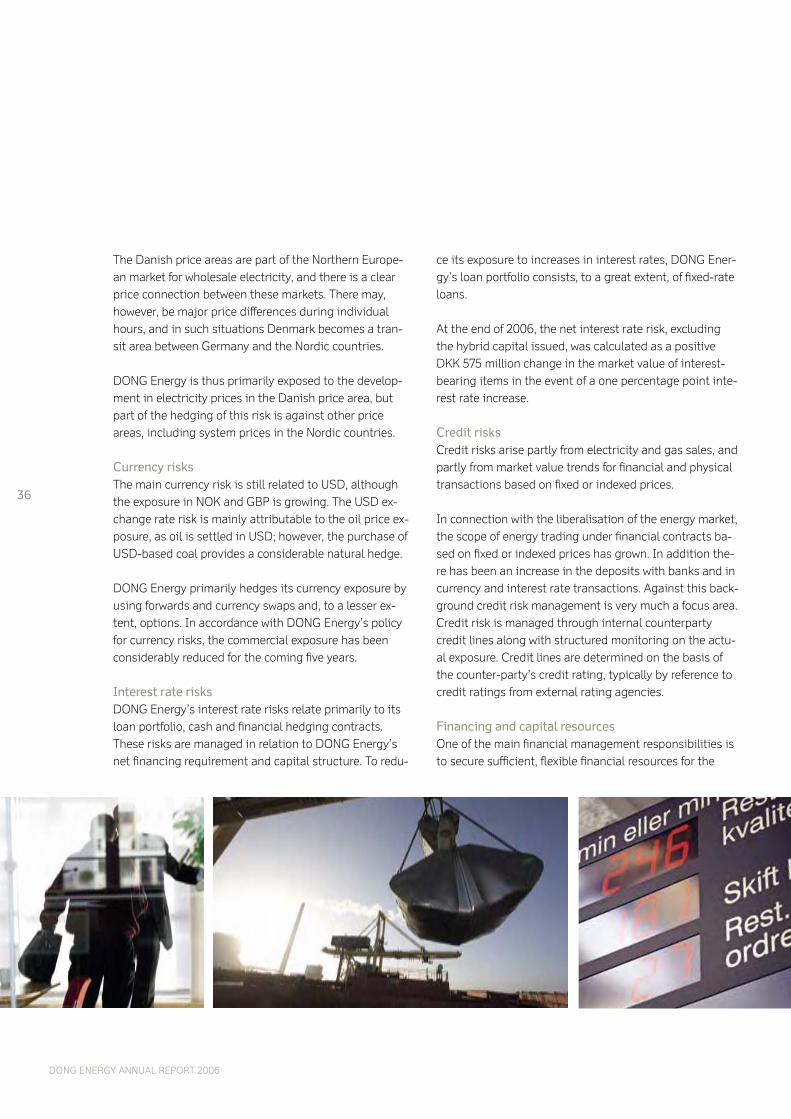
DONG ENErGy aNNual rEpOrt 2006
the Danish price areas are part of the Northern Europe-an market for wholesale electricity, and there is a clear price connection between these markets. there may, however, be major price differences during individual hours, and in such situations Denmark becomes a tran-sit area between Germany and the Nordic countries.
DONG Energy is thus primarily exposed to the develop-ment in electricity prices in the Danish price area, but part of the hedging of this risk is against other price areas, including system prices in the Nordic countries.
Currency risksthe main currency risk is still related to uSD, although the exposure in NOK and GBp is growing. the uSD ex-change rate risk is mainly attributable to the oil price ex-posure, as oil is settled in uSD; however, the purchase of uSD-based coal provides a considerable natural hedge.
DONG Energy primarily hedges its currency exposure by using forwards and currency swaps and, to a lesser ex-tent, options. In accordance with DONG Energy’s policy for currency risks, the commercial exposure has been considerably reduced for the coming five years.
Interest rate risks DONG Energy’s interest rate risks relate primarily to its loan portfolio, cash and financial hedging contracts. these risks are managed in relation to DONG Energy’s net financing requirement and capital structure. to redu-
ce its exposure to increases in interest rates, DONG Ener-gy’s loan portfolio consists, to a great extent, of fixed-rate loans.
at the end of 2006, the net interest rate risk, excluding the hybrid capital issued, was calculated as a positive DKK 575 million change in the market value of interest-bearing items in the event of a one percentage point inte-rest rate increase.
Credit risks Credit risks arise partly from electricity and gas sales, and partly from market value trends for financial and physical transactions based on fixed or indexed prices.
In connection with the liberalisation of the energy market, the scope of energy trading under financial contracts ba-sed on fixed or indexed prices has grown. In addition the-re has been an increase in the deposits with banks and in currency and interest rate transactions. against this back-ground credit risk management is very much a focus area. Credit risk is managed through internal counterparty credit lines along with structured monitoring on the actu-al exposure. Credit lines are determined on the basis of the counter-party’s credit rating, typically by reference to credit ratings from external rating agencies.
Financing and capital resourcesOne of the main financial management responsibilities is to secure sufficient, flexible financial resources for the
3�
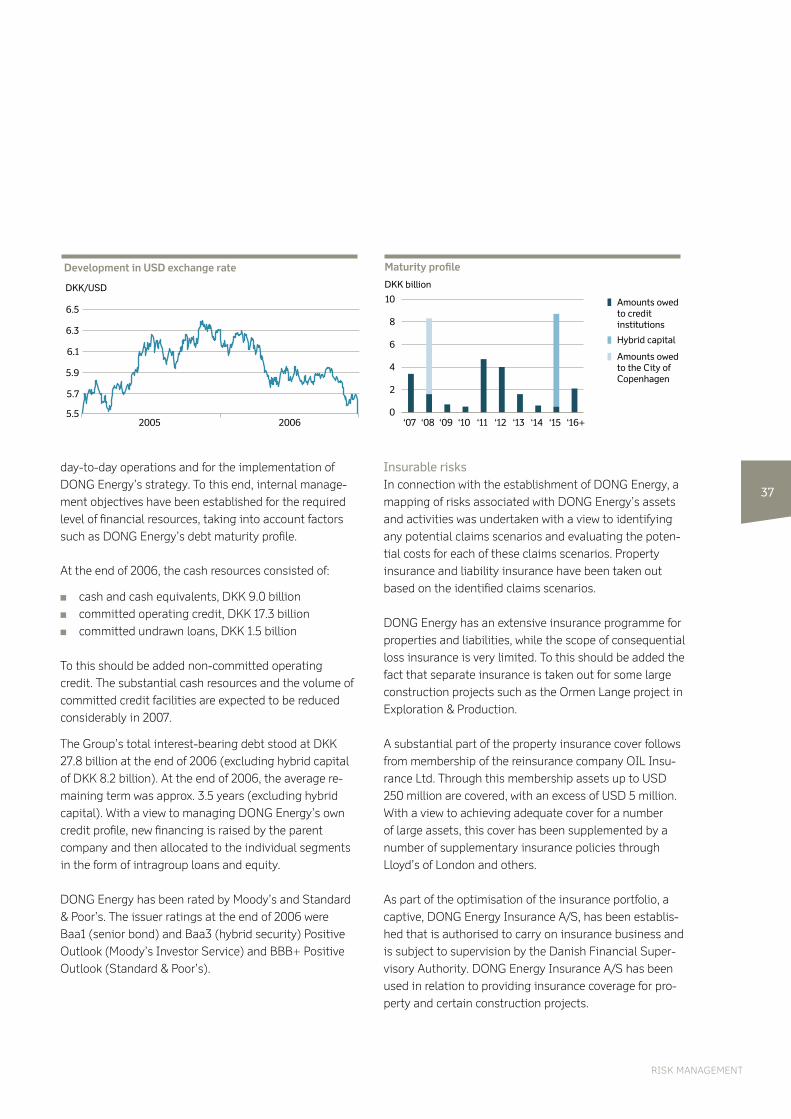
day-to-day operations and for the implementation of DONG Energy’s strategy. to this end, internal manage-ment objectives have been established for the required level of financial resources, taking into account factors such as DONG Energy’s debt maturity profile.
at the end of 2006, the cash resources consisted of:
cash and cash equivalents, DKK 9.0 billioncommitted operating credit, DKK 17.3 billioncommitted undrawn loans, DKK 1.5 billion
to this should be added non-committed operating credit. the substantial cash resources and the volume of committed credit facilities are expected to be reduced considerably in 2007.
the Group’s total interest-bearing debt stood at DKK 27.8 billion at the end of 2006 (excluding hybrid capital of DKK 8.2 billion). at the end of 2006, the average re-maining term was approx. 3.5 years (excluding hybrid capital). With a view to managing DONG Energy’s own credit profile, new financing is raised by the parent company and then allocated to the individual segments in the form of intragroup loans and equity.
DONG Energy has been rated by moody’s and Standard & poor’s. the issuer ratings at the end of 2006 were Baa1 (senior bond) and Baa3 (hybrid security) positive Outlook (moody’s Investor Service) and BBB+ positive Outlook (Standard & poor’s).
■
■
■
Insurable risks In connection with the establishment of DONG Energy, a mapping of risks associated with DONG Energy’s assets and activities was undertaken with a view to identifying any potential claims scenarios and evaluating the poten-tial costs for each of these claims scenarios. property insurance and liability insurance have been taken out based on the identified claims scenarios.
DONG Energy has an extensive insurance programme for properties and liabilities, while the scope of consequential loss insurance is very limited. to this should be added the fact that separate insurance is taken out for some large construction projects such as the Ormen lange project in Exploration & production.
a substantial part of the property insurance cover follows from membership of the reinsurance company OIl Insu-rance ltd. through this membership assets up to uSD 250 million are covered, with an excess of uSD 5 million. With a view to achieving adequate cover for a number of large assets, this cover has been supplemented by a number of supplementary insurance policies through lloyd’s of london and others.
as part of the optimisation of the insurance portfolio, a captive, DONG Energy Insurance a/S, has been establis-hed that is authorised to carry on insurance business and is subject to supervision by the Danish Financial Super-visory authority. DONG Energy Insurance a/S has been used in relation to providing insurance coverage for pro-perty and certain construction projects.
37
rISK maNaGEmENt
Development in USD exchange rate
DKK/USD
5.5
5.7
5.9
6.1
6.3
6.5
2005 20060
2
4
6
8
10
‘16+‘15‘14‘13‘12‘11‘10‘09‘08‘07
Maturity pro�le
Amounts owed to credit institutions
Hybrid capital
Amounts owed to the City of Copenhagen
DKK billion
DONG ENErGy aNNual rEpOrt 2006
DONG Energy is a public limited company with the Da-nish State as principal shareholder. the State was the sole shareholder until the merger with Elsam, Energi E2, Nesa and the electricity arms of the City of Copenhagen and Frederiksberg municipality. On 19 april 2006, a num-ber of former Elsam and Energi E2 shareholders elected to exchange their respective shares for shares in DONG Energy, reducing the State’s ownership interest to approx. 73%. the former shareholders in Elsam hold approx. 16% of the shares, and SEaS-NVE Holding holds approx. 11%.
the shareholders have the ultimate authority over the company, within the framework established by law, and they exercise their right to make decisions at the general meetings. the State exercises its ownership in accordan-ce with the principles in the publication ’the State as shareholder’.
a new shareholders’ agreement was entered into in spring 2006, partly with a view to governing:
the acceptance of Elsam’s shareholders and members of the SEaS-NVE Group as shareholders of DONG Energy the parties’ mutual rights and obligations as share-holders until such time as the company is listedthe framework for implementation of the IpO
the Supervisory Board and Executive Board are two sepa-rate entities and do not have any joint members. the Su-pervisory Board monitors the company’s financial perform-ance, management and organisation on behalf of the shareholders, while the Executive Board has the day-to-day responsibility for the company’s operations.
DONG Energy endeavours to ensure that the company’s objectives and the overall principles and structures that govern the interaction between the management bodies, the owners and the company’s other stakeholders are compatible with good corporate governance at all times.
DONG Energy complies with the latest revised re-commendations from the Copenhagen Stock Exchange (October 2005). the recommendations must be applied
■
■
■
using a ”comply-or-explain” principle, which means that the company must either comply with them or explain why they are not being complied with in full or in part .
the recommendations are intended for listed companies. DONG Energy is not a listed company, but essentially operates as such. the intention is to list DONG Energy’s shares on the Copenhagen Stock Exchange in the second half of 2007, market conditions permitting. DONG Energy has been complying with the Copenhagen Stock Exchan-ge’s recommendations since 2005; however, as a result of DONG Energy’s current ownership structure not all are deemed to be relevant.
DONG Energy complies with the Copenhagen Stock Ex-change recommendations, with the following exceptions:
the special competencies of each Supervisory Board member elected by the shareholders in general meet-ing are assessed in connection with their election to the Supervisory Board. the Supervisory Board mem-bers jointly represent extensive knowledge and expe-rience from managerial posts at large Danish and foreign companies with a broad range of areas of acti-vity, including in areas directly related to DONG Ener-gy’s segments. It has been decided not to include a written assessment of each member’s specific compe-tencies in the annual report there is no fixed retirement age for members of the Supervisory Board. Each member’s work and the com-position of the Supervisory Board are assessed in connection with the Supervisory Board’s annual self-assessmentNo explicit limits have been fixed relating to the num-
ber of Supervisory Board memberships, etc., that each member of the Executive Board may hold; however, it is judged that the scope of the existing Executive Board members’ work on other Supervisory Boards does not conflict with good corporate governance
as a result of changes in the composition of the Super-visory Board a decision was made in 2006 to post-pone until a later time the Supervisory Board’s self-assessment and its evaluation of the Executive Board’s work and results, including how the collabora-
■
■
■
■
COrPOrATE GOVErNANCE
3�

tion between the Supervisory Board and the Executive Board has functioned as a consequence of the fact that DONG Energy is not listed and only has a limited number of shareholders, the following recommendations are not relevant:
– the recommendation aimed at supporting communi-cation between the company and its shareholders and between the company’s shareholders
– the recommendation aimed at the shareholders’ use of proxies at general meetings – the recommendation concerning information relating
to Supervisory Board members’ shareholdings, etc., in the company
the Supervisory Board has established a communications policy according to which credibility, clarity and precision are critical to ensure understanding and acceptance of DONG Energy’s activities and products by the public. this is the basis upon which DONG Energy performs its activi-ties, thereby creating value for the Group, the owners and society. Information about the Group’s activities is therefo-re communicated systematically. the public is informed via the website dongenergy.com, press releases, Stock Ex-change announcements and notices to the Danish Com-merce and Companies agency. DONG Energy regularly holds investor meetings for financial investors.
In accordance with Danish ministry of Finance guidelines, DONG Energy’s financial reporting follows the provisions for listed companies and is presented in accordance with IFrS as adopted by the Eu. a corporate responsibility re-port will be prepared for 2006 for the first time. In additi-on, statutory environmental accounts will be prepared. the publications will be available on the website www.dongenergy.com.
General meetings General meetings must be convened with not less than two weeks’ notice in accordance with the articles of asso-ciation - or eight days in the case of Extraordinary Gene-ral meetings. the agenda and the complete set of resolu-tions to be proposed must be forwarded not later than eight days before the general meeting or, if the notice has
■
been waived, at the same time as the notice convening the meeting. at the annual General meeting the annual report must be adopted; auditors appointed; a chairman, deputy chairman and other members of the Supervisory Board elected; and the Supervisory Board’s remunerati-on determined.
the articles of association were amended at the annual General meeting in 2006 to reflect the company’s change of name, registered office, objectives, share capital and the number of Supervisory Board members. the share ca-pital was increased at the request of the State by sub-scription to new shares by shareholders in Elsam and SEaS-NVE, formerly a shareholder in Energi E2, in ex-change for their respective shares in Elsam and Energi E2.
Composition of Supervisory Board the composition of the Supervisory Board has been alig-ned to the new Group. the Supervisory Board has thus been enlarged by two members, consisting of 11 mem-bers at the end of 2006. Eight of these were elected by the shareholders at the annual General meeting and three were elected by the employees. according to the articles of association, the Supervisory Board must con-sist of eight members elected by the shareholders in ge-neral meeting. two of the members elected by the share-holders in general meeting must be appointed pursuant to a provisional shareholders’ agreement between DONG Energy’s shareholders by SEaS-NVE and the former sha-reholders of Elsam, respectively. None of the Supervisory Board members elected by the shareholders in general meeting have had any association with DONG Energy other than as Supervisory Board members in companies that are now part of the DONG Energy Group, and as re-sidential customers on standard terms, either in previous years or in the current year.
all Supervisory Board members elected by the sharehold-ers in general meeting stand down at the annual Gene-ral meeting each year and may be re-elected.
according to Danish legislation, the employees are entit-led to have a number of representatives on the Supervi-sory Board equivalent to half the number of members
3�
COrpOratE GOVErNaNCE
>>
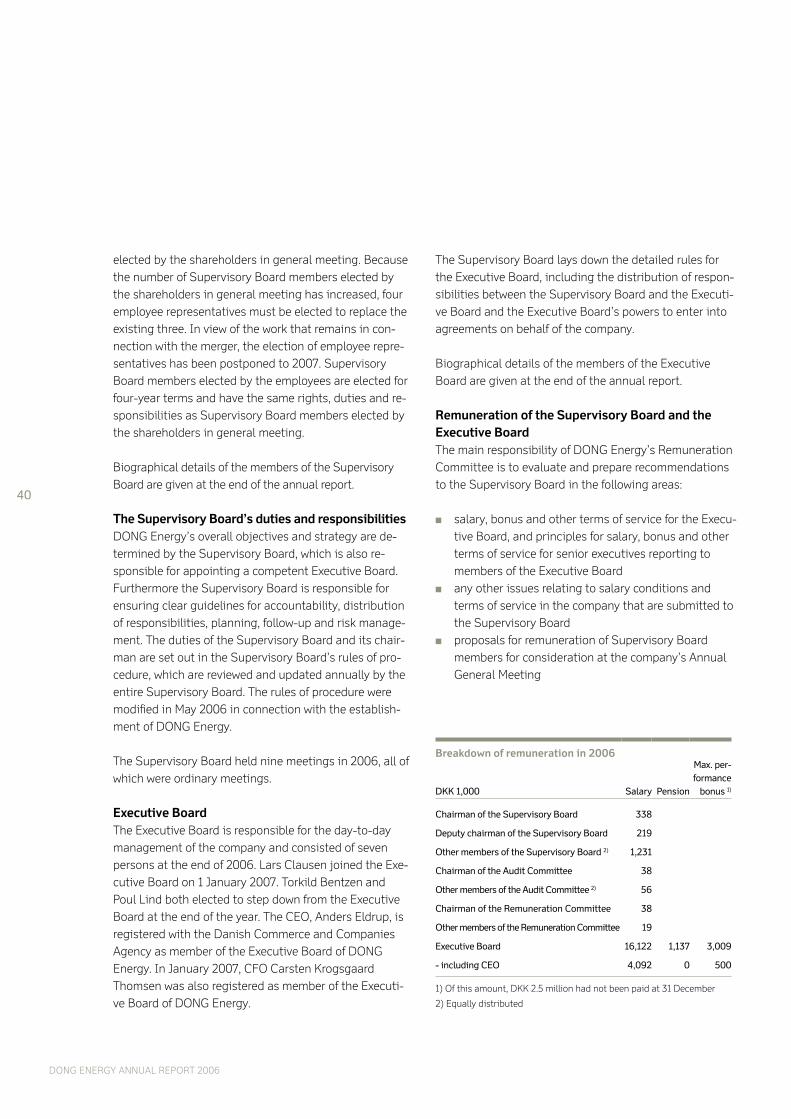
DONG ENErGy aNNual rEpOrt 2006
elected by the shareholders in general meeting. Because the number of Supervisory Board members elected by the shareholders in general meeting has increased, four employee representatives must be elected to replace the existing three. In view of the work that remains in con-nection with the merger, the election of employee repre-sentatives has been postponed to 2007. Supervisory Board members elected by the employees are elected for four-year terms and have the same rights, duties and re-sponsibilities as Supervisory Board members elected by the shareholders in general meeting.
Biographical details of the members of the Supervisory Board are given at the end of the annual report.
The Supervisory Board’s duties and responsibilitiesDONG Energy’s overall objectives and strategy are de-termined by the Supervisory Board, which is also re-sponsible for appointing a competent Executive Board. Furthermore the Supervisory Board is responsible for ensuring clear guidelines for accountability, distribution of responsibilities, planning, follow-up and risk manage-ment. the duties of the Supervisory Board and its chair-man are set out in the Supervisory Board’s rules of pro-cedure, which are reviewed and updated annually by the entire Supervisory Board. the rules of procedure were modified in may 2006 in connection with the establish-ment of DONG Energy.
the Supervisory Board held nine meetings in 2006, all of which were ordinary meetings.
Executive Board the Executive Board is responsible for the day-to-day management of the company and consisted of seven persons at the end of 2006. lars Clausen joined the Exe-cutive Board on 1 January 2007. torkild Bentzen and poul lind both elected to step down from the Executive Board at the end of the year. the CEO, anders Eldrup, is registered with the Danish Commerce and Companies agency as member of the Executive Board of DONG Energy. In January 2007, CFO Carsten Krogsgaard thomsen was also registered as member of the Executi-ve Board of DONG Energy.
the Supervisory Board lays down the detailed rules for the Executive Board, including the distribution of respon-sibilities between the Supervisory Board and the Executi-ve Board and the Executive Board’s powers to enter into agreements on behalf of the company.
Biographical details of the members of the Executive Board are given at the end of the annual report.
remuneration of the Supervisory Board and the Executive Boardthe main responsibility of DONG Energy’s remuneration Committee is to evaluate and prepare recommendations to the Supervisory Board in the following areas:
salary, bonus and other terms of service for the Execu-tive Board, and principles for salary, bonus and other terms of service for senior executives reporting to members of the Executive Board any other issues relating to salary conditions and terms of service in the company that are submitted to the Supervisory Board proposals for remuneration of Supervisory Board members for consideration at the company’s annual General meeting
■
■
■
�0
Breakdown of remuneration in 2006
DKK �,000 Salary Pension
max. per- formance
bonus �)
Chairman of the Supervisory board 33�
Deputy chairman of the Supervisory board ���
Other members of the Supervisory board �) �,�3�
Chairman of the Audit Committee 3�
Other members of the Audit Committee �) ��
Chairman of the Remuneration Committee 3�
Other members of the Remuneration Committee ��
Executive board ��,��� �,�37 3,00�
- including CEO �,0�� 0 �00
1) Of this amount, DKK 2.5 million had not been paid at 31 December
2) Equally distributed

the committee consists of the Chairman of DONG Ener-gy’s Supervisory Board, Fritz H. Schur, who also chairs the committee, and the Deputy Chairman of the Board, lars Nørby Johansen. the remuneration Committee held four meetings in 2006. DONG Energy’s remuneration policy is based on a desire to attract, retain and motivate the mem-bers of the Supervisory Board and the Executive Board. It is therefore the aim that remuneration should be set at a competitive level at all times.
In 2006, the Supervisory Board received fixed remunera-tion totalling DKK 1.9 million compared to DKK 2.1 million in 2005. the Executive Board’s remuneration is fixed by the Supervisory Board. In 2006, the Executive Board re-ceived DKK 16.1 million in fixed remuneration and DKK 1.1 million in pension. this included the CEO’s remuneration, which amounted to DKK 4.1 million, including pension.
In addition to their fixed remuneration, the members of the Executive Board received a performance-based bonus and a retention bonus of DKK 6.3 million in 2006 relating to 2005, including DKK 1.7 million to the CEO.
the performance-based bonus for the entire Executive Board for 2006 cannot exceed DKK 3.0 million. most of this bonus will be fixed and payable in 2007. DONG Energy does not offer share options, subscription rights or similar incentive schemes. If the employment of a member ceases for reasons other than his/her resignation, he/she is entit-led to compensation equivalent to 24 months’ salary.
Audit matters In the summer of 2006, the Supervisory Board appointed an audit Committee consisting of the Supervisory Board members lars Nørby Johansen (chairman), asbjørn lar-sen, Svend Sigaard and Jens Kampmann. the committee held four meetings in 2006. the primary function of the audit Committee is to support the Supervisory Board in its supervision of:
the integrity of the company’s annual report, financial reporting and internal accounting and financial control systems the conclusion of engagement agreements with the
■
■
��
COrpOratE GOVErNaNCE
external auditors and evaluation of the external audi-tors’ qualifications and independence the company’s compliance with statutory and official requirements relating to the company’s annual report and financial reporting and internal control systems, including the company’s control procedures relating to publication the discussion and planning of audit work with the ex-ternal auditors and evaluation of the work performed by them the overseight of matters related to the risk policy de-termined by the Supervisory Board for financial and commercial risks
In the autumn of 2006, the audit Committee established a whistleblower policy that enables both employees and external individuals to contact the audit Committee ano-nymously if they suspect questionable practices in con-nection with accounts, financial reporting, internal con-trols or auditing practices.
risk management and internal controlDONG Energy continually seeks to identify risk factors that could impact adversely on the Group’s activities, financial position and results. the Supervisory Board evaluates the company’s risk management at least once a year on the basis of the Executive Board’s recommendations.
Day-to-day risk management is performed by DONG Energy’s internal risk Committee under the guidance of the CFO. the committee reports to the Supervisory Board on all important risk areas on a quarterly basis.
the Supervisory Board has the overall responsibility for the internal control environment. In consultation with the Supervisory Board, the risk Committee prepares and plans appropriate internal controls. the risk Committee reports regularly to the Supervisory Board on any material weaknesses in the structure or operation of the company’s internal controls.
■
■
■
��
DONG ENErGy aNNual rEpOrt 2006
FINANCIAL rEVIEW
Both EBItDa, EBIt and profit after tax were considerably higher than expected at the start of the year. the results benefited from the fact that oil and gas prices were hig-her than expected. Furthermore, the electricity compa-nies featured with profit after tax of DKK 2,042 million, the recognition of which was not assumed at the start of the year. the results of the acquired companies bene-fited from high electricity prices. the acquired compa-nies Elsam, Energi E2, Nesa and the electricity activities from the City of Copenhagen and the municipality of Frederiksberg featured in full in DONG Energy’s group financial statements for the third and fourth quarters. Elsam, Energi E2 and Nesa were included as subsidiaries from 1 July, while the electricity activities from the City of Copenhagen and the municipality of Frederiksberg were recognised from 1 may. the shares of the results of Elsam, Energi E2 and Nesa were recognised as profit of associates in the period before 1 July.
revenueFull-year revenue was DKK 35,661 million versus DKK 18,493 million in 2005. Excluding the acquired electricity companies, revenue was DKK 6,399 million ahead, dri-ven by higher oil and gas prices, partly offset by lower oil production and gas sales than in 2005. the oil price (Brent) averaged uSD 65.2/bbl versus uSD 54.4/bbl in 2005, equivalent to a 20% increase.
results for the yearEBIt was DKK 5,534 million compared with DKK 4,099 million in 2005. EBIt from the acquired electricity companies amounted to DKK 1,821 million.
Full-year EBIt was adversely affected by non-recurring items of DKK 2,008 million, while, in 2005, non-recur-ring items contributed DKK 40 million to EBIt. the sum of DKK 2,008 million included a sum of DKK 2,185 milli-on relating to an intragroup adjustment that arose in connection with DONG Naturgas’ termination of in-tragroup agreements. the corresponding gain was re-cognised in the opening balance sheets at 1 July 2006 and consequently was not recognised as income in the group financial statements, resulting in an expense of DKK 2,185 million for the Group. the accounting treat-
ment is based on uS Gaap (EItF-04-01), which IFrS re-lies on in this instance.
Excluding acquired electricity companies and non-recur-ring items, EBIt was up by DKK 1,662 million, reflecting several counterbalancing items. On the positive front were the increasing oil and gas prices from which both Exploration & production and markets benefited.
markets’ results benefited from the so-called time lag ef-fect. the time lag effect arises as a result of the price of oil and the uSD exchange rate featuring with different time lags in DONG Energy’s main natural gas purchase and sales contracts. Oil price changes consequently im-pact on selling prices relatively quickly, whereas purchase prices are adjusted with a delay of up to 17 months. the price increases yielded a substantial gain in 2006, which, however, was even bigger in 2005, when oil prices also rose significantly. the time lag effect will be negative in the event of falling oil prices.
markets’ results also benefited from the fact that gas was purchased in 2006 under purchase contracts with favourable price indexing. DONG Energy buys gas under several types of contracts with different price indexing. the purchases under the individual contracts are made within the gas year, which runs from 1 October to 30 September, although there is some flexibility with re-spect to which contracts purchases can be made under in the individual months during the gas year. according-ly, in some years, the effect may be positive, while, in others, it may be negative. In 2006, there was a signifi-cant positive effect, while the effect was neutral in 2005.
the total effect of time lag and gas purchase allocation was at the same level in 2006 as in 2005.
to this should be added the effect of the fact that a large proportion of the oil price exposure was hedged in 2005 at low prices, which meant that the full impact of the high oil prices was not felt. In 2006, a smaller proportion of the oil price exposure was hedged at low prices.
the results were adversely affected by declining produc-
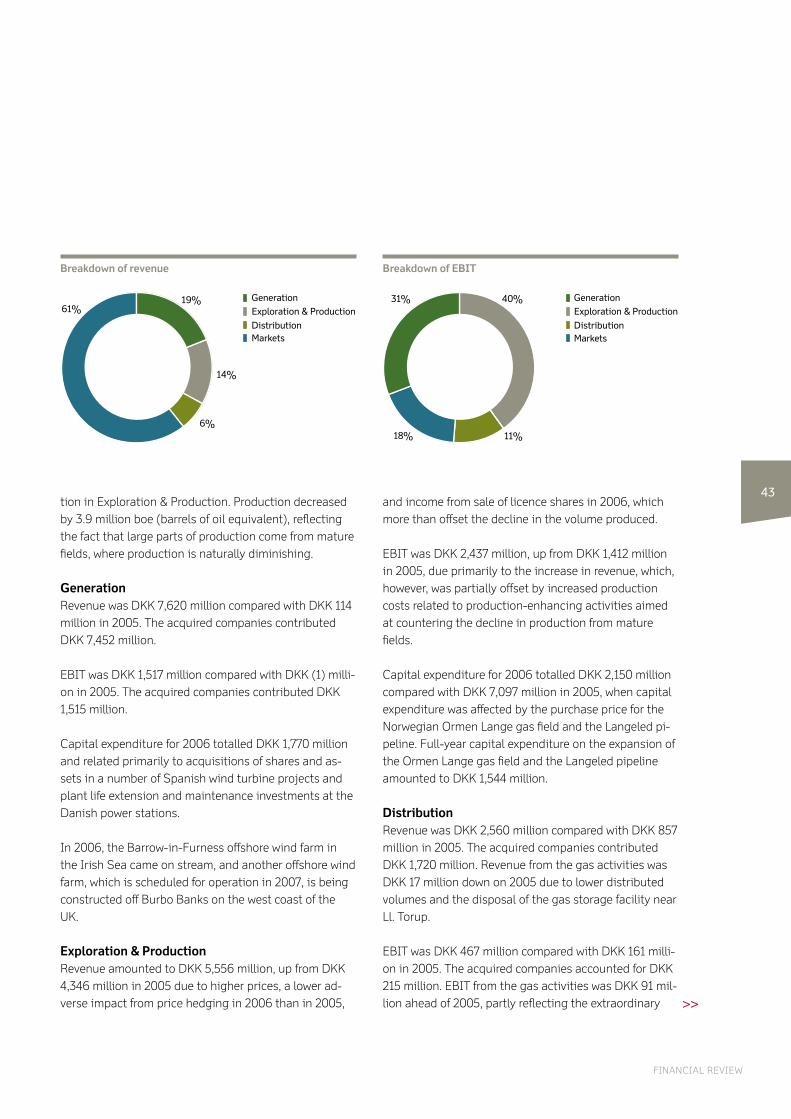
�3tion in Exploration & production. production decreased by 3.9 million boe (barrels of oil equivalent), reflecting the fact that large parts of production come from mature fields, where production is naturally diminishing.
Generationrevenue was DKK 7,620 million compared with DKK 114 million in 2005. the acquired companies contributed DKK 7,452 million.
EBIt was DKK 1,517 million compared with DKK (1) milli-on in 2005. the acquired companies contributed DKK 1,515 million.
Capital expenditure for 2006 totalled DKK 1,770 million and related primarily to acquisitions of shares and as-sets in a number of Spanish wind turbine projects and plant life extension and maintenance investments at the Danish power stations.
In 2006, the Barrow-in-Furness offshore wind farm in the Irish Sea came on stream, and another offshore wind farm, which is scheduled for operation in 2007, is being constructed off Burbo Banks on the west coast of the uK.
Exploration & Productionrevenue amounted to DKK 5,556 million, up from DKK 4,346 million in 2005 due to higher prices, a lower ad-verse impact from price hedging in 2006 than in 2005,
and income from sale of licence shares in 2006, which more than offset the decline in the volume produced.
EBIt was DKK 2,437 million, up from DKK 1,412 million in 2005, due primarily to the increase in revenue, which, however, was partially offset by increased production costs related to production-enhancing activities aimed at countering the decline in production from mature fields.
Capital expenditure for 2006 totalled DKK 2,150 million compared with DKK 7,097 million in 2005, when capital expenditure was affected by the purchase price for the Norwegian Ormen lange gas field and the langeled pi-peline. Full-year capital expenditure on the expansion of the Ormen lange gas field and the langeled pipeline amounted to DKK 1,544 million.
Distributionrevenue was DKK 2,560 million compared with DKK 857 million in 2005. the acquired companies contributed DKK 1,720 million. revenue from the gas activities was DKK 17 million down on 2005 due to lower distributed volumes and the disposal of the gas storage facility near ll. torup.
EBIt was DKK 467 million compared with DKK 161 milli-on in 2005. the acquired companies accounted for DKK 215 million. EBIt from the gas activities was DKK 91 mil-lion ahead of 2005, partly reflecting the extraordinary
Breakdown of revenue
6%
14%
61%19% Generation
Exploration & Production
DistributionMarkets
FINaNCIal rEVIEW
Breakdown of EBIT
31%
18%
40%
11%
GenerationExploration & Production
DistributionMarkets
>>
��
DONG ENErGy aNNual rEpOrt 2006
sale in march of excess cushion gas, which generated a DKK 43 million gain. the increase also reflected incre-ased sales of storage capacity, tariff increases and the fact that, in 2005, EBIt was depressed by an impairment loss on a service line in the distribution network that was no longer in use.
Capital expenditure for 2006 totalled DKK 758 million and related primarily to trenching of cables in North Zealand and reinvestments in the electricity distribution network, but also to expansion of the gas storage capa-city near Stenlille in 2006.
Marketsrevenue amounted to DKK 24,115 million, up from DKK 13,885 million in 2005. Excluding revenue from the ac-quired companies, the increase was DKK 3,794 million. the increase was due primarily to higher selling prices and a positive time lag effect.
EBIt was DKK 1,217 million compared with DKK 2,582 million in 2005. EBIt was depressed by a non-recurring charge of DKK 2,185 million relating to the termination of intragroup agreements. Excluding non-recurring in-come and acquired companies, EBIt was DKK 729 milli-on ahead of 2005, reflecting higher selling prices. a low-er positive time lag effect than in 2005 was offset by the positive effect of gas purchase allocation (purchases from proportionately less costly purchase contracts).
Capital expenditure for 2006 totalled DKK 530 million and related primarily to It and the underground installa-tion of an optical fibre network in North Zealand and the metropolitan area. In addition, a major expansion of the property facilities in Vangede was undertaken.
Capital expenditure in 2005 related primarily to the ac-quisition of the stake in Ormen lange, the setting up of a partnership with Stadtwerke lübeck Holding GmbH as part of which a 25.1% ownership interest in Stadtwerke lübeck GmbH was acquired, and the acquisition of In-tergas levering B.V.
Profit on disposal of enterprisesprofit on sale of enterprises included a gain on the sale of the gas storage facility near ll. torup to Energinet.dk, which contributed a preliminary profit of DKK 1,000 milli-on. Energinet.dk’s acquisition of the storage facility will be completed on 1 may 2007, when the free cash flows are expected to benefit by approx. DKK 2 billion before offset-
Financial items
DKKm 2006 2005
Interest expenses, net (���) (���)
Interest element of abandonment costs (�3) (��)
Dividends on equity investments � ���
Other �� �
Financial items, net (���) (���)
��
ting of transferred net debt. the free cash flows conse-quently were not affected by the transaction in 2006.
Financial itemsFinancial items amounted to a net charge of DKK 592 million versus DKK 152 million in 2005, including inter-est expense of DKK 529 million compared with DKK 211 million in 2005. Interest expense increased as a result of the increase in average interest-bearing debt in 2006 following the acquisitions made. Net interest-bearing debt averaged DKK 9.4 billion versus DKK 3.3 billion in 2005.
Income taxFull-year income tax expense was DKK 1,518 million compared with DKK 1,322 million in 2005. the tax rate - adjusted for the fact that associates are recognised after tax (2006), the tax-free profit on the sale of the gas sto-rage facility near ll. torup (2006) - was 32% compared with 39% in 2005. the tax rate exceeded 28% as a re-sult of the overall tax rate of 78% due to hydrocarbon tax in Norway.
Profit after taxFull-year profit after tax was DKK 4,917 million compared with DKK 2,687 million in 2005.
profit was adversely affected by non-recurring items of DKK 385 million net relating to the termination of in-tragroup agreements, partly offset by a gain on the sale of the gas storage facility near ll. torup and the disposal of minor activities. In 2005, profit benefited from non-re-curring items of DKK 229 million. acquired electricity companies contributed DKK 2,042 million to profit. profit for 2005 included dividends of DKK 115 million from own-ership interests in the acquired electricity companies.
Excluding the above, profit was DKK 917 million ahead of 2005, driven primarily by improvements in EBIt, partial-ly offset by higher financial expenses due to higher net interest-bearing debt, as described above.
Cash flowsOperating cash inflow was DKK 8,169 million, up from
FINaNCIal rEVIEW
DKK 5,866 million in 2005 due to higher EBItDa, partly offset by higher income tax expense. Cash flows from investing activities amounted to DKK (7,809) million versus DKK (10,128) million in 2005. the principal in-vestments were the acquisitions of the electricity activi-ties of the City of Copenhagen and the municipality of Frederiksberg (incl. Energi E2 shares), the remaining 75% of the shares in Elsam (incl. Nesa and Energi E2 shares), 30% of the shares in Energi E2, and the expan-sion of the Ormen lange and langeled projects. the purchase price for the electricity companies is recogni-sed as a net sum after offsetting acquired cash and cash equivalents and the DKK 10,041 million capital in-crease to SEaS-NVE and a number of former Elsam shareholders in april. the purchase price for the electri-city activities of the City of Copenhagen does not fea-ture in full, as a payment of DKK 6.7 billion is still out-standing. Cash flows from investing activities also include payment for Elsam’s and Energi E2’s sale of as-sets to Vattenfall.
Equity Equity stood at DKK 42,268 million at year end compa-red with DKK 26,278 million at the end of 2005. Equity increased by the DKK 10,041 million capital increase to SEaS-NVE and a number of former Elsam shareholders in april, profit for the period and the change in the effect of value adjustments of hedging instruments, partly off-set by dividend payments totalling DKK 486 million.
Balance sheetthe balance sheet total increased from DKK 46,854 mil-lion at the end of 2005 to DKK 105,586 million at the end of 2006, mainly as a consequence of the recogniti-on of the acquired electricity companies and an in-crease in balance sheet items relating to hedging in-struments. Net interest-bearing debt was DKK 17,779 million compared with net cash and cash equivalents of DKK 208 million at the end of 2005.
Proposed dividendsthe Supervisory Board recommends that a dividend of 40% of profit after tax be paid for 2006, giving a divi-dend payment of DKK 1,967 million.


47
Skærbæk, 12 March 2007
Executive Board
Anders Eldrup Carsten Krogsgaard ThomsenCEO CFO
Supervisory Board
Fritz H. Schur Lars Nørby Johansen Asbjørn Larsen Svend SigaardChairman Deputy Chairman
Lars Torpe Christoffersen Jens Kampmann Kresten Philipsen Poul Arne Nielsen
Jesper Magtengaard Thorkild Meiner-Jensen Bent Stubkjær PedersenEmployee representative Employee representative Employee representative
STATEMENT BY THE EXECUTIVE AND SUPERVISORY BOARDSThe Executive and Supervisory Boards have today consi-dered and approved the annual report of DONG Energy A/S for the financial year 2006.
The annual report has been prepared in accordance with International Financial Reporting Standards as adopted by the EU and additional Danish disclosure require-ments for annual reports of listed and State-owned public limited companies. We consider the accounting
policies used to be appropriate. Accordingly, the annual report gives a true and fair view of the Group’s and the parent company’s financial position at 31 December 2006 and of the results of the Group’s and the parent company’s operations and cash flows for the financial year 1 January - 31 December 2006.
We recommend that the annual report be approved at the Annual General Meeting.
DONG ENERGY ANNUAL REPORT 2006
To the shareholders of DONG Energy A/SWe have audited the annual report of DONG Energy A/S for the financial year 1 January - 31 December 2006, which comprises the statement by the Executive and Supervisory Boards, the management’s review and the income statement, balance sheet, statement of changes in equity, cash flow statement and notes for the Group as well as the parent company. The annual report has been prepared in accordance with International Financi-al Reporting Standards as adopted by the EU and addi-tional Danish disclosure requirements for annual reports of listed and State-owned public limited companies.
Management’s responsibility for the annual reportManagement is responsible for the preparation and fair presentation of the annual report in accordance with International Financial Reporting Standards as adopted by the EU and additional Danish disclosure require-ments for annual reports of listed and State-owned public limited companies. This responsibility includes: designing, implementing and maintaining internal control relevant to the preparation and fair presentation of an annual report that is free from material misstate-ment, whether due to fraud or error; selecting and using appropriate accounting policies; and making accounting estimates that are reasonable in the circumstances.
Auditors’ responsibility and basis of opinionOur responsibility is to express an opinion on the annual report based on our audit. We conducted our audit in accordance with Danish Standards on Auditing. Those standards require that we comply with ethical require-ments and plan and perform the audit to obtain reaso-nable assurance whether the annual report is free from material misstatement.
An audit involves performing procedures to obtain audit evidence about the amounts and disclosures in the annual report. The procedures selected depend on the auditors’ judgment, including the assessment of the risks of material misstatement of the annual report, whether due to fraud or error. In making those risk assessments, the auditors consider internal control rele-vant to the Company’s preparation and fair presentation of the annual report in order to design audit procedures that are appropriate in the circumstances, but not for the purpose of expressing an opinion on the effectiveness of the Company’s internal control. An audit also includes evaluating the appropriateness of accounting policies used and the reasonableness of accounting estimates made by Management, as well as evaluating the overall presentation of the annual report.
We believe that the audit evidence we have obtained is sufficient and appropriate to provide a basis for our audit opinion.
Our audit did not result in any qualification.
OpinionIn our opinion, the annual report gives a true and fair view of the Group’s and the parent company’s financial position at 31 December 2006 and of the results of the Group’s and the parent company’s operations and cash flows for the financial year 1 January - 31 December 2006 in accordance with International Financial Re-porting Standards as adopted by the EU and additional Danish disclosure requirements for annual reports of listed and State-owned public limited companies.
INDEPENDENT AUDITORS’ REPORT
Copenhagen, 12 March 2007
KPMG C.Jespersen DeloitteStatsautoriseret Revisionsinteressentskab Statsautoriseret Revisionsaktieselskab
Flemming Brokhattingen Torben Bender Jørgen Jørgensen Kim MückeState Authorised State Authorised State Authorised State Authorised Public Accountant Public Accountant Public Accountant Public Accountant
48
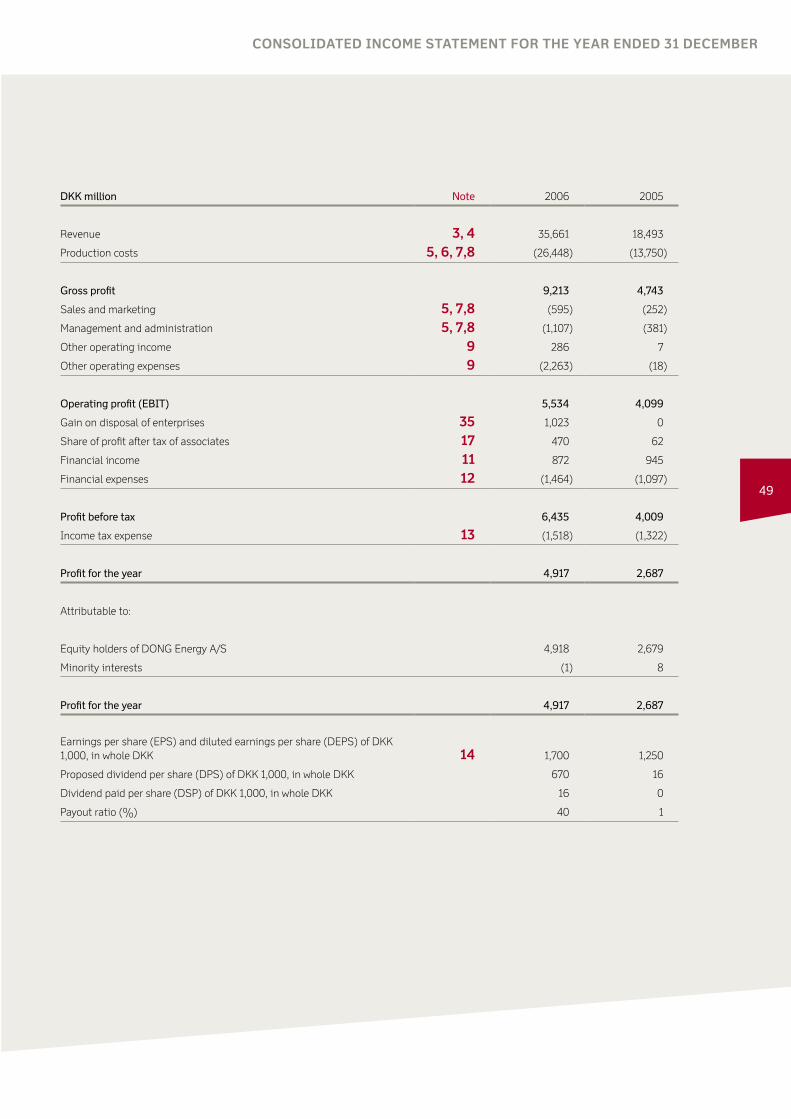
49
CONSOLIDATED INCOME STATEMENT FOR THE YEAR ENDED 31 DECEMBER
DKK million Note 2006 2005
Revenue 3, 4 35,661 18,493
Production costs 5, 6, 7,8 (26,448) (13,750)
Gross profit 9,213 4,743
Sales and marketing 5, 7,8 (595) (252)
Management and administration 5, 7,8 (1,107) (381)
Other operating income 9 286 7
Other operating expenses 9 (2,263) (18)
Operating profit (EBIT) 5,534 4,099
Gain on disposal of enterprises 35 1,023 0
Share of profit after tax of associates 17 470 62
Financial income 11 872 945
Financial expenses 12 (1,464) (1,097)
Profit before tax 6,435 4,009
Income tax expense 13 (1,518) (1,322)
Profit for the year 4,917 2,687
Attributable to:
Equity holders of DONG Energy A/S 4,918 2,679
Minority interests (1) 8
Profit for the year 4,917 2,687
Earnings per share (EPS) and diluted earnings per share (DEPS) of DKK 1,000, in whole DKK 14 1,700 1,250
Proposed dividend per share (DPS) of DKK 1,000, in whole DKK 670 16
Dividend paid per share (DSP) of DKK 1,000, in whole DKK 16 0
Payout ratio (%) 40 1
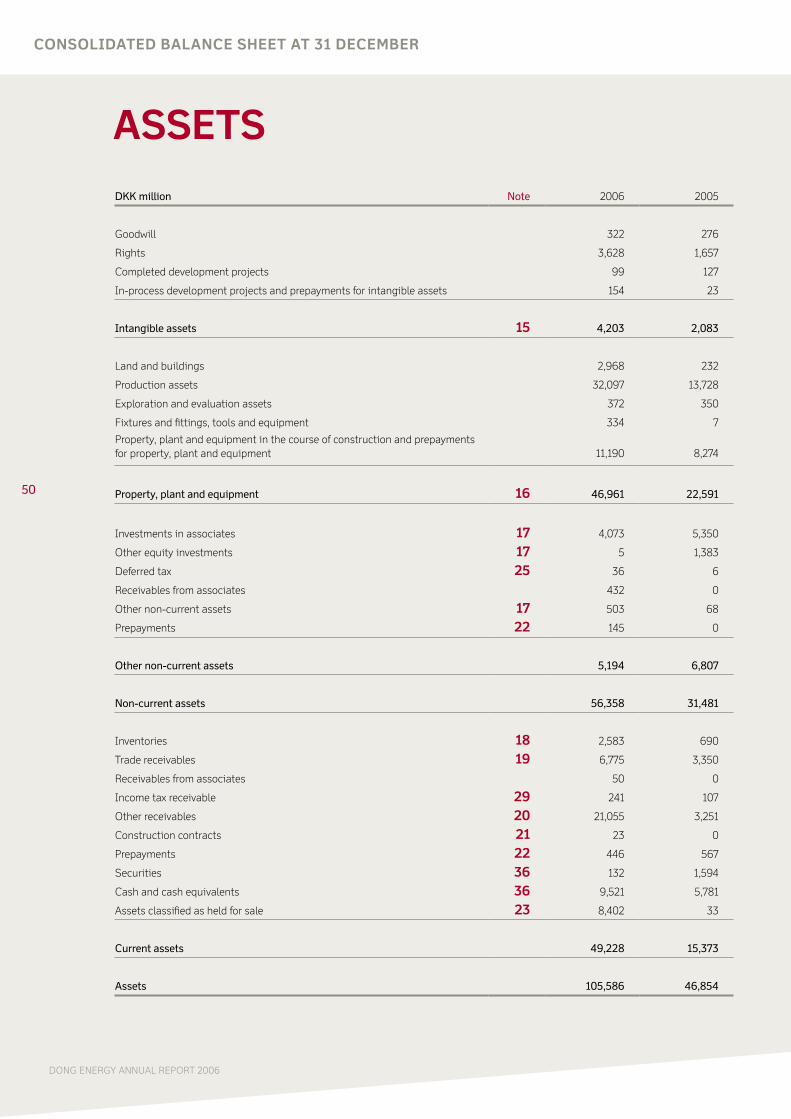
50
DONG ENERGY ANNUAL REPORT 2006
DKK million Note 2006 2005
Goodwill 322 276
Rights 3,628 1,657
Completed development projects 99 127
In-process development projects and prepayments for intangible assets 154 23
Intangible assets 15 4,203 2,083
Land and buildings 2,968 232
Production assets 32,097 13,728
Exploration and evaluation assets 372 350
Fixtures and fittings, tools and equipment 334 7
Property, plant and equipment in the course of construction and prepayments for property, plant and equipment 11,190 8,274
Property, plant and equipment 16 46,961 22,591
Investments in associates 17 4,073 5,350
Other equity investments 17 5 1,383
Deferred tax 25 36 6
Receivables from associates 432 0
Other non-current assets 17 503 68
Prepayments 22 145 0
Other non-current assets 5,194 6,807
Non-current assets 56,358 31,481
Inventories 18 2,583 690
Trade receivables 19 6,775 3,350
Receivables from associates 50 0
Income tax receivable 29 241 107
Other receivables 20 21,055 3,251
Construction contracts 21 23 0
Prepayments 22 446 567
Securities 36 132 1,594
Cash and cash equivalents 36 9,521 5,781
Assets classified as held for sale 23 8,402 33
Current assets 49,228 15,373
Assets 105,586 46,854
CONSOLIDATED BALANCE SHEET AT 31 DECEMBER
ASSETS
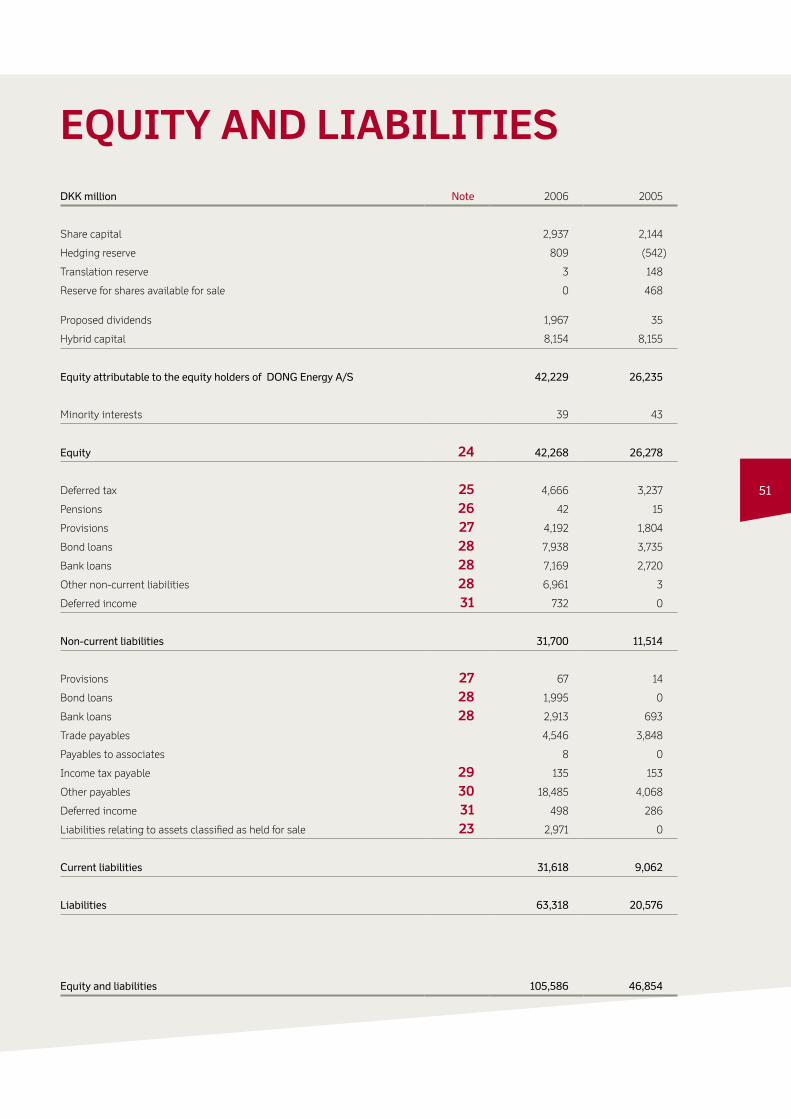
51
DKK million Note 2006 2005
Share capital 2,937 2,144
Hedging reserve 809 (542)
Translation reserve 3 148
Reserve for shares available for sale 0 468
Proposed dividends 1,967 35
Hybrid capital 8,154 8,155
Equity attributable to the equity holders of DONG Energy A/S 42,229 26,235
Minority interests 39 43
Equity 24 42,268 26,278
Deferred tax 25 4,666 3,237
Pensions 26 42 15
Provisions 27 4,192 1,804
Bond loans 28 7,938 3,735
Bank loans 28 7,169 2,720
Other non-current liabilities 28 6,961 3
Deferred income 31 732 0
Non-current liabilities 31,700 11,514
Provisions 27 67 14
Bond loans 28 1,995 0
Bank loans 28 2,913 693
Trade payables 4,546 3,848
Payables to associates 8 0
Income tax payable 29 135 153
Other payables 30 18,485 4,068
Deferred income 31 498 286
Liabilities relating to assets classified as held for sale 23 2,971 0
Current liabilities 31,618 9,062
Liabilities 63,318 20,576
Equity and liabilities 105,586 46,854
EqUITY AND LIABILITIES

52
DONG ENERGY ANNUAL REPORT 2006
CONSOLIDATED STATEMENT OF CHANGES IN EqUITY FOR THE YEAR ENDED 31 DECEMBER 2005
DKK millionShare
capitalHedging
reserve
Translation reserve
Reserve for shares available
for saleRetained earnings
Proposed dividends
Hybrid capital
Equity at-tributable to equity
holders of DONG
EnergyMinority interests Total
Equity at 1 January 2005 2,144 (233) 3 0 13,751 0 0 15,665 695 16,360
Changes in accounting policies 0 0 0 337 (337) 0 0 0 0 0
Restated equity at1 January 2005 2,144 (233) 3 337 13,414 0 0 15,665 695 16,360
Foreign exchange adjustments relating to foreign enterprises, equity-like loans, etc. - - 188 - 0 - - 188 0 188
Value adjustments of hedging instruments transferred to income statement - 2,196 - - - - - 2,196 0 2,196
Value adjustments of hedging instruments transferred to non-financial assets - (38) - - - - - (38) 0 (38)
Value adjustments of hedging instruments - (2,578) - - - - - (2,578) 0 (2,578)
Tax on equity items - 118 (43) 131 0 - 67 273 0 273
Adjustment of corporate income tax rate from 30% to 28% - (7) - 0 7 - - 0 0 0
Reversal of value adjustments of other equity investments on recognition as associates - - - 0 (228) - - (228) 0 (228)
Other adjustments - 0 0 0 (10) 0 0 (10) (6) (16)
Net gains recognised directly in equity 0 (309) 145 131 (231) 0 67 (197) (6) (203)
Profit for the year - - - - 2,679 - - 2,679 8 2,687
Total income and expense for the year 0 (309) 145 131 2,448 0 67 2,482 2 2,484
Proposed dividends - - - - (35) 35 - 0 - 0
Issuing of hybrid capital - - - - 0 - 8,088 8,088 - 8,088
Acq. of minority interests - - - - 0 - - 0 (354) (354)
Capital reduction and other adjustments 0 - - - 0 - - 0 (300) (300)
Total changes in equity in 2005 0 (309) 145 131 2,413 35 8,155 10,570 (652) 9,918
Equity at 31 December 2005 2,144 (542) 148 468 15,827 35 8,155 26,235 43 26,278
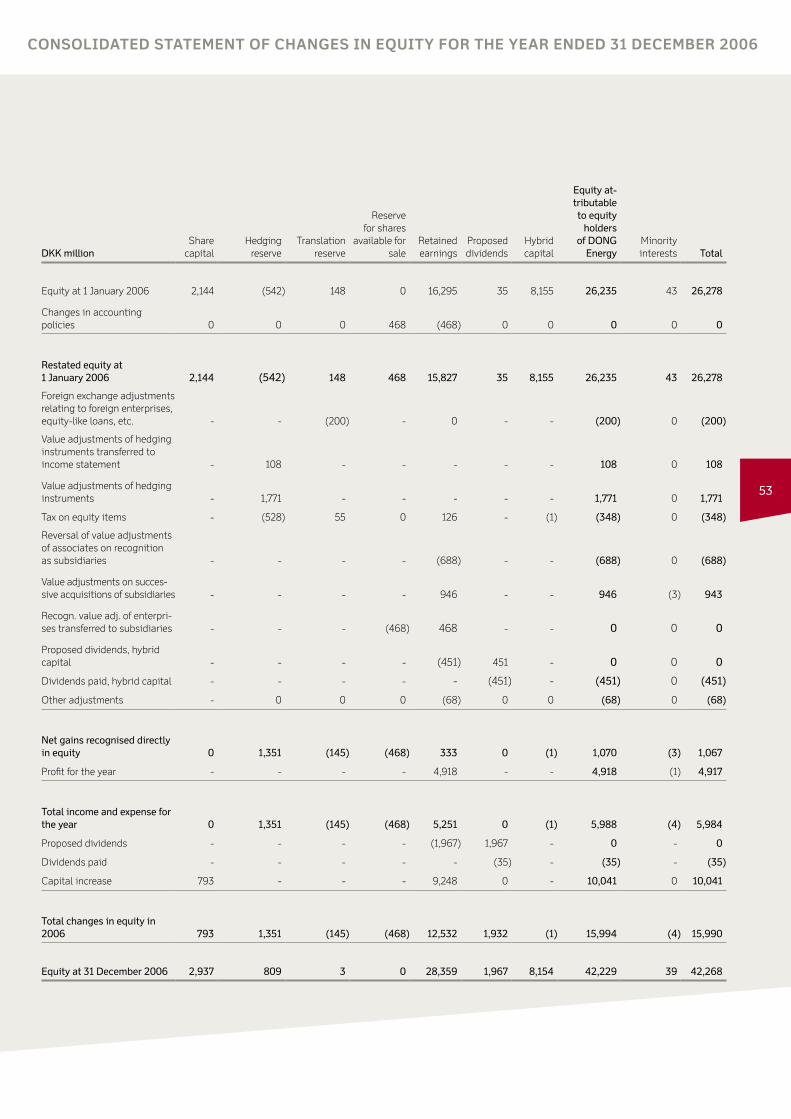
53
CONSOLIDATED STATEMENT OF CHANGES IN EqUITY FOR THE YEAR ENDED 31 DECEMBER 2006
DKK millionShare
capitalHedging
reserve
Translation
reserve
Reserve for shares
available for sale
Retained earnings
Proposed dividends
Hybrid capital
Equity at-tributable to equity
holders of DONG
EnergyMinority interests Total
Equity at 1 January 2006 2,144 (542) 148 0 16,295 35 8,155 26,235 43 26,278
Changes in accounting policies 0 0 0 468 (468) 0 0 0 0 0
Restated equity at 1 January 2006 2,144 (542) 148 468 15,827 35 8,155 26,235 43 26,278
Foreign exchange adjustments relating to foreign enterprises, equity-like loans, etc. - - (200) - 0 - - (200) 0 (200)
Value adjustments of hedging instruments transferred to income statement - 108 - - - - - 108 0 108
Value adjustments of hedging instruments - 1,771 - - - - - 1,771 0 1,771
Tax on equity items - (528) 55 0 126 - (1) (348) 0 (348)
Reversal of value adjustments of associates on recognition as subsidiaries - - - - (688) - - (688) 0 (688)
Value adjustments on succes-sive acquisitions of subsidiaries - - - - 946 - - 946 (3) 943
Recogn. value adj. of enterpri-ses transferred to subsidiaries - - - (468) 468 - - 0 0 0
Proposed dividends, hybrid capital - - - - (451) 451 - 0 0 0
Dividends paid, hybrid capital - - - - - (451) - (451) 0 (451)
Other adjustments - 0 0 0 (68) 0 0 (68) 0 (68)
Net gains recognised directly in equity 0 1,351 (145) (468) 333 0 (1) 1,070 (3) 1,067
Profit for the year - - - - 4,918 - - 4,918 (1) 4,917
Total income and expense for the year 0 1,351 (145) (468) 5,251 0 (1) 5,988 (4) 5,984
Proposed dividends - - - - (1,967) 1,967 - 0 - 0
Dividends paid - - - - - (35) - (35) - (35)
Capital increase 793 - - - 9,248 0 - 10,041 0 10,041
Total changes in equity in 2006 793 1,351 (145) (468) 12,532 1,932 (1) 15,994 (4) 15,990
Equity at 31 December 2006 2,937 809 3 0 28,359 1,967 8,154 42,229 39 42,268
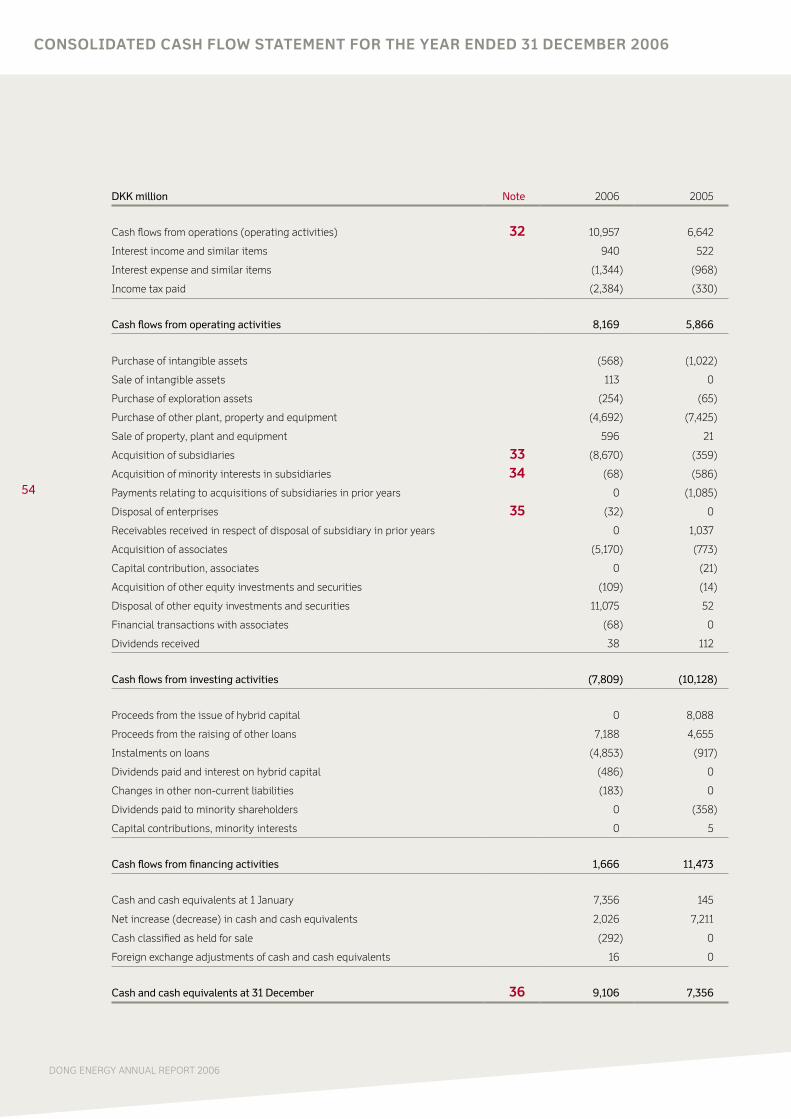
54
DONG ENERGY ANNUAL REPORT 2006
CONSOLIDATED CASH FLOw STATEMENT FOR THE YEAR ENDED 31 DECEMBER 2006
DKK million Note 2006 2005
Cash flows from operations (operating activities) 32 10,957 6,642
Interest income and similar items 940 522
Interest expense and similar items (1,344) (968)
Income tax paid (2,384) (330)
Cash flows from operating activities 8,169 5,866
Purchase of intangible assets (568) (1,022)
Sale of intangible assets 113 0
Purchase of exploration assets (254) (65)
Purchase of other plant, property and equipment (4,692) (7,425)
Sale of property, plant and equipment 596 21
Acquisition of subsidiaries 33 (8,670) (359)
Acquisition of minority interests in subsidiaries 34 (68) (586)
Payments relating to acquisitions of subsidiaries in prior years 0 (1,085)
Disposal of enterprises 35 (32) 0
Receivables received in respect of disposal of subsidiary in prior years 0 1,037
Acquisition of associates (5,170) (773)
Capital contribution, associates 0 (21)
Acquisition of other equity investments and securities (109) (14)
Disposal of other equity investments and securities 11,075 52
Financial transactions with associates (68) 0
Dividends received 38 112
Cash flows from investing activities (7,809) (10,128)
Proceeds from the issue of hybrid capital 0 8,088
Proceeds from the raising of other loans 7,188 4,655
Instalments on loans (4,853) (917)
Dividends paid and interest on hybrid capital (486) 0
Changes in other non-current liabilities (183) 0
Dividends paid to minority shareholders 0 (358)
Capital contributions, minority interests 0 5
Cash flows from financing activities 1,666 11,473
Cash and cash equivalents at 1 January 7,356 145
Net increase (decrease) in cash and cash equivalents 2,026 7,211
Cash classified as held for sale (292) 0
Foreign exchange adjustments of cash and cash equivalents 16 0
Cash and cash equivalents at 31 December 36 9,106 7,356

55
LIST OF NOTES TO THE CONSOLIDATED FINANCIAL STATEMENTS
Note
1 Accounting policies ......................................................................56
2 Accounting estimates and judgements ...................................71
Notes to the income statement
3 Segment information ................................................................... 73
4 Revenue ...........................................................................................78
5 Staff costs ........................................................................................78
6 Research and development costs .............................................80
7 Depreciation, amortisation and impairment losses ............80
8 Fees to auditors appointed at the Annual General
Meeting ............................................................................................82
9 Other operating income and expenses ...................................82
10 Government grants .......................................................................83
11 Financial income ...........................................................................83
12 Financial expenses ........................................................................83
13 Income tax expense ......................................................................84
14 Earnings per share ........................................................................85
Notes to the balance sheet
15 Intangible assets ...........................................................................86
16 Property, plant and equipment ..................................................88
17 Other non-current assets ............................................................ 91
18 Inventories ......................................................................................95
19 Trade receivables ...........................................................................95
20 Other receivables ..........................................................................95
21 Construction contracts ................................................................96
22 Prepayments ...................................................................................96
23 Assets classified as held for sale ...............................................97
24 Equity................................................................................................98
25 Deferred tax .....................................................................................99
26 Pensions ......................................................................................... 101
27 Provisions ......................................................................................103
28 Current and non-current loans ................................................104
29 Income tax receivable and payable ........................................106
30 Other payables .............................................................................106
31 Deferred income .......................................................................... 107
Notes to the cash flow statement
32 Cash flows from operations (operating activities) .............108
33 Acquisition of subsidiaries .......................................................108
34 Acquisition of minority interests in subsidiaries ................113
35 Disposal of subsidiaries .............................................................113
36 Cash and cash equivalents ........................................................114
Notes without reference
37 Currency risks, interest rate risks and raw material
price risks, etc ...............................................................................115
38 Credit risks ....................................................................................120
39 Embedded financial instruments ............................................120
40 Operating leases..........................................................................120
41 Contingent assets, liabilities and security ............................121
42 Related party transactions ....................................................... 122
43 New International Financial Reporting Standards
and IFRIC Interpretations ......................................................... 124
44 Company and licence overview ............................................... 125

56
DONG ENERGY ANNUAL REPORT 2006
ACCOUNTING POLICIES
01 Accounting policies
In general
DONG Energy A/S is a public limited company with its reg-
istered office in Denmark. The annual report for the period 1
January – 31 December 2006 comprises the consolidated finan-
cial statements of DONG Energy A/S and its subsidiaries (the
Group) as well as separate financial statements for the parent
company, DONG Energy A/S. The parent company’s financial
statements are included on the enclosed CD-ROM.
The annual report has been prepared in accordance with
International Financial Reporting Standards as adopted by the
EU and additional Danish disclosure requirements for annual
reports of listed and State-owned public limited companies,
see the Copenhagen Stock Exchange disclosure requirements
for annual reports of listed companies and the statutory order
on adoption of IFRS issued pursuant to the Danish Financial
Statements Act.
In addition, the annual report has been prepared in compliance
with the International Financial Reporting Standards (IFRS)
issued by the IASB.
Basis of preparation
The annual report is presented in Danish kroner (DKK),
rounded to the nearest million.
The annual report has been prepared on the historical cost
basis except that the following assets and liabilities are stated
at their fair value: derivative financial instruments, financial in-
struments held for trading and financial instruments classified
as available-for-sale.
Non-current assets and disposal groups classified as held
for sale are stated at the lower of carrying amount before the
reclassification and fair value less costs to sell.
The accounting policies described in the following have been
applied consistently to the financial year and the comparative
figures.
The accounting policies have not been changed compared
with the previous year, except for the change described in the
following concerning government grants and other equity in-
vestments. The description of the accounting policies has been
expanded as a consequence of the acquired activities.
Change in accounting policy and classifications
Government grants
DONG Energy has reclassified government grants in the income
statement and the balance sheet with effect from 1 January
2006 so that
grants for the purchase of assets are recognised in the
balance sheet under deferred income (liabilities). Grants for
the purchase of assets were previously offset against the
cost of the assets. The grant is recognised in the income
statement under other operating income as the assets to
which the grant relates are depreciated, whereas, previ-
ously, such grants were recognised in the income statement
as the assets to which they related were depreciated, but by
way of a reduced depreciation charge;
grants for research and development costs, which are
recognised directly in the income statement, are recognised
under other operating income, whereas, previously, they
were offset against the costs incurred.
The change in accounting policy has no effect on profit, earn-
ings per share, equity or the balance sheet for either 2005 or
2006.
Other equity investments
In accordance with the provisions in IFRS, DONG Energy has
implemented the amendment to IAS 39 concerning the fair
value option with effect from 1 January 2006. Accordingly, the
value of shares available for sale is adjusted to fair value via
equity until realisation, except for impairment losses, whereas,
previously, the value of such shares was adjusted to fair value
via the income statement on a continuing basis. The fair value
option is still applied to the bond portfolio.
The change has been incorporated in the annual report by
restatement of the comparative figures to reflect the change in
accounting policy. For 2005, the change reduces profit for the
year by DKK 131 million, while it has no effect on profit before
tax, assets or equity at the end of 2005. The change has no
effect for 2006.
Description of accounting policies
Consolidated financial statements
The consolidated financial statements include the financial
statements of the parent company DONG Energy A/S and sub-
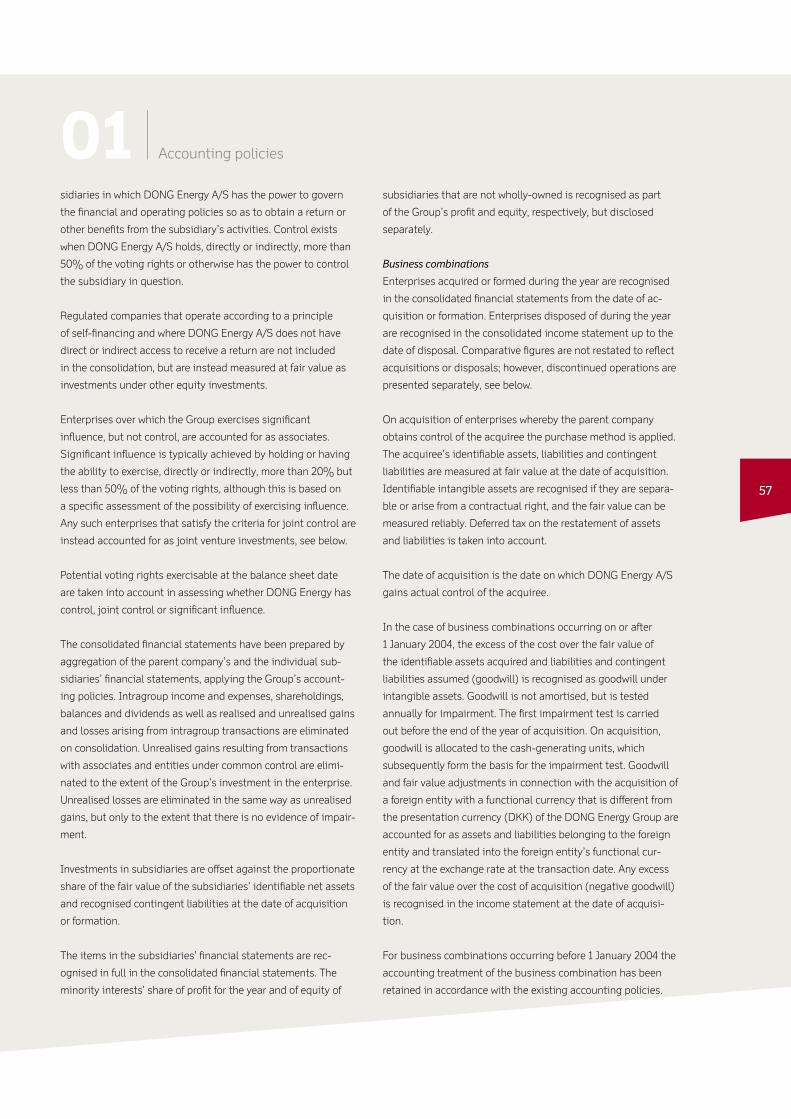
57
sidiaries in which DONG Energy A/S has the power to govern
the financial and operating policies so as to obtain a return or
other benefits from the subsidiary’s activities. Control exists
when DONG Energy A/S holds, directly or indirectly, more than
50% of the voting rights or otherwise has the power to control
the subsidiary in question.
Regulated companies that operate according to a principle
of self-financing and where DONG Energy A/S does not have
direct or indirect access to receive a return are not included
in the consolidation, but are instead measured at fair value as
investments under other equity investments.
Enterprises over which the Group exercises significant
influence, but not control, are accounted for as associates.
Significant influence is typically achieved by holding or having
the ability to exercise, directly or indirectly, more than 20% but
less than 50% of the voting rights, although this is based on
a specific assessment of the possibility of exercising influence.
Any such enterprises that satisfy the criteria for joint control are
instead accounted for as joint venture investments, see below.
Potential voting rights exercisable at the balance sheet date
are taken into account in assessing whether DONG Energy has
control, joint control or significant influence.
The consolidated financial statements have been prepared by
aggregation of the parent company’s and the individual sub-
sidiaries’ financial statements, applying the Group’s account-
ing policies. Intragroup income and expenses, shareholdings,
balances and dividends as well as realised and unrealised gains
and losses arising from intragroup transactions are eliminated
on consolidation. Unrealised gains resulting from transactions
with associates and entities under common control are elimi-
nated to the extent of the Group’s investment in the enterprise.
Unrealised losses are eliminated in the same way as unrealised
gains, but only to the extent that there is no evidence of impair-
ment.
Investments in subsidiaries are offset against the proportionate
share of the fair value of the subsidiaries’ identifiable net assets
and recognised contingent liabilities at the date of acquisition
or formation.
The items in the subsidiaries’ financial statements are rec-
ognised in full in the consolidated financial statements. The
minority interests’ share of profit for the year and of equity of
subsidiaries that are not wholly-owned is recognised as part
of the Group’s profit and equity, respectively, but disclosed
separately.
Business combinations
Enterprises acquired or formed during the year are recognised
in the consolidated financial statements from the date of ac-
quisition or formation. Enterprises disposed of during the year
are recognised in the consolidated income statement up to the
date of disposal. Comparative figures are not restated to reflect
acquisitions or disposals; however, discontinued operations are
presented separately, see below.
On acquisition of enterprises whereby the parent company
obtains control of the acquiree the purchase method is applied.
The acquiree’s identifiable assets, liabilities and contingent
liabilities are measured at fair value at the date of acquisition.
Identifiable intangible assets are recognised if they are separa-
ble or arise from a contractual right, and the fair value can be
measured reliably. Deferred tax on the restatement of assets
and liabilities is taken into account.
The date of acquisition is the date on which DONG Energy A/S
gains actual control of the acquiree.
In the case of business combinations occurring on or after
1 January 2004, the excess of the cost over the fair value of
the identifiable assets acquired and liabilities and contingent
liabilities assumed (goodwill) is recognised as goodwill under
intangible assets. Goodwill is not amortised, but is tested
annually for impairment. The first impairment test is carried
out before the end of the year of acquisition. On acquisition,
goodwill is allocated to the cash-generating units, which
subsequently form the basis for the impairment test. Goodwill
and fair value adjustments in connection with the acquisition of
a foreign entity with a functional currency that is different from
the presentation currency (DKK) of the DONG Energy Group are
accounted for as assets and liabilities belonging to the foreign
entity and translated into the foreign entity’s functional cur-
rency at the exchange rate at the transaction date. Any excess
of the fair value over the cost of acquisition (negative goodwill)
is recognised in the income statement at the date of acquisi-
tion.
For business combinations occurring before 1 January 2004 the
accounting treatment of the business combination has been
retained in accordance with the existing accounting policies.
01 Accounting policies

58
DONG ENERGY ANNUAL REPORT 2006
ACCOUNTING POLICIES
The accounting treatment of business combinations occurring
before 1 January 2004 has not been changed in connection
with the opening balance sheet at 1 January 2004. Goodwill at
1 January 2004 is thus recognised on the basis of the cost that
was recognised under the existing accounting policies (Danish
Financial Statements Act and Danish Accounting Standards)
less amortisation and impairment losses up to 31 December
2003. Goodwill is not amortised after 1 January 2004.
The cost of an enterprise consists of the fair value of the
consideration paid plus costs that can be directly attributed
to the acquisition. If parts of the consideration are contingent
on future events, these parts are recognised in the cost to the
extent that the events are probable and the consideration can
be measured reliably.
If there is any uncertainty, at the date of acquisition, concern-
ing the measurement of identifiable assets acquired and liabili-
ties and contingent liabilities assumed, initial recognition is
based on provisional fair values. If the fair value of identifiable
assets, liabilities and contingent liabilities subsequently proves
to differ from the fair value assumed at the time of acquisition,
goodwill may be adjusted for up to twelve months follow-
ing their acquisition. The effect of any such adjustments is
recognised in opening equity, and the comparative figures are
restated accordingly. Subsequently, goodwill is only adjusted
as a consequence of changes in the estimated contingent
purchase consideration, except in the case of material errors;
however, subsequent realisation of the acquiree’s deferred tax
assets that were not recognised at the date of acquisition leads
to recognition of the tax benefit in the income statement and
simultaneous reduction of the carrying amount of goodwill to
the amount that would have been recognised if the deferred tax
asset had been recognised as an identifiable asset at the date
of acquisition.
Gains or losses on disposal of subsidiaries and associates are
determined as the difference between the selling price and the
carrying amount of net assets including goodwill at the date of
disposal and costs necessary to make the sale.
A business combination may involve successive acquisitions. If
so, each significant acquisition is treated separately with a view
to determining the cost and fair value of the acquired identifi-
able assets, liabilities and contingent liabilities, including
any goodwill. Gains or losses on disposal of subsidiaries and
associates are recognised in the income statement in the item
gain on disposal of enterprises.
The fair value of the identifiable assets, liabilities and contin-
gent liabilities may be different at the date of each acquisition.
When a transaction results in the achievement of control of
the acquiree, previously acquired shares of identifiable assets,
liabilities and contingent liabilities relating to the already ac-
quired investments are remeasured at fair value at the acquisi-
tion date. The remeasurement is accounted for as a revaluation,
which is recognised via equity.
Interests in joint ventures
Interests in joint ventures comprise jointly operated oil explora-
tion and oil production licences as well as wind farms and
geothermal plants within renewable energy.
Recognition of an investment as a joint venture interest is
conditional upon the existence of a contractual arrangement
stipulating joint control. The contractual arrangement must
also stipulate whether the joint venturers are jointly and sever-
ally liable or liable for their proportionate shares only.
Interests in joint ventures are recognised by proportionate
consolidation at the share of the jointly controlled assets and li-
abilities, classified by nature, and the share of revenue from the
sale of the joint product, along with the share of the expenses
incurred by the jointly controlled operation. Liabilities and
expenses incurred in respect of the jointly controlled operation
are also recognised.
Acquisition of licence interests is accounted for as acquisition
of individual assets. Deferred tax on temporary differences be-
tween the carrying amount and the tax base is not provided for,
cf. the description under “Income tax and deferred tax”.
In connection with proportionate consolidation, intragroup in-
come and expenses, balances and realised and unrealised gains
and losses arising from intragroup transactions are eliminated
to the extent of the Group’s investment.
Foreign currency translation
For each of the reporting enterprises in the Group a functional
currency is determined. The functional currency is the currency
of the primary economic environment in which the individual
reporting enterprise operates. Transactions in other currencies
than the functional currency are accounted for as transactions
in foreign currencies.
On initial recognition, transactions in foreign currencies are
translated into the functional currency at the exchange rates
01 Accounting policies

59
at the transaction date. Exchange differences arising between
the exchange rate at the transaction date and at the date of
payment are recognised in the income statement as financial
income and financial expenses.
Receivables, payables and other monetary items in foreign
currencies are translated into the functional currency at the ex-
change rates at the balance sheet date. The difference between
the exchange rates at the balance sheet date and at the date at
which the receivable or payable arose or was recognised in the
latest annual report is recognised in the income statement as
financial income and financial expenses.
Gains and losses on hedging transactions relating to purchases
and sales of goods are recognised at the same time as and in
the same item as the hedged item.
On recognition in the consolidated financial statements of
enterprises with a different functional currency than DKK, the
items in the income statements are translated at the exchange
rates at the transaction date and the balance sheet items
are translated at the exchange rates at the balance sheet
date. An average exchange rate for each month is used as the
exchange rate at the transaction date to the extent that this
does not significantly distort the presentation of the underlying
transactions. Exchange differences arising on translation of the
opening equity of these enterprises at the exchange rates at
the balance sheet date and on translation of the income state-
ments from the rates at the transaction date to the exchange
rates at the balance sheet date are recognised directly in equity
under a separate translation reserve.
Foreign exchange adjustments of balances that are accounted
for as part of the total net investment in enterprises with a
different functional currency than DKK are recognised in the
consolidated financial statements directly in equity under a
separate translation reserve. Likewise, foreign exchange gains
and losses on the portion of loans and derivative financial
instruments that has been entered into to hedge the net invest-
ment in these enterprises and that provides an effective hedge
against corresponding foreign exchange gains/losses on the
net investment in the enterprise are taken directly to a separate
translation reserve under equity.
On recognition in the consolidated financial statements of
associates with a different functional currency than DKK,
the share of profit for the year is translated using an average
exchange rate, and the share of equity including goodwill is
translated at the exchange rates at the balance sheet date. Ex-
change differences arising on translation of the share of foreign
associates’ opening equity at the exchange rates at the balance
sheet date and on translation of the share of profit for the year
from average rates to the exchange rates at the balance sheet
date are recognised directly in equity under a separate transla-
tion reserve.
On complete or partial disposal of a foreign operation, or on re-
payment of balances that are considered part of the net invest-
ment, the share of the cumulative exchange adjustments that
is recognised directly in equity and attributable to the foreign
operation is recognised in the income statement when the gain
or loss on disposal is recognised.
Hedging and derivative financial instruments
Derivative financial instruments and loans are used to hedge
currency risks, interest rate risks and price risks related to the
price of oil, electricity, coal and natural gas, etc.
Derivative financial instruments are recognised from the trade
date and measured in the balance sheet at fair value. Positive
and negative fair values of derivative financial instruments are
recognised as other receivables and other payables, respective-
ly, and offsetting of positive and negative values is only effected
if the enterprise has the right to and intends to settle several
financial instruments net in cash. The fair value of derivative
financial instruments is determined on the basis of current
market data and recognised valuation methods.
Changes in the fair value of derivative financial instruments
designated as and qualifying for recognition as hedges of the
fair value of a recognised asset or liability are recognised in the
income statement together with changes in the value of the
hedged asset or liability to the extent of the hedged risk. Hedg-
ing of the value of future cash flows of contracts concluded
(firm commitment) is accounted for as hedging of the fair value
of a recognised asset or liability, except in the case of foreign
currency hedging.
Changes in the portion of the fair value of derivative financial
instruments and foreign exchange adjustments of loans that
is designated as and qualifies for recognition as a hedge of
future cash flows and that provides an effective hedge against
changes in the value of the hedged item are recognised directly
in equity under a separate hedging reserve until the hedged
01 Accounting policies

60
DONG ENERGY ANNUAL REPORT 2006
ACCOUNTING POLICIES
transaction is realised. In the case of options used as hedges,
only the intrinsic value of the option is accounted for as a
hedge. On realisation of the hedged transaction the resulting
gain or loss is transferred from equity and recognised in the
same item as the hedged item; however, on hedging of the pro-
ceeds from future loans the resulting gain or loss is transferred
from equity over the term of the loan.
Value adjustments of financial instruments that have been
entered into to hedge the Group’s revenue but do not satisfy
the criteria for hedge accounting are recognised under revenue.
Likewise, value adjustments of financial contracts offered to
customers with a view to price hedging are recognised under
revenue. This classification is judged to best reflect the results
of the Group’s operations.
For derivative financial instruments that have not been entered
into to hedge revenue or production costs, changes in fair value
are recognised in the income statement as financial items when
they occur.
Changes in the fair value of derivative financial instruments
that are used to hedge net investments in foreign subsidiaries
or associates and that provide effective hedges against chang-
es in foreign exchange rates in these enterprises are recognised
in the consolidated financial statements directly in equity under
a separate translation reserve.
Some contracts embody conditions corresponding to derivative
financial instruments. Such embedded financial instruments
are recognised separately and measured on a continuing basis
at fair value if they differ significantly from the contract in ques-
tion, unless the host contract is recognised and measured at
fair value on a continuing basis.
Government grants
Government grants comprise grants for environment-friendly
power generation, grants for and funding of development
projects and grants for capital expenditure, etc. Government
grants are recognised when there is reasonable assurance that
they will be received.
Grants for power generation are recognised under revenue as
the related electricity revenue is recognised.
Grants for research and development costs, which are recog-
nised directly in the income statement, are recognised under
other operating income as the costs to which the grants relate
are incurred.
Grants for the purchase of assets and development projects
are recognised in the balance sheet under deferred income and
transferred to other operating income in the income statement
as the electricity assets to which the grants relate are depreci-
ated.
Allocated CO2 rights are recognised under rights as intangible
assets. Reference is made to the description of the accounting
policies under the relevant sections.
Income statement
Revenue
Revenue from sales comprises sales and transportation of
natural gas and crude oil, distribution and storage of natural
gas, sales and distribution of electricity and heat and grants
for electricity sales (price supplement). Revenue is recognised
in the income statement if delivery and transfer of risk to buyer
have taken place before the end of the financial year, and if
the income can be measured reliably and is expected to be
received.
Construction contracts and rendering of services (consul-
tancy services, etc.) are recognised as revenue as the work to
which they relate is performed or the service rendered to the
effect that revenue corresponds to the selling price of the work
performed during the year (percentage of completion method).
When the outcome of a construction contract cannot be esti-
mated reliably, revenue is only recognised to the extent of the
costs incurred that it is probable will be recoverable.
Revenue is measured at the fair value of the agreed remunera-
tion excluding VAT and duties collected on behalf of third par-
ties. All forms of discounts granted are recognised in revenue.
Overlift/underlift of oil and gas is recognised in revenue at re-
alisable value. Over/-underlift relates to situations in which the
Group participates in producing fields (licences) with several
participants and where the Group has lifted and sold more or
less oil from the producing field than its entitlement at the time
of lifting.
Physical and financial contracts relating to trading in gas,
electricity, CO2 rights, etc., that are concluded in the course of
01 Accounting policies

61
the Group’s trading activities with a view to generating gains
from short-term price fluctuations are market value adjusted
under revenue.
Value adjustments of financial instruments that have been
entered into to hedge the Group’s revenue but do not satisfy
the criteria for hedge accounting are recognised as revenue.
Likewise, value adjustments of financial contracts offered to
customers with a view to price hedging are recognised as rev-
enue, cf. the description under hedging and derivative financial
instruments.
Production costs, etc.
Production costs comprise costs, including cost of sales, depre-
ciation and amortisation, wages and salaries, relating to
equity production of natural gas, crude oil, power and heat,
etc., operation and maintenance of production assets, etc.,
during the year under review
exploration, including costs for exploration licences, own
costs for geological data, seismic surveys, licence adminis-
tration, impairment losses relating to exploration wells, etc.
Sales and marketing
Sales and marketing comprises expenses for negotiation and
conclusion of purchase and sales contracts relating to natural
gas, crude oil, electricity, heat, etc., and for marketing of DONG
Energy and DONG Energy’s products. This item includes direct
expenses as well as allocated indirect expenses for sales and
marketing.
Management and administration
Management and administration comprises primarily staff
costs for management and administrative staff. This item
includes direct expenses as well as allocated indirect expenses
for management and administration.
Other operating income and expenses
Other operating income and expenses comprise items sec-
ondary in nature to the Group’s and the parent company’s
activities, including gains and losses on ongoing disposal
and replacement of intangible assets and property, plant and
equipment, and government grants received for research and
development costs and for the purchase of assets and develop-
ment projects. Grants for research and development costs are
recognised as the costs to which the grants relate are incurred,
while grants for the purchase of assets and development
projects are recognised as the assets to which the grants relate
are depreciated. Gains and losses on disposal of intangible as-
sets and property, plant and equipment are determined as the
selling price less costs to sell and the carrying amount at the
date of disposal.
Income from investments in associates
The proportionate share of profit after tax of associates is
recognised in the consolidated income statement after tax
and after elimination of the proportionate share of intragroup
profits/losses.
Financial income and financial expenses
Financial income and financial expenses comprise interest
income and expense, capital gains and losses and impair-
ment losses relating to securities, payables and transactions
denominated in foreign currencies, amortisation of financial as-
sets and liabilities, including lease commitments under finance
leases, as well as surcharges and refunds under the on-account
tax scheme, etc. Financial income and financial expenses also
include realised and unrealised gains and losses relating to
derivative financial instruments that have not been entered into
to hedge revenue or production costs.
Income tax expense
The Group is subject to the Danish rules on compulsory joint
taxation and has also elected international joint taxation with
the Group’s foreign subsidiaries. The Group’s subsidiaries are
included in the joint taxation from the date they are included
in the consolidation in the consolidated financial statements
and up to the date on which they are no longer included in the
consolidation.
The current Danish income tax is allocated among the jointly
taxed Danish subsidiaries in the form of settlement of joint
taxation contributions in proportion to their taxable income. In
this connection Danish subsidiaries with tax losses receive joint
taxation contributions from Danish companies that have been
able to utilise these losses to reduce their own taxable profits.
Income tax expense, which consists of current tax, joint taxation
contribution for the year and changes in deferred tax - including
as a result of changes in tax rates - is recognised in the income
statement to the extent that it relates to profit for the year, and
directly in equity to the extent that it relates to entries directly
to equity.
01 Accounting policies

62
DONG ENERGY ANNUAL REPORT 2006
ACCOUNTING POLICIES
The Group is registered for the Danish on-account tax scheme.
Tax refunds/tax surcharges are allocated between the jointly
taxed Danish companies in accordance with the allocation of
the Danish income tax and recognised as financial income and
financial expenses, respectively.
Subsidiaries that are engaged in hydrocarbon recovery are sub-
ject to the hydrocarbon tax legislation in the countries in which
they operate. Hydrocarbon taxes are calculated on the basis of
a taxable hydrocarbon income, and comprise taxes calculated
applying the respective country’s ordinary income tax rate as
well as taxes calculated applying increased tax rates. Hydrocar-
bon taxes are recognised under income tax expense.
Balance sheet
Intangible assets
Goodwill
Goodwill is recognised initially in the balance sheet at cost as
described under business combinations. Subsequent to initial
recognition, goodwill is measured at cost less accumulated
impairment losses. Goodwill is not amortised.
The carrying amount of goodwill is allocated to the Group’s
cash-generating units at the date of acquisition. The determi-
nation of cash-generating units follows the Group’s organisa-
tional and internal reporting structure.
Rights
Allocated and acquired CO2 rights are measured initially at
cost. To the extent that a grant is received in connection with
an allocation, the cost constitutes the actual consideration paid
for the rights, i.e. nil if the rights are allocated free of charge.
CO2 rights are amortised in step with the actual emissions of
CO2. To the extent that the actual emissions exceed the al-
located and acquired CO2 rights, the fair value of the additional
CO2 rights that DONG Energy is under obligation to settle is
recognised as a liability. The amortisation basis for CO2 rights is
determined taking into account their residual value, which de-
pends on whether they are held for use or for sale. The residual
value of CO2 rights held for use is nil.
Other rights comprise gas purchase rights, acquired customer
rights and IT software licences, etc., and are measured at cost
less accumulated amortisation and impairment losses.
Other rights are amortised on a straight-line basis over their
expected economic lives, which are determined on the basis
of management’s experience of the specific business areas,
and the assets to which the rights relate. Capitalised rights are
estimated to have an economic life of 5 - 20 years.
The value of associates includes rights with indefinite useful
lives.
Development projects
Development projects comprise development of IT systems, etc.
Development projects that are clearly defined and identifiable,
and for which technical feasibility, adequate resources and a
potential future market or an application in the enterprise can
be demonstrated, and which the enterprise intends to manu-
facture, market or use, are recognised as intangible assets if the
cost can be determined reliably and if there is reasonable cer-
tainty that the future earnings or the net selling price will cover
production costs, selling costs, administrative expenses and
development costs. Other development costs are recognised in
the income statement when incurred.
Recognised development costs are measured at cost less ac-
cumulated amortisation and impairment losses. Cost com-
prises salaries, amortisation and other costs attributable to the
enterprise’s development activities.
On completion of the development work, development projects
are amortised on a straight-line basis over the estimated
economic life from the date the asset is available for use. The
amortisation period is usually five years. The basis of amortisa-
tion is reduced by any impairment.
Amortisation and impairment losses relating to intangible
assets are recognised in the income statement as production
costs, sales and marketing, and management and administra-
tion, respectively.
Property, plant and equipment
Property, plant and equipment comprises land and buildings,
investment properties, production assets, exploration and
evaluation assets, and other tools and equipment. Property,
plant and equipment is measured at cost less accumulated
depreciation and impairment losses.
Cost comprises purchase price and any costs directly attribut-
able to the acquisition until the date the asset is available for
01 Accounting policies
63
use. The cost of self-constructed assets comprises direct and
indirect costs of materials, components, subsuppliers and la-
bour. Financial expenses that can be attributed to a preparation
or production period are recognised in the income statement
under financial expenses. Cost is increased by estimated costs
for dismantling and removal of the asset and restoration costs
to the extent that they are recognised as a provision. Where
individual components of an asset have different useful lives,
they are accounted for as separate items, which are depreciated
separately.
In the case of assets held under finance leases, cost is deter-
mined as the lower of fair value and present value of future
minimum lease payments. The present value is determined
using the interest rate implicit in the lease as the discount rate
or an approximated value.
Subsequent costs, for example in connection with replacement
of parts of an item of property, plant and equipment, are recog-
nised in the carrying amount of the asset in question when it
is probable that future economic benefits will flow to the Group
from the expenses incurred. Recognition of the replaced parts
in the balance sheet ceases, and the carrying amount is taken
to the income statement. All other expenses for general repair
and maintenance are recognised in the income statement as
incurred.
Exploration and evaluation assets comprise exploration ex-
penses that relate to successful wells on which production has
not yet begun. Costs are recognised using the successful efforts
method. Under the successful efforts method, exploration
expenses for drilling specific exploration wells are recognised
in the balance sheet. Acquired licences where finds have been
made, including acquired reserves, are also recognised under
exploration and evaluation assets. General exploration ex-
penses and expenses relating to unsuccessful exploration wells
are charged to the income statement. Recognition in the bal-
ance sheet is maintained pending determination of commercial
viability. All exploration expenses determined as unsuccessful
are recognised in the income statement as production costs.
Other exploration expenses are recognised in the income state-
ment as production costs when incurred. Recognised explora-
tion expenses relating to commercial finds are transferred to oil
and gas production assets (production assets) when a field has
been fully developed and production begins. The asset is tested
for indications of impairment in connection with the transfer to
production assets, see the description in the section Impair-
ment of non-current assets.
Development and construction costs relating to property, plant
and equipment are recognised in the balance sheet, until entry
into service, under property, plant and equipment in the course
of construction. Following entry into service, these assets are
transferred to the relevant items under property, plant and
equipment.
In the case of oil and gas production assets, cost is depreciated
using the unit-of-production method based on the ratio of cur-
rent production to estimated proven reserves by individual field.
In the case of natural gas activities and wind turbines, cost is
depreciated using the unit-of-production method, taking into
account the expected earnings profile, so that the depreciation
pattern reflects the expected earnings patterns.
In the case of other property, plant and equipment, cost is basi-
cally depreciated on a straight-line basis over the estimated
future useful lives.
Depreciation periods for property, plant and equipment
Buildings used for own purposes 20 - 50 years
Oil and gas production assets1 20 - 40 years
Production assets, power 20 - 35 years
Production assets, district heat 25 - 35 years
Natural gas distribution system2 20 - 40 years
Natural gas storage facilities2 20 - 40 years
Natural gas transportation system (marine pipelines) 2 20 - 40 years
Geothermal plants 20 years
Distribution grid, electricity 10 - 40 years
Distribution grid, heat 10 - 50 years
Oil transportation system (marine pipeline) 15 years
Wind turbines2 15 - 20 years
Exploration and evaluation assets3 -
IT hardware 3 - 5 years
Fixtures and fittings, tools and equipment 3 - 10 years
Assets in the course of construction 3
1 Depreciated applying the unit-of-production method.2 The depreciation profile takes account of the fact that the
earnings profile changes substantially over the life of the asset
as a result of the statutory revenue caps.3 Depreciation does not commence until the date of entry into
service, at which time the asset is transferred to the relevant
item under property, plant and equipment.
01 Accounting policies

64
DONG ENERGY ANNUAL REPORT 2006
ACCOUNTING POLICIES
The basis of depreciation is determined on the basis of the
asset’s residual value less any impairment losses. The residual
value is fixed at the date of acquisition and reassessed an-
nually. Depreciation ceases if the residual value exceeds the
carrying amount of the individual components.
If the depreciation period or the residual value changes, the
effect on depreciation is recognised prospectively as a change
in accounting estimates.
Depreciation and impairment losses are recognised in the in-
come statement as production costs, sales and marketing, and
management and administration, respectively, to the extent
that depreciation is not recognised in the cost of self-con-
structed assets.
Investments in associates in the consolidated
financial statements
Investments in associates are measured in the consolidated
financial statements using the equity method whereby the
investments are measured in the balance sheet at the propor-
tionate share of the associates’ net asset values determined in
accordance with the Group’s accounting policies, plus or minus
the carrying amount of goodwill.
Associates with a negative equity value are measured at nil. If
the Group has a legal or constructive obligation to cover the
associate’s deficit, the obligation is recognised as a liability.
Receivables from associates are measured at amortised cost.
Write-downs are made for bad debts. On acquisition of invest-
ments in associates the purchase method is applied, cf. the
description of Business combinations.
Other equity investments
Other equity investments are recognised initially in the balance
sheet at fair value plus transaction costs and are subsequently
measured at fair value.
For listed securities, this corresponds to the market price at the
balance sheet date. In the case of unlisted securities, an esti-
mated fair value is used, if this is considered reliable; alterna-
tively, cost is used, after deduction of any impairment losses.
In the case of other equity investments classified as available
for sale, unrealised changes in fair value are taken directly to
equity, apart from impairment losses and reversals of same,
and dividends recognised in the income statement as financial
income and financial expenses. On realisation, the accumulated
value adjustment recognised in equity is transferred to financial
income and financial expenses in the income statement.
Other non-current financial assets
Other non-current financial assets include non-current loans
to customers and underabsorption relating to waste-fired CHP
plants, etc.
Impairment of non-current assets
Goodwill and intangible assets with an indefinite useful life are
tested for impairment annually, initially before the end of the
year of acquisition. In-process development projects are also
tested annually for impairment.
The carrying amount of goodwill is tested for impairment, along
with the carrying amounts of the other non-current assets
of the cash-generating unit to which the goodwill has been
allocated, and written down to the recoverable amount in the
income statement if the carrying amount exceeds the recover-
able amount. The recoverable amount is generally determined
as the present value of the expected future net cash flows from
the enterprise or activity (cash-generating unit) to which the
goodwill relates. Impairment losses relating to goodwill are
recognised as a separate line item in the income statement.
Exploration and evaluation assets are reviewed for impairment
annually and if there is any indication of impairment. Impair-
ment testing is also carried out at the time commercial finds
have been identified, and the exploration and evaluation assets
are reclassified to oil and gas production assets. In carrying out
the test, emphasis is placed on the special indicators that are
relevant to the exploration and extractive industry, including
the duration of the period for which DONG Energy holds the
rights for exploration wells in the individual fields, the expected
timing and costs in connection with the exploration wells in the
individual fields, the results of existing exploration wells and
the expectations concerning future exploration wells, including
the level of future exploration wells, and the probability that the
exploration wells will result in commercial finds. The recover-
able amount of exploration and evaluation assets is reviewed if
any indication of impairment exists. The recoverable amount is
the higher of an asset’s fair value less expected disposal costs
and the present value of the expected future net cash flows
(value in use).
01 Accounting policies

65
Deferred tax assets are reviewed annually and recognised only
to the extent that it is probable that they will be utilised.
The carrying amounts of other non-current assets are tested
annually to determine if any indication of impairment exists. If
any such indication exists, the asset’s recoverable amount is
determined. The recoverable amount is the higher of an asset’s
fair value less expected disposal costs and its value in use. The
value in use is determined as the present value of the expected
future cash flows from the asset or the cash-generating unit to
which the asset belongs.
An impairment loss is recognised whenever the carrying
amount of an asset or its cash-generating unit exceeds its
recoverable amount. Impairment losses are recognised in the
income statement under production costs and administrative
expenses, respectively; however, impairment losses relating to
goodwill are recognised as a separate line item in the income
statement.
Impairment losses relating to goodwill are not reversed. Impair-
ment losses relating to other assets are reversed to the extent
that the assumptions or estimates that led to the impairment
have changed. Impairment losses are only reversed to the
extent that the asset’s new carrying amount does not exceed
the value the asset would have had after depreciation if no
impairment losses had been charged.
Inventories
Inventories consist of natural gas and crude oil in storage facili-
ties, as well as raw materials, consumables and fuel inventories.
The cost of natural gas is determined as a weighted average
of the last month’s purchase prices including transportation
costs. The cost of crude oil is determined as the average of the
production costs.
Allocated and acquired CO2 rights that form part of the
Group’s trading activities with a view to generating gains from
short-term price fluctuations are measured at fair value. Other
inventories are measured at the lower of cost and net realisable
value.
In the case of natural gas, cost is determined as a weighted
average of the previous month’s buying prices, including trans-
portation costs. In the case of crude oil, cost is determined as
the average production cost.
The cost of other inventories is measured using the FIFO
method.
The net realisable value of inventories is determined as the
expected selling price less any costs of completion and costs
incurred to execute the sale. The net realisable value is deter-
mined on the basis of marketability, obsolescence and develop-
ment of expected selling price.
Receivables
Receivables are measured at amortised cost. Write-downs are
made for bad and doubtful debts.
Other receivables
Other receivables include positive fair values of derivative
financial instruments.
Construction contracts
Construction contracts comprise services, etc., including estab-
lishment of grids and sale of expertise. Construction contracts
are measured at the selling price of the work performed less
progress billings and expected losses.
The selling price is measured on the basis of the stage of com-
pletion at the balance sheet date and total expected income on
each contract. The stage of completion is determined on the
basis of an assessment of the work performed, normally deter-
mined as the proportion that contract costs incurred for work
performed to date bear to the estimated total contract costs.
When it is probable that total contract costs on a construction
contract will exceed total contract revenue, the expected loss
on the construction contract is recognised as an expense im-
mediately.
When the outcome of a construction contract cannot be esti-
mated reliably, the selling price is only recognised to the extent
of the costs incurred that it is probable will be recoverable.
Where the selling price of work performed on construction
contracts exceeds progress billings and expected losses, the
contracts are recognised under receivables. Where progress bill-
ings and expected losses exceed the selling price of construc-
tion contracts, the contracts are recognised under liabilities.
Prepayments from customers are recognised under liabilities.
01 Accounting policies

66
DONG ENERGY ANNUAL REPORT 2006
ACCOUNTING POLICIES
Costs related to sales work and the winning of contracts are
recognised in the income statement as incurred.
Prepayments
Prepayments comprise expenses paid in respect of subsequent
financial years and are measured at cost.
Prepayments also include underlift of crude oil, which is
measured at realisable value. As producing fields have several
participants, there may be situations in which a participant has
lifted and sold more or less oil than the participant’s relative
entitlement at the time of lifting. Such a situation is called over-
lift and underlift, respectively. Overlift of crude oil is recognised
as current liabilities under deferred income.
Securities
Securities, comprising bonds, are recognised at the trade date
under current assets and measured at fair value, equivalent to
the market price for listed securities and an estimated fair value
determined on the basis of market data and recognised valua-
tion methods for unlisted securities.
Changes in the fair value of securities are recognised on a
continuing basis in the income statement as financial income
and financial expenses. The reason for recognising value
adjustments in the income statement when they occur is that
the investments are made in accordance with an established
investment strategy and are managed and reported internally
using fair values.
Equity
Hedging reserve
The hedging reserve comprises the accumulated net change in
the fair value of hedging transactions that qualify for designa-
tion as hedges of future cash flows, and where the hedged
transaction has yet to be realised, less the related tax.
Translation reserve
The translation reserve comprises exchange differences arising
on translation of the financial statements of foreign entities
with a functional currency that is different from the presen-
tation currency (DKK) of the DONG Energy Group, foreign
exchange adjustments relating to assets and liabilities that
form a part of the Group’s net investment in such entities, and
foreign exchange adjustments relating to hedging transactions
that hedge the Group’s net investment in such entities, less the
related tax.
The foreign exchange adjustments are recognised in the income
statement on realisation or partial realisation of the net invest-
ment.
The translation reserve has been deemed to be zero at 1 Janu-
ary 2004 in accordance with IFRS 1.
Reserve for shares available for sale
The reserve for shares available for sale comprises the ac-
cumulated net change in the fair value of those shares, less the
related tax.
Dividends
Proposed dividends are recognised as a liability at the date
of their adoption at the Annual General Meeting (declaration
date). Up to the declaration date, proposed dividends are dis-
closed as a separate item under equity.
On account dividends are recognised as a liability at the decla-
ration date.
Hybrid capital
Hybrid capital comprises issued loans that qualify for treatment
as equity due to the special characteristics of the loan. Accord-
ingly, any interest payments are accounted for as dividends
that are recognised directly in equity at the time the payment
obligation arises. Interest payments are included in the cash
flow statement under financing activities in the same way as
dividend payments.
The loan is not included in the statement of net interest-bear-
ing debt under financial highlights.
Income tax and deferred tax
Current tax payable and receivable is recognised in the balance
sheet as tax computed on the taxable income for the year, ad-
justed for tax on the taxable income of prior years and for taxes
paid on account.
Deferred tax is measured using the balance sheet liability meth-
od, providing for all temporary differences between the carrying
amount and the tax base of assets and liabilities; however, tem-
porary differences are not provided for in respect of goodwill not
deductible for tax purposes, office properties and other items
- apart from business combinations - where temporary differ-
01 Accounting policies
67
ences have arisen at the date of acquisition without having any
effect on either profit/loss or taxable income. Where different
tax rules can be applied to determine the tax base, deferred tax
is measured on the basis of management’s planned use of the
asset or settlement of the liability, respectively.
Deferred tax assets, including the tax base of tax loss carryfor-
wards, are recognised as other non-current assets at the value
at which they are expected to be utilised either by elimination
against tax on future earnings or by set-off against deferred tax
liabilities within the same legal tax entity and jurisdiction.
Adjustment of deferred tax is made relating to eliminations of
unrealised intragroup profits and losses.
Deferred tax is measured in accordance with the tax rules and
tax rates in the respective countries that will apply under the
legislation enacted at the balance sheet date when the deferred
tax is expected to crystallise in the form of current tax. Changes
in deferred tax as a result of changes in tax rates are recognised
in the income statement.
Pensions
The Group has entered into pension agreements and similar
agreements with most of the Group’s employees.
Contributions to insured (defined contribution) pension plans
are recognised in the income statement in the period to which
they relate, and any contributions payable are recognised in the
balance sheet as other payables.
Non-insured pension plans (defined benefit plans) relate to
pensions to former employees at the individual power stations,
public servants in connection with the acquisition of munici-
pally owned regional gas companies and a former CEO. The
obligation has been determined using an actuarial calculation.
In the case of defined benefit plans, the present value of future
benefits to be paid under the plan is determined actuarially on
an annual basis. The present value is determined on the basis
of assumptions about future trends in salary levels, interest
rates, inflation, mortality, etc. The present value is determined
only for the benefits to which the employees have earned the
right through service already rendered to the Group. The actu-
arially determined present value is recognised in the balance
sheet under pension obligations.
Provisions
Provisions comprise estimated costs for decommissioning
of production facilities, restoration of drilling sites and other
technical installations, etc.
Provisions are recognised when, as a result of an event occur-
ring before or at the balance sheet date, the Group has a legal
or constructive obligation, the settlement of which is expected
to result in an outflow from the company of resources embody-
ing economic benefits.
Provisions for decommissioning of production facilities and
restoration of drilling sites are measured at the present value
of the future liability in respect of restoration and decommis-
sioning as estimated at the balance sheet date. The amount
provided is determined on the basis of existing requirements
and estimated expenses, which are discounted to present
value. If specific risks are deemed to attach to a provision, the
estimated costs are recognised. A discount rate is used that
reflects the general interest rate level in the market. These
liabilities are recognised as they arise and are adjusted on a
regular basis to reflect changes in requirements, price level, etc.
The value of the provision is recognised under property, plant
and equipment and depreciated together with the relevant as-
sets. The increase in time of the present value is recognised in
the income statement under financial expenses.
If it is considered unlikely that an outflow of resources embody-
ing economic benefits will be required to settle an obligation,
or if the obligation cannot be measured reliably, the obligation
is accounted for as a contingent liability that is not recognised
in the balance sheet. Information about material contingent
liabilities is disclosed in the notes.
Financial liabilities
Bond loans, mortgage loans, bank loans, etc., are recognised
at inception at the proceeds received net of transaction costs
incurred. In subsequent periods, the financial liabilities are
measured at amortised cost using the effective interest rate
method. Accordingly, the difference between the proceeds
received and the nominal amount is recognised in the income
statement under financial expenses over the term of the loan.
Other bank loans include the capitalised residual lease commit-
ment under finance leases, measured at amortised cost.
01 Accounting policies
68
DONG ENERGY ANNUAL REPORT 2006
Trade payables, payable income tax and other payables are
measured at net realisable value. Other payables include
negative fair values of derivative financial instruments, certain
realised and unrealised gains and losses on loans in DONG Oil
Pipe A/S (formerly DONG Olierør A/S), etc.
Financial liabilities the value of which has been effectively
hedged are adjusted to fair value to the extent of the hedged
risk. The value adjustment is recognised in the income state-
ment as financial income or financial expenses.
Leasing
Lease commitments are accounted for as commitments under
finance leases and commitments under operating leases,
respectively.
A lease is classified as a finance lease if it transfers substan-
tially all the risks and rewards incidental to ownership of the
leased asset. Other leases are classified as operating leases.
The accounting treatment of assets held under finance leases
and the associated liability is described in the sections on prop-
erty, plant and equipment and financial liabilities.
Lease payments under operating leases are recognised in the
income statement over the term of the lease on a straight-line
basis.
Deferred income
Deferred income comprises payments received in respect of
income in subsequent years, measured at cost.
Deferred income also includes overlift of crude oil, cf. the
description under prepayments, the value of unrecognised
amounts in respect of natural gas delivered under contract, etc.,
which is recognised at realisable value
The value of natural gas free of charge delivered under contract
is spread proportionally over the remaining contract period with
a view to accounting for purchased goods on an accruals basis.
Assets classified as held for sale
Assets classified as held for sale and the associated liabilities
are presented as separate line items in the balance sheet.
Assets classified as held for sale comprise non-current assets
and disposal groups classified as held for sale. Disposal groups
are groups of assets to be disposed of, by sale or otherwise,
together as a group in a single transaction. Liabilities relating
to assets held for sale are liabilities directly associated with
those assets that will be transferred in the transaction. Assets
are classified as held for sale when their carrying amount will be
recovered principally through a sale transaction within twelve
months under a formal plan rather than through continuing
use.
Assets or disposal groups classified as held for sale are
measured at the lower of carrying amount at the date of clas-
sification as held for sale and fair value less costs to sell. No
depreciation or amortisation is charged on assets from the date
they are classified as held for sale.
Impairment losses arising on initial classification as held for
sale and gains and losses on subsequent measurement at the
lower of carrying amount and fair value less costs to sell are
recognised in the income statement under the items to which
they relate. Gains and losses are disclosed in the notes.
Cash flow statement
The cash flow statement shows cash flows for the year from
operating, investing and financing activities, the year’s changes
in cash and cash equivalents, and cash and cash equivalents at
the beginning and end of the year.
The cash flow effect of acquisitions and disposals of enterprises
is disclosed separately under cash flows from investing activi-
ties. Cash flows relating to acquired enterprises are recognised
in the cash flow statement from the date of acquisition, and
cash flows relating to enterprises disposed of are recognised up
to the date of disposal.
Cash flows from operating activities are determined using the
indirect method as profit before tax adjusted for non-cash op-
erating items, changes in working capital, interest received and
interest paid, dividends received and income tax paid.
Cash flows from investing activities comprise payments in
connection with acquisition and disposal of enterprises and ac-
tivities; purchase and sale of intangible assets, property, plant
and equipment and other non-current assets; and purchase
and sale of securities that are not recognised as cash and cash
equivalents.
Finance leases are accounted for as non-cash transactions.
ACCOUNTING POLICIES
01 Accounting policies
69
Cash flows from financing activities comprise changes in the
size or composition of share capital and costs associated with
such changes as well as the raising of loans, repayment of
interest-bearing debt, purchases and sales of treasury shares,
and payment of dividends to owners.
Cash flows relating to assets held under finance leases are
recognised as payment of interest and repayment of debt.
Cash and cash equivalents comprise cash as well as securities
that form part of the ongoing cash management, are readily
convertible to cash and are subject to an insignificant risk of
changes in value.
Cash flows in currencies other than the functional currency
are translated at the average exchange rates for the month in
question, unless these deviate significantly from the rates at
the transaction date.
Segment information
Information is provided on business segments, the Group’s pri-
mary format for reporting segment information, and geographi-
cal markets – its secondary reporting format. The segments
reflect the Group’s risks and internal reporting structure. The
segment information has been prepared in accordance with the
Group’s accounting policies.
Segment income, segment expense, segment assets and seg-
ment liabilities are those items that are directly attributable
to the individual segment or can be indirectly allocated to
the individual segment on a reliable basis. Unallocated items
comprise primarily assets, liabilities, revenue and expense relat-
ing to the Group’s administrative functions, investing activities,
income taxes, etc.
Segment liabilities comprise liabilities resulting from the seg-
ment’s operating activities, including trade payables and other
payables.
Segment information relating to geographical markets is
determined by breaking revenue down by customer location,
while segment assets and additions of intangible assets and
property, plant and equipment are broken down by physical,
geographical location of the assets.
Intragroup transactions between segments are priced at arm’s
length.
01 Accounting policies

70
DONG ENERGY ANNUAL REPORT 2006
01 Accounting policies
Financial ratios
Unless otherwise stated, financial ratios are determined in accord-
ance with the Danish Society of Financial Analysts’ “Recommenda-
tions & Financial Ratios 2005”.
Financial highlights have been calculated as follows:
EBITDA marginEarnings before interest, tax, depreciation and amortisation
Revenue
EBIT margin Earnings before interest and tax
Revenue
Earnings per share (EPS) of DKK 1,0001Profit2
Average number of shares
Dividend per share of DKK 1,000Dividend
Number of sharesyear end
Payout ratioTotal proposed dividend payment
Profit3
Average number of shares(Sharesbeg. of yr x D4 ) + (Sharesyr end x (number of days/year-D4)
Average number of shares
Free cash flows to equity (with acquisitions) Cash flows from operating and investing activities
Free cash flows to equity (without acquisitions)Cash flows from operating and investing activities, plus/minus cash
flows from acquisitions and disposals of enterprises
Net interest-bearing debt Interest-bearing liabilities5 less interest-bearing assets5
Invested capital1 Equity plus/minus gains/losses relating to hedging instruments on equity + net interest-bearing debt
Financial gearingNet interest-bearing debt
Total equity
ACCOUNTING POLICIES
1 The definition deviates from the Danish Society of Financial
Analysts’ “Recommendations & Financial Ratios 2005”.2 Earnings per share (EPS) is determined in accordance with
IAS 33.3 Profit exclusive of minority interests.
4 D = Number of days from the last capital increase to year end.5 Bank overdrafts that are included in the cash flow statement as
cash and cash equivalents are included as negative interest-
bearing assets.
71
In general
Determining the carrying amounts of certain assets and liabili-
ties requires judgements, estimates and assumptions regarding
future events.
The estimates and assumptions made are based on historical
experience and other factors that are believed by management
to be reasonable under the circumstances, but that, by their
nature, are uncertain and unpredictable. The assumptions
may be incomplete or inaccurate, and unforeseen events or
circumstances may occur. Moreover, the DONG Energy Group is
subject to risks and uncertainties that may cause actual results
to differ from these estimates.
Estimates and associated judgments that are deemed by the
management of DONG Energy to be critical to the financial
reporting are set out below. The Group’s accounting policies
are described in detail in note 1 to the consolidated financial
statements.
Business combinations
In 2006, DONG Energy acquired significant activities in the
Danish electricity sector. For an overview of acquired compa-
nies and the fair values determined at the dates of acquisition,
reference is made to note 33 of the consolidated financial
statements.
Very substantial acquisitions were made in 2006, with a total
purchase price of approx. DKK 40 billion. In connection with
the acquisitions, the fair values of the acquired identifiable
assets and liabilities were determined. A number of separate
accounting estimates were made regarding the nature of the
identifiable assets and liabilities, including whether intangible
assets are separable or form an integral part of property, plant
and equipment.
A number of assets and liabilities have been acquired for which
no unique market value is available. For some assets and li-
abilities, the determination of fair value at the acquisition date
is therefore based on a number of accounting estimates of
significant parameters that form part of the measurement of the
fair value, including:
.
service life, maintenance costs and decommissioning costs
for the individual items of property, plant and equipment
and intangible assets;
future electricity and fuel prices, etc.
prices of CO2 quotas, etc.
the possibilities for realising cost and earnings synergies
the future market development and regulation of the Dan-
ish energy market
interest rates applied for discounting, as models have been
used to a large extent that are based on calculations of the
present value of future cash flows
probabilities and expected cash flows related to identifiable
contingent liabilities and contingent assets
The determination has been further complicated by the exten-
sive activities and the existence of cross-ownerships between
the acquired enterprises prior to the merger with DONG Energy,
which also leads to various significant estimates with allocation
of purchase prices.
Prior to the acquisitions, there was trading between DONG En-
ergy and the acquired companies, including a number of long-
term purchase and sales contracts between the enterprises. The
measurement of the fair values of these contracts is subject to
significant estimates.
Some of the investments were purchased over a period of
time, and, in accordance with the rules in IFRS 3 on succes-
sive purchases, adjustment has been made to fair values of the
acquired assets and liabilities up to the date of acquisition. This
determination is subject to a number of accounting estimates
and judgements.
Determination of oil and gas reserves
The assessment of underground oil and gas reserves under
ownership interests in licences is made to SPE standards (So-
ciety of Petroleum Engineers). The assessment of reserves is a
complex process involving various parameters such as analysis
02 Accounting estimates and judgements
ACCOUNTING ESTIMATES AND JUDGEMENTS
72
DONG ENERGY ANNUAL REPORT 2006
02 Accounting estimates and judgements (continued)
of geological data, commercial aspects, etc., each of which is
subject to uncertainty. The assessment is relevant to the deter-
mination of the recoverable amount and depreciation profile for
exploration and evaluation assets.
Recoverable amounts and
depreciation profile for production assets
The determination of recoverable amounts for production as-
sets is based on assumptions about future earnings, oil and gas
prices, electricity and fuel prices, etc., prices of CO2 quotas, etc.,
interest rate levels, etc., future market conditions, etc., each
of which is subject to uncertainty. As stated in the account-
ing policies in note 1, the depreciation profile for a number of
production assets has been determined using the unit-of-pro-
duction method based on the ratio of current production to
estimated proven reserves or based on the expected earnings
profile. The depreciation profile is therefore subject to the same
uncertainties as apply to the determination of the recoverable
amounts for the assets.
Fair value of assets classified as held for sale
Assets classified as held for sale are measured in accordance
with the Group’s accounting policies at the lower of the carrying
amount at the date of classification and fair value less costs to
sell. At the end of the year, assets classified as held for sale had
a carrying amount totalling approx. DKK 8 billion, as described
in further detail in note 23. The determination of the fair value
of the assets is subject to uncertainty, as sales processes are in
progress for the Greek and Spanish wind power assets and the
132 kV transmission network in North Zealand.
write-downs of receivables
Write-downs are made for bad and doubtful debts. The esti-
mates are subject to significant uncertainties, as they are based
on an estimation of the right to collect the receivable and an
assessment of the counter-party’s ability to pay. Reference is
made to note 19 on trade receivables.
Unlisted financial agreements
The DONG Energy Group has concluded financial agreements
based, among other things, on electricity that are unlisted
and are measured at fair value, including a single long-term
agreement that runs until 2020. Reference is made to note
37 for further details. Market values are determined based on
fixed valuation models based on market data and the outlook
concerning long-term prices and exchange rates, etc., each of
which is subject to uncertainty.
Loss-making agreements
As part of the Group’s operations, a number of commercial
agreements have been entered into with fixed terms that may
result in the agreements being loss-making depending on
the market development, etc., and the liabilities incurred by
the DONG Energy Group as a result of these agreements may
also be subject to uncertainty. The judgements concerning of
these complex agreements and their future effects are subject
to significant uncertainties. Reference is also made to note 27
concerning provisions.
Restoration obligations
The measurement of provisions for restoration obligations
is subject to a number of uncertainties, including especially
regarding expected regulatory requirements concerning decom-
missioning and the determination of the expected costs associ-
ated with decommissioning of the production assets, and the
timing of such decommissioning.
ACCOUNTING ESTIMATES AND JUDGEMENTS

73
03 Segment information
The Group’s primary business segments are:
The segments comprise the following activities:
Generation produces energy from efficient power stations
and renewable energy sources. Generation is a market leader
within design, construction and operation of offshore wind
farms.
Exploration & Production creates value through oil and gas
production and procurement of gas at competitive prices.
The exploration and production activities are carried out in
Danish, Norwegian, UK and Faroese waters.
Distribution takes care of DONG Energy’s electricity and gas
distribution and natural gas storage in Denmark. Electri-
city distribution takes place in the metropolitan area and
in North Zealand, while gas distribution covers southern
Jutland and South and West Zealand.
Markets sells DONG Energy’s electricity, natural gas and
related products to more than one million customers in
Denmark, Sweden, Germany and the Netherlands. The cus-
tomers include residential customers, industrial customers,
public sector customers and wholesale customers.
The Group’s secondary segments comprise the following geo-
graphical segments:
Denmark
Rest of EU
Rest of world
NOTES TO THE INCOME STATEMENT

74
DONG ENERGY ANNUAL REPORT 2006
03 Segment information (continued)
Activities – 2006 (primary segment)
DKK million Generation
Explo-ration &
ProductionDistribu-
tion Markets
Unallo-cated/Eli-minations
Group total
Revenue1 7,620 5,556 2,560 24,115 (4,190) 35,661
Production costs (5,959) (3,049) (1,929) (19,277) 3,766 (26,448)
Gross profit (loss) 1,661 2,507 631 4,838 (424) 9,213
Sales and marketing (76) 0 (15) (551) 47 (595)
Management and administration (490) (70) (193) (627) 273 (1,107)
Other operating income 495 0 46 148 (403) 286
Other operating expenses (73) 0 (2) (2,591) 403 (2,263)
Operating profit (loss) (EBIT) 1,517 2,437 467 1,217 (104) 5,534
Gain on disposal of enterprises - - - - 1,023 1,023
Share of profit after tax of associates 674 0 0 (202) (2) 470
Financial income - - - - 872 872
Financial expenses - - - - (1,464) (1,464)
Profit before tax - - - - - 6,435
Income tax expense - - - - - (1,518)
Profit for the year - - - - - 4,917
Intragroup revenue between segments 704 146 594 2,875 (4,319) -
EBITDA 2,695 3,499 1,012 1,601 (14) 8,793
1 The Markets segment includes the effect of intragroup hedging contracts with DKK (173) million net.
NOTES TO THE INCOME STATEMENT

75
03 Segment information (continued)
Balance sheet
Assets 42,712 14,762 17,367 36,339 (5,594) 105,586
- including investments in associates 3,552 0 3 516 2 4,073
- including deferred tax assets 33 0 0 3 0 36
Equity 29,830 3,214 5,836 12,773 (9,385) 42,268
Liabilities 12,882 11,548 11,531 23,566 3,791 63,318
Of which non-interest bearing liabilities 7,178 3,982 4,755 20,883 (1,741) 35,057
Cash flows
Additions of intangible assets and pro-perty, plant and equipment 1,770 2,416 758 530 40 5,514
Depreciation and amortisation (1,179) (1,062) (545) (373) (88) (3,247)
Impairment losses 0 0 0 12 0 12
Other non-cash transactions recognised in the income statement (324) 420 (148) 794 129 871
Number of full-time employees
Average for the financial year 1 1,103 254 445 821 321 2,944
At year end 2,083 273 701 1,183 345 4,585
1 The average number of employees in 2006 reflects the fact that significant
acquisitions of enterprises were made in 2006 that are included in the consolidated
financial statements from the respective acquisition dates, cf. note 33.
Geographical breakdown - 2006 (secondary segment)
DKK million Denmark Rest of EU Rest of world Group total
Revenue 17,273 17,916 472 35,661
Segment assets 84,711 9,149 11,726 105,586
Additions of intangible assets and property, plant and equipment 3,485 1,020 1,722 6,227
DKK million Generation
Explo-ration &
ProductionDistribu-
tion Markets
Unallo-cated/Eli-minations
Group total

76
DONG ENERGY ANNUAL REPORT 2006
03 Segment information (continued)
Activities – 2005 (primary segment)
DKK million Generation
Explo-ration &
ProductionDistribu-
tion Markets
Unallo-cated/eli-minations
Group total
Revenue 114 4,346 857 13,885 (709) 18,493
Production costs (91) (2,860) (677) (10,857) 735 (13,750)
Gross profit 23 1,486 180 3,028 26 4,743
Sales and marketing - - - - (263) (263)
Management and administration - - - - (369) (369)
Other operating income - - - - 7 7
Other operating expenses - - - - (19) (19)
Operating profit (loss) (EBIT) (1) 1,412 161 2,582 (667) 4,099
Gain on disposal of enterprises - - - - 0 0
Share of profit after tax of associates 38 0 0 22 2 62
Financial income - - - - 945 945
Financial expenses - - - - (1,097) (1,097)
Profit before tax - - - - - 4,009
Income tax expense - - - - - (1,322)
Profit for the year - - - - - 2,687
Intragroup revenue between segments 0 115 664 39 (818) -
EBITDA 47 2,692 565 2,921 89 6,314
NOTES TO THE INCOME STATEMENT
The comparative figures for segment information for 2005 have
not been incorporated with the same degree of specification
as for 2006, as transactions were not recorded with the same
degree of detail and on the same functions in 2005 as in 2006.
It is therefore not possible to present segment information for
2006 with fully comparable figures for 2005.
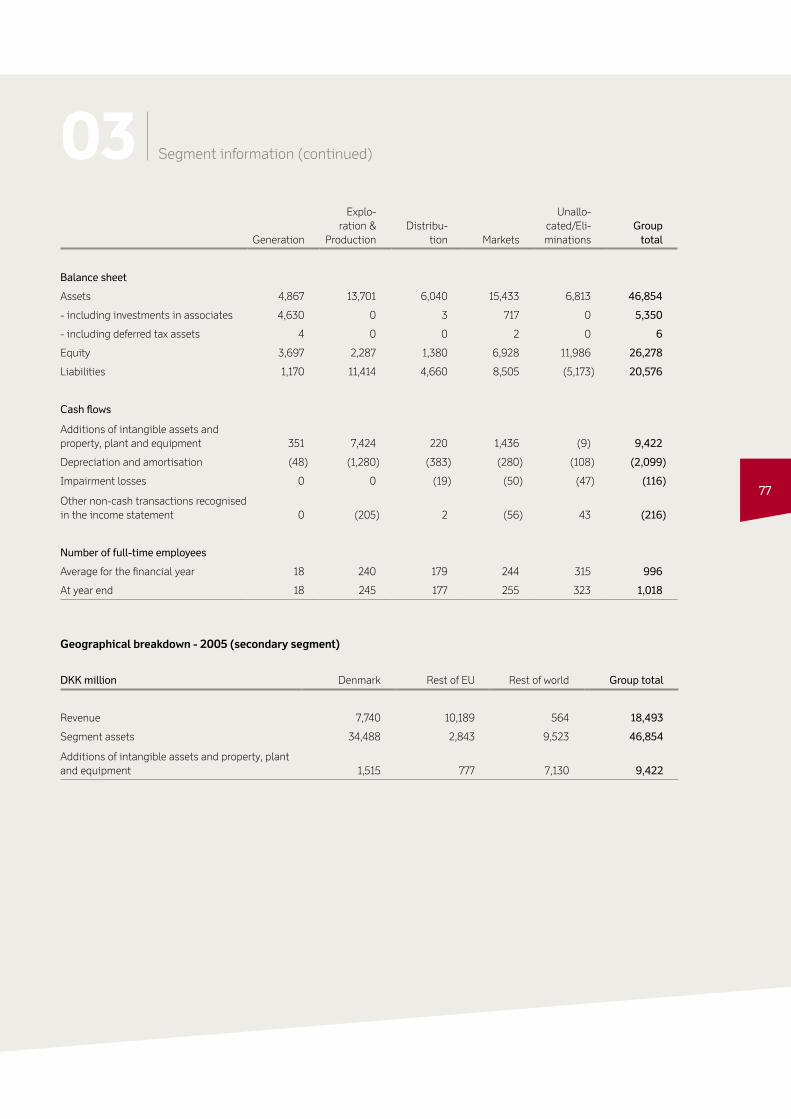
77
03 Segment information (continued)
Generation
Explo-ration &
ProductionDistribu-
tion Markets
Unallo-cated/Eli-minations
Group total
Balance sheet
Assets 4,867 13,701 6,040 15,433 6,813 46,854
- including investments in associates 4,630 0 3 717 0 5,350
- including deferred tax assets 4 0 0 2 0 6
Equity 3,697 2,287 1,380 6,928 11,986 26,278
Liabilities 1,170 11,414 4,660 8,505 (5,173) 20,576
Cash flows
Additions of intangible assets and property, plant and equipment 351 7,424 220 1,436 (9) 9,422
Depreciation and amortisation (48) (1,280) (383) (280) (108) (2,099)
Impairment losses 0 0 (19) (50) (47) (116)
Other non-cash transactions recognised in the income statement 0 (205) 2 (56) 43 (216)
Number of full-time employees
Average for the financial year 18 240 179 244 315 996
At year end 18 245 177 255 323 1,018
Geographical breakdown - 2005 (secondary segment)
DKK million Denmark Rest of EU Rest of world Group total
Revenue 7,740 10,189 564 18,493
Segment assets 34,488 2,843 9,523 46,854
Additions of intangible assets and property, plant and equipment 1,515 777 7,130 9,422
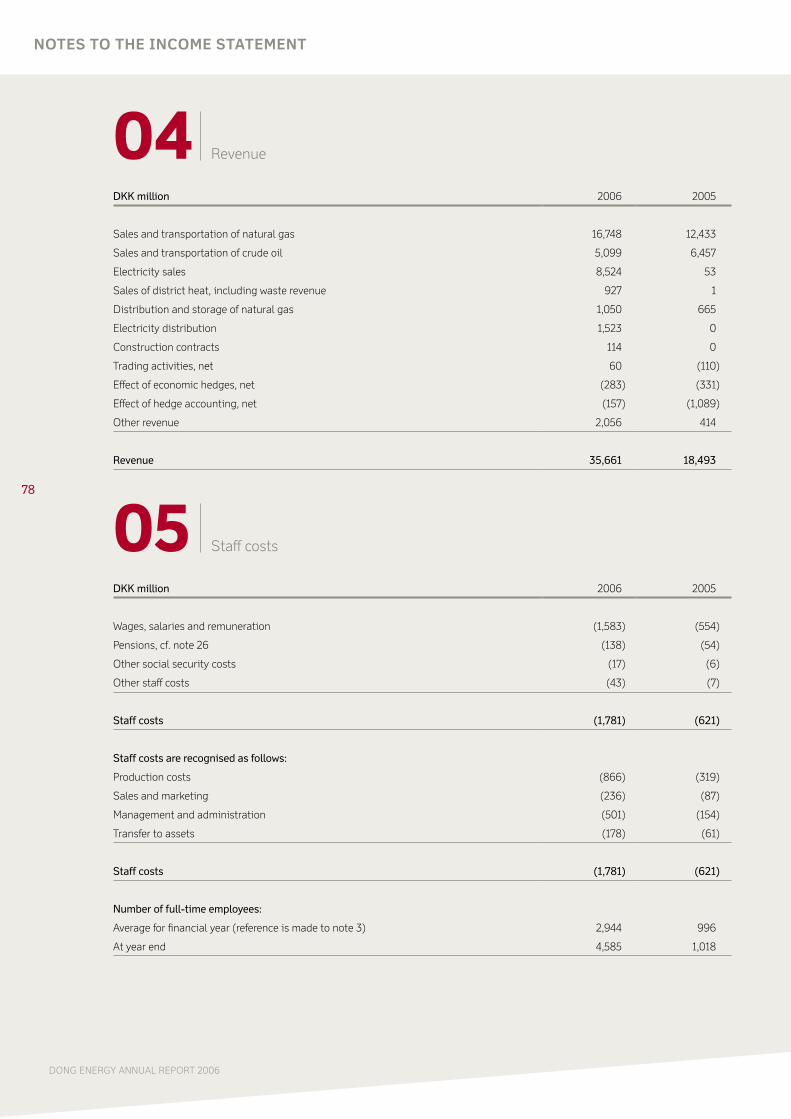
78
DONG ENERGY ANNUAL REPORT 2006
05 Staff costs
DKK million 2006 2005
Wages, salaries and remuneration (1,583) (554)
Pensions, cf. note 26 (138) (54)
Other social security costs (17) (6)
Other staff costs (43) (7)
Staff costs (1,781) (621)
Staff costs are recognised as follows:
Production costs (866) (319)
Sales and marketing (236) (87)
Management and administration (501) (154)
Transfer to assets (178) (61)
Staff costs (1,781) (621)
Number of full-time employees:
Average for financial year (reference is made to note 3) 2,944 996
At year end 4,585 1,018
NOTES TO THE INCOME STATEMENT
04 Revenue
DKK million 2006 2005
Sales and transportation of natural gas 16,748 12,433
Sales and transportation of crude oil 5,099 6,457
Electricity sales 8,524 53
Sales of district heat, including waste revenue 927 1
Distribution and storage of natural gas 1,050 665
Electricity distribution 1,523 0
Construction contracts 114 0
Trading activities, net 60 (110)
Effect of economic hedges, net (283) (331)
Effect of hedge accounting, net (157) (1,089)
Other revenue 2,056 414
Revenue 35,661 18,493
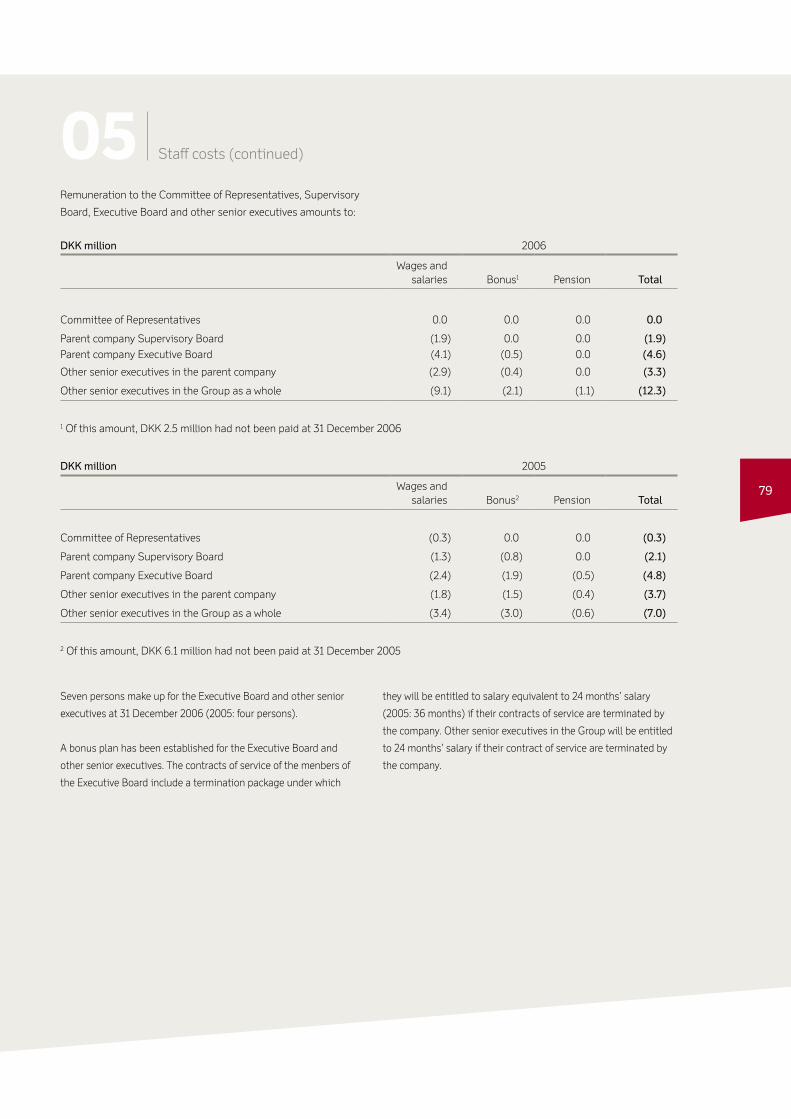
79
Remuneration to the Committee of Representatives, Supervisory
Board, Executive Board and other senior executives amounts to:
DKK million 2006
Wages and salaries Bonus1 Pension Total
Committee of Representatives 0.0 0.0 0.0 0.0
Parent company Supervisory Board (1.9) 0.0 0.0 (1.9)Parent company Executive Board (4.1) (0.5) 0.0 (4.6)
Other senior executives in the parent company (2.9) (0.4) 0.0 (3.3)
Other senior executives in the Group as a whole (9.1) (2.1) (1.1) (12.3)
1 Of this amount, DKK 2.5 million had not been paid at 31 December 2006
DKK million 2005
Wages and salaries Bonus2 Pension Total
Committee of Representatives (0.3) 0.0 0.0 (0.3)
Parent company Supervisory Board (1.3) (0.8) 0.0 (2.1)
Parent company Executive Board (2.4) (1.9) (0.5) (4.8)
Other senior executives in the parent company (1.8) (1.5) (0.4) (3.7)
Other senior executives in the Group as a whole (3.4) (3.0) (0.6) (7.0)
2 Of this amount, DKK 6.1 million had not been paid at 31 December 2005
05 Staff costs (continued)
Seven persons make up for the Executive Board and other senior
executives at 31 December 2006 (2005: four persons).
A bonus plan has been established for the Executive Board and
other senior executives. The contracts of service of the menbers of
the Executive Board include a termination package under which
they will be entitled to salary equivalent to 24 months’ salary
(2005: 36 months) if their contracts of service are terminated by
the company. Other senior executives in the Group will be entitled
to 24 months’ salary if their contract of service are terminated by
the company.

80
DONG ENERGY ANNUAL REPORT 2006
NOTES TO THE INCOME STATEMENT
06 Research and development costs
DKK million 2006 2005
Research and development costs incurred during the year (210) (31)
Amortisation and impairment losses relating to recognised development costs under intangible assets (102) (95)
Development costs recognised under intangible assets 136 45
Research and development costs recognised in the income statement under production costs (176) (81)
07 Depreciation, amortisation and impairment losses
DKK million 2006 2005
Depreciation and amortisation by function:
Intangible assets
Amortisation recognised in production costs (659) (122)
Amortisation recognised in sales and marketing (18) 0
Amortisation recognised in management and administration (15) 0
Property, plant and equipment
Depreciation recognised in production costs (2,446) (1,969)
Depreciation recognised in sales and marketing (15) 0
Depreciation recognised in management and administration (94) (8)
Depreciation and amortisation recognised in the income statement (3,247) (2,099)

81
07 Depreciation, amortisation and impairment losses (continued)
DKK million 2006 2005
Impairment losses by function:
Intangible assets
Production costs 0 (83)
Property, plant and equipment
Production costs 0 (33)
Other non-current assets
Impairment losses, recognised in management and administration (12) 0
Impairment losses, recognised in share of profit after tax of associates (188) 0
Impairment losses recognised in the income statement (200) (116)
Depreciation, amortisation and impairment losses recognised in the income statement (3,447) (2,215)
The impairment loss for associates relates to the investment in
Stadtwerke Lübeck GmbH. The impairment loss is due to estimates
of future cash flows being lower than previously estimated. The
net cash flows were determined on the basis of budgets for the
period 2007 - 2011 and specific expectations for the net cash flows
for the period 2012 - 2015. The weighted average growth rate for
extrapolation of expected future net cash flows for the years after
2015 (terminal value) has been estimated at 2%. The terminal
value accounts for approx. 69% of total expected future cash flows.
The net cash flows have been discounted using a discount rate
before tax of 6.25%.

82
DONG ENERGY ANNUAL REPORT 2006
08 Fees to auditors appointed at the Annual General Meeting
DKK million 2006 2005
Audit fees (13) (4)
Non-audit fees (23) (32)
Total fees to KPMG C. Jespersen (36) (36)
Audit fees (4) 0
Non-audit fees (17) 0
Total fees to Deloitte (21) 0
Audit fees 0 (1)
Non-audit fees 0 0
Total fees to BDO ScanRevision 0 (1)
Total audit fees (17) (5)
Total non-audit fees (40) (32)
Fees to auditors appointed at the Annual General Meeting (57) (37)
09 Other operating income and expenses
DKK million 2006 2005
Gains on sale of intangible assets and property, plant and equipment 45 5
Operating income, other 241 2
Other operating income 286 7
Loss on sale of intangible assets and property, plant and equipment (6) (15)
Loss on termination of gas sales agreement (2,185) 0
Operating expenses, other (72) (3)
Other operating expenses (2,263) (18)
Other operating income and expenses (1,977) (11)
1 Negative fair value of gas sales agreements recognised in connection with acquisitions.
NOTES TO THE INCOME STATEMENT
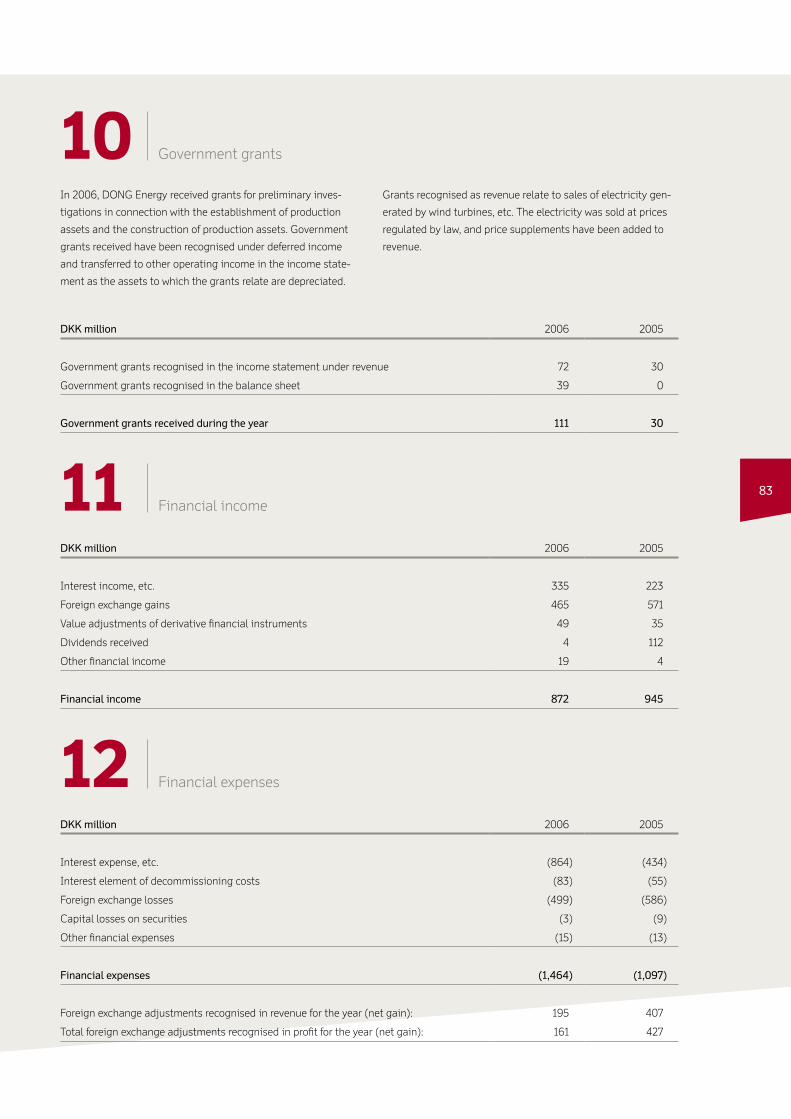
83
10 Government grants
In 2006, DONG Energy received grants for preliminary inves-
tigations in connection with the establishment of production
assets and the construction of production assets. Government
grants received have been recognised under deferred income
and transferred to other operating income in the income state-
ment as the assets to which the grants relate are depreciated.
Grants recognised as revenue relate to sales of electricity gen-
erated by wind turbines, etc. The electricity was sold at prices
regulated by law, and price supplements have been added to
revenue.
DKK million 2006 2005
Government grants recognised in the income statement under revenue 72 30
Government grants recognised in the balance sheet 39 0
Government grants received during the year 111 30
11 Financial income
DKK million 2006 2005
Interest income, etc. 335 223
Foreign exchange gains 465 571
Value adjustments of derivative financial instruments 49 35
Dividends received 4 112
Other financial income 19 4
Financial income 872 945
12 Financial expenses
DKK million 2006 2005
Interest expense, etc. (864) (434)
Interest element of decommissioning costs (83) (55)
Foreign exchange losses (499) (586)
Capital losses on securities (3) (9)
Other financial expenses (15) (13)
Financial expenses (1,464) (1,097)
Foreign exchange adjustments recognised in revenue for the year (net gain): 195 407
Total foreign exchange adjustments recognised in profit for the year (net gain): 161 427
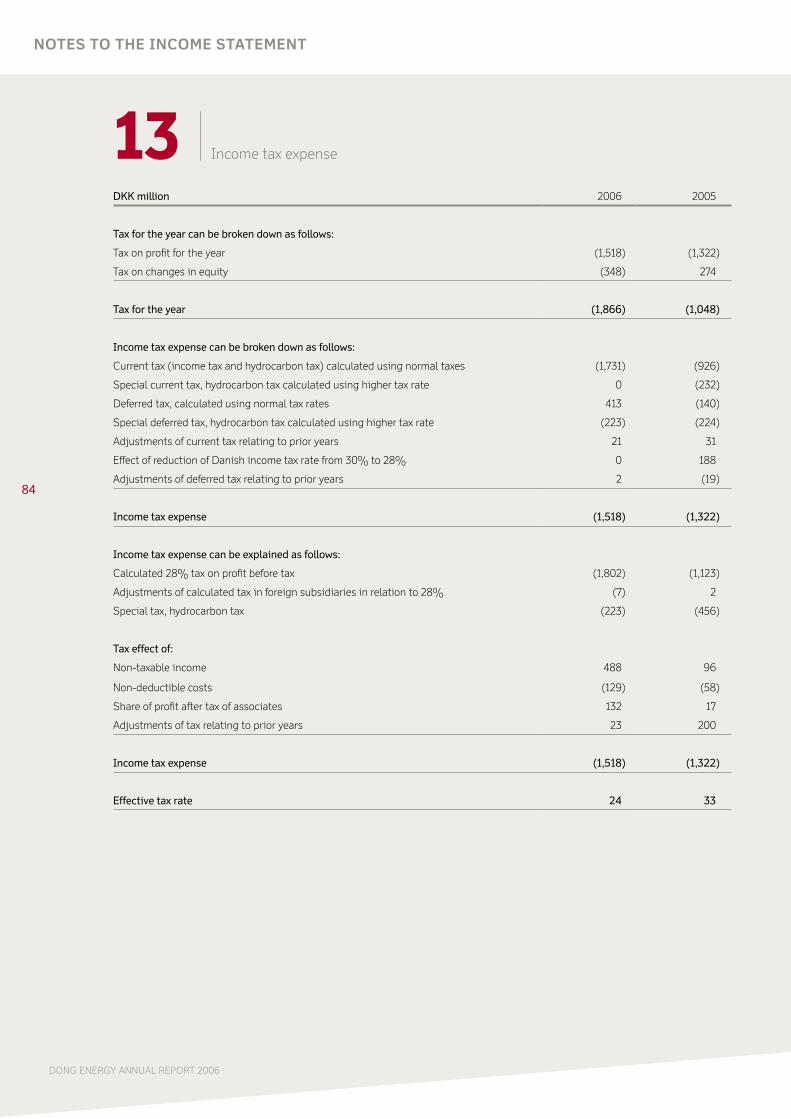
84
DONG ENERGY ANNUAL REPORT 2006
13 Income tax expense
DKK million 2006 2005
Tax for the year can be broken down as follows:
Tax on profit for the year (1,518) (1,322)
Tax on changes in equity (348) 274
Tax for the year (1,866) (1,048)
Income tax expense can be broken down as follows:
Current tax (income tax and hydrocarbon tax) calculated using normal taxes (1,731) (926)
Special current tax, hydrocarbon tax calculated using higher tax rate 0 (232)
Deferred tax, calculated using normal tax rates 413 (140)
Special deferred tax, hydrocarbon tax calculated using higher tax rate (223) (224)
Adjustments of current tax relating to prior years 21 31
Effect of reduction of Danish income tax rate from 30% to 28% 0 188
Adjustments of deferred tax relating to prior years 2 (19)
Income tax expense (1,518) (1,322)
Income tax expense can be explained as follows:
Calculated 28% tax on profit before tax (1,802) (1,123)
Adjustments of calculated tax in foreign subsidiaries in relation to 28% (7) 2
Special tax, hydrocarbon tax (223) (456)
Tax effect of:
Non-taxable income 488 96
Non-deductible costs (129) (58)
Share of profit after tax of associates 132 17
Adjustments of tax relating to prior years 23 200
Income tax expense (1,518) (1,322)
Effective tax rate 24 33
NOTES TO THE INCOME STATEMENT

85
14 Earnings per share
DKK million 2006 2005
Profit for the year 4,917 2,687
Dividend on hybrid capital after tax (325) 0
Attributable to minority interests 1 (8)
Attributable to the DONG Energy Group 4,593 2,679
Average number of shares of DKK 1,000 each 2,701,665 2,143,600
Earnings (EPS) and diluted earnings (DEPS) per DKK 1,000 share, in whole DKK 1,700 1,250
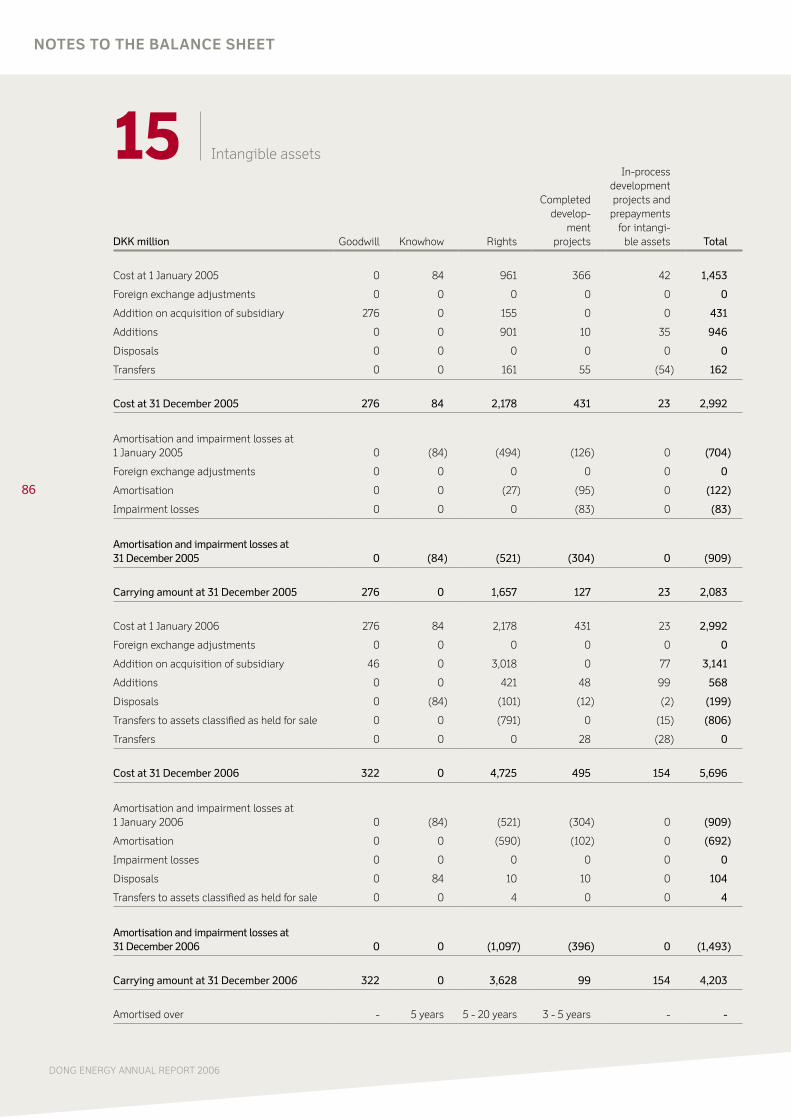
86
DONG ENERGY ANNUAL REPORT 2006
NOTES TO THE BALANCE SHEET
15 Intangible assets
DKK million Goodwill Knowhow Rights
Completed develop-
ment projects
In-process development projects and
prepayments for intangi-
ble assets Total
Cost at 1 January 2005 0 84 961 366 42 1,453
Foreign exchange adjustments 0 0 0 0 0 0
Addition on acquisition of subsidiary 276 0 155 0 0 431
Additions 0 0 901 10 35 946
Disposals 0 0 0 0 0 0
Transfers 0 0 161 55 (54) 162
Cost at 31 December 2005 276 84 2,178 431 23 2,992
Amortisation and impairment losses at 1 January 2005 0 (84) (494) (126) 0 (704)
Foreign exchange adjustments 0 0 0 0 0 0
Amortisation 0 0 (27) (95) 0 (122)
Impairment losses 0 0 0 (83) 0 (83)
Amortisation and impairment losses at 31 December 2005 0 (84) (521) (304) 0 (909)
Carrying amount at 31 December 2005 276 0 1,657 127 23 2,083
Cost at 1 January 2006 276 84 2,178 431 23 2,992
Foreign exchange adjustments 0 0 0 0 0 0
Addition on acquisition of subsidiary 46 0 3,018 0 77 3,141
Additions 0 0 421 48 99 568
Disposals 0 (84) (101) (12) (2) (199)
Transfers to assets classified as held for sale 0 0 (791) 0 (15) (806)
Transfers 0 0 0 28 (28) 0
Cost at 31 December 2006 322 0 4,725 495 154 5,696
Amortisation and impairment losses at 1 January 2006 0 (84) (521) (304) 0 (909)
Amortisation 0 0 (590) (102) 0 (692)
Impairment losses 0 0 0 0 0 0
Disposals 0 84 10 10 0 104
Transfers to assets classified as held for sale 0 0 4 0 0 4
Amortisation and impairment losses at 31 December 2006 0 0 (1,097) (396) 0 (1,493)
Carrying amount at 31 December 2006 322 0 3,628 99 154 4,203
Amortised over - 5 years 5 - 20 years 3 - 5 years - -
87
15 Intangible assets (continued)
Impairment testing of goodwill
At 31 December 2006, DONG Energy tested the carrying
amount of goodwill for impairment based on the allocation
of the cost of goodwill on the two subsidiaries DONG Energy
Sales B.V. (formerly Intergas Levering B.V.) with DKK 276 mil-
lion and DONG Energy Sales GmbH (formerly E-Nord GmbH)
with DKK 46 million.
The result of the impairment test was that the recoverable
amount is higher than the carrying amount. It has therefore
been deemed unnecessary to write down goodwill in 2006.
The recoverable amount for DONG Energy Sales B.V. is based
on a fair value determination for the company, less expected
costs to sell. The fair value has been determined on the basis of
the price per customer in recent transactions with comparable
enterprises. The definite practice is to value enterprises such as
DONG Energy Sales B.V. using such valuation methods.
The recoverable amount for DONG Energy Sales GmbH was
determined as the present value of the expected future net cash
flows relating to the company’s activities. The net cash flows
were determined based on budgets for the period 2007 - 2010
and specific expectations for the net cash flows for the period
2011 - 2014. The weighted average growth rate for extrapola-
tion of expected future net cash flows for the years after 2014
(terminal value) has been estimated at 2%. The expected future
net cash flows have been discounted using a discount rate
before tax of 7.75%.
Impairment testing of rights
Rights consist primarily of CO2 rights, gas purchase rights and
customer-related rights. At 31 December 2006, the carrying
amount of CO2 rights was DKK 1,151 million and gas purchase
rights were determined at DKK 1,559 million. The carrying
amount of customer-related rights was DKK 586 million at 31
December 2006.
Rights have not been impairment tested, as there has not been
any indication of impairment of recognised rights.
Impairment testing of completed development projects
Completed development projects relate to IT software. At 31
December 2006, the carrying amount of the development
projects was DKK 99 million.
Completed development projects have not been impairment
tested, as there has not been any indication of impairment of
completed development projects.
Impairment testing of in-process development projects
In-process development projects relate to IT software for the
new Group, optical fibre network technology and development
of an intelligent electricity meter, etc. At 31 December 2006, the
carrying amount of in-process development projects was DKK
154 million.
The carrying amounts of in-process development projects were
tested for impairment at 31 December 2006. The result of the
impairment tests was that the recoverable amount is higher
than the carrying amount. It has therefore been deemed unnec-
essary to write down development projects in progress.
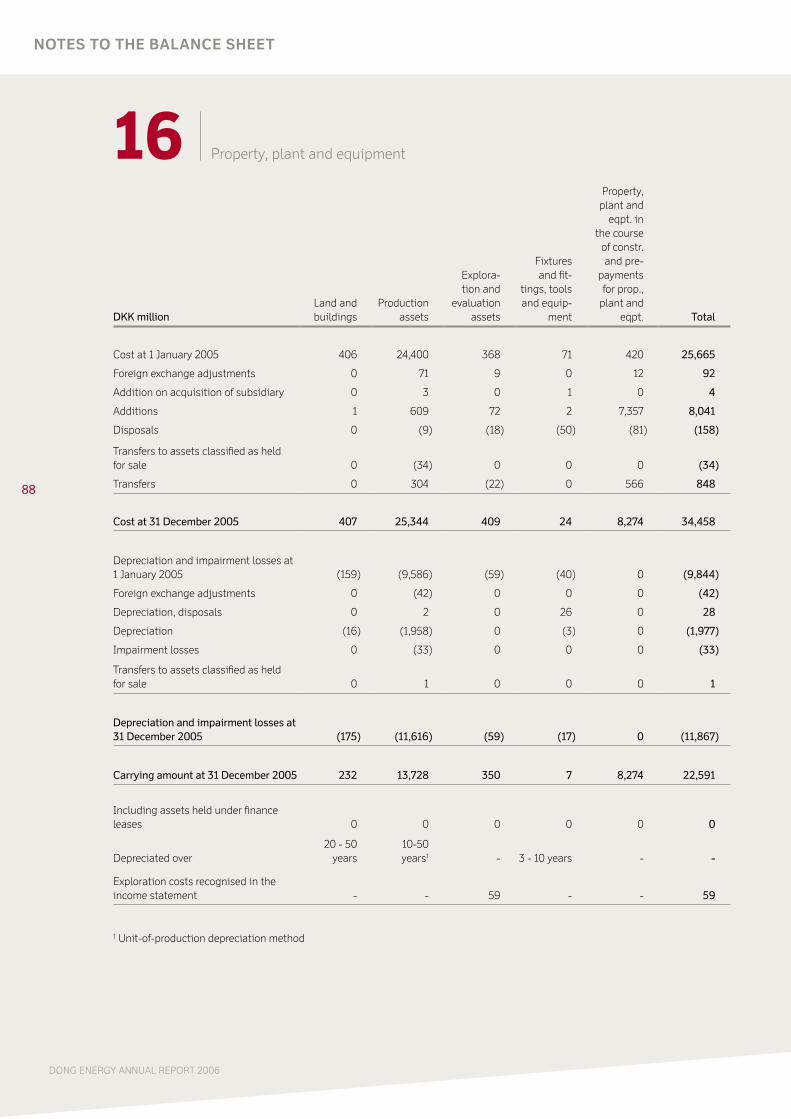
88
DONG ENERGY ANNUAL REPORT 2006
16 Property, plant and equipment
DKK millionLand and buildings
Production assets
Explora-tion and
evaluation assets
Fixtures and fit-
tings, tools and equip-
ment
Property, plant and
eqpt. in the course
of constr. and pre-
payments for prop.,
plant and eqpt. Total
Cost at 1 January 2005 406 24,400 368 71 420 25,665
Foreign exchange adjustments 0 71 9 0 12 92
Addition on acquisition of subsidiary 0 3 0 1 0 4
Additions 1 609 72 2 7,357 8,041
Disposals 0 (9) (18) (50) (81) (158)
Transfers to assets classified as held for sale 0 (34) 0 0 0 (34)
Transfers 0 304 (22) 0 566 848
Cost at 31 December 2005 407 25,344 409 24 8,274 34,458
Depreciation and impairment losses at1 January 2005 (159) (9,586) (59) (40) 0 (9,844)
Foreign exchange adjustments 0 (42) 0 0 0 (42)
Depreciation, disposals 0 2 0 26 0 28
Depreciation (16) (1,958) 0 (3) 0 (1,977)
Impairment losses 0 (33) 0 0 0 (33)
Transfers to assets classified as held for sale 0 1 0 0 0 1
Depreciation and impairment losses at 31 December 2005 (175) (11,616) (59) (17) 0 (11,867)
Carrying amount at 31 December 2005 232 13,728 350 7 8,274 22,591
Including assets held under finance leases 0 0 0 0 0 0
Depreciated over20 - 50
years 10-50 years1 - 3 - 10 years - -
Exploration costs recognised in the income statement - - 59 - - 59
1 Unit-of-production depreciation method
NOTES TO THE BALANCE SHEET

89
16 Property, plant and equipment (continued)
DKK millionLand and buildings
Production assets
Explora-tion and
evaluation assets
Fixtures and fit-
tings, tools and equip-
ment
Property, plant and
eqpt. in the course
of constr. and pre-
payments for prop.,
plant and eqpt. Total
Cost at 1 January 2006 407 25,344 409 24 8,274 34,458
Foreign exchange adjustments 0 (42) 0 0 (293) (335)
Addition on acquisition of subsidiary 3,487 24,454 0 390 2,520 30,851
Additions 1 1,828 254 40 3,158 5,281
Disposal on sale of subsidiary (20) (2,685) 0 (2) 0 (2,707)
Disposals (319) (264) (291) (62) (94) (1,030)
Transfers to assets classified as held for sale (368) (6,276) 0 0 (408) (7,052)
Transfers 11 1,963 0 5 (1,967) 12
Cost at 31 December 2006 3,199 44,322 372 395 11,190 59,478
Depreciation and impairment losses at1 January 2006 (175) (11,616) (59) (17) 0 (11,867)
Foreign exchange adjustments 0 59 0 0 0 59
Disposal on sale of subsidiary 18 1,300 0 2 0 1,320
Depreciation, disposals 2 38 59 0 0 99
Depreciation (79) (2,431) 0 (46) 0 (2,556)
Impairment losses 0 0 0 0 0 0
Transfers to assets classified as held for sale 3 407 0 0 0 410
Transfers 0 18 0 0 0 18
Depreciation and impairment losses at 31 December 2006 (231) (12,225) 0 (61) 0 (12,517)
Carrying amount at 31 December 2006 2,968 32,097 372 334 11,190 46,961
Including assets held under finance leases 0 108 0 0 0 108
Depreciated over20 - 50
years10 - 50 years1 - 3 - 10 years - -
Exploration costs recognised in the income statement - - 433 - - 433
1 Unit-of-production depreciation method

90
DONG ENERGY ANNUAL REPORT 2006
16 Property, plant and equipment (continued)
Impairment testing of property, plant and equipment
The exploration and evaluation activities are tested for impair-
ment annually and if there is any indication of impairment. An
assessment for impairment is also carried out on identification
of commercial oil and/or gas finds. The carrying amounts of
other items of property, plant and equipment are reviewed an-
nually to determine whether there is any indication of impair-
ment.
The recoverable amount is based on the higher of the value in
use and the fair value less estimated costs to sell. The value in
use is determined on the basis of expected net cash flows ac-
cording to budgets and projections and a discount rate before
tax of between 7.25% - 10.50%. Significant parameters in
connection with the determination of the value in use are sales,
EBIT, working capital, fixed assets and growth assumptions.
Based on the impairment test of property, plant and equip-
ment, it is estimated that the carrying amount exceeds the
recoverable amount. It was thus not deemed necessary to write
down the Group’s property, plant and equipment in 2006. The
impairment loss of DKK 33 million in 2005 related to produc-
tion assets and is recognised in the income statement for 2005
under production costs.
Finance leases
The Group has concluded finance leases relating to produc-
tion assets. On expiry of the leases the Group must acquire the
assets or nominate a buyer. The purchase sum on expiry of the
leases is estimated to amount to the market value of the assets.
The leased assets have been customised for use by the Group.
NOTES TO THE BALANCE SHEET

91
17 Other non-current assets
DKK million Investments in associates Other equity investmentsOther non-current
financial assets
2006 2005 2006 2005 2006 2005
Cost at 1 January 5,529 403 915 4,874 68 1,017
Reclassifications at 1 January 0 0 0 91 0 0
Restated cost at 1 January 5,529 403 915 4,965 68 1,017
Additions 5,170 882 7 194 314 0
Addition on acquisition of subsidiaries 3,485 0 27 0 121 0
Capital contributions in the form of assets 10,047 0 0 0 0 0
Capital contributions, etc. 38 0 0 0 0 0
Transfers 0 4,244 (11) (4,244) 0 (942)
Transferred on establishment of group (19,754) 0 (904) 0 0 0
Transfers to assets classified as held for sale 0 0 (17) 0 0 0
Disposals (35) 0 0 0 0 (7)
Cost at 31 December 4,480 5,529 17 915 503 68
Value adjustments at 1 January (179) (215) 468 787 0 (10)
Reclassifications at 1 January 0 0 0 (91) 0 0
Restated value adjustments at 1 January (179) (215) 468 696 0 (10)
Share of profit for the year 658 62 0 0 0 0
Reversal of value adjustments of asso-ciates on recognition as subsidiaries (688) 0 0 0 0 0
Recognised value adjustments of enter-prises transferred to subsidiaries 0 0 (468) 0 0 0
Goodwill impairment losses (188) 0 0 0 0 0
Value adjustments, etc. 2 (9) 0 0 0 0
Impairment losses 0 0 (12) 0 0 0
Dividends received (35) (17) 0 0 0 0
Transfers 0 0 0 0 0 10
Reversal of revaluation on transfer of other equity investments to associates 0 0 0 (228) 0 0
Disposals 23 0 0 0 0 0
Value adjustments at 31 December (407) (179) (12) 468 0 0
Carrying amount at 31 December 4,073 5,350 5 1,383 503 68
Other equity investments are classified as shares available for sale.
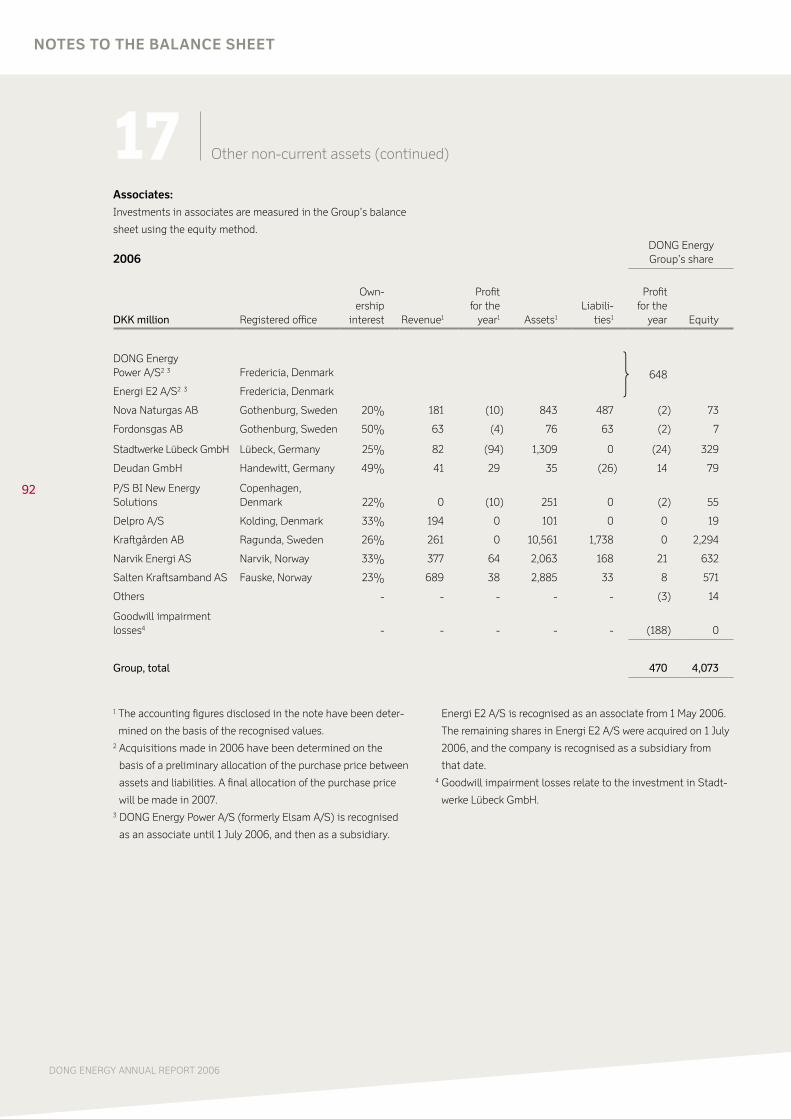
92
DONG ENERGY ANNUAL REPORT 2006
17 Other non-current assets (continued)
Associates:
Investments in associates are measured in the Group’s balance
sheet using the equity method.
2006DONG EnergyGroup’s share
DKK million Registered office
Own-ership
interest Revenue1
Profit for the
year1 Assets1
Liabili-ties1
Profit for the
year Equity
DONG Energy Power A/S2 3 Fredericia, Denmark 648
Energi E2 A/S2 3 Fredericia, Denmark
Nova Naturgas AB Gothenburg, Sweden 20% 181 (10) 843 487 (2) 73
Fordonsgas AB Gothenburg, Sweden 50% 63 (4) 76 63 (2) 7
Stadtwerke Lübeck GmbH Lübeck, Germany 25% 82 (94) 1,309 0 (24) 329
Deudan GmbH Handewitt, Germany 49% 41 29 35 (26) 14 79
P/S BI New Energy Solutions
Copenhagen, Denmark 22% 0 (10) 251 0 (2) 55
Delpro A/S Kolding, Denmark 33% 194 0 101 0 0 19
Kraftgården AB Ragunda, Sweden 26% 261 0 10,561 1,738 0 2,294
Narvik Energi AS Narvik, Norway 33% 377 64 2,063 168 21 632
Salten Kraftsamband AS Fauske, Norway 23% 689 38 2,885 33 8 571
Others - - - - - (3) 14
Goodwill impairment losses4 - - - - - (188) 0
Group, total 470 4,073
NOTES TO THE BALANCE SHEET
1 The accounting figures disclosed in the note have been deter-
mined on the basis of the recognised values.2 Acquisitions made in 2006 have been determined on the
basis of a preliminary allocation of the purchase price between
assets and liabilities. A final allocation of the purchase price
will be made in 2007.3 DONG Energy Power A/S (formerly Elsam A/S) is recognised
as an associate until 1 July 2006, and then as a subsidiary.
Energi E2 A/S is recognised as an associate from 1 May 2006.
The remaining shares in Energi E2 A/S were acquired on 1 July
2006, and the company is recognised as a subsidiary from
that date. 4 Goodwill impairment losses relate to the investment in Stadt-
werke Lübeck GmbH.
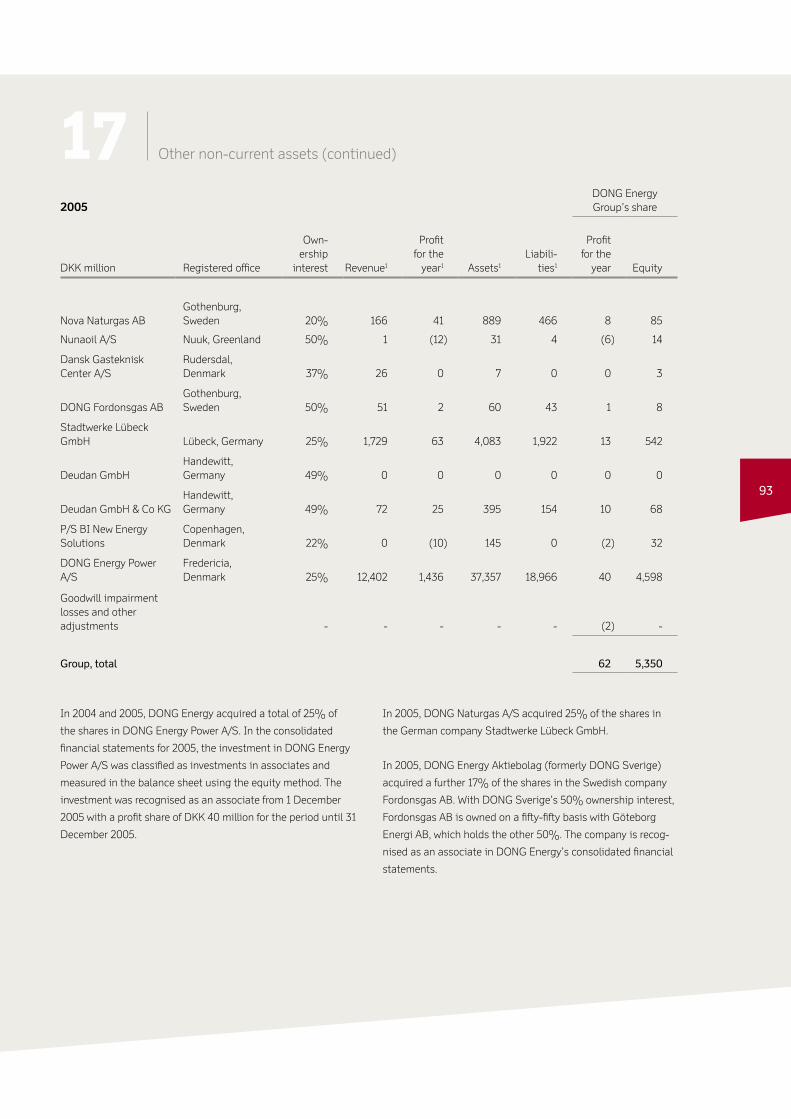
93
17 Other non-current assets (continued)
2005DONG EnergyGroup’s share
DKK million Registered office
Own-ership
interest Revenue1
Profit for the
year1 Assets1
Liabili-ties1
Profit for the
year Equity
Nova Naturgas ABGothenburg, Sweden 20% 166 41 889 466 8 85
Nunaoil A/S Nuuk, Greenland 50% 1 (12) 31 4 (6) 14
Dansk Gasteknisk Center A/S
Rudersdal, Denmark 37% 26 0 7 0 0 3
DONG Fordonsgas ABGothenburg, Sweden 50% 51 2 60 43 1 8
Stadtwerke Lübeck GmbH Lübeck, Germany 25% 1,729 63 4,083 1,922 13 542
Deudan GmbHHandewitt, Germany 49% 0 0 0 0 0 0
Deudan GmbH & Co KGHandewitt, Germany 49% 72 25 395 154 10 68
P/S BI New Energy Solutions
Copenhagen, Denmark 22% 0 (10) 145 0 (2) 32
DONG Energy Power A/S
Fredericia, Denmark 25% 12,402 1,436 37,357 18,966 40 4,598
Goodwill impairment losses and other adjustments - - - - - (2) -
Group, total 62 5,350
In 2004 and 2005, DONG Energy acquired a total of 25% of
the shares in DONG Energy Power A/S. In the consolidated
financial statements for 2005, the investment in DONG Energy
Power A/S was classified as investments in associates and
measured in the balance sheet using the equity method. The
investment was recognised as an associate from 1 December
2005 with a profit share of DKK 40 million for the period until 31
December 2005.
In 2005, DONG Naturgas A/S acquired 25% of the shares in
the German company Stadtwerke Lübeck GmbH.
In 2005, DONG Energy Aktiebolag (formerly DONG Sverige)
acquired a further 17% of the shares in the Swedish company
Fordonsgas AB. With DONG Sverige’s 50% ownership interest,
Fordonsgas AB is owned on a fifty-fifty basis with Göteborg
Energi AB, which holds the other 50%. The company is recog-
nised as an associate in DONG Energy’s consolidated financial
statements.
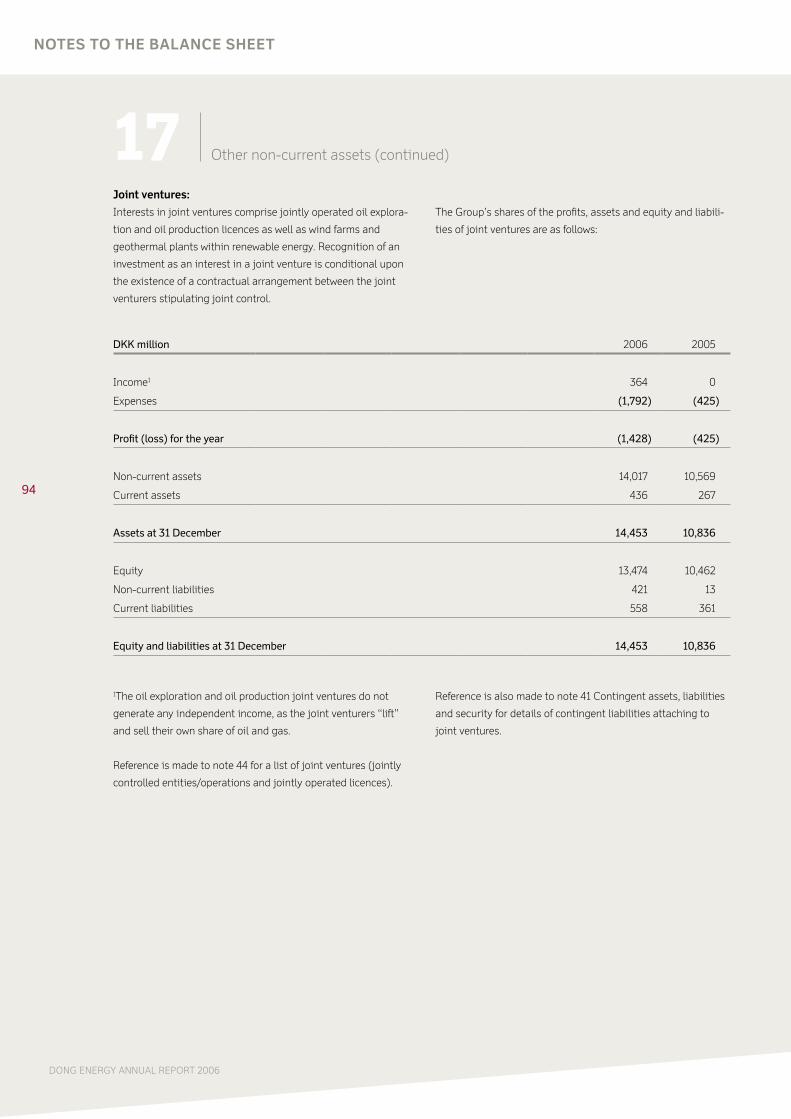
94
DONG ENERGY ANNUAL REPORT 2006
17 Other non-current assets (continued)
NOTES TO THE BALANCE SHEET
Joint ventures:
Interests in joint ventures comprise jointly operated oil explora-
tion and oil production licences as well as wind farms and
geothermal plants within renewable energy. Recognition of an
investment as an interest in a joint venture is conditional upon
the existence of a contractual arrangement between the joint
venturers stipulating joint control.
The Group’s shares of the profits, assets and equity and liabili-
ties of joint ventures are as follows:
DKK million 2006 2005
Income1 364 0
Expenses (1,792) (425)
Profit (loss) for the year (1,428) (425)
Non-current assets 14,017 10,569
Current assets 436 267
Assets at 31 December 14,453 10,836
Equity 13,474 10,462
Non-current liabilities 421 13
Current liabilities 558 361
Equity and liabilities at 31 December 14,453 10,836
1The oil exploration and oil production joint ventures do not
generate any independent income, as the joint venturers “lift”
and sell their own share of oil and gas.
Reference is made to note 44 for a list of joint ventures (jointly
controlled entities/operations and jointly operated licences).
Reference is also made to note 41 Contingent assets, liabilities
and security for details of contingent liabilities attaching to
joint ventures.

95
18 Inventories
DKK million 2006 2005
Raw materials and consumables 155 2
Fuel 1,491 0
Natural gas and crude oil 937 688
Inventories at 31 December 2,583 690
Carrying amount of inventories recognised at net selling price 0 0
Write-downs for the year recognised in the income statement 0 0
Reversals of write-downs recognised in the income statement 0 0
Cost of sales recognised in the income statement 19,970 9,351
19 Trade receivables
Receivables fall due for payment less than one year after the
close of the financial year.
In 2006, DONG Energy recognised a DKK 327 million (2005: in-
come of DKK 4 million) adjustment of provisions for anticipated
losses in the income statement. Provision for anticipated loss at
31 December 2006 amounted to DKK 406 million (31 December
2005: DKK 79 million).
The carrying amount of receivables is estimated to correspond
to the fair value.
20 Other receivables
DKK million 2006 2005
Fair value of derivative financial instruments 15,312 2,141
Receivables in respect of sale of activities 1,559 101
Deposits 126 141
Receivables, other 4,058 868
Other receivables at 31 December 21,055 3,251
Apart from the fair values of derivative financial instruments
and deposits, receivables fall due for payment less than one
year after the close of the financial year. The carrying amount of
receivables is estimated to correspond to the fair value.
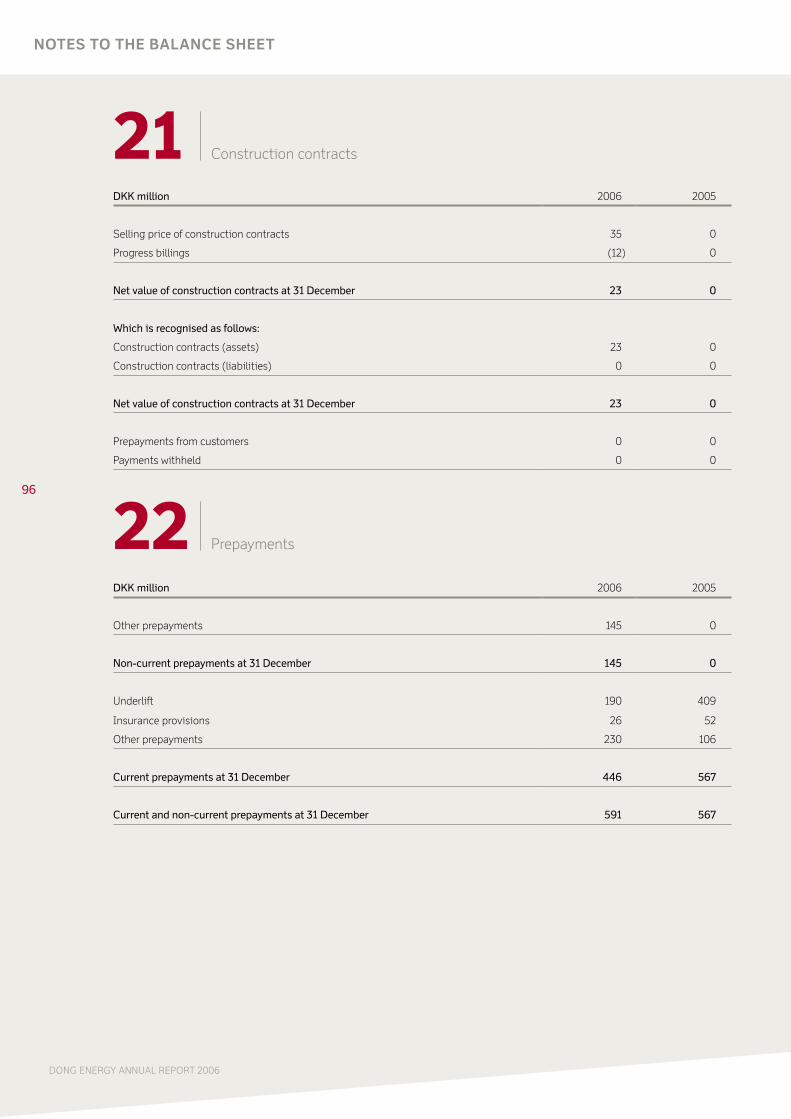
96
DONG ENERGY ANNUAL REPORT 2006
NOTES TO THE BALANCE SHEET
21 Construction contracts
DKK million 2006 2005
Selling price of construction contracts 35 0
Progress billings (12) 0
Net value of construction contracts at 31 December 23 0
Which is recognised as follows:
Construction contracts (assets) 23 0
Construction contracts (liabilities) 0 0
Net value of construction contracts at 31 December 23 0
Prepayments from customers 0 0
Payments withheld 0 0
22 Prepayments
DKK million 2006 2005
Other prepayments 145 0
Non-current prepayments at 31 December 145 0
Underlift 190 409
Insurance provisions 26 52
Other prepayments 230 106
Current prepayments at 31 December 446 567
Current and non-current prepayments at 31 December 591 567

97
23 Assets classified as held for sale
In connection with the merger of the energy companies DONG
Energy A/S (formerly DONG A/S), Energi E2 A/S, DONG Energy
Power A/S (formerly Elsam A/S), DONG Energy Sales & Dis-
tribution A/S (formerly Nesa A/S) and the electricity activities
of the City of Copenhagen and Frederiksberg Municipality, the
Group’s strategy has been updated. As a consequence of the
strategy work, the Group has decided to dispose of the Spanish
and Greek wind power activities. It has not been deemed neces-
sary to write down the assets. An agreement on sale of the
Spanish and Greek wind power assets has yet to be made. The
assets are included in the segment Generation.
As a consequence of its acquisition of DONG Energy Sales &
Distribution A/S, DONG Energy must sell DONG Energy Nord
Elnet A/S’s (formerly Nesa Net A/S) 132 kV transmission net-
work in North Zealand to Energinet.dk. The sales process has
yet to be completed. It has not been deemed necessary to write
down the assets. The activities are included in the segment
Distribution.
The Group has sold Energi E2 A/S’s former head office property
at Teglholmen in Copenhagen. The sale was completed on 1
January 2007. The property is included in the segment Genera-
tion.
Assets classified as held for sale comprise:
DKK million 2006 2005
Intangible assets 802 0
Property, plant and equipment 6,642 33
Other non-current assets 74 0
Non-current assets 7,518 33
Current assets 884 0
Assets classified as held for sale at 31 December 8,402 33
Non-current liabilities 2,229 0
Current liabilities 742 0
Liabilities relating to assets classified as held for sale at 31 December 2,971 0

98
DONG ENERGY ANNUAL REPORT 2006
NOTES TO THE BALANCE SHEET
24 Equity
DKK million 2006 2005 2004 2003 2002
Share capital at beginning of year 2,144 2,144 2,144 2,144 2,144
Capital increase by way of non-cash contributions 793 0 0 0 0
Share capital at 31 December 2,937 2,144 2,144 2,144 2,144
The company’s share capital is DKK 2,937 million, divided into shares of DKK 1,000.
The shares are fully paid up.
Hybrid capital
Hybrid capital of DKK 8,154 million comprises the EUR bonds
(hybrid capital) issued in the European capital market in June
2005. The principal amounts to EUR 1.1 billion and the loan is
subject to a number of special terms. The purpose of the issue
was to strengthen DONG Energy A/S’s capital base and to fund
DONG Energy’s CAPEX and acquisitions.
The bonds rank as subordinated debt and have a maturity of
1,000 years. The coupon for the first ten years is fixed at 5.5%
p.a., following which it becomes floating with a step-up added.
DONG Energy A/S can omit or postpone interest payments
to the bond holders. However, deferred interest payments will
fall due for payment in the event of DONG Energy A/S making
any distributions to its shareholders. The proceeds from the
issuing of hybrid capital amounted to DKK 8,111 million (EUR
1.1 billion).
Because of the special characteristics of the bond loan, it is ac-
counted for as equity pursuant to IAS 32, as DONG Energy A/S
is not under obligation to pay interest to the bond holders.

99
25 Deferred tax
DKK million 2006 2005
Deferred tax at 1 January 3.231 3.089
Foreign exchange adjustments (27) 10
Addition on acquisition of subsidiary 3.045 49
Disposal on sale of subsidiary (353) 0
Deferred tax for the year recognised in profit for the year (190) 364
Deferred tax for the year recognised in equity 20 0
Prior year adjustments (2) 19
Prior year adjustments recognised in equity 0 (112)
Effect of reduction of Danish corporate income tax rate from 30% to 28% 0 (188)
Transfer to assets classified as held for sale (1,094) 0
Deferred tax at 31 December 4,630 3,231
Deferred tax is recognised in the balance sheet as follows:
Deferred tax (assets) 36 6
Deferred tax (liabilities) 4,666 3,237
Deferred tax at 31 December, net 4,630 3,231
Deferred tax relates to:
Intangible assets 448 169
Property, plant and equipment 5,990 3,512
Other non-current assets (16) 101
Current assets (40) 140
Non-current liabilities (1,477) (688)
Current liabilities (432) (85)
Retaxation 249 88
Tax loss carryforwards (92) (6)
Deferred tax at 31 December 4,630 3,231
Deferred tax assets that are not recognised in the balance sheet relate to:
Temporary differences 1,391 1,394
Tax loss carryforwards 6,337 6,112
Deferred tax assets at 31 December 7,728 7,506
Deferred tax liabilities that are not recognised in the balance sheet relate to:
Temporary differences relating to investments in subsidiaries and associates 680 263
Unrecognised deferred tax assets relate primarily to unutilised
losses in the hydrocarbon income. Utilisation of the losses within
the foreseeable future is considered unlikely.

100
DONG ENERGY ANNUAL REPORT 2006
25 Deferred tax (continued)
Changes in temporary differences during the year:
2006
DKK million
Balance sheet
at 1 January
Foreign ex-
change adjust-ments
Disposal on sale
of subsi-diary
Addition on ac-
quisition of enter-
prises
Recog-nised in profit for the year
Trans-fers to assets
clas-sified as held for
sale
Recog-nised in
equity
Balance sheet at
31 Decem-
ber
Intangible assets 169 (1) 0 301 (14) (7) 0 448
Property, plant and equip-ment 3,512 (33) (372) 3,690 315 (1,122) 0 5,990
Other non-current assets 101 (2) 0 (243) 128 0 0 (16)
Current assets 140 (3) 0 775 (953) 1 0 (40)
Non-current liabilities (688) 11 19 (653) (166) 0 0 (1,477)
Current liabilities (85) 0 0 (244) (123) 0 20 (432)
Retaxation 88 0 0 0 161 0 0 249
Tax loss carryforwards (6) 1 0 (581) 460 34 0 (92)
3,231 (27) (353) 3,045 (192) (1,094) 20 4,630
2005
DKK million
Balance sheet at 1
January
Foreign exchange
adjust-ments
Addition on acqui-
sition of enterprises
Recog-nised in profit for the year1
Recog-nised in equity1
Balance sheet at 31 December
Intangible assets (23) 0 49 143 0 169
Property, plant and equipment 3,398 19 0 66 29 3,512
Other non-current assets 241 0 0 (9) (131) 101
Current assets 40 1 0 99 0 140
Non-current liabilities (550) (10) 0 (118) (10) (688)
Current liabilities (105) 0 0 20 0 (85)
Retaxation 88 0 0 0 0 88
Tax loss carryforwards 0 0 0 (6) 0 (6)
3,089 10 49 195 (112) 3,231
1 Including the effect of the reduction of the Danish corporate
income tax rate from 30% to 28%.
NOTES TO THE BALANCE SHEET

101
26 Pensions
DKK million 2006 2005
Development in present value of obligations relating to defined benefit plans:
Present value of obligations at 1 January 15 18
Calculated interest relating to obligation 1 (1)
Actuarial gains (losses) (2) (2)
Paid during year (53) (4)
Addition on acquisition of subsidiary 79 0
Current service cost 2 4
Present value of obligations at 31 December 42 15
Pension obligations recognised in the income statement:
Current service cost (2) (4)
Calculated interest relating to obligation (1) 1
Total recognised for defined benefit plans (3) (3)
Total recognised for defined contribution plans (136) (50)
Recognised in the income statement (139) (53)
The cost is recognised in the following items in the income statement:
Production costs (137) (54)
Management and administration (1) 0
Sales and marketing 0 0
Financial income and financial expenses (1) 1
Recognised in the income statement (139) (53)
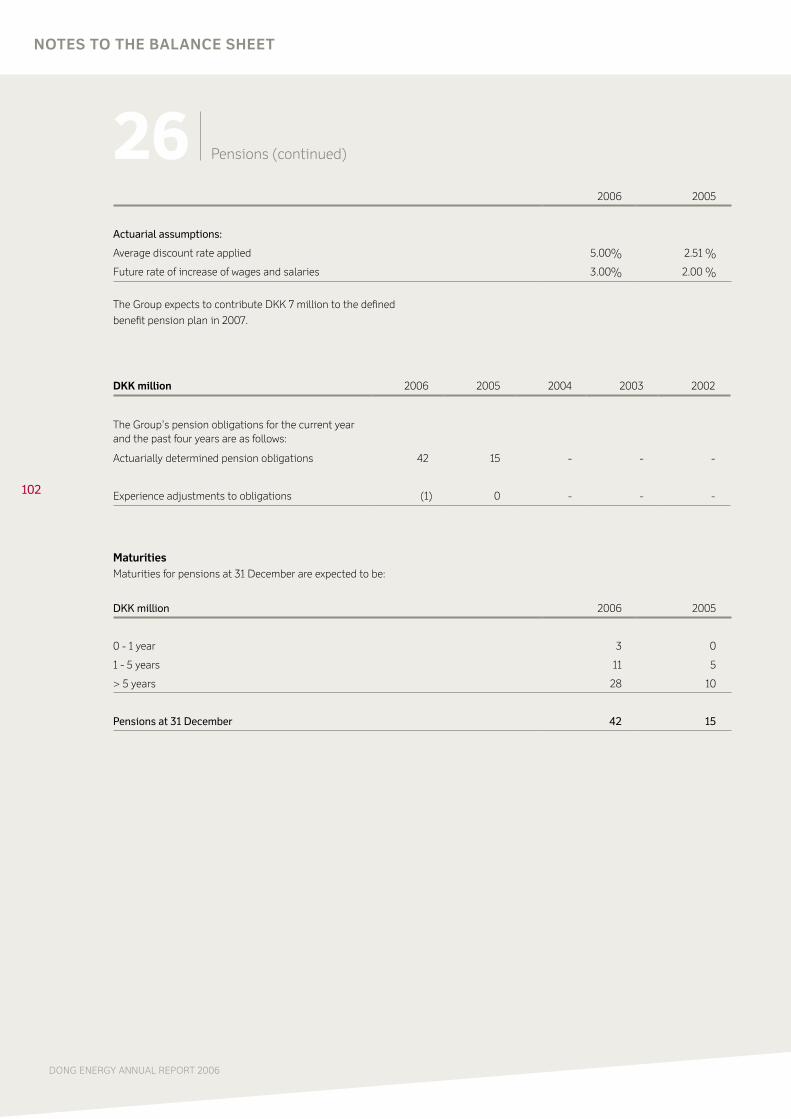
102
DONG ENERGY ANNUAL REPORT 2006
NOTES TO THE BALANCE SHEET
26 Pensions (continued)
2006 2005
Actuarial assumptions:
Average discount rate applied 5.00% 2.51 %
Future rate of increase of wages and salaries 3.00% 2.00 %
The Group expects to contribute DKK 7 million to the defined
benefit pension plan in 2007.
DKK million 2006 2005 2004 2003 2002
The Group’s pension obligations for the current year and the past four years are as follows:
Actuarially determined pension obligations 42 15 - - -
Experience adjustments to obligations (1) 0 - - -
MaturitiesMaturities for pensions at 31 December are expected to be:
DKK million 2006 2005
0 - 1 year 3 0
1 - 5 years 11 5
> 5 years 28 10
Pensions at 31 December 42 15
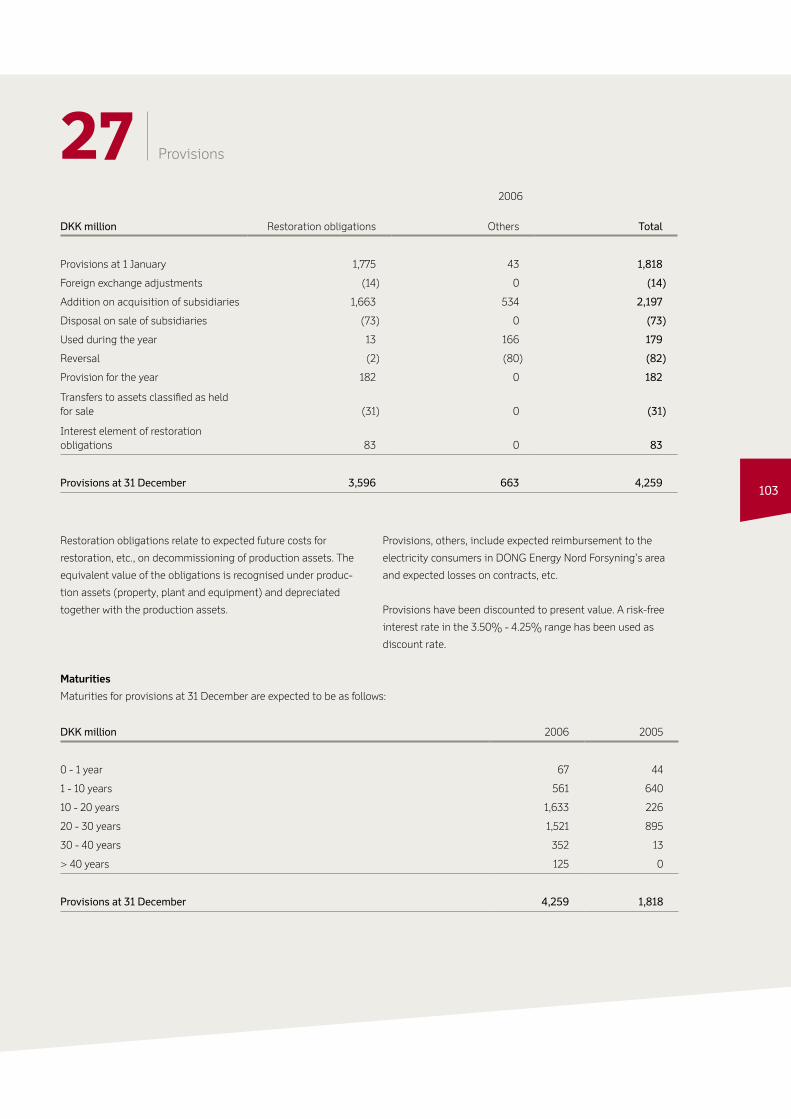
103
27 Provisions
2006
DKK million Restoration obligations Others Total
Provisions at 1 January 1,775 43 1,818
Foreign exchange adjustments (14) 0 (14)
Addition on acquisition of subsidiaries 1,663 534 2,197
Disposal on sale of subsidiaries (73) 0 (73)
Used during the year 13 166 179
Reversal (2) (80) (82)
Provision for the year 182 0 182
Transfers to assets classified as held for sale (31) 0 (31)
Interest element of restoration obligations 83 0 83
Provisions at 31 December 3,596 663 4,259
Restoration obligations relate to expected future costs for
restoration, etc., on decommissioning of production assets. The
equivalent value of the obligations is recognised under produc-
tion assets (property, plant and equipment) and depreciated
together with the production assets.
Provisions, others, include expected reimbursement to the
electricity consumers in DONG Energy Nord Forsyning’s area
and expected losses on contracts, etc.
Provisions have been discounted to present value. A risk-free
interest rate in the 3.50% - 4.25% range has been used as
discount rate.
Maturities
Maturities for provisions at 31 December are expected to be as follows:
DKK million 2006 2005
0 - 1 year 67 44
1 - 10 years 561 640
10 - 20 years 1,633 226
20 - 30 years 1,521 895
30 - 40 years 352 13
> 40 years 125 0
Provisions at 31 December 4,259 1,818

104
DONG ENERGY ANNUAL REPORT 2006
NOTES TO THE BALANCE SHEET
28 Current and non-current loans
The Group’s current and non-current loans can be broken down as follows:
DKK million 2006 2005
Bond loans 7,938 3,735
Mortgage loans 1,810 583
Bank loans 5,359 2,137
Other non-current financial liabilities 6,961 3
Non-current loans at 31 December 22,068 6,458
Bond loans 1,995 0
Mortgage loans 11 39
Bank loans 2,902 654
Current loans at 31 December 4,908 693
Current and non-current loans at 31 December 26,976 7,151
Fair value 27,061 7,375
Nominal value 26,894 7,153
Maturity
Expected maturity of current and non-current loans:
DKK million 2006 2005
0 - 1 year 4,908 693
1 - 5 years 13,940 1,063
> 5 years 8,128 5,395
Current and non-current loans at 31 December 26,976 7,151
The fair value has been determined as the present value of
expected future instalments and interest payments.
The Group’s financing agreements are not subject to any
unusual terms and conditions.

105
28 Current and non-current loans (continued)
Finance leases
Liabilities relating to assets held under finance leases are thus
recognised under bank loans:
2006 2005
DKK millionMinimum lea-
se paymentsInterest element Present value
Minimum lea-se payments
Interest element Present value
0 - 1 year 9 1 8 0 0 0
1 - 5 years 47 6 41 0 0 0
> 5 years 98 25 73 0 0 0
154 32 122 0 0 0
Carrying amount at31 December 120 0
The fair value has been estimated as the present value of future
cash flows at a market rate for corresponding leases.
There is no contingent rent under the leases.
Further details of the Group’s leases are given in note 16.
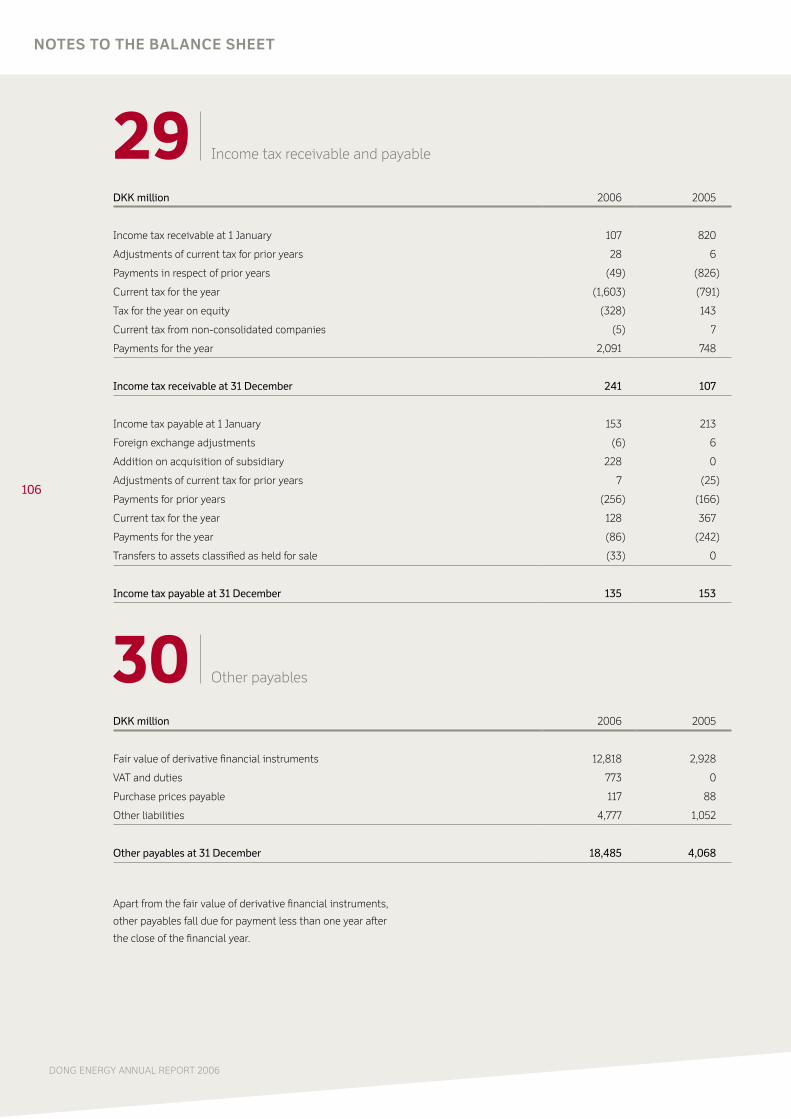
106
DONG ENERGY ANNUAL REPORT 2006
29 Income tax receivable and payable
DKK million 2006 2005
Income tax receivable at 1 January 107 820
Adjustments of current tax for prior years 28 6
Payments in respect of prior years (49) (826)
Current tax for the year (1,603) (791)
Tax for the year on equity (328) 143
Current tax from non-consolidated companies (5) 7
Payments for the year 2,091 748
Income tax receivable at 31 December 241 107
Income tax payable at 1 January 153 213
Foreign exchange adjustments (6) 6
Addition on acquisition of subsidiary 228 0
Adjustments of current tax for prior years 7 (25)
Payments for prior years (256) (166)
Current tax for the year 128 367
Payments for the year (86) (242)
Transfers to assets classified as held for sale (33) 0
Income tax payable at 31 December 135 153
30 Other payables
DKK million 2006 2005
Fair value of derivative financial instruments 12,818 2,928
VAT and duties 773 0
Purchase prices payable 117 88
Other liabilities 4,777 1,052
Other payables at 31 December 18,485 4,068
Apart from the fair value of derivative financial instruments,
other payables fall due for payment less than one year after
the close of the financial year.
NOTES TO THE BALANCE SHEET

107
31 Deferred income
Deferred income comprises government grants received and the
value of gas received free of charge, etc. These amounts are
recognised as income over a number of years.
Deferred income can be broken down as follows:
DKK million 2006 2005
Other deferred income 732 0
Non-current deferred income at 31 December 732 0
Value of gas received free of charge 148 76
Prepayments 0 65
Government grants received 72 0
Other deferred income 278 145
Current deferred income at 31 December 498 286
Current and non-current deferred income at 31 December 1,230 286

108
DONG ENERGY ANNUAL REPORT 2006
32 Cash flows from operations (operating activities)
DKK million 2006 2005
Operating profit 5,534 4,099
Depreciation, amortisation and impairment losses 3,259 2,215
Operating profit before depreciation and amortisation (EBITDA) 8,793 6,314
Other restatements 877 (231)
Cash flows from operations (operating activities) before changes in working capital 9,670 6,083
Change in inventories (559) (229)
Change in trade receivables (111) (764)
Change in other receivables (608) 24
Change in trade payables (1,115) 1,336
Change in other payables 3,680 192
Change in working capital 1,287 559
Cash flows from operations (operating activities) 10,957 6,642
Cash flows from exploration activities amounted to
DKK (179) million (2005: DKK (284) million).
NOTES TO THE CASH FLOw STATEMENT
Acquisition of subsidiaries in 2006
In 2006, DONG Energy acquired a number of significant sub-
sidiaries, all of which have been accounted for in accordance
with the purchase method. There are various cross-ownerships
among the acquired companies that have been adjusted in the
overviews below so that the information is presented by com-
pany group. Acquisitions of subsidiaries in 2006 are also shown
by acquisition date, as the acquisitions were implemented
through interdependent negotiations, agreements, etc.
Companies acquired in 2006 and adjustments of cost for com-
panies acquired in prior years are as follows:
33 Acquisition of subsidiaries
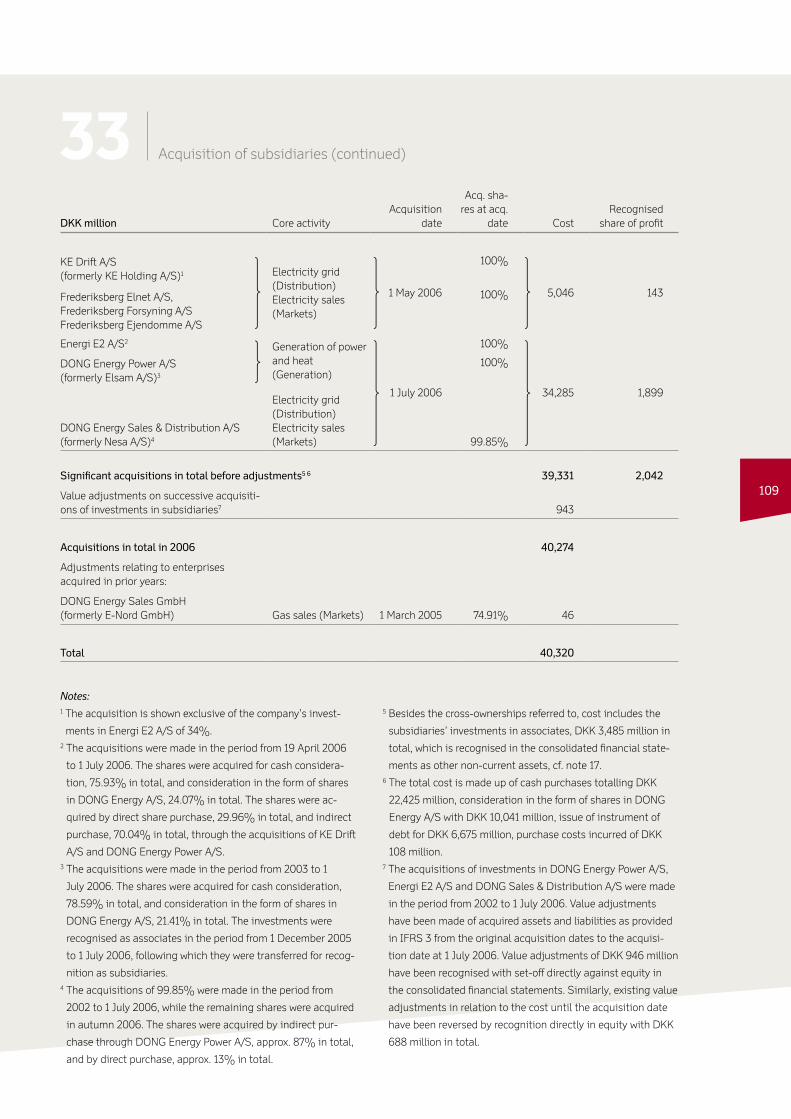
109
33 Acquisition of subsidiaries (continued)
DKK million Core activityAcquisition
date
Acq. sha-res at acq.
date CostRecognised
share of profit
KE Drift A/S (formerly KE Holding A/S)1 Electricity grid
(Distribution)Electricity sales (Markets)
1 May 2006
100%
5,046 143Frederiksberg Elnet A/S, Frederiksberg Forsyning A/SFrederiksberg Ejendomme A/S
100%
Energi E2 A/S2Generation of power and heat (Generation)
1 July 2006
100%
34,285 1,899
DONG Energy Power A/S (formerly Elsam A/S)3
100%
DONG Energy Sales & Distribution A/S (formerly Nesa A/S)4
Electricity grid(Distribution)Electricity sales (Markets) 99.85%
Significant acquisitions in total before adjustments5 6 39,331 2,042
Value adjustments on successive acquisiti-ons of investments in subsidiaries7 943
Acquisitions in total in 2006 40,274
Adjustments relating to enterprises acquired in prior years:
DONG Energy Sales GmbH(formerly E-Nord GmbH) Gas sales (Markets) 1 March 2005 74.91% 46
Total 40,320
Notes:1 The acquisition is shown exclusive of the company’s invest-
ments in Energi E2 A/S of 34%.2 The acquisitions were made in the period from 19 April 2006
to 1 July 2006. The shares were acquired for cash considera-
tion, 75.93% in total, and consideration in the form of shares
in DONG Energy A/S, 24.07% in total. The shares were ac-
quired by direct share purchase, 29.96% in total, and indirect
purchase, 70.04% in total, through the acquisitions of KE Drift
A/S and DONG Energy Power A/S.3 The acquisitions were made in the period from 2003 to 1
July 2006. The shares were acquired for cash consideration,
78.59% in total, and consideration in the form of shares in
DONG Energy A/S, 21.41% in total. The investments were
recognised as associates in the period from 1 December 2005
to 1 July 2006, following which they were transferred for recog-
nition as subsidiaries.4 The acquisitions of 99.85% were made in the period from
2002 to 1 July 2006, while the remaining shares were acquired
in autumn 2006. The shares were acquired by indirect pur-
chase through DONG Energy Power A/S, approx. 87% in total,
and by direct purchase, approx. 13% in total.
5 Besides the cross-ownerships referred to, cost includes the
subsidiaries’ investments in associates, DKK 3,485 million in
total, which is recognised in the consolidated financial state-
ments as other non-current assets, cf. note 17.6 The total cost is made up of cash purchases totalling DKK
22,425 million, consideration in the form of shares in DONG
Energy A/S with DKK 10,041 million, issue of instrument of
debt for DKK 6,675 million, purchase costs incurred of DKK
108 million. 7 The acquisitions of investments in DONG Energy Power A/S,
Energi E2 A/S and DONG Sales & Distribution A/S were made
in the period from 2002 to 1 July 2006. Value adjustments
have been made of acquired assets and liabilities as provided
in IFRS 3 from the original acquisition dates to the acquisi-
tion date at 1 July 2006. Value adjustments of DKK 946 million
have been recognised with set-off directly against equity in
the consolidated financial statements. Similarly, existing value
adjustments in relation to the cost until the acquisition date
have been reversed by recognition directly in equity with DKK
688 million in total.
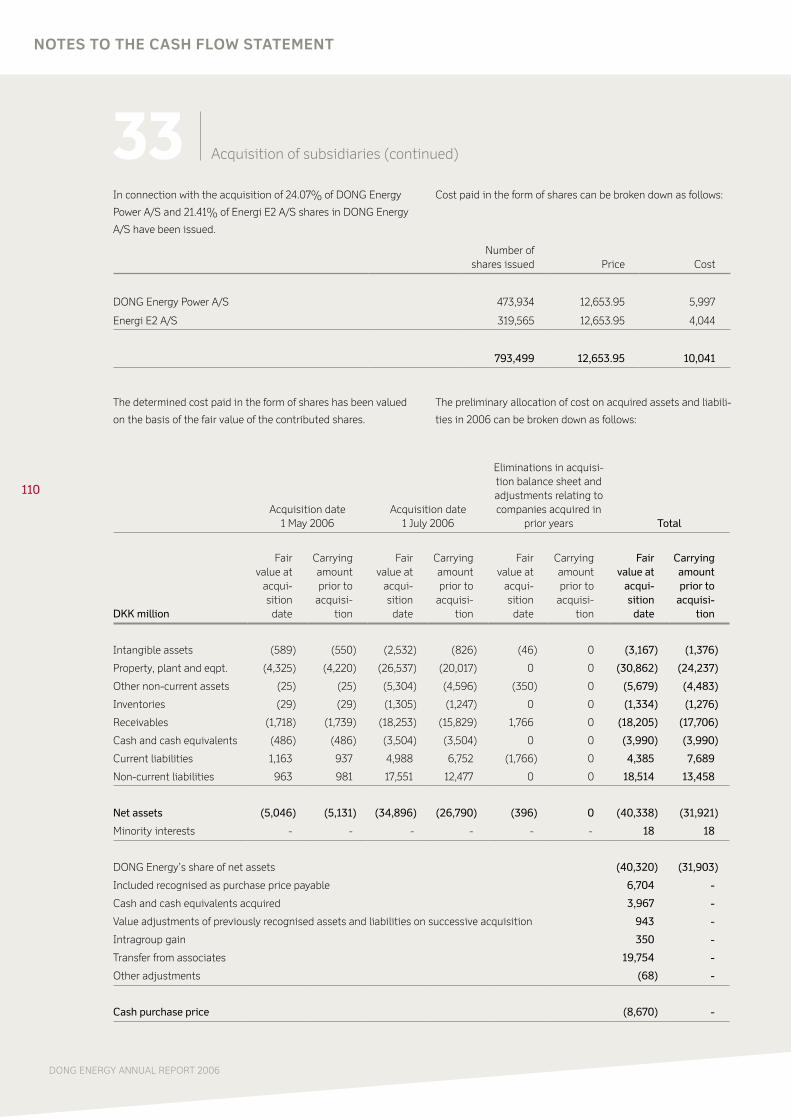
110
DONG ENERGY ANNUAL REPORT 2006
NOTES TO THE CASH FLOw STATEMENT
Number of shares issued Price Cost
DONG Energy Power A/S 473,934 12,653.95 5,997
Energi E2 A/S 319,565 12,653.95 4,044
793,499 12,653.95 10,041
33 Acquisition of subsidiaries (continued)
In connection with the acquisition of 24.07% of DONG Energy
Power A/S and 21.41% of Energi E2 A/S shares in DONG Energy
A/S have been issued.
Cost paid in the form of shares can be broken down as follows:
The determined cost paid in the form of shares has been valued
on the basis of the fair value of the contributed shares.
The preliminary allocation of cost on acquired assets and liabili-
ties in 2006 can be broken down as follows:
Acquisition date 1 May 2006
Acquisition date 1 July 2006
Eliminations in acquisi-tion balance sheet and adjustments relating to companies acquired in
prior years Total
DKK million
Fair value at
acqui- sition
date
Carrying amount prior to
acquisi-tion
Fair value at
acqui- sition
date
Carrying amount prior to
acquisi-tion
Fair value at
acqui- sition
date
Carrying amount prior to
acquisi-tion
Fair value at
acqui- sition
date
Carrying amount prior to
acquisi-tion
Intangible assets (589) (550) (2,532) (826) (46) 0 (3,167) (1,376)
Property, plant and eqpt. (4,325) (4,220) (26,537) (20,017) 0 0 (30,862) (24,237)
Other non-current assets (25) (25) (5,304) (4,596) (350) 0 (5,679) (4,483)
Inventories (29) (29) (1,305) (1,247) 0 0 (1,334) (1,276)
Receivables (1,718) (1,739) (18,253) (15,829) 1,766 0 (18,205) (17,706)
Cash and cash equivalents (486) (486) (3,504) (3,504) 0 0 (3,990) (3,990)
Current liabilities 1,163 937 4,988 6,752 (1,766) 0 4,385 7,689
Non-current liabilities 963 981 17,551 12,477 0 0 18,514 13,458
Net assets (5,046) (5,131) (34,896) (26,790) (396) 0 (40,338) (31,921)
Minority interests - - - - - - 18 18
DONG Energy’s share of net assets (40,320) (31,903)
Included recognised as purchase price payable 6,704 -
Cash and cash equivalents acquired 3,967 -
Value adjustments of previously recognised assets and liabilities on successive acquisition 943 -
Intragroup gain 350 -
Transfer from associates 19,754 -
Other adjustments (68) -
Cash purchase price (8,670) -
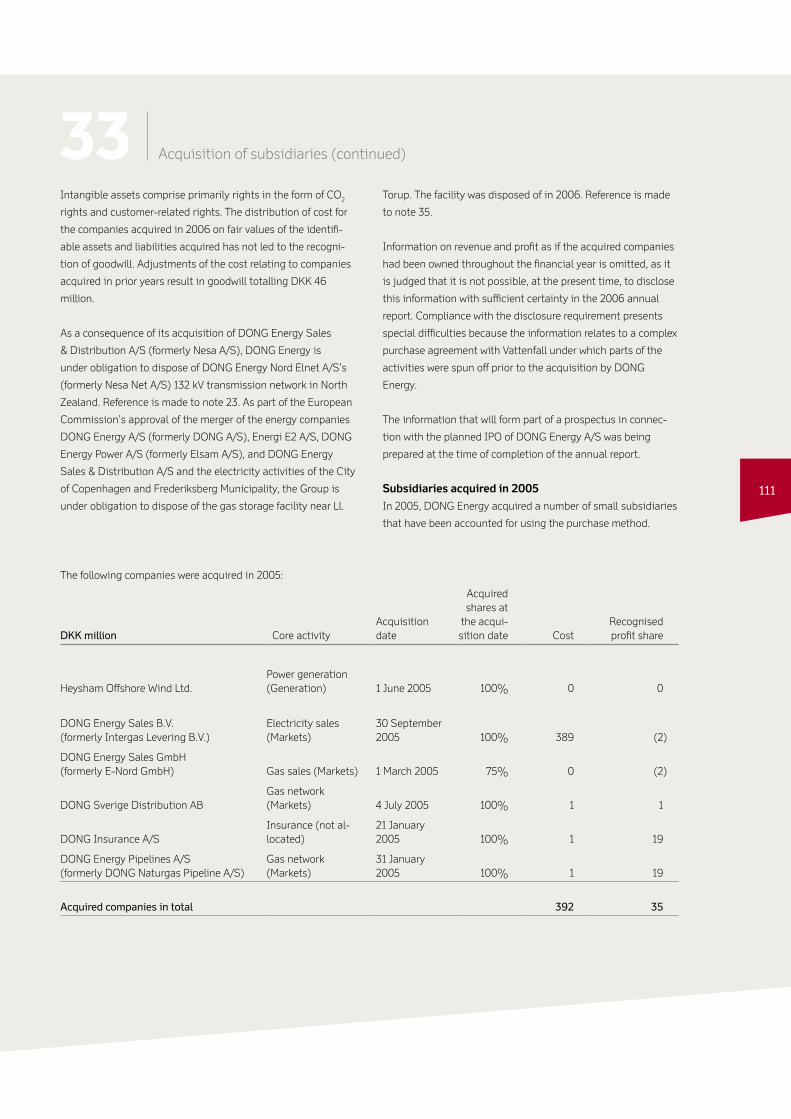
111
33 Acquisition of subsidiaries (continued)
Intangible assets comprise primarily rights in the form of CO2
rights and customer-related rights. The distribution of cost for
the companies acquired in 2006 on fair values of the identifi-
able assets and liabilities acquired has not led to the recogni-
tion of goodwill. Adjustments of the cost relating to companies
acquired in prior years result in goodwill totalling DKK 46
million.
As a consequence of its acquisition of DONG Energy Sales
& Distribution A/S (formerly Nesa A/S), DONG Energy is
under obligation to dispose of DONG Energy Nord Elnet A/S’s
(formerly Nesa Net A/S) 132 kV transmission network in North
Zealand. Reference is made to note 23. As part of the European
Commission’s approval of the merger of the energy companies
DONG Energy A/S (formerly DONG A/S), Energi E2 A/S, DONG
Energy Power A/S (formerly Elsam A/S), and DONG Energy
Sales & Distribution A/S and the electricity activities of the City
of Copenhagen and Frederiksberg Municipality, the Group is
under obligation to dispose of the gas storage facility near Ll.
Torup. The facility was disposed of in 2006. Reference is made
to note 35.
Information on revenue and profit as if the acquired companies
had been owned throughout the financial year is omitted, as it
is judged that it is not possible, at the present time, to disclose
this information with sufficient certainty in the 2006 annual
report. Compliance with the disclosure requirement presents
special difficulties because the information relates to a complex
purchase agreement with Vattenfall under which parts of the
activities were spun off prior to the acquisition by DONG
Energy.
The information that will form part of a prospectus in connec-
tion with the planned IPO of DONG Energy A/S was being
prepared at the time of completion of the annual report.
Subsidiaries acquired in 2005
In 2005, DONG Energy acquired a number of small subsidiaries
that have been accounted for using the purchase method.
The following companies were acquired in 2005:
DKK million Core activityAcquisition date
Acquired shares at
the acqui-sition date Cost
Recognised profit share
Heysham Offshore Wind Ltd.Power generation (Generation) 1 June 2005 100% 0 0
DONG Energy Sales B.V. (formerly Intergas Levering B.V.)
Electricity sales (Markets)
30 September 2005 100% 389 (2)
DONG Energy Sales GmbH (formerly E-Nord GmbH) Gas sales (Markets) 1 March 2005 75% 0 (2)
DONG Sverige Distribution ABGas network (Markets) 4 July 2005 100% 1 1
DONG Insurance A/SInsurance (not al-located)
21 January 2005 100% 1 19
DONG Energy Pipelines A/S(formerly DONG Naturgas Pipeline A/S)
Gas network (Markets)
31 January 2005 100% 1 19
Acquired companies in total 392 35
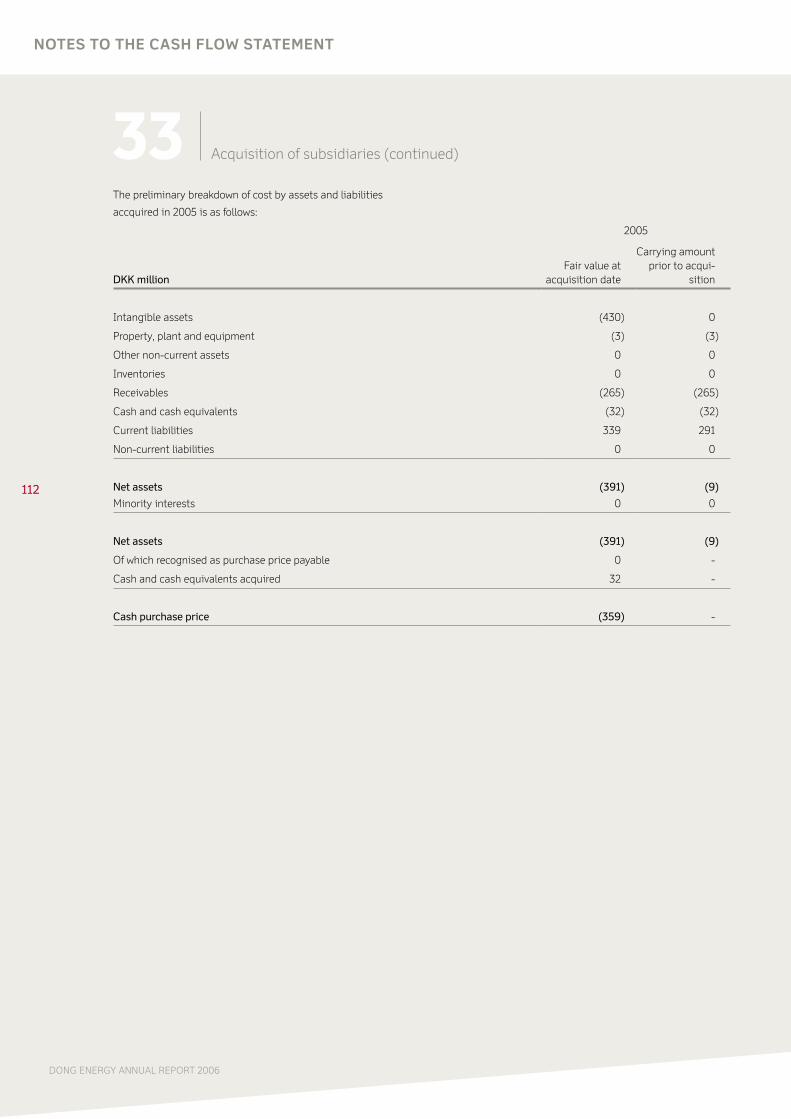
112
DONG ENERGY ANNUAL REPORT 2006
NOTES TO THE CASH FLOw STATEMENT
The preliminary breakdown of cost by assets and liabilities
accquired in 2005 is as follows:
2005
DKK millionFair value at
acquisition date
Carrying amount prior to acqui-
sition
Intangible assets (430) 0
Property, plant and equipment (3) (3)
Other non-current assets 0 0
Inventories 0 0
Receivables (265) (265)
Cash and cash equivalents (32) (32)
Current liabilities 339 291
Non-current liabilities 0 0
Net assets (391) (9)
Minority interests 0 0
Net assets (391) (9)
Of which recognised as purchase price payable 0 -
Cash and cash equivalents acquired 32 -
Cash purchase price (359) -
33 Acquisition of subsidiaries (continued)
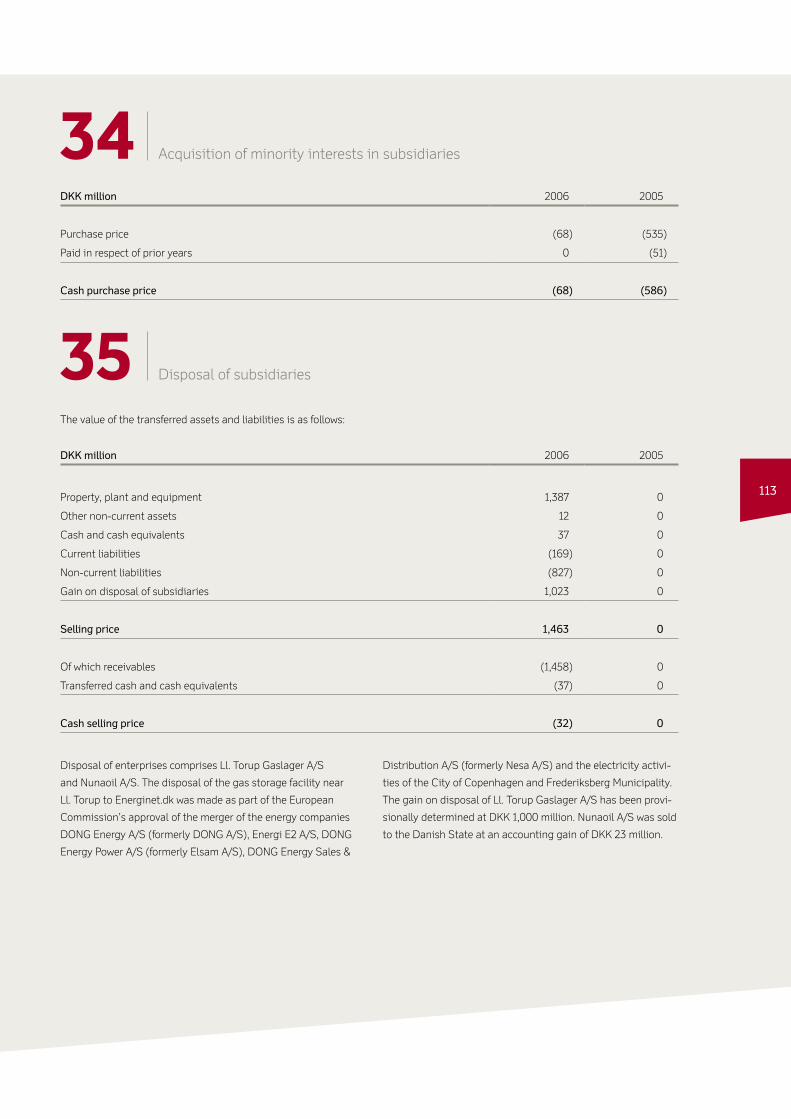
113
34 Acquisition of minority interests in subsidiaries
DKK million 2006 2005
Purchase price (68) (535)
Paid in respect of prior years 0 (51)
Cash purchase price (68) (586)
35 Disposal of subsidiaries
The value of the transferred assets and liabilities is as follows:
DKK million 2006 2005
Property, plant and equipment 1,387 0
Other non-current assets 12 0
Cash and cash equivalents 37 0
Current liabilities (169) 0
Non-current liabilities (827) 0
Gain on disposal of subsidiaries 1,023 0
Selling price 1,463 0
Of which receivables (1,458) 0
Transferred cash and cash equivalents (37) 0
Cash selling price (32) 0
Disposal of enterprises comprises Ll. Torup Gaslager A/S
and Nunaoil A/S. The disposal of the gas storage facility near
Ll. Torup to Energinet.dk was made as part of the European
Commission’s approval of the merger of the energy companies
DONG Energy A/S (formerly DONG A/S), Energi E2 A/S, DONG
Energy Power A/S (formerly Elsam A/S), DONG Energy Sales &
Distribution A/S (formerly Nesa A/S) and the electricity activi-
ties of the City of Copenhagen and Frederiksberg Municipality.
The gain on disposal of Ll. Torup Gaslager A/S has been provi-
sionally determined at DKK 1,000 million. Nunaoil A/S was sold
to the Danish State at an accounting gain of DKK 23 million.
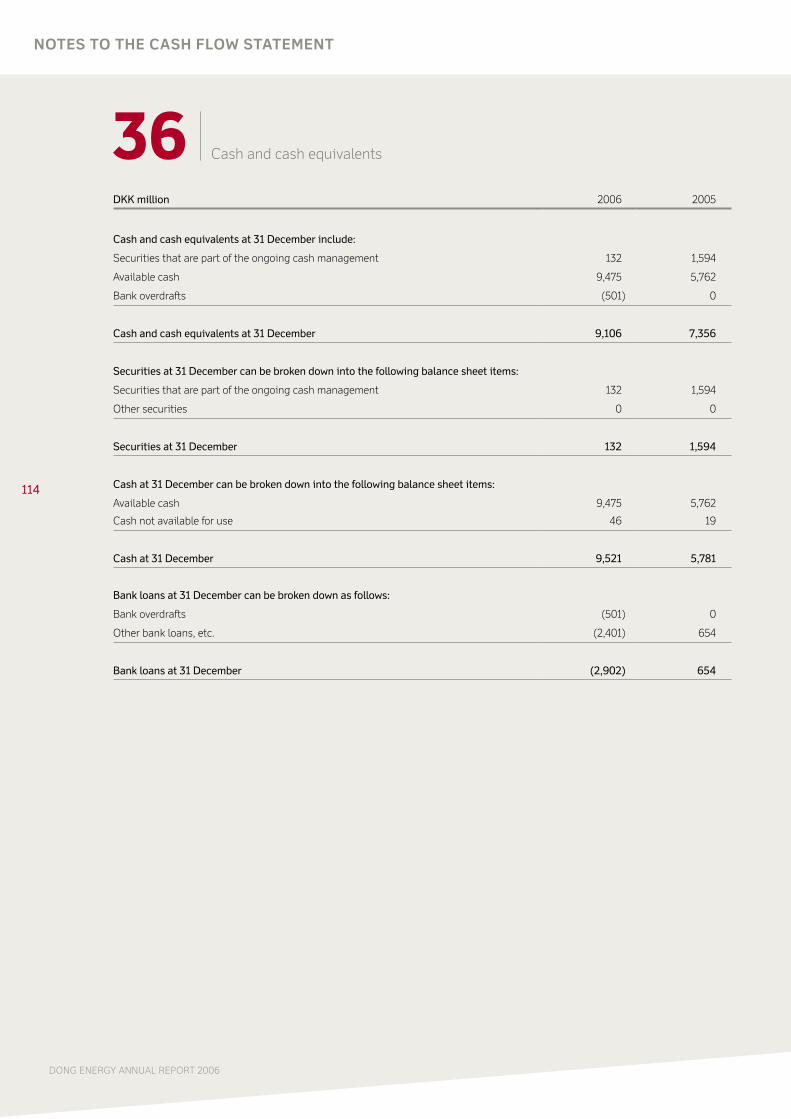
114
DONG ENERGY ANNUAL REPORT 2006
NOTES TO THE CASH FLOw STATEMENT
36 Cash and cash equivalents
DKK million 2006 2005
Cash and cash equivalents at 31 December include:
Securities that are part of the ongoing cash management 132 1,594
Available cash 9,475 5,762
Bank overdrafts (501) 0
Cash and cash equivalents at 31 December 9,106 7,356
Securities at 31 December can be broken down into the following balance sheet items:
Securities that are part of the ongoing cash management 132 1,594
Other securities 0 0
Securities at 31 December 132 1,594
Cash at 31 December can be broken down into the following balance sheet items:
Available cash 9,475 5,762
Cash not available for use 46 19
Cash at 31 December 9,521 5,781
Bank loans at 31 December can be broken down as follows:
Bank overdrafts (501) 0
Other bank loans, etc. (2,401) 654
Bank loans at 31 December (2,902) 654
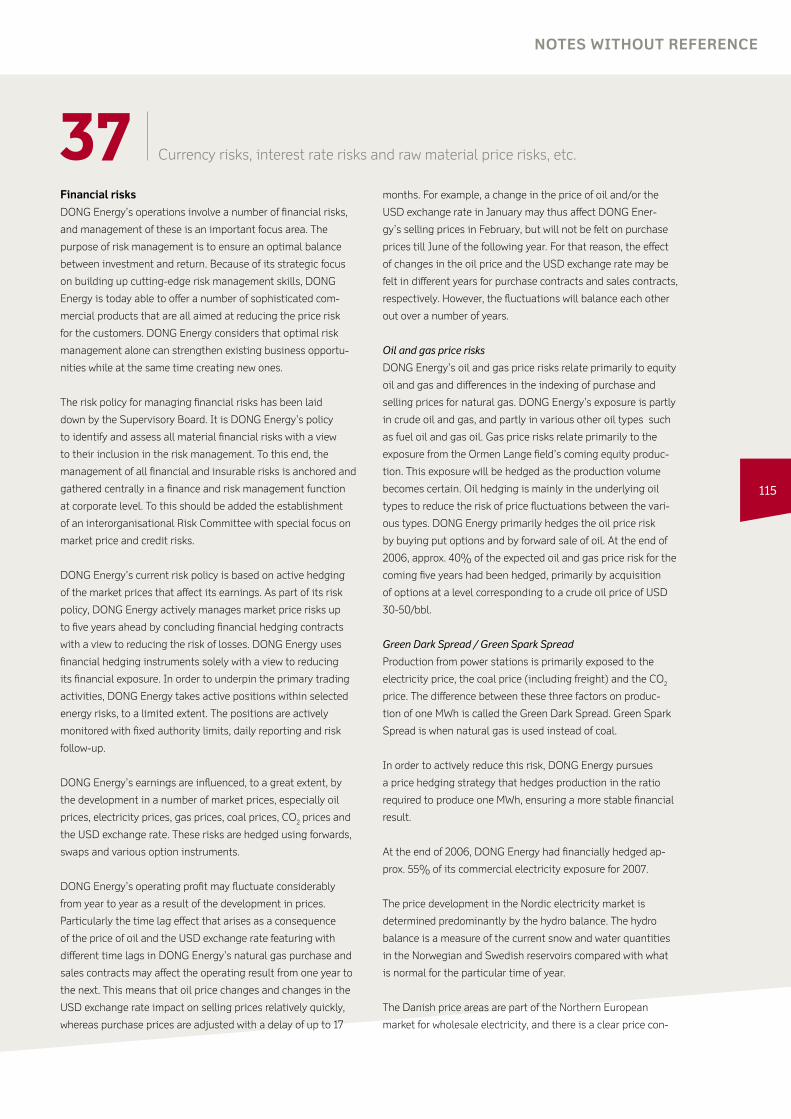
115
37 Currency risks, interest rate risks and raw material price risks, etc.
Financial risks
DONG Energy’s operations involve a number of financial risks,
and management of these is an important focus area. The
purpose of risk management is to ensure an optimal balance
between investment and return. Because of its strategic focus
on building up cutting-edge risk management skills, DONG
Energy is today able to offer a number of sophisticated com-
mercial products that are all aimed at reducing the price risk
for the customers. DONG Energy considers that optimal risk
management alone can strengthen existing business opportu-
nities while at the same time creating new ones.
The risk policy for managing financial risks has been laid
down by the Supervisory Board. It is DONG Energy’s policy
to identify and assess all material financial risks with a view
to their inclusion in the risk management. To this end, the
management of all financial and insurable risks is anchored and
gathered centrally in a finance and risk management function
at corporate level. To this should be added the establishment
of an interorganisational Risk Committee with special focus on
market price and credit risks.
DONG Energy’s current risk policy is based on active hedging
of the market prices that affect its earnings. As part of its risk
policy, DONG Energy actively manages market price risks up
to five years ahead by concluding financial hedging contracts
with a view to reducing the risk of losses. DONG Energy uses
financial hedging instruments solely with a view to reducing
its financial exposure. In order to underpin the primary trading
activities, DONG Energy takes active positions within selected
energy risks, to a limited extent. The positions are actively
monitored with fixed authority limits, daily reporting and risk
follow-up.
DONG Energy’s earnings are influenced, to a great extent, by
the development in a number of market prices, especially oil
prices, electricity prices, gas prices, coal prices, CO2 prices and
the USD exchange rate. These risks are hedged using forwards,
swaps and various option instruments.
DONG Energy’s operating profit may fluctuate considerably
from year to year as a result of the development in prices.
Particularly the time lag effect that arises as a consequence
of the price of oil and the USD exchange rate featuring with
different time lags in DONG Energy’s natural gas purchase and
sales contracts may affect the operating result from one year to
the next. This means that oil price changes and changes in the
USD exchange rate impact on selling prices relatively quickly,
whereas purchase prices are adjusted with a delay of up to 17
months. For example, a change in the price of oil and/or the
USD exchange rate in January may thus affect DONG Ener-
gy’s selling prices in February, but will not be felt on purchase
prices till June of the following year. For that reason, the effect
of changes in the oil price and the USD exchange rate may be
felt in different years for purchase contracts and sales contracts,
respectively. However, the fluctuations will balance each other
out over a number of years.
Oil and gas price risks
DONG Energy’s oil and gas price risks relate primarily to equity
oil and gas and differences in the indexing of purchase and
selling prices for natural gas. DONG Energy’s exposure is partly
in crude oil and gas, and partly in various other oil types such
as fuel oil and gas oil. Gas price risks relate primarily to the
exposure from the Ormen Lange field’s coming equity produc-
tion. This exposure will be hedged as the production volume
becomes certain. Oil hedging is mainly in the underlying oil
types to reduce the risk of price fluctuations between the vari-
ous types. DONG Energy primarily hedges the oil price risk
by buying put options and by forward sale of oil. At the end of
2006, approx. 40% of the expected oil and gas price risk for the
coming five years had been hedged, primarily by acquisition
of options at a level corresponding to a crude oil price of USD
30-50/bbl.
Green Dark Spread / Green Spark Spread
Production from power stations is primarily exposed to the
electricity price, the coal price (including freight) and the CO2
price. The difference between these three factors on produc-
tion of one MWh is called the Green Dark Spread. Green Spark
Spread is when natural gas is used instead of coal.
In order to actively reduce this risk, DONG Energy pursues
a price hedging strategy that hedges production in the ratio
required to produce one MWh, ensuring a more stable financial
result.
At the end of 2006, DONG Energy had financially hedged ap-
prox. 55% of its commercial electricity exposure for 2007.
The price development in the Nordic electricity market is
determined predominantly by the hydro balance. The hydro
balance is a measure of the current snow and water quantities
in the Norwegian and Swedish reservoirs compared with what
is normal for the particular time of year.
The Danish price areas are part of the Northern European
market for wholesale electricity, and there is a clear price con-
NOTES wITHOUT REFERENCE

116
DONG ENERGY ANNUAL REPORT 2006
37 Currency risks, interest rate risks and raw material price risks, etc. (continued)
nection between these markets. There may, however, be major
price differences during individual hours, and in such situations
Denmark becomes a transit area between Germany and the
Nordic countries.
DONG Energy is thus primarily exposed to the development in
electricity prices in the Danish price area, but part of the hedg-
ing of this risk is against other price areas, including system
prices in the Nordic countries.
Currency risks
The main currency risk is still related to USD, although the ex-
posure in NOK and GBP is growing. The USD exchange rate risk
is mainly attributable to the oil price exposure, as oil is settled
in USD; however, the purchase of USD-based coal provides a
considerable natural hedge.
DONG Energy primarily hedges its currency exposure by using
forwards and currency swaps and, to a lesser extent, options. In
accordance with DONG Energy’s policy for currency risks, the
commercial exposure has been considerably reduced for the
coming five years.
Interest rate risks
DONG Energy’s interest rate risks relate primarily to its loan
portfolio, cash and concluded financial hedging contracts.
These risks are managed in relation to DONG Energy’s net
financing requirement and capital structure. To reduce its expo-
sure to increases in interest rates, DONG Energy’s loan portfolio
consists, to some extent, of fixed-rate loans.
At the end of 2006, the net interest rate risk, excluding the
hybrid capital issued, was determined as a DKK 575 million
change in the market value of interest-bearing items in the
event of a one percentage point interest rate increase.
Financing and capital resources
One of the main financial management tasks is to secure suf-
ficient, flexible financial resources in relation to the day-to-day
operations and implementation of DONG Energy’s strategy. To
this end, internal management objectives have been set up for
the extent of the financial resources, taking into account factors
such as DONG Energy’s debt maturity profile.
At the end of 2006, the cash resources consisted of:
cash and cash equivalents, DKK 9.0 billion.
committed operating credit, DKK 17.3 billion
committed undrawn loans, DKK 1.5 billion
To this should be added non-committed operating credit. The
substantial cash resources and the volume of committed credit
facilities are expected to be reduced considerably in 2007.
The Group’s total interest-bearing debt stood at DKK 27.8
billion at the end of 2006 (excluding hybrid capital of DKK 8.2
billion). At the end of 2006, the average remaining term was
approx. 3.5 years (excluding hybrid capital).
With a view to managing DONG Energy’s own credit profile,
new financing is raised by the parent company and then al-
located to the individual segments in the form of intragroup
loans and equity.
DONG Energy has been rated by Moody’s and Standard &
Poor’s. The issuer ratings at the end of 2006 were Baa1 (bond
loan) and Baa3 (hybrid security) Positive Outlook (Moody’s In-
vestor Service) and BBB+ Positive Outlook (Standard & Poor’s).
As part of its financial management, DONG Energy hedges
currency risks, interest rate risks and oil, coal, gas and electric-
ity price risks. Full or partial hedging of recognised assets and
liabilities (hedging of fair value) and of future transactions
(hedging of cash flows) is carried out in accordance with the
framework laid down in the financial risk policy implemented
by DONG Energy. Both derivative financial instruments such as
forwards, swaps and options and, to a limited extent, loans in
foreign currencies, are used to hedge currency risks.
NOTES wITHOUT REFERENCE
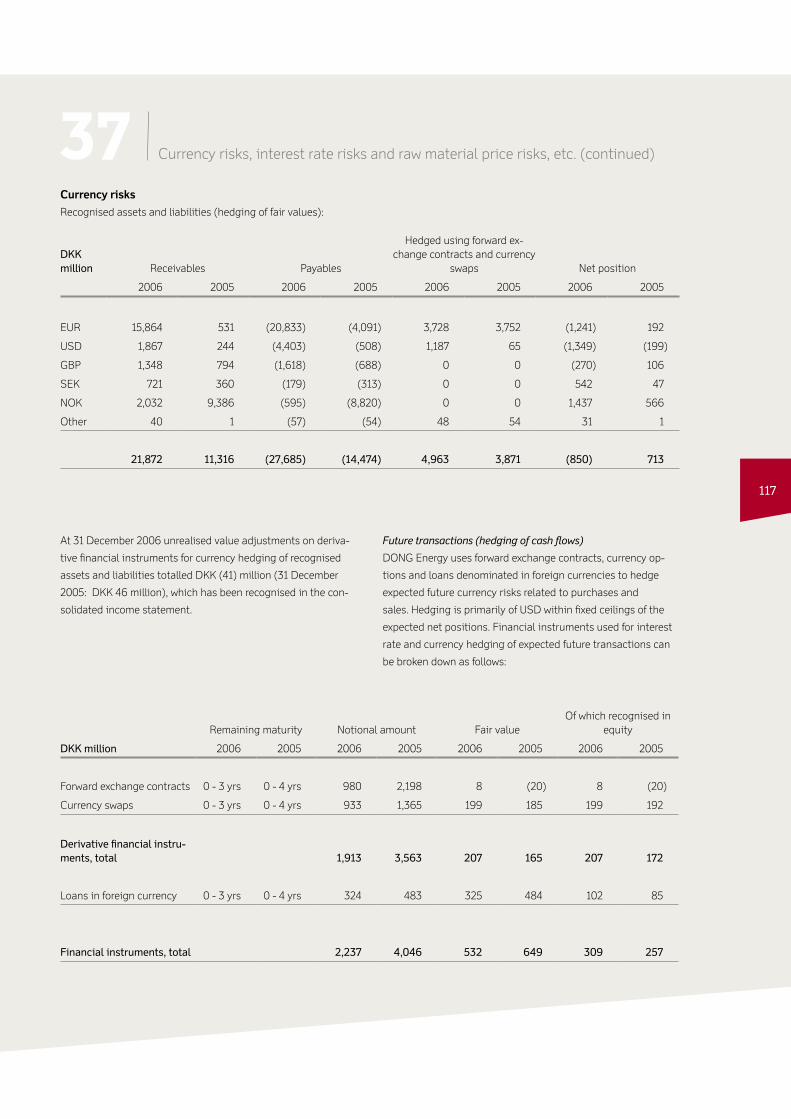
117
37 Currency risks, interest rate risks and raw material price risks, etc. (continued)
Currency risks
Recognised assets and liabilities (hedging of fair values):
DKK million Receivables Payables
Hedged using forward ex-change contracts and currency
swaps Net position
2006 2005 2006 2005 2006 2005 2006 2005
EUR 15,864 531 (20,833) (4,091) 3,728 3,752 (1,241) 192
USD 1,867 244 (4,403) (508) 1,187 65 (1,349) (199)
GBP 1,348 794 (1,618) (688) 0 0 (270) 106
SEK 721 360 (179) (313) 0 0 542 47
NOK 2,032 9,386 (595) (8,820) 0 0 1,437 566
Other 40 1 (57) (54) 48 54 31 1
21,872 11,316 (27,685) (14,474) 4,963 3,871 (850) 713
At 31 December 2006 unrealised value adjustments on deriva-
tive financial instruments for currency hedging of recognised
assets and liabilities totalled DKK (41) million (31 December
2005: DKK 46 million), which has been recognised in the con-
solidated income statement.
Future transactions (hedging of cash flows)
DONG Energy uses forward exchange contracts, currency op-
tions and loans denominated in foreign currencies to hedge
expected future currency risks related to purchases and
sales. Hedging is primarily of USD within fixed ceilings of the
expected net positions. Financial instruments used for interest
rate and currency hedging of expected future transactions can
be broken down as follows:
Remaining maturity Notional amount Fair valueOf which recognised in
equity
DKK million 2006 2005 2006 2005 2006 2005 2006 2005
Forward exchange contracts 0 - 3 yrs 0 - 4 yrs 980 2,198 8 (20) 8 (20)
Currency swaps 0 - 3 yrs 0 - 4 yrs 933 1,365 199 185 199 192
Derivative financial instru-ments, total 1,913 3,563 207 165 207 172
Loans in foreign currency 0 - 3 yrs 0 - 4 yrs 324 483 325 484 102 85
Financial instruments, total 2,237 4,046 532 649 309 257
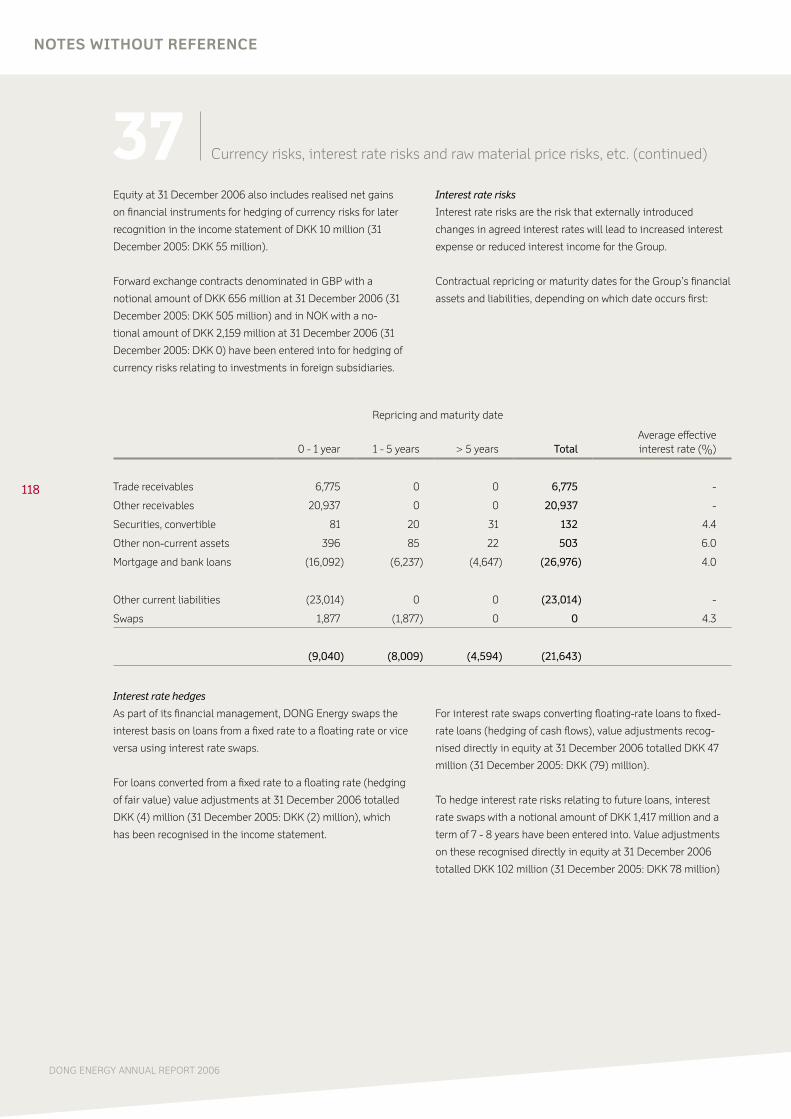
118
DONG ENERGY ANNUAL REPORT 2006
Interest rate hedges
As part of its financial management, DONG Energy swaps the
interest basis on loans from a fixed rate to a floating rate or vice
versa using interest rate swaps.
For loans converted from a fixed rate to a floating rate (hedging
of fair value) value adjustments at 31 December 2006 totalled
DKK (4) million (31 December 2005: DKK (2) million), which
has been recognised in the income statement.
For interest rate swaps converting floating-rate loans to fixed-
rate loans (hedging of cash flows), value adjustments recog-
nised directly in equity at 31 December 2006 totalled DKK 47
million (31 December 2005: DKK (79) million).
To hedge interest rate risks relating to future loans, interest
rate swaps with a notional amount of DKK 1,417 million and a
term of 7 - 8 years have been entered into. Value adjustments
on these recognised directly in equity at 31 December 2006
totalled DKK 102 million (31 December 2005: DKK 78 million)
NOTES wITHOUT REFERENCE
37 Currency risks, interest rate risks and raw material price risks, etc. (continued)
Equity at 31 December 2006 also includes realised net gains
on financial instruments for hedging of currency risks for later
recognition in the income statement of DKK 10 million (31
December 2005: DKK 55 million).
Forward exchange contracts denominated in GBP with a
notional amount of DKK 656 million at 31 December 2006 (31
December 2005: DKK 505 million) and in NOK with a no-
tional amount of DKK 2,159 million at 31 December 2006 (31
December 2005: DKK 0) have been entered into for hedging of
currency risks relating to investments in foreign subsidiaries.
Interest rate risks
Interest rate risks are the risk that externally introduced
changes in agreed interest rates will lead to increased interest
expense or reduced interest income for the Group.
Contractual repricing or maturity dates for the Group’s financial
assets and liabilities, depending on which date occurs first:
Repricing and maturity date
0 - 1 year 1 - 5 years > 5 years TotalAverage effective interest rate (%)
Trade receivables 6,775 0 0 6,775 -
Other receivables 20,937 0 0 20,937 -
Securities, convertible 81 20 31 132 4.4
Other non-current assets 396 85 22 503 6.0
Mortgage and bank loans (16,092) (6,237) (4,647) (26,976) 4.0
Other current liabilities (23,014) 0 0 (23,014) -
Swaps 1,877 (1,877) 0 0 4.3
(9,040) (8,009) (4,594) (21,643)
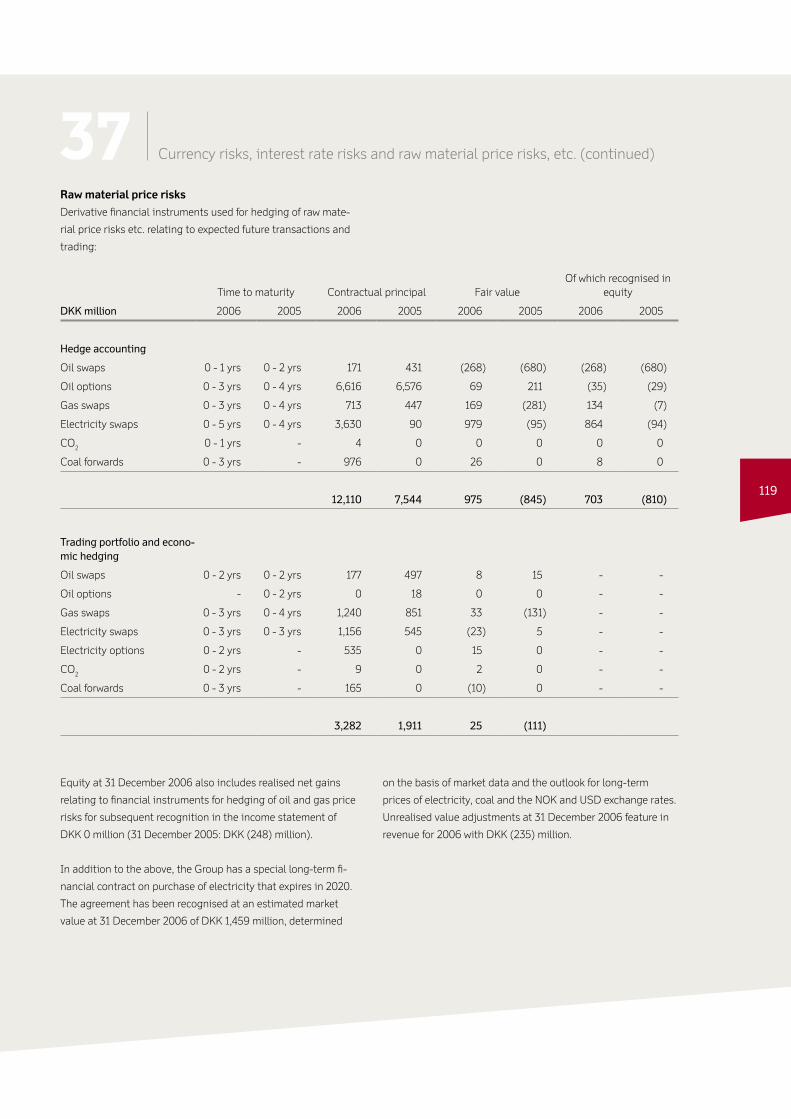
119
37 Currency risks, interest rate risks and raw material price risks, etc. (continued)
Time to maturity Contractual principal Fair valueOf which recognised in
equity
DKK million 2006 2005 2006 2005 2006 2005 2006 2005
Hedge accounting
Oil swaps 0 - 1 yrs 0 - 2 yrs 171 431 (268) (680) (268) (680)
Oil options 0 - 3 yrs 0 - 4 yrs 6,616 6,576 69 211 (35) (29)
Gas swaps 0 - 3 yrs 0 - 4 yrs 713 447 169 (281) 134 (7)
Electricity swaps 0 - 5 yrs 0 - 4 yrs 3,630 90 979 (95) 864 (94)
CO2 0 - 1 yrs - 4 0 0 0 0 0
Coal forwards 0 - 3 yrs - 976 0 26 0 8 0
12,110 7,544 975 (845) 703 (810)
Trading portfolio and econo-mic hedging
Oil swaps 0 - 2 yrs 0 - 2 yrs 177 497 8 15 - -
Oil options - 0 - 2 yrs 0 18 0 0 - -
Gas swaps 0 - 3 yrs 0 - 4 yrs 1,240 851 33 (131) - -
Electricity swaps 0 - 3 yrs 0 - 3 yrs 1,156 545 (23) 5 - -
Electricity options 0 - 2 yrs - 535 0 15 0 - -
CO2 0 - 2 yrs - 9 0 2 0 - -
Coal forwards 0 - 3 yrs - 165 0 (10) 0 - -
3,282 1,911 25 (111)
Equity at 31 December 2006 also includes realised net gains
relating to financial instruments for hedging of oil and gas price
risks for subsequent recognition in the income statement of
DKK 0 million (31 December 2005: DKK (248) million).
In addition to the above, the Group has a special long-term fi-
nancial contract on purchase of electricity that expires in 2020.
The agreement has been recognised at an estimated market
value at 31 December 2006 of DKK 1,459 million, determined
on the basis of market data and the outlook for long-term
prices of electricity, coal and the NOK and USD exchange rates.
Unrealised value adjustments at 31 December 2006 feature in
revenue for 2006 with DKK (235) million.
Raw material price risks
Derivative financial instruments used for hedging of raw mate-
rial price risks etc. relating to expected future transactions and
trading:

120
DONG ENERGY ANNUAL REPORT 2006
38 Credit risks
NOTES wITHOUT REFERENCE
Credit risks are the risk that a book loss will be realised in the
event of a party to a contract being unable to perform its con-
tractual obligations.
The Group’s credit risk on commercial counterparties com-
prises primarily trade receivables from the sale of natural gas,
electricity and oil, and positive values of raw material contracts.
The Group regularly monitors the risk and manages it based on
credit rating of the counterparties. The Group’s greatest expo-
sure in relation to commercial counterparties is with Northern
European utility companies.
The Group’s credit risk in connection with derivative financial
instruments is limited as they have primarily been entered into
with banks and other counterparties with a high credit rating.
Moreover, a substantial part of the Group’s surplus liquidity is
placed on deposit with banks.
Losses on receivables due to the counterparty’s inability to pay
have historically been low.
The Group systematically reviews contracts that could poten-
tially feature conditions corresponding to derivative financial
instruments, requiring separate recognition and measurement
of the embedded financial instruments. As part of the Group’s
commercial activities, natural gas purchase and sales contracts
are entered into that are indexed in relation to various raw
material prices, etc. It is estimated that the economic relation-
ship between the price of natural gas and the agreed indexa-
tion means that separate recognition and measurement of
embedded derivate financial instruments in relation to this is
not required.
39 Embedded financial instruments
40 Operating leases
Non-cancellable operating lease payments amount to:
DKK million 2006 2005
0 - 1 year 102 11
1 - 5 years 1,771 15
> 5 years 1,416 0
3,289 26
Operating leases recognised in the income statement amount to 6 16
Operating leases comprise leasing of a drilling rig in the period
2008 - 2011, a gas storage facility in Germany in the period 2008 -
2023 and leasing of vehicles, etc. The latter leases have a term
of up to five years.

121
41 Contingent assets, liabilities and security
Contingent assets
Significiant unrecognised contingent assets comprise deferred
tax assets of DKK 7.7 billion (2005: DKK 7.5 billion). Reference
is made to note 25.
Contingent liabilities
According to the legislation, DONG Energy’s natural gas
companies, DONG Oil Pipe A/S, DONG E&P A/S and DONG
E&P Grønland A/S are liable to pay compensation for damage
caused by their oil and natural gas activities, even where there
is no proof of negligence (strict liability). The usual insurance
has been taken out to cover any such claims.
The DONG E&P Group participates in a number of oil and
natural gas production and exploration licences. Continued
participation in these licences commits the companies to invest
substantial sums in future. The DONG E&P Group is jointly and
severally liable in respect of the individual licences together
with the other licence partners for obligations and liability
under the licences.
The DONG Energy Group participates in a number of joint
ventures, including renewable energy projects. The Group’s
companies are jointly and severally liable with the other joint
venturers for obligations and liability under agreements con-
cluded.
Through its participation in the collaboration with Oil Insur-
ance Limited (OIL), DONG Energy is subject to provisions that
imply payment of an avoided premium surcharge (APS) in the
event of termination or reduction of the insurance. Provision is
made in the financial statements for the retrospective adjust-
ment. The prospective premium is not expected to exceed USD
0.4 million.
As mentioned under management’s review, the Danish Com-
petition Board of Appeal has concluded that DONG Energy
Power (formerly Elsam A/S) exploited its dominant position in
Western Denmark to some extent, periodically charging exces-
sive prices. DONG Energy has appealed the Competition Board
of Appeal’s decision to the Danish Maritime and Commercial
Court. No provision has been made in the annual report for any
claims for compensation.
Contractual obligations
The Group has entered into binding agreements with suppliers
for the purchase of property, plant and equipment and intangi-
ble assets. The obligations total DKK 2.3 billion.
DONG Naturgas is a party to gas purchase agreements with the
DUC partners. The Group is also party to a number of long-term
purchase and sales agreements entered into in the course of
the Group’s ordinary operations. The Group is not expected to
incur any financial losses as a result of termination of these,
apart from the liabilities that are already recognised in the bal-
ance sheet.
Guarantees
DONG Naturgas A/S and the regional gas companies HNG and
Midt-Nord have concluded an agreement under which DONG
Naturgas A/S will provide a financial guarantee securing HNG
and Midt-Nord the necessary annual income from transporta-
tion activities to pay off their debt in 2014. From 1 January
2007, the guarantee is limited to a sum of DKK 200 million,
which will be written down successively by DKK 15 million an-
nually from 1 January 2007 to 1 January 2012. DONG Naturgas
A/S’s maximum payment obligation will also be written down
by the amounts paid in total by DONG Naturgas A/S.
DONG E&P A/S has furnished the Danish Ministry of Eco-
nomic and Business Affairs with a guarantee for fulfilment of
all obligations and liability to the Danish State or third parties
incurred by DONG E&P A/S as co-holder of the licences in
which the company participates, irrespective of whether the
obligations and liability rest on DONG E&P A/S alone or jointly
and severally with others. However, the guarantee is limited to a
sum corresponding to twice DONG E&P’s share of each obliga-
tion or liability.
As a condition for approval of its participation in hydrocarbon
exploration and production on the Norwegian and Faroese con-
tinental shelves, DONG E&P A/S has furnished the undertaking
normally required by the local authorities to act as guarantor
with primary liability. The guarantee covers obligations and
liability incurred or assumed by DONG E&P A/S in connection
with its exploration and production activities. The guarantee
has no maximum limit and DONG E&P A/S is jointly and sever-
ally liable with the other partners for obligations and liability.

122
DONG ENERGY ANNUAL REPORT 2006
42 Related party transactions
Related parties that have control over the Group comprise the
Danish State, represented by the Danish Ministry of Finance,
which owns 73% of the parent company.
Related parties that exercise significant influence comprise the
parent company’s and associates’ Supervisory and Executive
Boards, senior executives and close members of their families.
Related parties also comprise companies over which the per-
sons referred to above exercise significant influence.
Related parties also include the Group’s associates, i.e. compa-
nies in which the DONG Energy Group has significant influence.
Reference is made to note 44 for an overview of the Group’s
associates.
The Group was involved in the following transactions with
related parties in the year under review:
Licences from the Danish State
DONG Energy has been granted storage and distribution
licences by the Danish State under Sections 10 and 59 of the
Danish Natural Gas Supply Act. The licences have been granted
for the period up to 2023.
Under Sections 24, 25 and 59 of the Natural Gas Supply Act,
DONG Energy has also been granted a licence to engage in
natural gas supply activities on firm terms on the conditions
laid down in the Natural Gas Supply Act. Accordingly, the
licence to engage in natural gas supply activities on firm terms
has been granted for a period up to 2008.
DONG Energy has also been granted power generation licences
that run until 2022, an electricity transmission licence that runs
until 2025, electricity distribution licences that run until 2022,
2023 and 2025, respectively, depending on the area, electric-
ity PSO licences that are renewed on a regular basis subject to
application, exploration and production licences that generally
run for six years during the exploration phase and then for 30
years during the production phase, licences to operate wind
farms and, lastly, licences for exploration for and recovery of
geothermal energy that expire in 2013 and 2051, respectively.
Guarantees from the Danish State
DONG Naturgas, DONG Energy and the Danish State entered
into an agreement with the former Naturgas Syd in 1999 and
with the former Naturgas Sjælland in 2000 concerning transfer
of these two regional natural gas companies’ assets and li-
abilities to DONG Naturgas. The values were determined on the
basis of financial calculations of the future earnings potential.
All loans remained with the two regional natural gas compa-
nies, which changed their names to Gældsafviklingsselskabet
Naturgas Syd and Gældsafviklingsselskabet Naturgas Sjælland,
respectively. DONG Naturgas issued instruments of debt to
the debt repayment partnerships under which DONG Naturgas
pays interest and instalments on the loan.
The instruments of debt were transferred to the companies
DONG Gas Distribution and DONG Storage in connection with
the unbundling of DONG Naturgas. The State has granted an
unconditional and irrevocable guarantee to the debt repayment
partnerships in respect of all payments. The State has recourse
against DONG Gas Distribution and DONG Storage in respect
of any amounts paid by the State under the guarantees.
41 Contingent assets, liabilities and security (continued
Contracts have been entered into on purchases of fuel and
supply of district heat. DONG Energy Power A/S is liable as a
partner for financial losses at certain CHP plants.
As a condition for Barrow Offshore Wind Ltd’s agreement with
the Crown Estate Commissioner on leasing of offshore areas,
DONG VE A/S has furnished an, in principle, unlimited guaran-
tee to act as guarantor with primary liability for costs related to
decommissioning of the offshore wind farm, etc.
Security
Mortgage loans totalling DKK 1,821 million (2005: DKK 622
million) are secured on property and four central power stations
with a carrying amount of DKK 3,831 million (2005: DKK 791
million).
Litigation
A number of former shareholders in DONG Energy Power A/S
(formerly Elsam A/S) have commenced proceedings against
DONG Energy, claiming that shares in DONG Energy Power A/S
should be the subject of a preemption right round; alternatively,
payment of damages calculated at approx. DKK 800 million.
Provision for any damages has not been made in the annual
report.
NOTES wITHOUT REFERENCE
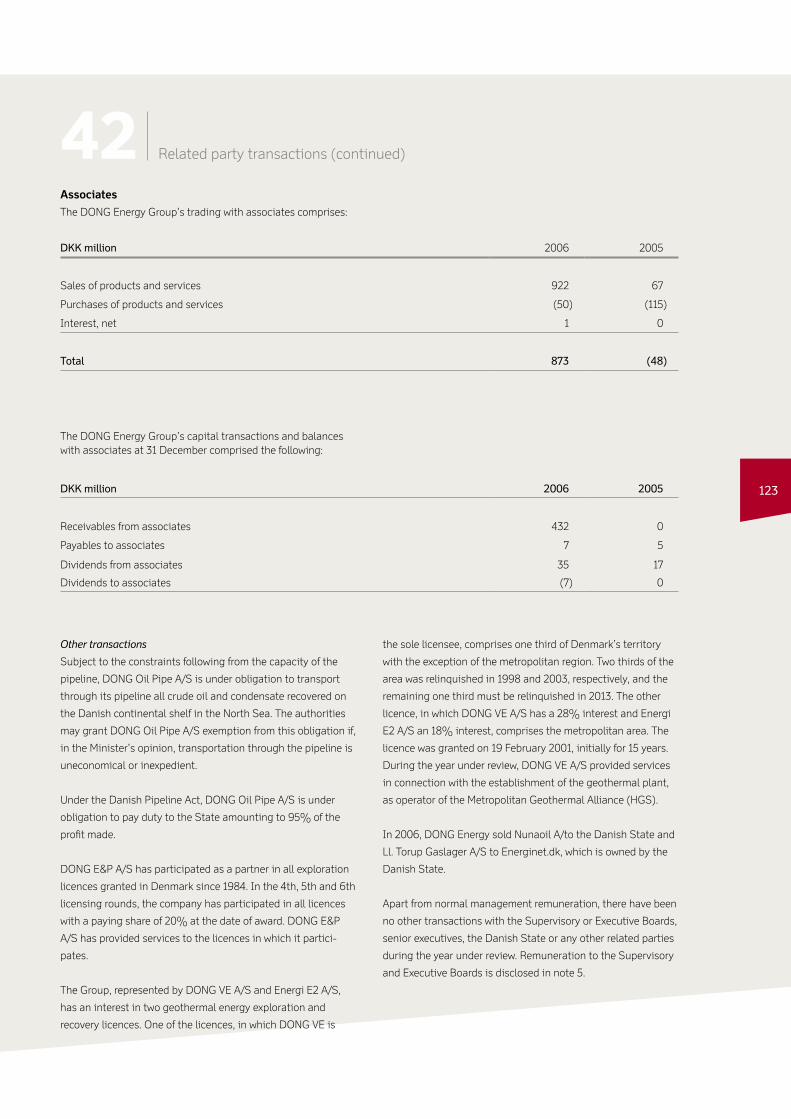
123
Associates
The DONG Energy Group’s trading with associates comprises:
DKK million 2006 2005
Sales of products and services 922 67
Purchases of products and services (50) (115)
Interest, net 1 0
Total 873 (48)
The DONG Energy Group’s capital transactions and balances with associates at 31 December comprised the following:
DKK million 2006 2005
Receivables from associates 432 0
Payables to associates 7 5
Dividends from associates 35 17
Dividends to associates (7) 0
42 Related party transactions (continued)
Other transactions
Subject to the constraints following from the capacity of the
pipeline, DONG Oil Pipe A/S is under obligation to transport
through its pipeline all crude oil and condensate recovered on
the Danish continental shelf in the North Sea. The authorities
may grant DONG Oil Pipe A/S exemption from this obligation if,
in the Minister’s opinion, transportation through the pipeline is
uneconomical or inexpedient.
Under the Danish Pipeline Act, DONG Oil Pipe A/S is under
obligation to pay duty to the State amounting to 95% of the
profit made.
DONG E&P A/S has participated as a partner in all exploration
licences granted in Denmark since 1984. In the 4th, 5th and 6th
licensing rounds, the company has participated in all licences
with a paying share of 20% at the date of award. DONG E&P
A/S has provided services to the licences in which it partici-
pates.
The Group, represented by DONG VE A/S and Energi E2 A/S,
has an interest in two geothermal energy exploration and
recovery licences. One of the licences, in which DONG VE is
the sole licensee, comprises one third of Denmark’s territory
with the exception of the metropolitan region. Two thirds of the
area was relinquished in 1998 and 2003, respectively, and the
remaining one third must be relinquished in 2013. The other
licence, in which DONG VE A/S has a 28% interest and Energi
E2 A/S an 18% interest, comprises the metropolitan area. The
licence was granted on 19 February 2001, initially for 15 years.
During the year under review, DONG VE A/S provided services
in connection with the establishment of the geothermal plant,
as operator of the Metropolitan Geothermal Alliance (HGS).
In 2006, DONG Energy sold Nunaoil A/to the Danish State and
Ll. Torup Gaslager A/S to Energinet.dk, which is owned by the
Danish State.
Apart from normal management remuneration, there have been
no other transactions with the Supervisory or Executive Boards,
senior executives, the Danish State or any other related parties
during the year under review. Remuneration to the Supervisory
and Executive Boards is disclosed in note 5.
124
DONG ENERGY ANNUAL REPORT 2006
43 New International Financial Reporting Standards and IFRIC Interpretations
The IASB has adopted the following new accounting standards
(IFRS) that are not mandatory for DONG Energy in connection
with the preparation of the annual report for 2006. Unless oth-
erwise stated, the standards have also been adopted by the EU:
IFRS 7 Financial Instruments: Disclosures comes into effect
for financial years beginning on or after 1 January 2007. Im-
plementation of the new standard will not have any effect on
the recognition and measurement of financial instruments.
IFRS 8 Operating Segments on segment information comes
into effect for financial years beginning on or after 1 January
2009. The standard will not have any effect on the recogni-
tion and measurement in the annual report. IFRS 8 has yet
to be adopted by the EU.
The IASB has adopted the following new interpretations
(IFRICs) that are not mandatory for DONG Energy in connec-
tion with the preparation of the annual report for 2006. Unless
otherwise stated, the interpretations have also been adopted
by the EU:
IFRIC 7 Applying the Restatement Approach under IAS 29
Financial Reporting in Hyperinflationary Economies comes
into effect for financial years beginning on or after 1 March
2007. DONG Energy has no foreign entities in hyperinfla-
tionary economies.
IFRIC 8 Scope of IFRS 2 comes into effect for financial years
beginning on or after 1 May 2007. DONG Energy does not
have any share-based payment schemes.
IFRIC 9 Reassessment of Embedded Derivatives comes into
effect for financial years beginning on or after 1 June 2006.
In accordance with the commencement provisions in IFRIC
9, DONG Energy has elected to apply IFRIC 9 from and
including the 2006 financial year. Reference is made to note
39.
IFRIC 10 Interim Financial Reporting and Impairment pro-
hibits the reversal in the annual report of impairment losses
on goodwill that have been recognised in an interim report
as a consequence of impairment, even though the factors
that led to the write-down in the interim report no longer
apply. The same applies to impairment losses on equity
investments and financial assets that are measured at cost.
IFRIC 10 comes into effect for financial years beginning on
or after 1 November 2006 and is not expected to affect the
financial reporting. IFRIC 10 has yet to be adopted by the
EU.
IFRIC 11 IFRS 2: Group and Treasury Share Transactions
comes into effect for financial years beginning on or after
1 March 2007 and is not expected to affect the financial
reporting. IFRIC 11 has yet to be adopted by the EU.
IFRIC 12 Service Concession Arrangements comes into ef-
fect for financial years beginning on or after 1 January 2008.
IFRIC 12 has yet to be adopted by the EU. DONG Energy
has made a preliminary assessment of the impact of IFRIC
12 on DONG Energy’s financial reporting. The assessment
was based on the existing licences from the Danish State.
Based on this preliminary assessment, DONG Energy is of
the opinion that IFRIC 12 will not have a significant effect on
DONG Energy’s financial reporting.
DONG Energy expects to implement the accounting standards
and interpretations referred to above from their mandatory
effective dates.
NOTES wITHOUT REFERENCE

125
44 Company and licence overview
Name Registered office Ownership interest
Parent company
DONG Energy A/S Fredericia, Denmark -
Subsidiaries
Borkum Riffgrund I Holding A/S Copenhagen, Denmark 51%
Compañia Productora de Energia para Consumo Interno, S.L. Madrid, Spain 50%
Danish Hellenic S.A. Athens, Greece 50%
Desarrollos Eólicos del Valle del Ebro, S.A. Madrid, Spain 50%
DONG E&P (UK) Ltd. London, UK 100%
DONG E&P A/S Fredericia, Denmark 100%
DONG E&P Føroyar P/F Torshavn, Faroe Islands 100%
DONG E&P Grønland A/S Nuuk, Greenland 100%
DONG E&P Norge AS Stavanger, Norway 100%
DONG EGJ A/S Fredericia, Denmark 100%
DONG El A/S Fredericia, Denmark 100%
DONG Energy Aktiebolag Gothenburg, Sweden 100%
DONG Energy El & Gas A/S Fredericia, Denmark 100%
DONG Energy Gasforsyning A/S Fredericia, Denmark 100%
DONG Energy Generation A/S Fredericia, Denmark 100%
DONG Energy Kraftwerke Greifswald Beteiligungs-GmbH Frankfurt-am-Main, Germany 100%
DONG Energy Kraftwerke Greifswald GmbH & Co. KG Frankfurt-am-Main, Germany 100%
DONG Energy Kraftwerke Greifswald Verwaltungs GmbH Frankfurt-am-Main, Germany 75%
DONG Energy Kraftwerke Holding GmbH Hamburg, Germany 100%
DONG Energy Leitung E GmbH Kiel, Germany 100%
DONG Energy Markets GmbH Dorsten, Germany 100%
DONG Energy Nord Elnet A/S Fredericia, Denmark 100%
DONG Energy Nord Forsyning A/S Fredericia, Denmark 100%
DONG Energy Pipelines A/S Fredericia, Denmark 100%
DONG Energy Pipelines GmbH Kiel, Germany 100%
DONG Energy Power A/S Fredericia, Denmark 100%
DONG Energy Sales & Distribution A/S Fredericia, Denmark 100%
DONG Energy Sales B.V. Oosterhout, the Netherlands 100%
DONG Energy Sales GmbH Lübeck, Germany 81%
DONG Energy Speicher E GmbH Kiel, Germany 100%
DONG Energy Tele A/S Gentofte, Denmark 100%
DONG Gas Distribution A/S Fredericia, Denmark 100%
DONG Generation Ireland Ltd. Dublin, Ireland 100%
DONG Generation Norge AS Lindås, Norway 100%
DONG Insurance A/S Fredericia, Denmark 100%
The overview of enterprises below lists the DONG Energy
Group’s ultimate ownership interest in each enterprise, regard-
less of whether the enterprise is owned directly or indirectly.

126
DONG ENERGY ANNUAL REPORT 2006
44 Company and licence overview (continued)
NOTES wITHOUT REFERENCE
Name Registered office Ownership interest
DONG Litauen A/S Fredericia, Denmark 100%
DONG Naturgas A/S Fredericia, Denmark 100%
DONG Netherlands B.V. Amsterdam, the Netherlands 100%
DONG Oil Pipe A/S Fredericia, Denmark 100%
DONG Olieforsyning A/S Fredericia, Denmark 100%
DONG Storage A/S Fredericia, Denmark 100%
DONG Sverige Distribution AB Gothenburg, Sweden 100%
DONG VE A/S Fredericia, Denmark 100%
DONG Vind A/S Fredericia, Denmark 100%
DONG Walney (UK) Ltd. London, UK 100%
DONG Wind (UK) Ltd. London, UK 100%
Dublin Waste to Energy Ltd. Dublin, Ireland 100%
E2 Landvind A/S Fredericia, Denmark 100%
E2 Landvind af 20. oktober 2003 A/S Fredericia, Denmark 100%
E2 Landvind af 15. september 2003 A/S Fredericia, Denmark 100%
Elsam Biosystems A/S Fredericia, Denmark 52%
Elsam Engineering A/S Fredericia, Denmark 100%
Elsam France S.A.S. Paris, France 100%
Elsam Polska S.A. Warsaw, Poland 100%
Elsamprojekt Polska Sp. z.o.o. Warsaw, Poland 100%
EM El Holding A/S Fredericia, Denmark 100%
Energi E2 A/S Fredericia, Denmark 100%
Energi E2 Aiolika Parka Karystias EPE Athens, Greece 100%
Energi E2 Aioliki S.A. Athens, Greece 100%
ENERGI E2 Iberia, Mediterranean Power, S.L. Madrid, Spain 100%
Energi E2 Portugal, SGPS, S.A. Madrid, Spain 100%
Energi E2, Energias Renovables Aragonesas, SLU Madrid, Spain 50%
Energias Eólicas Casa Requena S.L. Madrid, Spain 100%
EnergiGruppen Jylland A/S Herning, Denmark 66%
EnergiGruppen Jylland Biogas A/S Herning, Denmark 66%
EnergiGruppen Jylland El A/S Herning, Denmark 100%
EnergiGruppen Jylland El Holding A/S Herning, Denmark 100%
EnergiGruppen Jylland Forbrænding A/S Herning, Denmark 66%
EnergiGruppen Jylland Udvikling A/S Herning, Denmark 66%
EnergiGruppen Jylland Vand A/S Herning, Denmark 66%
EnergiGruppen Jylland Varme A/S Herning, Denmark 66%
Energy E2 Renewables A/S Fredericia, Denmark 100%
Energy E2 Renovables Ibericas S.L. Madrid, Spain 100%
Eoliser Servicos de Gestao Para Parques Eolicos LDA Madrid, Spain 60%
Frederiksberg Elforsyning A/S Frederiksberg, Denmark 100%
Frederiksberg Elnet A/S Frederiksberg, Denmark 100%
Frederiksberg Energiservice A/S Frederiksberg, Denmark 100%
Frederiksberg Forsyning A/S Frederiksberg, Denmark 100%
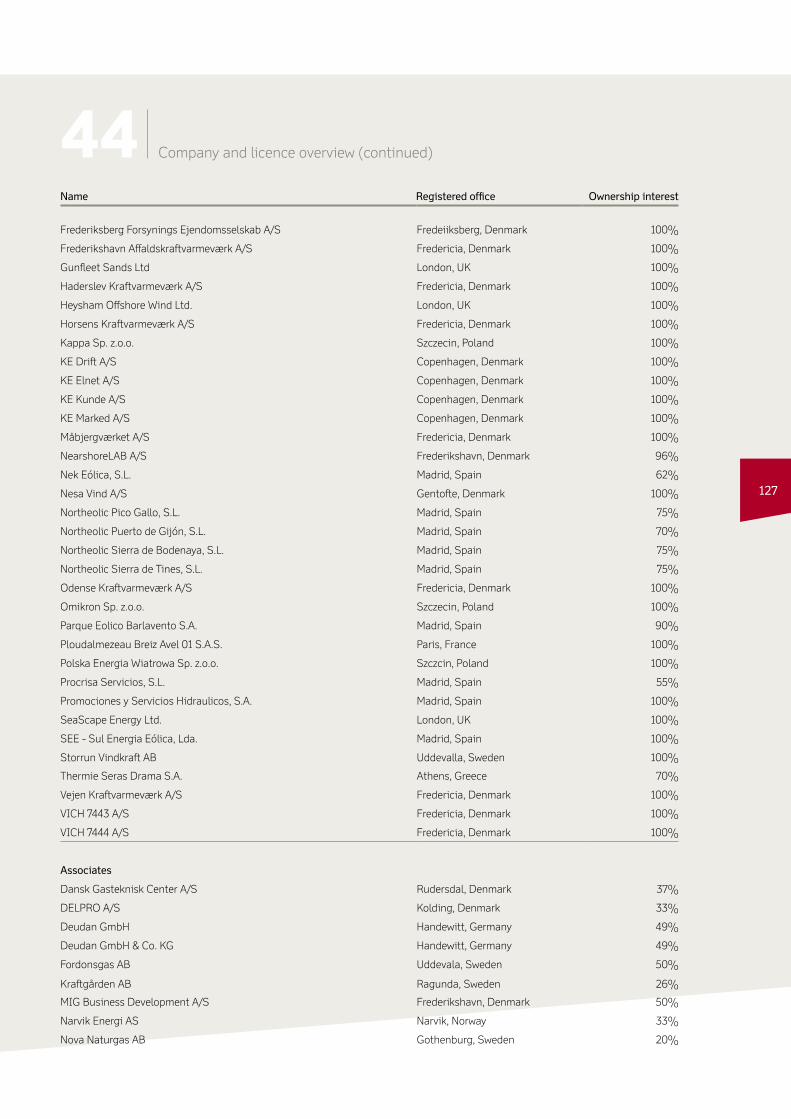
127
44 Company and licence overview (continued)
Name Registered office Ownership interest
Frederiksberg Forsynings Ejendomsselskab A/S Fredeiiksberg, Denmark 100%
Frederikshavn Affaldskraftvarmeværk A/S Fredericia, Denmark 100%
Gunfleet Sands Ltd London, UK 100%
Haderslev Kraftvarmeværk A/S Fredericia, Denmark 100%
Heysham Offshore Wind Ltd. London, UK 100%
Horsens Kraftvarmeværk A/S Fredericia, Denmark 100%
Kappa Sp. z.o.o. Szczecin, Poland 100%
KE Drift A/S Copenhagen, Denmark 100%
KE Elnet A/S Copenhagen, Denmark 100%
KE Kunde A/S Copenhagen, Denmark 100%
KE Marked A/S Copenhagen, Denmark 100%
Måbjergværket A/S Fredericia, Denmark 100%
NearshoreLAB A/S Frederikshavn, Denmark 96%
Nek Eólica, S.L. Madrid, Spain 62%
Nesa Vind A/S Gentofte, Denmark 100%
Northeolic Pico Gallo, S.L. Madrid, Spain 75%
Northeolic Puerto de Gijón, S.L. Madrid, Spain 70%
Northeolic Sierra de Bodenaya, S.L. Madrid, Spain 75%
Northeolic Sierra de Tines, S.L. Madrid, Spain 75%
Odense Kraftvarmeværk A/S Fredericia, Denmark 100%
Omikron Sp. z.o.o. Szczecin, Poland 100%
Parque Eolico Barlavento S.A. Madrid, Spain 90%
Ploudalmezeau Breiz Avel 01 S.A.S. Paris, France 100%
Polska Energia Wiatrowa Sp. z.o.o. Szczcin, Poland 100%
Procrisa Servicios, S.L. Madrid, Spain 55%
Promociones y Servicios Hidraulicos, S.A. Madrid, Spain 100%
SeaScape Energy Ltd. London, UK 100%
SEE - Sul Energia Eólica, Lda. Madrid, Spain 100%
Storrun Vindkraft AB Uddevalla, Sweden 100%
Thermie Seras Drama S.A. Athens, Greece 70%
Vejen Kraftvarmeværk A/S Fredericia, Denmark 100%
VICH 7443 A/S Fredericia, Denmark 100%
VICH 7444 A/S Fredericia, Denmark 100%
Associates
Dansk Gasteknisk Center A/S Rudersdal, Denmark 37%
DELPRO A/S Kolding, Denmark 33%
Deudan GmbH Handewitt, Germany 49%
Deudan GmbH & Co. KG Handewitt, Germany 49%
Fordonsgas AB Uddevala, Sweden 50%
Kraftgården AB Ragunda, Sweden 26%
MIG Business Development A/S Frederikshavn, Denmark 50%
Narvik Energi AS Narvik, Norway 33%
Nova Naturgas AB Gothenburg, Sweden 20%
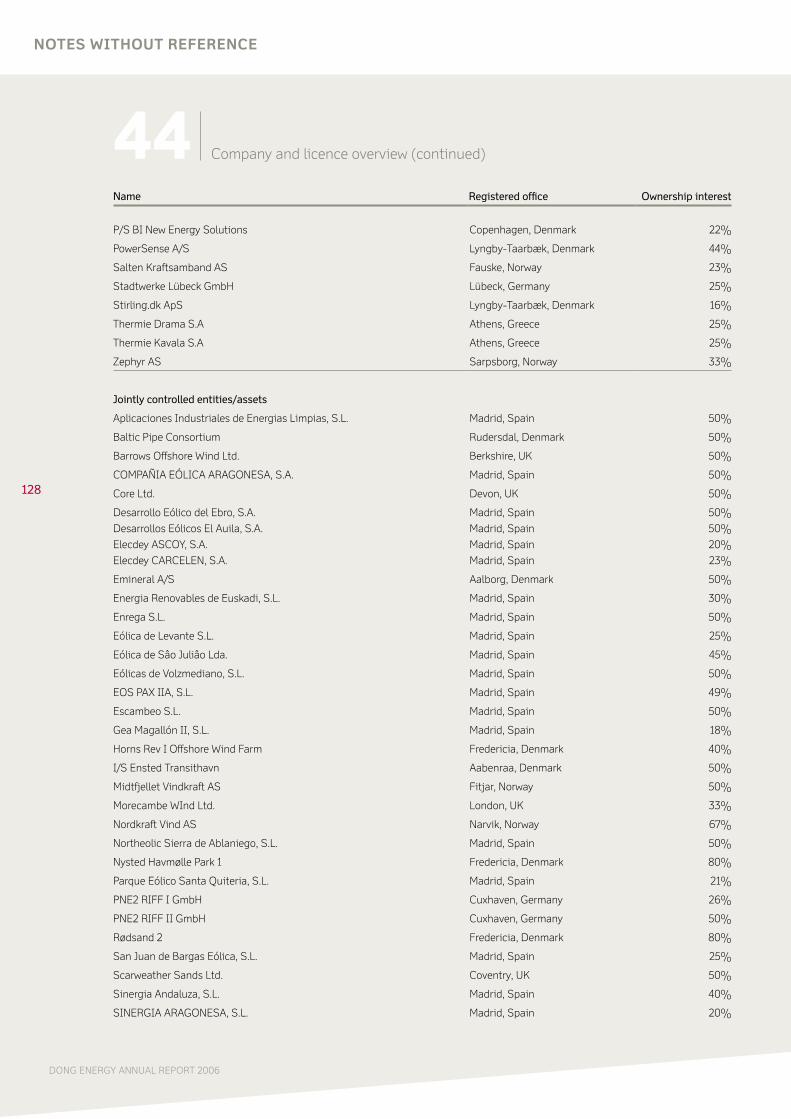
128
DONG ENERGY ANNUAL REPORT 2006
44 Company and licence overview (continued)
Name Registered office Ownership interest
P/S BI New Energy Solutions Copenhagen, Denmark 22%
PowerSense A/S Lyngby-Taarbæk, Denmark 44%
Salten Kraftsamband AS Fauske, Norway 23%
Stadtwerke Lübeck GmbH Lübeck, Germany 25%
Stirling.dk ApS Lyngby-Taarbæk, Denmark 16%
Thermie Drama S.A Athens, Greece 25%
Thermie Kavala S.A Athens, Greece 25%
Zephyr AS Sarpsborg, Norway 33%
Jointly controlled entities/assets
Aplicaciones Industriales de Energias Limpias, S.L. Madrid, Spain 50%
Baltic Pipe Consortium Rudersdal, Denmark 50%
Barrows Offshore Wind Ltd. Berkshire, UK 50%
COMPAÑIA EÓLICA ARAGONESA, S.A. Madrid, Spain 50%
Core Ltd. Devon, UK 50%
Desarrollo Eólico del Ebro, S.A. Madrid, Spain 50%
Desarrollos Eólicos El Auila, S.A. Madrid, Spain 50%
Elecdey ASCOY, S.A. Madrid, Spain 20%
Elecdey CARCELEN, S.A. Madrid, Spain 23%
Emineral A/S Aalborg, Denmark 50%
Energia Renovables de Euskadi, S.L. Madrid, Spain 30%
Enrega S.L. Madrid, Spain 50%
Eólica de Levante S.L. Madrid, Spain 25%
Eólica de Sâo Juliâo Lda. Madrid, Spain 45%
Eólicas de Volzmediano, S.L. Madrid, Spain 50%
EOS PAX IIA, S.L. Madrid, Spain 49%
Escambeo S.L. Madrid, Spain 50%
Gea Magallón II, S.L. Madrid, Spain 18%
Horns Rev I Offshore Wind Farm Fredericia, Denmark 40%
I/S Ensted Transithavn Aabenraa, Denmark 50%
Midtfjellet Vindkraft AS Fitjar, Norway 50%
Morecambe WInd Ltd. London, UK 33%
Nordkraft Vind AS Narvik, Norway 67%
Northeolic Sierra de Ablaniego, S.L. Madrid, Spain 50%
Nysted Havmølle Park 1 Fredericia, Denmark 80%
Parque Eólico Santa Quiteria, S.L. Madrid, Spain 21%
PNE2 RIFF I GmbH Cuxhaven, Germany 26%
PNE2 RIFF II GmbH Cuxhaven, Germany 50%
Rødsand 2 Fredericia, Denmark 80%
San Juan de Bargas Eólica, S.L. Madrid, Spain 25%
Scarweather Sands Ltd. Coventry, UK 50%
Sinergia Andaluza, S.L. Madrid, Spain 40%
SINERGIA ARAGONESA, S.L. Madrid, Spain 20%
NOTES wITHOUT REFERENCE
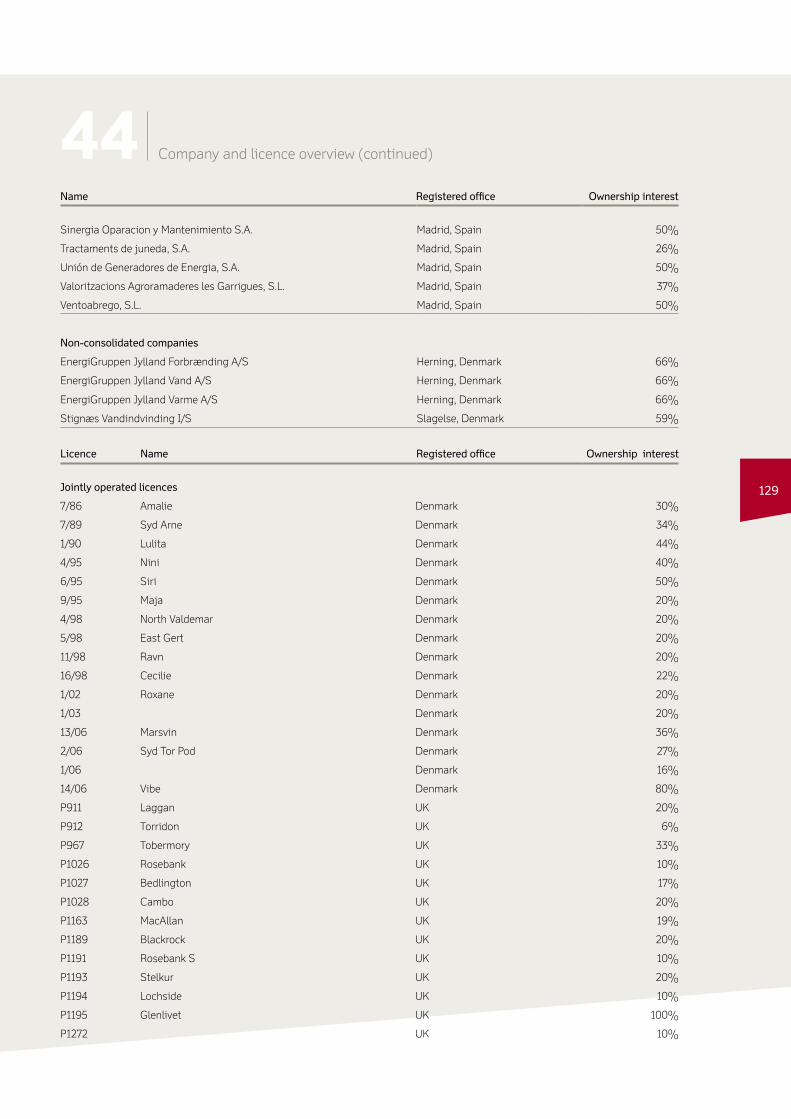
129
44 Company and licence overview (continued)
Licence Name Registered office Ownership interest
Jointly operated licences
7/86 Amalie Denmark 30%
7/89 Syd Arne Denmark 34%
1/90 Lulita Denmark 44%
4/95 Nini Denmark 40%
6/95 Siri Denmark 50%
9/95 Maja Denmark 20%
4/98 North Valdemar Denmark 20%
5/98 East Gert Denmark 20%
11/98 Ravn Denmark 20%
16/98 Cecilie Denmark 22%
1/02 Roxane Denmark 20%
1/03 Denmark 20%
13/06 Marsvin Denmark 36%
2/06 Syd Tor Pod Denmark 27%
1/06 Denmark 16%
14/06 Vibe Denmark 80%
P911 Laggan UK 20%
P912 Torridon UK 6%
P967 Tobermory UK 33%
P1026 Rosebank UK 10%
P1027 Bedlington UK 17%
P1028 Cambo UK 20%
P1163 MacAllan UK 19%
P1189 Blackrock UK 20%
P1191 Rosebank S UK 10%
P1193 Stelkur UK 20%
P1194 Lochside UK 10%
P1195 Glenlivet UK 100%
P1272 UK 10%
Sinergia Oparacion y Mantenimiento S.A. Madrid, Spain 50%
Tractaments de juneda, S.A. Madrid, Spain 26%
Unión de Generadores de Energia, S.A. Madrid, Spain 50%
Valoritzacions Agroramaderes les Garrigues, S.L. Madrid, Spain 37%
Ventoabrego, S.L. Madrid, Spain 50%
Non-consolidated companies
EnergiGruppen Jylland Forbrænding A/S Herning, Denmark 66%
EnergiGruppen Jylland Vand A/S Herning, Denmark 66%
EnergiGruppen Jylland Varme A/S Herning, Denmark 66%
Stignæs Vandindvinding I/S Slagelse, Denmark 59%
Name Registered office Ownership interest
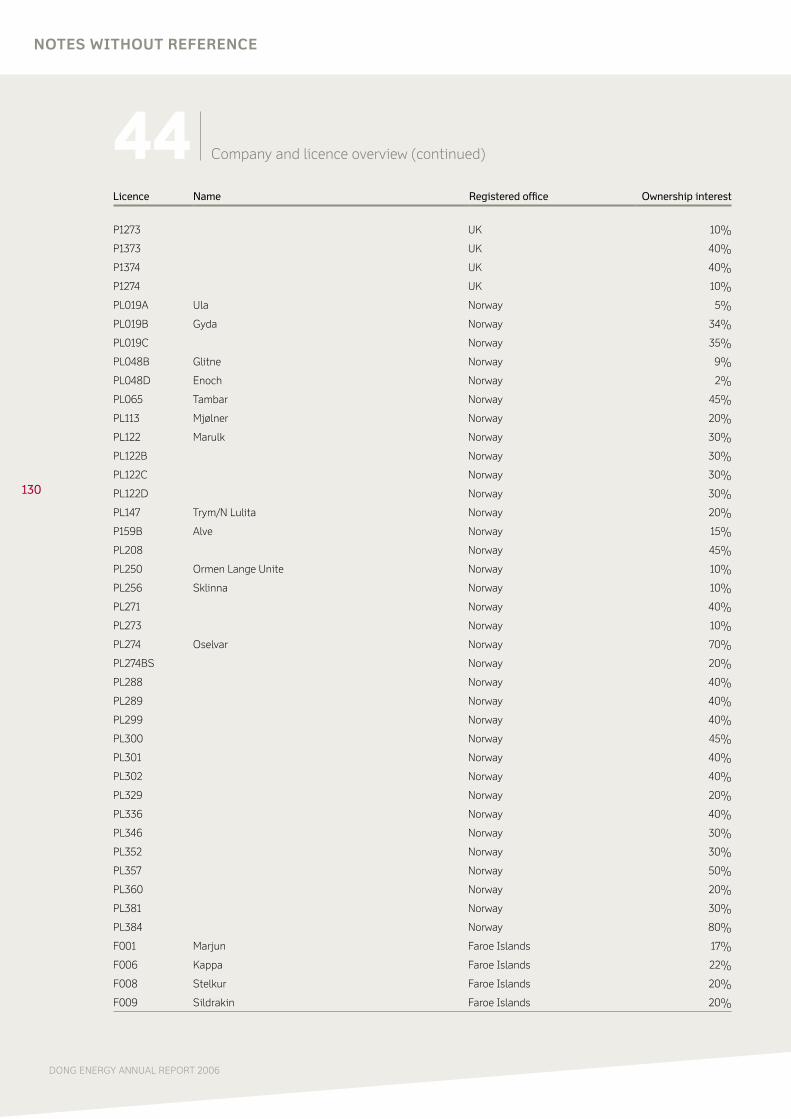
130
DONG ENERGY ANNUAL REPORT 2006
Licence Name Registered office Ownership interest
P1273 UK 10%
P1373 UK 40%
P1374 UK 40%
P1274 UK 10%
PL019A Ula Norway 5%
PL019B Gyda Norway 34%
PL019C Norway 35%
PL048B Glitne Norway 9%
PL048D Enoch Norway 2%
PL065 Tambar Norway 45%
PL113 Mjølner Norway 20%
PL122 Marulk Norway 30%
PL122B Norway 30%
PL122C Norway 30%
PL122D Norway 30%
PL147 Trym/N Lulita Norway 20%
P159B Alve Norway 15%
PL208 Norway 45%
PL250 Ormen Lange Unite Norway 10%
PL256 Sklinna Norway 10%
PL271 Norway 40%
PL273 Norway 10%
PL274 Oselvar Norway 70%
PL274BS Norway 20%
PL288 Norway 40%
PL289 Norway 40%
PL299 Norway 40%
PL300 Norway 45%
PL301 Norway 40%
PL302 Norway 40%
PL329 Norway 20%
PL336 Norway 40%
PL346 Norway 30%
PL352 Norway 30%
PL357 Norway 50%
PL360 Norway 20%
PL381 Norway 30%
PL384 Norway 80%
F001 Marjun Faroe Islands 17%
F006 Kappa Faroe Islands 22%
F008 Stelkur Faroe Islands 20%
F009 Sildrakin Faroe Islands 20%
NOTES wITHOUT REFERENCE
44 Company and licence overview (continued)
ANNuAl rEPort 2006
DoNG ENErGy A/s
Kraftværksvej 53skærbæk7000 FredericiaDenmark
tel. +45 9955 1111Fax +45 7556 4477
DoNG ENErGy A/sAnnual report 2006editorial offi ce: DONG energy, Group financeDesign, production and printing: DatagrafPhotos: Jasper Carlberg and Thomas PriskornThis report was printed by an ISO 14001 eco-certifi ed and eMAS-registered printing fi rm, using chlorine-free paperand vegatable inks.
editorial work was completed on 12 March 2007.
ISbN: 87-91906-04-0Annual report 2006 08.11.29.01
ConTenTS
mArKeTS dISTrIBuTIon
Markets sells DONG energy’s electricity, natural gas and related products to more than one million customers in Denmark, Sweden, Germany and the Netherlands. The customers include residential customers, industrial customers, public sector customers and wholesale customers.
Distribution takes care of DONG energy’s electricity and gas distribution and storage of natural gas in Denmark.The electricity distribution takes place in the metropolitan area and in North Zealand while the gas distribution covers southern Jutland and South and West Zealand.
generATIon
Generation produces energy from effi cient power stations and renewable energy sources. Generation is a market leader within design, construction and operation of offshore wind farms and clean coal technology.
exploration & Production creates value through oil and gas production and procurement of gas at competitive prices.The exploration and production activities are carried out in Danish, Norwegian, UK and faroese waters.
expLorATIon & produCTIon
DONG energy in brief CoverPreface 2Management’s review Consolidated fi nancial highlights 6 Major highlights and outlook for 2007 7 Generation 12 exploration & Production 16 Distribution 20 Markets 24 employees 28 Safety and environment 30 risk management 32 Corporate governance 38
DO
NG
eN
er
GY
/ AN
NU
AL r
eP
Or
T 200
6
financial review 42Management statement and Auditors’ report 47Consolidated income statement 49Consolidated balance sheet 50Consolidated statement of changes in equity 52Consolidated cash fl ow statement 54Notes 55Company information Coverfinancial statements of the parent company Cover(CD-rOM enclosed*)
* The fi nancial statements of the parent company, DONG energy A/S, that appear
from the enclosed CD-rOM, form an integral part of the overall annual report.
the fi nancial statements of the parent company, DoNG Energy A/s,
that appear from the enclosed cD-roM, form an integral part of the overall
annual report. Parts of the parent company’s fi nancial statements
appear in the printed part of the annual report only, as these parts are
identical to the corresponding parts in the consolidated fi nancial
statements. the parts in question are: statement by the Executive
and supervisory boards, independent auditors’ report, management’s
review, and the parts of the accounting policies that are identical
for the Group and the parent company.
12 20 2416
Omslag arsrapport_UK.indd 1 30/03/07 11:19:17
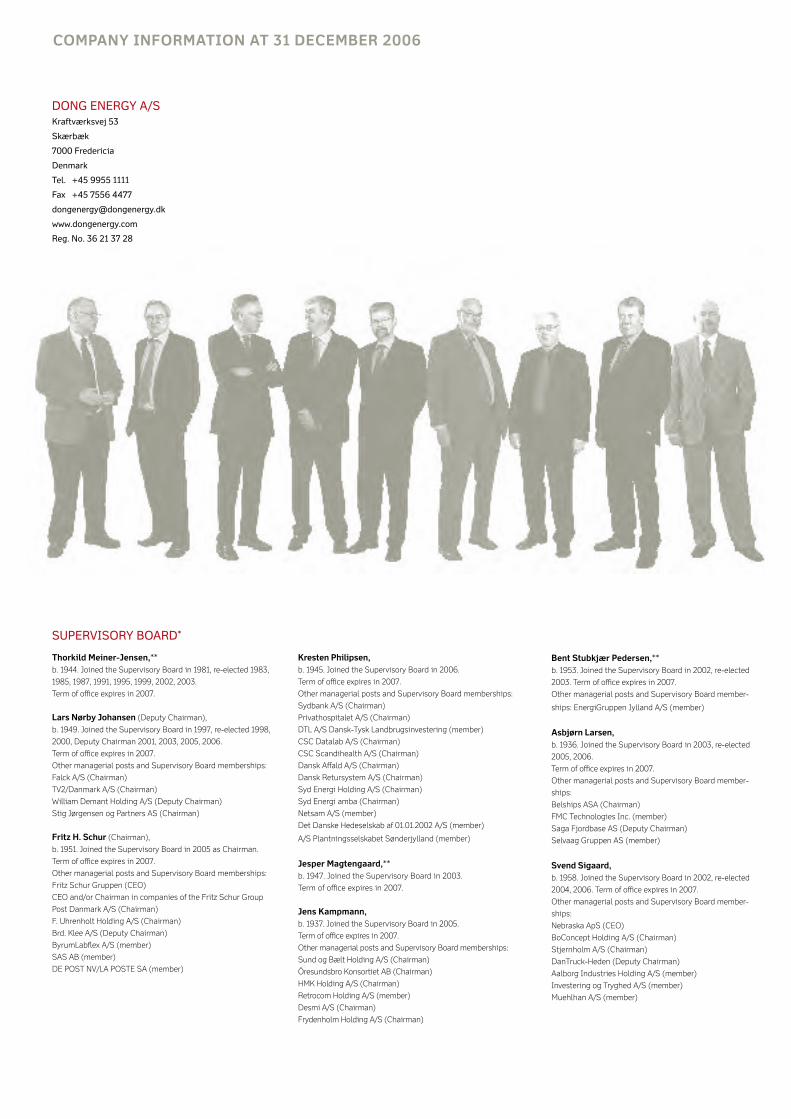
dong energyIN brIef
35.7revenue
8.8eBITdA
5.5eBIT
4.9profIT AfTer TAx
0
20
40
60
80
100
120
20052006
Assets at year end
105
47
DKKbn
0
500
1,000
1,500
2,000
2,500
3,000
EBITRevenue
Distribution
467
857
2,560
161
DKKm
20052006
0
5,000
10,000
15,000
20,000
25,000
EBITRevenue
Markets
1,217
13,885
24,115
2,582
DKKm
20052006
0
1,000
2,000
3,000
4,000
5,000
6,000
20052006
Number of employeesat year end
4,585
1,018
Distribution
electricity distribution
The electricity distribution customers are located in North Zealand, Copen-hagen and frederiksberg
Markets
EBITDA by segment
40%
18% 11%
31%
Markets
GenerationExploration & ProductionDistribution
Gas distribution
The gas distribution customers are located in southern Jutland and South and West Zealand
eBITdA
1.0Distribution takes care of DONG energy’s electricity and gas distribution and gas storage in Denmark.
Distribution serves approx. 956,000 customers with electricityand approx. 116,000 customers with natural gas. The gas storage capacity is 401 million m3.
eBITdA
1.6With around one million customers, Markets is Denmark’s largest electri-city and gas supplier.
The focus area is the Northern european market, where electricity, gas and related products are sold.
Exploration & Production
The activities in exploration & Production focus on buildingup gas reserves to underpin the gas sales activities, and production of oil and natural gas. In 2006, production amounted to 13.8 million boe.
Geographical focus areas for the exploration and production activities
0
1,000
2,000
3,000
4,000
5,000
6,000
EBITRevenue
Exploration & Production
20052006
2,437
4,346
5,556
1,412
DKKm
eBITdA
3.5The exploration and production activities are carried out in Danish, Norwegian, UK and faroese waters. DONG energy also operates Denmark’s only oil pipe-line, which takes the oil from the North Sea to the fredericia oil terminal.
Gas storage facility near Stenlille on Zealand
0
2,000
4,000
6,000
8,000
EBITRevenue
Generation
1,517
114
7,620
-1
DKKm
20052006
Offshore windfarms
Onshore windfarms
Central power stations Hydropower
At the end of 2006, the generating capacity from power stations was 5.7 GW, while the capacity from wind power and hydropower-based stations was 0.9 GW.Power generation in 2006: 13,200 GWhHeat generation in 2006: 17,165 TJ
eBITdA
2.7Generation produces energy from efficient power stations and rene-wable energy sources. Generation is a market leader within design, construction and operation of offshore wind farms and clean coal technology.
Generation
CompAny InformATIon AT 31 deCemBer 2006
Kresten philipsen, b. 1945. Joined the Supervisory board in 2006.
Term of office expires in 2007.
Other managerial posts and Supervisory board memberships:
Sydbank A/S (Chairman)
Privathospitalet A/S (Chairman)
DTL A/S Dansk-Tysk Landbrugsinvestering (member)
CSC Datalab A/S (Chairman)
CSC Scandihealth A/S (Chairman)
Dansk Affald A/S (Chairman)
Dansk retursystem A/S (Chairman)
Syd energi Holding A/S (Chairman)
Syd energi amba (Chairman)
Netsam A/S (member)
Det Danske Hedeselskab af 01.01.2002 A/S (member)
A/S Plantningsselskabet Sønderjylland (member)
Jesper magtengaard,**b. 1947. Joined the Supervisory board in 2003.
Term of office expires in 2007.
Jens Kampmann, b. 1937. Joined the Supervisory board in 2005.
Term of office expires in 2007.
Other managerial posts and Supervisory board memberships:
Sund og bælt Holding A/S (Chairman)
Öresundsbro Konsortiet Ab (Chairman)
HMK Holding A/S (Chairman)
retrocom Holding A/S (member)
Desmi A/S (Chairman)
frydenholm Holding A/S (Chairman)
Lars Torpe Christoffersen,b. 1964. Joined the Supervisory board in
2004, re-elected 2006.
Term of office expires in 2007.
Other managerial posts and Supervisory
board memberships:
Aktieselskabet Danatech engineering
(member)
LTC Holding A/S (member)
Telefaction A/S (member)
Actimizer A/S (member)
Capidea A/S (member)
poul Arne nielsen,b. 1944. Joined the Supervisory board in 2006.
Term of office expires in 2007.
Other managerial posts and Supervisory
board memberships:
Ny Stevns Municipality (Mayor)
SeAS-NVe a.m.b.A. (Chairman)
SeAS NVe Holding A/S (Chairman)
SeAS-NVe Strømmen A/S (Chairman)
SeAS Transmission A/S (Chairman)
Dagbladet/frederiksborg Amtsavis A/S (Chairman)
Østtrafik A/S (Deputy Chairman)
SAMPeNSION A/S (member)
suPErvisory boArD*
niels Berg-HansenOther managerial posts
and Supervisory board
memberships:
None
ExEcutivE boArD*
Carsten Krogsgaard Thomsen ***Other managerial posts
and Supervisory board
memberships:
energiGruppen Jylland
A/S (Deputy Chairman)
energiGruppen Jylland
Varme A/S (member)
NNIT A/S (member)
Kurt Bligaard pedersenOther managerial posts
and Supervisory board
memberships:
brfkredit A/S
(member)
Lars Clausen **** Other managerial
posts and Supervisory
board memberships:
None
Anders eldrup ***(CeO)
Other managerial
posts and Supervi-
sory board member-
ships:
None
Søren gath HansenOther managerial
posts and Supervisory
board memberships:
None
Bent Stubkjær pedersen,** b. 1953. Joined the Supervisory board in 2002, re-elected
2003. Term of office expires in 2007.
Other managerial posts and Supervisory board member-
ships: energiGruppen Jylland A/S (member)
Asbjørn Larsen,b. 1936. Joined the Supervisory board in 2003, re-elected
2005, 2006.
Term of office expires in 2007.
Other managerial posts and Supervisory board member-
ships:
belships ASA (Chairman)
fMC Technologies Inc. (member)
Saga fjordbase AS (Deputy Chairman)
Selvaag Gruppen AS (member)
Svend Sigaard, b. 1958. Joined the Supervisory board in 2002, re-elected
2004, 2006. Term of office expires in 2007.
Other managerial posts and Supervisory board member-
ships:
Nebraska ApS (CeO)
boConcept Holding A/S (Chairman)
Stjernholm A/S (Chairman)
DanTruck-Heden (Deputy Chairman)
Aalborg Industries Holding A/S (member)
Investering og Tryghed A/S (member)
Muehlhan A/S (member)
Thorkild meiner-Jensen,**b. 1944. Joined the Supervisory board in 1981, re-elected 1983,
1985, 1987, 1991, 1995, 1999, 2002, 2003.
Term of office expires in 2007.
Lars nørby Johansen (Deputy Chairman),
b. 1949. Joined the Supervisory board in 1997, re-elected 1998,
2000, Deputy Chairman 2001, 2003, 2005, 2006.
Term of office expires in 2007.
Other managerial posts and Supervisory board memberships:
falck A/S (Chairman)
TV2/Danmark A/S (Chairman)
William Demant Holding A/S (Deputy Chairman)
Stig Jørgensen og Partners AS (Chairman)
fritz H. Schur (Chairman),
b. 1951. Joined the Supervisory board in 2005 as Chairman.
Term of office expires in 2007.
Other managerial posts and Supervisory board memberships:
fritz Schur Gruppen (CeO)
CeO and/or Chairman in companies of the fritz Schur Group
Post Danmark A/S (Chairman)
f. Uhrenholt Holding A/S (Chairman)
brd. Klee A/S (Deputy Chairman)
byrumLabflex A/S (member)
SAS Ab (member)
De POST NV/LA POSTe SA (member) * Other managerial posts and Supervisory board memberships
refer solely to posts in Danish or foreign public limited companies.
** employee representative.
*** registered with the Danish Commerce and Companies Agency as CeO.
Carsten Krogsgaard Thomsen was registered at 1 January 2007 as CfO.
**** Joined the executive board at 1 January 2007.
AuDitorsKPMG c.Jespersen
statsautoriseret revisionsinteressentskab
Deloitte
statsautoriseret revisionsaktieselskab
DoNG ENErGy A/sKraftværksvej 53
skærbæk
7000 Fredericia
Denmark
tel. +45 9955 1111
Fax +45 7556 4477
www.dongenergy.com
reg. No. 36 21 37 28
shArEholDErsboE service A/s 1.16%
Energi horsens Net holding A/s 4.30%
Ess Net A/s 6.95%
Galten Elværk Net A/s 0.91%
GEv Net A/s 0.10%
Nyborg Elnet A/s 0.61%
Østjysk Energi Net A/s 2.11%
sEAs-NvE holding A/s 10.88%
the Danish state through the
Ministry of Finance 72.98%
electricity and gas markets
Sales offices
energy exchanges and hubs
DKKbn
DKKbn
DKKbn
DKKbn
DKKbn
DKKbn
DKKbn
DKKbn
electricity sales in 2006:5,870 GWh
Gas sales in 2006:8,202 million m3
Omslag arsrapport_UK.indd 2 26/03/07 17:21:23
ANNuAl rEPort 2006
DoNG ENErGy A/s
Kraftværksvej 53skærbæk7000 FredericiaDenmark
tel. +45 9955 1111Fax +45 7556 4477
DoNG ENErGy A/sAnnual report 2006editorial offi ce: DONG energy, Group financeDesign, production and printing: DatagrafPhotos: Jasper Carlberg and Thomas PriskornThis report was printed by an ISO 14001 eco-certifi ed and eMAS-registered printing fi rm, using chlorine-free paperand vegatable inks.
editorial work was completed on 12 March 2007.
ISbN: 87-91906-04-0Annual report 2006 08.11.29.01
ConTenTS
mArKeTS dISTrIBuTIon
Markets sells DONG energy’s electricity, natural gas and related products to more than one million customers in Denmark, Sweden, Germany and the Netherlands. The customers include residential customers, industrial customers, public sector customers and wholesale customers.
Distribution takes care of DONG energy’s electricity and gas distribution and storage of natural gas in Denmark.The electricity distribution takes place in the metropolitan area and in North Zealand while the gas distribution covers southern Jutland and South and West Zealand.
generATIon
Generation produces energy from effi cient power stations and renewable energy sources. Generation is a market leader within design, construction and operation of offshore wind farms and clean coal technology.
exploration & Production creates value through oil and gas production and procurement of gas at competitive prices.The exploration and production activities are carried out in Danish, Norwegian, UK and faroese waters.
expLorATIon & produCTIon
DONG energy in brief CoverPreface 2Management’s review Consolidated fi nancial highlights 6 Major highlights and outlook for 2007 7 Generation 12 exploration & Production 16 Distribution 20 Markets 24 employees 28 Safety and environment 30 risk management 32 Corporate governance 38
DO
NG
eN
er
GY
/ AN
NU
AL r
eP
Or
T 200
6
financial review 42Management statement and Auditors’ report 47Consolidated income statement 49Consolidated balance sheet 50Consolidated statement of changes in equity 52Consolidated cash fl ow statement 54Notes 55Company information Coverfinancial statements of the parent company Cover(CD-rOM enclosed*)
* The fi nancial statements of the parent company, DONG energy A/S, that appear
from the enclosed CD-rOM, form an integral part of the overall annual report.
the fi nancial statements of the parent company, DoNG Energy A/s,
that appear from the enclosed cD-roM, form an integral part of the overall
annual report. Parts of the parent company’s fi nancial statements
appear in the printed part of the annual report only, as these parts are
identical to the corresponding parts in the consolidated fi nancial
statements. the parts in question are: statement by the Executive
and supervisory boards, independent auditors’ report, management’s
review, and the parts of the accounting policies that are identical
for the Group and the parent company.
12 20 2416
Omslag arsrapport_UK.indd 1 30/03/07 11:19:17