12.1 inverse functions for an inverse function to exist, the function must be one-to-one. one-to-one...
TRANSCRIPT
12.1 Inverse Functions
• For an inverse function to exist, the function must be one-to-one.
• One-to-one function – each x-value corresponds to only one y-value and each y-value corresponds to only one x-value.
• Horizontal Line Test – A function is one-to-one if every horizontal line intersects the graph of the function at most once.

12.1 Inverse Functions
• f-1(x) – the set of all ordered pairs of the form (y, x) where (x, y) belongs to the function f. Note:
• Since x maps to y and then y maps back to x it follows that:
)(
11
xf(x) f -
xyff(x)f - )()( 11
12.1 Inverse Functions
• Method for finding the equation of the inverse of a one-to-one function:
1. Interchange x and y.
2. Solve for y.
3. Replace y with f-1(x)
)(xfy

12.1 Inverse Functions• Example:
1. Interchange x and y.
2. Solve for y.
3. Replace y with f-1(x)
5)3( 3 yx
5)3( 3 xy
yx
yx
yx
35
35
)3(5
3
3
3
35)( 31 xxf

12.1 Inverse Functions
• Graphing inverse functions: The graph of an inverse function can be obtained by reflecting (getting the mirror image) of the original function’s graph over the line y = x
12.2 Exponential Functions
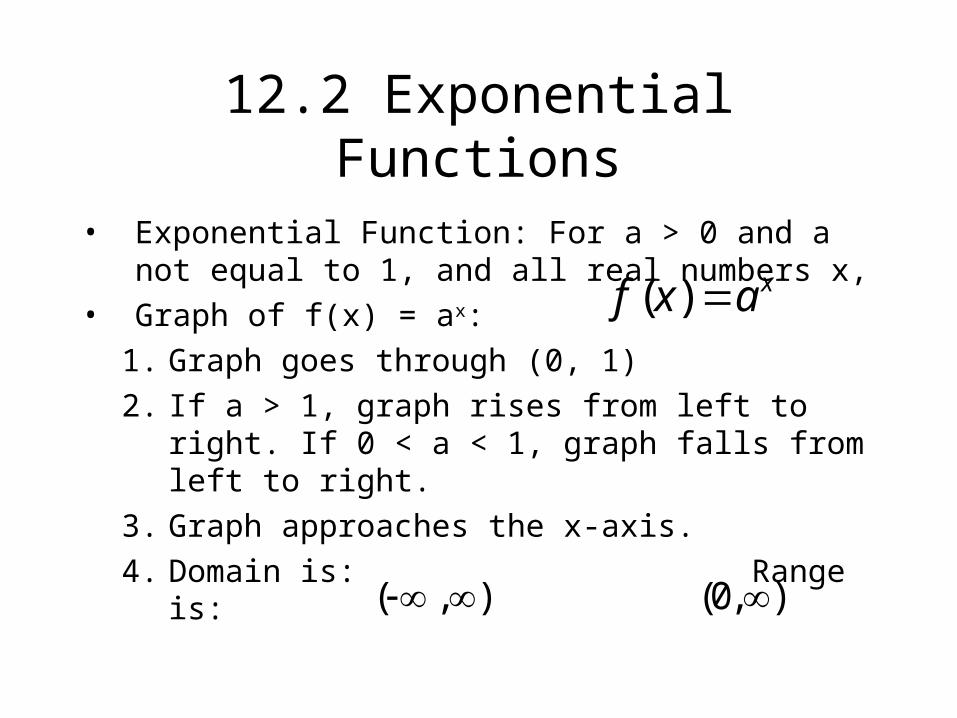
• Exponential Function: For a > 0 and a not equal to 1, and all real numbers x,
• Graph of f(x) = ax:
1. Graph goes through (0, 1)
2. If a > 1, graph rises from left to right. If 0 < a < 1, graph falls from left to right.
3. Graph approaches the x-axis.
4. Domain is: Range is:
xaxf )(
),( ),0(

12.2 Exponential Functions Graph of an Exponential Function
xaxf )(
(0, 1)

12.2 Exponential Functions
• Property for solving exponential equations:
• Solving exponential equations:
1. Express each side of the equation as a power of the same base
2. Simplify the exponents
3. Set the exponents equal
4. Solve the resulting equation
yxaa yx

12.2 Exponential Functions
• Example: Solve: 9x = 27
23
32
32
32
33
)3()3(
xx
x
x

12.3 Logarithmic Functions
• Definition of logarithm:
• Note: logax and ax are inverse functions
• Since b1 = b and b0 = 1, it follows that:logb(b) = 1 and logb(1) = 0
ya axxy log

12.3 Logarithmic Functions
• Logarithmic Function: For a > 0 and a not equal to 1, and all real numbers x,
• Graph of f(x) = logax :
1. Graph goes through (0, 1)
2. If a > 1, graph rises from left to right. If 0 < a < 1, graph falls from left to right.
3. Graph approaches the y-axis.
4. Domain is: Range is:
xxf alog)(
),0( ),(

12.3 Logarithmic Functions Graph of an Exponential Function
xaxf )(
Try to imagine the inverse function

12.3 Logarithmic Functions Inverse - Logarithmic Function
)(log)( xxf a

12.3 Logarithmic Functions
• Example: Solve x = log1255
In exponential form:
In powers of 5:
Setting the powers equal: 3131 xx
xx 3131 55)5(5
x1255

12.4 Properties of Logarithms
• If x, y, and b are positive real numbers whereProduct Rule:
Quotient Rule:
Power Rule:
Special Properties:
yxy
xbbb logloglog
yxxy bbb logloglog 1b
xrx br
b loglog
xbxb xxb
b log and log

12.4 Properties of Logarithms
• Examples:Product Rule:
Quotient Rule:
Power Rule:
Special Properties:
yyy 10101010 log3log1000log
1000log
xxx 3333 log2log9log9log
3log43log 54
5
37112log 37112
13.1 Additional Graphs of Functions Absolute Value Function
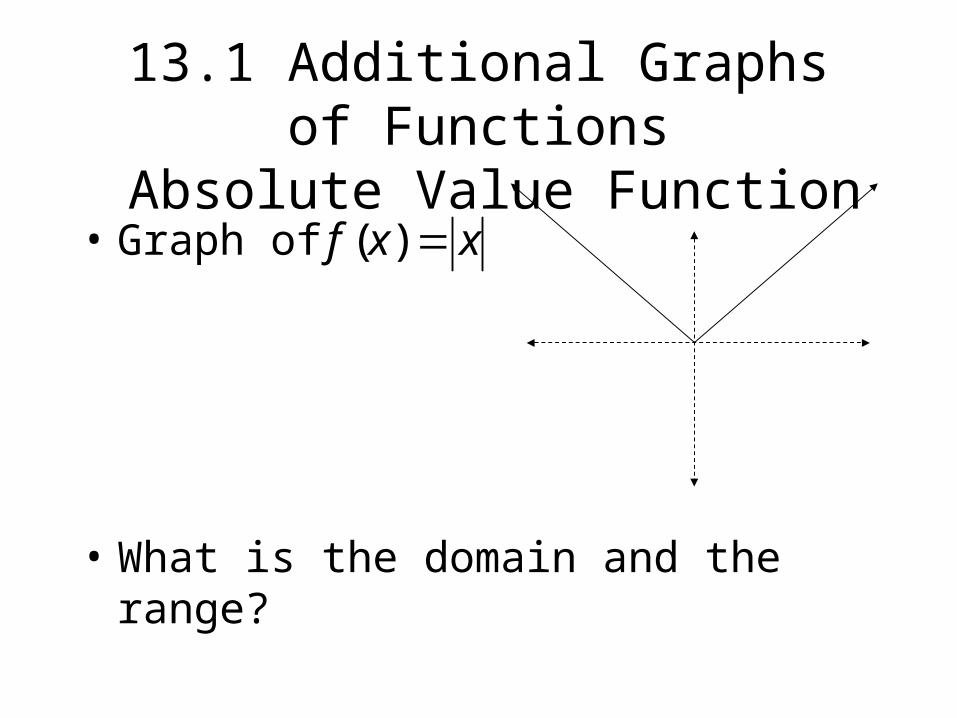
• Graph of
• What is the domain and the range?
xxf )(

13.1 Additional Graphs of Functions Graph of a Square Root Function
• Graph of
(0, 0)
xxf )(

13.1 Additional Graphs of Functions Graph of a Greatest Integer Function
• Graph of
Greatest integerthat is less than orequal to x
xxf )(

13.1 Additional Graphs of Functions Shifting of Graphs
• Vertical Shifts:The graph is shifted upward by k units
• Horizontal shifts:The graph is shifted h units to the right
• If a < 0, the graph is inverted (flipped)• If a > 1, the graph is stretched (narrower)
If 0 < a < 1, the graph is flattened (wider)
kxfy )(
)( hxfy
)(xfay
13.1 Additional Graphs of Functions
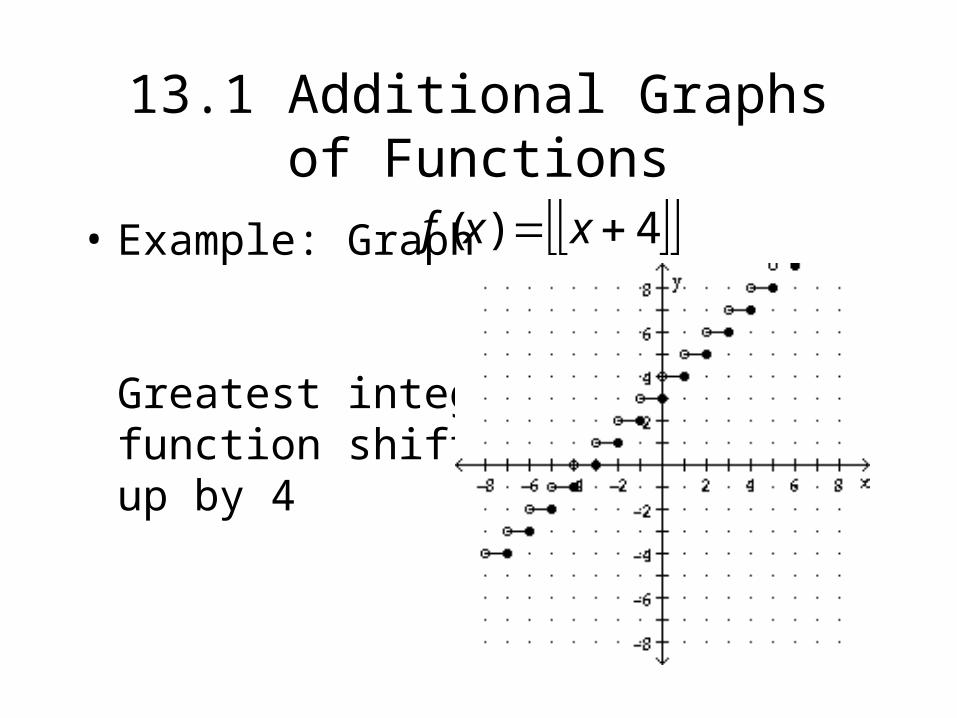
• Example: Graph
Greatest integerfunction shiftedup by 4
4)( xxf

13.1 Additional Graphs of Functions Composite Functions
• Composite function: function of a functionf(g(x)) = (f g)(x)
Example: if f(x) = 2x – 1 and g(x) = x2 thenf(g(x)) = f(x2) = 2x2 – 1
• What is g(f(2))?
• Does f(g(x)) = g(f(x))?