12/27/16 viewed last - united states tax court · alaska kodiak island borough 1,942 2,280 2403...
TRANSCRIPT
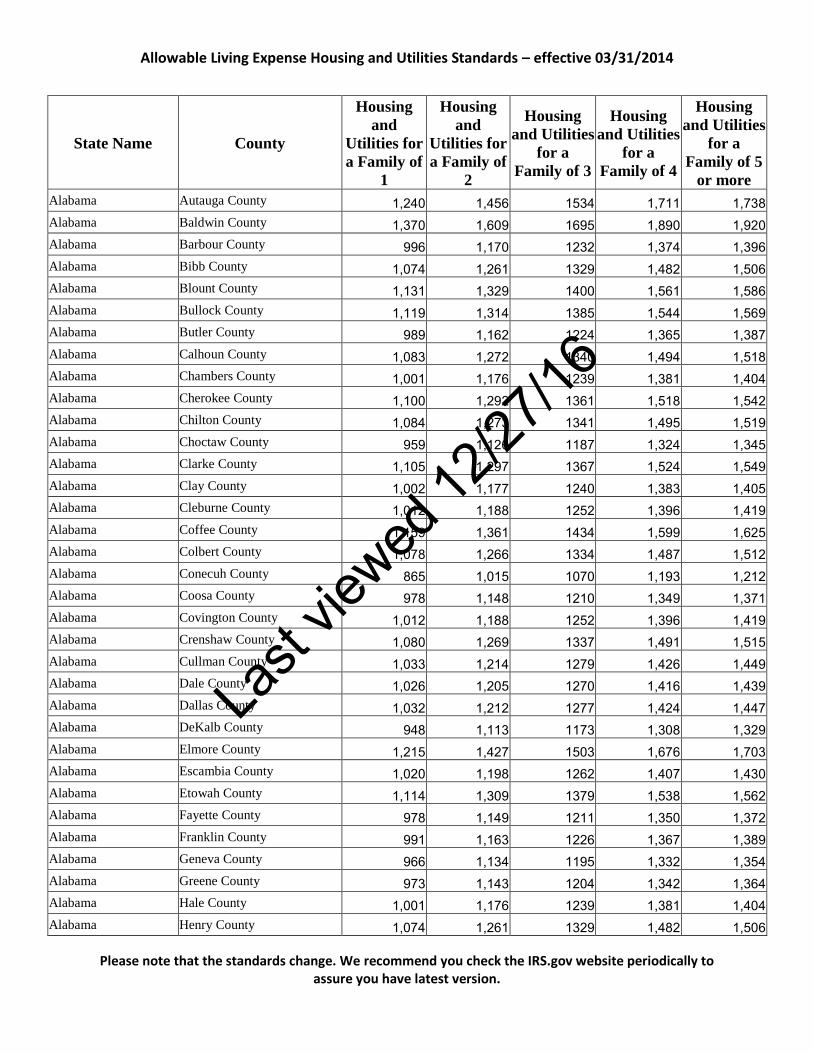
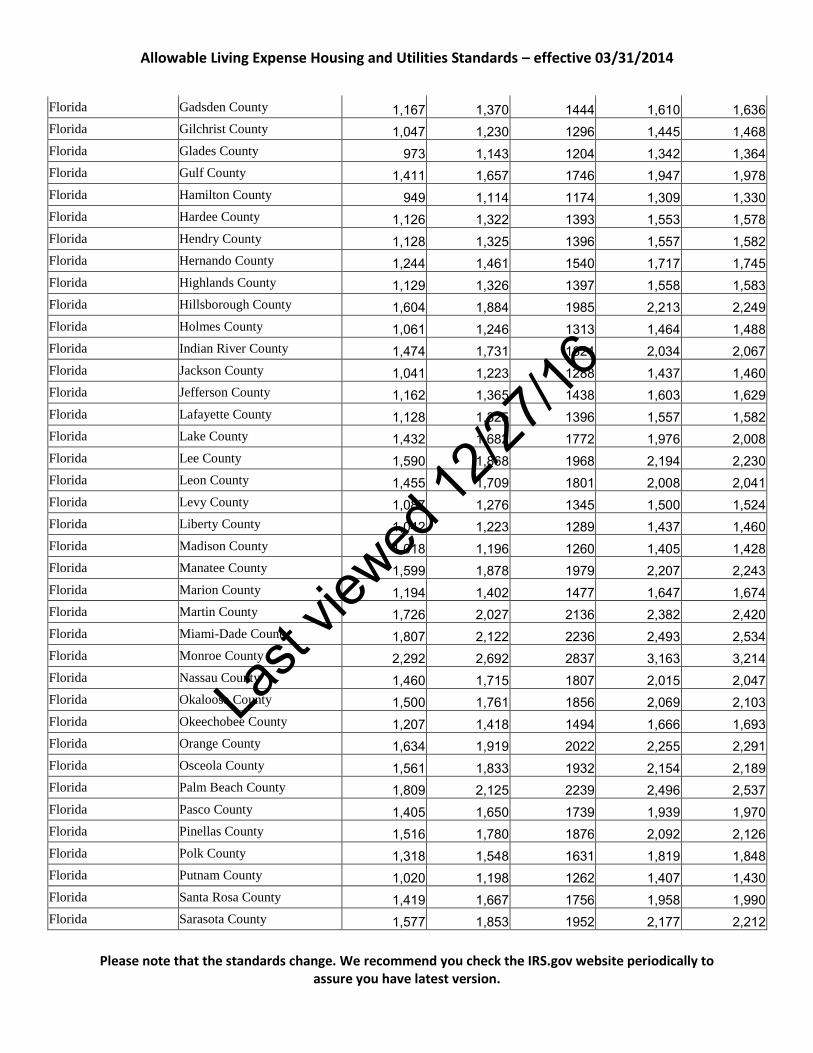
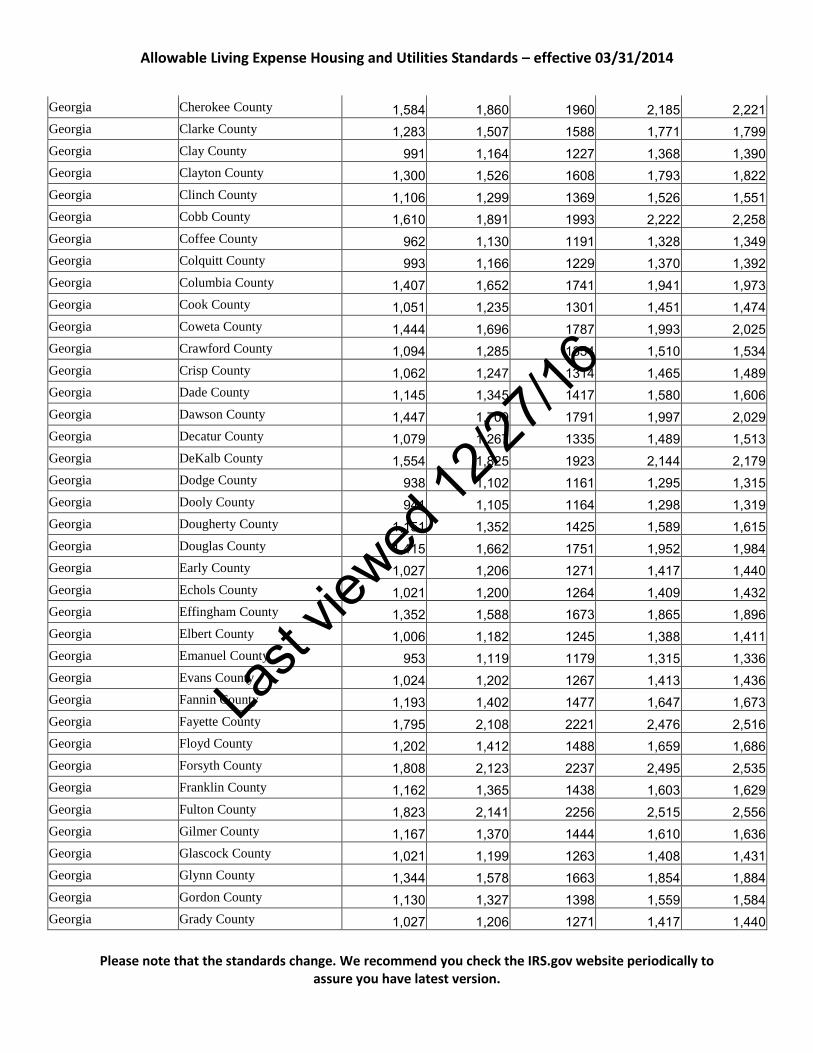
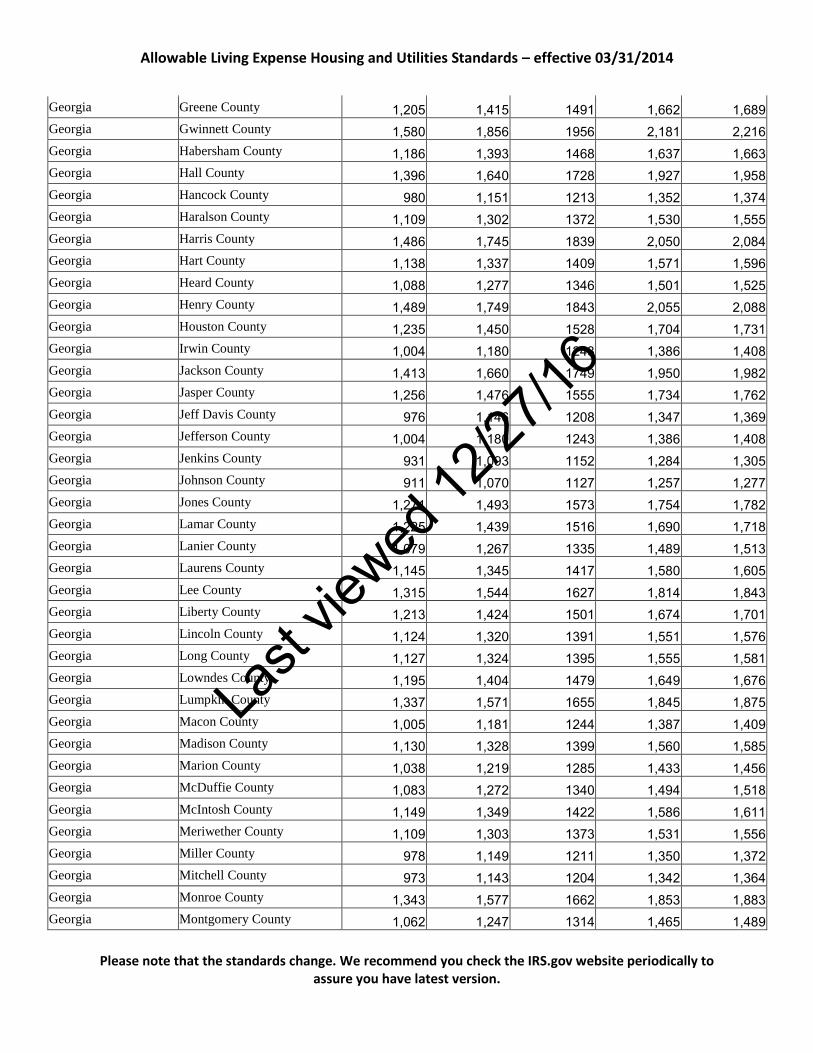
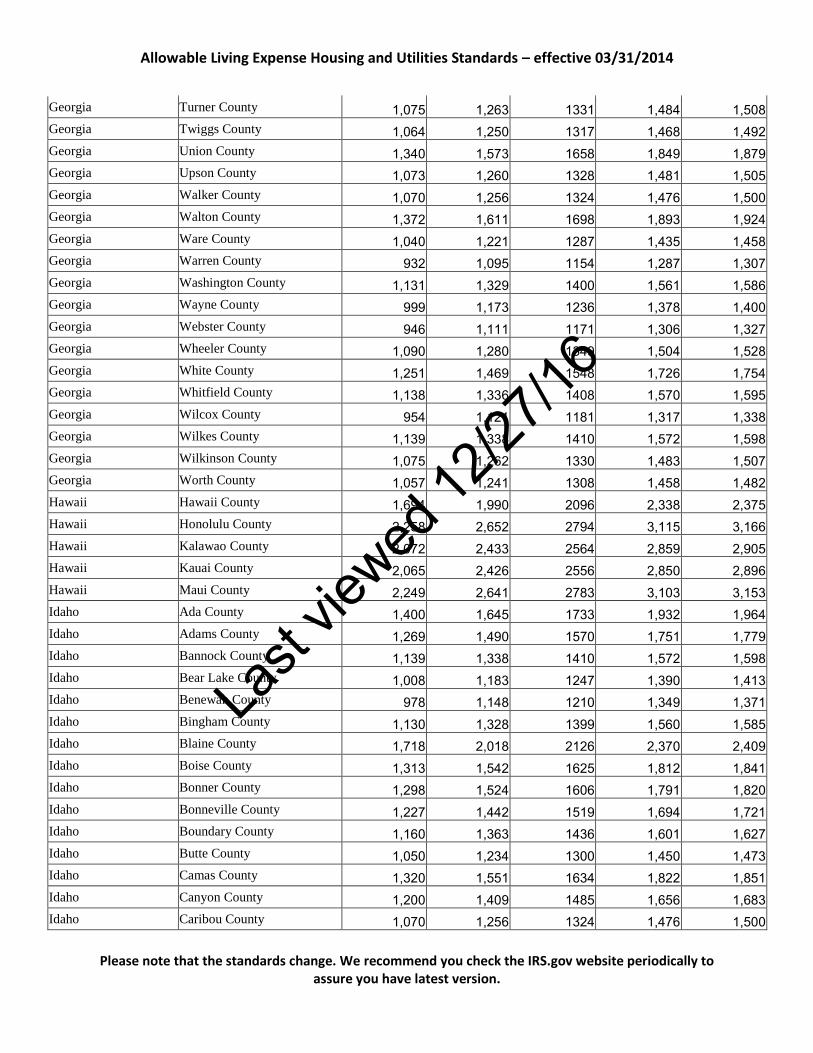
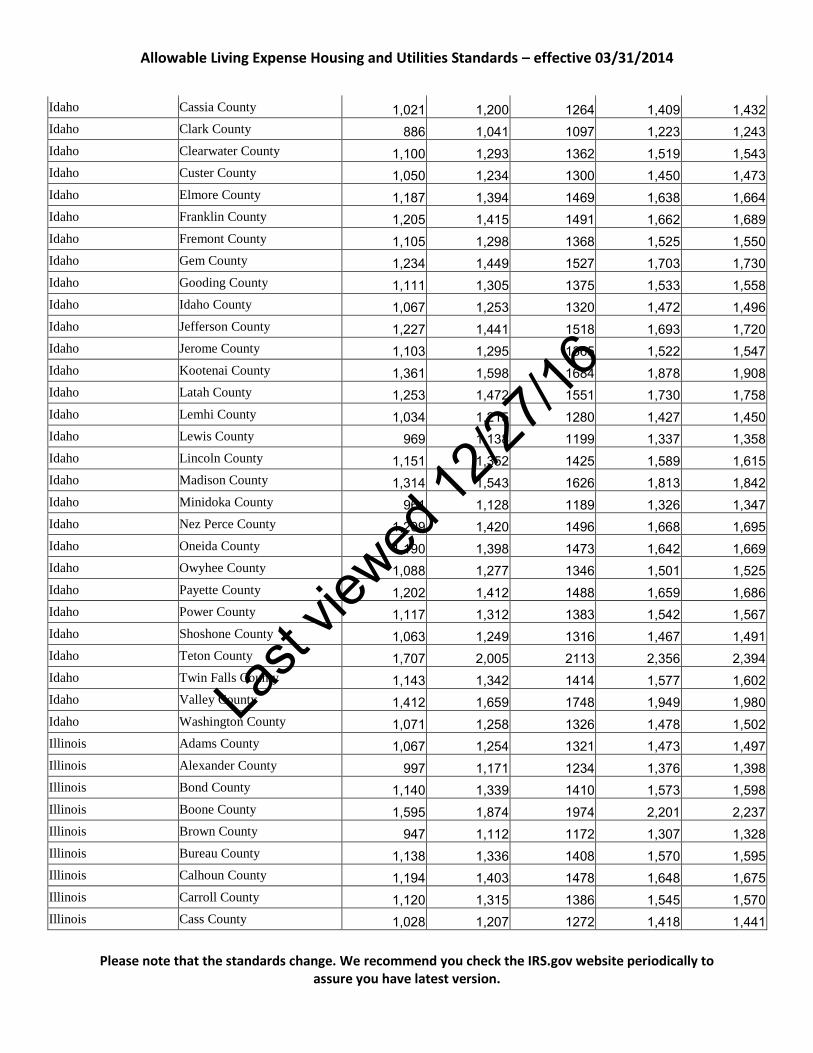
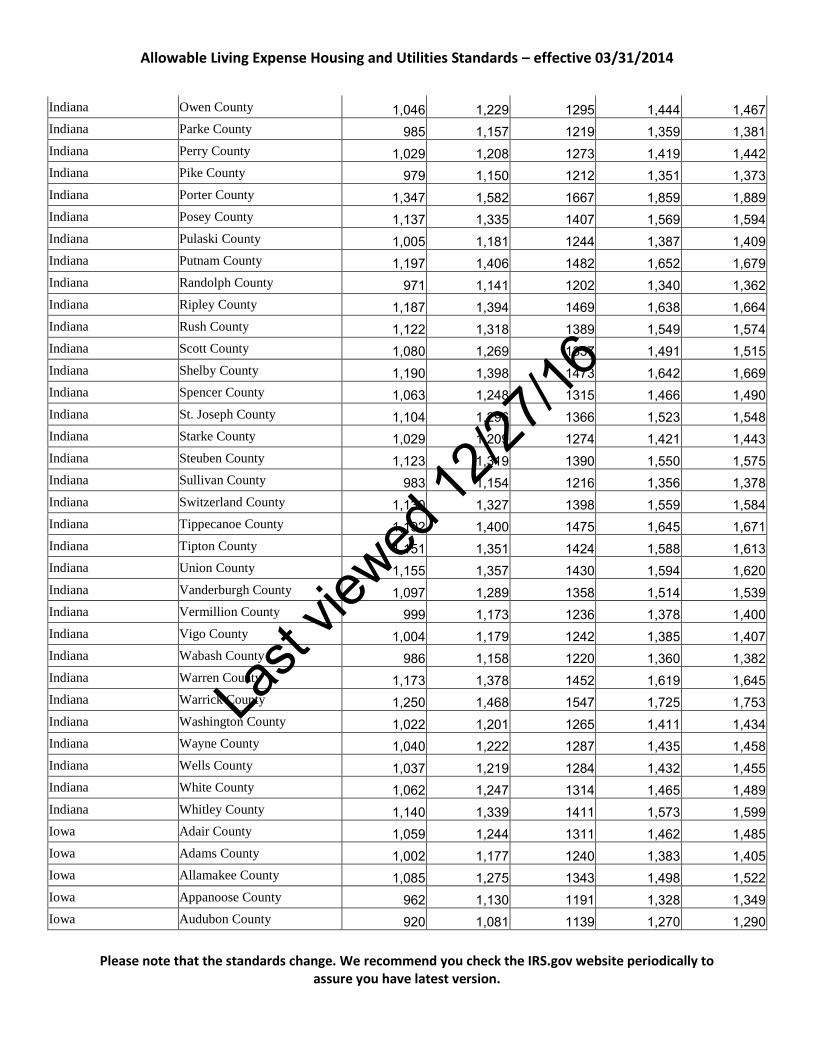
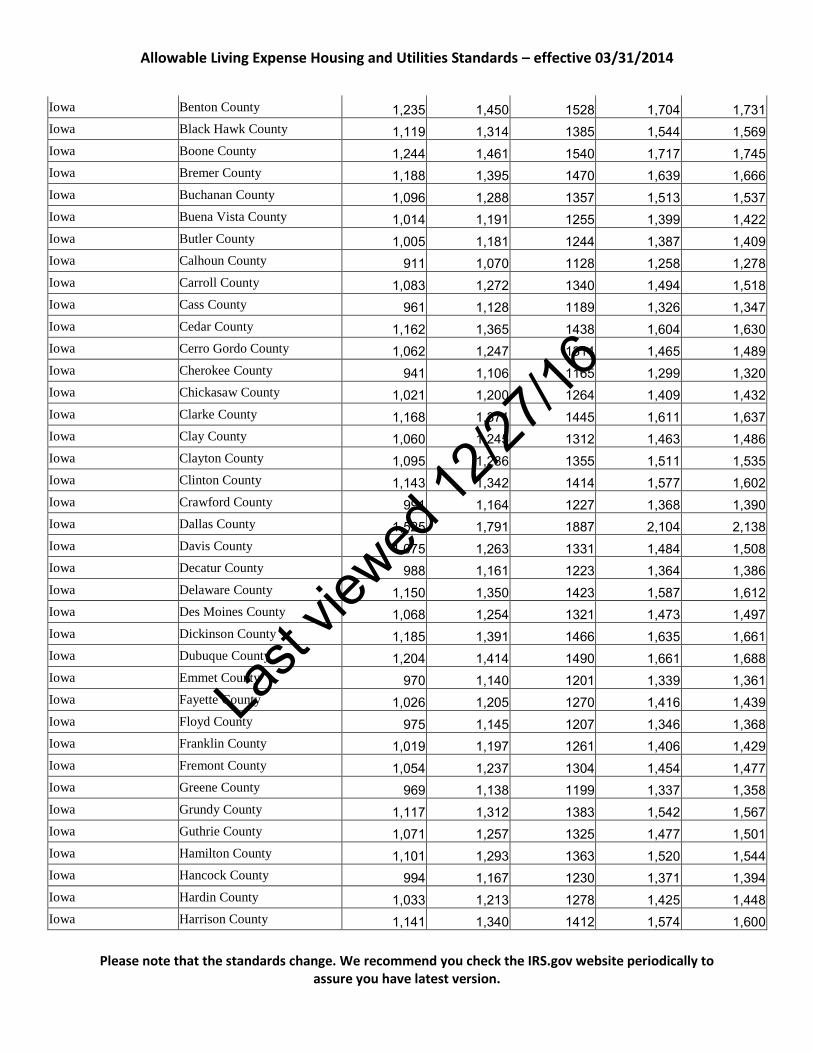
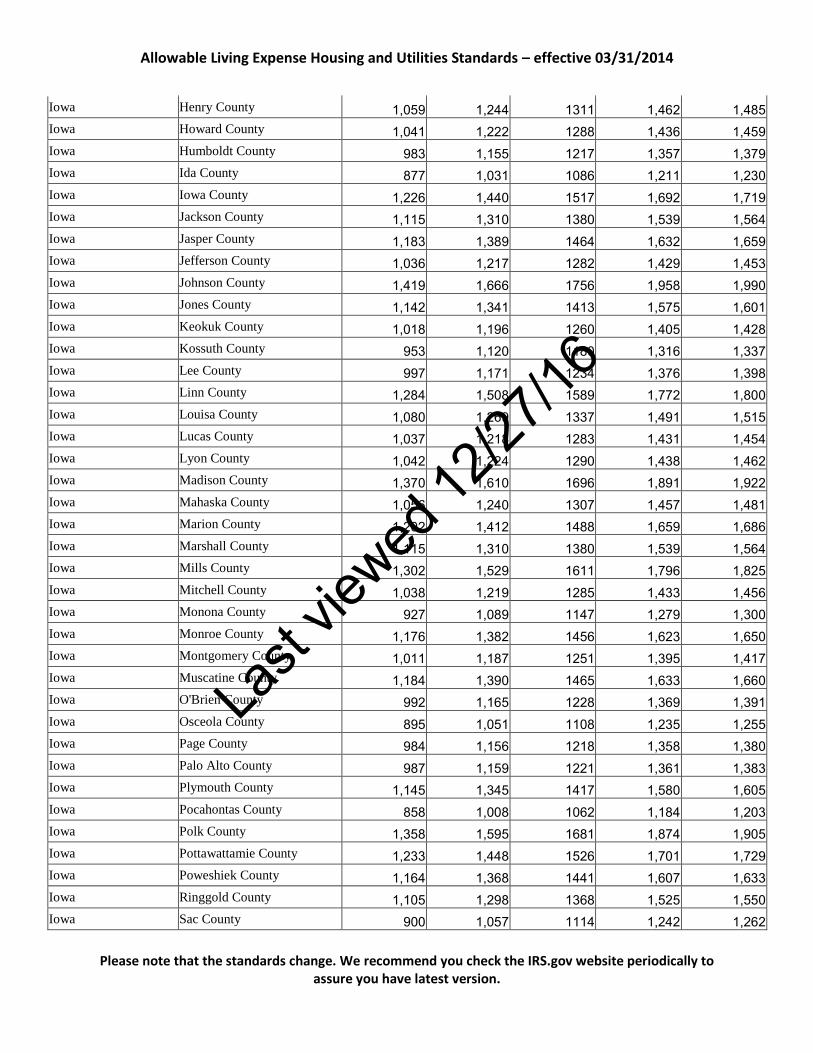
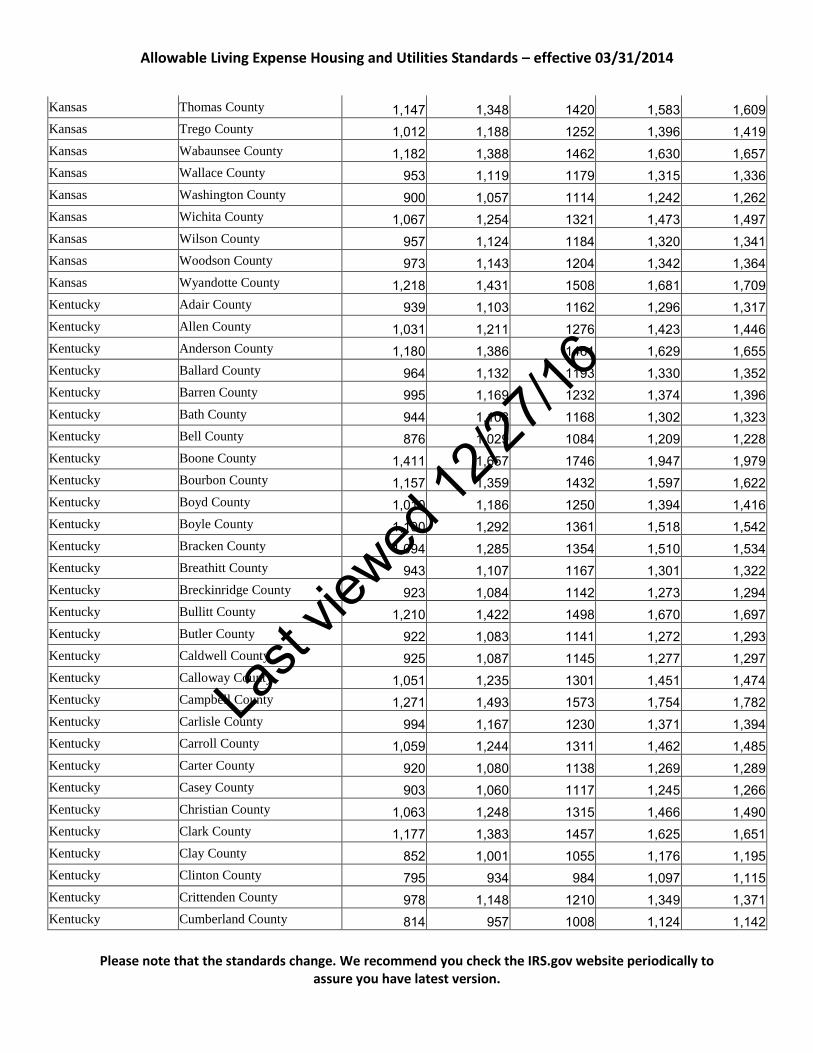
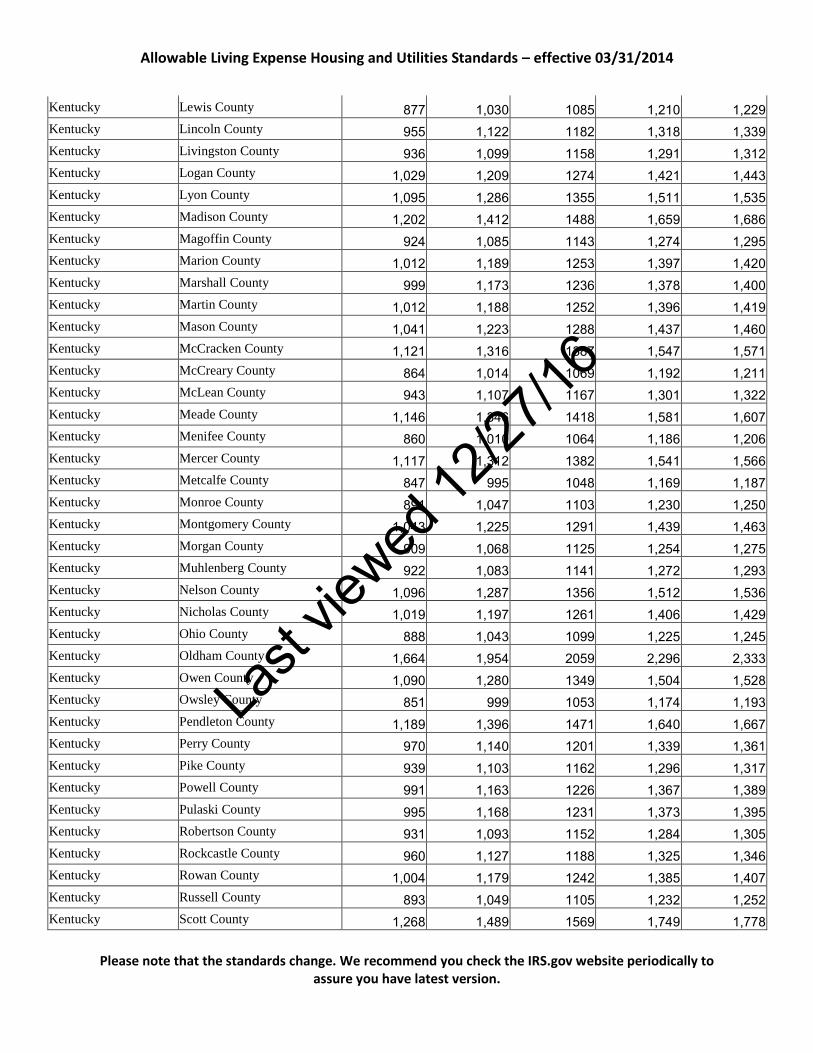
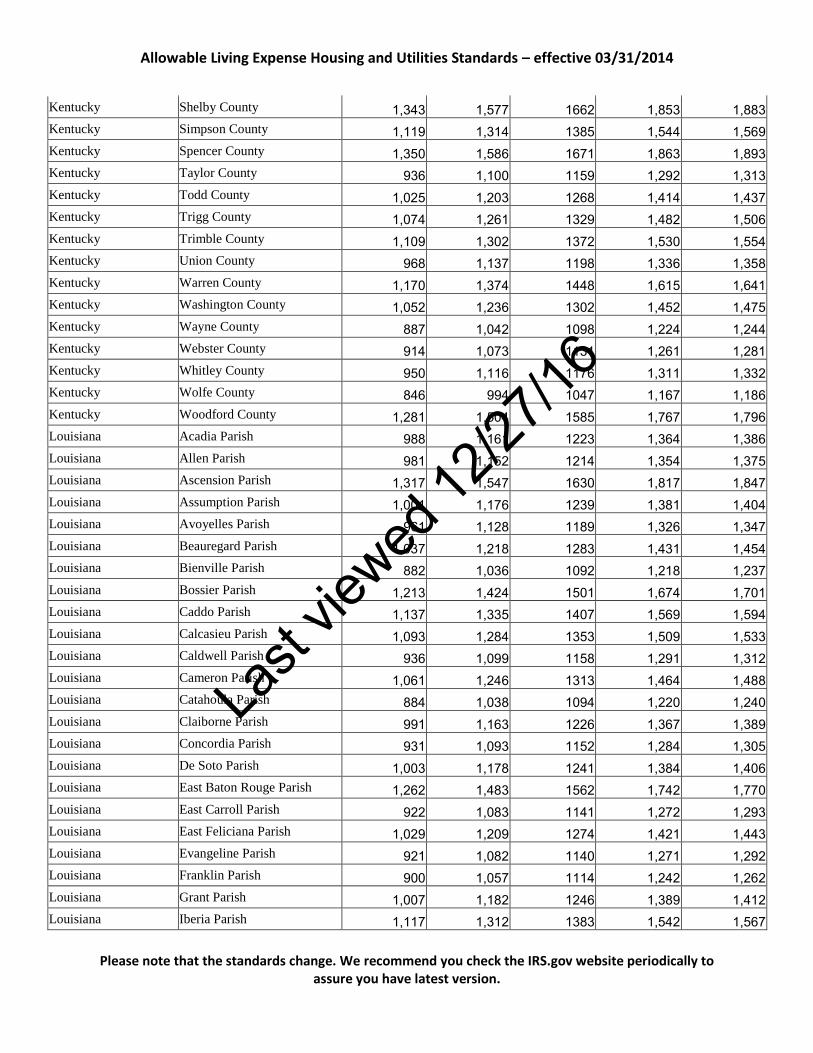
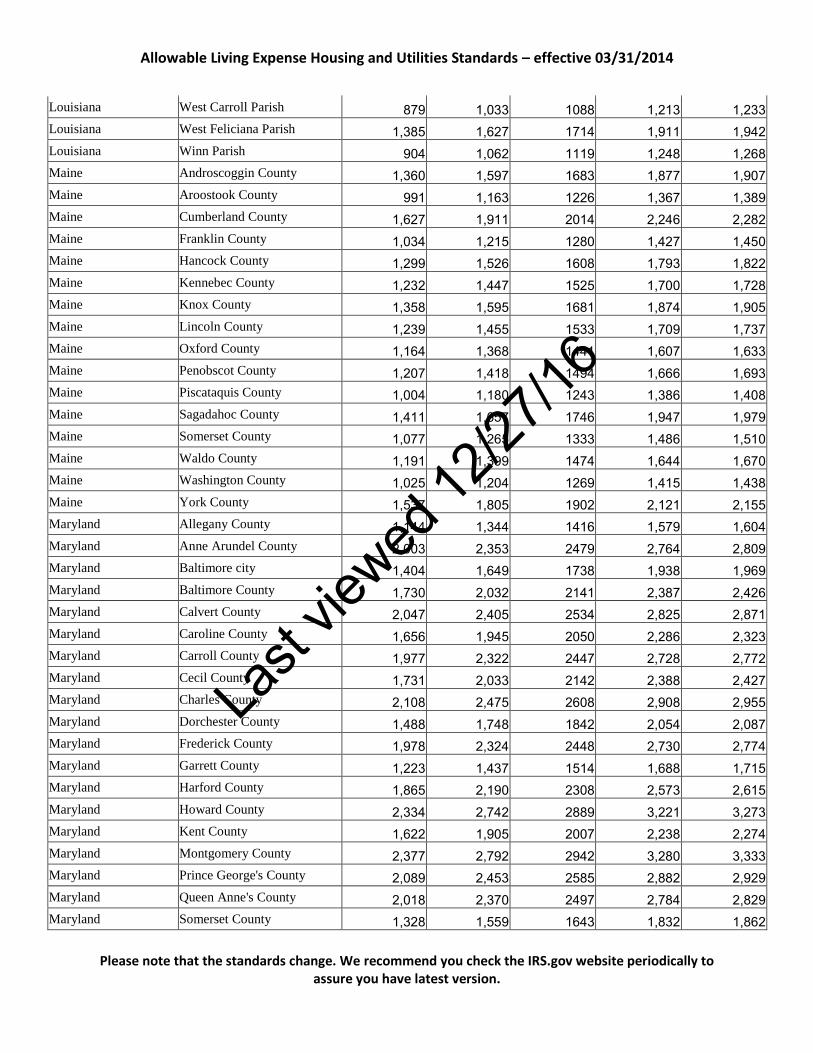
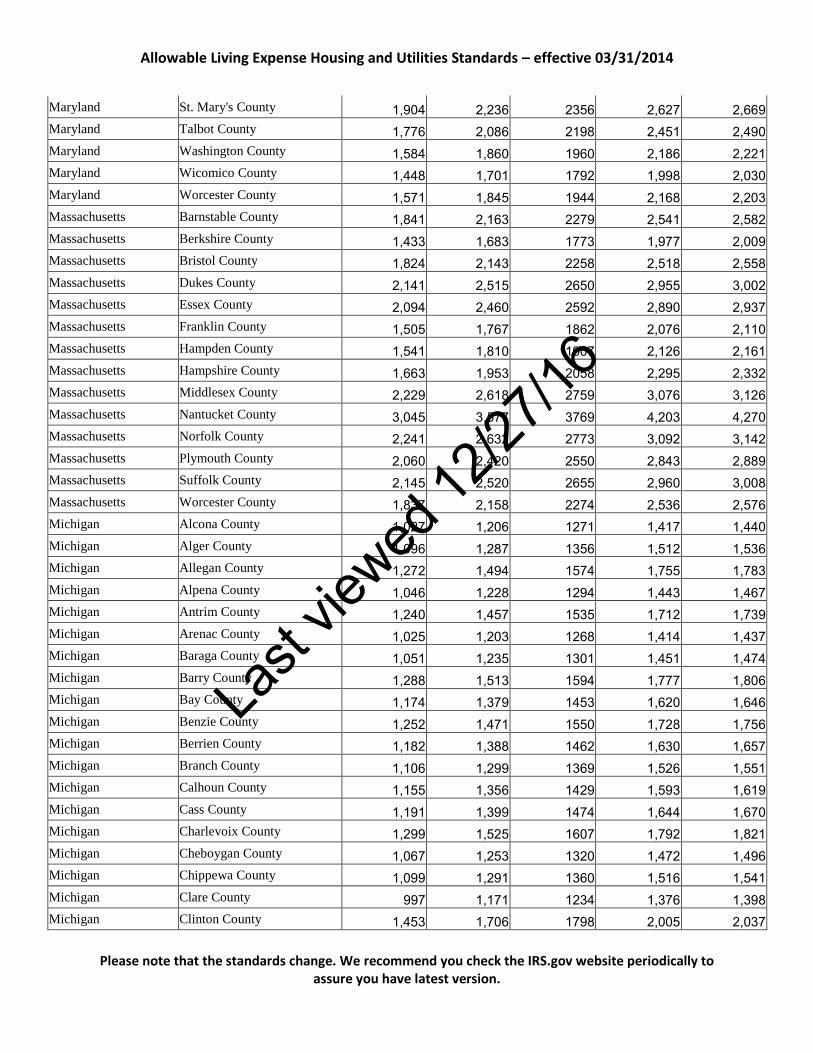
Allowable Living Expense Housing and Utilities Standards – effective 03/31/2014
State Name County
Housing
and
Utilities for
a Family of
1
Housing
and
Utilities for
a Family of
2
Housing
and Utilities
for a
Family of 3
Housing
and Utilities
for a
Family of 4
Housing
and Utilities
for a
Family of 5
or more
Alabama Autauga County 1,240 1,456 1534 1,711 1,738 Alabama Baldwin County 1,370 1,609 1695 1,890 1,920 Alabama Barbour County 996 1,170 1232 1,374 1,396 Alabama Bibb County 1,074 1,261 1329 1,482 1,506 Alabama Blount County 1,131 1,329 1400 1,561 1,586 Alabama Bullock County 1,119 1,314 1385 1,544 1,569 Alabama Butler County 989 1,162 1224 1,365 1,387 Alabama Calhoun County 1,083 1,272 1340 1,494 1,518 Alabama Chambers County 1,001 1,176 1239 1,381 1,404 Alabama Cherokee County 1,100 1,292 1361 1,518 1,542 Alabama Chilton County 1,084 1,273 1341 1,495 1,519 Alabama Choctaw County 959 1,126 1187 1,324 1,345 Alabama Clarke County 1,105 1,297 1367 1,524 1,549 Alabama Clay County 1,002 1,177 1240 1,383 1,405 Alabama Cleburne County 1,012 1,188 1252 1,396 1,419 Alabama Coffee County 1,159 1,361 1434 1,599 1,625 Alabama Colbert County 1,078 1,266 1334 1,487 1,512 Alabama Conecuh County 865 1,015 1070 1,193 1,212 Alabama Coosa County 978 1,148 1210 1,349 1,371 Alabama Covington County 1,012 1,188 1252 1,396 1,419 Alabama Crenshaw County 1,080 1,269 1337 1,491 1,515 Alabama Cullman County 1,033 1,214 1279 1,426 1,449 Alabama Dale County 1,026 1,205 1270 1,416 1,439 Alabama Dallas County 1,032 1,212 1277 1,424 1,447 Alabama DeKalb County 948 1,113 1173 1,308 1,329 Alabama Elmore County 1,215 1,427 1503 1,676 1,703 Alabama Escambia County 1,020 1,198 1262 1,407 1,430 Alabama Etowah County 1,114 1,309 1379 1,538 1,562 Alabama Fayette County 978 1,149 1211 1,350 1,372 Alabama Franklin County 991 1,163 1226 1,367 1,389 Alabama Geneva County 966 1,134 1195 1,332 1,354 Alabama Greene County 973 1,143 1204 1,342 1,364 Alabama Hale County 1,001 1,176 1239 1,381 1,404 Alabama Henry County 1,074 1,261 1329 1,482 1,506
Please note that the standards change. We recommend you check the IRS.gov website periodically to assure you have latest version.
Last
viewed
12/27
/16
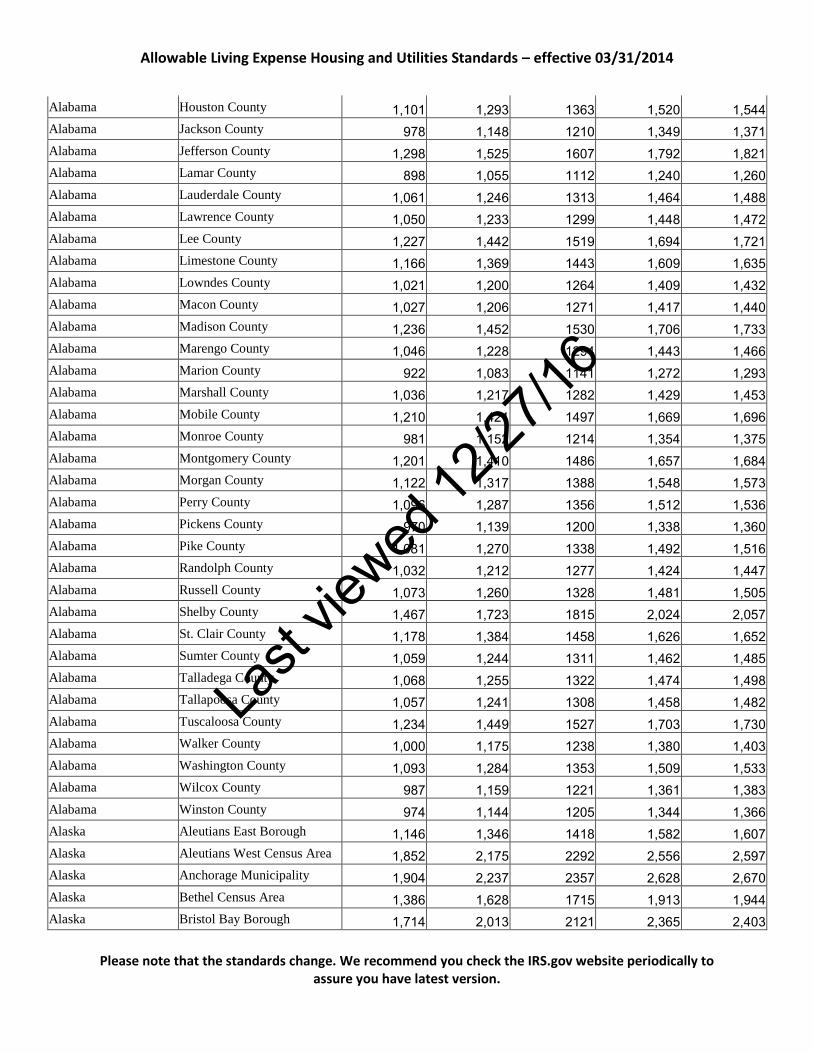
Allowable Living Expense Housing and Utilities Standards – effective 03/31/2014
Please note that the standards change. We recommend you check the IRS.gov website periodically to assure you have latest version.
Alabama Houston County 1,101 1,293 1363 1,520 1,544 Alabama Jackson County 978 1,148 1210 1,349 1,371 Alabama Jefferson County 1,298 1,525 1607 1,792 1,821 Alabama Lamar County 898 1,055 1112 1,240 1,260 Alabama Lauderdale County 1,061 1,246 1313 1,464 1,488 Alabama Lawrence County 1,050 1,233 1299 1,448 1,472 Alabama Lee County 1,227 1,442 1519 1,694 1,721 Alabama Limestone County 1,166 1,369 1443 1,609 1,635 Alabama Lowndes County 1,021 1,200 1264 1,409 1,432 Alabama Macon County 1,027 1,206 1271 1,417 1,440 Alabama Madison County 1,236 1,452 1530 1,706 1,733 Alabama Marengo County 1,046 1,228 1294 1,443 1,466 Alabama Marion County 922 1,083 1141 1,272 1,293 Alabama Marshall County 1,036 1,217 1282 1,429 1,453 Alabama Mobile County 1,210 1,421 1497 1,669 1,696 Alabama Monroe County 981 1,152 1214 1,354 1,375 Alabama Montgomery County 1,201 1,410 1486 1,657 1,684 Alabama Morgan County 1,122 1,317 1388 1,548 1,573 Alabama Perry County 1,096 1,287 1356 1,512 1,536 Alabama Pickens County 970 1,139 1200 1,338 1,360 Alabama Pike County 1,081 1,270 1338 1,492 1,516 Alabama Randolph County 1,032 1,212 1277 1,424 1,447 Alabama Russell County 1,073 1,260 1328 1,481 1,505 Alabama Shelby County 1,467 1,723 1815 2,024 2,057 Alabama St. Clair County 1,178 1,384 1458 1,626 1,652 Alabama Sumter County 1,059 1,244 1311 1,462 1,485 Alabama Talladega County 1,068 1,255 1322 1,474 1,498 Alabama Tallapoosa County 1,057 1,241 1308 1,458 1,482 Alabama Tuscaloosa County 1,234 1,449 1527 1,703 1,730 Alabama Walker County 1,000 1,175 1238 1,380 1,403 Alabama Washington County 1,093 1,284 1353 1,509 1,533 Alabama Wilcox County 987 1,159 1221 1,361 1,383 Alabama Winston County 974 1,144 1205 1,344 1,366 Alaska Aleutians East Borough 1,146 1,346 1418 1,582 1,607 Alaska Aleutians West Census Area 1,852 2,175 2292 2,556 2,597 Alaska Anchorage Municipality 1,904 2,237 2357 2,628 2,670 Alaska Bethel Census Area 1,386 1,628 1715 1,913 1,944 Alaska Bristol Bay Borough 1,714 2,013 2121 2,365 2,403
Last
viewed
12/27
/16
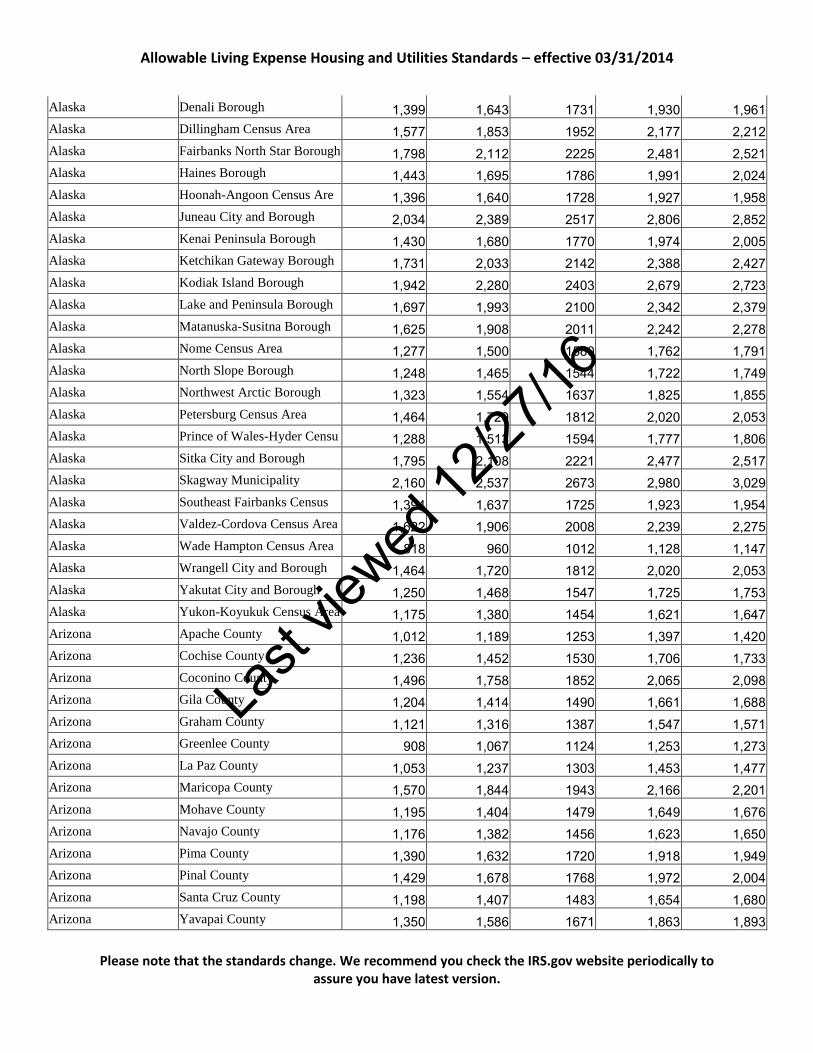
Allowable Living Expense Housing and Utilities Standards – effective 03/31/2014
Please note that the standards change. We recommend you check the IRS.gov website periodically to assure you have latest version.
Alaska Denali Borough 1,399 1,643 1731 1,930 1,961 Alaska Dillingham Census Area 1,577 1,853 1952 2,177 2,212 Alaska Fairbanks North Star Borough 1,798 2,112 2225 2,481 2,521 Alaska Haines Borough 1,443 1,695 1786 1,991 2,024 Alaska Hoonah-Angoon Census Are 1,396 1,640 1728 1,927 1,958 Alaska Juneau City and Borough 2,034 2,389 2517 2,806 2,852 Alaska Kenai Peninsula Borough 1,430 1,680 1770 1,974 2,005 Alaska Ketchikan Gateway Borough 1,731 2,033 2142 2,388 2,427 Alaska Kodiak Island Borough 1,942 2,280 2403 2,679 2,723 Alaska Lake and Peninsula Borough 1,697 1,993 2100 2,342 2,379 Alaska Matanuska-Susitna Borough 1,625 1,908 2011 2,242 2,278 Alaska Nome Census Area 1,277 1,500 1580 1,762 1,791 Alaska North Slope Borough 1,248 1,465 1544 1,722 1,749 Alaska Northwest Arctic Borough 1,323 1,554 1637 1,825 1,855 Alaska Petersburg Census Area 1,464 1,720 1812 2,020 2,053 Alaska Prince of Wales-Hyder Censu 1,288 1,513 1594 1,777 1,806 Alaska Sitka City and Borough 1,795 2,108 2221 2,477 2,517 Alaska Skagway Municipality 2,160 2,537 2673 2,980 3,029 Alaska Southeast Fairbanks Census 1,394 1,637 1725 1,923 1,954 Alaska Valdez-Cordova Census Area 1,622 1,906 2008 2,239 2,275 Alaska Wade Hampton Census Area 818 960 1012 1,128 1,147 Alaska Wrangell City and Borough 1,464 1,720 1812 2,020 2,053 Alaska Yakutat City and Borough 1,250 1,468 1547 1,725 1,753 Alaska Yukon-Koyukuk Census Area 1,175 1,380 1454 1,621 1,647 Arizona Apache County 1,012 1,189 1253 1,397 1,420 Arizona Cochise County 1,236 1,452 1530 1,706 1,733 Arizona Coconino County 1,496 1,758 1852 2,065 2,098 Arizona Gila County 1,204 1,414 1490 1,661 1,688 Arizona Graham County 1,121 1,316 1387 1,547 1,571 Arizona Greenlee County 908 1,067 1124 1,253 1,273 Arizona La Paz County 1,053 1,237 1303 1,453 1,477 Arizona Maricopa County 1,570 1,844 1943 2,166 2,201 Arizona Mohave County 1,195 1,404 1479 1,649 1,676 Arizona Navajo County 1,176 1,382 1456 1,623 1,650 Arizona Pima County 1,390 1,632 1720 1,918 1,949 Arizona Pinal County 1,429 1,678 1768 1,972 2,004 Arizona Santa Cruz County 1,198 1,407 1483 1,654 1,680 Arizona Yavapai County 1,350 1,586 1671 1,863 1,893
Last
viewed
12/27
/16

Allowable Living Expense Housing and Utilities Standards – effective 03/31/2014
Please note that the standards change. We recommend you check the IRS.gov website periodically to assure you have latest version.
Arizona Yuma County 1,220 1,433 1510 1,684 1,711 Arkansas Arkansas County 959 1,126 1187 1,324 1,345 Arkansas Ashley County 925 1,086 1144 1,276 1,296 Arkansas Baxter County 994 1,167 1230 1,371 1,394 Arkansas Benton County 1,240 1,456 1534 1,711 1,738 Arkansas Boone County 985 1,157 1219 1,359 1,381 Arkansas Bradley County 911 1,070 1127 1,257 1,277 Arkansas Calhoun County 912 1,071 1129 1,259 1,279 Arkansas Carroll County 997 1,171 1233 1,375 1,398 Arkansas Chicot County 957 1,124 1184 1,320 1,341 Arkansas Clark County 991 1,164 1227 1,368 1,390 Arkansas Clay County 865 1,016 1071 1,194 1,213 Arkansas Cleburne County 977 1,147 1209 1,348 1,370 Arkansas Cleveland County 968 1,137 1198 1,336 1,358 Arkansas Columbia County 993 1,166 1229 1,370 1,392 Arkansas Conway County 961 1,128 1189 1,326 1,347 Arkansas Craighead County 1,054 1,238 1305 1,455 1,479 Arkansas Crawford County 975 1,145 1207 1,346 1,368 Arkansas Crittenden County 1,103 1,295 1365 1,522 1,547 Arkansas Cross County 961 1,128 1189 1,326 1,347 Arkansas Dallas County 908 1,067 1124 1,253 1,273 Arkansas Desha County 933 1,096 1155 1,288 1,309 Arkansas Drew County 1,013 1,190 1254 1,398 1,421 Arkansas Faulkner County 1,141 1,340 1412 1,574 1,600 Arkansas Franklin County 935 1,098 1157 1,290 1,311 Arkansas Fulton County 874 1,027 1082 1,206 1,226 Arkansas Garland County 1,070 1,256 1324 1,476 1,500 Arkansas Grant County 1,071 1,258 1326 1,478 1,502 Arkansas Greene County 972 1,142 1203 1,341 1,363 Arkansas Hempstead County 962 1,129 1190 1,327 1,348 Arkansas Hot Spring County 946 1,111 1171 1,306 1,327 Arkansas Howard County 912 1,071 1129 1,259 1,279 Arkansas Independence County 939 1,103 1162 1,296 1,317 Arkansas Izard County 840 987 1040 1,160 1,178 Arkansas Jackson County 816 958 1009 1,125 1,144 Arkansas Jefferson County 1,012 1,188 1252 1,396 1,419 Arkansas Johnson County 889 1,044 1100 1,227 1,246 Arkansas Lafayette County 896 1,052 1109 1,237 1,256
Last
viewed
12/27
/16

Allowable Living Expense Housing and Utilities Standards – effective 03/31/2014
Please note that the standards change. We recommend you check the IRS.gov website periodically to assure you have latest version.
Arkansas Lawrence County 780 916 965 1,076 1,093 Arkansas Lee County 889 1,044 1100 1,227 1,246 Arkansas Lincoln County 866 1,017 1072 1,195 1,215 Arkansas Little River County 878 1,031 1086 1,211 1,231 Arkansas Logan County 882 1,036 1092 1,218 1,237 Arkansas Lonoke County 1,102 1,294 1364 1,521 1,545 Arkansas Madison County 972 1,142 1203 1,341 1,363 Arkansas Marion County 882 1,036 1092 1,218 1,237 Arkansas Miller County 1,014 1,191 1255 1,400 1,422 Arkansas Mississippi County 954 1,121 1181 1,317 1,338 Arkansas Monroe County 851 999 1053 1,174 1,193 Arkansas Montgomery County 1,003 1,178 1241 1,384 1,406 Arkansas Nevada County 914 1,073 1131 1,261 1,281 Arkansas Newton County 874 1,027 1082 1,206 1,226 Arkansas Ouachita County 905 1,063 1120 1,249 1,269 Arkansas Perry County 962 1,130 1191 1,328 1,349 Arkansas Phillips County 962 1,129 1190 1,327 1,348 Arkansas Pike County 920 1,080 1138 1,269 1,289 Arkansas Poinsett County 912 1,071 1129 1,259 1,279 Arkansas Polk County 943 1,107 1167 1,301 1,322 Arkansas Pope County 970 1,140 1201 1,339 1,361 Arkansas Prairie County 925 1,087 1145 1,277 1,297 Arkansas Pulaski County 1,236 1,452 1530 1,706 1,733 Arkansas Randolph County 857 1,006 1060 1,182 1,201 Arkansas Saline County 1,196 1,405 1480 1,650 1,677 Arkansas Scott County 924 1,086 1144 1,276 1,296 Arkansas Searcy County 886 1,041 1097 1,223 1,243 Arkansas Sebastian County 1,029 1,209 1274 1,421 1,443 Arkansas Sevier County 969 1,138 1199 1,337 1,359 Arkansas Sharp County 865 1,015 1070 1,193 1,212 Arkansas St. Francis County 916 1,076 1134 1,264 1,285 Arkansas Stone County 854 1,003 1057 1,179 1,198 Arkansas Union County 956 1,123 1183 1,319 1,340 Arkansas Van Buren County 875 1,028 1083 1,208 1,227 Arkansas Washington County 1,220 1,432 1509 1,683 1,710 Arkansas White County 1,025 1,204 1269 1,415 1,438 Arkansas Woodruff County 839 985 1038 1,157 1,176 Arkansas Yell County 920 1,081 1139 1,270 1,290
Last
viewed
12/27
/16

Allowable Living Expense Housing and Utilities Standards – effective 03/31/2014
Please note that the standards change. We recommend you check the IRS.gov website periodically to assure you have latest version.
California Alameda County 2,527 2,968 3127 3,487 3,543 California Alpine County 2,180 2,560 2698 3,008 3,057 California Amador County 1,821 2,139 2254 2,514 2,554 California Butte County 1,572 1,846 1945 2,169 2,204 California Calaveras County 1,788 2,100 2213 2,467 2,507 California Colusa County 1,649 1,937 2041 2,276 2,312 California Contra Costa County 2,545 2,990 3150 3,512 3,569 California Del Norte County 1,462 1,718 1810 2,018 2,051 California El Dorado County 2,201 2,585 2724 3,037 3,086 California Fresno County 1,614 1,895 1997 2,227 2,263 California Glenn County 1,500 1,761 1856 2,069 2,103 California Humboldt County 1,591 1,869 1969 2,195 2,231 California Imperial County 1,531 1,798 1895 2,113 2,147 California Inyo County 1,645 1,932 2036 2,270 2,307 California Kern County 1,540 1,809 1906 2,126 2,160 California Kings County 1,548 1,818 1916 2,136 2,171 California Lake County 1,636 1,922 2025 2,258 2,294 California Lassen County 1,526 1,792 1888 2,105 2,139 California Los Angeles County 2,270 2,667 2810 3,133 3,184 California Madera County 1,646 1,933 2037 2,272 2,308 California Marin County 3,116 3,660 3857 4,301 4,370 California Mariposa County 1,573 1,848 1947 2,171 2,206 California Mendocino County 1,864 2,190 2307 2,573 2,614 California Merced County 1,620 1,903 2005 2,236 2,272 California Modoc County 1,260 1,479 1559 1,738 1,766 California Mono County 2,068 2,429 2560 2,854 2,900 California Monterey County 2,242 2,633 2775 3,094 3,144 California Napa County 2,427 2,851 3004 3,350 3,404 California Nevada County 2,045 2,402 2531 2,822 2,868 California Orange County 2,486 2,920 3077 3,431 3,486 California Placer County 2,273 2,670 2813 3,136 3,187 California Plumas County 1,560 1,833 1931 2,153 2,188 California Riverside County 1,998 2,347 2473 2,757 2,802 California Sacramento County 1,904 2,237 2357 2,628 2,670 California San Benito County 2,484 2,917 3074 3,428 3,483 California San Bernardino County 1,842 2,164 2280 2,542 2,583 California San Diego County 2,289 2,689 2833 3,159 3,210 California San Francisco County 2,937 3,450 3635 4,053 4,119
Last
viewed
12/27
/16

Allowable Living Expense Housing and Utilities Standards – effective 03/31/2014
Please note that the standards change. We recommend you check the IRS.gov website periodically to assure you have latest version.
California San Joaquin County 1,988 2,335 2460 2,743 2,787 California San Luis Obispo County 2,128 2,499 2633 2,936 2,984 California San Mateo County 2,969 3,488 3675 4,098 4,164 California Santa Barbara County 2,243 2,634 2776 3,095 3,145 California Santa Clara County 2,847 3,343 3523 3,928 3,992 California Santa Cruz County 2,550 2,994 3155 3,518 3,575 California Shasta County 1,588 1,865 1965 2,191 2,226 California Sierra County 1,446 1,698 1789 1,995 2,027 California Siskiyou County 1,384 1,626 1713 1,910 1,941 California Solano County 2,157 2,533 2669 2,976 3,024 California Sonoma County 2,305 2,707 2853 3,181 3,232 California Stanislaus County 1,793 2,106 2219 2,474 2,514 California Sutter County 1,655 1,944 2048 2,284 2,320 California Tehama County 1,396 1,640 1728 1,927 1,958 California Trinity County 1,453 1,706 1798 2,005 2,037 California Tulare County 1,450 1,703 1794 2,001 2,033 California Tuolumne County 1,718 2,018 2126 2,370 2,409 California Ventura County 2,413 2,835 2987 3,331 3,384 California Yolo County 2,074 2,436 2567 2,862 2,908 California Yuba County 1,651 1,939 2043 2,278 2,315 Colorado Adams County 1,584 1,860 1960 2,185 2,221 Colorado Alamosa County 1,109 1,303 1373 1,531 1,556 Colorado Arapahoe County 1,633 1,918 2021 2,253 2,290 Colorado Archuleta County 1,434 1,684 1775 1,979 2,011 Colorado Baca County 944 1,108 1168 1,302 1,323 Colorado Bent County 974 1,144 1205 1,344 1,365 Colorado Boulder County 1,821 2,139 2254 2,513 2,554 Colorado Broomfield County 1,791 2,103 2216 2,471 2,511 Colorado Chaffee County 1,340 1,574 1659 1,850 1,880 Colorado Cheyenne County 1,025 1,204 1269 1,415 1,438 Colorado Clear Creek County 1,645 1,932 2036 2,270 2,307 Colorado Conejos County 966 1,134 1195 1,332 1,354 Colorado Costilla County 1,017 1,195 1259 1,404 1,426 Colorado Crowley County 1,005 1,181 1244 1,387 1,409 Colorado Custer County 1,562 1,834 1933 2,155 2,190 Colorado Delta County 1,299 1,526 1608 1,793 1,822 Colorado Denver County 1,576 1,851 1950 2,174 2,209 Colorado Dolores County 1,175 1,380 1454 1,621 1,647
Last
viewed
12/27
/16

Allowable Living Expense Housing and Utilities Standards – effective 03/31/2014
Please note that the standards change. We recommend you check the IRS.gov website periodically to assure you have latest version.
Colorado Douglas County 2,045 2,402 2531 2,822 2,868 Colorado Eagle County 2,113 2,482 2615 2,916 2,963 Colorado El Paso County 1,516 1,780 1876 2,092 2,126 Colorado Elbert County 2,013 2,364 2491 2,778 2,822 Colorado Fremont County 1,190 1,398 1473 1,642 1,669 Colorado Garfield County 1,759 2,066 2177 2,427 2,467 Colorado Gilpin County 1,649 1,936 2040 2,275 2,312 Colorado Grand County 1,431 1,681 1771 1,975 2,007 Colorado Gunnison County 1,681 1,975 2081 2,320 2,358 Colorado Hinsdale County 1,623 1,907 2009 2,240 2,277 Colorado Huerfano County 1,029 1,208 1273 1,419 1,442 Colorado Jackson County 1,083 1,272 1340 1,494 1,518 Colorado Jefferson County 1,703 2,000 2108 2,350 2,388 Colorado Kiowa County 920 1,080 1138 1,269 1,289 Colorado Kit Carson County 1,184 1,390 1465 1,633 1,660 Colorado La Plata County 1,596 1,874 1975 2,202 2,238 Colorado Lake County 1,156 1,358 1431 1,596 1,621 Colorado Larimer County 1,556 1,828 1926 2,148 2,182 Colorado Las Animas County 1,209 1,420 1496 1,668 1,695 Colorado Lincoln County 1,171 1,375 1449 1,616 1,642 Colorado Logan County 1,084 1,274 1342 1,496 1,520 Colorado Mesa County 1,387 1,629 1716 1,914 1,945 Colorado Mineral County 1,354 1,591 1676 1,869 1,899 Colorado Moffat County 1,355 1,591 1677 1,870 1,900 Colorado Montezuma County 1,202 1,412 1488 1,659 1,686 Colorado Montrose County 1,383 1,624 1711 1,908 1,939 Colorado Morgan County 1,265 1,485 1565 1,745 1,773 Colorado Otero County 1,002 1,177 1240 1,383 1,405 Colorado Ouray County 2,006 2,356 2483 2,769 2,813 Colorado Park County 1,533 1,800 1897 2,115 2,149 Colorado Phillips County 1,129 1,326 1397 1,558 1,583 Colorado Pitkin County 2,135 2,507 2642 2,946 2,993 Colorado Prowers County 987 1,160 1222 1,363 1,385 Colorado Pueblo County 1,206 1,416 1492 1,664 1,691 Colorado Rio Blanco County 1,314 1,543 1626 1,813 1,842 Colorado Rio Grande County 1,072 1,259 1327 1,480 1,503 Colorado Routt County 1,754 2,060 2170 2,420 2,459 Colorado Saguache County 1,051 1,235 1301 1,451 1,474
Last
viewed
12/27
/16
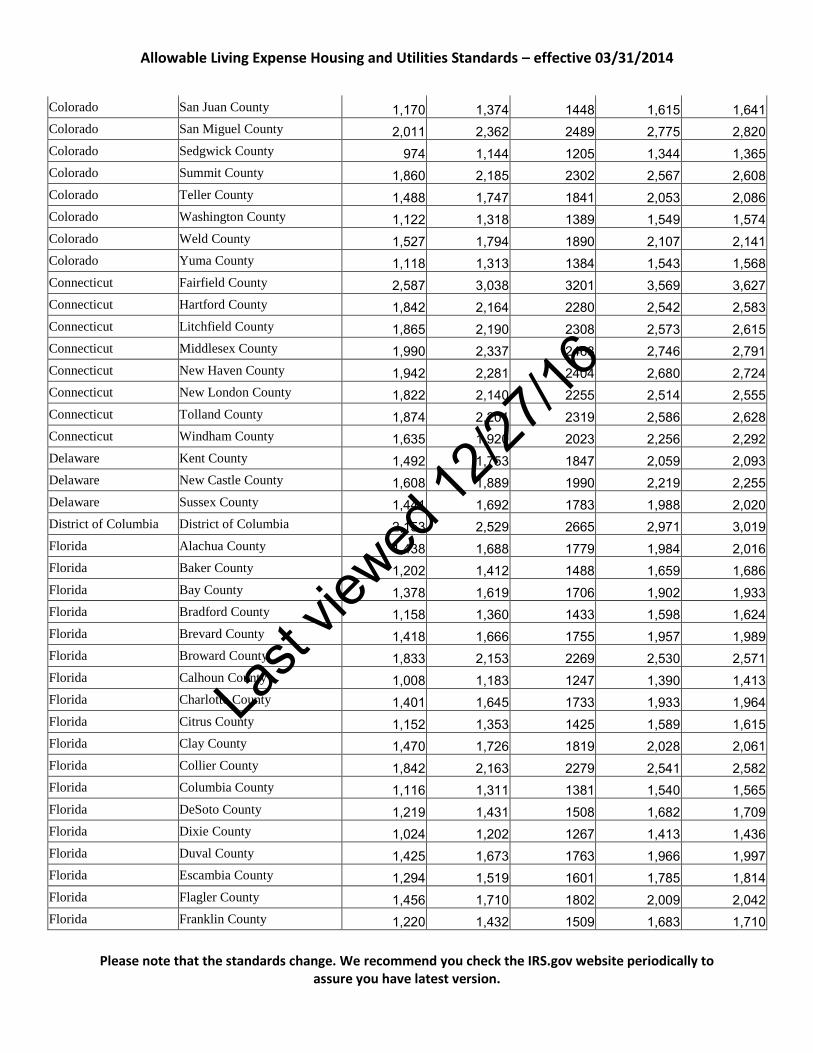
Allowable Living Expense Housing and Utilities Standards – effective 03/31/2014
Please note that the standards change. We recommend you check the IRS.gov website periodically to assure you have latest version.
Colorado San Juan County 1,170 1,374 1448 1,615 1,641 Colorado San Miguel County 2,011 2,362 2489 2,775 2,820 Colorado Sedgwick County 974 1,144 1205 1,344 1,365 Colorado Summit County 1,860 2,185 2302 2,567 2,608 Colorado Teller County 1,488 1,747 1841 2,053 2,086 Colorado Washington County 1,122 1,318 1389 1,549 1,574 Colorado Weld County 1,527 1,794 1890 2,107 2,141 Colorado Yuma County 1,118 1,313 1384 1,543 1,568 Connecticut Fairfield County 2,587 3,038 3201 3,569 3,627 Connecticut Hartford County 1,842 2,164 2280 2,542 2,583 Connecticut Litchfield County 1,865 2,190 2308 2,573 2,615 Connecticut Middlesex County 1,990 2,337 2463 2,746 2,791 Connecticut New Haven County 1,942 2,281 2404 2,680 2,724 Connecticut New London County 1,822 2,140 2255 2,514 2,555 Connecticut Tolland County 1,874 2,201 2319 2,586 2,628 Connecticut Windham County 1,635 1,920 2023 2,256 2,292 Delaware Kent County 1,492 1,753 1847 2,059 2,093 Delaware New Castle County 1,608 1,889 1990 2,219 2,255 Delaware Sussex County 1,441 1,692 1783 1,988 2,020 District of Columbia District of Columbia 2,153 2,529 2665 2,971 3,019 Florida Alachua County 1,438 1,688 1779 1,984 2,016 Florida Baker County 1,202 1,412 1488 1,659 1,686 Florida Bay County 1,378 1,619 1706 1,902 1,933 Florida Bradford County 1,158 1,360 1433 1,598 1,624 Florida Brevard County 1,418 1,666 1755 1,957 1,989 Florida Broward County 1,833 2,153 2269 2,530 2,571 Florida Calhoun County 1,008 1,183 1247 1,390 1,413 Florida Charlotte County 1,401 1,645 1733 1,933 1,964 Florida Citrus County 1,152 1,353 1425 1,589 1,615 Florida Clay County 1,470 1,726 1819 2,028 2,061 Florida Collier County 1,842 2,163 2279 2,541 2,582 Florida Columbia County 1,116 1,311 1381 1,540 1,565 Florida DeSoto County 1,219 1,431 1508 1,682 1,709 Florida Dixie County 1,024 1,202 1267 1,413 1,436 Florida Duval County 1,425 1,673 1763 1,966 1,997 Florida Escambia County 1,294 1,519 1601 1,785 1,814 Florida Flagler County 1,456 1,710 1802 2,009 2,042 Florida Franklin County 1,220 1,432 1509 1,683 1,710
Last
viewed
12/27
/16
Allowable Living Expense Housing and Utilities Standards – effective 03/31/2014
Please note that the standards change. We recommend you check the IRS.gov website periodically to assure you have latest version.
Florida Gadsden County 1,167 1,370 1444 1,610 1,636 Florida Gilchrist County 1,047 1,230 1296 1,445 1,468 Florida Glades County 973 1,143 1204 1,342 1,364 Florida Gulf County 1,411 1,657 1746 1,947 1,978 Florida Hamilton County 949 1,114 1174 1,309 1,330 Florida Hardee County 1,126 1,322 1393 1,553 1,578 Florida Hendry County 1,128 1,325 1396 1,557 1,582 Florida Hernando County 1,244 1,461 1540 1,717 1,745 Florida Highlands County 1,129 1,326 1397 1,558 1,583 Florida Hillsborough County 1,604 1,884 1985 2,213 2,249 Florida Holmes County 1,061 1,246 1313 1,464 1,488 Florida Indian River County 1,474 1,731 1824 2,034 2,067 Florida Jackson County 1,041 1,223 1288 1,437 1,460 Florida Jefferson County 1,162 1,365 1438 1,603 1,629 Florida Lafayette County 1,128 1,325 1396 1,557 1,582 Florida Lake County 1,432 1,682 1772 1,976 2,008 Florida Lee County 1,590 1,868 1968 2,194 2,230 Florida Leon County 1,455 1,709 1801 2,008 2,041 Florida Levy County 1,087 1,276 1345 1,500 1,524 Florida Liberty County 1,042 1,223 1289 1,437 1,460 Florida Madison County 1,018 1,196 1260 1,405 1,428 Florida Manatee County 1,599 1,878 1979 2,207 2,243 Florida Marion County 1,194 1,402 1477 1,647 1,674 Florida Martin County 1,726 2,027 2136 2,382 2,420 Florida Miami-Dade County 1,807 2,122 2236 2,493 2,534 Florida Monroe County 2,292 2,692 2837 3,163 3,214 Florida Nassau County 1,460 1,715 1807 2,015 2,047 Florida Okaloosa County 1,500 1,761 1856 2,069 2,103 Florida Okeechobee County 1,207 1,418 1494 1,666 1,693 Florida Orange County 1,634 1,919 2022 2,255 2,291 Florida Osceola County 1,561 1,833 1932 2,154 2,189 Florida Palm Beach County 1,809 2,125 2239 2,496 2,537 Florida Pasco County 1,405 1,650 1739 1,939 1,970 Florida Pinellas County 1,516 1,780 1876 2,092 2,126 Florida Polk County 1,318 1,548 1631 1,819 1,848 Florida Putnam County 1,020 1,198 1262 1,407 1,430 Florida Santa Rosa County 1,419 1,667 1756 1,958 1,990 Florida Sarasota County 1,577 1,853 1952 2,177 2,212
Last
viewed
12/27
/16

Allowable Living Expense Housing and Utilities Standards – effective 03/31/2014
Please note that the standards change. We recommend you check the IRS.gov website periodically to assure you have latest version.
Florida Seminole County 1,641 1,928 2031 2,265 2,301 Florida St. Johns County 1,779 2,089 2201 2,454 2,494 Florida St. Lucie County 1,484 1,743 1836 2,047 2,080 Florida Sumter County 1,197 1,406 1482 1,652 1,679 Florida Suwannee County 1,021 1,200 1264 1,409 1,432 Florida Taylor County 1,003 1,178 1241 1,384 1,406 Florida Union County 1,194 1,402 1477 1,647 1,674 Florida Volusia County 1,392 1,635 1723 1,921 1,952 Florida Wakulla County 1,301 1,528 1610 1,795 1,824 Florida Walton County 1,349 1,584 1669 1,861 1,891 Florida Washington County 1,034 1,214 1279 1,426 1,449 Georgia Appling County 943 1,107 1167 1,301 1,322 Georgia Atkinson County 869 1,020 1075 1,199 1,218 Georgia Bacon County 873 1,026 1081 1,205 1,225 Georgia Baker County 957 1,124 1184 1,320 1,341 Georgia Baldwin County 1,157 1,359 1432 1,597 1,622 Georgia Banks County 1,197 1,406 1482 1,652 1,679 Georgia Barrow County 1,257 1,477 1556 1,735 1,763 Georgia Bartow County 1,286 1,511 1592 1,775 1,804 Georgia Ben Hill County 987 1,159 1221 1,361 1,383 Georgia Berrien County 981 1,152 1214 1,354 1,375 Georgia Bibb County 1,232 1,447 1525 1,700 1,728 Georgia Bleckley County 1,167 1,370 1444 1,610 1,636 Georgia Brantley County 995 1,168 1231 1,373 1,395 Georgia Brooks County 1,066 1,252 1319 1,471 1,494 Georgia Bryan County 1,488 1,748 1842 2,054 2,087 Georgia Bulloch County 1,222 1,435 1512 1,686 1,713 Georgia Burke County 957 1,125 1185 1,321 1,343 Georgia Butts County 1,270 1,492 1572 1,753 1,781 Georgia Calhoun County 972 1,142 1203 1,342 1,363 Georgia Camden County 1,404 1,649 1738 1,938 1,969 Georgia Candler County 1,028 1,207 1272 1,418 1,441 Georgia Carroll County 1,231 1,446 1524 1,699 1,727 Georgia Catoosa County 1,174 1,379 1453 1,620 1,646 Georgia Charlton County 1,042 1,223 1289 1,437 1,460 Georgia Chatham County 1,378 1,618 1705 1,901 1,932 Georgia Chattahoochee County 1,104 1,296 1366 1,523 1,548 Georgia Chattooga County 979 1,150 1212 1,351 1,373
Last
viewed
12/27
/16
Allowable Living Expense Housing and Utilities Standards – effective 03/31/2014
Please note that the standards change. We recommend you check the IRS.gov website periodically to assure you have latest version.
Georgia Cherokee County 1,584 1,860 1960 2,185 2,221 Georgia Clarke County 1,283 1,507 1588 1,771 1,799 Georgia Clay County 991 1,164 1227 1,368 1,390 Georgia Clayton County 1,300 1,526 1608 1,793 1,822 Georgia Clinch County 1,106 1,299 1369 1,526 1,551 Georgia Cobb County 1,610 1,891 1993 2,222 2,258 Georgia Coffee County 962 1,130 1191 1,328 1,349 Georgia Colquitt County 993 1,166 1229 1,370 1,392 Georgia Columbia County 1,407 1,652 1741 1,941 1,973 Georgia Cook County 1,051 1,235 1301 1,451 1,474 Georgia Coweta County 1,444 1,696 1787 1,993 2,025 Georgia Crawford County 1,094 1,285 1354 1,510 1,534 Georgia Crisp County 1,062 1,247 1314 1,465 1,489 Georgia Dade County 1,145 1,345 1417 1,580 1,606 Georgia Dawson County 1,447 1,700 1791 1,997 2,029 Georgia Decatur County 1,079 1,267 1335 1,489 1,513 Georgia DeKalb County 1,554 1,825 1923 2,144 2,179 Georgia Dodge County 938 1,102 1161 1,295 1,315 Georgia Dooly County 941 1,105 1164 1,298 1,319 Georgia Dougherty County 1,151 1,352 1425 1,589 1,615 Georgia Douglas County 1,415 1,662 1751 1,952 1,984 Georgia Early County 1,027 1,206 1271 1,417 1,440 Georgia Echols County 1,021 1,200 1264 1,409 1,432 Georgia Effingham County 1,352 1,588 1673 1,865 1,896 Georgia Elbert County 1,006 1,182 1245 1,388 1,411 Georgia Emanuel County 953 1,119 1179 1,315 1,336 Georgia Evans County 1,024 1,202 1267 1,413 1,436 Georgia Fannin County 1,193 1,402 1477 1,647 1,673 Georgia Fayette County 1,795 2,108 2221 2,476 2,516 Georgia Floyd County 1,202 1,412 1488 1,659 1,686 Georgia Forsyth County 1,808 2,123 2237 2,495 2,535 Georgia Franklin County 1,162 1,365 1438 1,603 1,629 Georgia Fulton County 1,823 2,141 2256 2,515 2,556 Georgia Gilmer County 1,167 1,370 1444 1,610 1,636 Georgia Glascock County 1,021 1,199 1263 1,408 1,431 Georgia Glynn County 1,344 1,578 1663 1,854 1,884 Georgia Gordon County 1,130 1,327 1398 1,559 1,584 Georgia Grady County 1,027 1,206 1271 1,417 1,440
Last
viewed
12/27
/16
Allowable Living Expense Housing and Utilities Standards – effective 03/31/2014
Please note that the standards change. We recommend you check the IRS.gov website periodically to assure you have latest version.
Georgia Greene County 1,205 1,415 1491 1,662 1,689 Georgia Gwinnett County 1,580 1,856 1956 2,181 2,216 Georgia Habersham County 1,186 1,393 1468 1,637 1,663 Georgia Hall County 1,396 1,640 1728 1,927 1,958 Georgia Hancock County 980 1,151 1213 1,352 1,374 Georgia Haralson County 1,109 1,302 1372 1,530 1,555 Georgia Harris County 1,486 1,745 1839 2,050 2,084 Georgia Hart County 1,138 1,337 1409 1,571 1,596 Georgia Heard County 1,088 1,277 1346 1,501 1,525 Georgia Henry County 1,489 1,749 1843 2,055 2,088 Georgia Houston County 1,235 1,450 1528 1,704 1,731 Georgia Irwin County 1,004 1,180 1243 1,386 1,408 Georgia Jackson County 1,413 1,660 1749 1,950 1,982 Georgia Jasper County 1,256 1,476 1555 1,734 1,762 Georgia Jeff Davis County 976 1,146 1208 1,347 1,369 Georgia Jefferson County 1,004 1,180 1243 1,386 1,408 Georgia Jenkins County 931 1,093 1152 1,284 1,305 Georgia Johnson County 911 1,070 1127 1,257 1,277 Georgia Jones County 1,271 1,493 1573 1,754 1,782 Georgia Lamar County 1,225 1,439 1516 1,690 1,718 Georgia Lanier County 1,079 1,267 1335 1,489 1,513 Georgia Laurens County 1,145 1,345 1417 1,580 1,605 Georgia Lee County 1,315 1,544 1627 1,814 1,843 Georgia Liberty County 1,213 1,424 1501 1,674 1,701 Georgia Lincoln County 1,124 1,320 1391 1,551 1,576 Georgia Long County 1,127 1,324 1395 1,555 1,581 Georgia Lowndes County 1,195 1,404 1479 1,649 1,676 Georgia Lumpkin County 1,337 1,571 1655 1,845 1,875 Georgia Macon County 1,005 1,181 1244 1,387 1,409 Georgia Madison County 1,130 1,328 1399 1,560 1,585 Georgia Marion County 1,038 1,219 1285 1,433 1,456 Georgia McDuffie County 1,083 1,272 1340 1,494 1,518 Georgia McIntosh County 1,149 1,349 1422 1,586 1,611 Georgia Meriwether County 1,109 1,303 1373 1,531 1,556 Georgia Miller County 978 1,149 1211 1,350 1,372 Georgia Mitchell County 973 1,143 1204 1,342 1,364 Georgia Monroe County 1,343 1,577 1662 1,853 1,883 Georgia Montgomery County 1,062 1,247 1314 1,465 1,489
Last
viewed
12/27
/16

Allowable Living Expense Housing and Utilities Standards – effective 03/31/2014
Please note that the standards change. We recommend you check the IRS.gov website periodically to assure you have latest version.
Georgia Morgan County 1,333 1,566 1650 1,840 1,869 Georgia Murray County 1,024 1,202 1267 1,413 1,436 Georgia Muscogee County 1,229 1,443 1521 1,696 1,723 Georgia Newton County 1,340 1,573 1658 1,849 1,879 Georgia Oconee County 1,597 1,875 1976 2,203 2,239 Georgia Oglethorpe County 1,168 1,371 1445 1,611 1,637 Georgia Paulding County 1,366 1,604 1690 1,884 1,915 Georgia Peach County 1,139 1,338 1410 1,572 1,598 Georgia Pickens County 1,352 1,588 1673 1,865 1,896 Georgia Pierce County 1,051 1,235 1301 1,451 1,474 Georgia Pike County 1,370 1,609 1695 1,890 1,920 Georgia Polk County 1,188 1,395 1470 1,639 1,666 Georgia Pulaski County 1,062 1,247 1314 1,465 1,489 Georgia Putnam County 1,220 1,433 1510 1,684 1,711 Georgia Quitman County 964 1,132 1193 1,330 1,352 Georgia Rabun County 1,276 1,498 1579 1,761 1,789 Georgia Randolph County 926 1,088 1146 1,278 1,298 Georgia Richmond County 1,138 1,337 1409 1,571 1,596 Georgia Rockdale County 1,417 1,664 1753 1,955 1,986 Georgia Schley County 1,046 1,228 1294 1,443 1,466 Georgia Screven County 959 1,126 1187 1,324 1,345 Georgia Seminole County 920 1,080 1138 1,269 1,289 Georgia Spalding County 1,255 1,474 1553 1,732 1,760 Georgia Stephens County 1,125 1,321 1392 1,552 1,577 Georgia Stewart County 911 1,070 1128 1,258 1,278 Georgia Sumter County 1,073 1,260 1328 1,481 1,505 Georgia Talbot County 1,060 1,245 1312 1,463 1,487 Georgia Taliaferro County 920 1,080 1138 1,269 1,289 Georgia Tattnall County 993 1,166 1229 1,370 1,392 Georgia Taylor County 1,063 1,249 1316 1,467 1,491 Georgia Telfair County 890 1,045 1101 1,228 1,247 Georgia Terrell County 971 1,141 1202 1,340 1,362 Georgia Thomas County 1,165 1,368 1442 1,608 1,634 Georgia Tift County 1,143 1,343 1415 1,578 1,603 Georgia Toombs County 1,015 1,192 1256 1,400 1,423 Georgia Towns County 1,179 1,385 1459 1,627 1,653 Georgia Treutlen County 987 1,159 1221 1,361 1,383 Georgia Troup County 1,206 1,417 1493 1,665 1,692
Last
viewed
12/27
/16
Allowable Living Expense Housing and Utilities Standards – effective 03/31/2014
Please note that the standards change. We recommend you check the IRS.gov website periodically to assure you have latest version.
Georgia Turner County 1,075 1,263 1331 1,484 1,508 Georgia Twiggs County 1,064 1,250 1317 1,468 1,492 Georgia Union County 1,340 1,573 1658 1,849 1,879 Georgia Upson County 1,073 1,260 1328 1,481 1,505 Georgia Walker County 1,070 1,256 1324 1,476 1,500 Georgia Walton County 1,372 1,611 1698 1,893 1,924 Georgia Ware County 1,040 1,221 1287 1,435 1,458 Georgia Warren County 932 1,095 1154 1,287 1,307 Georgia Washington County 1,131 1,329 1400 1,561 1,586 Georgia Wayne County 999 1,173 1236 1,378 1,400 Georgia Webster County 946 1,111 1171 1,306 1,327 Georgia Wheeler County 1,090 1,280 1349 1,504 1,528 Georgia White County 1,251 1,469 1548 1,726 1,754 Georgia Whitfield County 1,138 1,336 1408 1,570 1,595 Georgia Wilcox County 954 1,121 1181 1,317 1,338 Georgia Wilkes County 1,139 1,338 1410 1,572 1,598 Georgia Wilkinson County 1,075 1,262 1330 1,483 1,507 Georgia Worth County 1,057 1,241 1308 1,458 1,482 Hawaii Hawaii County 1,694 1,990 2096 2,338 2,375 Hawaii Honolulu County 2,258 2,652 2794 3,115 3,166 Hawaii Kalawao County 2,072 2,433 2564 2,859 2,905 Hawaii Kauai County 2,065 2,426 2556 2,850 2,896 Hawaii Maui County 2,249 2,641 2783 3,103 3,153 Idaho Ada County 1,400 1,645 1733 1,932 1,964 Idaho Adams County 1,269 1,490 1570 1,751 1,779 Idaho Bannock County 1,139 1,338 1410 1,572 1,598 Idaho Bear Lake County 1,008 1,183 1247 1,390 1,413 Idaho Benewah County 978 1,148 1210 1,349 1,371 Idaho Bingham County 1,130 1,328 1399 1,560 1,585 Idaho Blaine County 1,718 2,018 2126 2,370 2,409 Idaho Boise County 1,313 1,542 1625 1,812 1,841 Idaho Bonner County 1,298 1,524 1606 1,791 1,820 Idaho Bonneville County 1,227 1,442 1519 1,694 1,721 Idaho Boundary County 1,160 1,363 1436 1,601 1,627 Idaho Butte County 1,050 1,234 1300 1,450 1,473 Idaho Camas County 1,320 1,551 1634 1,822 1,851 Idaho Canyon County 1,200 1,409 1485 1,656 1,683 Idaho Caribou County 1,070 1,256 1324 1,476 1,500
Last
viewed
12/27
/16
Allowable Living Expense Housing and Utilities Standards – effective 03/31/2014
Please note that the standards change. We recommend you check the IRS.gov website periodically to assure you have latest version.
Idaho Cassia County 1,021 1,200 1264 1,409 1,432 Idaho Clark County 886 1,041 1097 1,223 1,243 Idaho Clearwater County 1,100 1,293 1362 1,519 1,543 Idaho Custer County 1,050 1,234 1300 1,450 1,473 Idaho Elmore County 1,187 1,394 1469 1,638 1,664 Idaho Franklin County 1,205 1,415 1491 1,662 1,689 Idaho Fremont County 1,105 1,298 1368 1,525 1,550 Idaho Gem County 1,234 1,449 1527 1,703 1,730 Idaho Gooding County 1,111 1,305 1375 1,533 1,558 Idaho Idaho County 1,067 1,253 1320 1,472 1,496 Idaho Jefferson County 1,227 1,441 1518 1,693 1,720 Idaho Jerome County 1,103 1,295 1365 1,522 1,547 Idaho Kootenai County 1,361 1,598 1684 1,878 1,908 Idaho Latah County 1,253 1,472 1551 1,730 1,758 Idaho Lemhi County 1,034 1,215 1280 1,427 1,450 Idaho Lewis County 969 1,138 1199 1,337 1,358 Idaho Lincoln County 1,151 1,352 1425 1,589 1,615 Idaho Madison County 1,314 1,543 1626 1,813 1,842 Idaho Minidoka County 961 1,128 1189 1,326 1,347 Idaho Nez Perce County 1,209 1,420 1496 1,668 1,695 Idaho Oneida County 1,190 1,398 1473 1,642 1,669 Idaho Owyhee County 1,088 1,277 1346 1,501 1,525 Idaho Payette County 1,202 1,412 1488 1,659 1,686 Idaho Power County 1,117 1,312 1383 1,542 1,567 Idaho Shoshone County 1,063 1,249 1316 1,467 1,491 Idaho Teton County 1,707 2,005 2113 2,356 2,394 Idaho Twin Falls County 1,143 1,342 1414 1,577 1,602 Idaho Valley County 1,412 1,659 1748 1,949 1,980 Idaho Washington County 1,071 1,258 1326 1,478 1,502 Illinois Adams County 1,067 1,254 1321 1,473 1,497 Illinois Alexander County 997 1,171 1234 1,376 1,398 Illinois Bond County 1,140 1,339 1410 1,573 1,598 Illinois Boone County 1,595 1,874 1974 2,201 2,237 Illinois Brown County 947 1,112 1172 1,307 1,328 Illinois Bureau County 1,138 1,336 1408 1,570 1,595 Illinois Calhoun County 1,194 1,403 1478 1,648 1,675 Illinois Carroll County 1,120 1,315 1386 1,545 1,570 Illinois Cass County 1,028 1,207 1272 1,418 1,441
Last
viewed
12/27
/16

Allowable Living Expense Housing and Utilities Standards – effective 03/31/2014
Please note that the standards change. We recommend you check the IRS.gov website periodically to assure you have latest version.
Illinois Champaign County 1,328 1,559 1643 1,832 1,862 Illinois Christian County 1,012 1,188 1252 1,396 1,419 Illinois Clark County 1,095 1,286 1355 1,511 1,535 Illinois Clay County 964 1,132 1193 1,330 1,352 Illinois Clinton County 1,293 1,518 1600 1,784 1,813 Illinois Coles County 1,070 1,257 1324 1,477 1,501 Illinois Cook County 1,824 2,142 2257 2,517 2,557 Illinois Crawford County 913 1,072 1130 1,260 1,280 Illinois Cumberland County 1,004 1,180 1243 1,386 1,408 Illinois De Witt County 1,126 1,322 1393 1,553 1,578 Illinois DeKalb County 1,648 1,936 2040 2,275 2,311 Illinois Douglas County 1,138 1,336 1408 1,570 1,595 Illinois DuPage County 2,003 2,353 2479 2,764 2,809 Illinois Edgar County 1,014 1,191 1255 1,399 1,422 Illinois Edwards County 899 1,056 1113 1,241 1,261 Illinois Effingham County 1,082 1,271 1339 1,493 1,517 Illinois Fayette County 998 1,172 1235 1,377 1,400 Illinois Ford County 1,117 1,312 1383 1,542 1,567 Illinois Franklin County 923 1,084 1142 1,273 1,294 Illinois Fulton County 1,042 1,224 1290 1,438 1,462 Illinois Gallatin County 869 1,020 1075 1,199 1,218 Illinois Greene County 944 1,108 1168 1,302 1,323 Illinois Grundy County 1,627 1,910 2013 2,244 2,281 Illinois Hamilton County 1,004 1,179 1242 1,385 1,407 Illinois Hancock County 971 1,141 1202 1,340 1,362 Illinois Hardin County 898 1,054 1111 1,239 1,259 Illinois Henderson County 1,054 1,238 1305 1,455 1,479 Illinois Henry County 1,151 1,352 1425 1,589 1,615 Illinois Iroquois County 1,147 1,347 1419 1,582 1,608 Illinois Jackson County 1,100 1,293 1362 1,519 1,543 Illinois Jasper County 968 1,137 1198 1,336 1,357 Illinois Jefferson County 1,061 1,246 1313 1,464 1,488 Illinois Jersey County 1,224 1,438 1515 1,689 1,716 Illinois Jo Daviess County 1,223 1,436 1513 1,687 1,714 Illinois Johnson County 1,076 1,264 1332 1,485 1,509 Illinois Kane County 1,863 2,188 2306 2,571 2,613 Illinois Kankakee County 1,395 1,638 1726 1,924 1,956 Illinois Kendall County 1,959 2,301 2425 2,704 2,748
Last
viewed
12/27
/16

Allowable Living Expense Housing and Utilities Standards – effective 03/31/2014
Please note that the standards change. We recommend you check the IRS.gov website periodically to assure you have latest version.
Illinois Knox County 1,018 1,196 1260 1,405 1,428 Illinois La Salle County 1,300 1,526 1608 1,793 1,822 Illinois Lake County 2,073 2,435 2566 2,861 2,907 Illinois Lawrence County 955 1,122 1182 1,318 1,339 Illinois Lee County 1,184 1,391 1465 1,634 1,660 Illinois Livingston County 1,190 1,398 1473 1,642 1,669 Illinois Logan County 1,075 1,262 1330 1,483 1,507 Illinois Macon County 1,088 1,278 1347 1,502 1,526 Illinois Macoupin County 1,112 1,306 1376 1,535 1,559 Illinois Madison County 1,274 1,497 1577 1,758 1,787 Illinois Marion County 1,015 1,192 1256 1,400 1,423 Illinois Marshall County 1,169 1,373 1447 1,613 1,639 Illinois Mason County 1,034 1,215 1280 1,427 1,450 Illinois Massac County 1,036 1,217 1282 1,429 1,453 Illinois McDonough County 1,041 1,222 1288 1,436 1,459 Illinois McHenry County 1,892 2,222 2341 2,610 2,652 Illinois McLean County 1,397 1,641 1729 1,928 1,959 Illinois Menard County 1,222 1,435 1512 1,686 1,713 Illinois Mercer County 1,106 1,299 1369 1,526 1,551 Illinois Monroe County 1,581 1,857 1957 2,182 2,217 Illinois Montgomery County 1,020 1,198 1262 1,407 1,430 Illinois Morgan County 1,096 1,287 1356 1,512 1,536 Illinois Moultrie County 1,086 1,275 1344 1,499 1,523 Illinois Ogle County 1,397 1,641 1729 1,928 1,959 Illinois Peoria County 1,214 1,426 1503 1,676 1,703 Illinois Perry County 981 1,152 1214 1,354 1,375 Illinois Piatt County 1,222 1,435 1512 1,686 1,713 Illinois Pike County 962 1,130 1191 1,328 1,349 Illinois Pope County 1,087 1,277 1345 1,500 1,524 Illinois Pulaski County 970 1,139 1200 1,338 1,360 Illinois Putnam County 1,265 1,485 1565 1,745 1,773 Illinois Randolph County 1,037 1,219 1284 1,432 1,455 Illinois Richland County 1,047 1,230 1296 1,445 1,468 Illinois Rock Island County 1,164 1,368 1441 1,607 1,633 Illinois Saline County 961 1,128 1189 1,326 1,347 Illinois Sangamon County 1,231 1,446 1524 1,699 1,727 Illinois Schuyler County 976 1,146 1208 1,347 1,369 Illinois Scott County 1,014 1,191 1255 1,399 1,422
Last
viewed
12/27
/16

Allowable Living Expense Housing and Utilities Standards – effective 03/31/2014
Please note that the standards change. We recommend you check the IRS.gov website periodically to assure you have latest version.
Illinois Shelby County 1,007 1,182 1246 1,389 1,412 Illinois St. Clair County 1,378 1,619 1706 1,902 1,933 Illinois Stark County 1,079 1,268 1336 1,490 1,514 Illinois Stephenson County 1,164 1,368 1441 1,607 1,633 Illinois Tazewell County 1,209 1,420 1496 1,668 1,695 Illinois Union County 1,047 1,230 1296 1,445 1,468 Illinois Vermilion County 1,002 1,177 1240 1,383 1,405 Illinois Wabash County 1,025 1,203 1268 1,414 1,437 Illinois Warren County 1,025 1,204 1269 1,415 1,438 Illinois Washington County 1,193 1,402 1477 1,647 1,673 Illinois Wayne County 936 1,100 1159 1,292 1,313 Illinois White County 941 1,105 1164 1,298 1,319 Illinois Whiteside County 1,102 1,294 1364 1,521 1,545 Illinois Will County 1,866 2,192 2310 2,576 2,617 Illinois Williamson County 1,044 1,226 1292 1,441 1,464 Illinois Winnebago County 1,287 1,512 1593 1,776 1,805 Illinois Woodford County 1,409 1,655 1744 1,945 1,976 Indiana Adams County 1,050 1,234 1300 1,450 1,473 Indiana Allen County 1,113 1,307 1377 1,536 1,561 Indiana Bartholomew County 1,180 1,386 1460 1,628 1,654 Indiana Benton County 1,039 1,220 1286 1,434 1,457 Indiana Blackford County 968 1,137 1198 1,336 1,357 Indiana Boone County 1,465 1,721 1813 2,021 2,054 Indiana Brown County 1,297 1,523 1605 1,790 1,818 Indiana Carroll County 1,129 1,326 1397 1,558 1,583 Indiana Cass County 984 1,156 1218 1,358 1,380 Indiana Clark County 1,157 1,359 1432 1,597 1,622 Indiana Clay County 1,044 1,226 1292 1,441 1,464 Indiana Clinton County 1,097 1,289 1358 1,514 1,539 Indiana Crawford County 984 1,156 1218 1,358 1,380 Indiana Daviess County 995 1,168 1231 1,373 1,395 Indiana Dearborn County 1,306 1,534 1616 1,802 1,831 Indiana Decatur County 1,082 1,271 1339 1,493 1,517 Indiana DeKalb County 1,072 1,259 1327 1,480 1,503 Indiana Delaware County 1,013 1,190 1254 1,398 1,421 Indiana Dubois County 1,156 1,357 1430 1,595 1,620 Indiana Elkhart County 1,159 1,361 1434 1,599 1,625 Indiana Fayette County 1,008 1,183 1247 1,390 1,413
Last
viewed
12/27
/16

Allowable Living Expense Housing and Utilities Standards – effective 03/31/2014
Please note that the standards change. We recommend you check the IRS.gov website periodically to assure you have latest version.
Indiana Floyd County 1,252 1,470 1549 1,728 1,755 Indiana Fountain County 1,033 1,214 1279 1,426 1,449 Indiana Franklin County 1,295 1,521 1603 1,788 1,816 Indiana Fulton County 1,042 1,224 1290 1,438 1,462 Indiana Gibson County 1,063 1,248 1315 1,466 1,490 Indiana Grant County 972 1,142 1203 1,342 1,363 Indiana Greene County 989 1,162 1224 1,365 1,387 Indiana Hamilton County 1,586 1,863 1963 2,189 2,224 Indiana Hancock County 1,352 1,588 1673 1,865 1,896 Indiana Harrison County 1,104 1,296 1366 1,523 1,548 Indiana Hendricks County 1,374 1,614 1701 1,897 1,927 Indiana Henry County 1,027 1,206 1271 1,417 1,440 Indiana Howard County 1,096 1,287 1356 1,512 1,536 Indiana Huntington County 1,070 1,256 1324 1,476 1,500 Indiana Jackson County 1,113 1,307 1377 1,536 1,561 Indiana Jasper County 1,182 1,388 1463 1,631 1,658 Indiana Jay County 934 1,097 1156 1,289 1,310 Indiana Jefferson County 1,058 1,243 1310 1,461 1,484 Indiana Jennings County 1,038 1,219 1285 1,433 1,456 Indiana Johnson County 1,315 1,545 1628 1,815 1,845 Indiana Knox County 955 1,122 1182 1,318 1,339 Indiana Kosciusko County 1,130 1,328 1399 1,560 1,585 Indiana LaGrange County 1,162 1,365 1438 1,603 1,629 Indiana Lake County 1,278 1,501 1582 1,764 1,792 Indiana LaPorte County 1,135 1,333 1405 1,567 1,592 Indiana Lawrence County 1,038 1,219 1284 1,432 1,455 Indiana Madison County 1,076 1,264 1332 1,485 1,509 Indiana Marion County 1,197 1,405 1481 1,651 1,678 Indiana Marshall County 1,123 1,319 1390 1,550 1,575 Indiana Martin County 981 1,152 1214 1,354 1,375 Indiana Miami County 1,019 1,197 1261 1,406 1,429 Indiana Monroe County 1,194 1,403 1478 1,648 1,675 Indiana Montgomery County 1,063 1,248 1315 1,466 1,490 Indiana Morgan County 1,258 1,478 1557 1,736 1,764 Indiana Newton County 1,100 1,293 1362 1,519 1,543 Indiana Noble County 1,109 1,302 1372 1,530 1,555 Indiana Ohio County 1,194 1,403 1478 1,648 1,675 Indiana Orange County 966 1,135 1196 1,334 1,355
Last
viewed
12/27
/16
Allowable Living Expense Housing and Utilities Standards – effective 03/31/2014
Please note that the standards change. We recommend you check the IRS.gov website periodically to assure you have latest version.
Indiana Owen County 1,046 1,229 1295 1,444 1,467 Indiana Parke County 985 1,157 1219 1,359 1,381 Indiana Perry County 1,029 1,208 1273 1,419 1,442 Indiana Pike County 979 1,150 1212 1,351 1,373 Indiana Porter County 1,347 1,582 1667 1,859 1,889 Indiana Posey County 1,137 1,335 1407 1,569 1,594 Indiana Pulaski County 1,005 1,181 1244 1,387 1,409 Indiana Putnam County 1,197 1,406 1482 1,652 1,679 Indiana Randolph County 971 1,141 1202 1,340 1,362 Indiana Ripley County 1,187 1,394 1469 1,638 1,664 Indiana Rush County 1,122 1,318 1389 1,549 1,574 Indiana Scott County 1,080 1,269 1337 1,491 1,515 Indiana Shelby County 1,190 1,398 1473 1,642 1,669 Indiana Spencer County 1,063 1,248 1315 1,466 1,490 Indiana St. Joseph County 1,104 1,296 1366 1,523 1,548 Indiana Starke County 1,029 1,209 1274 1,421 1,443 Indiana Steuben County 1,123 1,319 1390 1,550 1,575 Indiana Sullivan County 983 1,154 1216 1,356 1,378 Indiana Switzerland County 1,130 1,327 1398 1,559 1,584 Indiana Tippecanoe County 1,192 1,400 1475 1,645 1,671 Indiana Tipton County 1,151 1,351 1424 1,588 1,613 Indiana Union County 1,155 1,357 1430 1,594 1,620 Indiana Vanderburgh County 1,097 1,289 1358 1,514 1,539 Indiana Vermillion County 999 1,173 1236 1,378 1,400 Indiana Vigo County 1,004 1,179 1242 1,385 1,407 Indiana Wabash County 986 1,158 1220 1,360 1,382 Indiana Warren County 1,173 1,378 1452 1,619 1,645 Indiana Warrick County 1,250 1,468 1547 1,725 1,753 Indiana Washington County 1,022 1,201 1265 1,411 1,434 Indiana Wayne County 1,040 1,222 1287 1,435 1,458 Indiana Wells County 1,037 1,219 1284 1,432 1,455 Indiana White County 1,062 1,247 1314 1,465 1,489 Indiana Whitley County 1,140 1,339 1411 1,573 1,599 Iowa Adair County 1,059 1,244 1311 1,462 1,485 Iowa Adams County 1,002 1,177 1240 1,383 1,405 Iowa Allamakee County 1,085 1,275 1343 1,498 1,522 Iowa Appanoose County 962 1,130 1191 1,328 1,349 Iowa Audubon County 920 1,081 1139 1,270 1,290
Last
viewed
12/27
/16
Allowable Living Expense Housing and Utilities Standards – effective 03/31/2014
Please note that the standards change. We recommend you check the IRS.gov website periodically to assure you have latest version.
Iowa Benton County 1,235 1,450 1528 1,704 1,731 Iowa Black Hawk County 1,119 1,314 1385 1,544 1,569 Iowa Boone County 1,244 1,461 1540 1,717 1,745 Iowa Bremer County 1,188 1,395 1470 1,639 1,666 Iowa Buchanan County 1,096 1,288 1357 1,513 1,537 Iowa Buena Vista County 1,014 1,191 1255 1,399 1,422 Iowa Butler County 1,005 1,181 1244 1,387 1,409 Iowa Calhoun County 911 1,070 1128 1,258 1,278 Iowa Carroll County 1,083 1,272 1340 1,494 1,518 Iowa Cass County 961 1,128 1189 1,326 1,347 Iowa Cedar County 1,162 1,365 1438 1,604 1,630 Iowa Cerro Gordo County 1,062 1,247 1314 1,465 1,489 Iowa Cherokee County 941 1,106 1165 1,299 1,320 Iowa Chickasaw County 1,021 1,200 1264 1,409 1,432 Iowa Clarke County 1,168 1,371 1445 1,611 1,637 Iowa Clay County 1,060 1,245 1312 1,463 1,486 Iowa Clayton County 1,095 1,286 1355 1,511 1,535 Iowa Clinton County 1,143 1,342 1414 1,577 1,602 Iowa Crawford County 991 1,164 1227 1,368 1,390 Iowa Dallas County 1,525 1,791 1887 2,104 2,138 Iowa Davis County 1,075 1,263 1331 1,484 1,508 Iowa Decatur County 988 1,161 1223 1,364 1,386 Iowa Delaware County 1,150 1,350 1423 1,587 1,612 Iowa Des Moines County 1,068 1,254 1321 1,473 1,497 Iowa Dickinson County 1,185 1,391 1466 1,635 1,661 Iowa Dubuque County 1,204 1,414 1490 1,661 1,688 Iowa Emmet County 970 1,140 1201 1,339 1,361 Iowa Fayette County 1,026 1,205 1270 1,416 1,439 Iowa Floyd County 975 1,145 1207 1,346 1,368 Iowa Franklin County 1,019 1,197 1261 1,406 1,429 Iowa Fremont County 1,054 1,237 1304 1,454 1,477 Iowa Greene County 969 1,138 1199 1,337 1,358 Iowa Grundy County 1,117 1,312 1383 1,542 1,567 Iowa Guthrie County 1,071 1,257 1325 1,477 1,501 Iowa Hamilton County 1,101 1,293 1363 1,520 1,544 Iowa Hancock County 994 1,167 1230 1,371 1,394 Iowa Hardin County 1,033 1,213 1278 1,425 1,448 Iowa Harrison County 1,141 1,340 1412 1,574 1,600
Last
viewed
12/27
/16
Allowable Living Expense Housing and Utilities Standards – effective 03/31/2014
Please note that the standards change. We recommend you check the IRS.gov website periodically to assure you have latest version.
Iowa Henry County 1,059 1,244 1311 1,462 1,485 Iowa Howard County 1,041 1,222 1288 1,436 1,459 Iowa Humboldt County 983 1,155 1217 1,357 1,379 Iowa Ida County 877 1,031 1086 1,211 1,230 Iowa Iowa County 1,226 1,440 1517 1,692 1,719 Iowa Jackson County 1,115 1,310 1380 1,539 1,564 Iowa Jasper County 1,183 1,389 1464 1,632 1,659 Iowa Jefferson County 1,036 1,217 1282 1,429 1,453 Iowa Johnson County 1,419 1,666 1756 1,958 1,990 Iowa Jones County 1,142 1,341 1413 1,575 1,601 Iowa Keokuk County 1,018 1,196 1260 1,405 1,428 Iowa Kossuth County 953 1,120 1180 1,316 1,337 Iowa Lee County 997 1,171 1234 1,376 1,398 Iowa Linn County 1,284 1,508 1589 1,772 1,800 Iowa Louisa County 1,080 1,269 1337 1,491 1,515 Iowa Lucas County 1,037 1,218 1283 1,431 1,454 Iowa Lyon County 1,042 1,224 1290 1,438 1,462 Iowa Madison County 1,370 1,610 1696 1,891 1,922 Iowa Mahaska County 1,056 1,240 1307 1,457 1,481 Iowa Marion County 1,202 1,412 1488 1,659 1,686 Iowa Marshall County 1,115 1,310 1380 1,539 1,564 Iowa Mills County 1,302 1,529 1611 1,796 1,825 Iowa Mitchell County 1,038 1,219 1285 1,433 1,456 Iowa Monona County 927 1,089 1147 1,279 1,300 Iowa Monroe County 1,176 1,382 1456 1,623 1,650 Iowa Montgomery County 1,011 1,187 1251 1,395 1,417 Iowa Muscatine County 1,184 1,390 1465 1,633 1,660 Iowa O'Brien County 992 1,165 1228 1,369 1,391 Iowa Osceola County 895 1,051 1108 1,235 1,255 Iowa Page County 984 1,156 1218 1,358 1,380 Iowa Palo Alto County 987 1,159 1221 1,361 1,383 Iowa Plymouth County 1,145 1,345 1417 1,580 1,605 Iowa Pocahontas County 858 1,008 1062 1,184 1,203 Iowa Polk County 1,358 1,595 1681 1,874 1,905 Iowa Pottawattamie County 1,233 1,448 1526 1,701 1,729 Iowa Poweshiek County 1,164 1,368 1441 1,607 1,633 Iowa Ringgold County 1,105 1,298 1368 1,525 1,550 Iowa Sac County 900 1,057 1114 1,242 1,262
Last
viewed
12/27
/16

Allowable Living Expense Housing and Utilities Standards – effective 03/31/2014
Please note that the standards change. We recommend you check the IRS.gov website periodically to assure you have latest version.
Iowa Scott County 1,237 1,453 1531 1,707 1,735 Iowa Shelby County 1,115 1,310 1380 1,539 1,564 Iowa Sioux County 1,126 1,323 1394 1,554 1,579 Iowa Story County 1,357 1,594 1680 1,873 1,903 Iowa Tama County 1,092 1,283 1352 1,507 1,532 Iowa Taylor County 950 1,116 1176 1,312 1,333 Iowa Union County 1,006 1,182 1245 1,388 1,411 Iowa Van Buren County 943 1,107 1167 1,301 1,322 Iowa Wapello County 992 1,165 1228 1,369 1,391 Iowa Warren County 1,345 1,580 1665 1,856 1,886 Iowa Washington County 1,208 1,419 1495 1,667 1,694 Iowa Wayne County 945 1,110 1170 1,305 1,326 Iowa Webster County 1,003 1,178 1241 1,384 1,406 Iowa Winnebago County 1,009 1,185 1249 1,393 1,415 Iowa Winneshiek County 1,210 1,422 1498 1,670 1,697 Iowa Woodbury County 1,093 1,283 1352 1,508 1,532 Iowa Worth County 1,040 1,221 1287 1,435 1,458 Iowa Wright County 978 1,149 1211 1,350 1,372 Kansas Allen County 925 1,087 1145 1,277 1,297 Kansas Anderson County 1,098 1,290 1359 1,515 1,540 Kansas Atchison County 1,194 1,403 1478 1,648 1,675 Kansas Barber County 976 1,146 1208 1,347 1,369 Kansas Barton County 1,014 1,191 1255 1,399 1,422 Kansas Bourbon County 962 1,130 1191 1,328 1,349 Kansas Brown County 932 1,094 1153 1,286 1,306 Kansas Butler County 1,299 1,526 1608 1,793 1,822 Kansas Chase County 993 1,166 1229 1,370 1,393 Kansas Chautauqua County 1,009 1,185 1249 1,393 1,415 Kansas Cherokee County 998 1,172 1235 1,377 1,399 Kansas Cheyenne County 970 1,139 1200 1,338 1,360 Kansas Clark County 945 1,110 1170 1,305 1,326 Kansas Clay County 1,033 1,214 1279 1,426 1,449 Kansas Cloud County 937 1,101 1160 1,293 1,314 Kansas Coffey County 1,130 1,328 1399 1,560 1,585 Kansas Comanche County 860 1,010 1064 1,186 1,206 Kansas Cowley County 1,062 1,247 1314 1,465 1,489 Kansas Crawford County 1,029 1,209 1274 1,421 1,443 Kansas Decatur County 936 1,099 1158 1,291 1,312
Last
viewed
12/27
/16

Allowable Living Expense Housing and Utilities Standards – effective 03/31/2014
Please note that the standards change. We recommend you check the IRS.gov website periodically to assure you have latest version.
Kansas Dickinson County 1,109 1,303 1373 1,531 1,556 Kansas Doniphan County 1,083 1,272 1340 1,494 1,518 Kansas Douglas County 1,451 1,704 1796 2,003 2,035 Kansas Edwards County 893 1,049 1105 1,232 1,252 Kansas Elk County 910 1,069 1126 1,255 1,276 Kansas Ellis County 1,223 1,437 1514 1,688 1,716 Kansas Ellsworth County 936 1,100 1159 1,292 1,313 Kansas Finney County 1,194 1,403 1478 1,648 1,675 Kansas Ford County 1,105 1,298 1368 1,525 1,550 Kansas Franklin County 1,216 1,428 1505 1,678 1,705 Kansas Geary County 1,287 1,512 1593 1,776 1,805 Kansas Gove County 999 1,173 1236 1,378 1,400 Kansas Graham County 1,015 1,192 1256 1,401 1,423 Kansas Grant County 1,059 1,244 1311 1,462 1,485 Kansas Gray County 1,098 1,290 1359 1,515 1,540 Kansas Greeley County 1,012 1,189 1253 1,397 1,420 Kansas Greenwood County 939 1,103 1162 1,296 1,317 Kansas Hamilton County 973 1,143 1204 1,342 1,364 Kansas Harper County 976 1,146 1208 1,347 1,369 Kansas Harvey County 1,136 1,334 1406 1,568 1,593 Kansas Haskell County 1,037 1,219 1284 1,432 1,455 Kansas Hodgeman County 961 1,128 1189 1,326 1,347 Kansas Jackson County 1,210 1,421 1497 1,669 1,696 Kansas Jefferson County 1,302 1,529 1611 1,796 1,825 Kansas Jewell County 871 1,023 1078 1,202 1,221 Kansas Johnson County 1,636 1,922 2025 2,258 2,294 Kansas Kearny County 1,147 1,347 1419 1,582 1,608 Kansas Kingman County 1,095 1,286 1355 1,511 1,535 Kansas Kiowa County 915 1,075 1133 1,263 1,284 Kansas Labette County 991 1,164 1227 1,368 1,390 Kansas Lane County 969 1,138 1199 1,337 1,358 Kansas Leavenworth County 1,441 1,692 1783 1,988 2,020 Kansas Lincoln County 917 1,077 1135 1,266 1,286 Kansas Linn County 1,147 1,348 1420 1,583 1,609 Kansas Logan County 988 1,161 1223 1,364 1,386 Kansas Lyon County 1,051 1,235 1301 1,451 1,474 Kansas Marion County 1,018 1,196 1260 1,405 1,428 Kansas Marshall County 981 1,152 1214 1,354 1,375
Last
viewed
12/27
/16

Allowable Living Expense Housing and Utilities Standards – effective 03/31/2014
Please note that the standards change. We recommend you check the IRS.gov website periodically to assure you have latest version.
Kansas McPherson County 1,133 1,330 1402 1,563 1,588 Kansas Meade County 1,008 1,183 1247 1,390 1,413 Kansas Miami County 1,458 1,712 1804 2,012 2,044 Kansas Mitchell County 989 1,162 1224 1,365 1,387 Kansas Montgomery County 982 1,153 1215 1,355 1,377 Kansas Morris County 1,046 1,229 1295 1,444 1,467 Kansas Morton County 1,002 1,177 1240 1,383 1,405 Kansas Nemaha County 1,071 1,257 1325 1,477 1,501 Kansas Neosho County 993 1,166 1229 1,370 1,392 Kansas Ness County 945 1,110 1170 1,305 1,326 Kansas Norton County 939 1,103 1162 1,296 1,317 Kansas Osage County 1,145 1,345 1417 1,580 1,605 Kansas Osborne County 907 1,065 1122 1,251 1,271 Kansas Ottawa County 1,099 1,291 1360 1,516 1,541 Kansas Pawnee County 1,034 1,215 1280 1,427 1,450 Kansas Phillips County 957 1,125 1185 1,321 1,343 Kansas Pottawatomie County 1,231 1,445 1523 1,698 1,726 Kansas Pratt County 1,044 1,226 1292 1,441 1,464 Kansas Rawlins County 973 1,143 1204 1,343 1,364 Kansas Reno County 1,064 1,250 1317 1,468 1,492 Kansas Republic County 925 1,087 1145 1,277 1,298 Kansas Rice County 991 1,163 1226 1,367 1,389 Kansas Riley County 1,322 1,553 1636 1,824 1,854 Kansas Rooks County 937 1,101 1160 1,293 1,314 Kansas Rush County 942 1,107 1166 1,300 1,321 Kansas Russell County 968 1,137 1198 1,336 1,357 Kansas Saline County 1,161 1,363 1436 1,602 1,627 Kansas Scott County 1,130 1,327 1398 1,559 1,584 Kansas Sedgwick County 1,228 1,442 1520 1,695 1,722 Kansas Seward County 1,012 1,188 1252 1,396 1,419 Kansas Shawnee County 1,209 1,420 1496 1,668 1,695 Kansas Sheridan County 1,088 1,277 1346 1,501 1,525 Kansas Sherman County 1,006 1,182 1245 1,388 1,411 Kansas Smith County 995 1,169 1232 1,374 1,396 Kansas Stafford County 945 1,109 1169 1,303 1,324 Kansas Stanton County 1,013 1,190 1254 1,398 1,421 Kansas Stevens County 1,098 1,290 1359 1,515 1,540 Kansas Sumner County 1,127 1,324 1395 1,555 1,581
Last
viewed
12/27
/16
Allowable Living Expense Housing and Utilities Standards – effective 03/31/2014
Please note that the standards change. We recommend you check the IRS.gov website periodically to assure you have latest version.
Kansas Thomas County 1,147 1,348 1420 1,583 1,609 Kansas Trego County 1,012 1,188 1252 1,396 1,419 Kansas Wabaunsee County 1,182 1,388 1462 1,630 1,657 Kansas Wallace County 953 1,119 1179 1,315 1,336 Kansas Washington County 900 1,057 1114 1,242 1,262 Kansas Wichita County 1,067 1,254 1321 1,473 1,497 Kansas Wilson County 957 1,124 1184 1,320 1,341 Kansas Woodson County 973 1,143 1204 1,342 1,364 Kansas Wyandotte County 1,218 1,431 1508 1,681 1,709 Kentucky Adair County 939 1,103 1162 1,296 1,317 Kentucky Allen County 1,031 1,211 1276 1,423 1,446 Kentucky Anderson County 1,180 1,386 1461 1,629 1,655 Kentucky Ballard County 964 1,132 1193 1,330 1,352 Kentucky Barren County 995 1,169 1232 1,374 1,396 Kentucky Bath County 944 1,108 1168 1,302 1,323 Kentucky Bell County 876 1,029 1084 1,209 1,228 Kentucky Boone County 1,411 1,657 1746 1,947 1,979 Kentucky Bourbon County 1,157 1,359 1432 1,597 1,622 Kentucky Boyd County 1,010 1,186 1250 1,394 1,416 Kentucky Boyle County 1,100 1,292 1361 1,518 1,542 Kentucky Bracken County 1,094 1,285 1354 1,510 1,534 Kentucky Breathitt County 943 1,107 1167 1,301 1,322 Kentucky Breckinridge County 923 1,084 1142 1,273 1,294 Kentucky Bullitt County 1,210 1,422 1498 1,670 1,697 Kentucky Butler County 922 1,083 1141 1,272 1,293 Kentucky Caldwell County 925 1,087 1145 1,277 1,297 Kentucky Calloway County 1,051 1,235 1301 1,451 1,474 Kentucky Campbell County 1,271 1,493 1573 1,754 1,782 Kentucky Carlisle County 994 1,167 1230 1,371 1,394 Kentucky Carroll County 1,059 1,244 1311 1,462 1,485 Kentucky Carter County 920 1,080 1138 1,269 1,289 Kentucky Casey County 903 1,060 1117 1,245 1,266 Kentucky Christian County 1,063 1,248 1315 1,466 1,490 Kentucky Clark County 1,177 1,383 1457 1,625 1,651 Kentucky Clay County 852 1,001 1055 1,176 1,195 Kentucky Clinton County 795 934 984 1,097 1,115 Kentucky Crittenden County 978 1,148 1210 1,349 1,371 Kentucky Cumberland County 814 957 1008 1,124 1,142
Last
viewed
12/27
/16

Allowable Living Expense Housing and Utilities Standards – effective 03/31/2014
Please note that the standards change. We recommend you check the IRS.gov website periodically to assure you have latest version.
Kentucky Daviess County 1,047 1,230 1296 1,445 1,468 Kentucky Edmonson County 1,004 1,179 1242 1,385 1,407 Kentucky Elliott County 954 1,121 1181 1,317 1,338 Kentucky Estill County 979 1,150 1212 1,351 1,373 Kentucky Fayette County 1,291 1,517 1598 1,782 1,811 Kentucky Fleming County 978 1,149 1211 1,350 1,372 Kentucky Floyd County 958 1,126 1186 1,322 1,344 Kentucky Franklin County 1,189 1,397 1472 1,641 1,668 Kentucky Fulton County 978 1,149 1211 1,350 1,372 Kentucky Gallatin County 1,125 1,321 1392 1,553 1,578 Kentucky Garrard County 1,095 1,286 1355 1,511 1,535 Kentucky Grant County 1,210 1,422 1498 1,670 1,697 Kentucky Graves County 966 1,134 1195 1,332 1,354 Kentucky Grayson County 987 1,160 1222 1,363 1,385 Kentucky Green County 890 1,045 1101 1,228 1,247 Kentucky Greenup County 1,050 1,233 1299 1,448 1,472 Kentucky Hancock County 1,005 1,181 1244 1,387 1,409 Kentucky Hardin County 1,170 1,374 1448 1,615 1,641 Kentucky Harlan County 844 992 1045 1,165 1,184 Kentucky Harrison County 1,088 1,278 1347 1,502 1,526 Kentucky Hart County 940 1,104 1163 1,297 1,318 Kentucky Henderson County 1,075 1,263 1331 1,484 1,508 Kentucky Henry County 1,185 1,391 1466 1,635 1,661 Kentucky Hickman County 834 979 1032 1,151 1,169 Kentucky Hopkins County 993 1,166 1229 1,370 1,392 Kentucky Jackson County 872 1,024 1079 1,203 1,223 Kentucky Jefferson County 1,248 1,465 1544 1,722 1,749 Kentucky Jessamine County 1,311 1,539 1622 1,809 1,838 Kentucky Johnson County 932 1,095 1154 1,287 1,307 Kentucky Kenton County 1,306 1,534 1616 1,802 1,831 Kentucky Knott County 914 1,073 1131 1,261 1,281 Kentucky Knox County 948 1,113 1173 1,308 1,329 Kentucky Larue County 1,057 1,241 1308 1,459 1,482 Kentucky Laurel County 1,025 1,203 1268 1,414 1,437 Kentucky Lawrence County 862 1,013 1067 1,190 1,209 Kentucky Lee County 873 1,026 1081 1,205 1,225 Kentucky Leslie County 895 1,051 1108 1,235 1,255 Kentucky Letcher County 859 1,009 1063 1,185 1,204
Last
viewed
12/27
/16
Allowable Living Expense Housing and Utilities Standards – effective 03/31/2014
Please note that the standards change. We recommend you check the IRS.gov website periodically to assure you have latest version.
Kentucky Lewis County 877 1,030 1085 1,210 1,229 Kentucky Lincoln County 955 1,122 1182 1,318 1,339 Kentucky Livingston County 936 1,099 1158 1,291 1,312 Kentucky Logan County 1,029 1,209 1274 1,421 1,443 Kentucky Lyon County 1,095 1,286 1355 1,511 1,535 Kentucky Madison County 1,202 1,412 1488 1,659 1,686 Kentucky Magoffin County 924 1,085 1143 1,274 1,295 Kentucky Marion County 1,012 1,189 1253 1,397 1,420 Kentucky Marshall County 999 1,173 1236 1,378 1,400 Kentucky Martin County 1,012 1,188 1252 1,396 1,419 Kentucky Mason County 1,041 1,223 1288 1,437 1,460 Kentucky McCracken County 1,121 1,316 1387 1,547 1,571 Kentucky McCreary County 864 1,014 1069 1,192 1,211 Kentucky McLean County 943 1,107 1167 1,301 1,322 Kentucky Meade County 1,146 1,346 1418 1,581 1,607 Kentucky Menifee County 860 1,010 1064 1,186 1,206 Kentucky Mercer County 1,117 1,312 1382 1,541 1,566 Kentucky Metcalfe County 847 995 1048 1,169 1,187 Kentucky Monroe County 891 1,047 1103 1,230 1,250 Kentucky Montgomery County 1,043 1,225 1291 1,439 1,463 Kentucky Morgan County 909 1,068 1125 1,254 1,275 Kentucky Muhlenberg County 922 1,083 1141 1,272 1,293 Kentucky Nelson County 1,096 1,287 1356 1,512 1,536 Kentucky Nicholas County 1,019 1,197 1261 1,406 1,429 Kentucky Ohio County 888 1,043 1099 1,225 1,245 Kentucky Oldham County 1,664 1,954 2059 2,296 2,333 Kentucky Owen County 1,090 1,280 1349 1,504 1,528 Kentucky Owsley County 851 999 1053 1,174 1,193 Kentucky Pendleton County 1,189 1,396 1471 1,640 1,667 Kentucky Perry County 970 1,140 1201 1,339 1,361 Kentucky Pike County 939 1,103 1162 1,296 1,317 Kentucky Powell County 991 1,163 1226 1,367 1,389 Kentucky Pulaski County 995 1,168 1231 1,373 1,395 Kentucky Robertson County 931 1,093 1152 1,284 1,305 Kentucky Rockcastle County 960 1,127 1188 1,325 1,346 Kentucky Rowan County 1,004 1,179 1242 1,385 1,407 Kentucky Russell County 893 1,049 1105 1,232 1,252 Kentucky Scott County 1,268 1,489 1569 1,749 1,778
Last
viewed
12/27
/16
Allowable Living Expense Housing and Utilities Standards – effective 03/31/2014
Please note that the standards change. We recommend you check the IRS.gov website periodically to assure you have latest version.
Kentucky Shelby County 1,343 1,577 1662 1,853 1,883 Kentucky Simpson County 1,119 1,314 1385 1,544 1,569 Kentucky Spencer County 1,350 1,586 1671 1,863 1,893 Kentucky Taylor County 936 1,100 1159 1,292 1,313 Kentucky Todd County 1,025 1,203 1268 1,414 1,437 Kentucky Trigg County 1,074 1,261 1329 1,482 1,506 Kentucky Trimble County 1,109 1,302 1372 1,530 1,554 Kentucky Union County 968 1,137 1198 1,336 1,358 Kentucky Warren County 1,170 1,374 1448 1,615 1,641 Kentucky Washington County 1,052 1,236 1302 1,452 1,475 Kentucky Wayne County 887 1,042 1098 1,224 1,244 Kentucky Webster County 914 1,073 1131 1,261 1,281 Kentucky Whitley County 950 1,116 1176 1,311 1,332 Kentucky Wolfe County 846 994 1047 1,167 1,186 Kentucky Woodford County 1,281 1,504 1585 1,767 1,796 Louisiana Acadia Parish 988 1,161 1223 1,364 1,386 Louisiana Allen Parish 981 1,152 1214 1,354 1,375 Louisiana Ascension Parish 1,317 1,547 1630 1,817 1,847 Louisiana Assumption Parish 1,001 1,176 1239 1,381 1,404 Louisiana Avoyelles Parish 961 1,128 1189 1,326 1,347 Louisiana Beauregard Parish 1,037 1,218 1283 1,431 1,454 Louisiana Bienville Parish 882 1,036 1092 1,218 1,237 Louisiana Bossier Parish 1,213 1,424 1501 1,674 1,701 Louisiana Caddo Parish 1,137 1,335 1407 1,569 1,594 Louisiana Calcasieu Parish 1,093 1,284 1353 1,509 1,533 Louisiana Caldwell Parish 936 1,099 1158 1,291 1,312 Louisiana Cameron Parish 1,061 1,246 1313 1,464 1,488 Louisiana Catahoula Parish 884 1,038 1094 1,220 1,240 Louisiana Claiborne Parish 991 1,163 1226 1,367 1,389 Louisiana Concordia Parish 931 1,093 1152 1,284 1,305 Louisiana De Soto Parish 1,003 1,178 1241 1,384 1,406 Louisiana East Baton Rouge Parish 1,262 1,483 1562 1,742 1,770 Louisiana East Carroll Parish 922 1,083 1141 1,272 1,293 Louisiana East Feliciana Parish 1,029 1,209 1274 1,421 1,443 Louisiana Evangeline Parish 921 1,082 1140 1,271 1,292 Louisiana Franklin Parish 900 1,057 1114 1,242 1,262 Louisiana Grant Parish 1,007 1,182 1246 1,389 1,412 Louisiana Iberia Parish 1,117 1,312 1383 1,542 1,567
Last
viewed
12/27
/16

Allowable Living Expense Housing and Utilities Standards – effective 03/31/2014
Please note that the standards change. We recommend you check the IRS.gov website periodically to assure you have latest version.
Louisiana Iberville Parish 1,054 1,238 1305 1,455 1,479 Louisiana Jackson Parish 918 1,078 1136 1,267 1,287 Louisiana Jefferson Davis Parish 971 1,140 1201 1,339 1,361 Louisiana Jefferson Parish 1,397 1,641 1729 1,928 1,959 Louisiana La Salle Parish 882 1,035 1091 1,216 1,236 Louisiana Lafayette Parish 1,256 1,475 1554 1,733 1,761 Louisiana Lafourche Parish 1,171 1,375 1449 1,616 1,642 Louisiana Lincoln Parish 1,114 1,309 1379 1,538 1,562 Louisiana Livingston Parish 1,248 1,465 1544 1,722 1,749 Louisiana Madison Parish 848 996 1050 1,171 1,190 Louisiana Morehouse Parish 935 1,098 1157 1,290 1,311 Louisiana Natchitoches Parish 1,034 1,215 1280 1,427 1,450 Louisiana Orleans Parish 1,535 1,803 1900 2,119 2,153 Louisiana Ouachita Parish 1,122 1,318 1389 1,549 1,574 Louisiana Plaquemines Parish 1,525 1,791 1887 2,104 2,138 Louisiana Pointe Coupee Parish 1,113 1,307 1377 1,535 1,560 Louisiana Rapides Parish 1,147 1,347 1419 1,582 1,608 Louisiana Red River Parish 879 1,033 1088 1,213 1,233 Louisiana Richland Parish 919 1,079 1137 1,268 1,288 Louisiana Sabine Parish 984 1,156 1218 1,358 1,380 Louisiana St. Bernard Parish 1,126 1,322 1393 1,553 1,578 Louisiana St. Charles Parish 1,443 1,695 1786 1,991 2,024 Louisiana St. Helena Parish 1,054 1,237 1304 1,454 1,477 Louisiana St. James Parish 1,152 1,353 1425 1,589 1,615 Louisiana St. John the Baptist Parish 1,302 1,530 1612 1,797 1,826 Louisiana St. Landry Parish 941 1,105 1164 1,298 1,319 Louisiana St. Martin Parish 1,002 1,177 1240 1,383 1,405 Louisiana St. Mary Parish 1,102 1,294 1364 1,521 1,545 Louisiana St. Tammany Parish 1,490 1,750 1844 2,056 2,089 Louisiana Tangipahoa Parish 1,153 1,355 1427 1,592 1,617 Louisiana Tensas Parish 856 1,006 1060 1,182 1,201 Louisiana Terrebonne Parish 1,188 1,395 1470 1,639 1,666 Louisiana Union Parish 943 1,107 1167 1,301 1,322 Louisiana Vermilion Parish 1,024 1,202 1267 1,413 1,436 Louisiana Vernon Parish 987 1,160 1222 1,363 1,385 Louisiana Washington Parish 958 1,126 1186 1,322 1,344 Louisiana Webster Parish 1,023 1,201 1266 1,412 1,434 Louisiana West Baton Rouge Parish 1,199 1,409 1484 1,655 1,682
Last
viewed
12/27
/16
Allowable Living Expense Housing and Utilities Standards – effective 03/31/2014
Please note that the standards change. We recommend you check the IRS.gov website periodically to assure you have latest version.
Louisiana West Carroll Parish 879 1,033 1088 1,213 1,233 Louisiana West Feliciana Parish 1,385 1,627 1714 1,911 1,942 Louisiana Winn Parish 904 1,062 1119 1,248 1,268 Maine Androscoggin County 1,360 1,597 1683 1,877 1,907 Maine Aroostook County 991 1,163 1226 1,367 1,389 Maine Cumberland County 1,627 1,911 2014 2,246 2,282 Maine Franklin County 1,034 1,215 1280 1,427 1,450 Maine Hancock County 1,299 1,526 1608 1,793 1,822 Maine Kennebec County 1,232 1,447 1525 1,700 1,728 Maine Knox County 1,358 1,595 1681 1,874 1,905 Maine Lincoln County 1,239 1,455 1533 1,709 1,737 Maine Oxford County 1,164 1,368 1441 1,607 1,633 Maine Penobscot County 1,207 1,418 1494 1,666 1,693 Maine Piscataquis County 1,004 1,180 1243 1,386 1,408 Maine Sagadahoc County 1,411 1,657 1746 1,947 1,979 Maine Somerset County 1,077 1,265 1333 1,486 1,510 Maine Waldo County 1,191 1,399 1474 1,644 1,670 Maine Washington County 1,025 1,204 1269 1,415 1,438 Maine York County 1,537 1,805 1902 2,121 2,155 Maryland Allegany County 1,144 1,344 1416 1,579 1,604 Maryland Anne Arundel County 2,003 2,353 2479 2,764 2,809 Maryland Baltimore city 1,404 1,649 1738 1,938 1,969 Maryland Baltimore County 1,730 2,032 2141 2,387 2,426 Maryland Calvert County 2,047 2,405 2534 2,825 2,871 Maryland Caroline County 1,656 1,945 2050 2,286 2,323 Maryland Carroll County 1,977 2,322 2447 2,728 2,772 Maryland Cecil County 1,731 2,033 2142 2,388 2,427 Maryland Charles County 2,108 2,475 2608 2,908 2,955 Maryland Dorchester County 1,488 1,748 1842 2,054 2,087 Maryland Frederick County 1,978 2,324 2448 2,730 2,774 Maryland Garrett County 1,223 1,437 1514 1,688 1,715 Maryland Harford County 1,865 2,190 2308 2,573 2,615 Maryland Howard County 2,334 2,742 2889 3,221 3,273 Maryland Kent County 1,622 1,905 2007 2,238 2,274 Maryland Montgomery County 2,377 2,792 2942 3,280 3,333 Maryland Prince George's County 2,089 2,453 2585 2,882 2,929 Maryland Queen Anne's County 2,018 2,370 2497 2,784 2,829 Maryland Somerset County 1,328 1,559 1643 1,832 1,862
Last
viewed
12/27
/16
Allowable Living Expense Housing and Utilities Standards – effective 03/31/2014
Please note that the standards change. We recommend you check the IRS.gov website periodically to assure you have latest version.
Maryland St. Mary's County 1,904 2,236 2356 2,627 2,669 Maryland Talbot County 1,776 2,086 2198 2,451 2,490 Maryland Washington County 1,584 1,860 1960 2,186 2,221 Maryland Wicomico County 1,448 1,701 1792 1,998 2,030 Maryland Worcester County 1,571 1,845 1944 2,168 2,203 Massachusetts Barnstable County 1,841 2,163 2279 2,541 2,582 Massachusetts Berkshire County 1,433 1,683 1773 1,977 2,009 Massachusetts Bristol County 1,824 2,143 2258 2,518 2,558 Massachusetts Dukes County 2,141 2,515 2650 2,955 3,002 Massachusetts Essex County 2,094 2,460 2592 2,890 2,937 Massachusetts Franklin County 1,505 1,767 1862 2,076 2,110 Massachusetts Hampden County 1,541 1,810 1907 2,126 2,161 Massachusetts Hampshire County 1,663 1,953 2058 2,295 2,332 Massachusetts Middlesex County 2,229 2,618 2759 3,076 3,126 Massachusetts Nantucket County 3,045 3,577 3769 4,203 4,270 Massachusetts Norfolk County 2,241 2,632 2773 3,092 3,142 Massachusetts Plymouth County 2,060 2,420 2550 2,843 2,889 Massachusetts Suffolk County 2,145 2,520 2655 2,960 3,008 Massachusetts Worcester County 1,837 2,158 2274 2,536 2,576 Michigan Alcona County 1,027 1,206 1271 1,417 1,440 Michigan Alger County 1,096 1,287 1356 1,512 1,536 Michigan Allegan County 1,272 1,494 1574 1,755 1,783 Michigan Alpena County 1,046 1,228 1294 1,443 1,467 Michigan Antrim County 1,240 1,457 1535 1,712 1,739 Michigan Arenac County 1,025 1,203 1268 1,414 1,437 Michigan Baraga County 1,051 1,235 1301 1,451 1,474 Michigan Barry County 1,288 1,513 1594 1,777 1,806 Michigan Bay County 1,174 1,379 1453 1,620 1,646 Michigan Benzie County 1,252 1,471 1550 1,728 1,756 Michigan Berrien County 1,182 1,388 1462 1,630 1,657 Michigan Branch County 1,106 1,299 1369 1,526 1,551 Michigan Calhoun County 1,155 1,356 1429 1,593 1,619 Michigan Cass County 1,191 1,399 1474 1,644 1,670 Michigan Charlevoix County 1,299 1,525 1607 1,792 1,821 Michigan Cheboygan County 1,067 1,253 1320 1,472 1,496 Michigan Chippewa County 1,099 1,291 1360 1,516 1,541 Michigan Clare County 997 1,171 1234 1,376 1,398 Michigan Clinton County 1,453 1,706 1798 2,005 2,037
Last
viewed
12/27
/16

Allowable Living Expense Housing and Utilities Standards – effective 03/31/2014
Please note that the standards change. We recommend you check the IRS.gov website periodically to assure you have latest version.
Michigan Crawford County 1,062 1,247 1314 1,465 1,489 Michigan Delta County 1,109 1,303 1373 1,531 1,556 Michigan Dickinson County 1,043 1,225 1291 1,440 1,463 Michigan Eaton County 1,367 1,606 1692 1,887 1,917 Michigan Emmet County 1,364 1,602 1688 1,882 1,913 Michigan Genesee County 1,264 1,484 1564 1,744 1,772 Michigan Gladwin County 1,102 1,294 1364 1,521 1,545 Michigan Gogebic County 951 1,117 1177 1,312 1,334 Michigan Grand Traverse County 1,332 1,564 1648 1,838 1,867 Michigan Gratiot County 1,059 1,244 1311 1,462 1,485 Michigan Hillsdale County 1,150 1,350 1423 1,587 1,612 Michigan Houghton County 1,000 1,175 1238 1,380 1,403 Michigan Huron County 1,062 1,247 1314 1,465 1,489 Michigan Ingham County 1,341 1,575 1659 1,850 1,880 Michigan Ionia County 1,219 1,432 1509 1,683 1,710 Michigan Iosco County 984 1,156 1218 1,358 1,380 Michigan Iron County 983 1,154 1216 1,356 1,378 Michigan Isabella County 1,182 1,388 1462 1,630 1,657 Michigan Jackson County 1,251 1,469 1548 1,726 1,754 Michigan Kalamazoo County 1,307 1,535 1617 1,803 1,832 Michigan Kalkaska County 1,098 1,290 1359 1,515 1,540 Michigan Kent County 1,324 1,555 1638 1,827 1,856 Michigan Keweenaw County 929 1,091 1149 1,282 1,302 Michigan Lake County 962 1,129 1190 1,327 1,348 Michigan Lapeer County 1,412 1,659 1748 1,949 1,980 Michigan Leelanau County 1,450 1,703 1794 2,000 2,033 Michigan Lenawee County 1,287 1,512 1593 1,776 1,805 Michigan Livingston County 1,656 1,945 2049 2,285 2,322 Michigan Luce County 1,008 1,183 1247 1,390 1,413 Michigan Mackinac County 1,080 1,269 1337 1,491 1,515 Michigan Macomb County 1,440 1,691 1782 1,987 2,019 Michigan Manistee County 1,100 1,292 1361 1,518 1,542 Michigan Marquette County 1,121 1,316 1387 1,547 1,571 Michigan Mason County 1,130 1,328 1399 1,560 1,585 Michigan Mecosta County 1,155 1,356 1429 1,593 1,619 Michigan Menominee County 1,050 1,234 1300 1,450 1,473 Michigan Midland County 1,248 1,466 1545 1,723 1,750 Michigan Missaukee County 1,073 1,260 1328 1,481 1,505
Last
viewed
12/27
/16

Allowable Living Expense Housing and Utilities Standards – effective 03/31/2014
Please note that the standards change. We recommend you check the IRS.gov website periodically to assure you have latest version.
Michigan Monroe County 1,427 1,676 1766 1,969 2,001 Michigan Montcalm County 1,144 1,344 1416 1,579 1,604 Michigan Montmorency County 996 1,170 1233 1,375 1,397 Michigan Muskegon County 1,155 1,357 1430 1,594 1,620 Michigan Newaygo County 1,178 1,384 1458 1,626 1,652 Michigan Oakland County 1,698 1,995 2102 2,344 2,382 Michigan Oceana County 1,124 1,320 1391 1,551 1,576 Michigan Ogemaw County 1,029 1,208 1273 1,419 1,442 Michigan Ontonagon County 966 1,134 1195 1,332 1,354 Michigan Osceola County 1,058 1,242 1309 1,460 1,483 Michigan Oscoda County 953 1,119 1179 1,315 1,336 Michigan Otsego County 1,125 1,321 1392 1,552 1,577 Michigan Ottawa County 1,339 1,573 1657 1,848 1,878 Michigan Presque Isle County 1,033 1,213 1278 1,425 1,448 Michigan Roscommon County 1,030 1,210 1275 1,422 1,445 Michigan Saginaw County 1,174 1,379 1453 1,620 1,646 Michigan Sanilac County 1,155 1,357 1430 1,594 1,620 Michigan Schoolcraft County 999 1,174 1237 1,379 1,402 Michigan Shiawassee County 1,237 1,453 1531 1,707 1,735 Michigan St. Clair County 1,364 1,602 1688 1,882 1,913 Michigan St. Joseph County 1,122 1,318 1389 1,549 1,574 Michigan Tuscola County 1,159 1,361 1434 1,599 1,625 Michigan Van Buren County 1,223 1,436 1513 1,687 1,714 Michigan Washtenaw County 1,753 2,058 2169 2,418 2,457 Michigan Wayne County 1,381 1,622 1709 1,906 1,936 Michigan Wexford County 1,132 1,330 1401 1,562 1,587 Minnesota Aitkin County 1,181 1,387 1461 1,629 1,656 Minnesota Anoka County 1,622 1,905 2007 2,238 2,274 Minnesota Becker County 1,274 1,497 1577 1,758 1,787 Minnesota Beltrami County 1,206 1,416 1492 1,664 1,690 Minnesota Benton County 1,401 1,646 1734 1,933 1,965 Minnesota Big Stone County 983 1,155 1217 1,357 1,379 Minnesota Blue Earth County 1,312 1,541 1624 1,811 1,840 Minnesota Brown County 1,151 1,351 1424 1,588 1,613 Minnesota Carlton County 1,311 1,540 1623 1,810 1,839 Minnesota Carver County 1,896 2,226 2346 2,616 2,658 Minnesota Cass County 1,234 1,449 1527 1,703 1,730 Minnesota Chippewa County 1,130 1,327 1398 1,559 1,584
Last
viewed
12/27
/16

Allowable Living Expense Housing and Utilities Standards – effective 03/31/2014
Please note that the standards change. We recommend you check the IRS.gov website periodically to assure you have latest version.
Minnesota Chisago County 1,664 1,954 2059 2,296 2,333 Minnesota Clay County 1,313 1,542 1625 1,812 1,841 Minnesota Clearwater County 1,141 1,340 1412 1,574 1,600 Minnesota Cook County 1,351 1,587 1672 1,864 1,894 Minnesota Cottonwood County 1,004 1,179 1242 1,385 1,407 Minnesota Crow Wing County 1,272 1,494 1574 1,755 1,784 Minnesota Dakota County 1,694 1,990 2096 2,338 2,375 Minnesota Dodge County 1,387 1,629 1717 1,914 1,945 Minnesota Douglas County 1,314 1,543 1626 1,813 1,842 Minnesota Faribault County 995 1,169 1232 1,374 1,396 Minnesota Fillmore County 1,260 1,479 1559 1,738 1,766 Minnesota Freeborn County 1,117 1,312 1382 1,541 1,566 Minnesota Goodhue County 1,487 1,746 1840 2,052 2,085 Minnesota Grant County 1,078 1,266 1334 1,487 1,511 Minnesota Hennepin County 1,723 2,023 2132 2,377 2,416 Minnesota Houston County 1,257 1,477 1556 1,735 1,763 Minnesota Hubbard County 1,249 1,466 1545 1,723 1,751 Minnesota Isanti County 1,568 1,841 1940 2,163 2,198 Minnesota Itasca County 1,210 1,421 1497 1,669 1,696 Minnesota Jackson County 1,016 1,193 1257 1,402 1,424 Minnesota Kanabec County 1,377 1,617 1704 1,900 1,931 Minnesota Kandiyohi County 1,261 1,481 1561 1,741 1,769 Minnesota Kittson County 993 1,166 1229 1,370 1,392 Minnesota Koochiching County 1,077 1,265 1333 1,486 1,510 Minnesota Lac qui Parle County 987 1,159 1221 1,361 1,383 Minnesota Lake County 1,168 1,371 1445 1,611 1,637 Minnesota Lake of the Woods County 1,114 1,309 1379 1,538 1,562 Minnesota Le Sueur County 1,442 1,694 1785 1,990 2,022 Minnesota Lincoln County 1,025 1,203 1268 1,414 1,437 Minnesota Lyon County 1,209 1,420 1496 1,668 1,695 Minnesota Mahnomen County 1,069 1,256 1323 1,475 1,499 Minnesota Marshall County 1,030 1,210 1275 1,422 1,445 Minnesota Martin County 1,052 1,236 1302 1,452 1,475 Minnesota McLeod County 1,409 1,655 1744 1,945 1,976 Minnesota Meeker County 1,336 1,570 1654 1,844 1,874 Minnesota Mille Lacs County 1,328 1,559 1643 1,832 1,862 Minnesota Morrison County 1,286 1,511 1592 1,775 1,804 Minnesota Mower County 1,136 1,334 1406 1,568 1,593
Last
viewed
12/27
/16

Allowable Living Expense Housing and Utilities Standards – effective 03/31/2014
Please note that the standards change. We recommend you check the IRS.gov website periodically to assure you have latest version.
Minnesota Murray County 1,032 1,212 1277 1,424 1,447 Minnesota Nicollet County 1,364 1,602 1688 1,882 1,913 Minnesota Nobles County 1,088 1,277 1346 1,501 1,525 Minnesota Norman County 991 1,163 1226 1,367 1,389 Minnesota Olmsted County 1,433 1,684 1774 1,978 2,010 Minnesota Otter Tail County 1,224 1,438 1515 1,689 1,716 Minnesota Pennington County 1,050 1,233 1299 1,448 1,472 Minnesota Pine County 1,302 1,530 1612 1,797 1,826 Minnesota Pipestone County 1,008 1,184 1248 1,392 1,414 Minnesota Polk County 1,201 1,411 1487 1,658 1,685 Minnesota Pope County 1,234 1,449 1527 1,703 1,730 Minnesota Ramsey County 1,572 1,847 1946 2,170 2,205 Minnesota Red Lake County 999 1,173 1236 1,378 1,400 Minnesota Redwood County 1,113 1,307 1377 1,535 1,560 Minnesota Renville County 1,114 1,309 1379 1,538 1,562 Minnesota Rice County 1,536 1,804 1901 2,120 2,154 Minnesota Rock County 1,111 1,305 1375 1,533 1,558 Minnesota Roseau County 1,153 1,354 1427 1,591 1,617 Minnesota Scott County 1,824 2,143 2258 2,518 2,558 Minnesota Sherburne County 1,676 1,968 2074 2,313 2,350 Minnesota Sibley County 1,298 1,524 1606 1,791 1,820 Minnesota St. Louis County 1,204 1,414 1490 1,661 1,688 Minnesota Stearns County 1,361 1,599 1685 1,879 1,909 Minnesota Steele County 1,353 1,590 1675 1,868 1,898 Minnesota Stevens County 1,130 1,327 1398 1,559 1,584 Minnesota Swift County 1,067 1,253 1320 1,472 1,496 Minnesota Todd County 1,168 1,371 1445 1,611 1,637 Minnesota Traverse County 1,002 1,177 1240 1,383 1,405 Minnesota Wabasha County 1,365 1,603 1689 1,884 1,914 Minnesota Wadena County 1,076 1,264 1332 1,485 1,509 Minnesota Waseca County 1,237 1,453 1531 1,707 1,735 Minnesota Washington County 1,743 2,047 2157 2,405 2,444 Minnesota Watonwan County 1,066 1,252 1319 1,471 1,494 Minnesota Wilkin County 1,116 1,311 1381 1,540 1,565 Minnesota Winona County 1,312 1,541 1624 1,811 1,840 Minnesota Wright County 1,632 1,917 2020 2,252 2,289 Minnesota Yellow Medicine County 1,064 1,250 1317 1,469 1,492 Mississippi Adams County 963 1,131 1192 1,329 1,351
Last
viewed
12/27
/16

Allowable Living Expense Housing and Utilities Standards – effective 03/31/2014
Please note that the standards change. We recommend you check the IRS.gov website periodically to assure you have latest version.
Mississippi Alcorn County 1,004 1,179 1242 1,385 1,407 Mississippi Amite County 950 1,115 1175 1,311 1,332 Mississippi Attala County 861 1,012 1066 1,189 1,208 Mississippi Benton County 985 1,157 1219 1,359 1,381 Mississippi Bolivar County 1,062 1,247 1314 1,465 1,489 Mississippi Calhoun County 826 970 1022 1,140 1,158 Mississippi Carroll County 945 1,109 1169 1,303 1,324 Mississippi Chickasaw County 857 1,007 1061 1,183 1,202 Mississippi Choctaw County 860 1,010 1064 1,187 1,206 Mississippi Claiborne County 962 1,129 1190 1,327 1,348 Mississippi Clarke County 926 1,088 1146 1,278 1,298 Mississippi Clay County 972 1,142 1203 1,341 1,363 Mississippi Coahoma County 928 1,090 1149 1,281 1,302 Mississippi Copiah County 957 1,125 1185 1,321 1,343 Mississippi Covington County 928 1,089 1148 1,280 1,301 Mississippi DeSoto County 1,319 1,549 1632 1,820 1,849 Mississippi Forrest County 1,143 1,343 1415 1,578 1,603 Mississippi Franklin County 882 1,036 1092 1,218 1,237 Mississippi George County 1,089 1,279 1348 1,503 1,527 Mississippi Greene County 1,067 1,254 1321 1,473 1,497 Mississippi Grenada County 988 1,161 1223 1,364 1,386 Mississippi Hancock County 1,243 1,460 1538 1,715 1,743 Mississippi Harrison County 1,274 1,497 1577 1,758 1,787 Mississippi Hinds County 1,130 1,328 1399 1,560 1,585 Mississippi Holmes County 869 1,020 1075 1,199 1,218 Mississippi Humphreys County 927 1,089 1147 1,279 1,300 Mississippi Issaquena County 970 1,140 1201 1,339 1,361 Mississippi Itawamba County 970 1,140 1201 1,339 1,361 Mississippi Jackson County 1,253 1,472 1551 1,729 1,757 Mississippi Jasper County 939 1,103 1162 1,296 1,317 Mississippi Jefferson County 834 980 1032 1,151 1,169 Mississippi Jefferson Davis County 945 1,109 1169 1,303 1,324 Mississippi Jones County 1,032 1,212 1277 1,424 1,447 Mississippi Kemper County 856 1,006 1060 1,182 1,201 Mississippi Lafayette County 1,325 1,556 1640 1,829 1,858 Mississippi Lamar County 1,300 1,527 1609 1,794 1,823 Mississippi Lauderdale County 1,121 1,316 1387 1,547 1,571 Mississippi Lawrence County 996 1,170 1232 1,374 1,396
Last
viewed
12/27
/16

Allowable Living Expense Housing and Utilities Standards – effective 03/31/2014
Please note that the standards change. We recommend you check the IRS.gov website periodically to assure you have latest version.
Mississippi Leake County 1,004 1,179 1242 1,385 1,407 Mississippi Lee County 1,122 1,317 1388 1,548 1,573 Mississippi Leflore County 970 1,139 1200 1,338 1,360 Mississippi Lincoln County 1,038 1,219 1284 1,432 1,455 Mississippi Lowndes County 1,067 1,253 1320 1,472 1,496 Mississippi Madison County 1,503 1,765 1860 2,074 2,107 Mississippi Marion County 949 1,114 1174 1,309 1,330 Mississippi Marshall County 1,085 1,275 1343 1,497 1,522 Mississippi Monroe County 966 1,134 1195 1,332 1,354 Mississippi Montgomery County 925 1,087 1145 1,277 1,297 Mississippi Neshoba County 932 1,094 1153 1,286 1,306 Mississippi Newton County 963 1,131 1192 1,329 1,351 Mississippi Noxubee County 911 1,070 1128 1,258 1,278 Mississippi Oktibbeha County 1,126 1,323 1394 1,554 1,579 Mississippi Panola County 994 1,167 1230 1,371 1,394 Mississippi Pearl River County 1,125 1,321 1392 1,552 1,577 Mississippi Perry County 904 1,062 1119 1,248 1,268 Mississippi Pike County 996 1,170 1233 1,375 1,397 Mississippi Pontotoc County 961 1,128 1189 1,326 1,347 Mississippi Prentiss County 912 1,071 1129 1,259 1,279 Mississippi Quitman County 810 952 1003 1,118 1,136 Mississippi Rankin County 1,252 1,471 1550 1,728 1,756 Mississippi Scott County 938 1,102 1161 1,295 1,315 Mississippi Sharkey County 905 1,063 1120 1,249 1,269 Mississippi Simpson County 981 1,152 1214 1,354 1,375 Mississippi Smith County 1,016 1,194 1258 1,403 1,425 Mississippi Stone County 1,130 1,328 1399 1,560 1,585 Mississippi Sunflower County 943 1,107 1167 1,301 1,322 Mississippi Tallahatchie County 859 1,009 1063 1,185 1,204 Mississippi Tate County 1,244 1,461 1540 1,717 1,745 Mississippi Tippah County 940 1,104 1163 1,297 1,318 Mississippi Tishomingo County 885 1,040 1095 1,221 1,241 Mississippi Tunica County 933 1,096 1155 1,288 1,309 Mississippi Union County 991 1,163 1226 1,367 1,389 Mississippi Walthall County 1,026 1,205 1270 1,416 1,439 Mississippi Warren County 1,096 1,287 1356 1,512 1,536 Mississippi Washington County 999 1,174 1237 1,379 1,402 Mississippi Wayne County 936 1,100 1159 1,292 1,313
Last
viewed
12/27
/16

Allowable Living Expense Housing and Utilities Standards – effective 03/31/2014
Please note that the standards change. We recommend you check the IRS.gov website periodically to assure you have latest version.
Mississippi Webster County 974 1,144 1206 1,345 1,366 Mississippi Wilkinson County 937 1,101 1160 1,293 1,314 Mississippi Winston County 931 1,093 1152 1,284 1,305 Mississippi Yalobusha County 930 1,092 1151 1,283 1,304 Mississippi Yazoo County 987 1,160 1222 1,363 1,385 Missouri Adair County 945 1,109 1169 1,303 1,324 Missouri Andrew County 1,244 1,461 1539 1,716 1,744 Missouri Atchison County 945 1,109 1169 1,303 1,324 Missouri Audrain County 991 1,163 1226 1,367 1,389 Missouri Barry County 998 1,172 1235 1,377 1,399 Missouri Barton County 936 1,100 1159 1,292 1,313 Missouri Bates County 1,139 1,338 1410 1,572 1,598 Missouri Benton County 1,003 1,178 1241 1,384 1,406 Missouri Bollinger County 922 1,083 1141 1,272 1,293 Missouri Boone County 1,273 1,495 1575 1,756 1,784 Missouri Buchanan County 1,099 1,291 1360 1,516 1,541 Missouri Butler County 959 1,126 1187 1,324 1,345 Missouri Caldwell County 1,152 1,353 1426 1,590 1,616 Missouri Callaway County 1,119 1,314 1385 1,544 1,569 Missouri Camden County 1,129 1,326 1397 1,558 1,583 Missouri Cape Girardeau County 1,130 1,327 1398 1,559 1,584 Missouri Carroll County 993 1,166 1229 1,370 1,392 Missouri Carter County 978 1,148 1210 1,349 1,371 Missouri Cass County 1,353 1,589 1674 1,867 1,897 Missouri Cedar County 970 1,140 1201 1,339 1,361 Missouri Chariton County 931 1,093 1152 1,284 1,305 Missouri Christian County 1,210 1,422 1498 1,670 1,697 Missouri Clark County 873 1,025 1080 1,204 1,224 Missouri Clay County 1,410 1,656 1745 1,946 1,977 Missouri Clinton County 1,303 1,531 1613 1,799 1,828 Missouri Cole County 1,181 1,387 1462 1,630 1,656 Missouri Cooper County 1,047 1,229 1295 1,444 1,468 Missouri Crawford County 1,032 1,212 1277 1,424 1,447 Missouri Dade County 909 1,067 1124 1,254 1,274 Missouri Dallas County 978 1,149 1211 1,350 1,372 Missouri Daviess County 1,059 1,244 1311 1,462 1,485 Missouri DeKalb County 1,148 1,349 1421 1,584 1,610 Missouri Dent County 911 1,070 1128 1,258 1,278
Last
viewed
12/27
/16

Allowable Living Expense Housing and Utilities Standards – effective 03/31/2014
Please note that the standards change. We recommend you check the IRS.gov website periodically to assure you have latest version.
Missouri Douglas County 890 1,045 1101 1,228 1,247 Missouri Dunklin County 873 1,025 1080 1,204 1,224 Missouri Franklin County 1,230 1,444 1522 1,697 1,724 Missouri Gasconade County 1,095 1,286 1355 1,511 1,535 Missouri Gentry County 995 1,168 1231 1,373 1,395 Missouri Greene County 1,090 1,281 1349 1,505 1,529 Missouri Grundy County 946 1,111 1171 1,306 1,327 Missouri Harrison County 928 1,089 1148 1,280 1,301 Missouri Henry County 1,029 1,208 1273 1,419 1,442 Missouri Hickory County 891 1,047 1103 1,230 1,250 Missouri Holt County 983 1,154 1216 1,356 1,378 Missouri Howard County 1,072 1,259 1327 1,480 1,503 Missouri Howell County 949 1,115 1175 1,310 1,331 Missouri Iron County 889 1,044 1100 1,227 1,246 Missouri Jackson County 1,296 1,522 1604 1,788 1,817 Missouri Jasper County 1,026 1,205 1270 1,416 1,439 Missouri Jefferson County 1,289 1,514 1595 1,778 1,807 Missouri Johnson County 1,185 1,392 1467 1,636 1,662 Missouri Knox County 894 1,051 1107 1,234 1,254 Missouri Laclede County 982 1,153 1215 1,355 1,377 Missouri Lafayette County 1,173 1,378 1452 1,619 1,645 Missouri Lawrence County 1,024 1,202 1267 1,413 1,436 Missouri Lewis County 924 1,085 1143 1,275 1,295 Missouri Lincoln County 1,286 1,511 1592 1,775 1,804 Missouri Linn County 964 1,132 1193 1,330 1,352 Missouri Livingston County 987 1,160 1222 1,363 1,385 Missouri Macon County 975 1,145 1206 1,345 1,367 Missouri Madison County 933 1,096 1155 1,288 1,309 Missouri Maries County 1,049 1,232 1298 1,447 1,471 Missouri Marion County 1,052 1,236 1302 1,452 1,475 Missouri McDonald County 956 1,123 1183 1,319 1,340 Missouri Mercer County 872 1,024 1079 1,203 1,223 Missouri Miller County 1,006 1,182 1245 1,388 1,411 Missouri Mississippi County 827 972 1024 1,142 1,160 Missouri Moniteau County 1,079 1,268 1336 1,490 1,514 Missouri Monroe County 966 1,135 1196 1,334 1,355 Missouri Montgomery County 1,079 1,268 1336 1,490 1,514 Missouri Morgan County 999 1,173 1236 1,378 1,400
Last
viewed
12/27
/16

Allowable Living Expense Housing and Utilities Standards – effective 03/31/2014
Please note that the standards change. We recommend you check the IRS.gov website periodically to assure you have latest version.
Missouri New Madrid County 912 1,071 1129 1,259 1,279 Missouri Newton County 1,032 1,212 1277 1,424 1,447 Missouri Nodaway County 1,043 1,225 1291 1,439 1,463 Missouri Oregon County 881 1,034 1090 1,215 1,235 Missouri Osage County 1,018 1,196 1260 1,405 1,428 Missouri Ozark County 891 1,047 1103 1,230 1,250 Missouri Pemiscot County 912 1,071 1129 1,259 1,279 Missouri Perry County 1,125 1,321 1392 1,552 1,577 Missouri Pettis County 1,017 1,195 1259 1,404 1,426 Missouri Phelps County 1,093 1,284 1353 1,509 1,533 Missouri Pike County 1,045 1,227 1293 1,442 1,465 Missouri Platte County 1,572 1,846 1945 2,169 2,204 Missouri Polk County 1,039 1,220 1286 1,434 1,457 Missouri Pulaski County 1,176 1,381 1455 1,622 1,649 Missouri Putnam County 1,139 1,338 1409 1,572 1,597 Missouri Ralls County 1,049 1,232 1298 1,447 1,471 Missouri Randolph County 997 1,171 1234 1,376 1,398 Missouri Ray County 1,248 1,466 1545 1,723 1,750 Missouri Reynolds County 900 1,057 1114 1,242 1,262 Missouri Ripley County 903 1,060 1117 1,245 1,266 Missouri Saline County 963 1,131 1192 1,329 1,351 Missouri Schuyler County 891 1,047 1103 1,230 1,250 Missouri Scotland County 949 1,114 1174 1,309 1,330 Missouri Scott County 950 1,116 1176 1,311 1,332 Missouri Shannon County 890 1,045 1101 1,228 1,247 Missouri Shelby County 964 1,132 1193 1,330 1,352 Missouri St. Charles County 1,502 1,764 1859 2,073 2,106 Missouri St. Clair County 936 1,099 1158 1,291 1,312 Missouri St. Francois County 999 1,174 1237 1,379 1,402 Missouri St. Louis city 1,218 1,430 1507 1,680 1,707 Missouri St. Louis County 1,430 1,680 1770 1,974 2,005 Missouri Ste. Genevieve County 1,104 1,296 1366 1,523 1,548 Missouri Stoddard County 957 1,124 1184 1,320 1,341 Missouri Stone County 1,050 1,233 1299 1,448 1,472 Missouri Sullivan County 923 1,084 1142 1,273 1,294 Missouri Taney County 1,111 1,305 1375 1,533 1,558 Missouri Texas County 901 1,058 1115 1,243 1,263 Missouri Vernon County 1,003 1,178 1241 1,384 1,406
Last
viewed
12/27
/16

Allowable Living Expense Housing and Utilities Standards – effective 03/31/2014
Please note that the standards change. We recommend you check the IRS.gov website periodically to assure you have latest version.
Missouri Warren County 1,293 1,519 1600 1,784 1,813 Missouri Washington County 902 1,059 1116 1,245 1,265 Missouri Wayne County 846 994 1047 1,167 1,186 Missouri Webster County 972 1,142 1203 1,341 1,363 Missouri Worth County 861 1,012 1066 1,189 1,208 Missouri Wright County 919 1,079 1137 1,268 1,288 Montana Beaverhead County 1,141 1,340 1412 1,574 1,600 Montana Big Horn County 915 1,075 1133 1,263 1,284 Montana Blaine County 942 1,107 1166 1,300 1,321 Montana Broadwater County 1,173 1,378 1452 1,619 1,645 Montana Carbon County 1,207 1,417 1493 1,665 1,692 Montana Carter County 1,197 1,405 1481 1,651 1,678 Montana Cascade County 1,178 1,384 1458 1,626 1,652 Montana Chouteau County 1,118 1,314 1384 1,543 1,568 Montana Custer County 1,037 1,219 1284 1,432 1,455 Montana Daniels County 1,198 1,407 1483 1,654 1,680 Montana Dawson County 1,093 1,284 1353 1,509 1,533 Montana Deer Lodge County 1,055 1,239 1306 1,456 1,480 Montana Fallon County 986 1,158 1220 1,360 1,382 Montana Fergus County 1,043 1,225 1291 1,439 1,463 Montana Flathead County 1,378 1,618 1705 1,901 1,932 Montana Gallatin County 1,532 1,799 1896 2,114 2,148 Montana Garfield County 946 1,112 1171 1,306 1,327 Montana Glacier County 864 1,014 1069 1,192 1,211 Montana Golden Valley County 1,204 1,414 1490 1,661 1,688 Montana Granite County 1,173 1,378 1452 1,619 1,645 Montana Hill County 1,127 1,324 1395 1,555 1,581 Montana Jefferson County 1,405 1,650 1738 1,938 1,969 Montana Judith Basin County 974 1,144 1206 1,345 1,366 Montana Lake County 1,240 1,457 1535 1,712 1,739 Montana Lewis and Clark County 1,349 1,585 1670 1,862 1,892 Montana Liberty County 953 1,119 1179 1,315 1,336 Montana Lincoln County 1,049 1,232 1298 1,447 1,471 Montana Madison County 1,374 1,613 1700 1,896 1,926 Montana McCone County 1,069 1,256 1323 1,475 1,499 Montana Meagher County 1,016 1,194 1258 1,403 1,425 Montana Mineral County 1,151 1,351 1424 1,588 1,613 Montana Missoula County 1,455 1,709 1801 2,008 2,041
Last
viewed
12/27
/16

Allowable Living Expense Housing and Utilities Standards – effective 03/31/2014
Please note that the standards change. We recommend you check the IRS.gov website periodically to assure you have latest version.
Montana Musselshell County 1,120 1,315 1386 1,545 1,570 Montana Park County 1,294 1,520 1602 1,786 1,815 Montana Petroleum County 1,090 1,280 1349 1,504 1,528 Montana Phillips County 933 1,096 1155 1,288 1,309 Montana Pondera County 1,084 1,273 1341 1,495 1,519 Montana Powder River County 1,037 1,219 1284 1,432 1,455 Montana Powell County 1,088 1,277 1346 1,501 1,525 Montana Prairie County 1,006 1,182 1245 1,388 1,411 Montana Ravalli County 1,387 1,628 1716 1,913 1,944 Montana Richland County 1,014 1,191 1255 1,400 1,422 Montana Roosevelt County 920 1,081 1139 1,270 1,290 Montana Rosebud County 1,076 1,264 1332 1,485 1,509 Montana Sanders County 1,134 1,332 1404 1,565 1,591 Montana Sheridan County 1,096 1,288 1357 1,513 1,537 Montana Silver Bow County 1,037 1,218 1283 1,431 1,454 Montana Stillwater County 1,279 1,502 1583 1,765 1,794 Montana Sweet Grass County 1,298 1,524 1606 1,791 1,820 Montana Teton County 1,147 1,347 1419 1,582 1,608 Montana Toole County 993 1,166 1229 1,370 1,392 Montana Treasure County 931 1,093 1152 1,284 1,305 Montana Valley County 1,033 1,214 1279 1,426 1,449 Montana Wheatland County 886 1,041 1097 1,223 1,243 Montana Wibaux County 896 1,052 1109 1,237 1,256 Montana Yellowstone County 1,294 1,520 1602 1,786 1,815 Nebraska Adams County 1,088 1,278 1347 1,502 1,526 Nebraska Antelope County 962 1,129 1190 1,327 1,348 Nebraska Arthur County 1,051 1,235 1301 1,451 1,474 Nebraska Banner County 1,353 1,590 1675 1,868 1,898 Nebraska Blaine County 1,034 1,215 1280 1,427 1,450 Nebraska Boone County 1,048 1,231 1297 1,446 1,470 Nebraska Box Butte County 1,067 1,253 1320 1,472 1,496 Nebraska Boyd County 914 1,073 1131 1,261 1,281 Nebraska Brown County 911 1,070 1127 1,257 1,277 Nebraska Buffalo County 1,256 1,476 1555 1,734 1,762 Nebraska Burt County 1,156 1,358 1431 1,596 1,621 Nebraska Butler County 1,109 1,302 1372 1,530 1,554 Nebraska Cass County 1,390 1,633 1720 1,918 1,949 Nebraska Cedar County 1,033 1,214 1279 1,426 1,449
Last
viewed
12/27
/16

Allowable Living Expense Housing and Utilities Standards – effective 03/31/2014
Please note that the standards change. We recommend you check the IRS.gov website periodically to assure you have latest version.
Nebraska Chase County 983 1,154 1216 1,356 1,378 Nebraska Cherry County 1,249 1,467 1546 1,724 1,752 Nebraska Cheyenne County 1,166 1,369 1443 1,609 1,635 Nebraska Clay County 977 1,147 1209 1,348 1,370 Nebraska Colfax County 1,024 1,202 1267 1,413 1,436 Nebraska Cuming County 1,015 1,192 1256 1,401 1,423 Nebraska Custer County 976 1,146 1208 1,347 1,369 Nebraska Dakota County 1,173 1,378 1452 1,619 1,645 Nebraska Dawes County 1,072 1,259 1327 1,480 1,503 Nebraska Dawson County 1,038 1,219 1285 1,433 1,456 Nebraska Deuel County 937 1,101 1160 1,293 1,314 Nebraska Dixon County 1,021 1,200 1264 1,409 1,432 Nebraska Dodge County 1,150 1,350 1423 1,587 1,612 Nebraska Douglas County 1,382 1,623 1710 1,907 1,937 Nebraska Dundy County 974 1,144 1205 1,344 1,366 Nebraska Fillmore County 997 1,171 1234 1,376 1,398 Nebraska Franklin County 912 1,071 1129 1,259 1,279 Nebraska Frontier County 999 1,173 1236 1,378 1,400 Nebraska Furnas County 933 1,096 1155 1,288 1,309 Nebraska Gage County 1,155 1,356 1429 1,593 1,619 Nebraska Garden County 866 1,017 1072 1,195 1,215 Nebraska Garfield County 892 1,048 1104 1,231 1,251 Nebraska Gosper County 980 1,151 1213 1,352 1,374 Nebraska Grant County 893 1,049 1105 1,232 1,252 Nebraska Greeley County 992 1,165 1228 1,369 1,391 Nebraska Hall County 1,178 1,384 1458 1,626 1,652 Nebraska Hamilton County 1,168 1,371 1445 1,611 1,637 Nebraska Harlan County 971 1,140 1201 1,339 1,361 Nebraska Hayes County 1,100 1,293 1362 1,519 1,543 Nebraska Hitchcock County 831 977 1029 1,147 1,166 Nebraska Holt County 1,012 1,189 1253 1,397 1,420 Nebraska Hooker County 978 1,149 1211 1,350 1,372 Nebraska Howard County 1,165 1,368 1442 1,608 1,634 Nebraska Jefferson County 976 1,146 1208 1,347 1,369 Nebraska Johnson County 1,102 1,294 1364 1,521 1,545 Nebraska Kearney County 1,071 1,258 1326 1,478 1,502 Nebraska Keith County 1,057 1,241 1308 1,458 1,482 Nebraska Keya Paha County 1,158 1,360 1433 1,598 1,624
Last
viewed
12/27
/16

Allowable Living Expense Housing and Utilities Standards – effective 03/31/2014
Please note that the standards change. We recommend you check the IRS.gov website periodically to assure you have latest version.
Nebraska Kimball County 1,092 1,282 1351 1,506 1,531 Nebraska Knox County 978 1,149 1211 1,350 1,372 Nebraska Lancaster County 1,341 1,575 1659 1,850 1,880 Nebraska Lincoln County 1,203 1,413 1489 1,661 1,687 Nebraska Logan County 1,200 1,409 1485 1,656 1,683 Nebraska Loup County 978 1,149 1211 1,350 1,372 Nebraska Madison County 1,117 1,312 1383 1,542 1,567 Nebraska McPherson County 1,511 1,775 1870 2,085 2,119 Nebraska Merrick County 1,001 1,176 1239 1,381 1,404 Nebraska Morrill County 979 1,150 1212 1,351 1,373 Nebraska Nance County 942 1,107 1166 1,300 1,321 Nebraska Nemaha County 1,042 1,223 1289 1,437 1,460 Nebraska Nuckolls County 957 1,125 1185 1,321 1,343 Nebraska Otoe County 1,257 1,477 1556 1,735 1,763 Nebraska Pawnee County 987 1,159 1221 1,361 1,383 Nebraska Perkins County 1,069 1,256 1323 1,476 1,499 Nebraska Phelps County 1,059 1,244 1311 1,462 1,485 Nebraska Pierce County 1,109 1,302 1372 1,530 1,555 Nebraska Platte County 1,096 1,287 1356 1,512 1,536 Nebraska Polk County 1,035 1,216 1281 1,428 1,451 Nebraska Red Willow County 1,012 1,188 1252 1,396 1,419 Nebraska Richardson County 849 997 1051 1,172 1,191 Nebraska Rock County 924 1,086 1144 1,276 1,296 Nebraska Saline County 1,135 1,334 1405 1,567 1,592 Nebraska Sarpy County 1,483 1,742 1835 2,046 2,079 Nebraska Saunders County 1,363 1,601 1687 1,881 1,911 Nebraska Scotts Bluff County 1,153 1,354 1427 1,591 1,617 Nebraska Seward County 1,282 1,506 1587 1,770 1,798 Nebraska Sheridan County 970 1,139 1200 1,338 1,360 Nebraska Sherman County 981 1,152 1214 1,354 1,375 Nebraska Sioux County 1,070 1,256 1324 1,476 1,500 Nebraska Stanton County 1,018 1,196 1260 1,405 1,428 Nebraska Thayer County 990 1,163 1225 1,366 1,388 Nebraska Thomas County 1,113 1,307 1377 1,535 1,560 Nebraska Thurston County 986 1,158 1220 1,360 1,382 Nebraska Valley County 919 1,079 1137 1,268 1,288 Nebraska Washington County 1,499 1,760 1855 2,068 2,102 Nebraska Wayne County 1,102 1,294 1364 1,521 1,545
Last
viewed
12/27
/16

Allowable Living Expense Housing and Utilities Standards – effective 03/31/2014
Please note that the standards change. We recommend you check the IRS.gov website periodically to assure you have latest version.
Nebraska Webster County 948 1,113 1173 1,308 1,329 Nebraska Wheeler County 950 1,115 1175 1,310 1,332 Nebraska York County 1,067 1,254 1321 1,473 1,497 Nevada Carson City 1,634 1,919 2022 2,255 2,291 Nevada Churchill County 1,304 1,532 1614 1,800 1,829 Nevada Clark County 1,730 2,032 2141 2,387 2,426 Nevada Douglas County 1,825 2,144 2259 2,519 2,559 Nevada Elko County 1,409 1,655 1743 1,944 1,975 Nevada Esmeralda County 1,049 1,232 1298 1,447 1,471 Nevada Eureka County 1,122 1,317 1388 1,548 1,573 Nevada Humboldt County 1,294 1,519 1601 1,785 1,814 Nevada Lander County 1,185 1,391 1466 1,635 1,661 Nevada Lincoln County 1,117 1,312 1382 1,541 1,566 Nevada Lyon County 1,425 1,674 1764 1,967 1,999 Nevada Mineral County 1,105 1,297 1367 1,524 1,549 Nevada Nye County 1,253 1,471 1550 1,729 1,757 Nevada Pershing County 1,197 1,405 1481 1,651 1,678 Nevada Storey County 1,575 1,850 1949 2,173 2,208 Nevada Washoe County 1,778 2,089 2201 2,454 2,494 Nevada White Pine County 1,117 1,312 1383 1,542 1,567 New Hampshire Belknap County 1,667 1,958 2063 2,301 2,338 New Hampshire Carroll County 1,464 1,720 1812 2,020 2,053 New Hampshire Cheshire County 1,608 1,889 1990 2,219 2,255 New Hampshire Coos County 1,242 1,459 1537 1,714 1,741 New Hampshire Grafton County 1,503 1,765 1860 2,074 2,107 New Hampshire Hillsborough County 1,951 2,291 2414 2,692 2,735 New Hampshire Merrimack County 1,809 2,125 2239 2,496 2,537 New Hampshire Rockingham County 2,043 2,400 2529 2,820 2,865 New Hampshire Strafford County 1,787 2,099 2212 2,466 2,506 New Hampshire Sullivan County 1,467 1,722 1815 2,024 2,056 New Jersey Atlantic County 1,842 2,164 2280 2,542 2,583 New Jersey Bergen County 2,740 3,218 3391 3,781 3,842 New Jersey Burlington County 1,990 2,337 2463 2,746 2,791 New Jersey Camden County 1,849 2,171 2288 2,551 2,592 New Jersey Cape May County 1,840 2,161 2277 2,539 2,580 New Jersey Cumberland County 1,605 1,885 1986 2,214 2,250 New Jersey Essex County 2,600 3,054 3218 3,588 3,646 New Jersey Gloucester County 1,924 2,260 2381 2,655 2,698
Last
viewed
12/27
/16

Allowable Living Expense Housing and Utilities Standards – effective 03/31/2014
Please note that the standards change. We recommend you check the IRS.gov website periodically to assure you have latest version.
New Jersey Hudson County 2,503 2,940 3098 3,454 3,510 New Jersey Hunterdon County 2,608 3,064 3228 3,599 3,658 New Jersey Mercer County 2,121 2,491 2625 2,927 2,974 New Jersey Middlesex County 2,258 2,652 2795 3,116 3,167 New Jersey Monmouth County 2,456 2,885 3040 3,390 3,444 New Jersey Morris County 2,637 3,097 3263 3,639 3,697 New Jersey Ocean County 1,952 2,293 2416 2,694 2,737 New Jersey Passaic County 2,489 2,924 3081 3,435 3,491 New Jersey Salem County 1,711 2,009 2117 2,360 2,399 New Jersey Somerset County 2,536 2,979 3139 3,500 3,556 New Jersey Sussex County 2,179 2,559 2697 3,007 3,056 New Jersey Union County 2,503 2,940 3098 3,454 3,510 New Jersey Warren County 2,106 2,473 2606 2,906 2,953 New Mexico Bernalillo County 1,351 1,587 1672 1,864 1,894 New Mexico Catron County 1,172 1,377 1451 1,618 1,644 New Mexico Chaves County 948 1,113 1173 1,308 1,329 New Mexico Cibola County 938 1,102 1161 1,295 1,315 New Mexico Colfax County 1,098 1,290 1359 1,515 1,540 New Mexico Curry County 1,036 1,217 1282 1,429 1,453 New Mexico DeBaca County 949 1,115 1175 1,310 1,331 New Mexico Dona Ana County 1,168 1,371 1445 1,611 1,637 New Mexico Eddy County 1,007 1,182 1246 1,389 1,412 New Mexico Grant County 1,017 1,195 1259 1,404 1,426 New Mexico Guadalupe County 989 1,162 1224 1,365 1,387 New Mexico Harding County 958 1,126 1186 1,322 1,344 New Mexico Hidalgo County 929 1,091 1150 1,282 1,303 New Mexico Lea County 1,082 1,271 1339 1,493 1,517 New Mexico Lincoln County 1,164 1,368 1441 1,607 1,633 New Mexico Los Alamos County 1,795 2,109 2222 2,478 2,518 New Mexico Luna County 983 1,154 1216 1,356 1,378 New Mexico McKinley County 1,065 1,251 1318 1,470 1,493 New Mexico Mora County 1,021 1,199 1263 1,408 1,431 New Mexico Otero County 1,019 1,197 1261 1,406 1,429 New Mexico Quay County 869 1,020 1075 1,199 1,218 New Mexico Rio Arriba County 1,139 1,338 1410 1,572 1,598 New Mexico Roosevelt County 1,012 1,188 1252 1,396 1,419 New Mexico San Juan County 1,210 1,422 1498 1,670 1,697 New Mexico San Miguel County 1,096 1,287 1356 1,512 1,537
Last
viewed
12/27
/16
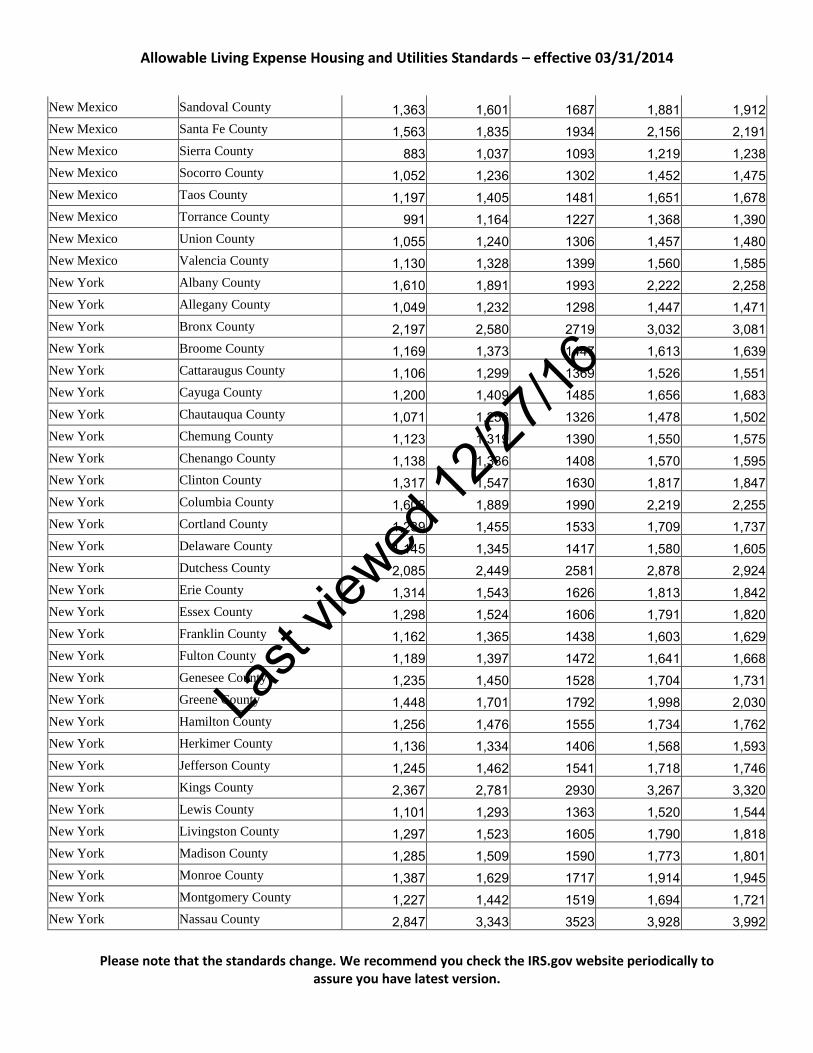
Allowable Living Expense Housing and Utilities Standards – effective 03/31/2014
Please note that the standards change. We recommend you check the IRS.gov website periodically to assure you have latest version.
New Mexico Sandoval County 1,363 1,601 1687 1,881 1,912 New Mexico Santa Fe County 1,563 1,835 1934 2,156 2,191 New Mexico Sierra County 883 1,037 1093 1,219 1,238 New Mexico Socorro County 1,052 1,236 1302 1,452 1,475 New Mexico Taos County 1,197 1,405 1481 1,651 1,678 New Mexico Torrance County 991 1,164 1227 1,368 1,390 New Mexico Union County 1,055 1,240 1306 1,457 1,480 New Mexico Valencia County 1,130 1,328 1399 1,560 1,585 New York Albany County 1,610 1,891 1993 2,222 2,258 New York Allegany County 1,049 1,232 1298 1,447 1,471 New York Bronx County 2,197 2,580 2719 3,032 3,081 New York Broome County 1,169 1,373 1447 1,613 1,639 New York Cattaraugus County 1,106 1,299 1369 1,526 1,551 New York Cayuga County 1,200 1,409 1485 1,656 1,683 New York Chautauqua County 1,071 1,258 1326 1,478 1,502 New York Chemung County 1,123 1,319 1390 1,550 1,575 New York Chenango County 1,138 1,336 1408 1,570 1,595 New York Clinton County 1,317 1,547 1630 1,817 1,847 New York Columbia County 1,608 1,889 1990 2,219 2,255 New York Cortland County 1,239 1,455 1533 1,709 1,737 New York Delaware County 1,145 1,345 1417 1,580 1,605 New York Dutchess County 2,085 2,449 2581 2,878 2,924 New York Erie County 1,314 1,543 1626 1,813 1,842 New York Essex County 1,298 1,524 1606 1,791 1,820 New York Franklin County 1,162 1,365 1438 1,603 1,629 New York Fulton County 1,189 1,397 1472 1,641 1,668 New York Genesee County 1,235 1,450 1528 1,704 1,731 New York Greene County 1,448 1,701 1792 1,998 2,030 New York Hamilton County 1,256 1,476 1555 1,734 1,762 New York Herkimer County 1,136 1,334 1406 1,568 1,593 New York Jefferson County 1,245 1,462 1541 1,718 1,746 New York Kings County 2,367 2,781 2930 3,267 3,320 New York Lewis County 1,101 1,293 1363 1,520 1,544 New York Livingston County 1,297 1,523 1605 1,790 1,818 New York Madison County 1,285 1,509 1590 1,773 1,801 New York Monroe County 1,387 1,629 1717 1,914 1,945 New York Montgomery County 1,227 1,442 1519 1,694 1,721 New York Nassau County 2,847 3,343 3523 3,928 3,992
Last
viewed
12/27
/16
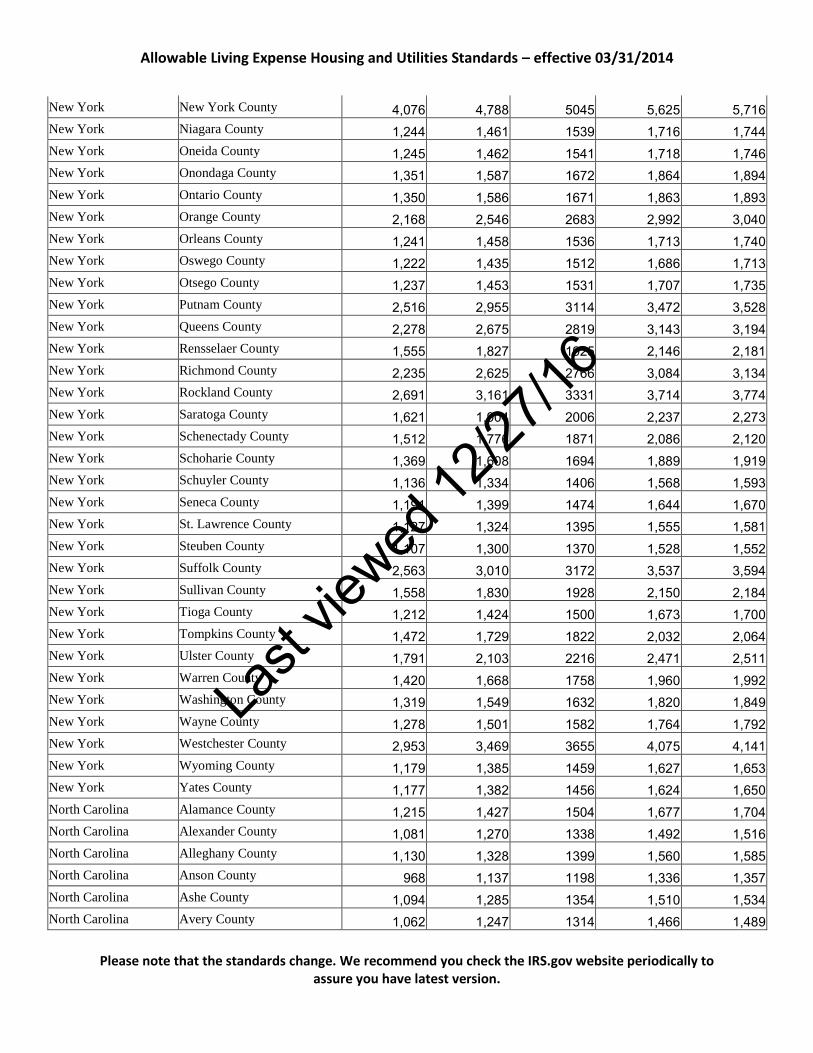
Allowable Living Expense Housing and Utilities Standards – effective 03/31/2014
Please note that the standards change. We recommend you check the IRS.gov website periodically to assure you have latest version.
New York New York County 4,076 4,788 5045 5,625 5,716 New York Niagara County 1,244 1,461 1539 1,716 1,744 New York Oneida County 1,245 1,462 1541 1,718 1,746 New York Onondaga County 1,351 1,587 1672 1,864 1,894 New York Ontario County 1,350 1,586 1671 1,863 1,893 New York Orange County 2,168 2,546 2683 2,992 3,040 New York Orleans County 1,241 1,458 1536 1,713 1,740 New York Oswego County 1,222 1,435 1512 1,686 1,713 New York Otsego County 1,237 1,453 1531 1,707 1,735 New York Putnam County 2,516 2,955 3114 3,472 3,528 New York Queens County 2,278 2,675 2819 3,143 3,194 New York Rensselaer County 1,555 1,827 1925 2,146 2,181 New York Richmond County 2,235 2,625 2766 3,084 3,134 New York Rockland County 2,691 3,161 3331 3,714 3,774 New York Saratoga County 1,621 1,904 2006 2,237 2,273 New York Schenectady County 1,512 1,776 1871 2,086 2,120 New York Schoharie County 1,369 1,608 1694 1,889 1,919 New York Schuyler County 1,136 1,334 1406 1,568 1,593 New York Seneca County 1,191 1,399 1474 1,644 1,670 New York St. Lawrence County 1,127 1,324 1395 1,555 1,581 New York Steuben County 1,107 1,300 1370 1,528 1,552 New York Suffolk County 2,563 3,010 3172 3,537 3,594 New York Sullivan County 1,558 1,830 1928 2,150 2,184 New York Tioga County 1,212 1,424 1500 1,673 1,700 New York Tompkins County 1,472 1,729 1822 2,032 2,064 New York Ulster County 1,791 2,103 2216 2,471 2,511 New York Warren County 1,420 1,668 1758 1,960 1,992 New York Washington County 1,319 1,549 1632 1,820 1,849 New York Wayne County 1,278 1,501 1582 1,764 1,792 New York Westchester County 2,953 3,469 3655 4,075 4,141 New York Wyoming County 1,179 1,385 1459 1,627 1,653 New York Yates County 1,177 1,382 1456 1,624 1,650 North Carolina Alamance County 1,215 1,427 1504 1,677 1,704 North Carolina Alexander County 1,081 1,270 1338 1,492 1,516 North Carolina Alleghany County 1,130 1,328 1399 1,560 1,585 North Carolina Anson County 968 1,137 1198 1,336 1,357 North Carolina Ashe County 1,094 1,285 1354 1,510 1,534 North Carolina Avery County 1,062 1,247 1314 1,466 1,489
Last
viewed
12/27
/16
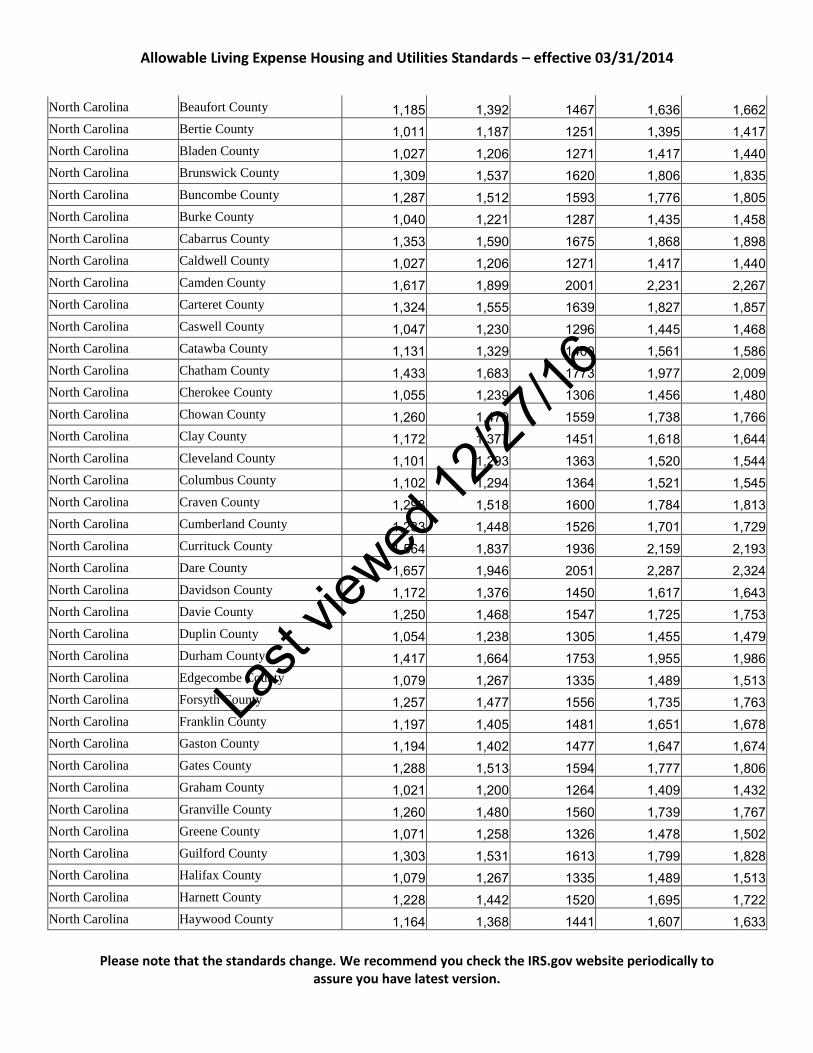
Allowable Living Expense Housing and Utilities Standards – effective 03/31/2014
Please note that the standards change. We recommend you check the IRS.gov website periodically to assure you have latest version.
North Carolina Beaufort County 1,185 1,392 1467 1,636 1,662 North Carolina Bertie County 1,011 1,187 1251 1,395 1,417 North Carolina Bladen County 1,027 1,206 1271 1,417 1,440 North Carolina Brunswick County 1,309 1,537 1620 1,806 1,835 North Carolina Buncombe County 1,287 1,512 1593 1,776 1,805 North Carolina Burke County 1,040 1,221 1287 1,435 1,458 North Carolina Cabarrus County 1,353 1,590 1675 1,868 1,898 North Carolina Caldwell County 1,027 1,206 1271 1,417 1,440 North Carolina Camden County 1,617 1,899 2001 2,231 2,267 North Carolina Carteret County 1,324 1,555 1639 1,827 1,857 North Carolina Caswell County 1,047 1,230 1296 1,445 1,468 North Carolina Catawba County 1,131 1,329 1400 1,561 1,586 North Carolina Chatham County 1,433 1,683 1773 1,977 2,009 North Carolina Cherokee County 1,055 1,239 1306 1,456 1,480 North Carolina Chowan County 1,260 1,479 1559 1,738 1,766 North Carolina Clay County 1,172 1,377 1451 1,618 1,644 North Carolina Cleveland County 1,101 1,293 1363 1,520 1,544 North Carolina Columbus County 1,102 1,294 1364 1,521 1,545 North Carolina Craven County 1,293 1,518 1600 1,784 1,813 North Carolina Cumberland County 1,233 1,448 1526 1,701 1,729 North Carolina Currituck County 1,564 1,837 1936 2,159 2,193 North Carolina Dare County 1,657 1,946 2051 2,287 2,324 North Carolina Davidson County 1,172 1,376 1450 1,617 1,643 North Carolina Davie County 1,250 1,468 1547 1,725 1,753 North Carolina Duplin County 1,054 1,238 1305 1,455 1,479 North Carolina Durham County 1,417 1,664 1753 1,955 1,986 North Carolina Edgecombe County 1,079 1,267 1335 1,489 1,513 North Carolina Forsyth County 1,257 1,477 1556 1,735 1,763 North Carolina Franklin County 1,197 1,405 1481 1,651 1,678 North Carolina Gaston County 1,194 1,402 1477 1,647 1,674 North Carolina Gates County 1,288 1,513 1594 1,777 1,806 North Carolina Graham County 1,021 1,200 1264 1,409 1,432 North Carolina Granville County 1,260 1,480 1560 1,739 1,767 North Carolina Greene County 1,071 1,258 1326 1,478 1,502 North Carolina Guilford County 1,303 1,531 1613 1,799 1,828 North Carolina Halifax County 1,079 1,267 1335 1,489 1,513 North Carolina Harnett County 1,228 1,442 1520 1,695 1,722 North Carolina Haywood County 1,164 1,368 1441 1,607 1,633
Last
viewed
12/27
/16
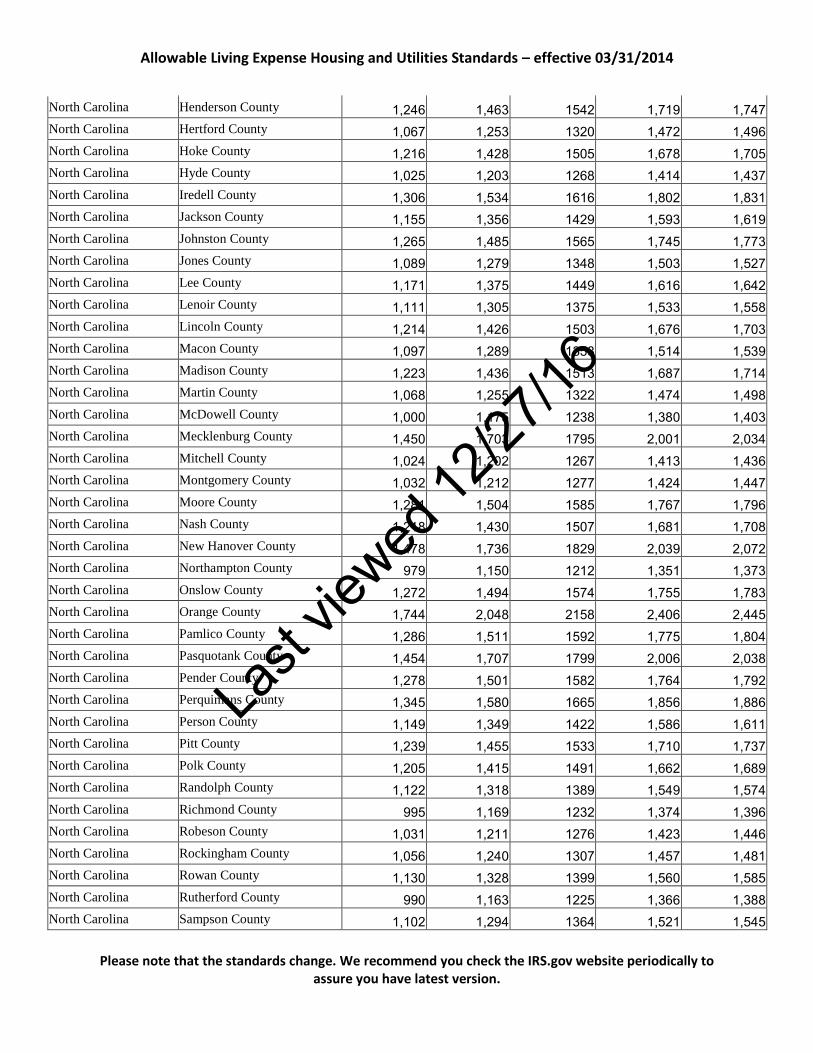
Allowable Living Expense Housing and Utilities Standards – effective 03/31/2014
Please note that the standards change. We recommend you check the IRS.gov website periodically to assure you have latest version.
North Carolina Henderson County 1,246 1,463 1542 1,719 1,747 North Carolina Hertford County 1,067 1,253 1320 1,472 1,496 North Carolina Hoke County 1,216 1,428 1505 1,678 1,705 North Carolina Hyde County 1,025 1,203 1268 1,414 1,437 North Carolina Iredell County 1,306 1,534 1616 1,802 1,831 North Carolina Jackson County 1,155 1,356 1429 1,593 1,619 North Carolina Johnston County 1,265 1,485 1565 1,745 1,773 North Carolina Jones County 1,089 1,279 1348 1,503 1,527 North Carolina Lee County 1,171 1,375 1449 1,616 1,642 North Carolina Lenoir County 1,111 1,305 1375 1,533 1,558 North Carolina Lincoln County 1,214 1,426 1503 1,676 1,703 North Carolina Macon County 1,097 1,289 1358 1,514 1,539 North Carolina Madison County 1,223 1,436 1513 1,687 1,714 North Carolina Martin County 1,068 1,255 1322 1,474 1,498 North Carolina McDowell County 1,000 1,175 1238 1,380 1,403 North Carolina Mecklenburg County 1,450 1,703 1795 2,001 2,034 North Carolina Mitchell County 1,024 1,202 1267 1,413 1,436 North Carolina Montgomery County 1,032 1,212 1277 1,424 1,447 North Carolina Moore County 1,281 1,504 1585 1,767 1,796 North Carolina Nash County 1,218 1,430 1507 1,681 1,708 North Carolina New Hanover County 1,478 1,736 1829 2,039 2,072 North Carolina Northampton County 979 1,150 1212 1,351 1,373 North Carolina Onslow County 1,272 1,494 1574 1,755 1,783 North Carolina Orange County 1,744 2,048 2158 2,406 2,445 North Carolina Pamlico County 1,286 1,511 1592 1,775 1,804 North Carolina Pasquotank County 1,454 1,707 1799 2,006 2,038 North Carolina Pender County 1,278 1,501 1582 1,764 1,792 North Carolina Perquimans County 1,345 1,580 1665 1,856 1,886 North Carolina Person County 1,149 1,349 1422 1,586 1,611 North Carolina Pitt County 1,239 1,455 1533 1,710 1,737 North Carolina Polk County 1,205 1,415 1491 1,662 1,689 North Carolina Randolph County 1,122 1,318 1389 1,549 1,574 North Carolina Richmond County 995 1,169 1232 1,374 1,396 North Carolina Robeson County 1,031 1,211 1276 1,423 1,446 North Carolina Rockingham County 1,056 1,240 1307 1,457 1,481 North Carolina Rowan County 1,130 1,328 1399 1,560 1,585 North Carolina Rutherford County 990 1,163 1225 1,366 1,388 North Carolina Sampson County 1,102 1,294 1364 1,521 1,545
Last
viewed
12/27
/16

Allowable Living Expense Housing and Utilities Standards – effective 03/31/2014
Please note that the standards change. We recommend you check the IRS.gov website periodically to assure you have latest version.
North Carolina Scotland County 1,036 1,217 1282 1,429 1,453 North Carolina Stanly County 1,169 1,373 1447 1,614 1,640 North Carolina Stokes County 1,071 1,257 1325 1,477 1,501 North Carolina Surry County 1,088 1,277 1346 1,501 1,525 North Carolina Swain County 1,033 1,213 1278 1,425 1,448 North Carolina Transylvania County 1,142 1,341 1413 1,575 1,601 North Carolina Tyrrell County 1,071 1,258 1326 1,478 1,502 North Carolina Union County 1,465 1,721 1813 2,021 2,054 North Carolina Vance County 1,141 1,340 1412 1,574 1,600 North Carolina Wake County 1,547 1,817 1915 2,135 2,170 North Carolina Warren County 1,110 1,304 1374 1,532 1,557 North Carolina Washington County 1,100 1,292 1361 1,518 1,542 North Carolina Watauga County 1,297 1,523 1605 1,790 1,818 North Carolina Wayne County 1,151 1,352 1425 1,589 1,615 North Carolina Wilkes County 1,068 1,255 1322 1,474 1,498 North Carolina Wilson County 1,225 1,439 1516 1,690 1,718 North Carolina Yadkin County 1,106 1,300 1369 1,527 1,551 North Carolina Yancey County 1,048 1,231 1297 1,446 1,470 North Dakota Adams County 998 1,172 1235 1,377 1,399 North Dakota Barnes County 1,067 1,254 1321 1,473 1,497 North Dakota Benson County 914 1,073 1131 1,261 1,281 North Dakota Billings County 980 1,151 1213 1,352 1,374 North Dakota Bottineau County 968 1,137 1198 1,336 1,357 North Dakota Bowman County 972 1,142 1203 1,341 1,363 North Dakota Burke County 949 1,114 1174 1,309 1,330 North Dakota Burleigh County 1,333 1,566 1650 1,840 1,869 North Dakota Cass County 1,383 1,625 1712 1,909 1,940 North Dakota Cavalier County 965 1,133 1194 1,331 1,353 North Dakota Dickey County 1,060 1,245 1312 1,463 1,486 North Dakota Divide County 1,076 1,264 1332 1,485 1,509 North Dakota Dunn County 854 1,003 1057 1,179 1,198 North Dakota Eddy County 939 1,103 1162 1,296 1,317 North Dakota Emmons County 905 1,063 1120 1,249 1,269 North Dakota Foster County 1,069 1,256 1323 1,475 1,499 North Dakota Golden Valley County 914 1,073 1131 1,261 1,281 North Dakota Grand Forks County 1,319 1,550 1633 1,821 1,850 North Dakota Grant County 1,048 1,231 1297 1,446 1,470 North Dakota Griggs County 965 1,133 1194 1,331 1,353
Last
viewed
12/27
/16

Allowable Living Expense Housing and Utilities Standards – effective 03/31/2014
Please note that the standards change. We recommend you check the IRS.gov website periodically to assure you have latest version.
North Dakota Hettinger County 877 1,031 1086 1,211 1,230 North Dakota Kidder County 991 1,163 1226 1,367 1,389 North Dakota LaMoure County 1,023 1,201 1266 1,412 1,434 North Dakota Logan County 1,064 1,250 1317 1,469 1,492 North Dakota McHenry County 1,017 1,195 1259 1,404 1,426 North Dakota McIntosh County 966 1,134 1195 1,332 1,354 North Dakota McKenzie County 1,004 1,180 1243 1,386 1,408 North Dakota McLean County 1,068 1,254 1321 1,473 1,497 North Dakota Mercer County 1,024 1,202 1267 1,413 1,436 North Dakota Morton County 1,239 1,455 1533 1,709 1,737 North Dakota Mountrail County 933 1,096 1155 1,288 1,309 North Dakota Nelson County 960 1,127 1188 1,325 1,346 North Dakota Oliver County 1,038 1,219 1285 1,433 1,456 North Dakota Pembina County 1,007 1,182 1246 1,389 1,412 North Dakota Pierce County 1,012 1,188 1252 1,396 1,419 North Dakota Ramsey County 1,032 1,212 1277 1,424 1,447 North Dakota Ransom County 1,122 1,317 1388 1,548 1,573 North Dakota Renville County 1,012 1,188 1252 1,396 1,419 North Dakota Richland County 1,122 1,317 1388 1,548 1,573 North Dakota Rolette County 810 951 1002 1,117 1,135 North Dakota Sargent County 1,017 1,194 1258 1,403 1,425 North Dakota Sheridan County 1,054 1,237 1304 1,454 1,477 North Dakota Sioux County 887 1,042 1098 1,224 1,244 North Dakota Slope County 1,041 1,222 1288 1,436 1,459 North Dakota Stark County 1,175 1,380 1454 1,621 1,647 North Dakota Steele County 960 1,127 1188 1,325 1,346 North Dakota Stutsman County 1,048 1,231 1297 1,446 1,470 North Dakota Towner County 931 1,093 1152 1,284 1,305 North Dakota Traill County 1,104 1,296 1366 1,523 1,548 North Dakota Walsh County 953 1,119 1179 1,315 1,336 North Dakota Ward County 1,190 1,398 1473 1,642 1,669 North Dakota Wells County 999 1,173 1236 1,379 1,401 North Dakota Williams County 1,040 1,221 1287 1,435 1,458 Ohio Adams County 1,058 1,243 1310 1,461 1,484 Ohio Allen County 1,116 1,311 1381 1,540 1,565 Ohio Ashland County 1,167 1,370 1444 1,610 1,636 Ohio Ashtabula County 1,148 1,349 1421 1,584 1,610 Ohio Athens County 1,162 1,365 1438 1,604 1,630
Last
viewed
12/27
/16

Allowable Living Expense Housing and Utilities Standards – effective 03/31/2014
Please note that the standards change. We recommend you check the IRS.gov website periodically to assure you have latest version.
Ohio Auglaize County 1,173 1,378 1452 1,619 1,645 Ohio Belmont County 997 1,171 1234 1,376 1,398 Ohio Brown County 1,168 1,372 1446 1,612 1,638 Ohio Butler County 1,423 1,671 1761 1,964 1,995 Ohio Carroll County 1,133 1,331 1402 1,563 1,589 Ohio Champaign County 1,180 1,386 1460 1,628 1,654 Ohio Clark County 1,143 1,342 1414 1,577 1,602 Ohio Clermont County 1,441 1,692 1783 1,988 2,020 Ohio Clinton County 1,248 1,465 1544 1,722 1,750 Ohio Columbiana County 1,091 1,281 1350 1,505 1,530 Ohio Coshocton County 1,029 1,208 1273 1,419 1,442 Ohio Crawford County 1,058 1,243 1310 1,461 1,484 Ohio Cuyahoga County 1,361 1,598 1684 1,878 1,908 Ohio Darke County 1,083 1,272 1340 1,494 1,518 Ohio Defiance County 1,139 1,338 1410 1,572 1,598 Ohio Delaware County 1,877 2,205 2323 2,591 2,633 Ohio Erie County 1,277 1,500 1581 1,763 1,791 Ohio Fairfield County 1,423 1,671 1761 1,964 1,995 Ohio Fayette County 1,140 1,339 1410 1,573 1,598 Ohio Franklin County 1,417 1,665 1754 1,956 1,987 Ohio Fulton County 1,248 1,465 1544 1,722 1,750 Ohio Gallia County 1,121 1,316 1387 1,547 1,571 Ohio Geauga County 1,681 1,974 2080 2,319 2,357 Ohio Greene County 1,408 1,653 1742 1,942 1,974 Ohio Guernsey County 1,030 1,210 1275 1,422 1,445 Ohio Hamilton County 1,407 1,652 1741 1,942 1,973 Ohio Hancock County 1,210 1,422 1498 1,670 1,697 Ohio Hardin County 1,099 1,291 1360 1,516 1,541 Ohio Harrison County 966 1,134 1195 1,332 1,354 Ohio Henry County 1,170 1,374 1448 1,615 1,641 Ohio Highland County 1,095 1,286 1355 1,511 1,535 Ohio Hocking County 1,113 1,307 1377 1,535 1,560 Ohio Holmes County 1,153 1,354 1427 1,591 1,617 Ohio Huron County 1,178 1,384 1458 1,626 1,652 Ohio Jackson County 1,084 1,273 1341 1,495 1,519 Ohio Jefferson County 1,012 1,188 1252 1,396 1,419 Ohio Knox County 1,216 1,428 1505 1,678 1,705 Ohio Lake County 1,383 1,625 1712 1,909 1,940
Last
viewed
12/27
/16
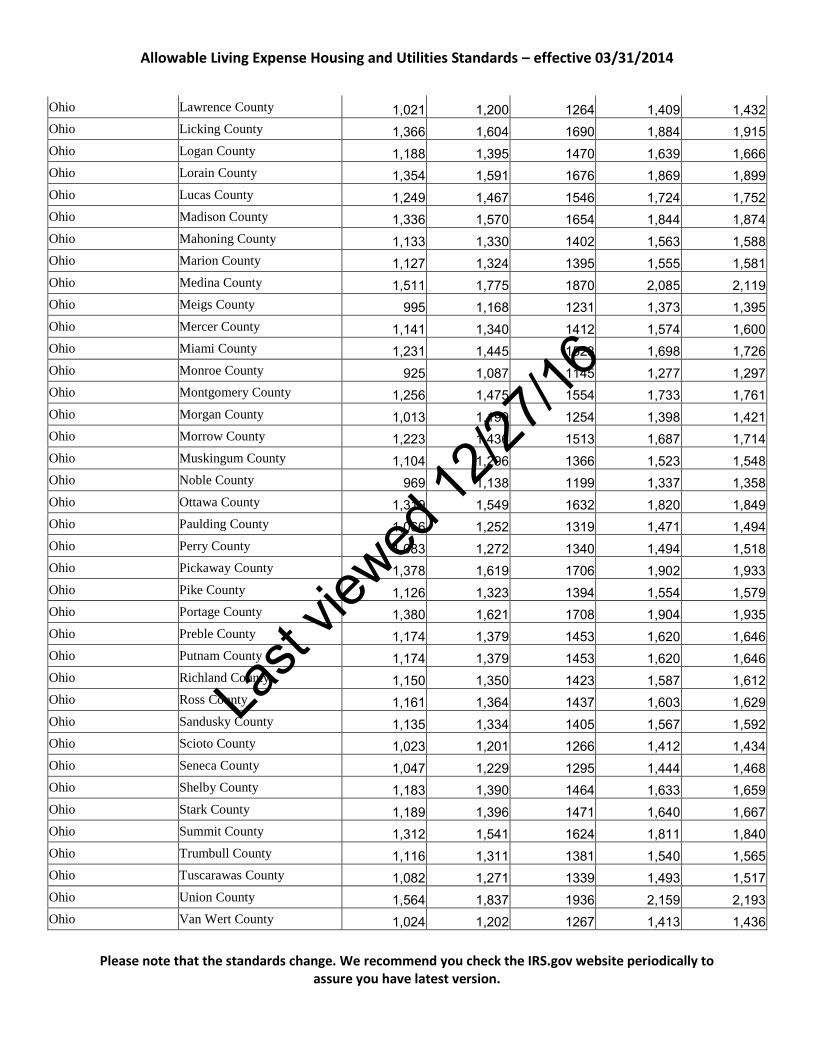
Allowable Living Expense Housing and Utilities Standards – effective 03/31/2014
Please note that the standards change. We recommend you check the IRS.gov website periodically to assure you have latest version.
Ohio Lawrence County 1,021 1,200 1264 1,409 1,432 Ohio Licking County 1,366 1,604 1690 1,884 1,915 Ohio Logan County 1,188 1,395 1470 1,639 1,666 Ohio Lorain County 1,354 1,591 1676 1,869 1,899 Ohio Lucas County 1,249 1,467 1546 1,724 1,752 Ohio Madison County 1,336 1,570 1654 1,844 1,874 Ohio Mahoning County 1,133 1,330 1402 1,563 1,588 Ohio Marion County 1,127 1,324 1395 1,555 1,581 Ohio Medina County 1,511 1,775 1870 2,085 2,119 Ohio Meigs County 995 1,168 1231 1,373 1,395 Ohio Mercer County 1,141 1,340 1412 1,574 1,600 Ohio Miami County 1,231 1,445 1523 1,698 1,726 Ohio Monroe County 925 1,087 1145 1,277 1,297 Ohio Montgomery County 1,256 1,475 1554 1,733 1,761 Ohio Morgan County 1,013 1,190 1254 1,398 1,421 Ohio Morrow County 1,223 1,436 1513 1,687 1,714 Ohio Muskingum County 1,104 1,296 1366 1,523 1,548 Ohio Noble County 969 1,138 1199 1,337 1,358 Ohio Ottawa County 1,319 1,549 1632 1,820 1,849 Ohio Paulding County 1,066 1,252 1319 1,471 1,494 Ohio Perry County 1,083 1,272 1340 1,494 1,518 Ohio Pickaway County 1,378 1,619 1706 1,902 1,933 Ohio Pike County 1,126 1,323 1394 1,554 1,579 Ohio Portage County 1,380 1,621 1708 1,904 1,935 Ohio Preble County 1,174 1,379 1453 1,620 1,646 Ohio Putnam County 1,174 1,379 1453 1,620 1,646 Ohio Richland County 1,150 1,350 1423 1,587 1,612 Ohio Ross County 1,161 1,364 1437 1,603 1,629 Ohio Sandusky County 1,135 1,334 1405 1,567 1,592 Ohio Scioto County 1,023 1,201 1266 1,412 1,434 Ohio Seneca County 1,047 1,229 1295 1,444 1,468 Ohio Shelby County 1,183 1,390 1464 1,633 1,659 Ohio Stark County 1,189 1,396 1471 1,640 1,667 Ohio Summit County 1,312 1,541 1624 1,811 1,840 Ohio Trumbull County 1,116 1,311 1381 1,540 1,565 Ohio Tuscarawas County 1,082 1,271 1339 1,493 1,517 Ohio Union County 1,564 1,837 1936 2,159 2,193 Ohio Van Wert County 1,024 1,202 1267 1,413 1,436
Last
viewed
12/27
/16

Allowable Living Expense Housing and Utilities Standards – effective 03/31/2014
Please note that the standards change. We recommend you check the IRS.gov website periodically to assure you have latest version.
Ohio Vinton County 1,021 1,199 1263 1,409 1,431 Ohio Warren County 1,622 1,906 2008 2,239 2,275 Ohio Washington County 1,082 1,271 1339 1,493 1,517 Ohio Wayne County 1,218 1,430 1507 1,680 1,707 Ohio Williams County 1,094 1,285 1354 1,510 1,534 Ohio Wood County 1,370 1,609 1695 1,890 1,921 Ohio Wyandot County 1,097 1,289 1358 1,514 1,539 Oklahoma Adair County 922 1,083 1141 1,272 1,293 Oklahoma Alfalfa County 884 1,038 1094 1,220 1,240 Oklahoma Atoka County 971 1,140 1201 1,339 1,361 Oklahoma Beaver County 1,106 1,299 1368 1,526 1,550 Oklahoma Beckham County 1,050 1,233 1299 1,448 1,472 Oklahoma Blaine County 948 1,113 1173 1,308 1,329 Oklahoma Bryan County 1,008 1,183 1247 1,390 1,413 Oklahoma Caddo County 927 1,089 1147 1,279 1,300 Oklahoma Canadian County 1,281 1,504 1585 1,767 1,796 Oklahoma Carter County 1,021 1,199 1263 1,408 1,431 Oklahoma Cherokee County 1,008 1,184 1248 1,392 1,414 Oklahoma Choctaw County 894 1,050 1106 1,233 1,253 Oklahoma Cimarron County 941 1,106 1165 1,299 1,320 Oklahoma Cleveland County 1,281 1,504 1585 1,767 1,796 Oklahoma Coal County 882 1,035 1091 1,216 1,236 Oklahoma Comanche County 1,133 1,330 1402 1,563 1,588 Oklahoma Cotton County 974 1,144 1205 1,344 1,366 Oklahoma Craig County 977 1,147 1209 1,348 1,370 Oklahoma Creek County 1,112 1,306 1376 1,534 1,559 Oklahoma Custer County 1,037 1,219 1284 1,432 1,455 Oklahoma Delaware County 1,013 1,190 1254 1,398 1,421 Oklahoma Dewey County 907 1,066 1123 1,252 1,272 Oklahoma Ellis County 941 1,106 1165 1,299 1,320 Oklahoma Garfield County 993 1,166 1229 1,370 1,392 Oklahoma Garvin County 1,012 1,189 1253 1,397 1,420 Oklahoma Grady County 1,138 1,336 1408 1,570 1,595 Oklahoma Grant County 987 1,159 1221 1,361 1,383 Oklahoma Greer County 873 1,025 1080 1,204 1,224 Oklahoma Harmon County 843 990 1043 1,163 1,182 Oklahoma Harper County 889 1,044 1100 1,227 1,246 Oklahoma Haskell County 966 1,135 1196 1,334 1,355
Last
viewed
12/27
/16
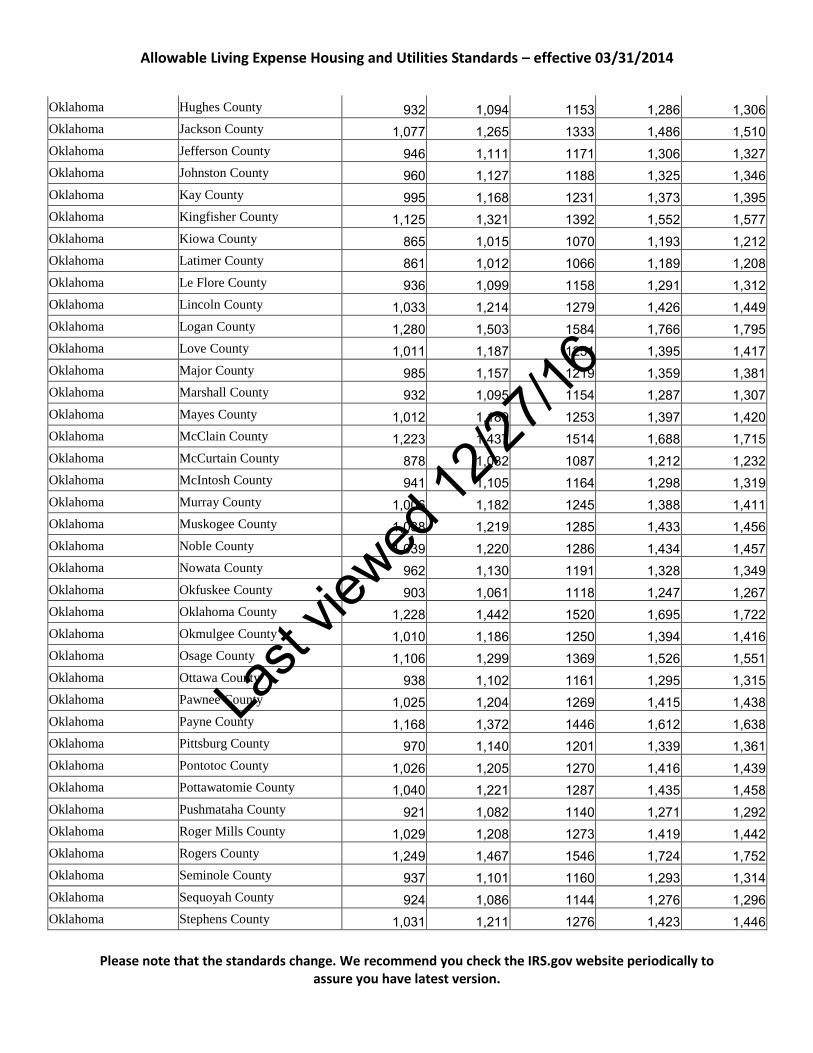
Allowable Living Expense Housing and Utilities Standards – effective 03/31/2014
Please note that the standards change. We recommend you check the IRS.gov website periodically to assure you have latest version.
Oklahoma Hughes County 932 1,094 1153 1,286 1,306 Oklahoma Jackson County 1,077 1,265 1333 1,486 1,510 Oklahoma Jefferson County 946 1,111 1171 1,306 1,327 Oklahoma Johnston County 960 1,127 1188 1,325 1,346 Oklahoma Kay County 995 1,168 1231 1,373 1,395 Oklahoma Kingfisher County 1,125 1,321 1392 1,552 1,577 Oklahoma Kiowa County 865 1,015 1070 1,193 1,212 Oklahoma Latimer County 861 1,012 1066 1,189 1,208 Oklahoma Le Flore County 936 1,099 1158 1,291 1,312 Oklahoma Lincoln County 1,033 1,214 1279 1,426 1,449 Oklahoma Logan County 1,280 1,503 1584 1,766 1,795 Oklahoma Love County 1,011 1,187 1251 1,395 1,417 Oklahoma Major County 985 1,157 1219 1,359 1,381 Oklahoma Marshall County 932 1,095 1154 1,287 1,307 Oklahoma Mayes County 1,012 1,189 1253 1,397 1,420 Oklahoma McClain County 1,223 1,437 1514 1,688 1,715 Oklahoma McCurtain County 878 1,032 1087 1,212 1,232 Oklahoma McIntosh County 941 1,105 1164 1,298 1,319 Oklahoma Murray County 1,006 1,182 1245 1,388 1,411 Oklahoma Muskogee County 1,038 1,219 1285 1,433 1,456 Oklahoma Noble County 1,039 1,220 1286 1,434 1,457 Oklahoma Nowata County 962 1,130 1191 1,328 1,349 Oklahoma Okfuskee County 903 1,061 1118 1,247 1,267 Oklahoma Oklahoma County 1,228 1,442 1520 1,695 1,722 Oklahoma Okmulgee County 1,010 1,186 1250 1,394 1,416 Oklahoma Osage County 1,106 1,299 1369 1,526 1,551 Oklahoma Ottawa County 938 1,102 1161 1,295 1,315 Oklahoma Pawnee County 1,025 1,204 1269 1,415 1,438 Oklahoma Payne County 1,168 1,372 1446 1,612 1,638 Oklahoma Pittsburg County 970 1,140 1201 1,339 1,361 Oklahoma Pontotoc County 1,026 1,205 1270 1,416 1,439 Oklahoma Pottawatomie County 1,040 1,221 1287 1,435 1,458 Oklahoma Pushmataha County 921 1,082 1140 1,271 1,292 Oklahoma Roger Mills County 1,029 1,208 1273 1,419 1,442 Oklahoma Rogers County 1,249 1,467 1546 1,724 1,752 Oklahoma Seminole County 937 1,101 1160 1,293 1,314 Oklahoma Sequoyah County 924 1,086 1144 1,276 1,296 Oklahoma Stephens County 1,031 1,211 1276 1,423 1,446
Last
viewed
12/27
/16
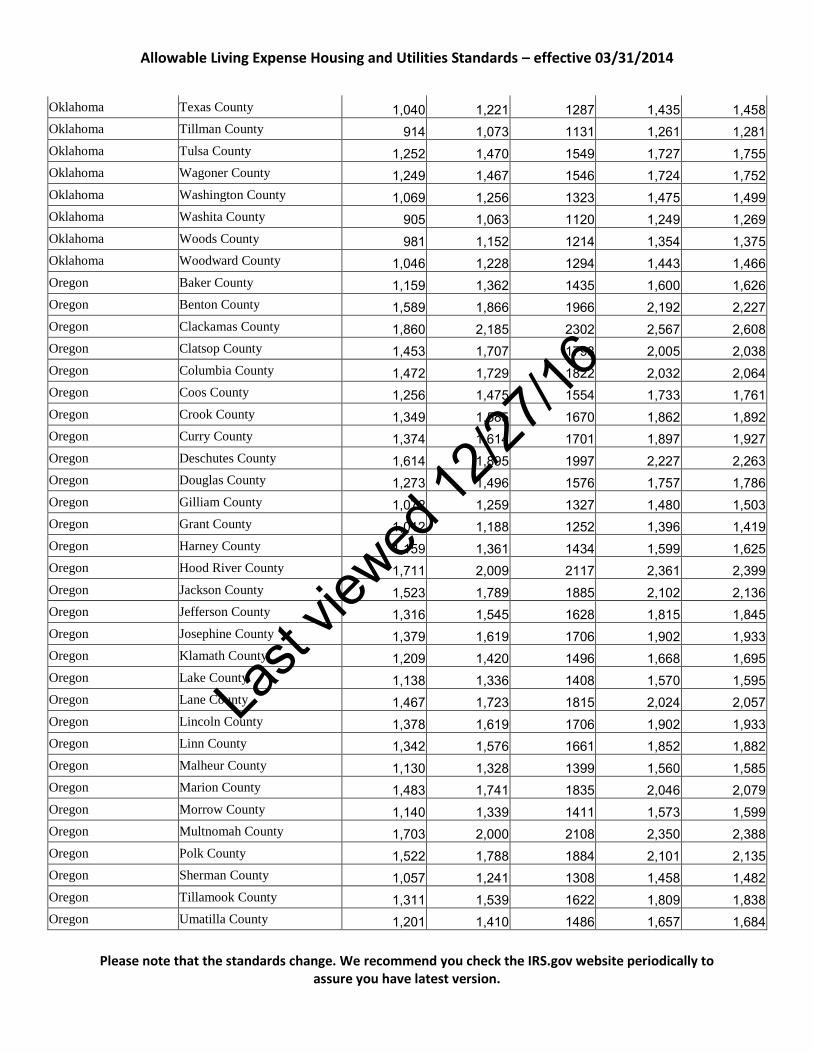
Allowable Living Expense Housing and Utilities Standards – effective 03/31/2014
Please note that the standards change. We recommend you check the IRS.gov website periodically to assure you have latest version.
Oklahoma Texas County 1,040 1,221 1287 1,435 1,458 Oklahoma Tillman County 914 1,073 1131 1,261 1,281 Oklahoma Tulsa County 1,252 1,470 1549 1,727 1,755 Oklahoma Wagoner County 1,249 1,467 1546 1,724 1,752 Oklahoma Washington County 1,069 1,256 1323 1,475 1,499 Oklahoma Washita County 905 1,063 1120 1,249 1,269 Oklahoma Woods County 981 1,152 1214 1,354 1,375 Oklahoma Woodward County 1,046 1,228 1294 1,443 1,466 Oregon Baker County 1,159 1,362 1435 1,600 1,626 Oregon Benton County 1,589 1,866 1966 2,192 2,227 Oregon Clackamas County 1,860 2,185 2302 2,567 2,608 Oregon Clatsop County 1,453 1,707 1798 2,005 2,038 Oregon Columbia County 1,472 1,729 1822 2,032 2,064 Oregon Coos County 1,256 1,475 1554 1,733 1,761 Oregon Crook County 1,349 1,585 1670 1,862 1,892 Oregon Curry County 1,374 1,614 1701 1,897 1,927 Oregon Deschutes County 1,614 1,895 1997 2,227 2,263 Oregon Douglas County 1,273 1,496 1576 1,757 1,786 Oregon Gilliam County 1,072 1,259 1327 1,480 1,503 Oregon Grant County 1,012 1,188 1252 1,396 1,419 Oregon Harney County 1,159 1,361 1434 1,599 1,625 Oregon Hood River County 1,711 2,009 2117 2,361 2,399 Oregon Jackson County 1,523 1,789 1885 2,102 2,136 Oregon Jefferson County 1,316 1,545 1628 1,815 1,845 Oregon Josephine County 1,379 1,619 1706 1,902 1,933 Oregon Klamath County 1,209 1,420 1496 1,668 1,695 Oregon Lake County 1,138 1,336 1408 1,570 1,595 Oregon Lane County 1,467 1,723 1815 2,024 2,057 Oregon Lincoln County 1,378 1,619 1706 1,902 1,933 Oregon Linn County 1,342 1,576 1661 1,852 1,882 Oregon Malheur County 1,130 1,328 1399 1,560 1,585 Oregon Marion County 1,483 1,741 1835 2,046 2,079 Oregon Morrow County 1,140 1,339 1411 1,573 1,599 Oregon Multnomah County 1,703 2,000 2108 2,350 2,388 Oregon Polk County 1,522 1,788 1884 2,101 2,135 Oregon Sherman County 1,057 1,241 1308 1,458 1,482 Oregon Tillamook County 1,311 1,539 1622 1,809 1,838 Oregon Umatilla County 1,201 1,410 1486 1,657 1,684
Last
viewed
12/27
/16
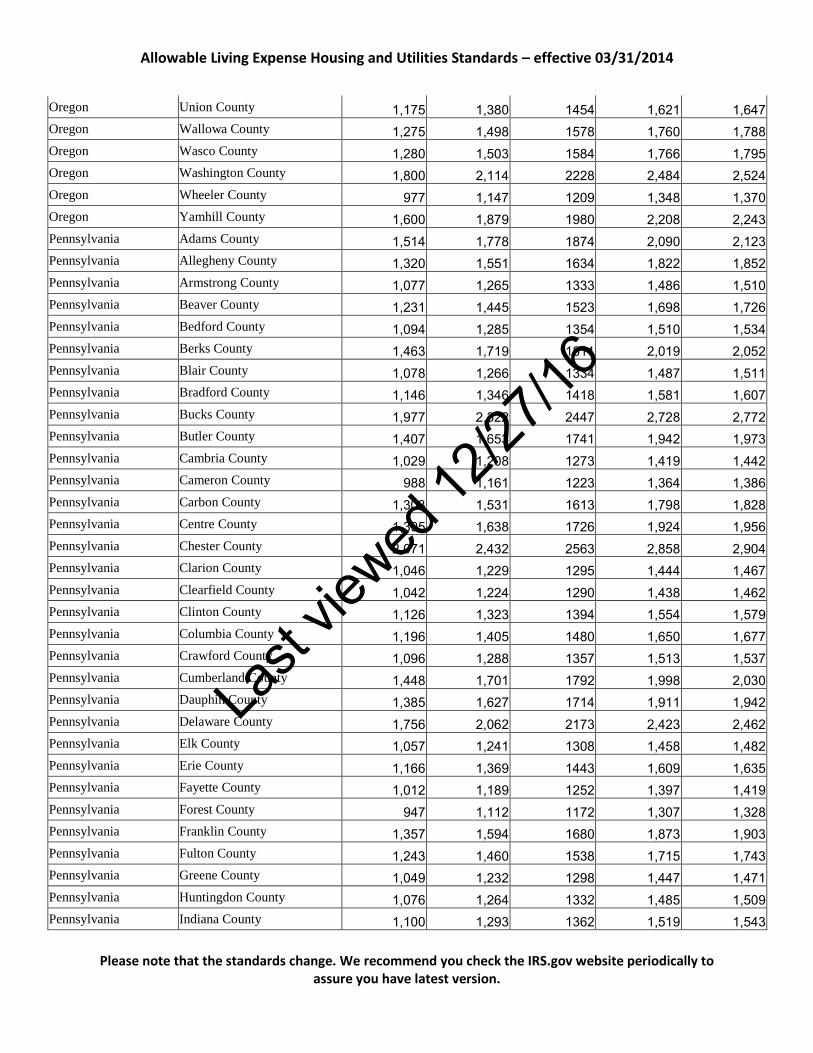
Allowable Living Expense Housing and Utilities Standards – effective 03/31/2014
Please note that the standards change. We recommend you check the IRS.gov website periodically to assure you have latest version.
Oregon Union County 1,175 1,380 1454 1,621 1,647 Oregon Wallowa County 1,275 1,498 1578 1,760 1,788 Oregon Wasco County 1,280 1,503 1584 1,766 1,795 Oregon Washington County 1,800 2,114 2228 2,484 2,524 Oregon Wheeler County 977 1,147 1209 1,348 1,370 Oregon Yamhill County 1,600 1,879 1980 2,208 2,243 Pennsylvania Adams County 1,514 1,778 1874 2,090 2,123 Pennsylvania Allegheny County 1,320 1,551 1634 1,822 1,852 Pennsylvania Armstrong County 1,077 1,265 1333 1,486 1,510 Pennsylvania Beaver County 1,231 1,445 1523 1,698 1,726 Pennsylvania Bedford County 1,094 1,285 1354 1,510 1,534 Pennsylvania Berks County 1,463 1,719 1811 2,019 2,052 Pennsylvania Blair County 1,078 1,266 1334 1,487 1,511 Pennsylvania Bradford County 1,146 1,346 1418 1,581 1,607 Pennsylvania Bucks County 1,977 2,322 2447 2,728 2,772 Pennsylvania Butler County 1,407 1,653 1741 1,942 1,973 Pennsylvania Cambria County 1,029 1,208 1273 1,419 1,442 Pennsylvania Cameron County 988 1,161 1223 1,364 1,386 Pennsylvania Carbon County 1,303 1,531 1613 1,798 1,828 Pennsylvania Centre County 1,395 1,638 1726 1,924 1,956 Pennsylvania Chester County 2,071 2,432 2563 2,858 2,904 Pennsylvania Clarion County 1,046 1,229 1295 1,444 1,467 Pennsylvania Clearfield County 1,042 1,224 1290 1,438 1,462 Pennsylvania Clinton County 1,126 1,323 1394 1,554 1,579 Pennsylvania Columbia County 1,196 1,405 1480 1,650 1,677 Pennsylvania Crawford County 1,096 1,288 1357 1,513 1,537 Pennsylvania Cumberland County 1,448 1,701 1792 1,998 2,030 Pennsylvania Dauphin County 1,385 1,627 1714 1,911 1,942 Pennsylvania Delaware County 1,756 2,062 2173 2,423 2,462 Pennsylvania Elk County 1,057 1,241 1308 1,458 1,482 Pennsylvania Erie County 1,166 1,369 1443 1,609 1,635 Pennsylvania Fayette County 1,012 1,189 1252 1,397 1,419 Pennsylvania Forest County 947 1,112 1172 1,307 1,328 Pennsylvania Franklin County 1,357 1,594 1680 1,873 1,903 Pennsylvania Fulton County 1,243 1,460 1538 1,715 1,743 Pennsylvania Greene County 1,049 1,232 1298 1,447 1,471 Pennsylvania Huntingdon County 1,076 1,264 1332 1,485 1,509 Pennsylvania Indiana County 1,100 1,293 1362 1,519 1,543
Last
viewed
12/27
/16

Allowable Living Expense Housing and Utilities Standards – effective 03/31/2014
Please note that the standards change. We recommend you check the IRS.gov website periodically to assure you have latest version.
Pennsylvania Jefferson County 979 1,150 1212 1,351 1,373 Pennsylvania Juniata County 1,194 1,403 1478 1,648 1,675 Pennsylvania Lackawanna County 1,320 1,551 1634 1,822 1,851 Pennsylvania Lancaster County 1,450 1,703 1795 2,001 2,034 Pennsylvania Lawrence County 1,126 1,322 1393 1,553 1,578 Pennsylvania Lebanon County 1,362 1,600 1686 1,880 1,910 Pennsylvania Lehigh County 1,555 1,826 1924 2,145 2,180 Pennsylvania Luzerne County 1,224 1,438 1515 1,689 1,716 Pennsylvania Lycoming County 1,203 1,413 1489 1,660 1,687 Pennsylvania McKean County 983 1,155 1217 1,357 1,379 Pennsylvania Mercer County 1,117 1,312 1383 1,542 1,567 Pennsylvania Mifflin County 1,063 1,248 1315 1,466 1,490 Pennsylvania Monroe County 1,652 1,941 2045 2,280 2,317 Pennsylvania Montgomery County 1,949 2,289 2412 2,689 2,733 Pennsylvania Montour County 1,261 1,481 1561 1,741 1,769 Pennsylvania Northampton County 1,614 1,896 1998 2,228 2,264 Pennsylvania Northumberland County 1,117 1,312 1383 1,542 1,567 Pennsylvania Perry County 1,332 1,565 1649 1,839 1,868 Pennsylvania Philadelphia County 1,241 1,458 1536 1,713 1,740 Pennsylvania Pike County 1,577 1,852 1951 2,176 2,211 Pennsylvania Potter County 1,088 1,278 1347 1,502 1,526 Pennsylvania Schuylkill County 1,138 1,336 1408 1,570 1,595 Pennsylvania Snyder County 1,172 1,376 1450 1,617 1,643 Pennsylvania Somerset County 1,083 1,272 1340 1,494 1,518 Pennsylvania Sullivan County 1,115 1,310 1380 1,539 1,564 Pennsylvania Susquehanna County 1,211 1,423 1499 1,671 1,698 Pennsylvania Tioga County 1,143 1,343 1415 1,578 1,603 Pennsylvania Union County 1,286 1,511 1592 1,775 1,804 Pennsylvania Venango County 974 1,144 1205 1,344 1,365 Pennsylvania Warren County 1,016 1,193 1257 1,402 1,424 Pennsylvania Washington County 1,261 1,481 1561 1,741 1,769 Pennsylvania Wayne County 1,361 1,598 1684 1,878 1,908 Pennsylvania Westmoreland County 1,232 1,447 1525 1,700 1,728 Pennsylvania Wyoming County 1,256 1,476 1555 1,734 1,762 Pennsylvania York County 1,483 1,742 1836 2,047 2,080 Puerto Rico Adjuntas Municipio 961 1,128 1189 1,326 1,347 Puerto Rico Aguada Municipio 1,012 1,189 1253 1,397 1,420 Puerto Rico Aguadilla Municipio 1,168 1,372 1446 1,612 1,638
Last
viewed
12/27
/16

Allowable Living Expense Housing and Utilities Standards – effective 03/31/2014
Please note that the standards change. We recommend you check the IRS.gov website periodically to assure you have latest version.
Puerto Rico Aguas Buenas Municipio 1,160 1,363 1436 1,601 1,627 Puerto Rico Aibonito Municipio 1,124 1,320 1391 1,551 1,576 Puerto Rico Añasco Municipio 949 1,115 1175 1,310 1,331 Puerto Rico Arecibo Municipio 1,114 1,309 1379 1,538 1,562 Puerto Rico Arroyo Municipio 901 1,058 1115 1,243 1,263 Puerto Rico Barceloneta Municipio 1,012 1,189 1253 1,397 1,420 Puerto Rico Barranquitas Municipio 1,027 1,206 1271 1,417 1,440 Puerto Rico Bayamón Municipio 1,332 1,564 1648 1,838 1,867 Puerto Rico Cabo Rojo Municipio 1,053 1,237 1303 1,453 1,476 Puerto Rico Caguas Municipio 1,254 1,473 1552 1,730 1,758 Puerto Rico Camuy Municipio 1,032 1,212 1277 1,424 1,447 Puerto Rico Canóvanas Municipio 1,154 1,355 1428 1,592 1,618 Puerto Rico Carolina Municipio 1,336 1,570 1654 1,844 1,874 Puerto Rico Cataño Municipio 1,528 1,795 1891 2,108 2,143 Puerto Rico Cayey Municipio 1,197 1,406 1482 1,652 1,679 Puerto Rico Ceiba Municipio 1,030 1,210 1275 1,422 1,445 Puerto Rico Ciales Municipio 975 1,145 1207 1,346 1,368 Puerto Rico Cidra Municipio 1,217 1,429 1506 1,679 1,706 Puerto Rico Coamo Municipio 980 1,151 1213 1,352 1,374 Puerto Rico Comerío Municipio 1,090 1,280 1349 1,504 1,528 Puerto Rico Corozal Municipio 1,043 1,225 1291 1,439 1,463 Puerto Rico Culebra Municipio 1,110 1,304 1374 1,532 1,557 Puerto Rico Dorado Municipio 1,428 1,677 1767 1,970 2,002 Puerto Rico Fajardo Municipio 1,111 1,305 1375 1,533 1,558 Puerto Rico Florida Municipio 1,053 1,237 1303 1,453 1,476 Puerto Rico Guánica Municipio 987 1,159 1221 1,361 1,383 Puerto Rico Guayama Municipio 1,080 1,269 1337 1,491 1,515 Puerto Rico Guayanilla Municipio 1,072 1,259 1327 1,480 1,503 Puerto Rico Guaynabo Municipio 1,956 2,298 2421 2,699 2,743 Puerto Rico Gurabo Municipio 1,314 1,543 1626 1,813 1,842 Puerto Rico Hatillo Municipio 1,080 1,269 1337 1,491 1,515 Puerto Rico Hormigueros Municipio 1,030 1,210 1275 1,422 1,445 Puerto Rico Humacao Municipio 1,129 1,326 1397 1,558 1,583 Puerto Rico Isabela Municipio 987 1,159 1221 1,361 1,383 Puerto Rico Jayuya Municipio 945 1,109 1169 1,303 1,324 Puerto Rico Juana Díaz Municipio 977 1,147 1209 1,348 1,370 Puerto Rico Juncos Municipio 1,172 1,376 1450 1,617 1,643 Puerto Rico Lajas Municipio 983 1,155 1217 1,357 1,379
Last
viewed
12/27
/16
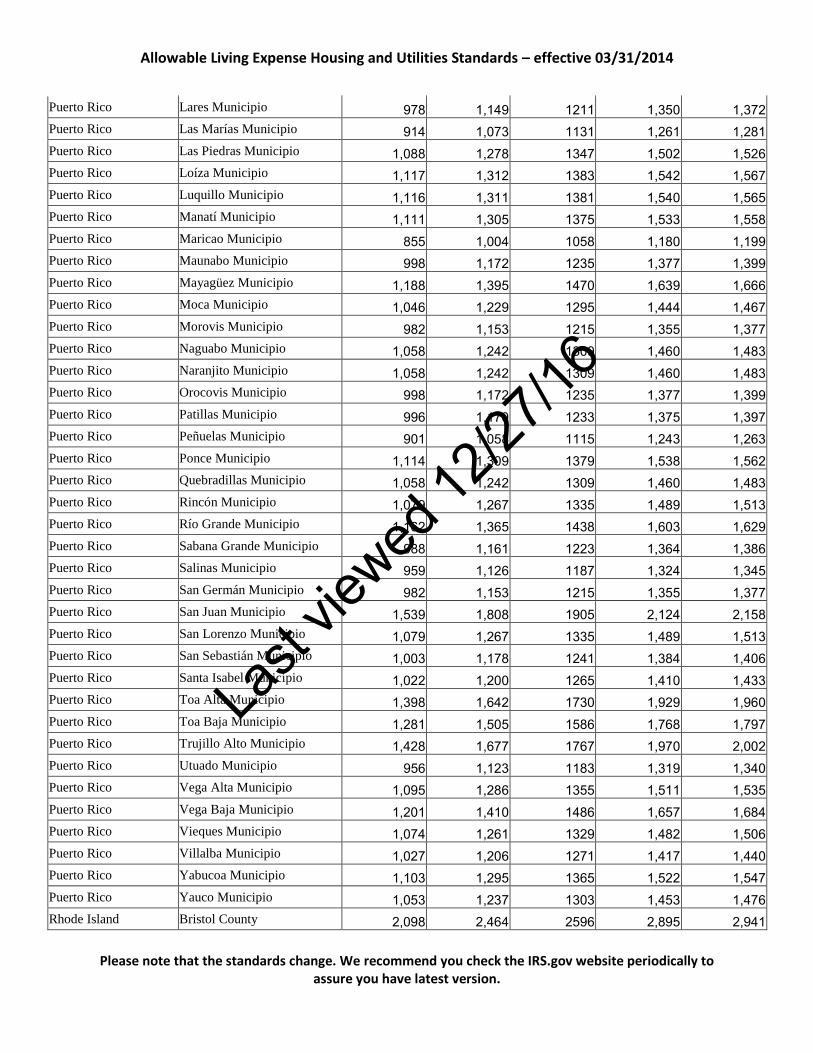
Allowable Living Expense Housing and Utilities Standards – effective 03/31/2014
Please note that the standards change. We recommend you check the IRS.gov website periodically to assure you have latest version.
Puerto Rico Lares Municipio 978 1,149 1211 1,350 1,372 Puerto Rico Las Marías Municipio 914 1,073 1131 1,261 1,281 Puerto Rico Las Piedras Municipio 1,088 1,278 1347 1,502 1,526 Puerto Rico Loíza Municipio 1,117 1,312 1383 1,542 1,567 Puerto Rico Luquillo Municipio 1,116 1,311 1381 1,540 1,565 Puerto Rico Manatí Municipio 1,111 1,305 1375 1,533 1,558 Puerto Rico Maricao Municipio 855 1,004 1058 1,180 1,199 Puerto Rico Maunabo Municipio 998 1,172 1235 1,377 1,399 Puerto Rico Mayagüez Municipio 1,188 1,395 1470 1,639 1,666 Puerto Rico Moca Municipio 1,046 1,229 1295 1,444 1,467 Puerto Rico Morovis Municipio 982 1,153 1215 1,355 1,377 Puerto Rico Naguabo Municipio 1,058 1,242 1309 1,460 1,483 Puerto Rico Naranjito Municipio 1,058 1,242 1309 1,460 1,483 Puerto Rico Orocovis Municipio 998 1,172 1235 1,377 1,399 Puerto Rico Patillas Municipio 996 1,170 1233 1,375 1,397 Puerto Rico Peñuelas Municipio 901 1,058 1115 1,243 1,263 Puerto Rico Ponce Municipio 1,114 1,309 1379 1,538 1,562 Puerto Rico Quebradillas Municipio 1,058 1,242 1309 1,460 1,483 Puerto Rico Rincón Municipio 1,079 1,267 1335 1,489 1,513 Puerto Rico Río Grande Municipio 1,162 1,365 1438 1,603 1,629 Puerto Rico Sabana Grande Municipio 988 1,161 1223 1,364 1,386 Puerto Rico Salinas Municipio 959 1,126 1187 1,324 1,345 Puerto Rico San Germán Municipio 982 1,153 1215 1,355 1,377 Puerto Rico San Juan Municipio 1,539 1,808 1905 2,124 2,158 Puerto Rico San Lorenzo Municipio 1,079 1,267 1335 1,489 1,513 Puerto Rico San Sebastián Municipio 1,003 1,178 1241 1,384 1,406 Puerto Rico Santa Isabel Municipio 1,022 1,200 1265 1,410 1,433 Puerto Rico Toa Alta Municipio 1,398 1,642 1730 1,929 1,960 Puerto Rico Toa Baja Municipio 1,281 1,505 1586 1,768 1,797 Puerto Rico Trujillo Alto Municipio 1,428 1,677 1767 1,970 2,002 Puerto Rico Utuado Municipio 956 1,123 1183 1,319 1,340 Puerto Rico Vega Alta Municipio 1,095 1,286 1355 1,511 1,535 Puerto Rico Vega Baja Municipio 1,201 1,410 1486 1,657 1,684 Puerto Rico Vieques Municipio 1,074 1,261 1329 1,482 1,506 Puerto Rico Villalba Municipio 1,027 1,206 1271 1,417 1,440 Puerto Rico Yabucoa Municipio 1,103 1,295 1365 1,522 1,547 Puerto Rico Yauco Municipio 1,053 1,237 1303 1,453 1,476 Rhode Island Bristol County 2,098 2,464 2596 2,895 2,941
Last
viewed
12/27
/16

Allowable Living Expense Housing and Utilities Standards – effective 03/31/2014
Please note that the standards change. We recommend you check the IRS.gov website periodically to assure you have latest version.
Rhode Island Kent County 1,782 2,093 2205 2,459 2,498 Rhode Island Newport County 1,967 2,310 2434 2,714 2,758 Rhode Island Providence County 1,762 2,069 2180 2,431 2,470 Rhode Island Washington County 1,909 2,242 2363 2,635 2,677 South Carolina Abbeville County 1,051 1,235 1301 1,451 1,474 South Carolina Aiken County 1,131 1,329 1400 1,561 1,586 South Carolina Allendale County 936 1,100 1159 1,292 1,313 South Carolina Anderson County 1,101 1,293 1363 1,520 1,544 South Carolina Bamberg County 998 1,172 1235 1,377 1,399 South Carolina Barnwell County 991 1,164 1227 1,368 1,390 South Carolina Beaufort County 1,665 1,955 2060 2,297 2,334 South Carolina Berkeley County 1,290 1,516 1597 1,781 1,809 South Carolina Calhoun County 1,091 1,281 1350 1,505 1,530 South Carolina Charleston County 1,617 1,899 2001 2,231 2,267 South Carolina Cherokee County 983 1,155 1217 1,357 1,379 South Carolina Chester County 978 1,148 1210 1,349 1,371 South Carolina Chesterfield County 950 1,116 1176 1,311 1,332 South Carolina Clarendon County 973 1,143 1204 1,342 1,364 South Carolina Colleton County 1,071 1,258 1326 1,478 1,502 South Carolina Darlington County 1,029 1,209 1274 1,421 1,443 South Carolina Dillon County 963 1,131 1192 1,329 1,351 South Carolina Dorchester County 1,416 1,663 1752 1,953 1,985 South Carolina Edgefield County 1,155 1,357 1430 1,594 1,620 South Carolina Fairfield County 1,073 1,260 1328 1,481 1,505 South Carolina Florence County 1,098 1,290 1359 1,515 1,540 South Carolina Georgetown County 1,320 1,551 1634 1,822 1,851 South Carolina Greenville County 1,254 1,473 1552 1,730 1,758 South Carolina Greenwood County 1,032 1,212 1277 1,424 1,447 South Carolina Hampton County 955 1,122 1182 1,318 1,339 South Carolina Horry County 1,288 1,513 1594 1,778 1,807 South Carolina Jasper County 1,048 1,231 1297 1,446 1,470 South Carolina Kershaw County 1,110 1,304 1374 1,532 1,557 South Carolina Lancaster County 1,172 1,376 1450 1,617 1,643 South Carolina Laurens County 999 1,173 1236 1,378 1,400 South Carolina Lee County 936 1,100 1159 1,292 1,313 South Carolina Lexington County 1,201 1,410 1486 1,657 1,684 South Carolina Marion County 938 1,102 1161 1,295 1,315 South Carolina Marlboro County 933 1,096 1155 1,288 1,309
Last
viewed
12/27
/16

Allowable Living Expense Housing and Utilities Standards – effective 03/31/2014
Please note that the standards change. We recommend you check the IRS.gov website periodically to assure you have latest version.
South Carolina McCormick County 1,089 1,279 1348 1,503 1,527 South Carolina Newberry County 1,084 1,273 1341 1,495 1,519 South Carolina Oconee County 1,130 1,327 1398 1,559 1,584 South Carolina Orangeburg County 1,037 1,219 1284 1,432 1,455 South Carolina Pickens County 1,100 1,292 1361 1,518 1,542 South Carolina Richland County 1,302 1,529 1611 1,796 1,825 South Carolina Saluda County 1,004 1,180 1243 1,386 1,408 South Carolina Spartanburg County 1,144 1,344 1416 1,579 1,604 South Carolina Sumter County 1,064 1,250 1317 1,468 1,492 South Carolina Union County 976 1,146 1208 1,347 1,369 South Carolina Williamsburg County 962 1,130 1191 1,328 1,349 South Carolina York County 1,324 1,554 1638 1,826 1,856 South Dakota Aurora County 884 1,038 1094 1,220 1,240 South Dakota Beadle County 1,060 1,245 1312 1,463 1,487 South Dakota Bennett County 951 1,117 1177 1,312 1,334 South Dakota Bon Homme County 900 1,057 1114 1,242 1,262 South Dakota Brookings County 1,197 1,405 1481 1,651 1,678 South Dakota Brown County 1,162 1,365 1438 1,603 1,629 South Dakota Brule County 1,138 1,336 1408 1,570 1,595 South Dakota Buffalo County 976 1,146 1208 1,347 1,369 South Dakota Butte County 1,142 1,341 1413 1,575 1,601 South Dakota Campbell County 1,182 1,388 1463 1,631 1,658 South Dakota Charles Mix County 987 1,160 1222 1,363 1,385 South Dakota Clark County 966 1,134 1195 1,332 1,354 South Dakota Clay County 1,236 1,452 1530 1,706 1,733 South Dakota Codington County 1,165 1,368 1442 1,608 1,634 South Dakota Corson County 981 1,152 1214 1,354 1,375 South Dakota Custer County 1,240 1,457 1535 1,712 1,739 South Dakota Davison County 1,172 1,376 1450 1,617 1,643 South Dakota Day County 977 1,147 1209 1,348 1,370 South Dakota Deuel County 1,089 1,279 1348 1,503 1,527 South Dakota Dewey County 970 1,139 1200 1,338 1,360 South Dakota Douglas County 1,014 1,191 1255 1,399 1,422 South Dakota Edmunds County 1,126 1,322 1393 1,553 1,578 South Dakota Fall River County 1,229 1,443 1521 1,696 1,723 South Dakota Faulk County 949 1,115 1175 1,310 1,331 South Dakota Grant County 1,250 1,468 1547 1,725 1,753 South Dakota Gregory County 959 1,126 1187 1,324 1,345
Last
viewed
12/27
/16

Allowable Living Expense Housing and Utilities Standards – effective 03/31/2014
Please note that the standards change. We recommend you check the IRS.gov website periodically to assure you have latest version.
South Dakota Haakon County 999 1,173 1236 1,378 1,400 South Dakota Hamlin County 1,130 1,328 1399 1,560 1,585 South Dakota Hand County 1,096 1,288 1357 1,513 1,537 South Dakota Hanson County 1,096 1,287 1356 1,512 1,536 South Dakota Harding County 1,141 1,340 1412 1,574 1,600 South Dakota Hughes County 1,281 1,504 1585 1,767 1,796 South Dakota Hutchinson County 1,010 1,186 1250 1,394 1,416 South Dakota Hyde County 944 1,108 1168 1,302 1,323 South Dakota Jackson County 1,088 1,278 1346 1,501 1,525 South Dakota Jerauld County 928 1,090 1149 1,281 1,302 South Dakota Jones County 941 1,106 1165 1,299 1,320 South Dakota Kingsbury County 987 1,160 1222 1,363 1,385 South Dakota Lake County 1,092 1,282 1351 1,506 1,531 South Dakota Lawrence County 1,319 1,549 1632 1,820 1,849 South Dakota Lincoln County 1,417 1,665 1754 1,956 1,987 South Dakota Lyman County 1,031 1,211 1276 1,423 1,446 South Dakota Marshall County 1,027 1,206 1271 1,417 1,440 South Dakota McCook County 1,079 1,267 1335 1,489 1,513 South Dakota McPherson County 1,014 1,191 1255 1,399 1,422 South Dakota Meade County 1,353 1,590 1675 1,868 1,898 South Dakota Mellette County 893 1,049 1105 1,232 1,252 South Dakota Miner County 1,022 1,200 1265 1,410 1,433 South Dakota Minnehaha County 1,260 1,479 1559 1,738 1,766 South Dakota Moody County 1,151 1,352 1425 1,589 1,615 South Dakota Pennington County 1,314 1,543 1626 1,813 1,842 South Dakota Perkins County 1,012 1,189 1253 1,397 1,420 South Dakota Potter County 963 1,131 1192 1,329 1,351 South Dakota Roberts County 1,026 1,205 1270 1,416 1,439 South Dakota Sanborn County 1,004 1,179 1242 1,385 1,407 South Dakota Shannon County 815 957 1008 1,124 1,143 South Dakota Spink County 939 1,103 1162 1,296 1,317 South Dakota Stanley County 1,176 1,382 1456 1,623 1,650 South Dakota Sully County 1,082 1,271 1339 1,493 1,517 South Dakota Todd County 720 846 891 993 1,010 South Dakota Tripp County 1,014 1,191 1255 1,399 1,422 South Dakota Turner County 1,125 1,321 1392 1,552 1,577 South Dakota Union County 1,250 1,468 1547 1,725 1,753 South Dakota Walworth County 1,040 1,222 1287 1,435 1,458
Last
viewed
12/27
/16
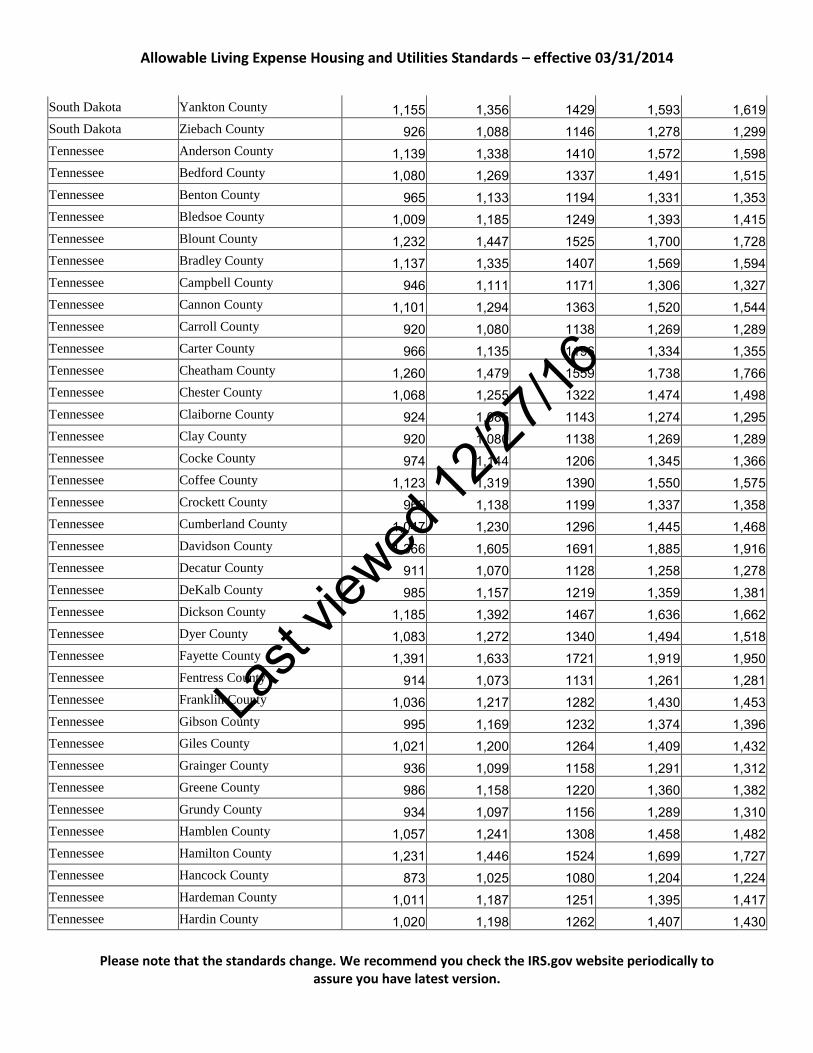
Allowable Living Expense Housing and Utilities Standards – effective 03/31/2014
Please note that the standards change. We recommend you check the IRS.gov website periodically to assure you have latest version.
South Dakota Yankton County 1,155 1,356 1429 1,593 1,619 South Dakota Ziebach County 926 1,088 1146 1,278 1,299 Tennessee Anderson County 1,139 1,338 1410 1,572 1,598 Tennessee Bedford County 1,080 1,269 1337 1,491 1,515 Tennessee Benton County 965 1,133 1194 1,331 1,353 Tennessee Bledsoe County 1,009 1,185 1249 1,393 1,415 Tennessee Blount County 1,232 1,447 1525 1,700 1,728 Tennessee Bradley County 1,137 1,335 1407 1,569 1,594 Tennessee Campbell County 946 1,111 1171 1,306 1,327 Tennessee Cannon County 1,101 1,294 1363 1,520 1,544 Tennessee Carroll County 920 1,080 1138 1,269 1,289 Tennessee Carter County 966 1,135 1196 1,334 1,355 Tennessee Cheatham County 1,260 1,479 1559 1,738 1,766 Tennessee Chester County 1,068 1,255 1322 1,474 1,498 Tennessee Claiborne County 924 1,085 1143 1,274 1,295 Tennessee Clay County 920 1,080 1138 1,269 1,289 Tennessee Cocke County 974 1,144 1206 1,345 1,366 Tennessee Coffee County 1,123 1,319 1390 1,550 1,575 Tennessee Crockett County 969 1,138 1199 1,337 1,358 Tennessee Cumberland County 1,047 1,230 1296 1,445 1,468 Tennessee Davidson County 1,366 1,605 1691 1,885 1,916 Tennessee Decatur County 911 1,070 1128 1,258 1,278 Tennessee DeKalb County 985 1,157 1219 1,359 1,381 Tennessee Dickson County 1,185 1,392 1467 1,636 1,662 Tennessee Dyer County 1,083 1,272 1340 1,494 1,518 Tennessee Fayette County 1,391 1,633 1721 1,919 1,950 Tennessee Fentress County 914 1,073 1131 1,261 1,281 Tennessee Franklin County 1,036 1,217 1282 1,430 1,453 Tennessee Gibson County 995 1,169 1232 1,374 1,396 Tennessee Giles County 1,021 1,200 1264 1,409 1,432 Tennessee Grainger County 936 1,099 1158 1,291 1,312 Tennessee Greene County 986 1,158 1220 1,360 1,382 Tennessee Grundy County 934 1,097 1156 1,289 1,310 Tennessee Hamblen County 1,057 1,241 1308 1,458 1,482 Tennessee Hamilton County 1,231 1,446 1524 1,699 1,727 Tennessee Hancock County 873 1,025 1080 1,204 1,224 Tennessee Hardeman County 1,011 1,187 1251 1,395 1,417 Tennessee Hardin County 1,020 1,198 1262 1,407 1,430
Last
viewed
12/27
/16

Allowable Living Expense Housing and Utilities Standards – effective 03/31/2014
Please note that the standards change. We recommend you check the IRS.gov website periodically to assure you have latest version.
Tennessee Hawkins County 991 1,164 1227 1,368 1,390 Tennessee Haywood County 1,079 1,267 1335 1,489 1,513 Tennessee Henderson County 984 1,156 1218 1,358 1,380 Tennessee Henry County 927 1,089 1147 1,279 1,300 Tennessee Hickman County 1,019 1,197 1261 1,406 1,429 Tennessee Houston County 1,008 1,184 1248 1,392 1,414 Tennessee Humphreys County 1,034 1,214 1279 1,426 1,449 Tennessee Jackson County 1,072 1,259 1327 1,480 1,503 Tennessee Jefferson County 1,041 1,222 1288 1,436 1,459 Tennessee Johnson County 951 1,117 1177 1,312 1,334 Tennessee Knox County 1,248 1,466 1545 1,723 1,750 Tennessee Lake County 943 1,107 1167 1,301 1,322 Tennessee Lauderdale County 990 1,163 1225 1,366 1,388 Tennessee Lawrence County 1,000 1,175 1238 1,380 1,403 Tennessee Lewis County 973 1,143 1204 1,342 1,364 Tennessee Lincoln County 1,084 1,273 1341 1,495 1,519 Tennessee Loudon County 1,210 1,421 1497 1,669 1,696 Tennessee Macon County 956 1,123 1183 1,319 1,340 Tennessee Madison County 1,159 1,362 1435 1,600 1,626 Tennessee Marion County 1,089 1,279 1348 1,503 1,527 Tennessee Marshall County 1,098 1,290 1359 1,515 1,540 Tennessee Maury County 1,189 1,397 1472 1,641 1,668 Tennessee McMinn County 1,033 1,213 1278 1,425 1,448 Tennessee McNairy County 948 1,113 1173 1,308 1,329 Tennessee Meigs County 1,046 1,229 1295 1,444 1,467 Tennessee Monroe County 1,035 1,216 1281 1,428 1,451 Tennessee Montgomery County 1,210 1,421 1497 1,669 1,696 Tennessee Moore County 1,049 1,232 1298 1,447 1,471 Tennessee Morgan County 980 1,151 1213 1,352 1,374 Tennessee Obion County 982 1,153 1215 1,355 1,377 Tennessee Overton County 951 1,116 1176 1,312 1,333 Tennessee Perry County 930 1,092 1151 1,283 1,304 Tennessee Pickett County 959 1,126 1187 1,324 1,345 Tennessee Polk County 1,054 1,238 1305 1,455 1,479 Tennessee Putnam County 1,102 1,294 1364 1,521 1,545 Tennessee Rhea County 1,009 1,185 1249 1,393 1,415 Tennessee Roane County 1,114 1,309 1379 1,538 1,562 Tennessee Robertson County 1,258 1,478 1557 1,736 1,764
Last
viewed
12/27
/16

Allowable Living Expense Housing and Utilities Standards – effective 03/31/2014
Please note that the standards change. We recommend you check the IRS.gov website periodically to assure you have latest version.
Tennessee Rutherford County 1,301 1,528 1610 1,795 1,824 Tennessee Scott County 873 1,026 1081 1,205 1,225 Tennessee Sequatchie County 1,040 1,222 1287 1,435 1,459 Tennessee Sevier County 1,180 1,386 1461 1,629 1,655 Tennessee Shelby County 1,391 1,633 1721 1,919 1,950 Tennessee Smith County 1,116 1,311 1381 1,540 1,565 Tennessee Stewart County 1,072 1,259 1327 1,480 1,503 Tennessee Sullivan County 1,043 1,225 1291 1,439 1,463 Tennessee Sumner County 1,381 1,622 1709 1,906 1,936 Tennessee Tipton County 1,261 1,481 1561 1,741 1,769 Tennessee Trousdale County 1,071 1,258 1326 1,478 1,502 Tennessee Unicoi County 1,014 1,191 1255 1,400 1,422 Tennessee Union County 960 1,127 1188 1,325 1,346 Tennessee Van Buren County 856 1,005 1059 1,181 1,200 Tennessee Warren County 959 1,126 1187 1,324 1,345 Tennessee Washington County 1,140 1,339 1411 1,573 1,599 Tennessee Wayne County 875 1,028 1083 1,208 1,227 Tennessee Weakley County 1,008 1,183 1247 1,390 1,413 Tennessee White County 964 1,132 1193 1,330 1,352 Tennessee Williamson County 1,850 2,173 2290 2,553 2,595 Tennessee Wilson County 1,409 1,655 1744 1,945 1,976 Texas Anderson County 1,111 1,305 1375 1,533 1,558 Texas Andrews County 1,138 1,336 1408 1,570 1,595 Texas Angelina County 1,077 1,265 1333 1,486 1,510 Texas Aransas County 1,438 1,689 1780 1,985 2,017 Texas Archer County 1,227 1,442 1519 1,694 1,721 Texas Armstrong County 1,034 1,215 1280 1,427 1,450 Texas Atascosa County 1,120 1,315 1386 1,545 1,570 Texas Austin County 1,354 1,591 1676 1,869 1,899 Texas Bailey County 1,121 1,316 1387 1,547 1,571 Texas Bandera County 1,269 1,490 1570 1,751 1,779 Texas Bastrop County 1,336 1,569 1653 1,843 1,873 Texas Baylor County 1,093 1,284 1353 1,509 1,533 Texas Bee County 1,064 1,250 1317 1,468 1,492 Texas Bell County 1,267 1,488 1568 1,748 1,777 Texas Bexar County 1,316 1,546 1629 1,816 1,846 Texas Blanco County 1,294 1,520 1602 1,786 1,815 Texas Borden County 892 1,048 1104 1,231 1,251
Last
viewed
12/27
/16

Allowable Living Expense Housing and Utilities Standards – effective 03/31/2014
Please note that the standards change. We recommend you check the IRS.gov website periodically to assure you have latest version.
Texas Bosque County 1,122 1,318 1389 1,549 1,574 Texas Bowie County 1,130 1,327 1398 1,559 1,584 Texas Brazoria County 1,618 1,900 2002 2,232 2,268 Texas Brazos County 1,399 1,643 1731 1,930 1,961 Texas Brewster County 1,176 1,382 1456 1,623 1,650 Texas Briscoe County 865 1,016 1071 1,194 1,213 Texas Brooks County 986 1,158 1220 1,360 1,382 Texas Brown County 1,098 1,290 1359 1,515 1,540 Texas Burleson County 1,050 1,234 1300 1,450 1,473 Texas Burnet County 1,330 1,562 1646 1,835 1,865 Texas Caldwell County 1,248 1,465 1544 1,722 1,749 Texas Calhoun County 1,200 1,409 1485 1,656 1,683 Texas Callahan County 1,094 1,285 1354 1,510 1,534 Texas Cameron County 1,123 1,319 1390 1,550 1,575 Texas Camp County 1,151 1,352 1425 1,589 1,615 Texas Carson County 1,067 1,254 1321 1,473 1,497 Texas Cass County 941 1,106 1165 1,299 1,320 Texas Castro County 970 1,140 1201 1,339 1,361 Texas Chambers County 1,537 1,805 1902 2,121 2,155 Texas Cherokee County 1,043 1,225 1291 1,439 1,463 Texas Childress County 861 1,011 1065 1,187 1,207 Texas Clay County 1,153 1,355 1427 1,592 1,617 Texas Cochran County 844 992 1045 1,165 1,184 Texas Coke County 999 1,173 1236 1,378 1,400 Texas Coleman County 961 1,128 1189 1,326 1,347 Texas Collin County 1,811 2,127 2241 2,499 2,539 Texas Collingsworth County 999 1,174 1237 1,379 1,402 Texas Colorado County 1,263 1,483 1563 1,743 1,771 Texas Comal County 1,509 1,772 1867 2,082 2,115 Texas Comanche County 1,012 1,189 1253 1,397 1,420 Texas Concho County 960 1,127 1188 1,325 1,346 Texas Cooke County 1,240 1,457 1535 1,712 1,739 Texas Coryell County 1,161 1,364 1437 1,602 1,628 Texas Cottle County 846 994 1047 1,167 1,186 Texas Crane County 935 1,098 1157 1,290 1,311 Texas Crockett County 1,054 1,238 1305 1,455 1,479 Texas Crosby County 924 1,086 1144 1,276 1,296 Texas Culberson County 1,004 1,179 1242 1,385 1,407
Last
viewed
12/27
/16
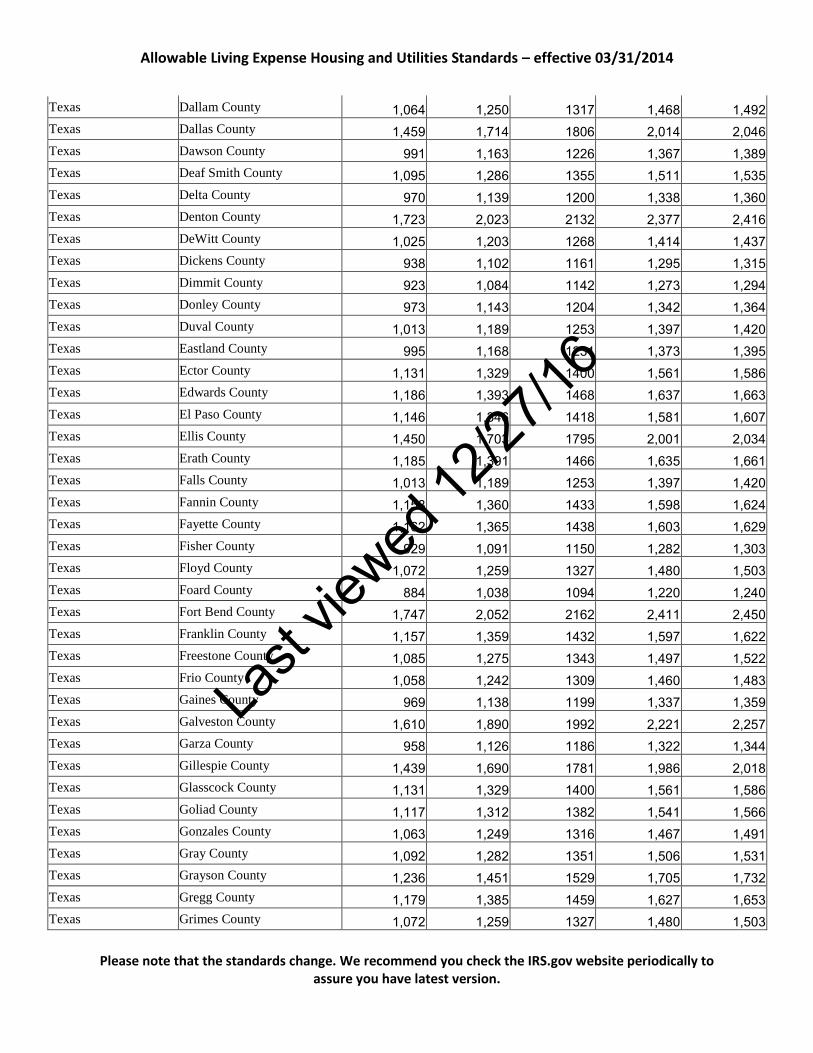
Allowable Living Expense Housing and Utilities Standards – effective 03/31/2014
Please note that the standards change. We recommend you check the IRS.gov website periodically to assure you have latest version.
Texas Dallam County 1,064 1,250 1317 1,468 1,492 Texas Dallas County 1,459 1,714 1806 2,014 2,046 Texas Dawson County 991 1,163 1226 1,367 1,389 Texas Deaf Smith County 1,095 1,286 1355 1,511 1,535 Texas Delta County 970 1,139 1200 1,338 1,360 Texas Denton County 1,723 2,023 2132 2,377 2,416 Texas DeWitt County 1,025 1,203 1268 1,414 1,437 Texas Dickens County 938 1,102 1161 1,295 1,315 Texas Dimmit County 923 1,084 1142 1,273 1,294 Texas Donley County 973 1,143 1204 1,342 1,364 Texas Duval County 1,013 1,189 1253 1,397 1,420 Texas Eastland County 995 1,168 1231 1,373 1,395 Texas Ector County 1,131 1,329 1400 1,561 1,586 Texas Edwards County 1,186 1,393 1468 1,637 1,663 Texas El Paso County 1,146 1,346 1418 1,581 1,607 Texas Ellis County 1,450 1,703 1795 2,001 2,034 Texas Erath County 1,185 1,391 1466 1,635 1,661 Texas Falls County 1,013 1,189 1253 1,397 1,420 Texas Fannin County 1,158 1,360 1433 1,598 1,624 Texas Fayette County 1,162 1,365 1438 1,603 1,629 Texas Fisher County 929 1,091 1150 1,282 1,303 Texas Floyd County 1,072 1,259 1327 1,480 1,503 Texas Foard County 884 1,038 1094 1,220 1,240 Texas Fort Bend County 1,747 2,052 2162 2,411 2,450 Texas Franklin County 1,157 1,359 1432 1,597 1,622 Texas Freestone County 1,085 1,275 1343 1,497 1,522 Texas Frio County 1,058 1,242 1309 1,460 1,483 Texas Gaines County 969 1,138 1199 1,337 1,359 Texas Galveston County 1,610 1,890 1992 2,221 2,257 Texas Garza County 958 1,126 1186 1,322 1,344 Texas Gillespie County 1,439 1,690 1781 1,986 2,018 Texas Glasscock County 1,131 1,329 1400 1,561 1,586 Texas Goliad County 1,117 1,312 1382 1,541 1,566 Texas Gonzales County 1,063 1,249 1316 1,467 1,491 Texas Gray County 1,092 1,282 1351 1,506 1,531 Texas Grayson County 1,236 1,451 1529 1,705 1,732 Texas Gregg County 1,179 1,385 1459 1,627 1,653 Texas Grimes County 1,072 1,259 1327 1,480 1,503
Last
viewed
12/27
/16
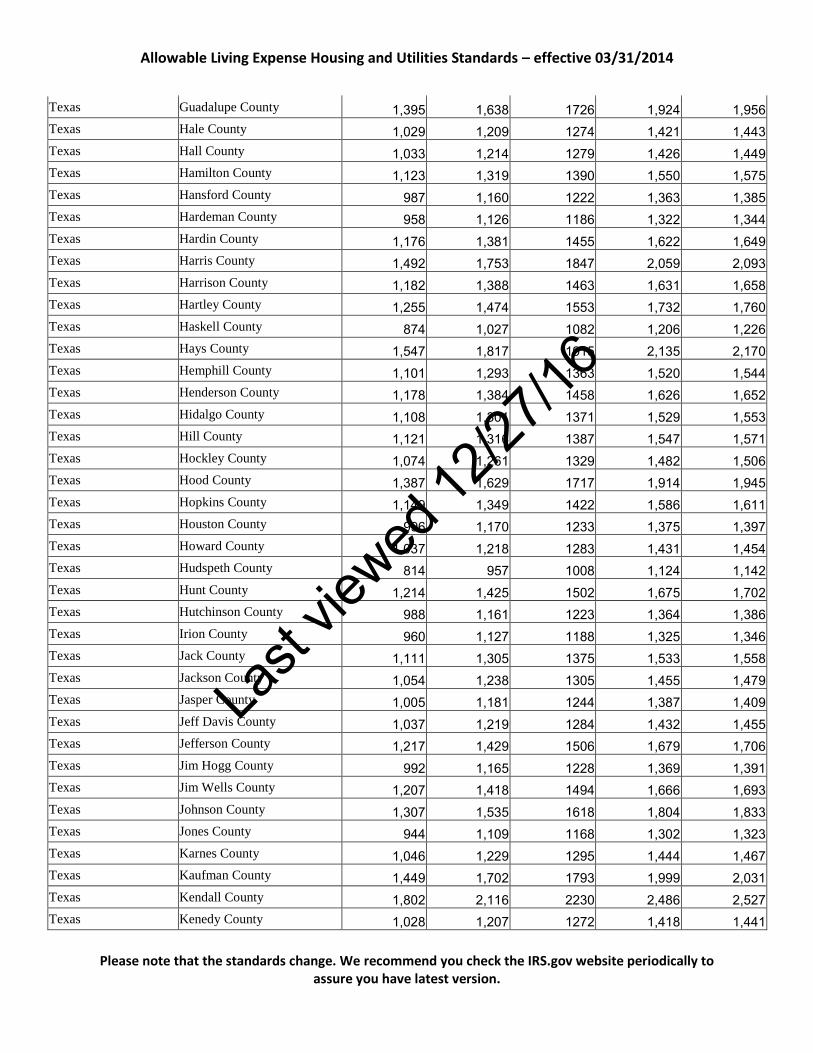
Allowable Living Expense Housing and Utilities Standards – effective 03/31/2014
Please note that the standards change. We recommend you check the IRS.gov website periodically to assure you have latest version.
Texas Guadalupe County 1,395 1,638 1726 1,924 1,956 Texas Hale County 1,029 1,209 1274 1,421 1,443 Texas Hall County 1,033 1,214 1279 1,426 1,449 Texas Hamilton County 1,123 1,319 1390 1,550 1,575 Texas Hansford County 987 1,160 1222 1,363 1,385 Texas Hardeman County 958 1,126 1186 1,322 1,344 Texas Hardin County 1,176 1,381 1455 1,622 1,649 Texas Harris County 1,492 1,753 1847 2,059 2,093 Texas Harrison County 1,182 1,388 1463 1,631 1,658 Texas Hartley County 1,255 1,474 1553 1,732 1,760 Texas Haskell County 874 1,027 1082 1,206 1,226 Texas Hays County 1,547 1,817 1915 2,135 2,170 Texas Hemphill County 1,101 1,293 1363 1,520 1,544 Texas Henderson County 1,178 1,384 1458 1,626 1,652 Texas Hidalgo County 1,108 1,301 1371 1,529 1,553 Texas Hill County 1,121 1,316 1387 1,547 1,571 Texas Hockley County 1,074 1,261 1329 1,482 1,506 Texas Hood County 1,387 1,629 1717 1,914 1,945 Texas Hopkins County 1,149 1,349 1422 1,586 1,611 Texas Houston County 996 1,170 1233 1,375 1,397 Texas Howard County 1,037 1,218 1283 1,431 1,454 Texas Hudspeth County 814 957 1008 1,124 1,142 Texas Hunt County 1,214 1,425 1502 1,675 1,702 Texas Hutchinson County 988 1,161 1223 1,364 1,386 Texas Irion County 960 1,127 1188 1,325 1,346 Texas Jack County 1,111 1,305 1375 1,533 1,558 Texas Jackson County 1,054 1,238 1305 1,455 1,479 Texas Jasper County 1,005 1,181 1244 1,387 1,409 Texas Jeff Davis County 1,037 1,219 1284 1,432 1,455 Texas Jefferson County 1,217 1,429 1506 1,679 1,706 Texas Jim Hogg County 992 1,165 1228 1,369 1,391 Texas Jim Wells County 1,207 1,418 1494 1,666 1,693 Texas Johnson County 1,307 1,535 1618 1,804 1,833 Texas Jones County 944 1,109 1168 1,302 1,323 Texas Karnes County 1,046 1,229 1295 1,444 1,467 Texas Kaufman County 1,449 1,702 1793 1,999 2,031 Texas Kendall County 1,802 2,116 2230 2,486 2,527 Texas Kenedy County 1,028 1,207 1272 1,418 1,441
Last
viewed
12/27
/16

Allowable Living Expense Housing and Utilities Standards – effective 03/31/2014
Please note that the standards change. We recommend you check the IRS.gov website periodically to assure you have latest version.
Texas Kent County 928 1,090 1149 1,281 1,302 Texas Kerr County 1,232 1,447 1525 1,700 1,728 Texas Kimble County 1,174 1,379 1453 1,620 1,646 Texas King County 1,215 1,427 1504 1,677 1,704 Texas Kinney County 920 1,081 1139 1,270 1,290 Texas Kleberg County 1,189 1,397 1472 1,641 1,668 Texas Knox County 896 1,052 1109 1,237 1,256 Texas La Salle County 1,096 1,288 1357 1,513 1,537 Texas Lamar County 1,073 1,260 1328 1,481 1,505 Texas Lamb County 1,003 1,178 1241 1,384 1,406 Texas Lampasas County 1,248 1,466 1545 1,723 1,750 Texas Lavaca County 983 1,154 1216 1,356 1,378 Texas Lee County 1,221 1,434 1511 1,685 1,712 Texas Leon County 1,151 1,352 1425 1,589 1,615 Texas Liberty County 1,163 1,366 1439 1,604 1,630 Texas Limestone County 1,029 1,208 1273 1,419 1,442 Texas Lipscomb County 986 1,158 1220 1,360 1,382 Texas Live Oak County 1,105 1,298 1367 1,525 1,549 Texas Llano County 1,234 1,449 1527 1,703 1,730 Texas Loving County 1,629 1,913 2016 2,248 2,284 Texas Lubbock County 1,194 1,403 1478 1,648 1,675 Texas Lynn County 1,084 1,274 1342 1,496 1,520 Texas Madison County 1,156 1,358 1431 1,596 1,621 Texas Marion County 971 1,141 1202 1,340 1,362 Texas Martin County 1,037 1,218 1283 1,431 1,454 Texas Mason County 1,116 1,311 1381 1,540 1,565 Texas Matagorda County 1,165 1,368 1442 1,608 1,634 Texas Maverick County 1,096 1,288 1357 1,513 1,537 Texas McCulloch County 997 1,171 1234 1,376 1,398 Texas McLennan County 1,233 1,448 1526 1,701 1,729 Texas McMullen County 891 1,047 1103 1,230 1,250 Texas Medina County 1,228 1,442 1520 1,695 1,722 Texas Menard County 848 996 1050 1,171 1,190 Texas Midland County 1,303 1,530 1612 1,797 1,826 Texas Milam County 1,133 1,330 1402 1,563 1,588 Texas Mills County 1,009 1,185 1249 1,393 1,415 Texas Mitchell County 987 1,160 1222 1,363 1,385 Texas Montague County 1,116 1,311 1381 1,540 1,565
Last
viewed
12/27
/16
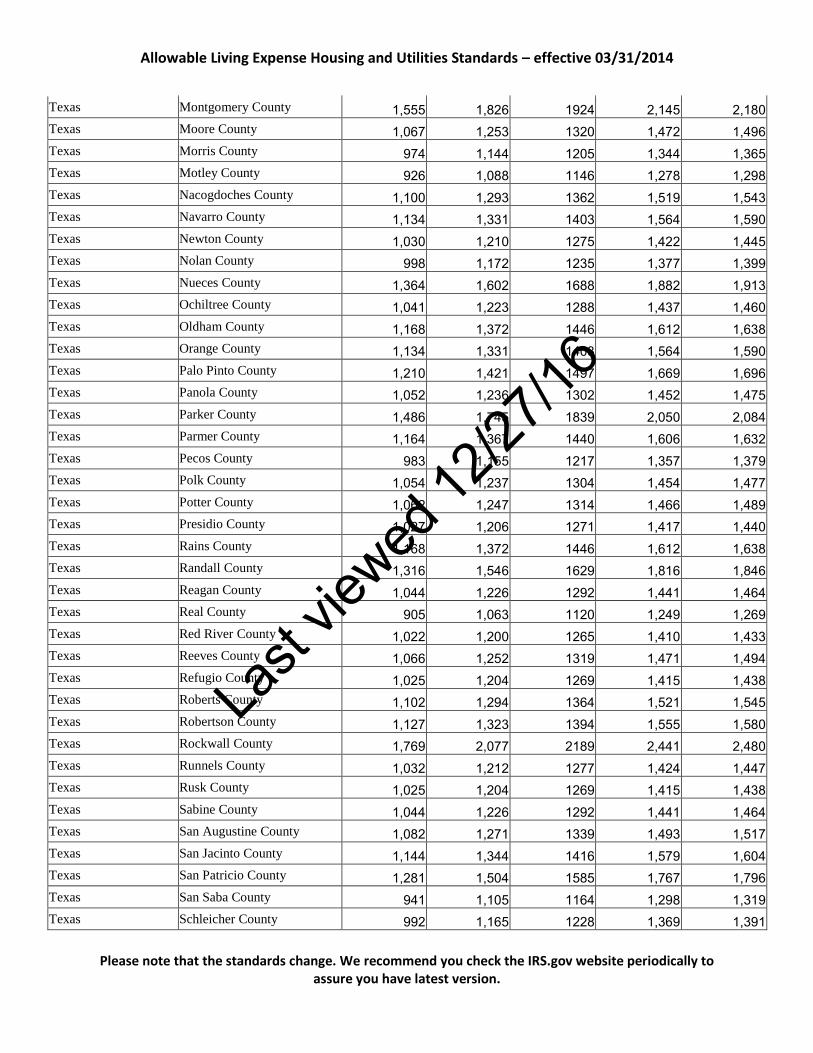
Allowable Living Expense Housing and Utilities Standards – effective 03/31/2014
Please note that the standards change. We recommend you check the IRS.gov website periodically to assure you have latest version.
Texas Montgomery County 1,555 1,826 1924 2,145 2,180 Texas Moore County 1,067 1,253 1320 1,472 1,496 Texas Morris County 974 1,144 1205 1,344 1,365 Texas Motley County 926 1,088 1146 1,278 1,298 Texas Nacogdoches County 1,100 1,293 1362 1,519 1,543 Texas Navarro County 1,134 1,331 1403 1,564 1,590 Texas Newton County 1,030 1,210 1275 1,422 1,445 Texas Nolan County 998 1,172 1235 1,377 1,399 Texas Nueces County 1,364 1,602 1688 1,882 1,913 Texas Ochiltree County 1,041 1,223 1288 1,437 1,460 Texas Oldham County 1,168 1,372 1446 1,612 1,638 Texas Orange County 1,134 1,331 1403 1,564 1,590 Texas Palo Pinto County 1,210 1,421 1497 1,669 1,696 Texas Panola County 1,052 1,236 1302 1,452 1,475 Texas Parker County 1,486 1,745 1839 2,050 2,084 Texas Parmer County 1,164 1,367 1440 1,606 1,632 Texas Pecos County 983 1,155 1217 1,357 1,379 Texas Polk County 1,054 1,237 1304 1,454 1,477 Texas Potter County 1,062 1,247 1314 1,466 1,489 Texas Presidio County 1,027 1,206 1271 1,417 1,440 Texas Rains County 1,168 1,372 1446 1,612 1,638 Texas Randall County 1,316 1,546 1629 1,816 1,846 Texas Reagan County 1,044 1,226 1292 1,441 1,464 Texas Real County 905 1,063 1120 1,249 1,269 Texas Red River County 1,022 1,200 1265 1,410 1,433 Texas Reeves County 1,066 1,252 1319 1,471 1,494 Texas Refugio County 1,025 1,204 1269 1,415 1,438 Texas Roberts County 1,102 1,294 1364 1,521 1,545 Texas Robertson County 1,127 1,323 1394 1,555 1,580 Texas Rockwall County 1,769 2,077 2189 2,441 2,480 Texas Runnels County 1,032 1,212 1277 1,424 1,447 Texas Rusk County 1,025 1,204 1269 1,415 1,438 Texas Sabine County 1,044 1,226 1292 1,441 1,464 Texas San Augustine County 1,082 1,271 1339 1,493 1,517 Texas San Jacinto County 1,144 1,344 1416 1,579 1,604 Texas San Patricio County 1,281 1,504 1585 1,767 1,796 Texas San Saba County 941 1,105 1164 1,298 1,319 Texas Schleicher County 992 1,165 1228 1,369 1,391
Last
viewed
12/27
/16

Allowable Living Expense Housing and Utilities Standards – effective 03/31/2014
Please note that the standards change. We recommend you check the IRS.gov website periodically to assure you have latest version.
Texas Scurry County 1,150 1,350 1423 1,587 1,612 Texas Shackelford County 1,107 1,300 1370 1,528 1,553 Texas Shelby County 963 1,131 1192 1,329 1,351 Texas Sherman County 1,126 1,323 1394 1,554 1,579 Texas Smith County 1,251 1,469 1548 1,726 1,754 Texas Somervell County 1,360 1,597 1683 1,877 1,907 Texas Starr County 1,030 1,210 1275 1,422 1,445 Texas Stephens County 1,018 1,196 1260 1,405 1,428 Texas Sterling County 919 1,079 1137 1,268 1,288 Texas Stonewall County 832 977 1030 1,148 1,167 Texas Sutton County 1,176 1,382 1456 1,623 1,650 Texas Swisher County 1,026 1,205 1270 1,416 1,439 Texas Tarrant County 1,488 1,747 1841 2,053 2,086 Texas Taylor County 1,143 1,342 1414 1,577 1,602 Texas Terrell County 920 1,081 1139 1,270 1,290 Texas Terry County 1,012 1,188 1252 1,396 1,419 Texas Throckmorton County 946 1,110 1170 1,305 1,326 Texas Titus County 1,079 1,267 1335 1,489 1,513 Texas Tom Green County 1,128 1,325 1396 1,557 1,582 Texas Travis County 1,676 1,968 2074 2,313 2,350 Texas Trinity County 1,025 1,204 1269 1,415 1,438 Texas Tyler County 949 1,114 1174 1,309 1,330 Texas Upshur County 1,055 1,239 1306 1,456 1,480 Texas Upton County 900 1,057 1114 1,242 1,262 Texas Uvalde County 998 1,172 1235 1,377 1,399 Texas Val Verde County 1,127 1,324 1395 1,555 1,581 Texas Van Zandt County 1,130 1,327 1398 1,559 1,584 Texas Victoria County 1,223 1,436 1513 1,687 1,714 Texas Walker County 1,177 1,383 1457 1,625 1,651 Texas Waller County 1,408 1,653 1742 1,942 1,974 Texas Ward County 980 1,151 1213 1,352 1,374 Texas Washington County 1,315 1,545 1628 1,815 1,845 Texas Webb County 1,326 1,557 1641 1,830 1,859 Texas Wharton County 1,179 1,385 1459 1,627 1,653 Texas Wheeler County 1,043 1,225 1291 1,439 1,463 Texas Wichita County 1,152 1,353 1426 1,590 1,616 Texas Wilbarger County 978 1,148 1210 1,349 1,371 Texas Willacy County 1,021 1,200 1264 1,409 1,432
Last
viewed
12/27
/16

Allowable Living Expense Housing and Utilities Standards – effective 03/31/2014
Please note that the standards change. We recommend you check the IRS.gov website periodically to assure you have latest version.
Texas Williamson County 1,593 1,870 1971 2,198 2,233 Texas Wilson County 1,345 1,579 1664 1,855 1,885 Texas Winkler County 925 1,087 1145 1,277 1,297 Texas Wise County 1,309 1,537 1620 1,806 1,835 Texas Wood County 1,134 1,331 1403 1,564 1,590 Texas Yoakum County 936 1,100 1159 1,292 1,313 Texas Young County 1,065 1,251 1318 1,470 1,493 Texas Zapata County 934 1,097 1156 1,289 1,310 Texas Zavala County 924 1,085 1143 1,274 1,295 Utah Beaver County 1,086 1,275 1344 1,499 1,523 Utah Box Elder County 1,225 1,439 1516 1,690 1,718 Utah Cache County 1,277 1,500 1581 1,763 1,791 Utah Carbon County 1,098 1,290 1359 1,516 1,540 Utah Daggett County 1,125 1,321 1392 1,552 1,577 Utah Davis County 1,500 1,761 1856 2,069 2,103 Utah Duchesne County 1,201 1,411 1487 1,658 1,685 Utah Emery County 994 1,167 1230 1,371 1,394 Utah Garfield County 1,039 1,220 1286 1,434 1,457 Utah Grand County 1,173 1,378 1452 1,619 1,645 Utah Iron County 1,266 1,487 1567 1,747 1,775 Utah Juab County 1,192 1,400 1475 1,645 1,671 Utah Kane County 1,108 1,301 1371 1,529 1,553 Utah Millard County 1,047 1,230 1296 1,445 1,468 Utah Morgan County 1,588 1,865 1965 2,191 2,226 Utah Piute County 1,009 1,185 1249 1,393 1,415 Utah Rich County 1,224 1,438 1515 1,689 1,716 Utah Salt Lake County 1,509 1,773 1868 2,083 2,116 Utah San Juan County 1,040 1,221 1287 1,435 1,458 Utah Sanpete County 1,172 1,376 1450 1,617 1,643 Utah Sevier County 1,082 1,270 1338 1,492 1,517 Utah Summit County 2,014 2,366 2493 2,780 2,825 Utah Tooele County 1,359 1,596 1682 1,876 1,906 Utah Uintah County 1,362 1,600 1686 1,880 1,910 Utah Utah County 1,501 1,763 1858 2,072 2,105 Utah Wasatch County 1,717 2,017 2125 2,369 2,408 Utah Washington County 1,497 1,758 1852 2,066 2,099 Utah Wayne County 1,150 1,350 1423 1,587 1,612 Utah Weber County 1,315 1,545 1628 1,815 1,845
Last
viewed
12/27
/16

Allowable Living Expense Housing and Utilities Standards – effective 03/31/2014
Please note that the standards change. We recommend you check the IRS.gov website periodically to assure you have latest version.
Vermont Addison County 1,513 1,777 1872 2,087 2,121 Vermont Bennington County 1,399 1,643 1731 1,930 1,961 Vermont Caledonia County 1,260 1,480 1560 1,739 1,767 Vermont Chittenden County 1,744 2,048 2158 2,406 2,445 Vermont Essex County 1,071 1,258 1326 1,478 1,502 Vermont Franklin County 1,481 1,740 1833 2,044 2,077 Vermont Grand Isle County 1,641 1,928 2031 2,265 2,301 Vermont Lamoille County 1,429 1,679 1769 1,972 2,004 Vermont Orange County 1,329 1,561 1645 1,834 1,864 Vermont Orleans County 1,226 1,440 1517 1,691 1,719 Vermont Rutland County 1,393 1,636 1723 1,922 1,953 Vermont Washington County 1,492 1,752 1846 2,058 2,092 Vermont Windham County 1,450 1,703 1795 2,001 2,034 Vermont Windsor County 1,514 1,778 1874 2,090 2,123 Virginia Accomack County 1,155 1,357 1430 1,594 1,620 Virginia Albemarle County 1,724 2,025 2134 2,379 2,418 Virginia Alexandria city 2,325 2,731 2878 3,209 3,261 Virginia Alleghany County 1,054 1,237 1304 1,454 1,477 Virginia Amelia County 1,315 1,544 1627 1,814 1,843 Virginia Amherst County 1,119 1,314 1385 1,544 1,569 Virginia Appomattox County 1,147 1,348 1420 1,583 1,609 Virginia Arlington County 2,481 2,913 3070 3,423 3,478 Virginia Augusta County 1,302 1,529 1611 1,796 1,825 Virginia Bath County 1,053 1,237 1303 1,453 1,476 Virginia Bedford city 1,170 1,374 1448 1,615 1,641 Virginia Bedford County 1,289 1,514 1595 1,778 1,807 Virginia Bland County 971 1,141 1202 1,340 1,362 Virginia Botetourt County 1,382 1,623 1710 1,907 1,937 Virginia Bristol city 1,004 1,179 1242 1,385 1,407 Virginia Brunswick County 1,040 1,221 1287 1,435 1,458 Virginia Buchanan County 906 1,064 1121 1,250 1,270 Virginia Buckingham County 1,082 1,271 1339 1,493 1,517 Virginia Buena Vista city 1,172 1,376 1450 1,617 1,643 Virginia Campbell County 1,140 1,339 1411 1,573 1,599 Virginia Caroline County 1,515 1,779 1875 2,091 2,124 Virginia Carroll County 962 1,130 1191 1,328 1,349 Virginia Charles City County 1,144 1,344 1416 1,579 1,604 Virginia Charlotte County 1,039 1,220 1286 1,434 1,457
Last
viewed
12/27
/16

Allowable Living Expense Housing and Utilities Standards – effective 03/31/2014
Please note that the standards change. We recommend you check the IRS.gov website periodically to assure you have latest version.
Virginia Charlottesville city 1,607 1,888 1989 2,218 2,254 Virginia Chesapeake city 1,788 2,100 2213 2,467 2,507 Virginia Chesterfield County 1,608 1,889 1990 2,219 2,255 Virginia Clarke County 1,858 2,183 2300 2,565 2,606 Virginia Colonial Heights city 1,401 1,645 1733 1,933 1,964 Virginia Covington city 1,022 1,200 1265 1,410 1,433 Virginia Craig County 1,160 1,363 1436 1,601 1,627 Virginia Culpeper County 1,812 2,128 2242 2,500 2,540 Virginia Cumberland County 1,201 1,411 1487 1,658 1,685 Virginia Danville city 1,029 1,208 1273 1,419 1,442 Virginia Dickenson County 932 1,095 1154 1,287 1,307 Virginia Dinwiddie County 1,353 1,589 1674 1,867 1,897 Virginia Emporia city 1,214 1,425 1502 1,675 1,702 Virginia Essex County 1,276 1,498 1579 1,761 1,789 Virginia Fairfax city 2,228 2,617 2758 3,075 3,125 Virginia Fairfax County 2,394 2,811 2962 3,303 3,356 Virginia Falls Church city 2,787 3,274 3449 3,846 3,908 Virginia Fauquier County 2,108 2,476 2609 2,910 2,956 Virginia Floyd County 1,192 1,400 1475 1,645 1,671 Virginia Fluvanna County 1,437 1,687 1778 1,982 2,014 Virginia Franklin city 1,484 1,743 1837 2,048 2,082 Virginia Franklin County 1,178 1,384 1458 1,626 1,652 Virginia Frederick County 1,587 1,864 1964 2,190 2,225 Virginia Fredericksburg city 1,901 2,233 2353 2,624 2,666 Virginia Galax city 944 1,108 1168 1,302 1,323 Virginia Giles County 1,034 1,215 1280 1,427 1,450 Virginia Gloucester County 1,434 1,684 1775 1,979 2,011 Virginia Goochland County 1,818 2,135 2250 2,509 2,549 Virginia Grayson County 955 1,122 1182 1,318 1,339 Virginia Greene County 1,475 1,733 1826 2,036 2,069 Virginia Greensville County 1,083 1,272 1340 1,494 1,519 Virginia Halifax County 1,027 1,206 1271 1,417 1,440 Virginia Hampton city 1,492 1,753 1847 2,059 2,093 Virginia Hanover County 1,686 1,981 2087 2,327 2,365 Virginia Harrisonburg city 1,283 1,507 1588 1,771 1,799 Virginia Henrico County 1,571 1,845 1944 2,168 2,203 Virginia Henry County 947 1,112 1172 1,307 1,328 Virginia Highland County 1,134 1,331 1403 1,564 1,590
Last
viewed
12/27
/16
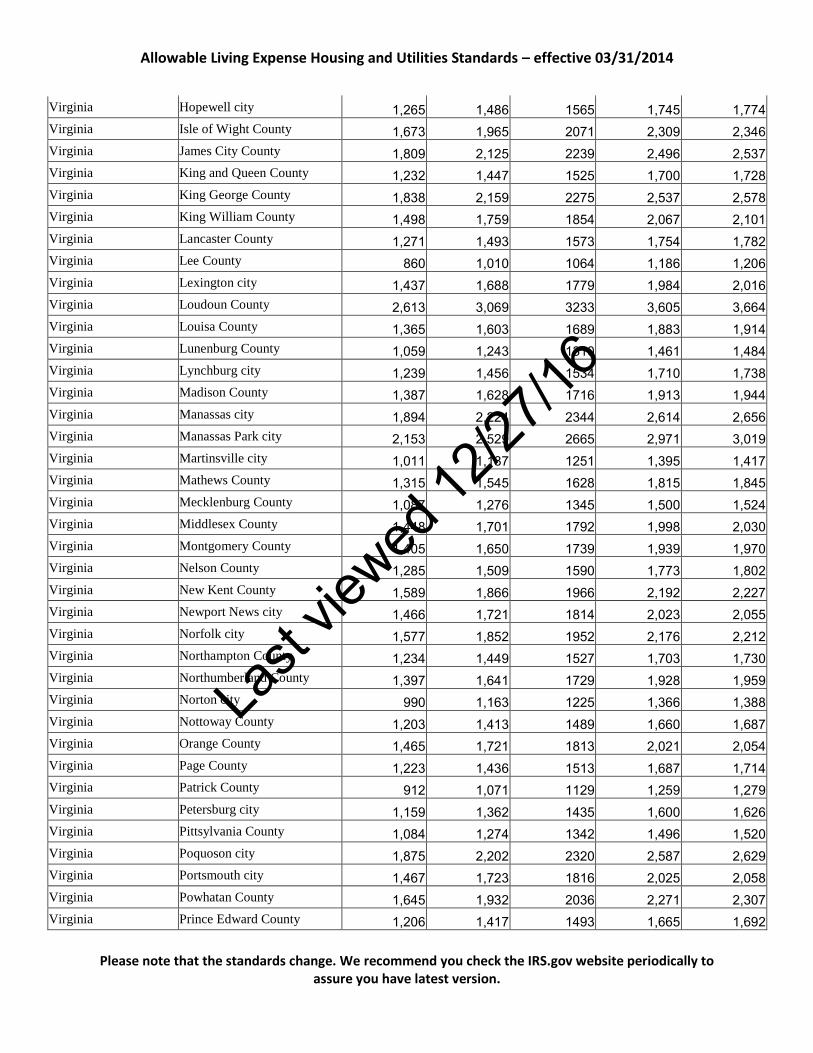
Allowable Living Expense Housing and Utilities Standards – effective 03/31/2014
Please note that the standards change. We recommend you check the IRS.gov website periodically to assure you have latest version.
Virginia Hopewell city 1,265 1,486 1565 1,745 1,774 Virginia Isle of Wight County 1,673 1,965 2071 2,309 2,346 Virginia James City County 1,809 2,125 2239 2,496 2,537 Virginia King and Queen County 1,232 1,447 1525 1,700 1,728 Virginia King George County 1,838 2,159 2275 2,537 2,578 Virginia King William County 1,498 1,759 1854 2,067 2,101 Virginia Lancaster County 1,271 1,493 1573 1,754 1,782 Virginia Lee County 860 1,010 1064 1,186 1,206 Virginia Lexington city 1,437 1,688 1779 1,984 2,016 Virginia Loudoun County 2,613 3,069 3233 3,605 3,664 Virginia Louisa County 1,365 1,603 1689 1,883 1,914 Virginia Lunenburg County 1,059 1,243 1310 1,461 1,484 Virginia Lynchburg city 1,239 1,456 1534 1,710 1,738 Virginia Madison County 1,387 1,628 1716 1,913 1,944 Virginia Manassas city 1,894 2,224 2344 2,614 2,656 Virginia Manassas Park city 2,153 2,529 2665 2,971 3,019 Virginia Martinsville city 1,011 1,187 1251 1,395 1,417 Virginia Mathews County 1,315 1,545 1628 1,815 1,845 Virginia Mecklenburg County 1,087 1,276 1345 1,500 1,524 Virginia Middlesex County 1,448 1,701 1792 1,998 2,030 Virginia Montgomery County 1,405 1,650 1739 1,939 1,970 Virginia Nelson County 1,285 1,509 1590 1,773 1,802 Virginia New Kent County 1,589 1,866 1966 2,192 2,227 Virginia Newport News city 1,466 1,721 1814 2,023 2,055 Virginia Norfolk city 1,577 1,852 1952 2,176 2,212 Virginia Northampton County 1,234 1,449 1527 1,703 1,730 Virginia Northumberland County 1,397 1,641 1729 1,928 1,959 Virginia Norton city 990 1,163 1225 1,366 1,388 Virginia Nottoway County 1,203 1,413 1489 1,660 1,687 Virginia Orange County 1,465 1,721 1813 2,021 2,054 Virginia Page County 1,223 1,436 1513 1,687 1,714 Virginia Patrick County 912 1,071 1129 1,259 1,279 Virginia Petersburg city 1,159 1,362 1435 1,600 1,626 Virginia Pittsylvania County 1,084 1,274 1342 1,496 1,520 Virginia Poquoson city 1,875 2,202 2320 2,587 2,629 Virginia Portsmouth city 1,467 1,723 1816 2,025 2,058 Virginia Powhatan County 1,645 1,932 2036 2,271 2,307 Virginia Prince Edward County 1,206 1,417 1493 1,665 1,692
Last
viewed
12/27
/16

Allowable Living Expense Housing and Utilities Standards – effective 03/31/2014
Please note that the standards change. We recommend you check the IRS.gov website periodically to assure you have latest version.
Virginia Prince George County 1,479 1,738 1831 2,042 2,075 Virginia Prince William County 2,229 2,618 2759 3,076 3,126 Virginia Pulaski County 1,094 1,285 1354 1,510 1,534 Virginia Radford city 1,173 1,378 1452 1,619 1,645 Virginia Rappahannock County 1,862 2,187 2305 2,570 2,612 Virginia Richmond city 1,510 1,773 1868 2,083 2,117 Virginia Richmond County 1,281 1,504 1585 1,767 1,796 Virginia Roanoke city 1,180 1,386 1461 1,629 1,655 Virginia Roanoke County 1,395 1,638 1726 1,924 1,956 Virginia Rockbridge County 1,269 1,491 1571 1,752 1,780 Virginia Rockingham County 1,298 1,524 1606 1,791 1,820 Virginia Russell County 887 1,042 1098 1,224 1,244 Virginia Salem city 1,351 1,587 1672 1,864 1,894 Virginia Scott County 915 1,075 1133 1,263 1,284 Virginia Shenandoah County 1,379 1,620 1707 1,903 1,934 Virginia Smyth County 907 1,065 1122 1,251 1,271 Virginia Southampton County 1,252 1,471 1550 1,728 1,756 Virginia Spotsylvania County 1,803 2,118 2231 2,488 2,528 Virginia Stafford County 2,098 2,464 2596 2,895 2,941 Virginia Staunton city 1,232 1,447 1525 1,700 1,728 Virginia Suffolk city 1,788 2,100 2213 2,467 2,507 Virginia Surry County 1,313 1,542 1625 1,812 1,841 Virginia Sussex County 1,180 1,386 1461 1,629 1,655 Virginia Tazewell County 986 1,158 1220 1,360 1,382 Virginia Virginia Beach city 1,742 2,046 2156 2,404 2,443 Virginia Warren County 1,575 1,850 1949 2,173 2,208 Virginia Washington County 1,144 1,344 1416 1,579 1,604 Virginia Waynesboro city 1,248 1,465 1544 1,722 1,749 Virginia Westmoreland County 1,326 1,557 1641 1,830 1,859 Virginia Williamsburg city 1,565 1,838 1937 2,160 2,195 Virginia Winchester city 1,676 1,968 2074 2,313 2,350 Virginia Wise County 940 1,104 1163 1,297 1,318 Virginia Wythe County 977 1,147 1209 1,348 1,370 Virginia York County 1,774 2,083 2195 2,447 2,487 Washington Adams County 1,179 1,385 1459 1,627 1,653 Washington Asotin County 1,231 1,446 1523 1,699 1,726 Washington Benton County 1,370 1,610 1696 1,891 1,922 Washington Chelan County 1,399 1,643 1731 1,930 1,961
Last
viewed
12/27
/16

Allowable Living Expense Housing and Utilities Standards – effective 03/31/2014
Please note that the standards change. We recommend you check the IRS.gov website periodically to assure you have latest version.
Washington Clallam County 1,357 1,593 1679 1,872 1,902 Washington Clark County 1,670 1,962 2067 2,305 2,342 Washington Columbia County 1,192 1,400 1475 1,645 1,671 Washington Cowlitz County 1,393 1,636 1724 1,922 1,953 Washington Douglas County 1,408 1,653 1742 1,942 1,974 Washington Ferry County 1,033 1,214 1279 1,426 1,449 Washington Franklin County 1,277 1,499 1580 1,762 1,790 Washington Garfield County 1,038 1,219 1285 1,433 1,456 Washington Grant County 1,180 1,386 1461 1,629 1,655 Washington Grays Harbor County 1,262 1,482 1562 1,742 1,770 Washington Island County 1,691 1,986 2092 2,333 2,371 Washington Jefferson County 1,519 1,784 1879 2,096 2,129 Washington King County 2,106 2,474 2607 2,907 2,954 Washington Kitsap County 1,698 1,995 2102 2,344 2,382 Washington Kittitas County 1,592 1,870 1970 2,197 2,232 Washington Klickitat County 1,234 1,449 1527 1,703 1,730 Washington Lewis County 1,307 1,535 1618 1,804 1,833 Washington Lincoln County 1,174 1,379 1453 1,620 1,646 Washington Mason County 1,379 1,620 1707 1,903 1,934 Washington Okanogan County 1,105 1,298 1368 1,525 1,550 Washington Pacific County 1,139 1,338 1410 1,572 1,598 Washington Pend Oreille County 1,120 1,316 1386 1,546 1,571 Washington Pierce County 1,762 2,070 2181 2,432 2,471 Washington San Juan County 1,774 2,083 2195 2,447 2,487 Washington Skagit County 1,666 1,957 2062 2,299 2,337 Washington Skamania County 1,465 1,721 1813 2,021 2,054 Washington Snohomish County 1,937 2,275 2397 2,673 2,716 Washington Spokane County 1,370 1,609 1695 1,890 1,920 Washington Stevens County 1,240 1,457 1535 1,712 1,739 Washington Thurston County 1,677 1,969 2075 2,314 2,351 Washington Wahkiakum County 1,279 1,502 1583 1,765 1,794 Washington Walla Walla County 1,399 1,644 1732 1,931 1,962 Washington Whatcom County 1,594 1,872 1973 2,200 2,235 Washington Whitman County 1,318 1,548 1631 1,819 1,848 Washington Yakima County 1,273 1,496 1576 1,757 1,786 West Virginia Barbour County 905 1,063 1120 1,249 1,269 West Virginia Berkeley County 1,375 1,615 1702 1,898 1,928 West Virginia Boone County 950 1,116 1176 1,311 1,332
Last
viewed
12/27
/16
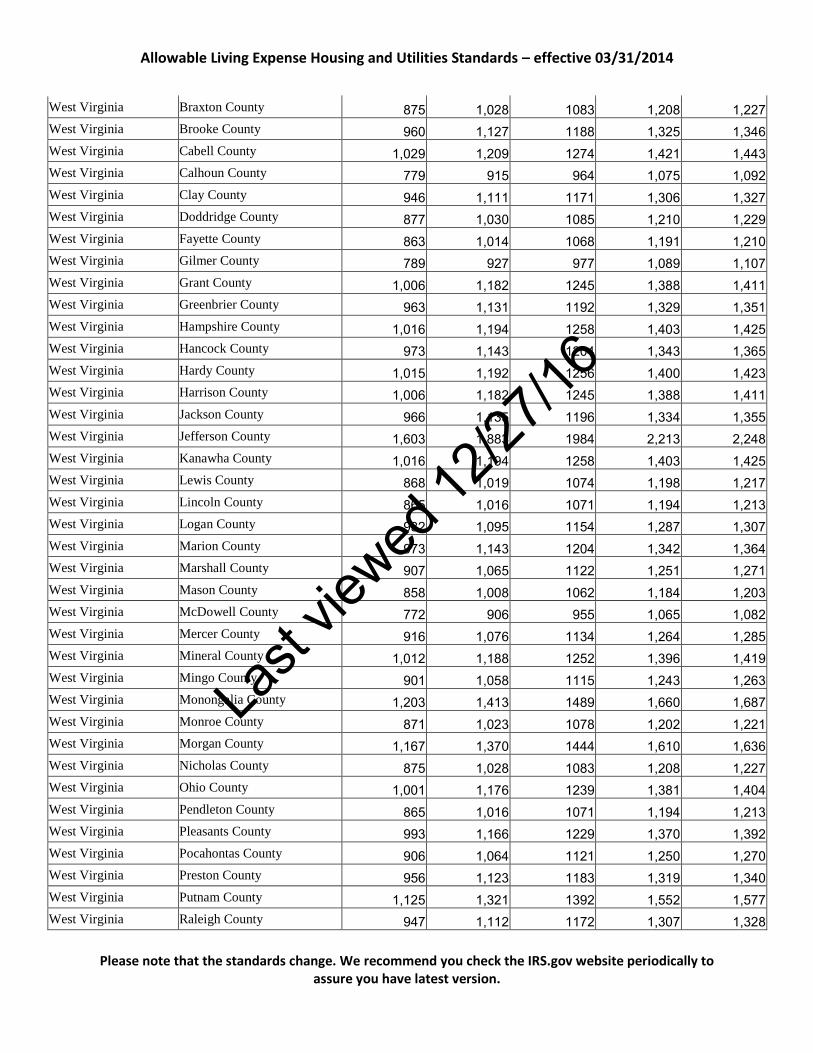
Allowable Living Expense Housing and Utilities Standards – effective 03/31/2014
Please note that the standards change. We recommend you check the IRS.gov website periodically to assure you have latest version.
West Virginia Braxton County 875 1,028 1083 1,208 1,227 West Virginia Brooke County 960 1,127 1188 1,325 1,346 West Virginia Cabell County 1,029 1,209 1274 1,421 1,443 West Virginia Calhoun County 779 915 964 1,075 1,092 West Virginia Clay County 946 1,111 1171 1,306 1,327 West Virginia Doddridge County 877 1,030 1085 1,210 1,229 West Virginia Fayette County 863 1,014 1068 1,191 1,210 West Virginia Gilmer County 789 927 977 1,089 1,107 West Virginia Grant County 1,006 1,182 1245 1,388 1,411 West Virginia Greenbrier County 963 1,131 1192 1,329 1,351 West Virginia Hampshire County 1,016 1,194 1258 1,403 1,425 West Virginia Hancock County 973 1,143 1204 1,343 1,365 West Virginia Hardy County 1,015 1,192 1256 1,400 1,423 West Virginia Harrison County 1,006 1,182 1245 1,388 1,411 West Virginia Jackson County 966 1,135 1196 1,334 1,355 West Virginia Jefferson County 1,603 1,883 1984 2,213 2,248 West Virginia Kanawha County 1,016 1,194 1258 1,403 1,425 West Virginia Lewis County 868 1,019 1074 1,198 1,217 West Virginia Lincoln County 865 1,016 1071 1,194 1,213 West Virginia Logan County 932 1,095 1154 1,287 1,307 West Virginia Marion County 973 1,143 1204 1,342 1,364 West Virginia Marshall County 907 1,065 1122 1,251 1,271 West Virginia Mason County 858 1,008 1062 1,184 1,203 West Virginia McDowell County 772 906 955 1,065 1,082 West Virginia Mercer County 916 1,076 1134 1,264 1,285 West Virginia Mineral County 1,012 1,188 1252 1,396 1,419 West Virginia Mingo County 901 1,058 1115 1,243 1,263 West Virginia Monongalia County 1,203 1,413 1489 1,660 1,687 West Virginia Monroe County 871 1,023 1078 1,202 1,221 West Virginia Morgan County 1,167 1,370 1444 1,610 1,636 West Virginia Nicholas County 875 1,028 1083 1,208 1,227 West Virginia Ohio County 1,001 1,176 1239 1,381 1,404 West Virginia Pendleton County 865 1,016 1071 1,194 1,213 West Virginia Pleasants County 993 1,166 1229 1,370 1,392 West Virginia Pocahontas County 906 1,064 1121 1,250 1,270 West Virginia Preston County 956 1,123 1183 1,319 1,340 West Virginia Putnam County 1,125 1,321 1392 1,552 1,577 West Virginia Raleigh County 947 1,112 1172 1,307 1,328
Last
viewed
12/27
/16
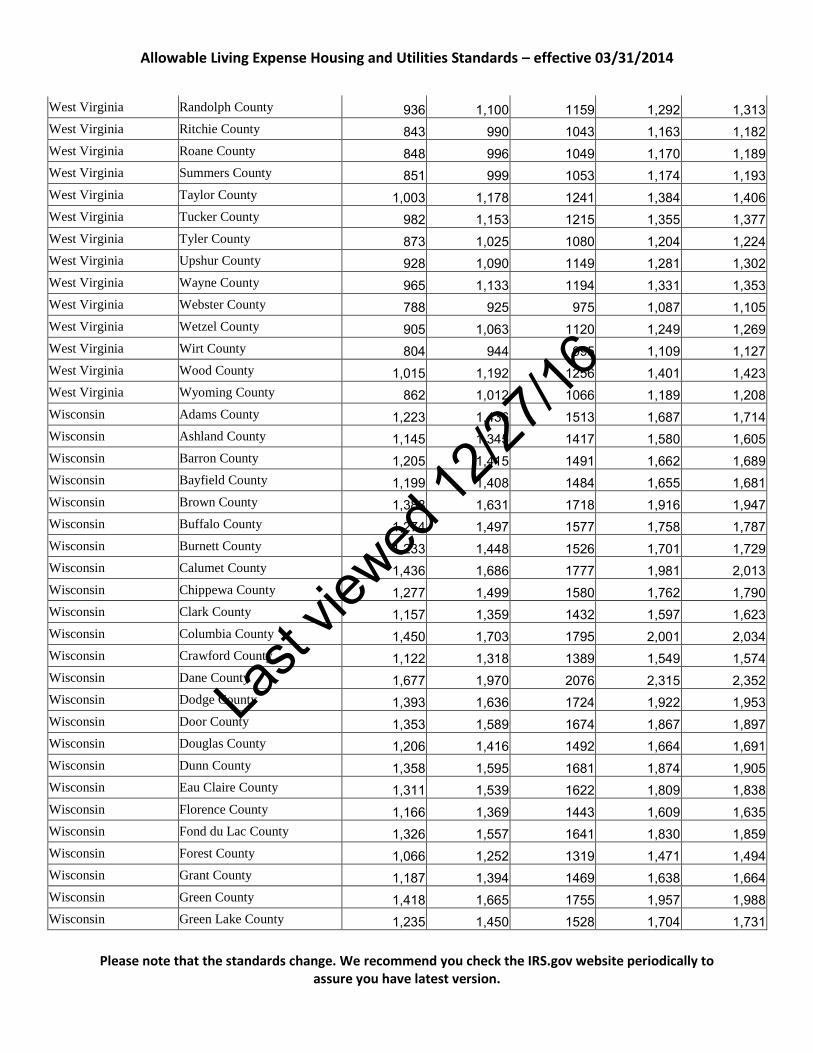
Allowable Living Expense Housing and Utilities Standards – effective 03/31/2014
Please note that the standards change. We recommend you check the IRS.gov website periodically to assure you have latest version.
West Virginia Randolph County 936 1,100 1159 1,292 1,313 West Virginia Ritchie County 843 990 1043 1,163 1,182 West Virginia Roane County 848 996 1049 1,170 1,189 West Virginia Summers County 851 999 1053 1,174 1,193 West Virginia Taylor County 1,003 1,178 1241 1,384 1,406 West Virginia Tucker County 982 1,153 1215 1,355 1,377 West Virginia Tyler County 873 1,025 1080 1,204 1,224 West Virginia Upshur County 928 1,090 1149 1,281 1,302 West Virginia Wayne County 965 1,133 1194 1,331 1,353 West Virginia Webster County 788 925 975 1,087 1,105 West Virginia Wetzel County 905 1,063 1120 1,249 1,269 West Virginia Wirt County 804 944 995 1,109 1,127 West Virginia Wood County 1,015 1,192 1256 1,401 1,423 West Virginia Wyoming County 862 1,012 1066 1,189 1,208 Wisconsin Adams County 1,223 1,436 1513 1,687 1,714 Wisconsin Ashland County 1,145 1,345 1417 1,580 1,605 Wisconsin Barron County 1,205 1,415 1491 1,662 1,689 Wisconsin Bayfield County 1,199 1,408 1484 1,655 1,681 Wisconsin Brown County 1,388 1,631 1718 1,916 1,947 Wisconsin Buffalo County 1,274 1,497 1577 1,758 1,787 Wisconsin Burnett County 1,233 1,448 1526 1,701 1,729 Wisconsin Calumet County 1,436 1,686 1777 1,981 2,013 Wisconsin Chippewa County 1,277 1,499 1580 1,762 1,790 Wisconsin Clark County 1,157 1,359 1432 1,597 1,623 Wisconsin Columbia County 1,450 1,703 1795 2,001 2,034 Wisconsin Crawford County 1,122 1,318 1389 1,549 1,574 Wisconsin Dane County 1,677 1,970 2076 2,315 2,352 Wisconsin Dodge County 1,393 1,636 1724 1,922 1,953 Wisconsin Door County 1,353 1,589 1674 1,867 1,897 Wisconsin Douglas County 1,206 1,416 1492 1,664 1,691 Wisconsin Dunn County 1,358 1,595 1681 1,874 1,905 Wisconsin Eau Claire County 1,311 1,539 1622 1,809 1,838 Wisconsin Florence County 1,166 1,369 1443 1,609 1,635 Wisconsin Fond du Lac County 1,326 1,557 1641 1,830 1,859 Wisconsin Forest County 1,066 1,252 1319 1,471 1,494 Wisconsin Grant County 1,187 1,394 1469 1,638 1,664 Wisconsin Green County 1,418 1,665 1755 1,957 1,988 Wisconsin Green Lake County 1,235 1,450 1528 1,704 1,731
Last
viewed
12/27
/16

Allowable Living Expense Housing and Utilities Standards – effective 03/31/2014
Please note that the standards change. We recommend you check the IRS.gov website periodically to assure you have latest version.
Wisconsin Iowa County 1,441 1,693 1784 1,989 2,021 Wisconsin Iron County 1,080 1,269 1337 1,491 1,515 Wisconsin Jackson County 1,191 1,399 1474 1,644 1,670 Wisconsin Jefferson County 1,500 1,761 1856 2,070 2,103 Wisconsin Juneau County 1,205 1,415 1491 1,662 1,689 Wisconsin Kenosha County 1,542 1,812 1909 2,129 2,163 Wisconsin Kewaunee County 1,302 1,530 1612 1,797 1,826 Wisconsin La Crosse County 1,359 1,596 1682 1,875 1,906 Wisconsin Lafayette County 1,276 1,498 1579 1,761 1,789 Wisconsin Langlade County 1,079 1,267 1335 1,489 1,513 Wisconsin Lincoln County 1,194 1,403 1478 1,648 1,675 Wisconsin Manitowoc County 1,211 1,423 1499 1,671 1,698 Wisconsin Marathon County 1,304 1,532 1614 1,800 1,829 Wisconsin Marinette County 1,083 1,272 1340 1,494 1,518 Wisconsin Marquette County 1,221 1,434 1511 1,685 1,712 Wisconsin Menominee County 1,146 1,346 1418 1,581 1,607 Wisconsin Milwaukee County 1,467 1,722 1815 2,024 2,056 Wisconsin Monroe County 1,244 1,461 1539 1,716 1,744 Wisconsin Oconto County 1,305 1,533 1615 1,801 1,830 Wisconsin Oneida County 1,222 1,435 1512 1,686 1,713 Wisconsin Outagamie County 1,369 1,608 1694 1,889 1,919 Wisconsin Ozaukee County 1,772 2,081 2193 2,445 2,485 Wisconsin Pepin County 1,304 1,532 1614 1,800 1,829 Wisconsin Pierce County 1,624 1,908 2010 2,241 2,278 Wisconsin Polk County 1,395 1,638 1726 1,924 1,956 Wisconsin Portage County 1,254 1,473 1552 1,730 1,758 Wisconsin Price County 1,128 1,325 1396 1,557 1,582 Wisconsin Racine County 1,460 1,715 1807 2,015 2,047 Wisconsin Richland County 1,210 1,421 1497 1,669 1,696 Wisconsin Rock County 1,316 1,546 1629 1,817 1,846 Wisconsin Rusk County 1,150 1,350 1423 1,587 1,612 Wisconsin Sauk County 1,373 1,612 1699 1,894 1,925 Wisconsin Sawyer County 1,179 1,385 1459 1,627 1,653 Wisconsin Shawano County 1,223 1,437 1514 1,688 1,715 Wisconsin Sheboygan County 1,338 1,572 1656 1,847 1,876 Wisconsin St. Croix County 1,660 1,949 2054 2,290 2,327 Wisconsin Taylor County 1,210 1,422 1498 1,670 1,697 Wisconsin Trempealeau County 1,265 1,485 1565 1,745 1,773
Last
viewed
12/27
/16
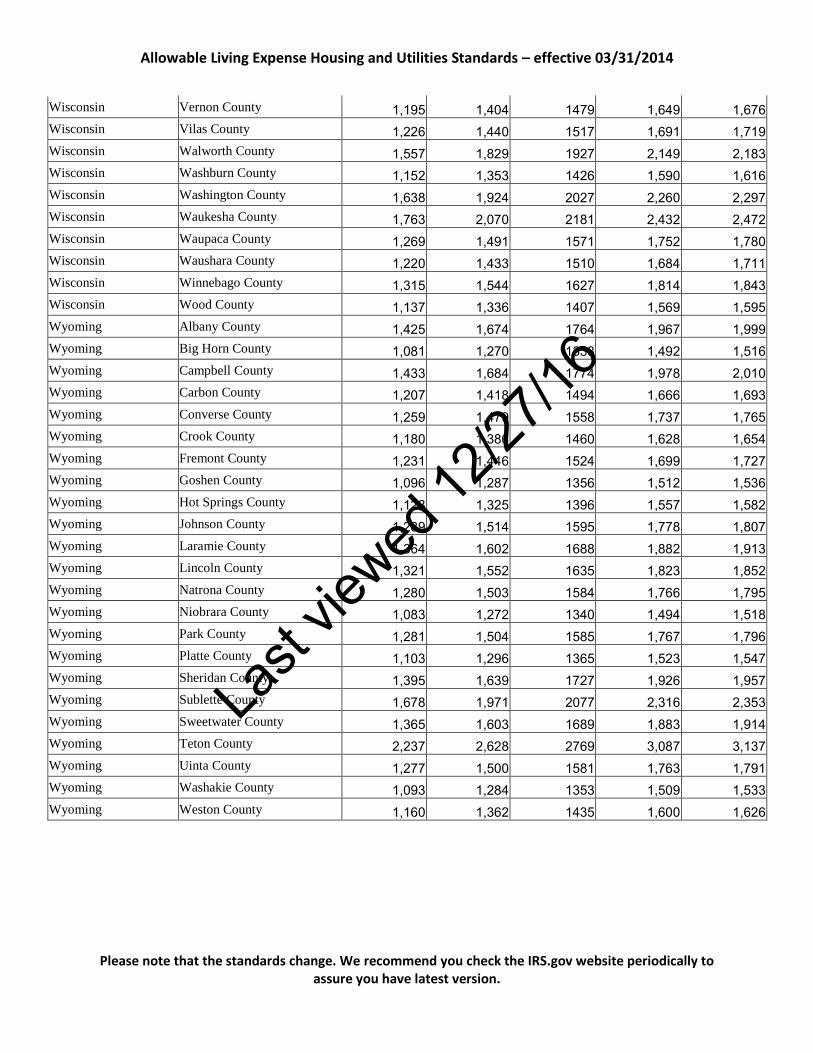
Allowable Living Expense Housing and Utilities Standards – effective 03/31/2014
Please note that the standards change. We recommend you check the IRS.gov website periodically to assure you have latest version.
Wisconsin Vernon County 1,195 1,404 1479 1,649 1,676 Wisconsin Vilas County 1,226 1,440 1517 1,691 1,719 Wisconsin Walworth County 1,557 1,829 1927 2,149 2,183 Wisconsin Washburn County 1,152 1,353 1426 1,590 1,616 Wisconsin Washington County 1,638 1,924 2027 2,260 2,297 Wisconsin Waukesha County 1,763 2,070 2181 2,432 2,472 Wisconsin Waupaca County 1,269 1,491 1571 1,752 1,780 Wisconsin Waushara County 1,220 1,433 1510 1,684 1,711 Wisconsin Winnebago County 1,315 1,544 1627 1,814 1,843 Wisconsin Wood County 1,137 1,336 1407 1,569 1,595 Wyoming Albany County 1,425 1,674 1764 1,967 1,999 Wyoming Big Horn County 1,081 1,270 1338 1,492 1,516 Wyoming Campbell County 1,433 1,684 1774 1,978 2,010 Wyoming Carbon County 1,207 1,418 1494 1,666 1,693 Wyoming Converse County 1,259 1,479 1558 1,737 1,765 Wyoming Crook County 1,180 1,386 1460 1,628 1,654 Wyoming Fremont County 1,231 1,446 1524 1,699 1,727 Wyoming Goshen County 1,096 1,287 1356 1,512 1,536 Wyoming Hot Springs County 1,128 1,325 1396 1,557 1,582 Wyoming Johnson County 1,289 1,514 1595 1,778 1,807 Wyoming Laramie County 1,364 1,602 1688 1,882 1,913 Wyoming Lincoln County 1,321 1,552 1635 1,823 1,852 Wyoming Natrona County 1,280 1,503 1584 1,766 1,795 Wyoming Niobrara County 1,083 1,272 1340 1,494 1,518 Wyoming Park County 1,281 1,504 1585 1,767 1,796 Wyoming Platte County 1,103 1,296 1365 1,523 1,547 Wyoming Sheridan County 1,395 1,639 1727 1,926 1,957 Wyoming Sublette County 1,678 1,971 2077 2,316 2,353 Wyoming Sweetwater County 1,365 1,603 1689 1,883 1,914 Wyoming Teton County 2,237 2,628 2769 3,087 3,137 Wyoming Uinta County 1,277 1,500 1581 1,763 1,791 Wyoming Washakie County 1,093 1,284 1353 1,509 1,533 Wyoming Weston County 1,160 1,362 1435 1,600 1,626
Last
viewed
12/27
/16