13 harvey v. sparks, jr., m.d. chapter the electrical activity … · maker potential in nodal...
TRANSCRIPT

The Electrical Activity of the HeartThom W. Rooke, M.D.Harvey V. Sparks, Jr., M.D.13
C H A P T E R
13
The heart beats in the absence of any nervous connectionsbecause the electrical (pacemaker) activity that generates
the heartbeat resides within the cardiac muscle. After initia-tion, the electrical activity spreads throughout the heart,reaching every cardiac cell rapidly with the correct timing.This enables coordinated contraction of individual cells.
The electrical activity of cardiac cells depends on the ionicgradients across their plasma membranes and changes in per-meability to selected ions brought about by the opening andclosing of cation channels. This chapter describes how theseionic gradients and changes in membrane permeability resultin the electrical activity of individual cells and how this elec-trical activity is propagated throughout the heart.
THE IONIC BASIS OF CARDIAC ELECTRICAL
ACTIVITY: THE CARDIAC MEMBRANE POTENTIAL
The cardiac membrane potential is divided into 5 phases,phases 0 to 4 (Fig. 13.1). Phase 0 is the rapid upswing of the
action potential; phase 1 is the small repolarization just af-ter rapid depolarization; phase 2 is the plateau of the actionpotential; phase 3 is the repolarization to the resting mem-brane potential; and phase 4 is the resting membrane po-tential in atrial, ventricular, and Purkinje cells and the pace-maker potential in nodal cells. In resting ventricular musclecells, the potential inside the membrane is stable at approx-imately �90 mV relative to the outside of the cell (seephase 4, Fig. 13.1A). When the cell is brought to threshold,an action potential occurs (see Chapter 3). First, there is arapid depolarization from �90 mV to �20 mV (phase 0).This is followed by a slight decline in membrane potential(phase 1) to a plateau (phase 2), at which time the mem-brane potential is close to 0 mV. Next, rapid repolarization(phase 3) returns the membrane potential to its restingvalue (phase 4).
In contrast to ventricular cells, cells of the sinoatrial(SA) node and atrioventricular (AV) node exhibit a pro-gressive depolarization during phase 4 called the pace-maker potential (see Fig. 13.1B). When the membrane po-
■ THE IONIC BASIS OF CARDIAC ELECTRICAL
ACTIVITY: THE CARDIAC MEMBRANE POTENTIAL
■ THE INITIATION AND PROPAGATION OF CARDIAC
ELECTRICAL ACTIVITY
■ THE ELECTROCARDIOGRAM
C H A P T E R O U T L I N E
1. The electrical activity of cardiac cells is caused by the se-lective opening and closing of plasma membrane channelsfor sodium, potassium, and calcium ions.
2. Depolarization is achieved by the opening of sodium andcalcium channels and the closing of potassium channels.
3. Repolarization is achieved by the opening of potassiumchannels and the closing of sodium and calcium channels.
4. Pacemaker potentials are achieved by the opening of chan-nels for sodium and calcium ions and the closing of chan-nels for potassium ions.
5. Electrical activity is normally initiated in the sinoatrial (SA)node where pacemaker cells reach threshold first.
6. Electrical activity spreads across the atria, through the atri-oventricular (AV) node, through the Purkinje system, andto ventricular muscle.
7. Norepinephrine increases pacemaker activity and thespeed of action potential conduction.
8. Acetylcholine decreases pacemaker activity and the speedof action potential conduction.
9. Voltage differences between repolarized and depolarizedregions of the heart are recorded by an electrocardiogram(ECG).
10. The ECG provides clinically useful information about rate,rhythm, pattern of depolarization, and mass of electricallyactive cardiac muscle.
K E Y C O N C E P T S
219

220 PART IV BLOOD AND CARDIOVASCULAR PHYSIOLOGY
tential reaches threshold potential, there is a rapid depolar-ization (phase 0) to approximately �20 mV. The mem-brane subsequently repolarizes (phase 3) without goingthrough a plateau phase, and the pacemaker potential re-sumes. Other myocardial cells combine various character-istics of the electrical activity of these two cell types. Atrialcells, for example (see Fig. 13.1C), have a steady diastolicresting membrane potential (phase 4) but lack a definiteplateau (phase 2).
The Cardiac Membrane Potential Depends
on Transmembrane Movements of Sodium,
Potassium, and Calcium
The membrane potential of a cardiac cell depends on con-centration differences in Na�, K�, and Ca2� across the cellmembrane and the opening and closing of channels thattransport these cations. Some Na�, K�, and Ca2� channels(voltage-gated channels) are opened and closed by changesin membrane voltage, and others (ligand-gated channels)are opened by a neurotransmitter, hormone, metabolite,and/or drug. Tables 13.1 and 13.2 list the major membranechannels responsible for conducting the ionic currents incardiac cells.
The ion concentration gradients that determine trans-membrane potentials are created and maintained by activetransport. The transport of Na� and K� is accomplished bythe plasma membrane Na�/K�-ATPase (see Chapter 2).Calcium is partially transported by means of a
Ca2�-ATPase and partially by an antiporter that uses en-ergy derived from the Na� electrochemical gradient to re-move Ca2� from the cell. If the energy supply of myocar-dial cells is restricted by inadequate coronary blood flow,ATP synthesis (and, in turn, active transport) may be im-paired. This situation leads to a reduction in ionic concen-tration gradients that eventually disrupts the electrical ac-tivity of the heart.
The magnitude of the intracellular potential depends onthe relative permeability of the membrane to Na�, Ca2�,and K�. The relative permeability to these cations at a par-ticular time depends on which of the various cation chan-nels listed in Table 13.1 are open. For example, during rest,mostly K� channels are open and the measured potential isclose to that which would exist if the membrane were per-
A
B
C
SA0
12
3
4
200 msec
+200
-20-40-60-80
-100
0
34
400 msec
+200
-20-40-60-80
-100
mV
0
1
2
3
4
200 msec
+200
-20-40-60-80
-100
mV
mV
Cardiac action potentials (mV) recorded
from A, ventricular, B, sinoatrial, and C, atrialcells. Note the difference in the time scale of the sinoatrial cell.Numbers 0 to 4 refer to the phases of the action potential (see text).
FIGURE 13.1
TABLE 13.1Major Channels Involved in Purkinje and
Ventricular Myocyte Membrane Poten-
tials
Voltage (V)-or Ligand(L)-
Name Gated Functional Role
Voltage-gated V Phase 0 of action potentialNa� channel (permits influx of Na�)(fast, INa)
Voltage-gated V Contributes to phase 2 ofCa2� channel action potential (permits(long-lasting, influx of Ca2�) whenICaL) membrane is
depolarized).�-adrenergic agentsincrease the probabilityof channel opening andraise Ca2� influx. AChlowers the probabilityof channel opening.
Inward rectifying V Maintains restingK� channel membrane potential(iK1) (phase 4) by permitting
outflux of K� at highlynegative membranepotentials.
Outward (transient) V Contributes briefly torectifying K� phase 1 by transientlychannel (ito1) permitting outflux of
K� at positivemembrane potentials.
Outward (delayed) V Cause phase 3 of actionrectifying K� potential by permittingchannels outflux of K� after a(iKr, iKs) delay when membrane
depolarizes. IKr channelis also called HERGchannel.
G protein-activated L G protein operatedK� channel channel, opened by(iK.G, iK.ACh, ACh and adenosine.iK.ado) This channel
hyperpolarizesmembrane during phase4 and shortens phase 2.

meable only to K� (potassium equilibrium potential). Incontrast, when open Na� channels predominate (as occursat the peak of phase 0 of the action potential), the measuredpotential is closer to the potential that would exist if themembrane were permeable only to Na� (sodium equilib-rium potential) (see Fig. 13.2). The opening of Ca2� chan-nels causes the membrane potential to be closer to the cal-cium equilibrium potential, which is also positive; thisoccurs in phase 2. Specific changes in the number of openchannels for these three cations are responsible for changesin membrane permeability and the different phases of theaction potential.
The Opening and Closing of Cation Channels
Causes the Ventricular Action Potential
In the normal heart, the sodium-potassium pump and cal-cium ion pump keep the ionic gradients constant. Withconstant ion gradients, the opening and closing of cation
channels and the resulting changes in membrane perme-ability determine the membrane potential. Figures 13.3 and13.4 depict the membrane changes that occur during an ac-tion potential in ventricular cells.
Depolarization Early in the Action Potential: SelectiveOpening of Sodium Channels. Depolarization occurswhen the membrane potential moves away from the K�
equilibrium potential and toward the Na� equilibrium po-tential. In ventricular cell membranes, this occurs passivelyat first, in response to the depolarization of adjacent mem-branes (discussed later). Once the ventricular cell mem-brane is brought to threshold, voltage-gated Na� channelsopen, causing the initial rapid upswing of the action poten-tial (phase 0). The opening of Na� channels causes Na�
permeability to increase. As permeability to Na� exceedspermeability to K�, the membrane potential approachesthe Na� equilibrium potential, and the inside of the cell be-comes positively charged relative to the outside.
Phase 1 of the ventricular action potential is caused by adecrease in the number of open Na� channels and theopening of a particular type of K� channel (see Fig. 13.3and Table 13.1). These changes tend to repolarize themembrane slightly.
Late Depolarization (Plateau): Selective Opening of Cal-cium Channels and Closing of Potassium Channels.The plateau of phase 2 results from a combination of theclosing of K� channels (see Fig. 13.3 and Table 13.1) andthe opening of voltage-gated Ca2� channels. These chan-
CHAPTER 13 The Electrical Activity of the Heart 221
TABLE 13.2Major Channels Involved in Nodal Mem-
brane Potentials
Voltage (V)-or Ligand(L)-
Name Gated Functional Role
Voltage-gated Ca2� V Phase 0 of action potentialchannel of SA and AV nodal(long-lasting, iCaL) cells (carries influx of
Ca2� when membraneis depolarized);contributes to earlypacemaker potential ofnodal cells.�-adrenergic agentsincrease the probabilityof channel opening andraise Ca2� influx. AChlowers the probabilityof channel opening.
Voltage-gated Ca2� V Contributes to thechannel pacemaker potential.(transient, iCaT)
Mixed cation channel V Carries Na� (mostly) and(funny, If) K� inward when
activated byhyperpolarization.Contributes topacemaker potential.
K� channel (delayed V Contributes to phase 3 ofoutward rectifier, iK) action potential.
Closing early in phase 4contributes topacemaker potential.
G protein-activated K� L G protein operatedchannel (iK.G, channel, opened by AChiK.ACh, iK.ado) and adenosine. This
channel hyperpolarizesmembrane during phase4, slowing pacemakerpotential.
Potassium equilibrium potential
Sodium equilibrium potential+60
+40
+20
0
-20
-40
-60
-80
-100
mV
Effect of ionic permeability on membrane
potential, primarily determined by the rela-
tive permeability of the membrane to Na�, K�, and Ca2�.Relatively high permeability to K� places the membrane poten-tial close to the K� equilibrium potential, and relatively high per-meability to Na� places it close to the Na� equilibrium potential.The same is true for Ca2�. An equilibrium potential is not shownfor Ca2� because, unlike Na� and K�, it changes during the ac-tion potential. This is because cytosolic Ca2� concentrationchanges approximately 5-fold during excitation. During theplateau of the action potential, the equilibrium potential for Ca2�
is approximately �90 mV. Membrane permeability to Na�, K�,and Ca2� depends on ion channel proteins (see Table 13.1).
FIGURE 13.2

222 PART IV BLOOD AND CARDIOVASCULAR PHYSIOLOGY
nels open more slowly than voltage-gated Na� channelsand do not contribute to the rapid upswing of the ventric-ular action potential.
Repolarization: Selective Opening of Potassium Channels.The return of the membrane potential (phase 3, or repolar-ization) to the resting state is caused by the closing of Ca2�
channels and the opening of particular classes of K� chan-nels (see Fig. 13.3 and Table 13.1). This relative increase inpermeability to K� drives the membrane potential towardthe K� equilibrium potential.
Resting Membrane Potential: Open Potassium Channels.The resting (diastolic) membrane potential (phase 4) ofventricular cells is maintained primarily by K� channelsthat are open at highly negative membrane potentials.They are called inward rectifying K� channels because,when the membrane is depolarized (e.g., by the opening ofvoltage-gated Na� channels), they do not permit outwardmovement of K�. Other specialized K� channels help sta-bilize the resting membrane potential (see Table 13.1) and,
in their absence, serious disorders of cardiac electrical ac-tivity can develop.
The Opening of Na� and Ca2� and the Closing
of K� Channels Causes the Pacemaker Potential
of the SA and AV Nodes
When the electrical activity of a cell from the SA or AVnode is compared with that of a ventricular muscle cell,three important differences are observed (see Fig. 13.1, Fig. 13.5): (1) the presence of a pacemaker potential, (2)the slow rise of the action potential, and (3) the lack of awell-defined plateau. The pacemaker potential results fromchanges in the permeability of the nodal cell membrane toall three of the major cations (see Table 13.2). First, K�
channels, primarily responsible for repolarization, begin toclose. Second, there is a steady increase in the membrane
Area of depolarization resultingfrom artificial stimulus or pacemaker
Positive chargesdisplaced intoadjacent areas
Depolarization
Threshold is reachedNa+ channels open
Membrane potentialapproaches Na+
equilibrium potential
Na+ channels inactivatedand ito1 channels open
Membrane potential nears zero
Phase0
Phase4
Phase1
Phase3
Phase2
iKr and iKs channels closeand iK1 channels open
Na+ channels activate
Resting membrane potential
iKr and iKs channels open
Membrane potentialapproaches K+
equilibrium potential
Ca2+ channels openand ito1 channels close
then:Ca2+ channels close
and iK1 channels close
Membrane potentialstays near zero
Events associated with the ventricular ac-
tion potential. (See Table 13.1 for channeldetails.)
FIGURE 13.3
Membrane potential(mV)
K+ permeability
Na+ permeability(fast channel)
Ca2+ permeability(slow channel)
Time (msec)
0
12
3
4
+200
-20-40-60-80
-100
mV
High
Low
High
Low
High
Low
0 100 200 300 400
ito
iKs
iK1iK1*
iKr
Changes in cation permeabilities during a
Purkinje fiber action potential (compare
with Fig. 13.3). The rise in action potential (phase 0) is causedby rapidly increasing Na� current carried by voltage-gated Na�
channels. Na� current falls rapidly because voltage-gated Na�
channels are inactivated. K� current rises briefly because of open-ing of ito1 channels and then falls precipitously because iK1 chan-nels are closed by depolarization (*closing of iK1 channels). Ca2�
channels are opened by depolarization and are responsible, alongwith closed iK1 channels, for phase 2. K� current begins to in-crease because iKr and iKs channels are opened by depolarization,after a delay. Once repolarization occurs, Na� channels are acti-vated. Reopened iK1 channels maintain phase 4.
FIGURE 13.4

permeability to Na� caused by the opening of a cationchannel. Third, calcium moves in through the voltage-gated Ca2� channel early in diastole. All three of thesechanges move the membrane potential in a positive direc-tion toward the Na� and Ca2� equilibrium potentials. Anaction potential is triggered when threshold is reached.This action potential rises more slowly than the ventricularaction potential because the fast voltage-gated Na� chan-nels play an insignificant role. Instead, the opening of slowvoltage-gated Ca2� channels is primarily responsible forthe upstroke of the action potential in nodal cells. The ab-sence of a well-defined plateau occurs because K� channelsopen and pull the membrane potential toward the K� equi-librium potential.
Purkinje fibers are also capable of pacemaker activity,but the rate of depolarization during phase 4 is much slowerthan that of the nodal cells. In the normal heart, phase 4 ofPurkinje fibers is usually thought to be a stable restingmembrane potential.
The Refractory Period Is Caused by a Delay
in the Reactivation of Na� Channels
As discussed in Chapter 10, cardiac muscle cells displaylong refractory periods and, as a result, cannot betetanized by fast, repeated stimulation. A prolonged re-fractory period eliminates the possibility that a sustainedcontraction might occur and prevent the cyclic contrac-tions required to pump blood. The refractory period be-gins with depolarization and continues until nearly theend of phase 3 (see Fig. 10.2). This occurs because theNa� channels that open to cause phase 0 close and are in-active until the membrane repolarizes.
Neurotransmitters and Other Ligands Can
Influence Membrane Ion Conductance
The normal pacemaker cells are under the influence ofparasympathetic nerves (vagus) and sympathetic nerves(cardioaccelerator). The vagus nerves release acetylcholine(ACh) and the cardioaccelerator nerves release norepi-nephrine at their terminals in the heart. ACh slows theheart rate by reducing the rate of spontaneous depolariza-tion of pacemaker cells (see Fig. 13.5), increasing the timerequired to reach threshold. Slowed heart rate is calledbradycardia, or when the heart rate is below 60 beats/min.ACh exerts this effect by increasing the number of open K�
channels and decreasing the number of open channels car-rying Na� and Ca2�; both actions hold the pacemaker po-tential closer to the K� equilibrium potential.
In contrast, norepinephrine causes an increase in theslope of the pacemaker potential so that the threshold isreached more rapidly and the heart rate increases. In-creased heart rate is called tachycardia, or when the heartrate is above 100 beats/min. Norepinephrine increases theslope of the pacemaker potential by opening channels car-rying Na� and Ca2� and closing K� channels. Both effectsresult in faster movement of the pacemaker potential to-ward the Na� and Ca2� equilibrium potentials. Norepi-nephrine and ACh exert these effects via Gs and Gi protein-mediated events.
Many other ligands, including metabolites (e.g., adeno-sine) and drugs (e.g., those which act on the autonomicnervous system), alter the heart rate by mechanisms similarto the ones outlined above.
THE INITIATION AND PROPAGATION
OF CARDIAC ELECTRICAL ACTIVITY
Cardiac electrical activity is normally initiated and spreadin an orderly fashion. The heart is said to be a functionalsyncytium because the excitation of one cardiac cell even-tually leads to the excitation of all cells. The cellular basisfor the functional syncytium is low-resistance areas of theintercalated disks (the end-to-end junctions of myocardialcells) called gap junctions (see Chapter 10). Gap junctionsbetween adjacent cells allow small ions to move freely fromone cell to the next, meaning that action potentials can bepropagated from cell to cell, similar to the way an actionpotential is propagated along an axon (see Chapter 3).
Excitation Starts in the SA Node Because
SA Cells Reach Threshold First
Excitation of the heart normally begins in the SA node be-cause the pacemaker potential of this tissue (see Fig. 13.1)reaches threshold before the pacemaker potential of the AVnode. The pacemaker rate of the SA node is normally 60 to100 beats/min versus 40 to 55 beats/min for the AV node.Pacemaker activity in the bundle of His and the Purkinjesystem is even slower, at 25 to 40 beats/min. Normal atrialand ventricular cells do not exhibit pacemaker activity.
Many cells of the SA node reach threshold and depolar-ize almost simultaneously, creating a migration of ions be-
CHAPTER 13 The Electrical Activity of the Heart 223
Time (msec)
�40
�20
�20
�40
�60
�80
0
a b c
Mem
bran
e po
tent
ial (
mV
)
Sinoatrial plasma membrane potential as a
function of time. Normal pacemaker potential(b) is affected by norepinephrine (a) and acetylcholine (c). Thedashed line indicates threshold potential. The more rapidly risingpacemaker potential in the presence of norepinephrine (a) resultsfrom increased Na� permeability. The hyperpolarization andslower rising pacemaker potential in the presence of ACh resultsfrom decreased Na� permeability and increased K� permeability,due to the opening of ACh-activated K� channels.
FIGURE 13.5

224 PART IV BLOOD AND CARDIOVASCULAR PHYSIOLOGY
tween these depolarized SA nodal cells and nearby restingatrial cells. This leads to depolarization of the neighboringright atrial cells and a wave of depolarization begins tospread over the right and left atria.
The Action Potential Is Propagated by Local
Currents Created During Depolarization
As Na� ions enter a cell during phase 0, their positivecharge repels intracellular K� ions into nearby areas wheredepolarization has not yet occurred. Potassium is evendriven into adjacent resting cells through gap junctions.The local buildup of K� depolarizes adjacent areas untilthreshold is reached. The cycle of depolarization tothreshold, Na� entry, and subsequent displacement of pos-itive charges into nearby areas explains the spread of elec-trical activity. Excitation proceeds as succeeding cycles oflocal ion current and action potential move out of the SAnode and across the atria. This process is called the propa-gation of the action potential.
Excitation Usually Spreads From the SA Node
to Atrial Muscle to the AV Node to the Purkinje
System to Ventricular Muscle
A fibrous, nonconducting connective tissue ring separatesthe atria from the ventricles everywhere except at the AVnode. For this reason, the transmission of electrical activityfrom the atria to the ventricles occurs only through the AVnode. Action potentials in atrial muscle adjacent to the AVnode produce local ion currents that invade the node andtrigger intranodal action potentials.
Slow Conduction Through the AV Node. Excitation pro-ceeds throughout the atria at a speed of approximately 1m/sec. It requires 60 to 90 msec to excite all regions of theatria (Fig. 13.6). Propagation of the action potential con-tinues within the AV node, but at a much slower velocity(0.05 to 0.1 m/sec). The slower conduction velocity is par-tially explained by the small size of the nodal cells. Lesscurrent is produced by the depolarization of a small nodal
cell (compared with a large atrial or ventricular cell), andthe relatively smaller current brings neighboring cells tothreshold more slowly, decreasing the rate at which elec-trical activation spreads. Other significant factors are theslow upstroke of the action potential because it depends onslow voltage-gated Ca2� channels and, possibly, weak elec-trical coupling as a result of relatively few gap junctions.Propagation of the action potential through the AV nodetakes approximately 120 msec. Excitation then proceedsthrough the AV bundle (bundle of His), the left and rightbundle branches, and the Purkinje system.
The AV node is the weak link in the excitation of theheart. Inflammation, hypoxia, vagus nerve activity, and cer-tain drugs (e.g., digitalis, beta blockers, and calcium entryblockers) can cause failure of the AV node to conduct someor all atrial depolarizations to the ventricles. On the otherhand, its tendency to conduct slowly is sometimes of ben-efit in pathological situations in which atrial depolariza-tions are too frequent and/or uncoordinated, as in atrialflutter or fibrillation. In these conditions, not all of the elec-trical impulses that reach the AV node are conducted to theventricles, and the ventricular rate tends to stay below thelevel at which diastolic filling is impaired (see Chapter 14).The benefit of slow AV nodal conduction in a normal heartis that it allows the ventricular filling associated with atrialsystole to occur before the ventricles are excited.
Rapid Conduction Through the Ventricles. The Purkinjesystem is composed of specialized cardiac muscle cells withlarge diameters. These cells rapidly conduct (conduction ve-locity up to 2 m/sec) action potentials throughout the suben-docardium of both ventricles. Depolarization then proceedsfrom endocardium to epicardium (see Fig. 13.6). The con-duction velocity through ventricular muscle is 0.3 m/sec;complete excitation of both ventricles takes approximately75 msec. The rapid completion of excitation of the ventriclesassures synchronized contraction of all ventricular musclecells and maximal effectiveness in ejecting blood.
THE ELECTROCARDIOGRAM
The electrocardiogram (ECG) is a continuous record ofcardiac electrical activity obtained by placing sensing elec-trodes on the surface of the body and recording the voltagedifferences generated by the heart. The equipment ampli-fies these voltages and causes a pen to deflect proportion-ally on a paper moving under it. This gives a plot of voltageas a function of time.
The ECG Records the Dipoles Produced
by the Electrical Activity of the Heart
To understand the ECG, it is necessary to understand thebehavior of electrical potentials in a three-dimensionalconductor of electricity. Consider what happens whenwires are run from the positive and negative terminals of abattery into a dish containing salt solution. Positivelycharged ions flow toward the negative wire (negative pole)and negatively charged ions simultaneously flow in the op-posite direction toward the positive wire (positive pole).
.20.21
.21
.22
.07.09
.03.03
.19
.18.17
.16.16
.17
.18
.19
.01
.02
.07
.05
SVC
SAnode
AVnode
IVC
Right bundlebranch
Ventricularseptum
Left bundlebranch
AV bundle
A B
The timing of excitation of various areas of
the heart (in fractions of a second). FIGURE 13.6
The combination of two poles that are equal in magnitudeand opposite in charge and located close to one another, iscalled a dipole. The flow of ions (current) is greatest in theregion between the two poles, but some current flows atevery point surrounding the dipole, reflecting the fact thatvoltage differences exist everywhere in the solution.
Measurement of the Voltage Associated With a Dipole.What points encircling the dipole in Figure 13.7 have thegreatest voltage difference between them? Points A and Bdo because A is closest to the positive pole and B is closestto the negative pole. Positive charges are drawn from thearea around point B by the negative end of the dipole,which is relatively near. The positive end of the dipole isrelatively distant and, therefore, has little ability to attractnegative charges from point B (although it can draw nega-tive charges from point A). As positive charges are drawnaway, point B is left with a negative charge (or negativevoltage). The opposite happens between the positive endof the dipole and point A, leaving A with a net positivecharge (or voltage). Points C and D have no voltage differ-ence between them because they are equally distant fromboth poles and are, therefore, equally influenced by posi-tive and negative charges. Any other two points on the cir-cle, E and F, for example, have a voltage difference betweenthem that is less than that between A and B and greater thanthat between C and D. This is also true of other combina-tions of points, such as A and C, B and D, and D and F.Voltage differences exist in all cases and are determined bythe relative influences of the positive and negative ends ofthe dipole.
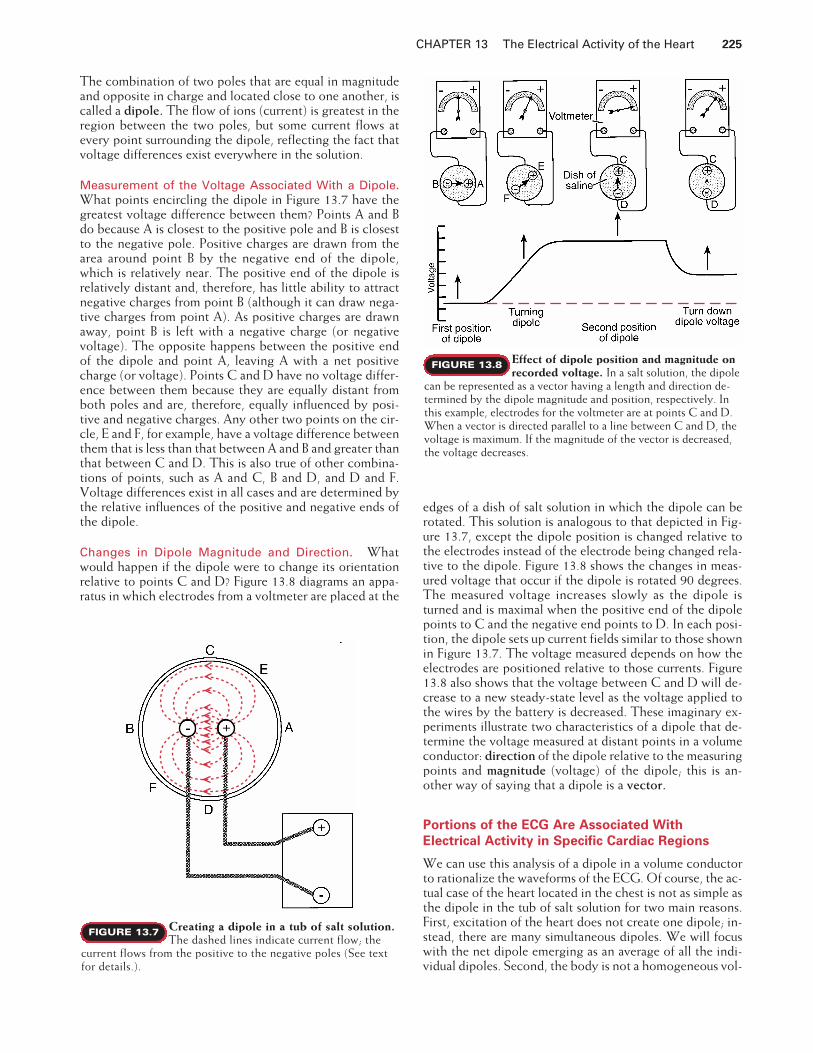
Changes in Dipole Magnitude and Direction. Whatwould happen if the dipole were to change its orientationrelative to points C and D? Figure 13.8 diagrams an appa-ratus in which electrodes from a voltmeter are placed at the
edges of a dish of salt solution in which the dipole can berotated. This solution is analogous to that depicted in Fig-ure 13.7, except the dipole position is changed relative tothe electrodes instead of the electrode being changed rela-tive to the dipole. Figure 13.8 shows the changes in meas-ured voltage that occur if the dipole is rotated 90 degrees.The measured voltage increases slowly as the dipole isturned and is maximal when the positive end of the dipolepoints to C and the negative end points to D. In each posi-tion, the dipole sets up current fields similar to those shownin Figure 13.7. The voltage measured depends on how theelectrodes are positioned relative to those currents. Figure13.8 also shows that the voltage between C and D will de-crease to a new steady-state level as the voltage applied tothe wires by the battery is decreased. These imaginary ex-periments illustrate two characteristics of a dipole that de-termine the voltage measured at distant points in a volumeconductor: direction of the dipole relative to the measuringpoints and magnitude (voltage) of the dipole; this is an-other way of saying that a dipole is a vector.
Portions of the ECG Are Associated With
Electrical Activity in Specific Cardiac Regions
We can use this analysis of a dipole in a volume conductorto rationalize the waveforms of the ECG. Of course, the ac-tual case of the heart located in the chest is not as simple asthe dipole in the tub of salt solution for two main reasons.First, excitation of the heart does not create one dipole; in-stead, there are many simultaneous dipoles. We will focuswith the net dipole emerging as an average of all the indi-vidual dipoles. Second, the body is not a homogeneous vol-
CHAPTER 13 The Electrical Activity of the Heart 225
Creating a dipole in a tub of salt solution.
The dashed lines indicate current flow; thecurrent flows from the positive to the negative poles (See textfor details.).
FIGURE 13.7
Effect of dipole position and magnitude on
recorded voltage. In a salt solution, the dipolecan be represented as a vector having a length and direction de-termined by the dipole magnitude and position, respectively. Inthis example, electrodes for the voltmeter are at points C and D.When a vector is directed parallel to a line between C and D, thevoltage is maximum. If the magnitude of the vector is decreased,the voltage decreases.
FIGURE 13.8

226 PART IV BLOOD AND CARDIOVASCULAR PHYSIOLOGY
ume conductor. The most significant problem is that thelungs are full of air, not salt solution. Despite these prob-lems, the model is useful in an initial understanding of thegeneration of the ECG.
At rest, myocardial cells have a negative charge insideand a positive charge outside the cell membrane. As cellsdepolarize, the depolarized cells become negative on theoutside, whereas the cells in the region ahead of the de-polarized cells remain positive on the outside (Fig. 13.9).When the entire myocardium is depolarized, no voltagedifferences exist between any regions of myocardium be-cause all cells are negative on the outside. When the cellsin a given region depolarize during normal excitation,that portion of the heart generates a dipole. The depolar-ized portion constitutes the negative side, and the yet-to-be-depolarized portion constitutes the positive side of thedipole. The tub of salt solution is analogous to the rest ofthe body in that the heart is a dipole in a volume conduc-tor. With electrodes located at various points around thevolume conductor (i.e., the body), the voltage resultingfrom the dipole generated by the electrical activity of theheart can be measured.
Consider the voltage changes produced by a two-di-mensional model in which the body serves as a volume con-ductor and the heart generates a collection of changingdipoles (Fig. 13.10). An electrocardiographic recorder (avoltmeter) is connected between points A and B (lead I, seebelow). By convention, when point A is positive relative topoint B, the ECG is deflected upward, and when B is posi-tive relative to A, downward deflection results. The blackarrows show (in two dimensions) the direction of the netdipole resulting from the many individual dipoles present atany one time. The lengths of the arrows are proportional tothe magnitude (voltage) of the net dipole, which is relatedto the mass of myocardium generating the net dipole. Thecolored arrows show the magnitude of the dipole compo-nent that is parallel to the line between points A and B (therecorder electrodes); this component determines the volt-age that will be recorded.
The P Wave and Atrial Depolarization. Atrial excitationresults from a wave of depolarization that originates in theSA node and spreads over the atria, as indicated in panel 1of Figure 13.10. The net dipole generated by this excitationhas a magnitude proportional to the mass of the atrial mus-cle involved and a direction indicated by the solid arrow.The head of the arrow points toward the positive end of thedipole, where the atrial muscle is not yet depolarized. Thenegative end of the dipole is located at the tail of the arrow,where depolarization has already occurred. Point A is,therefore, positive relative to point B, and there will be anupward deflection of the ECG as determined by the mag-nitude and direction of the dipole. Once the atria are com-pletely depolarized, no voltage difference exists between Aand B, and the voltage recording returns to 0. The voltagechange associated with atrial excitation appears on theECG as the P wave.
The PR Segment and Atrioventricular Conduction. Af-ter the P wave, the ECG returns to the baseline present be-fore the P wave. The ECG is said to be isoelectric whenthere is no deflection from the baseline established beforethe P wave. During this time, the wave of depolarizationmoves slowly through the AV node, the AV bundle, thebundle branches, and the Purkinje system. The dipoles cre-ated by depolarization of these structures are too small toproduce a deflection on the ECG. The isoelectric periodbetween the end of the P wave and the beginning of theQRS complex, which signals ventricular depolarization iscalled the PR segment. The P wave plus the PR segment isthe PR interval. The duration of the PR interval is usuallytaken as an index of AV conduction time.
The QRS Complex and Ventricular Depolarization. Thedepolarization wave emerges from the AV node and travelsalong the AV bundle (bundle of His), bundle branches, andPurkinje system; these tracts extend down the interventricu-lar septum. The net dipole that results from the initial depo-larization of the septum is shown in panel 2 of Figure 13.10.Point B is positive relative to point A because the left side ofthe septum depolarizes before the right side. The smalldownward deflection produced on the ECG is the Q wave.The normal Q wave is often so small that it is not apparent.
k
Cardiac dipoles. Partially depolarized or re-polarized myocardium creates a dipole. Arrows
show the direction of depolarization (or repolarization). Dipolesare present only when myocardium is undergoing depolarizationor repolarization.
FIGURE 13.9

The wave of depolarization spreads via the Purkinje sys-tem across the inside surface of the free walls of the ventri-cles. Depolarization of free wall ventricular muscle pro-ceeds from the innermost layers of muscle(subendocardium) to the outermost layers (subepicardium).Because the muscle mass of the left ventricle is muchgreater than that of the right ventricle, the net dipole dur-ing this phase has the direction indicated in panel 3. Thedeflection of the ECG is upward because point A is positiverelative to point B, and it is large because of the great massof tissue involved. This upward deflection is the R wave.
The last portions of the ventricle to depolarize generatea net dipole with the direction shown in panel 4. Point B ispositive compared with point A, and the deflection on theECG is downward. This final deflection is the S wave. TheECG tracing returns to baseline as all of the ventricularmuscle becomes depolarized and all dipoles associated withventricular depolarization disappear. The Q, R, and Swaves together are known as the QRS complex and showthe progression of ventricular muscle depolarization. The
duration of the QRS complex is roughly equivalent to theduration of the P wave, despite the much greater mass ofmuscle of the ventricles. The relatively brief duration of theQRS complex is the result of the rapid, synchronous exci-tation of the ventricles.
The ST Segment and Phase 2 of the Ventricular Action Po-tential. The ST segment is the period between the end ofthe S wave and the beginning of the T wave. The ST seg-ment is normally isoelectric, or nearly so. This indicates thatno dipoles large enough to influence the ECG exist becauseall ventricular muscle is depolarized; that is, the action po-tentials of all ventricular cells are in phase 2 (Fig. 13.11).
The T Wave and Ventricular Repolarization. Repolariza-tion, like depolarization, generates a dipole because thevoltage of the depolarized area is different from that of therepolarized areas. The dipole associated with atrial repolar-ization does not appear as a separate deflection on the ECGbecause it generates a very low voltage and because it is
CHAPTER 13 The Electrical Activity of the Heart 227
B A
1
B A
2
B A
3
P
SA
AV
-+
Q
-+
R
Q
-
+
S
R
4
B A B
5
A
S
T
-
+ -
+
B AR
TP
QS
The sequence of major dipoles giving rise
to ECG waveforms. The black arrows arevectors that represent the magnitude and direction of a major di-pole. The magnitude is proportional to the mass of myocardiuminvolved. The direction is determined by the orientation of depo-larized and polarized regions of the myocardium. The verticaldashed lines project the vector onto the A-B coordinate (lead I); itis this component of the vector that is sensed and recorded (col-ored arrow). In panel 5, the tail of the vector (black arrow) shows
FIGURE 13.10 the yet-to-be-repolarized region of the myocardium (negative)and the head points to the repolarized region (positive). The lastareas of the ventricles to depolarize are the first to repolarize, i.e.,repolarization appears to proceed in a direction opposite to that ofdepolarization. The projection of the vector (colored arrow) forrepolarization points to the more positive electrode (A) as op-posed to the less positive electrode (B), and so an upward deflec-tion is recorded on this lead.

228 PART IV BLOOD AND CARDIOVASCULAR PHYSIOLOGY
masked by the much larger QRS complex that is present atthe same time.
Ventricular repolarization is not as orderly as ventriculardepolarization. The duration of ventricular action poten-tials is longer in subendocardial myocardium than in
subepicardial myocardium. The longer duration of suben-docardial action potentials means that even though suben-docardial cells were the first to depolarize, they are the lastto repolarize. Because subepicardial cells repolarize first,the subepicardium is positive relative to the subendo-cardium (see Fig. 13.9). That is, the polarity of the net di-pole of repolarization is the same as the polarity of the di-pole of depolarization. This results in an upward deflectionbecause, as in depolarization, point A is positive with re-spect to point B. This deflection is the T wave (see panel 5,Fig. 13.10). The T wave has a longer duration than the QRScomplex because repolarization does not proceed as a syn-chronized, propagated wave. Instead, the timing of repo-larization is a function of properties of individual cells, suchas numbers of particular K� channels.
The QT Interval. The QT interval is the time from the be-ginning of the QRS complex to the end of the T wave. If ven-tricular action potential and QT interval are compared, theQRS complex corresponds to depolarization, the ST segmentto the plateau, and the T wave to repolarization (see Fig.13.11). The relationship between a single ventricular actionpotential and the events of the QT interval are approximatebecause the events of the QT interval represent the combinedinfluence of all of the ventricular action potentials.
The QT interval measures the total duration of ventric-ular activation. If ventricular repolarization is delayed, theQT interval is prolonged. Because delayed repolarization isassociated with genesis of ventricular arrhythmias, this isclinically significant (see Clinical Focus Box 13.1).
ECG Leads Give the Voltages Measured
Between Different Sites on the Body
An electrocardiographic lead is the pair of electrical conductorsused to detect cardiac potential differences. An ECG lead isalso used to refer to the record of potential differences madeby the ECG machine. Bipolar leads give the potential differ-ence between two electrodes placed at different sites. Elec-
0 0.2 0.4 0.6
Membranepotential
mV
+20
0
-20
-40
-60
-80
-100
+1.0
+0.5
0
-0.5
mV
PT
R
S
Q
ECG
PR interval QRS ST segment
Sec
The timing of the ventricular membrane po-
tential and the ECG. Note that the ST seg-ment occurs during the plateau of the action potential.
FIGURE 13.11
CLINICAL FOCUS BOX 13.1
Long QT Syndrome
Some families have a rare inherited abnormality calledcongenital long QT syndrome (LQTS). Individuals withLQTS are often discovered because the individual or a fam-ily member presents to a physician with episodes of syn-cope (fainting) or because an otherwise healthy persondies suddenly and an alert physician suggests that theirclose relatives get an ECG. The ECG of affected individualsreveals either a long, irregular T wave, a prolonged STsegment, or both. Their hearts have delayed repolariza-tion, which prolongs the ventricular action potential. In ad-dition, when repolarization does occur, the freshly repolar-ized myocardium is subject to sudden, earlydepolarizations, called afterdepolarizations. These oc-cur because the membrane potential in a small region ofmyocardium begins to depolarize before it has stabilized atthe resting value. Afterdepolarizations may disrupt thenormal, synchronized pattern of depolarization, and theventricles may begin to depolarize in a chaotic pattern
called ventricular fibrillation. With ventricular fibrilla-tion, there is no synchronized contraction of ventricularmuscle and the heart cannot pump the blood. Arterial pres-sure drops, blood flow to the brain and other parts of thebody ceases, and sudden death occurs.
A single mutation of one of at least four genes, each ofwhich codes for a particular cardiac muscle ion channel,causes LQTS. Mutations of three potassium channels havebeen discovered. The mutations decrease their function,decreasing potassium current and, thereby, increasing thetendency of the membrane to depolarize. A mutation of thesodium channel has also been found in some patients withLQTS. This mutation increases the sodium channel func-tion, increasing sodium current and the tendency of themembrane to depolarize.
Individuals with congenital LQTS may be children oradults when the abnormality is identified. It is now appar-ent that at least one cause of sudden infant death syn-drome (SIDS) involves a form of LQTS.

trodes of the traditional bipolar limb leads are placed on theleft arm, right arm, and left leg (Fig. 13.12). The potentialdifferences between each combination of two of these elec-trodes give leads I, II, and III. By convention, the left arm inlead I is the positive pole, and the left leg is the positive polein leads II and III. A unipolar lead is the pair of electrical con-ductors giving the potential difference between an exploringelectrode and a reference input, sometimes called the indif-ferent electrode. The reference input comes from a combi-nation of electrodes at different sites, which is supposed togive roughly zero potential throughout excitation of theheart. Assuming this to be the case, the recorded electricalactivity is the result of the influence of cardiac electrical ac-tivity on the exploring electrode. By convention, when theexploring electrode is positive relative to the reference input,an upward deflection is recorded.
The exploring electrode for the precordial or chestleads is the single electrode placed on the anterior and leftlateral chest wall. For the chest leads, the reference input isobtained by connecting the three limb electrodes (Fig.13.13). The observed ECGs recorded from the chest leadsare each the result of voltage changes at a specified pointon the surface of the chest. Unipolar chest leads are desig-nated V1 to V6 and are placed over the areas of the chest
shown in Figure 13.13. The generation of the QRS com-plex in the chest leads can be explained in a way similar tothat for lead I.
The exploratory electrode for an augmented limb leadis an electrode on a single limb. The reference input is thetwo other limb electrodes connected together. Lead aVRgives the potential difference between the right arm (ex-ploring electrode) and the combination of the left arm andthe left leg (reference). Lead aVL gives the potential differ-ence between the left arm and the combination of the rightarm and left leg. Lead aVF gives the potential difference be-tween the left leg and the combination of the left arm andright arm.
A standard 12-lead ECG, including six limb leads and sixchest leads, is shown in Figure 13.14. The ECG is calibratedso that two dark horizontal lines (1 cm) represent 1 mV,and five dark vertical lines represent 1 second. This meansthat one light vertical line represents 0.04 sec.
The ECG Provides Information About Cardiac
Dipoles as Vectors
Cardiac dipoles are vectors with both magnitude and di-rection. The net vector produced by all cardiac dipoles at agiven time can be determined from the ECG. The directionof the vectors can be determined in the frontal and hori-zontal planes of the body.
CHAPTER 13 The Electrical Activity of the Heart 229
+_
+_ +_
I
II III
+
+
+
_
_
_
Einthoven triangle. Einthoven codified theanalysis of electrical activity of the heart by
proposing that certain conventions be followed. The heart is con-sidered to be at the center of a triangle, each corner of whichserves as the location for an electrode for two leads to the ECGrecorder. The three resulting leads are I, II, and III. By conven-tion, one electrode causes an upward deflection on the recorderwhen it is under the influence of a positive dipole relative to theother electrode.
FIGURE 13.12
+_
V1 V3V4
V5 V6
V2
Unipolar chest leads. V1 is just to the right ofthe sternum in the fourth intercostal space. V2
is just to the left of the sternum in the fourth interspace. V4 is inthe fifth interspace in the midclavicular line. V3 is midway be-tween V2 and V4. V5 is in the fifth interspace in the anterior axil-lary line. V6 is in the fifth interspace in the midaxillary line. Thethree limb leads are combined to give the reference voltage (zero)for the unipolar chest lead (V).
FIGURE 13.13

230 PART IV BLOOD AND CARDIOVASCULAR PHYSIOLOGY
The bipolar limb leads (leads I, II, and III) and the aug-mented limb leads (aVR, aVL, and aVF) provide informa-tion about the electrical activity of the heart as observed inthe frontal plane. As we have seen, lead I is the record ofpotential differences between the left and right arms. Itrecords only the component of the electrical vector that isparallel to its axis. Lead I can be symbolized by a horizon-tal line (axis) going through the center of the chest (Fig.13.15A) in the direction of right arm to left arm. Likewise,lead II can be symbolized by a 60� line drawn through themiddle of the chest in the direction of right arm to left leg.The same type of representation can be done for lead IIIand for the augmented limb leads. The positive ends of theleads are shown by the arrowheads (see Fig. 13.15A). Thediagram that results (see Fig. 13.15A) is called the hexaxialreference system.
A net cardiac dipole with its positive charge directed to-
ward the positive end of the axis of a lead results in therecording of an upward deflection. A net cardiac dipole withits positive charge directed toward the negative end of theaxis of a lead results in a downward deflection. A net cardiacdipole with its positive charge directed at a right angle to theaxis of a lead results in no deflection. The hexaxial referencesystem can be used to predict the influence of a cardiac di-pole on any of the six leads in the frontal plane. As we willsee, this system is useful in understanding changes in theleads of the ECG associated with different diseases.
The unipolar chest leads provide information about car-diac dipoles generated in the horizontal plane (Figure13.15B). Each chest lead can be represented as having anaxis coming from the center of the chest to the site of theexploring electrode in the horizontal plane. The deflec-tions recorded in each chest lead can be understood interms of this axial system.
I
II
III
aVR
aVL
aVF
V4
V5
V6
I
II
III
aVR
aVL
aVF
V4
V5
V6
V1
V2
V3
V1
V2
V3
Standard 12-lead ECG. Six limb leads and six chest leads are shown. Two dark horizon-tal lines (10 mm) are calibrated to be 1 mV. Dark vertical lines represent 0.2 sec.
FIGURE 13.14
-90-60
-30
-120
+90+60
+30
+120
+150 +30+150
-150
0+180_+180_
Superior
Inferior
Right LeftI
IIIII
aVR aVL
aVF 30
60
0
Posterior
Anterior
Right Left
V1 V2 V3V4
V5
V6
75
A B
Hexaxial reference system. A, The limb leadsgive information on cardiac dipole vectors in
FIGURE 13.15 the frontal plane. B, Chest leads are influenced by dipole vectorsin the horizontal plane.

The Mean QRS Electrical Axis Is Determined
From the Limb Leads
As explained above, changes in the magnitude and directionof the cardiac dipole will cause changes in a given ECG lead,as predicted by the axial reference system. By examining thelimb leads, the observer can determine the mean electricalaxis during ventricular depolarization. One approach in-volves the use of Einthoven’s triangle. Einthoven’s triangle isan equilateral triangle with each side representing the axis ofone of the bipolar limb leads (Fig. 13.16). The net magnitudeof the QRS complex of any two of the three leads is meas-ured and plotted on the appropriate axis. A perpendicular isdropped from each of the plotted points. A vector drawn be-tween the center of the triangle and the intersection of thetwo perpendiculars gives the mean electrical axis. In this ex-ample, the data taken from the ECG in Figure 13.14 give amean electrical axis of 3 degrees.
A second approach employs the hexaxial reference sys-tem (see Fig. 13.15A). First, the six limb leads are inspectedto find the one in which the net QRS complex deflection isclosest to zero. As discussed earlier, when the cardiac di-pole is perpendicular to a particular lead, the net deflectionis zero. Once the net QRS deflection closest to zero is iden-tified, it follows that the mean electrical axis is perpendicu-lar to that lead. The hexaxial reference system can be con-sulted to determine the angle of that axis. In Figure 13.14,the lead in which the net QRS deflection is closest to zerois lead aVF (the bipolar limb leads and lead aVF are en-larged in Figure 13.16). Lead I is perpendicular to the axisof lead aVF (see Fig. 13.15A). Because the QRS complex isupward in lead I, the mean electrical axis points to the leftarm and is estimated to be about 0 degrees.
The mean QRS electrical axis is influenced by (a) theposition of the heart in the chest, (b) the properties of thecardiac conduction system, and (c) the excitation and re-polarization properties of the ventricular myocardium. Be-cause the last two of these influences are most significant,the mean QRS electrical axis can provide valuable informa-tion about a variety of cardiac diseases.
The ECG Permits the Detection and Diagnosis of
Irregularities in Heart Rate and Rhythm
The ECG provides information about the rate and rhythmof excitation, as well as the pattern of conduction of excita-tion throughout the heart. The following illustrations ofcardiac rate and rhythm irregularities are not comprehen-sive; they were chosen to describe basic physiological prin-ciples. Disorders of cardiac rate and rhythm are referred toas arrhythmias.
Figure 13.14 shows the standard 12-lead ECG from anindividual with normal sinus rhythm. We see that the Pwave is always followed by a QRS complex of uniformshape and size. The PR interval (beginning of the P wave tothe beginning of the QRS complex) is 0.16 sec (normal,0.10 to 0.20 sec). This measurement indicates that the con-duction velocity of the action potential from the SA nodeto the ventricular muscle is normal. The average time be-tween R waves (successive heart beats) is about 0.84 sec,making the heart rate approximately 71 beats/min.
Figure 13.17A shows respiratory sinus arrhythmia, anincrease in the heart rate with inspiration and a decreasewith expiration. The presence of a P wave before each QRScomplex indicates that these beats originate in the SAnode. Intervals between successive R waves of 1.08, 0.88,0.88, 0.80, 0.66, and 0.66 seconds correspond to heart ratesof 56, 68, 68, 75, 91, and 91 beats/min. The interval be-tween the beginning of the P wave and the end of the Twave is uniform, and the change in the interval betweenbeats is primarily accounted for by the variation in time be-tween the end of the T wave and the beginning of the Pwave. Although the heart rate changes, the interval duringwhich electrical activation of the atria and ventricles occursdoes not change nearly as much as the interval betweenbeats. Respiratory sinus arrhythmia is caused by cyclicchanges in sympathetic and parasympathetic neural activ-ity to the SA node that accompany respiration. It is ob-served in individuals with healthy hearts.
Figure 13.17B shows an ECG during excessive stimula-tion of the parasympathetic nerves. The stimulation re-leases ACh from nerve endings in the SA and AV nodes;ACh suppresses the pacemaker activity, slows the heart
CHAPTER 13 The Electrical Activity of the Heart 231
Lead I
Lead II Lead III
__
++
+_
0
00 00
I II
III aVF
+9 mm +5 mm
-4 mm
RA LA
LL
-5-10
+5
+10
+5 +10
Mean QRS electrical axis. This axis can beestimated by using Einthoven’s triangle and the
net voltage of the QRS complex in any two of the bipolar limbleads. It can also be estimated by inspection of the six limb leads(see text for details). ECG tracings are from Figure 13.14.
FIGURE 13.16

232 PART IV BLOOD AND CARDIOVASCULAR PHYSIOLOGY
rate, and increases the distance between P waves. Thefourth and fifth QRS complexes are not preceded by Pwaves. When a QRS complex is recorded without a pre-ceding P wave, it reflects the fact that ventricular excitationhas occurred without a preceding atrial contraction, whichmeans that the ventricles were excited by an impulse thatoriginated below the atria. The normal configuration of theQRS complex suggests that the new pacemaker was in theAV node or bundle of His and that ventricular excitationproceeded normally from that point. This is called junc-tional escape.
The ECG in Figure 13.17C is from a patient with atrialfibrillation. In this condition, atrial systole does not occurbecause the atria are excited by many chaotic waves of de-polarization. The AV node conducts excitation whenever itis not refractory and a wave of atrial excitation reaches it.Unless there are other abnormalities, conduction throughthe AV node and ventricles is normal and the resulting QRScomplex is normal. The ECG shows QRS complexes thatare not preceded by P waves. The ventricular rate is usuallyrapid and irregular. Atrial fibrillation is associated with nu-
merous disease states, such as cardiomyopathy, pericarditis,hypertension, and hyperthyroidism, but it sometimes oc-curs in otherwise normal individuals.
The ECG in Figure 13.17D shows a premature ventric-ular complex (PVC). The first three QRS complexes arepreceded by P waves; then after the T wave of the thirdQRS complex, a QRS complex of increased voltage andlonger duration occurs. This premature complex is not pre-ceded by a P wave and is followed by a pause before thenext normal P wave and QRS complex. The premature ven-tricular excitation is initiated by an ectopic focus, an areaof pacemaker activity in other than the SA node. In panelD, the focus is probably in the Purkinje system or ventricu-lar muscle, where an aberrant pacemaker reaches thresholdbefore being depolarized by the normal wave of excitation.Once the ectopic focus triggers an action potential, the ex-citation is propagated over the ventricles. The abnormalpattern of excitation accounts for the greater voltage,change of mean electrical axis, and longer duration (ineffi-cient conduction) of the QRS complex. Although the ab-normal wave of excitation reached the AV node, retrograde
A
B
C
D
E
ECGs (lead II) showing abnormal rhythms.
A, Respiratory sinus arrhythmia. B, Sinus arrestFIGURE 13.17 with vagal escape. C, Atrial fibrillation. D, Premature ventricular
complex. E, Complete atrioventricular block.

conduction usually dies out in the AV node. The next nor-mal atrial excitation (P wave) occurs but is hidden by theinverted T wave associated with the abnormal QRS com-plex. This normal wave of atrial excitation does not resultin ventricular excitation. Ventricular excitation does notoccur because, when the impulse arrives, a portion of theAV node is still refractory following excitation by the pre-mature complex. As a consequence, the next “scheduled”ventricular beat is missed. A prolonged interval following apremature ventricular beat is the compensatory pause.
Premature beats can also arise in the atria. In this case,the P wave is abnormal but the QRS complex is normal.Premature beats are often called extrasystoles, frequently amisnomer because there is no “extra” beat. However, insome cases, the premature beat is interpolated between twonormal beats, and the premature beat is indeed “extra.”
In Figure 13.17E, both P waves and QRS complexes arepresent, but their timing is independent of each other. Thisis complete atrioventricular block in which the AV nodefails to conduct impulses from the atria to the ventricles.Because the AV node is the only electrical connection be-tween these areas, the pacemaker activities of the two be-come entirely independent. In this example, the distancebetween P waves is about 0.8 sec, giving an atrial rate of 75beats/min. The distance between R waves averages 1.2 sec,giving a ventricular rate of 50 beats/min. The atrial pace-maker is probably in the SA node, and the ventricular pace-maker is probably in a lower portion of the AV node orbundle of His.
AV block is not always complete. Sometimes the PR in-terval is lengthened, but all atrial excitations are eventuallyconducted to the ventricles. This is first-degree atrioven-tricular block. When some, but not all, of the atrial excita-
tions are conducted by the AV node, it is second-degreeatrioventricular block. If atrial excitation never reaches theventricles, as in the example in Figure 13.17E, it is third-de-gree (complete) atrioventricular block.
The ECG Provides Three Types of Information
About the Ventricular Myocardium
The ECG provides information about the pattern of excita-tion of the ventricles, changes in the mass of electrically ac-tive ventricular myocardium, and abnormal dipoles result-ing from injury to the ventricular myocardium. It providesno direct information about the mechanical effectiveness ofthe heart; other tests are used to study the efficiency of theheart as a pump (see Chapter 14).
The Pattern of Ventricular Excitation. Disease or injurycan affect the pattern of ventricular depolarization and pro-duce an abnormality in the QRS complex. Figure 13.18shows a normal QRS complex (Fig. 13.18A) and two exam-ples of complexes that have been altered by impaired con-duction. In Figure 13.18B, the AV bundle branch to theright side of the heart is not conducting (i.e., there is rightbundle-branch block), and depolarization of right-sidedmyocardium, therefore, depends on delayed electrical ac-tivity coming from the normally depolarized left side of theheart. The resulting QRS complex has an abnormal shapebecause of aberrant electrical conduction and is prolongedbecause of the increased time necessary to fully depolarizethe heart. In Figure 13.18C, the AV bundle branch to theleft side of the heart is not conducting (i.e., there is leftbundle-branch block), also resulting in a wide, deformedQRS complex.
CHAPTER 13 The Electrical Activity of the Heart 233
ECGs (leads V2 and V6) of patients with
various conditions. A, patient with normalFIGURE 13.18 QRS complex. B, patient with right bundle-branch block. C, pa-
tient with left bundle-branch block.

234 PART IV BLOOD AND CARDIOVASCULAR PHYSIOLOGY
Changes in the Mass of Electrically Active Ventricular My-ocardium. The recording in Figure 13.19 shows the ef-fect of right ventricular enlargement on the ECG. The in-creased mass of right ventricular muscle changes thedirection of the major dipole during ventricular depolariza-tion, resulting in large R waves in lead V1. The large Swaves in lead I and the large R waves in lead aVF are alsocharacteristic of a shift in the dipole of ventricular depolar-ization to the right. This illustrates how a change in themass of excited tissue can affect the amplitude and direc-tion of the QRS complex.
Figure 13.20 shows the effects of atrial hypertrophy onthe P waves of lead III (see Fig. 13.20A) and the alteredQRS complexes in leads V1 and V5 associated with left ven-
tricular hypertrophy (see Fig. 13.20B). Left ventricular hy-pertrophy rotates the direction of the major dipole associ-ated with ventricular depolarization to the left, causinglarge S waves in V1 and large R waves in V5.
Abnormal Dipoles Resulting From Ventricular Myocar-dial Injury. Myocardial ischemia is present when a por-tion of the ventricular myocardium fails to receive sufficientblood flow to meet its metabolic needs. In this case, thesupply of ATP may decrease below the level required tomaintain the active transport of ions across the cell mem-brane. The resulting alterations in the membrane potentialin the ischemic region can affect the ECG. Normally, theECG is at baseline (zero voltage) during• The interval between the completion of the T wave and
the onset of the P wave (the TP interval), during whichall cardiac cells are at their resting membrane potential
• The ST segment, during which depolarization is com-plete and all ventricular cells are at the plateau (phase 2)of the action potential
Right ventricular hypertrophy. Leads I, aVF,and V1 of a patient are shown.
FIGURE 13.19
Effects of A, Large P waves (lead III) causedby atrial hypertrophy. B, Altered QRS complex
(leads V1 and V5) produced by left ventricular hypertrophy.
FIGURE 13.20
Electrocardiogram changes in myocardial
injury. A, Dark shading depicts depolarizedventricular tissue. ST segment elevation can occur with myocar-dial injury. The apparent zero baseline of the ECG before depo-larization is below zero because of partial depolarization of theinjured area (shading). After depolarization (during the action po-
FIGURE 13.21 tential plateau), all areas are depolarized and true zero is recorded.Because zero baseline is set arbitrarily (on the ECG recorder), adepressed diastolic baseline (TP segment) and an elevated ST seg-ment cannot be distinguished. Regardless of the mechanism, thisis referred to as an elevated ST segment. B, The ECG (lead V1) ofa patient with acute myocardial infarction.

With myocardial ischemia, the cells in the ischemic re-gion partially depolarize to a lower resting membrane po-tential because of a lowering of the potassium ion concen-tration gradient, although they are still capable of actionpotentials. As a consequence, a dipole is present during theTP interval in injured hearts because of the voltage differ-ence between normal (polarized) and abnormal (partiallypolarized) tissue. However, no dipole is present during the
ST interval because depolarization is uniform and completein both injured and normal tissue (this is the plateau periodof ventricular action potentials). Because the ECG is de-signed so that the TP interval is recorded as zero voltage,the true zero during the ST interval is recorded as a positiveor negative deflection (Fig. 13.21). These deflections dur-ing the ST interval are of major clinical utility in the diag-nosis of cardiac injury.
CHAPTER 13 The Electrical Activity of the Heart 235
DIRECTIONS: Each of the numbereditems or incomplete statements in thissection is followed by answers or bycompletions of the statement. Select theONE lettered answer or completion that isBEST in each case.
1. Rapid depolarization (phase 0) of theaction potential of ventricular muscleresults from opening of(A) Voltage-gated Ca2� channels(B) Voltage-gated Na� channels(C) Acetylcholine-activated K�
channels(D) Inward rectifying K� channels(E) ATP-sensitive K� channels
2. A 72-year-old man with an atrial rateof 80 beats/min develops third-degree(complete) AV block. A pacemaker sitelocated in the AV node below theregion of the block triggers ventricularactivity, but at a rate of only 40beats/min. What would be observed?(A) One P wave for each QRScomplex(B) An inverted T wave(C) A shortened PR interval(D) A normal QRS complex
3. To ensure an adequate heart rate, atemporary electronic pacemaker lead isattached to the apex of the rightventricle, and the heart is paced byelectrically stimulating this site at arate of 70 beats/min. When the ECGduring pacing is compared with theECG before pacing, there would be a(A) Shortened PR interval(B) QRS complex similar to that seenwith left bundle-branch block(C) QRS complex of shortenedduration(D) P wave following each QRScomplex(E) QRS complex similar to that seenwith right bundle-branch block
4. What is most responsible for phase 0of a cardiac nodal cell?(A) Voltage-gated Na� channels(B) Acetylcholine-activated K�
channels(C) Inward rectifying K� channels(D) Voltage-gated Ca2� channels
(E) Pacemaker channels5. Atrial repolarization normally occurs
during the(A) P wave(B) QRS complex(C) ST segment(D) T wave(E) Isoelectric period
6. The P wave is normally positive in leadI of the ECG because(A) Depolarization of the ventriclesproceeds from subendocardium tosubepicardium(B) When the ECG electrode attachedto the right arm is positive relative tothe electrode attached to the left arm,an upward deflection is recorded(C) AV nodal conduction is slowerthan atrial conduction(D) Depolarization of the atriaproceeds from right to left(E) When cardiac cells are depolarized,the inside of the cells is negativerelative to the outside of the cells
7. Stimulation of the sympathetic nervesto the normal heart(A) Increases duration of the TPinterval(B) Increases the duration of the PRinterval(C) Decreases the duration of the QTinterval(D) Leads to fewer P waves than QRScomplexes(E) Decreases the frequency of QRScomplexes
8. A drug that raises the heart rate from70 to 100 beats per minute could(A) Be an adrenergic receptorantagonist(B) Cause the opening ofacetylcholine-activated K� channels(C) Be a cholinergic receptor agonist(D) Be an adrenergic receptor agonist(E) Cause the closing of voltage-gatedCa2� channels
9. Excitation of the ventricles(A) Always leads to excitation of theatria(B) Results from the action ofnorepinephrine on ventricularmyocytes
(C) Proceeds from the subendocardiumto subepicardium(D) Is initiated during the plateau(phase 2) of the ventricular actionpotential(E) Results from pacemaker potentialsof ventricular cells
10.AV nodal cells(A) Exhibit action potentialscharacterized by rapid depolarization(phase 0)(B) Exhibit increased conductionvelocity when exposed toacetylcholine(C) Conduct impulses more slowlythan either atrial or ventricular cells(D) Are capable of pacemaker activityat an intrinsic rate of 100 beats/min(E) Exhibit slowed conduction velocitywhen exposed to norepinephrine
11.Stimulation of the parasympatheticnerves to the normal heart can leadto complete inhibition of the SAnode for several seconds. During thatperiod(A) P waves would become larger(B) There would be fewer T wavesthan QRS complexes(C) There would be fewer P wavesthan T waves(D) There would be fewer QRScomplexes than P waves(E) The shape of QRS complexeswould change
12.The R wave in lead I of the ECG(A) Is larger than normal with rightventricular hypertrophy(B) Reflects a net dipole associatedwith ventricular depolarization(C) Reflects a net dipole associatedwith ventricular repolarization(D) Is largest when the mean electricalaxis is directed perpendicular to a linedrawn between the two shoulders(E) Is associated with atrialdepolarization
13.The ST segment of the normal ECG(A) Occurs during a period when bothventricles are completely repolarized(B) Occurs when the major dipole isdirected from subendocardium tosubepicardium
R E V I E W Q U E S T I O N S
(continued)

236 PART IV BLOOD AND CARDIOVASCULAR PHYSIOLOGY
(C) Occurs during a period when bothventricles are completely depolarized(D) Is absent in lead I of the ECG(E) Occurs during depolarization ofthe Purkinje system
SUGGESTED READING
Fisch C. Electrocardiogram and mecha-nisms of arrhythmias. In: Podrid PJ,Kowley PR, eds. Cardiac Arrhythmia:Mechanisms, Diagnosis and Manage-
ment. Baltimore: Williams & Wilkins,1995.
Katz AM. Physiology of the Heart. 3rdEd. Philadelphia: Lippincott Williams &Wilkins, 2001.
Lauer MR, Sung RJ. Physiology of theconduction system. In: Podrid PJ, Kow-ley PR, eds. Cardiac Arrhythmia Mech-anisms, Diagnosis and Management.Baltimore: Williams & Wilkins, 1995.
Lilly LS. Pathophysiology of Heart Dis-
ease. 2nd Ed. Baltimore: Williams &Wilkins, 1998.
Mirvis DM, Goldberger AL. Electrocardio-graphy. In: Braunwald E, Zipes DP,Libby P, eds. Heart Disease. 6th Ed.Philadelphia: WB Saunders, 2001.
Rubart M, Zipes DP. Genesis of cardiac ar-rhythmias: Electrophysiological consid-erations. In: Braunwald E, Zipes DP,Libby P, eds. Heart Disease. 6th Ed.Philadelphia: WB Saunders, 2001.