13 - attijariwafabank.com · mr ismail el filali general audit mrs malika el younsi group legal...
TRANSCRIPT
1Attijariwafa bank Results at 30 June 2013
Attijariwafa bank as of June 30, 2013
Results13
Fin
anci
al C
omm
unic
atio
n
2013
Fina
ncia
l Inf
orm
atio
n an
d In
vest
or R
elat
ions
: Ib
tissa
m A
bouh
aria
em
ail :
i.ab
ouha
ria@
attij
ariw
afa.
com

Attijariwafa bank 12/31/2011 12/31/2012 06/30/2013
Price 350.1 313.0 327.9
P/B 2.59 x 2.04x 2.12x
PER 15.15 x 14.00x 15.02x
DY 2.43 % 2.88 % 2.74%
Number of Shares 192 995 960 201 243 086 203 527 226
Market capitalisation (in millions of dirhams) 67 568 62 989 66 737
› 15 578 Attijariwafa bank employees
› 2 424 Branches in Morocco
› 190 Branches in North Africa
› 56 Branches in Europe and the Middle East
› 286 Branches in West Africa
› 81 Branches in Central Africa
Shareholding structureas of June 2013
Attijariwafa bank key figures
Attijariwafa bank’s share price performance
Stock market indicators
Largest bank by market capitalisation in Morocco : MAD 66.7 bn as of June 30, 2013.
65
90
115
140
165
190
MASI ATTIJARIWAFA BANK
Base 100dec 08
2/24/10 9/22/10 4/20/11 11/16/11 6/13/12 1/9/13 12/31/08 7/29/09 8/7/13
AWB : -10.6%MASI : -15.1%
2011
2012
2013
AWB : +4.9%MASI : -4.9%
AWB : MASI :
-14.0%-12.9%
2009
AWB : +4.6%MASI: -8.7%
AWB : +50.7%MASI : +21.2%
2010SNI GroupLocal InstitutionsFree-float and othersGrupo SantanderAttijariwafa bank staff
47.8 %
28.6 %
5.3 %
13.8 %
4.5 %
3Attijariwafa bank Results at 30 June 2013
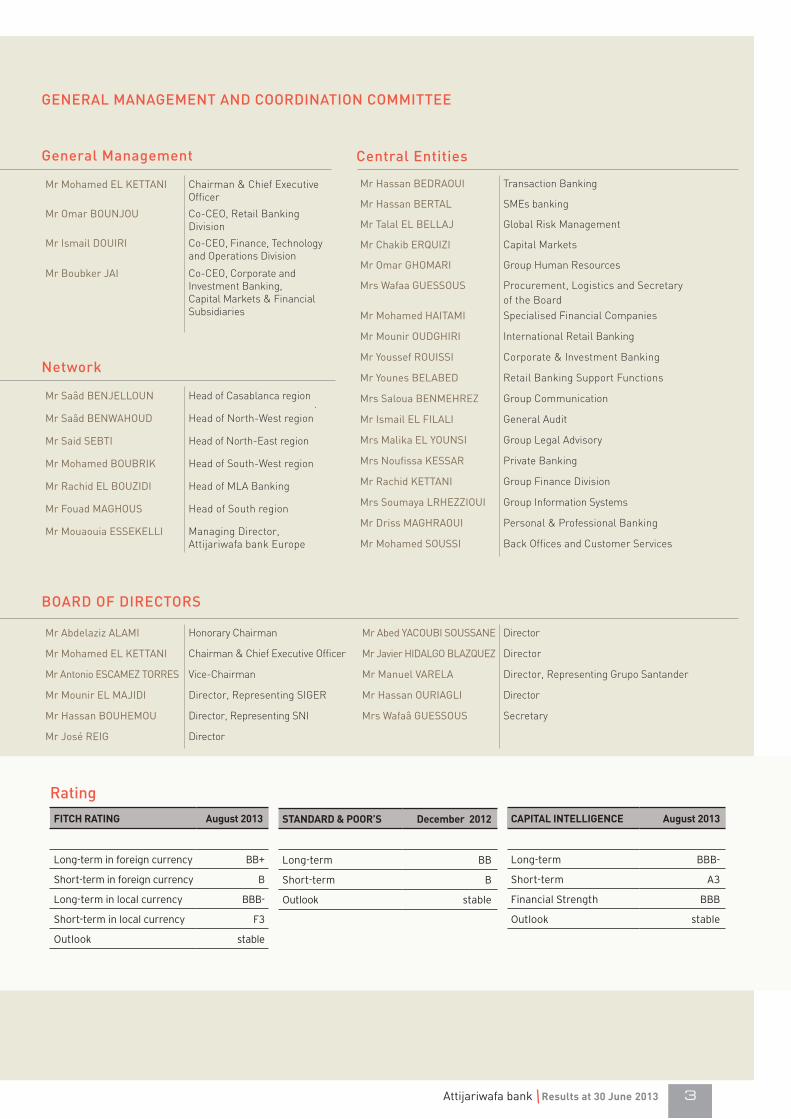
RatingFitch RAting August 2013
Long-term in foreign currency BB+
Short-term in foreign currency B
Long-term in local currency BBB-
Short-term in local currency F3
Outlook stable
cApitAl intelligence August 2013
Long-term BBB-
Short-term A3
Financial Strength BBB
Outlook stable
StAndARd & pooR’S december 2012
Long-term BB
Short-term B
Outlook stable
General Management
GENERAL MANAGEMENT AND COORDINATION COMMITTEE
Network
Central Entities
BOARD OF DIRECTORS
Mr Hassan BEdrAouI Transaction Banking
Mr Hassan BErtAl SMEs banking
Mr talal El BEllAj Global Risk Management
Mr Chakib ErquIzI Capital Markets
Mr omar GHoMArI Group Human Resources
Mrs Wafaa GuEssous Procurement, Logistics and Secretary of the Board
Mr Mohamed HAItAMI Specialised Financial Companies
Mr Mounir oudGHIrI International Retail Banking
Mr Youssef rouIssI Corporate & Investment Banking
Mr Younes BElABEd Retail Banking Support Functions
Mrs saloua BENMEHrEz Group Communication
Mr Ismail El FIlAlI General Audit
Mrs Malika El YouNsI Group Legal Advisory
Mrs Noufissa KEssAr Private Banking
Mr rachid KEttANI Group Finance Division
Mrs soumaya lrHEzzIouI Group Information Systems
Mr driss MAGHrAouI Personal & Professional Banking
Mr Mohamed soussI Back Offices and Customer Services
Mr Mohamed El KEttANI Chairman & Chief Executive Officer
Mr omar BouNjou Co-CEO, Retail Banking Division
Mr Ismail douIrI Co-CEO, Finance, Technology and Operations Division
Mr Boubker jAI Co-CEO, Corporate and Investment Banking, Capital Markets & Financial Subsidiaries
Mr saâd BENjEllouN Head of Casablanca region
Mr saâd BENWAHoud Head of North-West region
Mr said sEBtI Head of North-East region
Mr Mohamed BouBrIK Head of South-West region
Mr rachid El BouzIdI Head of MLA Banking
Mr Fouad MAGHous Head of South region
Mr Mouaouia EssEKEllI Managing Director, Attijariwafa bank Europe
Mr Abdelaziz AlAMI Honorary Chairman Mr Abed YACouBI soussANE Director
Mr Mohamed El KEttANI Chairman & Chief Executive Officer Mr javier HIdAlGo BlAzquEz Director
Mr Antonio EsCAMEz torrEs Vice-Chairman Mr Manuel VArElA Director, Representing Grupo Santander
Mr Mounir El MAjIdI Director, Representing SIGER Mr Hassan ourIAGlI Director
Mr Hassan BouHEMou Director, Representing SNI Mrs Wafaâ GuEssous Secretary
Mr josé rEIG Director
13
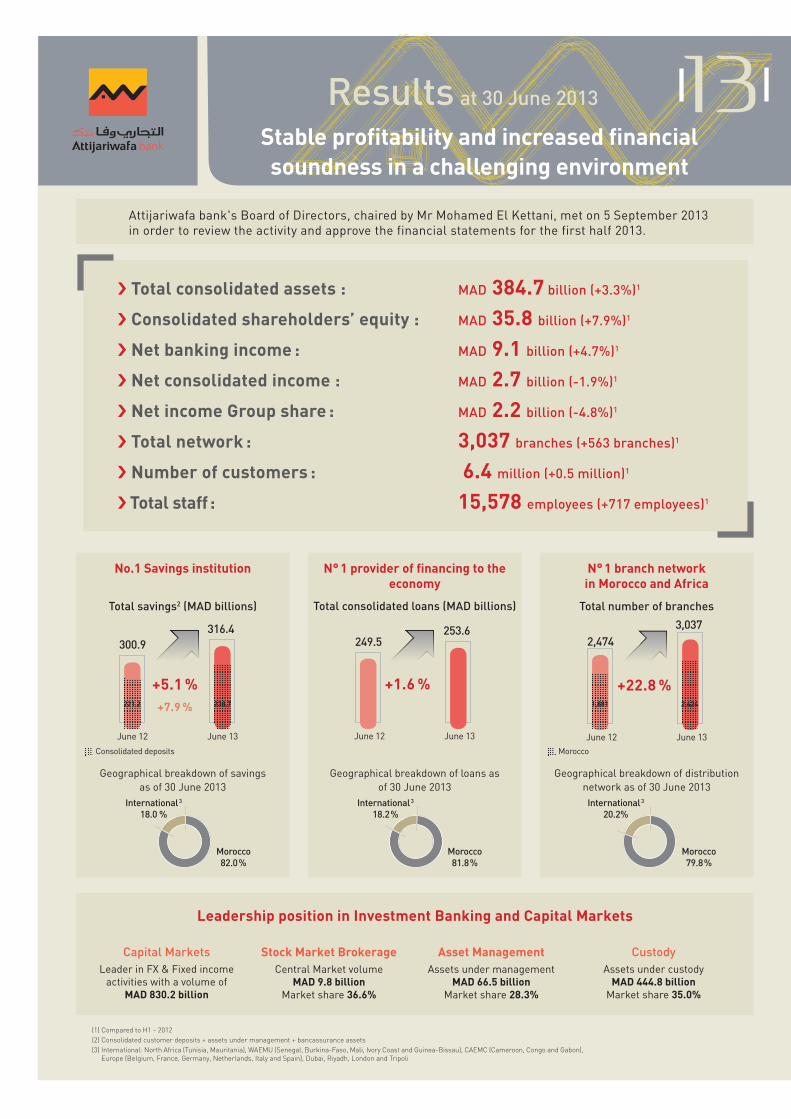
Attijariwafa bank's Board of directors, chaired by Mr Mohamed El Kettani, met on 5 september 2013 in order to review the activity and approve the financial statements for the first half 2013.
› total consolidated assets : MAD 384.7 billion (+3.3%)1
› consolidated shareholders’ equity : MAD 35.8 billion (+7.9%)1
› net banking income : MAD 9.1 billion (+4.7%)1
› net consolidated income : MAD 2.7 billion (-1.9%)1
› net income group share : MAD 2.2 billion (-4.8%)1
› total network : 3,037 branches (+563 branches)1
› number of customers : 6.4 million (+0.5 million)1
› total staff : 15,578 employees (+717 employees)1
leadership position in investment Banking and capital Markets
Capital Marketsleader in FX & Fixed income
activities with a volume of MAd 830.2 billion
Stock Market BrokerageCentral Market volume
MAd 9.8 billionMarket share 36.6%
CustodyAssets under custody
MAd 444.8 billionMarket share 35.0%
Asset ManagementAssets under management
MAd 66.5 billionMarket share 28.3%
Geographical breakdown of savingsas of 30 june 2013
Morocco 82.0 %
International 3
18.0 %
no.1 Savings institution
Total savings2 (MAD billions)
Geographical breakdown of loans as of 30 june 2013
Morocco 81.8 %
International 3
18.2 %
Total consolidated loans (MAD billions)
n° 1 provider of financing to the economy
249.5
june 12 june 13
+1.6 %
253.6
Geographical breakdown of distribution network as of 30 june 2013
Total number of branches
n° 1 branch networkin Morocco and Africa
2,474
june 12 june 13
+22.8 %
3,037
(1) Compared to H1 - 2012(2) Consolidated customer deposits + assets under management + bancassurance assets(3) International: North Africa (Tunisia, Mauritania), WAEMU (Senegal, Burkina-Faso, Mali, Ivory Coast and Guinea-Bissau), CAEMC (Cameroon, Congo and Gabon),
Europe (Belgium, France, Germany, Netherlands, Italy and Spain), Dubai, Riyadh, London and Tripoli
Morocco 79.8 %
International 3
20.2%
Morocco
1,881 2,424
300.9
june 12 june 13
+5.1 %+7.9 %
316.4
221.2 238.7
Consolidated deposits
Stable profitability and increased financial soundness in a challenging environment
Results at 30 June 2013
5Attijariwafa bank Results at 30 June 2013
Satisfactory business growth despite a challenging environmentIn first half 2013, Attijariwafa bank delivered solid achievements across all business activities despite a difficult environment characterised by slower economic growth (excluding the agricultural sector), bearish financial markets in Morocco and a higher cost of risk.
deposits rose by 7.9% to MAd 238.7 billion while loans increased 1.6% to MAd 253.6 billion.
As a result, net banking income grew by 4.7% to MAd 9.1 billion.
Gross operating income increased 4.6% to MAd 5.1 billion, thanks to a contained operating expenses growth (+4.9%, +3.6% excluding the impact from the capital increase reserved for employees in 2012)1.
Net income and net income Group share fell by 1.9% to MAd 2.7 billion and by 4.8% to MAd 2.2 billion respectively due to higher cost of risk.
A healthy business activity and continuously improved operational efficiency enabled the Group to maintain its profitability in line with the best international standards. roE and roA were 16.1% and 1.4% respectively despite a further strengthening in the Group's capitalization and conservative risk provisionning.
performance driven mainly by international Retail Banking and Specialised Finance companiesThe Bank in Morocco2: Increase in market share and growth of 5% in its contribution to net banking incomethe Bank in Morocco confirmed its commitment as the No.1 lender to the economy by delivering a higher growth than competitors. despite
increasing competition, deposits and loans market shares rose by 0.58 point and 0.51 point respectively in first half 2013. the Bank in Morocco’s contribution to consolidated net banking income totalled MAd 4.9 billion (+4.8% compared to H1 2012).
Specialised Finance Companies: Moderate growth but improved profitabilityIn first half 2013, the contribution from specialised Finance Companies to net banking income was MAd 1.1 billion (+2.7%) despite weaker industry growth. the contribution to net income Group share rose by 27.6% due to best-in-class expense and risk control.
these subsidiaries, with leading positioning in Morocco, have launched an ambitious strategic plan in order to expand in the group’s African markets.
International Retail Banking: Contribution to net banking income up 10% and contribution to net income Group share up 31%International retail Banking reported strong growth in first half 2013. Its contribution to consolidated net banking income rose by 10.4% to MAd 2.3 billion.
the contribution from International retail Banking to net income Group share soared by 31.2% to MAd 363.8 million benefiting from the normalization in Mali and the recovery in tunisia, senegal and Ivory Coast.
these results confirmed the relevance of Attijariwafa bank corporate strategy focused on regional development and geographical diversification.
Attijariwafa bank Group has continued to expand its network by signing an agreement
in May 2013 with the togolese authorities to acquire a 55% stake in Banque Internationale pour l’Afrique au togo (BIA-togo). the transaction is in the process of closing3.
Insurance: Contribution to net banking income declines by 4%
the Insurance business saw continued development in its life and Non-life segments despite the unfavourable environment marked by stock market under-performance and an increase in bond yields.
First half 2013 premiums was broadly unchanged compared to the same period last year.
Insurance’s contribution to net banking income was MAd 926.3 million, down 4.4%, due to a rise in the auto segment claims cost and the contraction of financial income.
As other business lines within the Group, Insurance took the first steps in its regional expansion with the effective launch of Attijari Assurance tunisie in May 2013.
Strengthened capitalizationAttijariwafa bank successfully increased its capital by MAd 685.2 million through optional conversion of 50% of its 2012 dividend (76% conversion ratio). It also issued a subordinated debt totalling MAd 1.25 billion.
these operations, in addition to a MAd 2.1 billion capital increase in 2012, will enable the Group to pursue its ambitious growth strategy in Morocco and overseas while complying immediately with future regulatory requirements under Basel 3.
The Board of Directors congratulated the Group’s entire staff for the first half 2013 results.
the Board of directorsCasablanca, 5 september 2013
(1) IFrs 2 -share-based payments(2) Banking in Morocco, Europe and in the offshore zone(3) BIA-togo is not included in the scope of consolidation at 30 june 2012
Attijariwafa bank’s consolidated financial statements have been prepared under International Financial Reporting Standards (IFRS) since first-half 2007 with the opening balance at 1 January 2006.
In its consolidated financial statements for the year ended 30 June 2013, the Attijariwafa bank Group has applied the obligatory principles and standards set out by the International Accounting Standards Board (IASB).
Consolidation principles:
Standard:The scope of consolidation is determined on the basis of what type of control (exclusive control, joint control or material influence) is exercised over the various overseas and domestic entities in which the Group has a direct or indirect interest.
The Group likewise consolidates legally independent entities specifically established for a restricted and well-defined purpose known as « special purpose entities », which are controlled by the credit institution, without there being any shareholder relationship between the entities.
The extent to which the Group exercises control will determine the consolidation method: fully consolidated for entities under the exclusive control of the Group as required by IFRS 10 “Consolidated Financial Statements” or under the equity method for associate companies or joint ventures as required by IAS 28 “Investments in Associates and Joint Ventures”.
Policies adopted by Attijariwafa bank:Attijariwafa bank includes entities in its scope of consolidation in which:
• It holds, directly or indirectly, at least 20% of the voting rights;
• The subsidiary’s consolidated figures satisfy one of the following criteria:- The subsidiary’s total assets exceed 0.5% of consolidated
total assets;- The subsidiary’s net assets exceed 0.5% of consolidated
net assets;- The subsidiary’s sales or banking income exceed 0.5% of
consolidated banking income.
Specialist mutual funds (OPCVM) are consolidated according to IFRS 10 which addresses the issue of consolidation of special purpose entities and in particular funds under exclusive control.
Those entities controlled or under exclusive control whose securities are held for a short period of time are excluded from the scope of consolidation.
Fixed assets:
Property, plant and equipment:
Standard:
Items of property plant and equipment are valued by entities using either the cost model or the revaluation model.
Cost modelUnder the cost model, assets are valued at cost less accumulated depreciation.
Revaluation modelOn being recognised as an asset, an item of property, plant and equipment, whose fair value may be accurately assessed, must be marked to market. Fair value is the value determined at the time the asset is marked to market less accumulated depreciation.
The sum-of-parts approach breaks down the items of property, plant and equipment into their most significant individual parts (constituents). They must be accounted for separately and systematically depreciated as a function of their estimated useful lives in such a way as to reflect the rate at which the related economic benefits are consumed.
Estimated useful life under IFRS is the length of time that a depreciable asset is expected to be usable.
The depreciable amount of an asset is the cost of the asset (or fair value) less its residual value.
Residual value is the value of the asset at the end of its estimated useful life, which takes into account the asset’s age and foreseeable condition.
Borrowing costs The IAS 23 standard entitled « Borrowing costs » does not allow to recognise immediately as expenses the cost of borrowing directly attributable to acquisition, construction or production of an eligible asset. All the costs of borrowing must be added into the expenses.
Policies adopted by Attijariwafa bank:The Group has opted to use the cost model. The fair value method may be used, however, without having to justify this choice, with an account under shareholders’ equity.
Attijariwafa bank has decided against using several depreciation schedules but a single depreciation schedule in the consolidated financial statements under IFRS standards.
Under the sum-of-parts approach, the Group has decided to include those components whose gross value is less than MAD 1000 thousand.- Historical cost (original cost) is broken down on the basis of
the breakdown of the current replacement cost as a function of technical data.
Residual value:
The residual value of each part is considered to be zero except in the case of land. Residual value is applied only to land (nonamortisable by nature), which is the only component to have an unlimited life.
Investment property:Standard:An investment property is a property which is held either to earn rental income or for capital appreciation or for both.
Accounting Standards and Principles applied by the Group
13Consolidated Accounts at 30 June 2013
FINANCIAL STATEMENTS

7Attijariwafa bank Results at 30 June 2013
An investment property generates cash flows in a very different way to the company’s other assets unlike the use of a building by its owner whose main purpose is to produce or provide goods and services.
An entity has the choice between:
The fair value method – if an entity opts for this treatment, then it must be applied to all buildings.
The cost model – an estimate of the fair value of investment properties must be recorded either in the balance sheet or in the notes to the financial statements.
It is only possible to move from the cost method to the fair value method.
Policies adopted by Attijariwafa bank:All buildings not used in ordinary activities are classified as investment property except for staff accommodation and buildings expected to be sold within a year.
The Group’s policy is to retain all buildings used in ordinary activities and those leased to companies outside the Group.
The historical cost method, modified by the sum-of-parts approach, is used to value investment properties. Information about fair value must be presented in the notes to the financial statements.
Intangible assets:
Standard:An intangible asset is a non-monetary asset which is identifiable and not physical in nature.
An intangible asset is deemed to be identifiable if it:• Is separable, that is to say, capable of being separated and sold,
transferred, licensed, rented, or exchanged, either individually or together with a related contract; or
• Arises from contractual or other legal rights, regardless of whether those rights are transferable or separable from the entity or from other rights and obligations.
Two valuation methods are possible:• the cost method;• the revaluation model. This treatment is possible if an active
market exists.
Amortisation of an intangible asset depends on its estimated useful life. An intangible asset with an unlimited useful life is not amortised but subject to impairment testing at least once a year at the end of the period. An intangible asset with a limited useful life is amortised over the life of the asset.
An intangible asset produced by the company for internal use is recognised if it is classified, from the R&D phase, as a fixed asset.
Policies adopted by Attijariwafa bank:Attijariwafa bank has decided against using several amortisation schedules but a single amortisation schedule in the consolidated financial statements under IFRS/IAS.
Acquisition costs not yet amortised as expenses at 1 January 2006 have been restated under shareholders’ equity.
Leasehold rights :
Leasehold rights recognised in the parent company financial statements are not amortised. In the consolidated financial statements, they are amortised using an appropriate method over their useful life.
Business goodwill:
Business goodwill recorded in the parent company financial statements of the different consolidated entities has been
reviewed to ensure that the way in which it is calculated is in accordance with IAS/IFRS.
Software:
The estimated useful life of software differs depending on the type of software (operating software or administrative software).
Amortisation schedules applied by each Group entity may vary from one entity to another by up to two years.
Valuation of software developed in-house:
Group Information Systems’ Management provides the necessary information to value software developed in-house. In the event that the valuation is not accurate, then the software cannot be recognised as an asset.
Transfer fees, commission and legal fees: These are recognised as expenses or at purchase cost depending on their value.
Separate amortisation schedules are used if there is a difference of more than MAD 1000K between parent company financial statements and IFRS statements.
Goodwill:
Standard:
Cost of a business combination:Business combinations are accounted for using the acquisition method according to which the acquisition cost is contingent consideration transferred in order to obtain control.
The acquirer must measure the acquisition cost as:
• The aggregate fair value, at the acquisition date, of assets acquired, liabilities incurred or assumed and equity instruments issued by the acquirer in consideration for control of the acquired company ;
• The other costs directly attributable to the acquisition are recognised through profit or loss in the year in which they are incurred.
The acquisition date is the date at which the acquirer obtains effective control of the acquired company.
Allocation of the cost of a business combination to the assets acquired and to the liabilities and contingent liabilities assumed:The acquirer must, at the date of acquisition, allocate the cost of a business combination by recognising the identifiable assets, liabilities and contingent liabilities of the acquiree that satisfy the recognition criteria at their respective fair values on that date.
Any difference between the cost of the business combination and the acquirer’s share of the net fair value of the identifiable assets, liabilities and contingent liabilities is recognised under goodwill.
Accounting for Goodwill:The acquirer must, at the date of acquisition, recognise the goodwill acquired in a business combination.
• Initial measurement : this goodwill must be initially measured at cost, namely the excess of the cost of the business combination over the acquirer’s share of the net fair value of the identifiable assets, liabilities and contingent liabilities.
• Subsequent measurement: following initial recognition, the acquirer must measure the goodwill acquired in a business combination at cost less cumulative impairment subsequent to annual impairment tests or when there is any indication of impairment to its carrying value.
If the share of the fair value of the assets, liabilities and contingent liabilities of the acquired entities exceeds the acquisition cost, negative goodwill is recognised immediately through profit or loss.
If initial recognition of a business combination can be determinedonly provisionally by the end of the reporting period in which the business combination takes place, the acquirer must account for the business combination using provisional values. The acquirer must recognise adjustments to provisional values relating to finalising the recognition within that financial period, beyond which time no adjustments are possible.
Policies adopted by Attijariwafa bank: • Option taken not to restate the existing goodwill at 31/12/05,
in accordance with the provisions of IFRS 1 “First-Time Adoption” ;
• Goodwill amortisation is discontinued when the asset has an indefinite life in accordance with amended IFRS 3 “Business combinations”;
• Regular impairment tests must be carried out to ensure that the carrying amount of goodwill is below the recoverable amount. If not, an impairment loss must be recognised;
• the Cash Generating Units mirror the segment reporting to be presented at Group level ; these are the banking business and the insurance business ;
• The recoverable amount is the higher of the unit’s value in use and its carrying amount less costs of disposal. This is used in impairment tests as required by IAS 36. If an impairment test reveals that the recoverable amount is less than the carrying amount, then the asset is written down by the excess of the carrying amount over its recoverable amount.
Inventories:
Standard:Inventories are assets:• Held for sale during the normal business cycle;• In the process of being produced for future sale;• In the form of raw materials or supplies consumed during the
production process or to provide services.
Inventories must be valued at the lower of cost or net realisable value.
Net realisable value is the estimated sales price in the normal course of business activity less• Estimated costs of completion;• Costs required for making the sale.
Policies adopted by Attijariwafa bank:Inventories are valued according to the weighted average unit cost method.
Leases:
Standard:A lease is an agreement by which the Lessor transfers to the Lessee for a specific period of time the right to use an asset in exchange for payment or a series of payments.
Distinction must be made between:• A finance lease, which is a contract by which almost all the
risks and benefits inherent in ownership of the asset are transferred to the lessee;
• An operating lease, which is any contract other than a finance lease.
Finance leases are financial instruments whose nominal value relates to the value of the property acquired/leased minus/plus fees paid/received and any other fees. The rate used in this case is the effective interest rate.
The effective interest rate is the discount rate which is used to equate:• The net present value of minimum payments to be received
by the Lessor plus the non-guaranteed residual value; and• The property’s entry value (equal to initial fair value plus
initial direct costs).
Policies adopted by Attijariwafa bank:No restatement is needed for operating leases for a specific period and which are automatically renewable.
Long-term rental contracts are considered as operating leases.
Leasing contracts are finance leases in which Attijariwafa bank is the Lessor. The Bank only accounts for its share of the contract in its financial statements.
At the beginning of the contract, rents relating to lease contracts for an indefinite period and leasing contracts are discounted using the effective interest rate. Their value relates to the initial financing amount.
Financial assets and liabilities:
Standard:
loans and receivablesThe amortised cost of a financial asset or liability relates to the value at which the instrument has been initially valued:• Less any repayment of principal;• Plus or minus accumulated amortisation calculated using
the effective interest rate on any difference between the initial amount and the amount to be repaid at maturity;
• Less any reductions for impairment or non-recoverability.
This calculation must include all fees and amounts paid or received directly attributable to the loans, transaction costs and any discount or premium.
provisions for loan impairmentA provision is booked when there is any indication of impairment to loans and receivables.
Provisions are determined on the basis of the difference between the loan's net carrying amount and its estimated recoverable amount.
Impairment is applied on an individual or collective basis.
Provision for impairment on an individual basis:In the case of a loan in arrears, losses are determined on the basis of the net present value of future estimated flows, discounted using the loan’s initial effective interest rate. Future flows include the value of guarantees received and recovery costs.
In the case of a loan which is not in arrears but for which indications of impairment are indicating forthcoming difficulties, the Group may use empirical tables of comparable losses to estimate and adjust future flows.
Provision for impairment on a collective basis:If an individual loan impairment test does not produce any indications of impairment, then the loans are classified in groups with similar credit risk profiles before undergoing a collective impairment test.
Borrowings and deposits:When initially recognised, a deposit or borrowing classified under IFRS in “Other financial liabilities” must be initially measured in the balance sheet at fair value plus or minus:
• transaction costs (these are external acquisition costs directly attributable to the transaction) ;
• fees received constituting professional fees that represent an integral part of the effective rate of return on the deposit or borrowing.
9Attijariwafa bank Results at 30 June 2013
Deposits and borrowings classified under IFRS as “Other financial liabilities” are subsequently measured at the end of the reporting period at amortised cost using the effective interest rate method (actuarial rate).
Deposits classified under IFRS as “Liabilities held for trading” are subsequently measured at fair value at the end of the reporting period. The fair value of the deposit is calculated excluding accrued interest.
A deposit or borrowing may be the host contract for an embedded derivative. In certain circumstances, the embedded derivative must be separated from the host contract and recognised in accordance with the principles applicable to derivatives. This analysis must be done at the inception of the contract on the basis of the contractual provisions.
Policies adopted by Attijariwafa bank:
loans and receivables
The Group’s policy is to apply the cost model to all loans maturing in more than one year as a function of their size. Loans maturing in less than one year are recorded at historical cost.
provisions for loan impairment:
The criteria proposed by Bank Al Maghrib in Circular N°19/G/2002 form the basis of the Group’s provisioning policy regarding impairment on an individual basis.
The basis for provisioning for impairment on a collective basis has been adapted as a function of each Group entity’s activity and also relates to healthy loans.
Specific provisions:Attijariwafa bank has developed statistical models, specific to eachof the relevant entities, to calculate specific provisions based on:
• Historical data relating to recovery of non-performing loans;
• Information about non-recurring loans available to loan recovery units for relatively significant amounts;
• Guarantees and pledges held.
Collective provisions:Attijariwafa bank has developed statistical models, specific to each relevant entity, to calculate collective provisions based on historical data relating to loan deterioration – healthy loans becoming non-performing loans.
Borrowings:
Borrowings and deposits are classified under different categories including « Financial liabilities », « Trading liabilities » and « Liabilities accounted for under the fair value option ».
deposits:
Sight deposits:
Attijariwafa bank applies IAS39 §49 standard to sight deposits. The fair value of a sight deposit cannot be lower than the amount due on demand. It is discounted from the first date on which the repayment may be demanded.
Interest-bearing deposits:
• Deposits bearing interest at market rates – the fair value is the nominal value unless transaction costs are significant.
A historical record of 10-year bond yields needs to be kept to be able to justify that the rates correspond to the original market rates.
• Deposits bearing interest at non-market rates – the fair value is the nominal value plus a discount.
Savings book deposits:The rate applied is regulated for the vast majority of credit institutions.
Accordingly, no specific accounting treatment is required for savings book deposits.
Deposits must be classified under the «Other liabilities » category.
Securities:Standard:The IAS 39 standard defines four asset categories applicable to securities:
• Trading securities (financial assets held at fair value through income);
• Available-for-sale financial assets;
• Held-to-maturity investments;
• Loans and receivables, (includes financial assets not quoted on an active market which are purchased directly from the issuer).
The securities are classified depending on the purpose for which they are held.
Trading portfolio securities : financial assets at fair valuethrough profit or loss and financial assets designated at fair value through profit or loss at inceptionAccording to IAS 39.9, financial assets or liabilities held at fair value through income are assets or liabilities acquired or generated by the company for the primary purpose of making a profit from
short-term price fluctuations or from arbitrage activities.
All derivative instruments are recognised as financial assets (or liabilities) at fair value through profit or loss except when they are used for hedging purposes.
Securities classified as financial assets held at fair value through income are recognised in the income statement.
This category of security is not subject to impairment.
Available-for-sale financial assetsThis category includes available-for-sale securities, investment securities and investments in non-consolidated affiliates and other long-term investments.
The standard stipulates that those assets and liabilities which do not satisfy the criteria for the three other asset categories are included in this category.
Changes in the fair value of available-for-sale securities (positive or negative) are recognised directly in equity (transferable equity). The amortisation of any possible premium/discount of fixed income securities is recognised in the income statement using to effective interest rate method (actuarial method).
On any indication of significant and lasting impairment in the case of equity securities and the occurrence of credit risk for debt securities, the unrealised loss that was recognised in equity must be removed and recognised in the income statement.
On subsequent improvement, a write-back may be booked against the provision for impairment in the case of debt securities but not so for equity securities. In the latter case, a positive change in fair value is recognised in transferable equity and a negative change in equity.
Held-to-maturity investmentsThis category includes securities with fixed or determinable payments that the Group intends to keep until maturity.
Classifying securities in this category entails an obligation not to dispose of the securities before maturity. If an entity sells a held-to-maturity security before maturity, all of its other held to-maturity investments must be reclassified as available-for sale investments for the current and next two reporting years.
Held-to-maturity investments are measured at amortised cost with the premium/discount being amortised using the effective interest rate method (actuarial method).
On any indication of impairment, a provision must be booked for the difference between the carrying amount and the estimated recoverable value. The estimated recoverable value is the net present value of future estimated flows, discounted using the loan’s initial effective interest rate.
On subsequent improvement, a write-back may be booked against the provision for impairment.
Loans and receivablesThe «Loans and receivables category » includes unquoted financial assets which are not intended to be sold and which the institution intends to keep for the long term.
Loans and receivables are recognised at amortised cost, using the effective interest rate method and restated for any possible impairment provisions.
On any indication of impairment, a provision must be booked for the difference between the carrying amount and the estimated recoverable value.
On subsequent improvement, a write-back may be booked against the provision for impairment.
Policies adopted by Attijariwafa bank
Portfolio classification
Attijariwafa bank and other entities excluding insurance companies
The instruments held in portfolios are currently classified in the following categories:
hFt AFS htM loans and
• Trading and dealing Room portfolios
• Negotiable treasury bills classified in the Investment Portfolio
• Bonds and other negotiable debt securities
• Long-term investments
• Treasury Bills
• CAM bonds;• CIH bonds;
Securities lending/borrowing and repurchase agreementsSecurities temporarily sold under repurchase agreements continue to be recognised in the Group’s balance sheet in the category of securities to which they belong. The corresponding liability is recognised under the appropriate debt category except in the case of repurchase agreements contracted by the Group for trading purposes where the corresponding liability is recognised under “Financial liabilities at fair value through profit or loss”. Securities temporarily acquired under reverse repurchase agreements are not recognised in the Group’s balance sheet. The corresponding receivable is recognised under “Loans and receivables” except in the case of reverse repurchase agreements contracted by the Group for trading purposes, where the corresponding receivable is recognised under “Financial assets at fair value through profit or loss”.
Treasury sharesThe term “treasury shares” refers to shares issued by the consolidating company, Attijariwafa bank. Treasury shares held by the Group are deducted from consolidated shareholders’ equity. Gains and losses arising on such instruments are also eliminated from the consolidated profit and loss account.
DerivativesStandard:A derivative is a financial instrument or another contract included in IAS 39’s scope of application which meets the following three criteria:• Its value changes in response to a change in a variable such
as specified interest rate, the price of a financial instrument, a price, index or yield benchmark, a credit rating, a credit index or any other variable, provided that in the case of a non-financial variable, the variable must not be specific to any one party to the contract (sometimes known as «the underlying »);
• Requires no initial investment or one that is smaller than would be required for a contract having a similar reaction to changes in market conditions; and
• Is settled at a future data.A hedging instrument is a designated derivative or, in the case of a hedge for foreign exchange risk only, a non-derivative designated financial asset or liability. The latter’s fair value or cash flows are intended to offset variations in the fair value or cash flows of the designated hedged item.
Policies adopted by Attijariwafa bankAttijariwafa bank does not currently use derivatives for hedging purposes and is not therefore subject to provisions applicable to hedge accounting.
All other transactions involving the use of derivatives are recognised as assets/liabilities at fair value through income.
Embedded derivatives
Standard:An embedded derivative is a feature within a financial contract whose purpose its to vary a part of the transaction’s cash flows in a similar way to that of a stand-alone derivative.
The IAS 39 standard defines a hybrid contract as a contract comprising a host contract and an embedded derivative.
IAS 39 requires that an embedded derivative is separated from its host contract and accounted for as a derivative when the following three conditions are met:
• The hybrid contract is not recognised at fair value;
• Separated from the host contract, the embedded derivative possesses the same characteristics as a derivative;
• The characteristics of the embedded derivative are not closely related to those of the host contract.
IAS 39 recommends that the host contract is valued at inception by taking the difference between the fair value of the hybrid contract (i.e. at cost) and the fair value of the embedded derivative.
Policies adopted by Attijariwafa bankIf there is a material impact from measuring embedded derivatives at fair value, then they are recognised under «Financial assets held at fair value through income ».
Fair value:IFRS 13 defines fair value as the price that would be received to sell an asset or paid to transfer a liability in an orderly transaction in a principal market (or the most advantageous market) at the measurement date based on current market conditions (i.e. an exit price) providing that this price was directly observable or estimated by using an appropriate valuation technique.
IFRS 13 uses a 'fair value hierarchy' which categorises the inputs used in valuation techniques into three levels in order to determine fair value. The hierarchy gives the highest priority to (unadjusted) quoted prices in active markets for identical assets or liabilities (Level 1 inputs) and the lowest priority to unobservable inputs (Level 3 inputs).
11Attijariwafa bank Results at 30 June 2013
Level 1 inputsLevel 1 inputs are quoted prices (unadjusted) in active markets for identical assets or liabilities that the entity can access at the measurement date. A quoted market price in an active market provides the most reliable evidence of fair value and is used without adjustment to measure fair value whenever available, with limited exceptions (§ 79).
Level 2 inputsLevel 2 inputs are inputs other than quoted market prices included within Level 1 that are observable for the asset or liability, either directly or indirectly.
If the asset or liability has a specified maturity (contractual), a Level 2 input must be observable for almost the entire life of the asset or liability. Level 2 inputs include:• Quoted prices for similar assets or liabilities in active markets;• Quoted prices for identical or similar assets or liabilities in
markets that are not active;• Inputs other than quoted prices that are observable for the
asset or liability, for example, interest rates and yield curves observable at commonly quoted intervals, implied volatilities, credit spreads.
Adjustments to Level 2 inputs will vary depending on factors specific to the asset or liability. Those factors include the following: the state or location of the asset, the extent to which inputs relate to items that are comparable to the asset or liability, as well as the volume and the level of activity in the markets within which the inputs are observed.
An adjustment to a Level 2 input that is significant to the entire measurement might result in a fair value measurement categorised within Level 3 of the fair value hierarchy if the adjustment uses significant unobservable inputs.
Level 3 inputsLevel 3 inputs inputs are unobservable inputs for the asset or liability. Unobservable inputs must be used to measure fair value to the extent that relevant observable inputs are not available, thereby allowing for situations in which there is little, if any, market activity for the asset or liability at the measurement date. However, the fair value measurement objective remains the same, i.e. an exit price at the measurement date from the perspective of a market participant that holds the asset or owes the liability. Therefore, unobservable inputs shall reflect the assumptions that market participants would use when pricing the asset or liability, including assumptions about risk.
Market value is determined by the Group:• Either from quoted market prices in an active market;• Or by using a valuation technique based on mathematical
models derived from recognised financial theories, which makes maximum use of market inputs.
➥ case 1: instruments traded on active marketsQuoted market prices on active markets are the best evidence of fair value and should be used, where they exist, to measure the financial instrument. Listed securities and derivatives such as futures and options, which are traded on organised markets, are valued in this way. The majority of over-the-counter derivatives, such as plain vanilla swaps and options, are traded on active markets. They are valued using widely-accepted models (discounted cash flow model, Black and Scholes model and interpolation techniques) and based on quoted market prices of similar or underlying instruments.
➥ case 2: instruments traded on inactive marketsInstruments traded on an inactive market are valued using an internal model based on directly observable or deduced market data.
Certain financial instruments, although not traded on active markets, are valued using methods based on directly observable market data.
Observable market data may include yield curves, implied volatility ranges for options, default rates and loss assumptions obtained by market consensus or from active over-the-counter markets.
InsuranceStandard:insurance contracts:The main provisions for insurance contracts are summarised below:• May continue to recognise these contracts in accordance with
current accounting policies by making a distinction between three types of contract under IFRS 4:
1. Pure insurance contracts;2. Financial contracts comprising a discretionary participation
feature;3. And liabilities relating to other financial contracts, in accordance
with IAS 39, which are recorded under «Amounts owing to customers ».
• Requires that embedded derivatives, which do not benefit from exempt status under IFRS 4, are accounted for separately and recognised at fair value through income;
• Requires a test for the adequacy of recognised insurance liabilities and an impairment test for reinsurance assets;
• A reinsurance cession asset is amortised, by recognising this impairment through income, when and only when:
- Tangible evidence exists, following the occurrence of an event after initial recognition of the asset in respect of reinsurance cessions, resulting in the cedant not receiving all its contractual cash flows;
- This event has an impact, which may be accurately assessed, on the amount which the reinsurer is expected to receive from the primary insurer.
• Requires an insurer to keep insurance liabilities on its balance sheet until they are discharged, cancelled, or expire and prohibits offsetting insurance liabilities against related reinsurance assets;
• Requires that a new insurance liability is recorded in accordance with IFRS 4 «Shadow accounting » in respect of policyholders’ deferred participation in profits which represents the portion of unrealised capital gains on financial assets to which policyholders are entitled, in accordance with IAS 39.
Policies adopted by Attijariwafa bank:insurance contracts:A liability adequacy test has already been carried out by Wafa Assurance, which appointed an external firm of actuaries to assess its technical reserves.
The provision for fluctuations in claims relating to non-life insurance contracts is to be cancelled.
investment-linked insurance:The instruments held in portfolios are currently classified in the following categories:
hFt AFS htM prêts et créances• Non
consolidated mutual funds (OPCVM).
• Shares and other equity
• Investments in SCIs (Panorama) ;
• Treasury bills and unquoted debt instruments.
• Not applicable
• Long-term investments

Liabilities provisions:
Standard:
A provision must be booked when :
• the company has a present obligation (legal or implicit) resulting from a past event.
• it is probable that an outflow of resources embodying economic benefits will be required to settle the obligation ; and
• the amount of the obligation can be reliably estimated.
If these conditions are not satisfied, no provision may be recognised.
Under IFRS, if the impact is material, it is compulsory to discount future estimated cash flows when the outflow of expected future economic benefits exceeds one year.
Except in the case of combinations, contingent liabilities are not provisioned. When the contingent liability or asset is material, it is compulsory to mention it in the notes to the financial statements.
Policies adopted by Attijariwafa bank: The Group has analysed all its general provisions and:
• How they are matched to inherent risks;
• Has reviewed how they are measured and booked under IFRS.
Deferred taxation:
Standard:
A deferred tax asset or liability is recognised each time that the recovery or payment of an asset or liability’s carrying amount will result in an increase or reduction in future tax payments compared to what they would have been previously.
A company will most likely be able to offset a deductible temporary difference against taxable income:
• If it has sufficient taxable temporary differences within the remit of the same tax authority and in relation to the same entity;
• If the company is likely to generate sufficient profit within the remit of the same tax authority and in relation to the same entity;
• Tax management allows it the opportunity to generate taxable income in the related periods.
Deferred taxes may not be amortised under IFRS.
Policies adopted by Attijariwafa bank:
Assessing the probability of generating future taxable income:
Deferred tax assets are not recognised unless it is probable that future taxable income will be generated. This probability can be ascertained by the business projections of the companies in question.
Accounting for deferred tax liabilities in respect of temporary differences relating to intangible assets resulting from business combinations:
A deferred tax liability is recognised for goodwill relating to intangible assets resulting from business combinations even if these intangible assets have an indefinite life.
Accounting for deferred tax assets in respect of deductible temporary differences relating to consolidated investments in affiliates:
A deferred tax asset must be recognised in respect of deductible temporary differences relating to consolidated investments in affiliates when these temporary differences are likely to be resolved in the foreseeable future and when it is probable that taxable profit will be generated.
possibility of revising goodwill if a deferred tax asset is identified after the regularisation period allowed under iFRS:
A deferred tax asset, which is not identifiable at the time of acquisition but recognised subsequently, is recognised through consolidated income and Goodwill is restated retrospectively even after the regularisation period expires. The impact of this revision is also recognised through consolidated income.
deferred taxes recognised initially in equity:
The impact of changes to tax rates and/or tax rules is recognised in equity.
Employee benefits
Standard:
The objective of this Standard is to prescribe the accounting treatment and disclosure for employee benefits. This Standard shall be applied by an employer in accounting for all employee benefits, except those to which IFRS 2 “Share-based Payment” applies. These benefits include those provided:- Under formal plans or other formal agreements between an
entity and individual employees, groups of employees or their representatives;
- Under legislative requirements, or through industry arrangements, whereby entities are required to contribute to national, state, industry or other multi-employer plans; or
- By those informal practices that give rise to a constructive obligation and those where the entity has no realistic alternative but to pay employee benefits.
Employee benefits are contingent considerations of any type provided by an entity for services rendered by members of staff or in the event that their employment is terminated. They comprise 4 categories:
Short-term benefits:
Are employee benefits (other than termination benefits), that are expected to be settled wholly before twelve months after the end of the annual reporting period in which the employees render the related services e.g. wages, salaries and social security contributions; paid annual leave and paid sick leave; profit-sharing and bonuses etc.
When an employee has rendered service to an entity during an accounting period, the entity shall recognise the undiscounted amount of short-term employee benefits expected to be paid in exchange for that service:• As a liability, after deducting any amount already paid, if
applicable; or• As an expense.
Post-employment benefits:
These are employee benefits which are payable post-employment e.g. retirement benefits, post-employment life insurance and post-employment medical care.
Distinction is made between two types of post-retirement benefit plan:
1. Defined contribution plans: an entity pays defined contributions into a fund and has no other legal or constructive obligation to pay additional contributions if the fund does not have sufficient assets to meet expected benefits relating to services rendered by staff. As a result, actuarial risk and investment risk fall on the employee.

13Attijariwafa bank Results at 30 June 2013
Accounting for defined contribution plans is straightforward because no actuarial assumptions are required to measure the obligation or the expense and there is no possibility of any actuarial gain or loss.
The entity shall recognise the contribution payable to a defined contribution plan in exchange for the service rendered by an employee: - As a liability, after deducting any amount already paid, if
applicable; or- As an expense.
2. Defined benefit plans: the entity’s obligation is to provide the agreed benefits to current and former employees As a result, actuarial risk and investment risk fall on the employee.
Accounting for defined benefit plans is quite complex due to the fact that actuarial assumptions are required to measure the obligation and there is a possibility of an actuarial gain or loss. In addition, the obligations are discounted to their present value as they may be paid several years after the employee has rendered the corresponding service.
A multi-employer plan which is neither a general plan nor a compulsory plan must be recognised by the company as either a defined contribution plan or a defined benefit plan depending on the characteristics of the plan.
Other long-term employee benefits:
Other long-term employee benefits include long-term paid absences, such as long-service or sabbatical leave. They also include jubilee or other long-service benefits such wissam schoghl, long-term disability benefits, profit-sharing, bonuses and deferred remuneration if not expected to be settled wholly before twelve months after the end of the annual reporting period.
In general, the measurement of other long-term employee benefits is usually not subject to the same degree of uncertainty as the measurement of defined benefit plans. Therefore, this standard provides a simplified method which does not recognise re-measurements in other comprehensive income.
Termination benefits:
Termination benefits are employee benefits payable as a result of either an entity’s decision to terminate an employee’s employment before the normal retirement date or an employee’s decision to accept voluntary redundancy in exchange for those benefits.
The entity should recognise a liability and expense for termination benefits at the earlier of the following two dates:- The date after which it may no longer withdraw its benefits;- The date at which it recognises the costs of restructuring as
required by IAS 37 and envisages the payment of related benefits.
In the case of termination benefits payable following an entity’s decision to terminate the employment of an employee, the entity may no longer withdraw its offer of benefits once it has informed the employees in question of the termination plan, which should satisfy the following criteria:- The measures required to successfully execute the plan would
suggest that is it unlikely that major changes would be made to the plan;
- The plan identifies the number of employees to be terminated, the job classifications or functions that will be affected and their locations and when the terminations are expected to occur;
- The plan establishes the terms of the termination benefits in sufficient detail to enable employees to determine the type and amount of benefits they will receive if they are involuntarily terminated.
Measuring obligations:
Method:Accounting for defined benefit plans requires the use of actuarial techniques to reliably estimate the benefits accruing to employees in consideration for current and past service rendered.
This requires estimating the benefits, demographic variables such as mortality rates and staff turnover, financial variables such as the discount rate and future salary increases that will affect the cost of benefits.
The recommended method under IAS 19 is the “projected unit credit method” which is also the preferred method used in French accounting practice.
This amounts to recognising, on the date that the obligation is calculated, an obligation equal to the probable present value of the estimated benefits multiplied by the length of service at the calculation date and at the retirement date.
The obligation can be considered as accruing pro-rata to the employee’s length of service. As a result, an employee’s entitlement is calculated on the basis of length of service and estimated salary at the retirement date.
Policies adopted by Attijariwafa bank:Attijariwafa bank has opted for a defined contribution retirement benefits plan. Accordingly, no specific accounting treatment is required under IFRS.
In the case of post-employment medical cover, Attijariwafa bank does not have sufficient information to be able to account for its medical cover as a defined benefit plan.
The Group, on the other hand, has booked specific provisions for liabilities to employees including end-of-career bonuses and service awards (Ouissam Achoughl).
Share-based paymentsShare-based payments are payments based on shares issued by the Group. The payments are made either in the form of shares or in cash for amounts based on the value of the Group’s shares.
Examples of share-based payments include stock options or employee share plans.
Under the subscription terms, employees may subscribe for shares at a discount to the current market price over a specified period. The inaccessibility period is taken into consideration when expensing this benefit.

13
notes 06/30/2013 06/30/2012 Interest and similar income 3.1 8 384 191 8 098 592
Interest and similar expenses 3.1 3 218 242 3 014 279 net inteReSt MARgin 5 165 949 5 084 313 Fees received 3,2 2 090 227 1 864 428 Fees paid 3,2 165 093 178 481 net Fee incoMe 1 925 134 1 685 947 Net gains or losses on financial instruments at fair value through income 1 043 830 1 286 708 Net gains or losses on available-for-sale financial assets 517 963 349 902 incoMe FRoM MARKet ActiVitieS 1 561 793 1 636 611 Income from other activities 2 642 850 2 785 892 Expenses on other activities 2 198 750 2 505 622 net BAnKing incoMe 9 096 976 8 687 140 General operating expenses 3 611 218 3 384 664 depreciation, amortisation and provisions 373 141 413 645 gRoSS opeRAting incoMe 5 112 617 4 888 831 Cost of risk 3.3 -971 640 -593 499 opeRAting incoMe 4 140 977 4 295 332 Net income from companies accounted for under the equity method 10 038 5 864 Net gains or losses on other assets 17 607 1 534 Changes in value of goodwill - - pRe-tAX incoMe 4 168 621 4 302 730 Income tax 1 499 551 1 580 688 net incoMe 2 669 070 2 722 042 Minority interests 448 058 389 371 net incoMe gRoUp ShARe 2 221 012 2 332 671 Earnings per share (in dirhams) 10,91 11,61 dividend per share (in dirhams) 10,91 11,61
Consolidated financial statements at 30 June 2013FINANCIAL STATEMENTS
consolidated iFRS Balance Sheet at 30 June 2013 (thousand MAd)
ASSetS (under iFRS) notes 06/30/2013 12/31/2012
Cash and balances with central banks. the treasury and post office accounts 12 251 921 10 697 230
Financial assets at fair value through income 2.1 37 964 048 47 428 881
derivative hedging instruments -
Available-for-sale financial assets 2.2 27 723 851 27 191 660 loans and advances to credit institutions and similar establishments 2.3 20 054 313 14 005 154
loans and advances to customers 2.4 253 581 523 247 628 093
Interest rate hedging reserve - -
Held-to-maturity investments 10 117 484 -
Current tax assets 100 808 87 099
deferred tax assets 840 680 467 125
other assets 7 947 752 6 632 060 Participations of insured parties in differed profits - -
Non-current assets held for sale 6 459 27 698 Investments in companies accounted for under the equity method 106 202 110 396
Investment property 1 224 401 1 246 494
Property. plant and equipment 2.5 4 922 877 4 953 658
Intangible assets 2.5 1 259 064 1 208 857
Goodwill 2.6 6 617 694 6 620 472
totAl ASSetS 384 719 077 368 304 877
liABilitieS (under iFRS) notes 06/30/2013 12/31/2012Amounts owing to central banks. the treasury and post office accounts 258 904 262 444
Financial liabilities at fair value through income
2.7 1 107 546 972 159
derivative hedging instruments - - Amounts owing to credit institutions and similar establishments
2.8 46 838 141 45 084 894
Customer deposits 2.9 238 678 791 227 019 046 debt securities issued 17 862 726 17 726 877
Interest rate hedging reserve - -
Current tax liabilities 192 663 227 455 deferred tax liabilities 1 837 572 1 496 691 other liabilities 9 623 530 9 248 179 liabilities related to non-current assets held for sale - -
Insurance companies' technical reserves 19 678 807 19 088 075
General provisions 2.10 1 181 865 1 150 289 subsidies. public funds and special guarantee funds 444 499 164 829
subordinated debt 11 237 783 10 469 283 share capital and related reserves 10 151 765 9 466 523 Consolidated reserves 22 971 460 20 500 262 - Group share 19 091 479 16 726 955 - Minority interests 3 879 981 3 773 307 unrealised deferred capital gains or losses -16 045 118 799
Net income for the financial year 2 669 070 5 309 072 - Group share 2 221 012 4 500 769 - Minority interests 448 058 808 302 totAl liABilitieS 384 719 077 368 304 877
consolidated income statement under iFRS at 30 June 2013 (thousand MAd)

15Attijariwafa bank Results at 30 June 2013
Statement of net income and gains and losses directly recorded in shareholders equity at 30 June 2013 (thousand MAd)
06/30/2013 12/31/2012net income 2 669 070 5 309 072 Asset and liability variations directly recorded in shareholders equity -267 293 -561 906
translation gains or losses -92 714 -83 151 Variation in value of financial assets available for sale -160 347 -463 595 revaluation of fixed assets - - Variations in differed value of derivative coverage instruments - - Items regarding enterprises by equity method -14 232 -15 159
total 2 401 777 4 747 166 Group share 2 016 872 4 081 699 Minority interest share 384 905 665 467
Share capital
(1)
Reserves (related to share capital)
(2)
treasury stock
(3)
Reserves and
consolidated income
(4)
total assets and liabilities
entered directly in
capital(5)
Share-holders'
equity group share
(6)
Minority interests
(7)
total
(8) Shareholders' equity at 31 december 2011 1 929 960 5 436 564 -2 005 366 20 293 124 409 089 26 063 370 4 216 726 30 280 097 Effect of changes to accounting policiesShareholders' equity restated at 31 december 2011 1 929 960 5 436 564 -2 005 366 20 293 124 409 089 26 063 370 4 216 726 30 280 097 transactions related to share capital 82 471 2 017 529 625 590 2 725 590 317 554 3 043 144 share-based payments - - transactions related to treasury stock 14 699 14 699 14 699 dividends -1 591 951 -1 591 951 -374 324 -1 966 276 net income at 31 december 2012 4 500 769 4 500 769 808 302 5 309 072 Variations in assets and liabilities recorded directly in shareholders’ equity (A) -375 037 -375 037 -103 717 -478 754
translation gains and losses (B) -44 034 -44 034 -39 118 -83 151 total assets and liabilities entered directly in capital (A)+(B) - - - - -419 070 -419 070 -142 835 -561 906 other variations -480 361 -480 361 -243 813 -724 174 perimeter variation - - Shareholders' equity at 31 december 2012 2 012 431 7 454 092 -1 990 667 23 347 171 -9 981 30 813 046 4 581 609 35 394 656 Effect of changes to accounting policiesShareholders' equity restated at 31 december 2012 2 012 431 7 454 092 -1 990 667 23 347 171 -9 981 30 813 046 4 581 609 35 394 656 transactions related to share capital 22 841 662 401 -445 387 239 855 -116 342 123 513 share-based payments - - transactions related to treasury stock -59 918 -59 918 -59 918 dividends -1 778 370 -1 778 370 -569 037 -2 347 407 net income for the period 2 221 012 2 221 012 448 058 2 669 070 total assets and liabilities entered directly in capital (C) -149 076 -149 076 -25 503 -174 579 Variations in assets and liabilities recorded directly in shareholders’ equity (d) -55 064 -55 064 -37 650 -92 714
latent or differed gains or losses (c)+(d) - - - - -204 140 -204 140 -63 153 -267 293 other variations 216 727 216 727 46 903 263 629 Changes in scope of consolidation - - Shareholders' equity at 30 June 2013 2 035 272 8 116 493 -2 050 585 23 561 152 -214 121 31 448 211 4 328 039 35 776 250
table of shareholders equity variation at 30 June 2013 (thousand MAd)
consolidated cash flow statement at 30 June 2013 (thousand MAd)
06/30/2013 12/31/2012 06/30/2012pre-tax income 4 168 621 8 173 131 4 302 730 +/- Net depreciation and amortisation of property, plant and equipment and intangible assets 419 664 868 847 472 572 +/- Net impairment of goodwill and other fixed assets - - - +/- Net amortisation of financial assets -2 985 -11 689 2 648 +/- Net provisions 1 033 041 1 401 191 610 573 +/- Net income from companies accounted for under the equity method -10 038 -14 575 -5 864 +/- Net gain/loss from investment activities -444 519 -356 715 -363 218 +/- Net gain/loss from financing activities - - - +/- other movements -1 657 428 -797 032 -1 043 209 total non-cash items included in pre-tax income and other adjustments -662 263 1 090 027 -326 498 +/- Flows relating to transactions with credit institutions and similar establishments -1 634 884 22 327 290 27 249 460 +/- Flows relating to transactions with customers 5 293 501 -8 605 116 -14 774 153 +/- Flows relating to other transactions affecting financial assets or liabilities 9 948 551 -14 134 322 -6 874 014 +/- Flows relating to other transactions affecting non-financial assets or liabilities - - - - taxes paid -1 432 980 -1 808 260 -1 058 750 net increase/decrease in operating assets and liabilities 12 174 188 -2 220 408 4 542 544 net cash flow from operating activities 15 680 546 7 042 750 8 518 775 +/- Flows relating to financial assets and investments -10 063 906 -1 455 750 -1 116 232 +/- Flows relating to investment property 3 332 -79 165 -16 676 +/- Flows relating to plant, property and equipment and intangible assets -378 078 -492 327 -142 882 net cash flow from investment activities -10 438 653 -2 027 242 -1 275 790 +/- Cash flows from or to shareholders -1 662 165 133 724 34 728 +/- other net cash flows from financing activities 717 266 2 188 174 1 525 489 net cash flow from financing activities -944 899 2 321 898 1 560 217 effect of changes in foreign exchange rates on cash and cash equivalents 65 494 30 036 39 928 net increase (decrease) in cash and cash equivalents 4 362 488 7 367 443 8 843 131
06/30/2013 12/31/2012 06/30/2012cash and cash equivalents at the beginning of the period 9 658 041 2 290 598 2 290 598 Net cash balance (assets and liabilities) with central banks, the treasury and post office accounts 10 434 787 13 590 125 13 590 125 Inter-bank balances with credit institutions and similar establishments -776 746 -11 299 527 -11 299 527 cash and cash equivalents at the end of the period 14 020 529 9 658 041 11 133 728 Net cash balance (assets and liabilities) with central banks, the treasury and post office accounts 11 993 017 10 434 787 11 106 553 Inter-bank balances with credit institutions and similar establishments 2 027 512 -776 746 27 175 net change in cash and cash equivalents 4 362 488 7 367 443 8 843 131
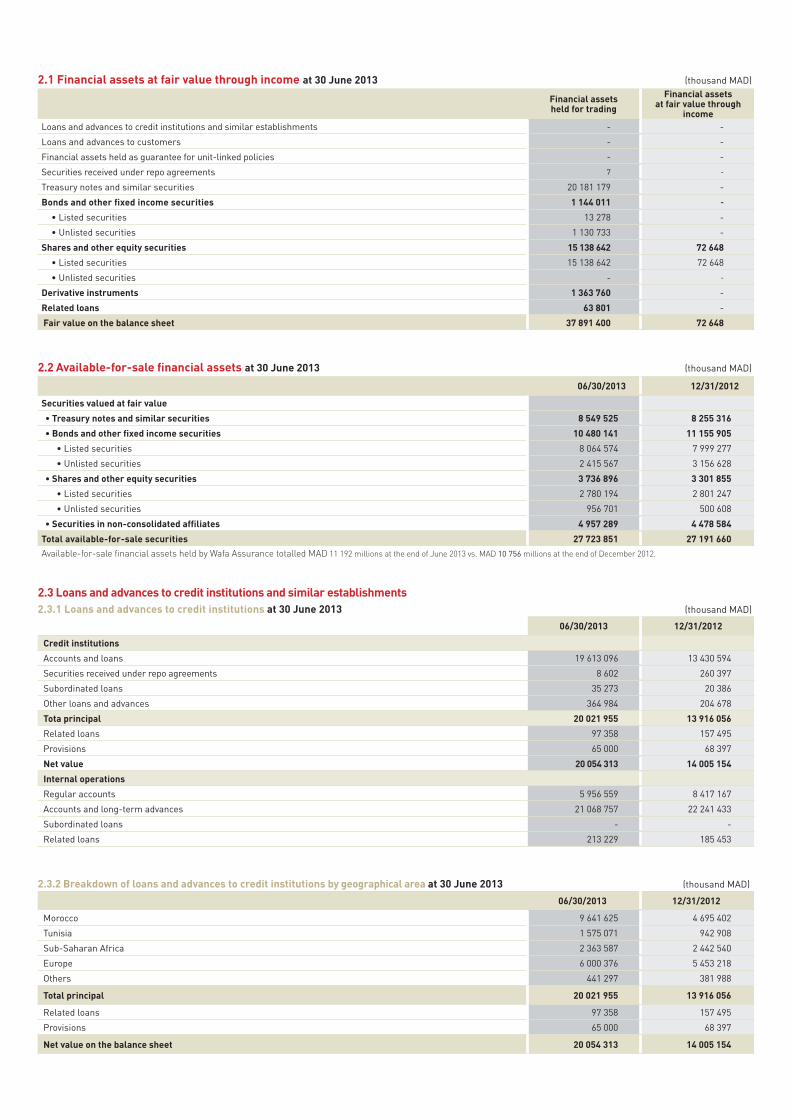
Financial assetsheld for trading
Financial assetsat fair value through
incomeloans and advances to credit institutions and similar establishments - -
loans and advances to customers - -
Financial assets held as guarantee for unit-linked policies - -
securities received under repo agreements 7 -
treasury notes and similar securities 20 181 179 -
Bonds and other fixed income securities 1 144 011 -
• listed securities 13 278 -
• unlisted securities 1 130 733 -
Shares and other equity securities 15 138 642 72 648
• listed securities 15 138 642 72 648
• unlisted securities - -
derivative instruments 1 363 760 -
Related loans 63 801 -
Fair value on the balance sheet 37 891 400 72 648
2.1 Financial assets at fair value through income at 30 June 2013 (thousand MAd)
06/30/2013 12/31/2012
Securities valued at fair value
• treasury notes and similar securities 8 549 525 8 255 316
• Bonds and other fixed income securities 10 480 141 11 155 905
• listed securities 8 064 574 7 999 277
• unlisted securities 2 415 567 3 156 628
• Shares and other equity securities 3 736 896 3 301 855
• listed securities 2 780 194 2 801 247
• unlisted securities 956 701 500 608
• Securities in non-consolidated affiliates 4 957 289 4 478 584
total available-for-sale securities 27 723 851 27 191 660 Available-for-sale financial assets held by Wafa Assurance totalled MAD 11 192 millions at the end of June 2013 vs. MAD 10 756 millions at the end of December 2012.
2.2 Available-for-sale financial assets at 30 June 2013 (thousand MAd)
2.3 loans and advances to credit institutions and similar establishments
06/30/2013 12/31/2012
credit institutions
Accounts and loans 19 613 096 13 430 594
securities received under repo agreements 8 602 260 397
subordinated loans 35 273 20 386
other loans and advances 364 984 204 678
tota principal 20 021 955 13 916 056
related loans 97 358 157 495
Provisions 65 000 68 397
net value 20 054 313 14 005 154
internal operations
regular accounts 5 956 559 8 417 167
Accounts and long-term advances 21 068 757 22 241 433
subordinated loans - -
related loans 213 229 185 453
2.3.1 loans and advances to credit institutions at 30 June 2013 (thousand MAd)
06/30/2013 12/31/2012
Morocco 9 641 625 4 695 402
tunisia 1 575 071 942 908
sub-saharan Africa 2 363 587 2 442 540
Europe 6 000 376 5 453 218
others 441 297 381 988
total principal 20 021 955 13 916 056
related loans 97 358 157 495
Provisions 65 000 68 397
net value on the balance sheet 20 054 313 14 005 154
2.3.2 Breakdown of loans and advances to credit institutions by geographical area at 30 June 2013 (thousand MAd)
17Attijariwafa bank Results at 30 June 2013
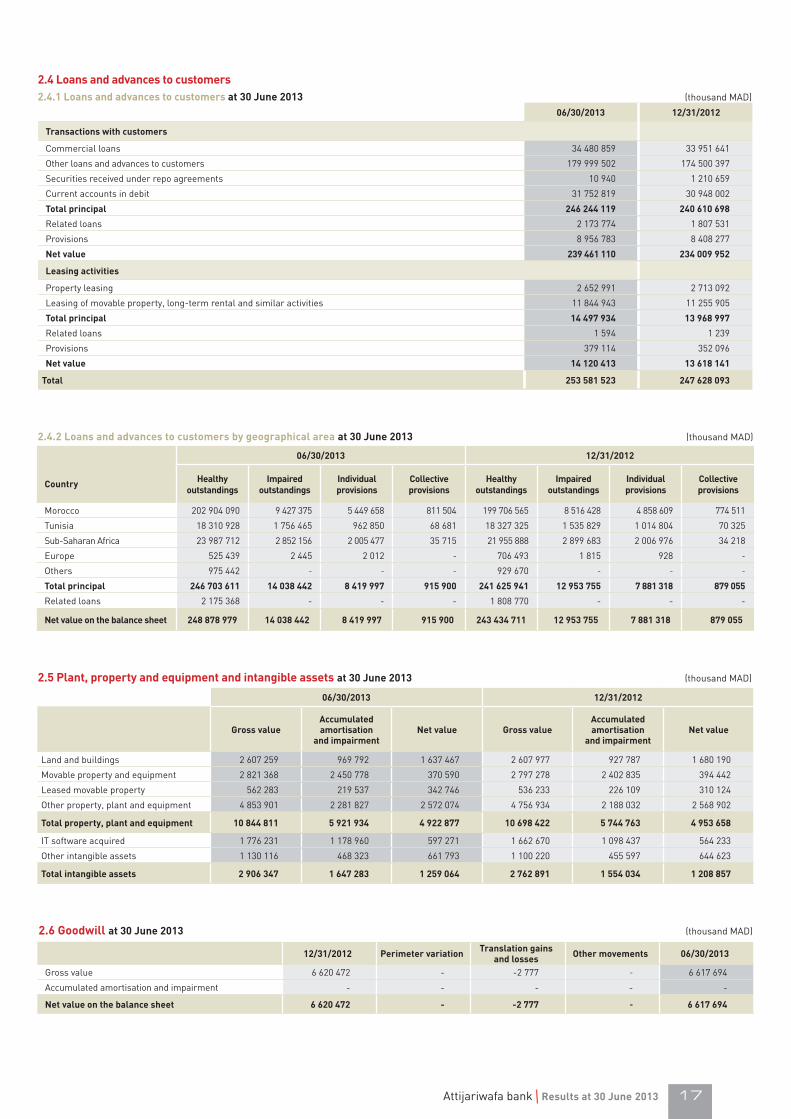
2.4.1 loans and advances to customers at 30 June 2013 (thousand MAd)
06/30/2013 12/31/2012
transactions with customers
Commercial loans 34 480 859 33 951 641
other loans and advances to customers 179 999 502 174 500 397
securities received under repo agreements 10 940 1 210 659
Current accounts in debit 31 752 819 30 948 002
total principal 246 244 119 240 610 698
related loans 2 173 774 1 807 531
Provisions 8 956 783 8 408 277
net value 239 461 110 234 009 952
leasing activities
Property leasing 2 652 991 2 713 092
leasing of movable property, long-term rental and similar activities 11 844 943 11 255 905
total principal 14 497 934 13 968 997
related loans 1 594 1 239
Provisions 379 114 352 096
net value 14 120 413 13 618 141
total 253 581 523 247 628 093
2.4 loans and advances to customers
06/30/2013 12/31/2012
country healthy outstandings
impaired outstandings
individual provisions
collective provisions
healthy outstandings
impaired outstandings
individual provisions
collective provisions
Morocco 202 904 090 9 427 375 5 449 658 811 504 199 706 565 8 516 428 4 858 609 774 511
tunisia 18 310 928 1 756 465 962 850 68 681 18 327 325 1 535 829 1 014 804 70 325
sub-saharan Africa 23 987 712 2 852 156 2 005 477 35 715 21 955 888 2 899 683 2 006 976 34 218
Europe 525 439 2 445 2 012 - 706 493 1 815 928 -
others 975 442 - - - 929 670 - - -
total principal 246 703 611 14 038 442 8 419 997 915 900 241 625 941 12 953 755 7 881 318 879 055
related loans 2 175 368 - - - 1 808 770 - - -
net value on the balance sheet 248 878 979 14 038 442 8 419 997 915 900 243 434 711 12 953 755 7 881 318 879 055
2.4.2 loans and advances to customers by geographical area at 30 June 2013 (thousand MAd)
06/30/2013 12/31/2012
gross valueAccumulated amortisation
and impairmentnet value gross value
Accumulated amortisation
and impairmentnet value
land and buildings 2 607 259 969 792 1 637 467 2 607 977 927 787 1 680 190
Movable property and equipment 2 821 368 2 450 778 370 590 2 797 278 2 402 835 394 442
leased movable property 562 283 219 537 342 746 536 233 226 109 310 124
other property, plant and equipment 4 853 901 2 281 827 2 572 074 4 756 934 2 188 032 2 568 902
total property, plant and equipment 10 844 811 5 921 934 4 922 877 10 698 422 5 744 763 4 953 658
It software acquired 1 776 231 1 178 960 597 271 1 662 670 1 098 437 564 233
other intangible assets 1 130 116 468 323 661 793 1 100 220 455 597 644 623
total intangible assets 2 906 347 1 647 283 1 259 064 2 762 891 1 554 034 1 208 857
2.5 plant, property and equipment and intangible assets at 30 June 2013 (thousand MAd)
12/31/2012 perimeter variation translation gains and losses other movements 06/30/2013
Gross value 6 620 472 - -2 777 - 6 617 694
Accumulated amortisation and impairment - - - - -
net value on the balance sheet 6 620 472 - -2 777 - 6 617 694
2.6 goodwill at 30 June 2013 (thousand MAd)

Stock at 12/31/2012
change in scope
Additional provisions
Write-backs used
Write-backs not used
otherchanges
Stock at 06/30/2013
Provisions for risks in executing signature loans 90 317 - 21 781 - - -665 111 433
Provisions for social benefit liabilities 375 109 - 34 728 30 451 - 14 708 394 095
other general provisions 684 863 - 55 332 78 516 7 801 22 459 676 337
general provisions 1 150 289 111 842 108 966 7 801 36 501 1 181 865
2.10 general provisions at 30 June 2013 (thousand MAd)
06/30/2013 12/31/2012
credit institutions
Accounts and borrowings 21 112 899 13 679 079
securities pledged under repo agreements 25 618 630 31 267 497
total principal 46 731 529 44 946 576
related debt 106 612 138 318
Value on the balance sheet 46 838 141 45 084 894
internal group operations
Current accounts in credit 4 793 642 7 305 439
Accounts and long-term advances 21 787 783 23 078 517
related debt 133 619 51 603
2.8 Amounts owing to credit institutions at 30 June 2013 (thousand MAd)
06/30/2013 12/31/2012
ordinary creditor accounts 163 482 704 158 208 749
savings accounts 59 050 477 56 785 896
other amounts owing to customers 13 836 815 10 887 507
securities pledged under repo agreements 1 123 126 -
total principal 237 493 122 225 882 152
related debt 1 185 669 1 136 894
Value on the balance sheet 238 678 791 227 019 046
2.9.1 Amounts owing to customers at 30 June 2013 (thousand MAd)
2.9 Amounts owing to customers
06/30/2013 12/31/2012
Morocco 139 119 793 133 075 836
tunisia 19 552 525 18 624 173
sub-saharan Africa 34 745 391 32 058 207
Europe 42 712 951 41 816 622
other 1 362 462 307 315
total principal 237 493 122 225 882 152
related debt 1 185 669 1 136 894
Value on the balance sheet 238 678 791 227 019 046
2.9.2 Breakdown of amounts owing to customers by geographical area at 30 June 2013 (thousand MAd)
06/30/2013 12/31/2012
securities pledged under repo agreements 336 781 323 905
derivative instruments 770 765 648 254
Fair value on the balance sheet 1 107 546 972 159
2.7 Financial liabilities at fair value through income at 30 June 2013 (thousand MAd)

19Attijariwafa bank Results at 30 June 2013
06/30/2013 06/30/2012
income expenses net income expenses nettransactions with customers 7 388 908 1 741 848 5 647 060 7 196 942 1 543 509 5 653 433 Accounts and loans/borrowings 6 997 628 1 694 162 5 303 466 6 789 610 1 521 800 5 267 809 repurchase agreements 5 841 47 686 -41 845 2 259 21 709 -19 451 leasing activities 385 438 - 385 438 405 074 - 405 074 inter-bank transactions 382 844 856 080 -473 236 433 416 903 014 -469 598 Accounts and loans/borrowings 382 357 780 376 -398 020 429 396 861 462 -432 066 repurchase agreements 487 75 703 -75 216 4 020 41 552 -37 532 debt issued by the group - 620 315 -620 315 - 567 755 -567 755 Available-for-sale assets 612 440 - 612 440 468 234 - 468 234
total net interest income 8 384 191 3 218 242 5 165 949 8 098 592 3 014 279 5 084 313
3.1 net interest margin at 30 June 2013 (thousand MAd)
06/30/2013 06/30/2012
Additional provisions -1 111 106 -805 179
Provisions for loan impairment -1 026 666 -712 400 Provisions for signature loans -21 781 -3 510 other general provisions -62 659 -89 270
provision write-backs 398 198 290 136
Provision write-backs for loan impairment 292 499 230 619 Provisions write-backs for signature loans - - Provision write-backs for other general provisions 105 699 59 516
change in provisions -258 732 -78 455
losses on non-provisioned irrecoverable loans and advances -11 208 -13 088 losses on provisioned irrecoverable loans and advances -253 287 -83 265 Amounts recovered on impaired loans and advances 34 555 35 871 other losses -28 792 -17 973
cost of risk -971 640 -593 499
3.3 cost of risk at 30 June 2013 (thousand MAd)
income expenses net
net fees on transactions 1 015 721 22 332 993 389
with credit institutions 34 679 19 906 14 774
with customers 637 981 - 637 981
on securities 62 112 2 426 59 687
on foreign exchange 110 517 - 110 516
on forward financial instruments and other off-balance sheet transactions 170 431 - 170 431
Banking and financial services 1 074 506 142 761 931 746
Net income from mutual fund management (oPCVM) 132 191 7 626 124 565
Net income from payment services 579 957 100 706 479 252
Insurance products 74 317 74 317
other services 288 041 34 429 253 612
net fee income 2 090 227 165 093 1 925 134
3.2 net fee income at 30 June 2013 (thousand MAd)
4. Information per center of activitiesAttijariwafa bank’s information by business activity is presented as follows:• domestic banking, europe and offshore comprising Attijariwafa bank
sA, Attijariwafa bank Europe, Attijari International bank and holding companies incorporating the Group’s investments in the Group’s consolidated subsidiaries;
• Specialised Financial Subsidiaries comprising Moroccan subsidiaries undertaking consumer finance, mortgage loan, leasing, factoring and money transfer activities;
• international Retail Banking activities comprising Attijari bank tunisie and the banks located in sub-saharan Africa ;
• insurance and property comprising Wafa Assurance.
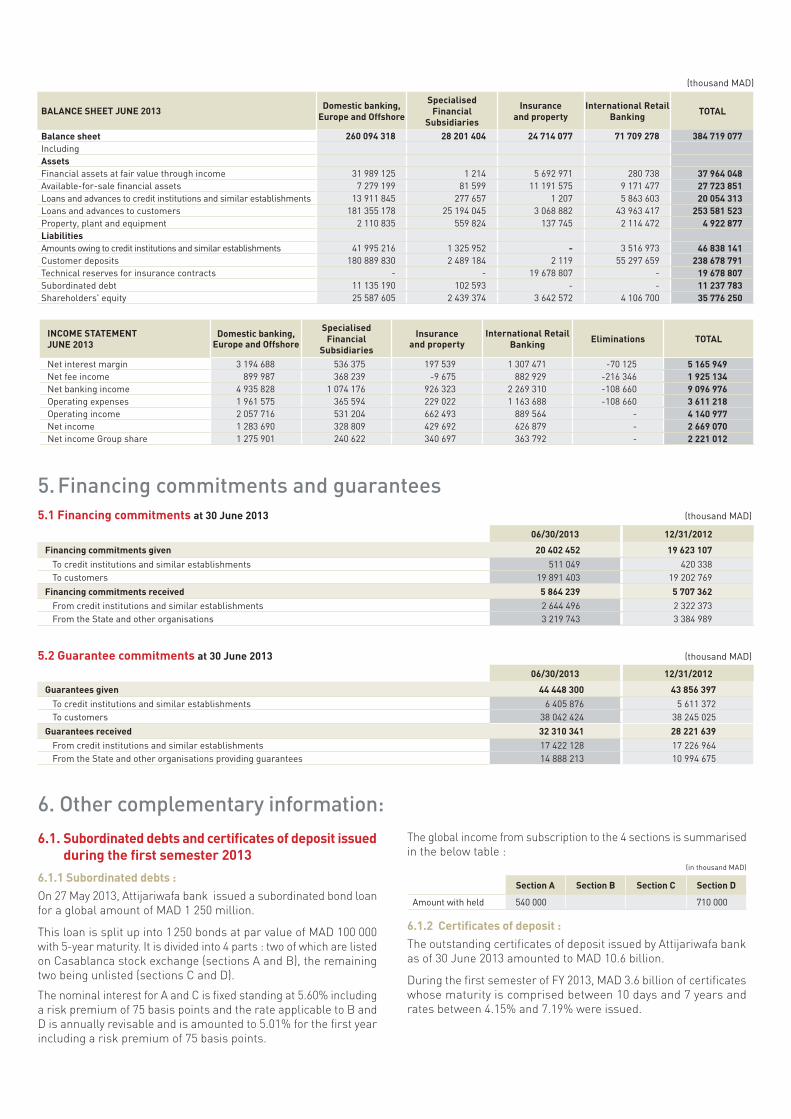
6. Other complementary information:
incoMe StAteMentJUne 2013
domestic banking, europe and offshore
SpecialisedFinancial
Subsidiaries
insurance and property
international Retail Banking eliminations totAl
Net interest margin 3 194 688 536 375 197 539 1 307 471 -70 125 5 165 949 Net fee income 899 987 368 239 -9 675 882 929 -216 346 1 925 134 Net banking income 4 935 828 1 074 176 926 323 2 269 310 -108 660 9 096 976 operating expenses 1 961 575 365 594 229 022 1 163 688 -108 660 3 611 218 operating income 2 057 716 531 204 662 493 889 564 - 4 140 977 Net income 1 283 690 328 809 429 692 626 879 - 2 669 070 Net income Group share 1 275 901 240 622 340 697 363 792 - 2 221 012
BAlAnce Sheet JUne 2013 domestic banking, europe and offshore
SpecialisedFinancial
Subsidiaries
insurance and property
international Retail Banking totAl
Balance sheet 260 094 318 28 201 404 24 714 077 71 709 278 384 719 077 IncludingAssetsFinancial assets at fair value through income 31 989 125 1 214 5 692 971 280 738 37 964 048 Available-for-sale financial assets 7 279 199 81 599 11 191 575 9 171 477 27 723 851 loans and advances to credit institutions and similar establishments 13 911 845 277 657 1 207 5 863 603 20 054 313 loans and advances to customers 181 355 178 25 194 045 3 068 882 43 963 417 253 581 523 Property, plant and equipment 2 110 835 559 824 137 745 2 114 472 4 922 877 liabilitiesAmounts owing to credit institutions and similar establishments 41 995 216 1 325 952 - 3 516 973 46 838 141 Customer deposits 180 889 830 2 489 184 2 119 55 297 659 238 678 791 technical reserves for insurance contracts - - 19 678 807 - 19 678 807 subordinated debt 11 135 190 102 593 - - 11 237 783 shareholders' equity 25 587 605 2 439 374 3 642 572 4 106 700 35 776 250
(thousand MAd)
5. Financing commitments and guarantees
6.1. Subordinated debts and certificates of deposit issued during the first semester 2013
6.1.1 Subordinated debts :On 27 May 2013, Attijariwafa bank issued a subordinated bond loan for a global amount of MAD 1 250 million.
This loan is split up into 1 250 bonds at par value of MAD 100 000 with 5-year maturity. It is divided into 4 parts : two of which are listed on Casablanca stock exchange (sections A and B), the remaining two being unlisted (sections C and D).
The nominal interest for A and C is fixed standing at 5.60% including a risk premium of 75 basis points and the rate applicable to B and D is annually revisable and is amounted to 5.01% for the first year including a risk premium of 75 basis points.
The global income from subscription to the 4 sections is summarised in the below table :
(in thousand MAd)
Section A Section B Section c Section d
Amount with held 540 000 710 000
6.1.2 certificates of deposit :The outstanding certificates of deposit issued by Attijariwafa bank as of 30 June 2013 amounted to MAD 10.6 billion.
During the first semester of FY 2013, MAD 3.6 billion of certificates whose maturity is comprised between 10 days and 7 years and rates between 4.15% and 7.19% were issued.
5.1 Financing commitments at 30 June 2013 (thousand MAd)
5.2 guarantee commitments at 30 June 2013 (thousand MAd)
06/30/2013 12/31/2012
Financing commitments given 20 402 452 19 623 107
to credit institutions and similar establishments 511 049 420 338to customers 19 891 403 19 202 769
Financing commitments received 5 864 239 5 707 362 From credit institutions and similar establishments 2 644 496 2 322 373From the state and other organisations 3 219 743 3 384 989
06/30/2013 12/31/2012
guarantees given 44 448 300 43 856 397 to credit institutions and similar establishments 6 405 876 5 611 372to customers 38 042 424 38 245 025
guarantees received 32 310 341 28 221 639 From credit institutions and similar establishments 17 422 128 17 226 964From the state and other organisations providing guarantees 14 888 213 10 994 675
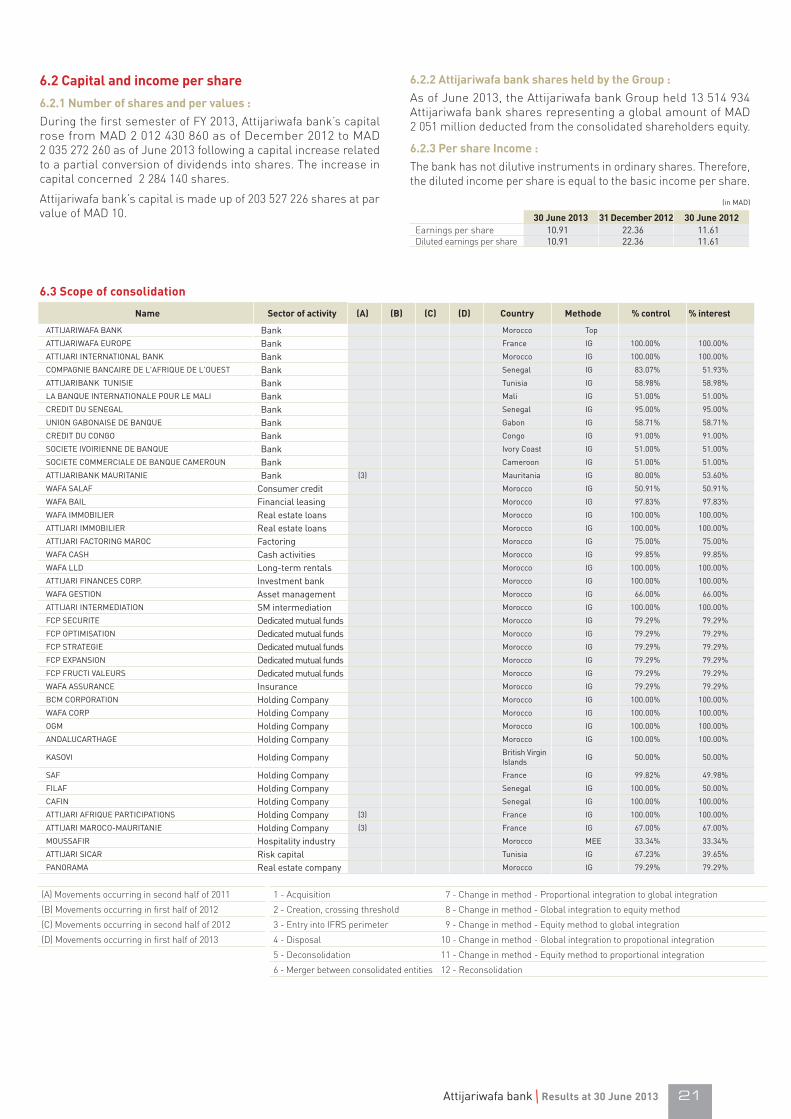
21Attijariwafa bank Results at 30 June 2013
name Sector of activity (A) (B) (c) (d) country Methode % control % interest
AttIjArIWAFA BANK Bank Morocco top
AttIjArIWAFA EuroPE Bank France IG 100.00% 100.00%
AttIjArI INtErNAtIoNAl BANK Bank Morocco IG 100.00% 100.00%
CoMPAGNIE BANCAIrE dE l'AFrIquE dE l'ouEst Bank senegal IG 83.07% 51.93%
AttIjArIBANK tuNIsIE Bank tunisia IG 58.98% 58.98%
lA BANquE INtErNAtIoNAlE Pour lE MAlI Bank Mali IG 51.00% 51.00%
CrEdIt du sENEGAl Bank senegal IG 95.00% 95.00%
uNIoN GABoNAIsE dE BANquE Bank Gabon IG 58.71% 58.71%
CrEdIt du CoNGo Bank Congo IG 91.00% 91.00%
soCIEtE IVoIrIENNE dE BANquE Bank Ivory Coast IG 51.00% 51.00%
soCIEtE CoMMErCIAlE dE BANquE CAMErouN Bank Cameroon IG 51.00% 51.00%
AttIjArIBANK MAurItANIE Bank (3) Mauritania IG 80.00% 53.60%
WAFA sAlAF Consumer credit Morocco IG 50.91% 50.91%
WAFA BAIl Financial leasing Morocco IG 97.83% 97.83%
WAFA IMMoBIlIEr real estate loans Morocco IG 100.00% 100.00%
AttIjArI IMMoBIlIEr real estate loans Morocco IG 100.00% 100.00%
AttIjArI FACtorING MAroC Factoring Morocco IG 75.00% 75.00%
WAFA CAsH Cash activities Morocco IG 99.85% 99.85%
WAFA lld long-term rentals Morocco IG 100.00% 100.00%
AttIjArI FINANCEs CorP. Investment bank Morocco IG 100.00% 100.00%
WAFA GEstIoN Asset management Morocco IG 66.00% 66.00%
AttIjArI INtErMEdIAtIoN sM intermediation Morocco IG 100.00% 100.00%
FCP sECurItE dedicated mutual funds Morocco IG 79.29% 79.29%
FCP oPtIMIsAtIoN dedicated mutual funds Morocco IG 79.29% 79.29%
FCP strAtEGIE dedicated mutual funds Morocco IG 79.29% 79.29%
FCP EXPANsIoN dedicated mutual funds Morocco IG 79.29% 79.29%
FCP FruCtI VAlEurs dedicated mutual funds Morocco IG 79.29% 79.29%
WAFA AssurANCE Insurance Morocco IG 79.29% 79.29%
BCM CorPorAtIoN Holding Company Morocco IG 100.00% 100.00%
WAFA CorP Holding Company Morocco IG 100.00% 100.00%
oGM Holding Company Morocco IG 100.00% 100.00%
ANdAluCArtHAGE Holding Company Morocco IG 100.00% 100.00%
KAsoVI Holding Company British Virgin Islands IG 50.00% 50.00%
sAF Holding Company France IG 99.82% 49.98%
FIlAF Holding Company senegal IG 100.00% 50.00%
CAFIN Holding Company senegal IG 100.00% 100.00%
AttIjArI AFrIquE PArtICIPAtIoNs Holding Company (3) France IG 100.00% 100.00%
AttIjArI MAroCo-MAurItANIE Holding Company (3) France IG 67.00% 67.00%
MoussAFIr Hospitality industry Morocco MEE 33.34% 33.34%
AttIjArI sICAr risk capital tunisia IG 67.23% 39.65%
PANorAMA real estate company Morocco IG 79.29% 79.29%
1 - Acquisition 7 - Change in method - Proportional integration to global integration
2 - Creation, crossing threshold 8 - Change in method - Global integration to equity method
3 - Entry into IFRS perimeter 9 - Change in method - Equity method to global integration
4 - Disposal 10 - Change in method - Global integration to propotional integration
5 - Deconsolidation 11 - Change in method - Equity method to proportional integration
6 - Merger between consolidated entities 12 - Reconsolidation
6.3 Scope of consolidation
(A) Movements occurring in second half of 2011
(B) Movements occurring in first half of 2012
(C) Movements occurring in second half of 2012
(D) Movements occurring in first half of 2013
6.2 capital and income per share
6.2.1 number of shares and per values :During the first semester of FY 2013, Attijariwafa bank’s capital rose from MAD 2 012 430 860 as of December 2012 to MAD 2 035 272 260 as of June 2013 following a capital increase related to a partial conversion of dividends into shares. The increase in capital concerned 2 284 140 shares.
Attijariwafa bank’s capital is made up of 203 527 226 shares at par value of MAD 10.
6.2.2 Attijariwafa bank shares held by the group :As of June 2013, the Attijariwafa bank Group held 13 514 934 Attijariwafa bank shares representing a global amount of MAD 2 051 million deducted from the consolidated shareholders equity.
6.2.3 per share income :The bank has not dilutive instruments in ordinary shares. Therefore, the diluted income per share is equal to the basic income per share.
(in MAd)
30 June 2013 31 december 2012 30 June 2012Earnings per share 10.91 22.36 11.61Diluted earnings per share 10.91 22.36 11.61

1. Presentation
Attijariwafa bank is a Moroccan company governed by common law. The financial statements comprise the accounts of head office as well as branches in Morocco and overseas, including the branch offices in Brussels. Material intra-group transactions and balances between Moroccan entities and overseas branches have been eliminated.
2. General principles
The financial statements are prepared in accordance with generally accepted accounting principles applicable to credit institutions.
The presentation of Attijariwafa bank’s financial statements complies with the Credit Institution Accounting Plan.
3. Loans and signature loans
General presentation of loans
• Loans and advances to credit institutions and customers are classified according to their initial maturity and type:
- Sight and term loans in the case of credit institutions;
- Short-term loans, equipment loans, consumer loans, mortgage loans and other loans for customers.
• Signature loans accounted for off-balance sheet relate to transactions which have not yet given rise to cash movements such as irrevocable commitments for the undrawn portion of facilities made available to credit institutions and customers or guarantees given;
• Repo transactions, involving shares or other securities, are recorded under the different loan categories (credit institutions or customers);
• Interest accrued on these loans is recorded under related loans and booked to the income statement.
non-performing loans on customers
• Non-performing loans on customers are recorded and valued in accordance with prevailing banking regulations.
The main measures applied are summarised as follows:
- Non-performing loans are classified as sub-standard, doubtful or impaired depending on the level of risk;
After deducting the guarantee portion as required by prevailing regulations, provisions for non-performing loans are made as follows:
- 20% for sub-standard loans;
- 50% for doubtful loans;
- 100% for impaired loans.
Provisions made relating to credit risks are deducted from the asset classes in question.
• As soon as loans are classified as non-performing, interest is no longer accrued but is recognised as income when received;
• Losses on irrecoverable loans are booked when the possibility of recovering the non-performing loans is deemed to be zero;
• Provisions for non-performing loans are written-back on any positive development in respect of the non-performing loans in question, such as partial or full repayment or a restructuring of the debt with partial repayment.
• The bank has written off non-performing loans using provisions set aside for this purpose.
4. Amounts owing to credit institutions and
customers
Amounts owing to credit institutions and customers are presented in the financial statements according to their initial maturity and type:
- Sight and term borrowings in the case of credit institutions;
- Current accounts in credit, savings accounts, terms deposits and other customer accounts in credit in the case of customers.
Repo transactions, involving shares or other securities, are recorded under the different loan categories (credit institutions or customers), depending on the counterparty;
Interest accrued on these loans is recorded under related borrowings and booked to the income statement.
5. Securities portfolio
5.1 General presentation
Securities transactions are booked and valued in accordance with the Plan Comptable des Etablissements de Crédit.
Securities are classified as a function of their legal characteristics (debt security or equity security) and the purpose for which they are acquired (trading securities, available-for-sale securities, investment securities and investments in affiliates).
5.2 Trading securities
Trading securities are securities which are highly liquid and are acquired with the intention of being resold in the very near future. These securities are recorded at cost (including coupon). At the end of each period, the difference between this value and their market value is recognised directly in the income statement.
5.3 Available-for-sale securities
Available-for-sale securities are securities acquired with the intention of being held for at least 6 months, except for fixed income securities intended to be held until maturity. AFS securities comprise all securities that do not satisfy the criteria required to be classified in another category.
Parent company financial statements at 30 June 2013FINANCIAL STATEMENTS
13

23Attijariwafa bank Results at 30 June 2013
Debt securities are booked excluding accrued interest. The difference between their purchase price and redemption price is amortised over the security’s remaining life.
Equities are recorded at cost less acquisition expenses.
At the end of each period, a provision for impairment is made for any negative difference between a security’s market value and carrying amount. Unrealised gains are not booked.
5.4. Investment securities
Investment securities are debt securities which are acquired, or which come from another category of securities, with the intention of being held until maturity for the purpose of generating regular income over a long period.
These securities are recorded at cost less acquisition expenses. The difference between their purchase price and redemption price is amortised over the security’s remaining life.
At the end of each period, these securities are recorded at cost, regardless of their market value. Unrealised profit or loss is therefore not recognised.
5.5. Investments in affiliates
This category comprises securities whose long-term ownership is deemed useful to the Bank.
At the end of each period, their value is estimated on the basis of generally accepted criteria such as useful value, share of net assets, future outlook for earnings and share price. Only unrealised losses give rise to provisions for impairment on a case-by-case basis.
5.6. Repos with physical delivery
This category comprises securities which are expected to be useful to the bank if held over the long term.
At the end of each period, their value is estimated on the basis of generally accepted criteria such as useful value, share of net assets, future outlook for earnings and share price. Only unrealised losses give rise to provisions for impairment on a case-by-case basis.
6. Foreign currency-denominated transactions
Foreign currency-denominated loans, amounts owing and signature loans are translated into dirhams at the average exchange rate prevailing on the balance sheet date.
Any foreign exchange difference on contributions from overseas branches and on foreign currency-denominated borrowings for hedging exchange rate risk is recorded in the balance sheet under "Other assets” or “Other liabilities” as appropriate. Any translation difference arising on translation of long-term investment securities acquired in a foreign currency is recorded as a translation difference for each category of security in question.
Any foreign exchange difference on any other foreign currency account is posted to the income statement. Income and expenses in foreign currency are translated at the exchange rate prevailing on the day they are booked.
7. Translation of financial statements drawn up
in foreign currencies
The “closing rate” method is used to translate foreign currency-denominated financial statements.
translation of balance sheet and off-balance sheet items
All assets, liabilities and off-balance sheet items of foreign entities (Brussels branch offices) are translated at the exchange rate prevailing on the balance sheet date.
Shareholders’ equity (excluding net income for the current period) is valued at different historical rates. Any difference arising on restatement (closing rate less historical rate) is recorded in shareholders’ equity under “Translation differences”.
translation of income statement items
All income statement items are translated at the average exchange rate over the year except for depreciation and amortisation expenses, which are translated at the closing rate.
8. General provisions
These provisions are made, at the discretion of the management, to address future risks which cannot be currently identified or accurately measured relating to the banking activity.
Provisions made qualify for a tax write-back.
9. Intangible assets and property, plant and
equipment
Intangible assets and property, plant and equipment are recorded in the balance sheet at cost less accumulated depreciation and amortisation, calculated using the straight line method over the estimated use life of the assets in question.
Intangible assets are categorised as operating or non-operating assets and are amortised over the following periods:
type Amortisation period
- Lease rights not amortised
- Patents and brands N/A
- Research and development N/A
- IT software 6.67 years
- Other items of goodwill 5 years
Property, plant and equipment are categorised as operating or non-operating assets and are depreciated over the following periods:
type depreciation period
- Land not depreciated
- Operating premises 25 years
- Office furniture 6.67 years
- IT hardware 6.67 years
- Vehicles 5 years
- Fixtures, fittings and equipment 6.67 years

10. Deferred expenses
Deferred expenses are expenses which, given their size and nature, are likely to relate to more than one period.
Deferred expenses are amortised over the following periods:
type Amortisation period
- Start-up costs 3 years
- Expenses incurred in acquiring
fixed assets 5 years
- Bond issuance expenses N/A
- Premiums paid on issuing
or redeeming debt securities N/A
- Other deferred expenses 3-5 years on a case by case basis
11. Recognition of interest and fees in the income
statement
interest
Income and expenses calculated on principal amounts actually lent or borrowed are considered as interest.
Income and expenses calculated on a prorata temporis basis which remunerate a risk are considered as similar income or expenses. This category includes fees on guarantee and financing commitments (guarantees, documentary credits etc.).
Interest accrued on principal amounts actually lent or borrowed is booked under related loans or debt with an offsetting entry in the income statement entry.
Similar income or expenses are recorded under income or expenses when invoiced.
Fees
Income and expenses, calculated on a flat-rate basis for a service provided, are recorded under fees when invoiced.
12. Non-recurring items of income and expenditure
They consist exclusively of income and expenses arising on an exceptional basis and are, in principle, rare in that they are unusual in nature or occur infrequently.
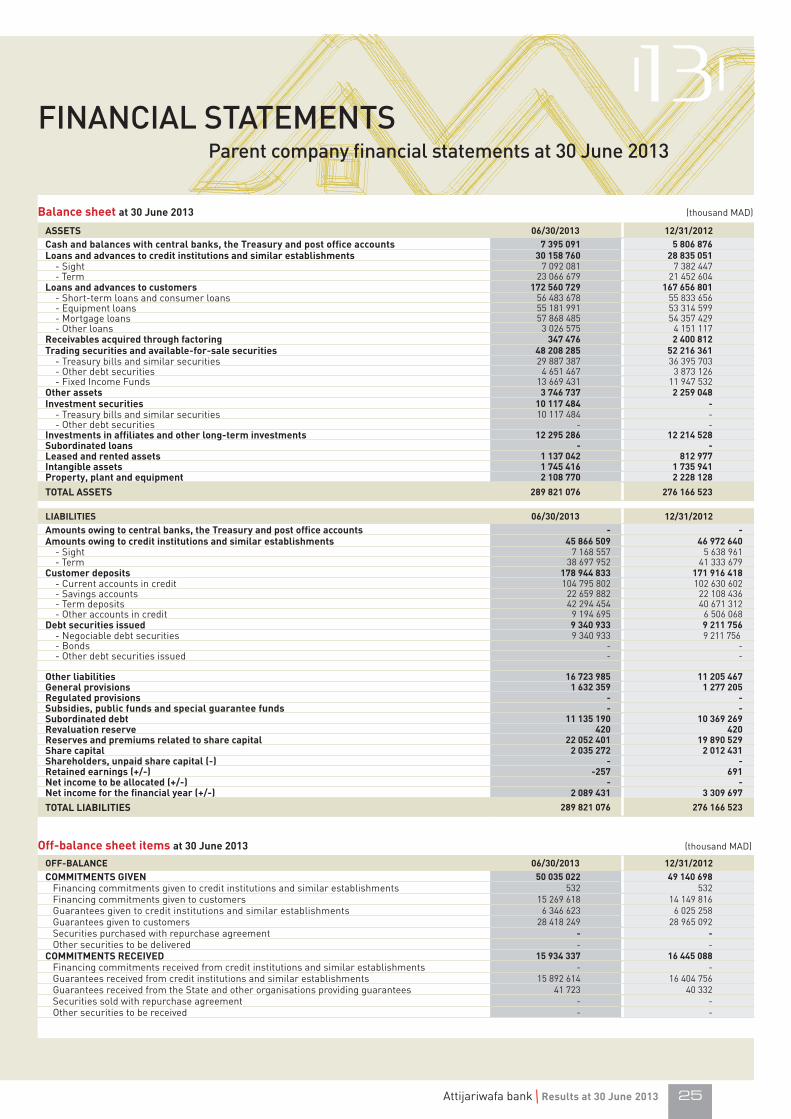
13
25Attijariwafa bank Results at 30 June 2013
ASSetS 06/30/2013 12/31/2012cash and balances with central banks, the treasury and post office accounts 7 395 091 5 806 876 loans and advances to credit institutions and similar establishments 30 158 760 28 835 051
- sight 7 092 081 7 382 447 - term 23 066 679 21 452 604
loans and advances to customers 172 560 729 167 656 801 - short-term loans and consumer loans 56 483 678 55 833 656 - Equipment loans 55 181 991 53 314 599 - Mortgage loans 57 868 485 54 357 429 - other loans 3 026 575 4 151 117
Receivables acquired through factoring 347 476 2 400 812 trading securities and available-for-sale securities 48 208 285 52 216 361
- treasury bills and similar securities 29 887 387 36 395 703 - other debt securities 4 651 467 3 873 126 - Fixed Income Funds 13 669 431 11 947 532
other assets 3 746 737 2 259 048 investment securities 10 117 484 -
- treasury bills and similar securities 10 117 484 - - other debt securities - -
investments in affiliates and other long-term investments 12 295 286 12 214 528 Subordinated loans - - leased and rented assets 1 137 042 812 977 intangible assets 1 745 416 1 735 941 property, plant and equipment 2 108 770 2 228 128
totAl ASSetS 289 821 076 276 166 523
liABilitieS 06/30/2013 12/31/2012Amounts owing to central banks, the treasury and post office accounts - - Amounts owing to credit institutions and similar establishments 45 866 509 46 972 640
- sight 7 168 557 5 638 961 - term 38 697 952 41 333 679
customer deposits 178 944 833 171 916 418 - Current accounts in credit 104 795 802 102 630 602 - savings accounts 22 659 882 22 108 436 - term deposits 42 294 454 40 671 312 - other accounts in credit 9 194 695 6 506 068
debt securities issued 9 340 933 9 211 756 - Negociable debt securities 9 340 933 9 211 756 - Bonds - - - other debt securities issued - -
other liabilities 16 723 985 11 205 467 general provisions 1 632 359 1 277 205 Regulated provisions - - Subsidies, public funds and special guarantee funds - - Subordinated debt 11 135 190 10 369 269 Revaluation reserve 420 420 Reserves and premiums related to share capital 22 052 401 19 890 529 Share capital 2 035 272 2 012 431 Shareholders, unpaid share capital (-) - - Retained earnings (+/-) -257 691 net income to be allocated (+/-) - - net income for the financial year (+/-) 2 089 431 3 309 697
totAl liABilitieS 289 821 076 276 166 523
Balance sheet at 30 June 2013 (thousand MAd)
oFF-BAlAnce 06/30/2013 12/31/2012coMMitMentS giVen 50 035 022 49 140 698
Financing commitments given to credit institutions and similar establishments 532 532 Financing commitments given to customers 15 269 618 14 149 816 Guarantees given to credit institutions and similar establishments 6 346 623 6 025 258 Guarantees given to customers 28 418 249 28 965 092 securities purchased with repurchase agreement - - other securities to be delivered - -
coMMitMentS ReceiVed 15 934 337 16 445 088 Financing commitments received from credit institutions and similar establishments - - Guarantees received from credit institutions and similar establishments 15 892 614 16 404 756 Guarantees received from the state and other organisations providing guarantees 41 723 40 332 securities sold with repurchase agreement - - other securities to be received - -
off-balance sheet items at 30 June 2013 (thousand MAd)
Parent company financial statements at 30 June 2013FINANCIAL STATEMENTS
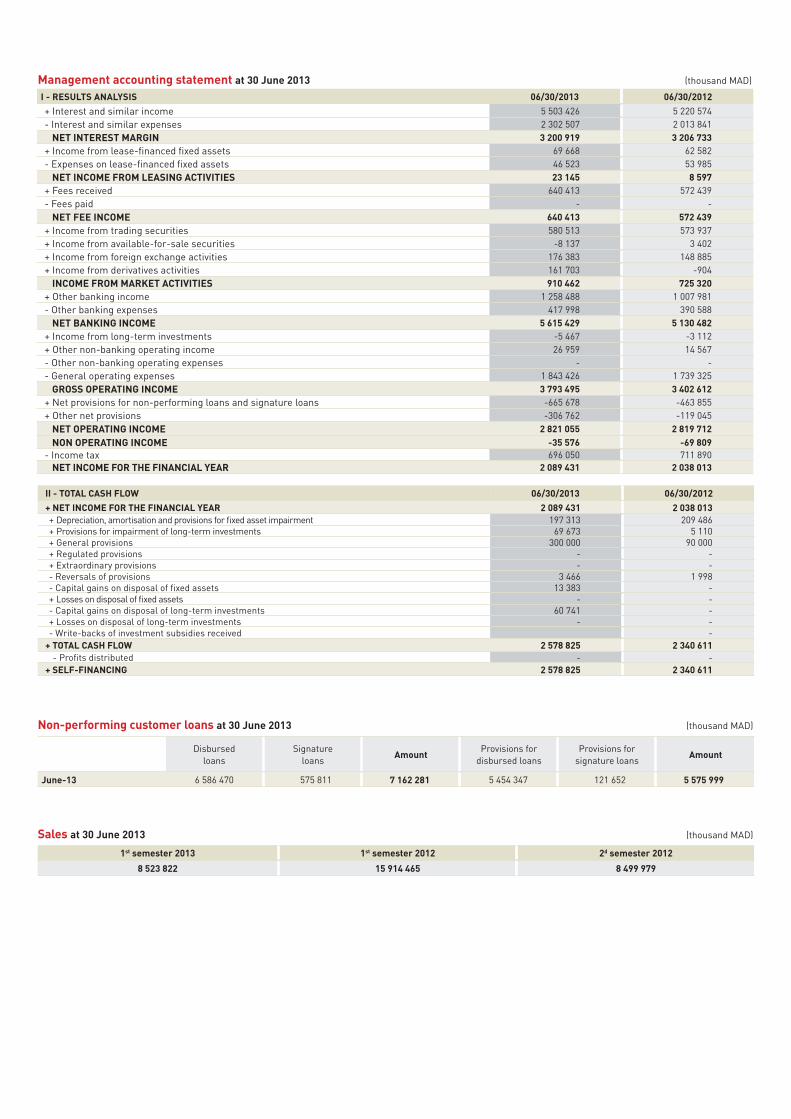
i - ReSUltS AnAlYSiS 06/30/2013 06/30/2012
+ Interest and similar income 5 503 426 5 220 574 - Interest and similar expenses 2 302 507 2 013 841
net inteReSt MARgin 3 200 919 3 206 733 + Income from lease-financed fixed assets 69 668 62 582 - Expenses on lease-financed fixed assets 46 523 53 985
net incoMe FRoM leASing ActiVitieS 23 145 8 597 + Fees received 640 413 572 439 - Fees paid - -
net Fee incoMe 640 413 572 439 + Income from trading securities 580 513 573 937 + Income from available-for-sale securities -8 137 3 402 + Income from foreign exchange activities 176 383 148 885 + Income from derivatives activities 161 703 -904
incoMe FRoM MARKet ActiVitieS 910 462 725 320 + other banking income 1 258 488 1 007 981 - other banking expenses 417 998 390 588
net BAnKing incoMe 5 615 429 5 130 482 + Income from long-term investments -5 467 -3 112 + other non-banking operating income 26 959 14 567 - other non-banking operating expenses - - - General operating expenses 1 843 426 1 739 325
gRoSS opeRAting incoMe 3 793 495 3 402 612 + Net provisions for non-performing loans and signature loans -665 678 -463 855 + other net provisions -306 762 -119 045
net opeRAting incoMe 2 821 055 2 819 712 non opeRAting incoMe -35 576 -69 809
- Income tax 696 050 711 890 net incoMe FoR the FinAnciAl YeAR 2 089 431 2 038 013
Management accounting statement at 30 June 2013 (thousand MAd)
ii - totAl cASh FloW 06/30/2013 06/30/2012
+ net incoMe FoR the FinAnciAl YeAR 2 089 431 2 038 013 + depreciation, amortisation and provisions for fixed asset impairment 197 313 209 486 + Provisions for impairment of long-term investments 69 673 5 110 + General provisions 300 000 90 000 + regulated provisions - - + Extraordinary provisions - - - reversals of provisions 3 466 1 998 - Capital gains on disposal of fixed assets 13 383 - + losses on disposal of fixed assets - - - Capital gains on disposal of long-term investments 60 741 - + losses on disposal of long-term investments - - - Write-backs of investment subsidies received -
+ totAl cASh FloW 2 578 825 2 340 611 - Profits distributed - -
+ SelF-FinAncing 2 578 825 2 340 611
non-performing customer loans at 30 June 2013 (thousand MAd)
Sales at 30 June 2013 (thousand MAd)
disbursedloans
signatureloans
AmountProvisions for
disbursed loansProvisions for
signature loansAmount
June-13 6 586 470 575 811 7 162 281 5 454 347 121 652 5 575 999
1st semester 2013 1st semester 2012 2d semester 2012
8 523 822 15 914 465 8 499 979

27Attijariwafa bank Results at 30 June 2013
06/30/2013 06/30/2012opeRAting incoMe FRoM BAnKing ActiVitieS 8 523 822 8 499 979 Interest and similar income from transactions with credit institutions 533 323 541 138 Interest and similar income from transactions with customers 4 742 250 4 555 091 Interest and similar income from debt securities 227 853 124 344 Income from equity securities 1 258 488 1 007 982 Income from lease-financed fixed assets 69 668 62 582 Fee income 640 413 572 439 other banking income 1 051 827 1 636 403 opeRAting eXpenSeS on BAnKing ActiVitieS 2 908 393 3 369 497 Interest and similar expenses on transactions with credit institutions 613 462 556 582 Interest and similar expenses on transactions with customers 1 508 578 1 247 346 Interest and similar expenses on debt securities issued 180 467 209 913 Expenses on lease-financed fixed assets 46 523 53 985 other banking expenses 559 363 1 301 671 net BAnKing incoMe 5 615 429 5 130 482 Non-banking operating income 87 700 14 567 Non-banking operating expenses - opeRAting eXpenSeS 1 843 425 1 739 325 staff costs 851 339 817 681 taxes other than on income 53 363 50 021 External expenses 738 019 659 844 other general operating expenses 3 391 2 293 depreciation, amortisation and provisions 197 313 209 486 pRoViSionS And loSSeS on iRRecoVeRABle loAnS 1 324 398 760 538 Provisions for non-performing loans and signature loans 796 023 569 699 losses on irrecoverable loans 115 347 38 951 other provisions 413 028 151 888 pRoViSion WRite-BAcKS And AMoUntS RecoVeRed on iMpAiRed loAnS 285 751 174 526 Provision write-backs for non-performing loans and signature loans 218 261 115 823 Amounts recovered on impaired loans 27 432 28 972 other provision write-backs 40 058 29 731 incoMe FRoM oRdinARY ActiVitieS 2 821 057 2 819 712 Non-recurring income 2 186 21 Non-recurring expenses 37 761 69 830 pRe-tAX incoMe 2 785 482 2 749 903 Income tax 696 050 711 890 net incoMe FoR the FinAnciAl YeAR 2 089 431 2 038 013
income statement at 30 June 2013 (thousand MAd)
06/30/2013 12/31/2012 1. (+) operating income from banking activities 7 160 368 14 641 960 2. (+) Amounts recovered on impaired loans 27 432 87 340 3. (+) Non-banking operating income 15 762 73 467 4. (-) operating expenses on banking activities (*) -3 442 073 -6 829 065 5. (-) Non-banking operating expenses 6. (-) General operating expenses -1 646 112 -3 154 903 7. (-) Income tax -696 050 -1 510 015i. net cASh FloW FRoM incoMe StAteMent 1 419 327 3 308 784 Change in: 8. (±) loans and advances to credit institutions and similar establishments -1 323 709 604 431
9. (±) loans and advances to customers -2 850 592 -11 842 94810. (±) trading securities and available-for-sale securities 4 008 076 -14 676 08811. (±) other assets -1 487 689 -93 40612. (±) lease-financed fixed assets -324 065 -117 20413. (±) Amounts owing to credit institutions and similar establishments -1 106 131 11 333 98714. (±) Customer deposits 7 028 415 6 325 96715. (±) debt securities issued 129 177 -977 47116. (±) other liabilities 5 518 518 1 991 072ii. net chAnge in opeRAting ASSetS And liABilitieS 9 592 000 -7 451 660iii. net cASh FloW FRoM opeRAting ActiVitieS (i + ii) 11 011 327 -4 142 87617. (+) Income from the disposal of long-term investments 58 18518. (+) Income from the disposal of fixed assets 99 174 295 99019. (-) Acquisition of long-term investments -10 026 635 -29 90620. (-) Acquisition of fixed assets -173 247 -469 86121. (+) Interest received 104 96622. (+) dividends received 1 258 488 1 272 505iV. net cASh FloW FRoM inVeStMent ActiVitieS -8 679 069 1 068 72823. (+) subsidies, public funds and special guarantee funds24. (+) subordinated loan issuance 616 10025. (+) Equity issuance 685 242 2 099 99926. (-) repayment of shareholders’ equity and equivalent 27. (-) Interest paid -234 197 -462 35228. (-) dividends paid -1 811 188 -1 640 466V- net cASh FloW FRoM FinAncing ActiVitieS -744 043 -2 819Vi- net chAnge in cASh And cASh eQUiVAlentS 1 588 215 -3 076 967Vii- cASh And cASh eQUiVAlentS At the Beginning oF the peRiod 5 806 876 8 883 843Viii- cASh And cASh eQUiVAlentS At the end oF the peRiod 7 395 091 5 806 876(*) including net provisions
cash flow statement at 30 June 2013 (thousand MAd)

tYpe oF depARtURe ReASonSFoR depARtUReS
iMpAct oF depARtUReS onthe coMpAnY’S FinAnciAl
poSition oR ReSUltSI. Departures from fundamental accounting principles Not applicable Not applicableII. Departures from valuation methods Not applicable Not applicableIII. Departures from rules for drawing up and presenting the financial statements Not applicable Not applicable
Statement of departures from standard accounting treatment at 30 June 2013
nAtURe oF chAngeS ReASonS FoR chAngeS iMpAct oF chAngeS on the coMpAnY’S FinAnciAl poSition oR ReSUltS
I. Changes in valuation methods Not applicable Not applicableII. Changes in rules of presentation Not applicable Not applicable
Statement of changes in accounting methods at 30 June 2013
loans and advances to credit institutions and similar establishments at 30 June 2013 (thousand MAd)
loAnS And AdVAnceSBank Al Maghrib, the
treasury and post office accounts
Banksother credit institutions
or equivalent in Morocco
credit institutions abroad
total06/30/2013
total12/31/2012
cURRent AccoUntS in deBit 4 982 760 2 049 445 4 802 098 11 834 303 10 574 704noteS ReceiVed AS SecURitY- overnight- term
cASh loAnS 128 089 9 992 918 220 672 10 341 679 11 195 697- overnight 128 089 128 089- term 9 992 918 220 672 10 213 590 11 195 697
FinAnciAl loAnS 2 664 901 9 995 015 12 659 916 10 127 257otheR loAnS 90 381 25 214 90 620 124 161inteReSt AccRUed AWAiting Receipt 211 842 3 998 215 840 159 277non-peRFoRMing loAnS
totAl 4 982 760 2 883 371 22 249 245 5 026 982 35 142 358 32 181 096
loans and advances to customers at 30 June 2013 (thousand MAd)
loAnS And AdVAnceS public sectorprivate sector
total06/30/2013
total12/31/2012Financial
companiesnon-financial
companiesother custo-
mersShoRt-teRM loAnS 2 669 370 840 351 40 493 190 3 101 752 47 104 663 47 028 924- Current accounts in debit 976 043 830 351 21 919 837 2 629 348 26 355 579 25 490 771- Commercial loans within Morocco 4 542 382 4 542 382 5 018 581- Export loans 365 941 365 941 437 395- Other cash loans 1 693 327 10 000 13 665 030 472 404 15 840 761 16 082 177
conSUMeR loAnS 562 903 8 028 897 8 591 800 8 077 306eQUipMent loAnS 27 400 687 24 368 732 2 417 560 54 186 979 52 495 745MoRtgAge loAnS 12 639 16 146 623 41 708 477 57 867 739 54 349 333otheR loAnS 6 1 170 530 714 1 361 902 1 893 792 3 205 398ReceiVABleS AcQUiRed thRoUgh FActoRing 347 331 347 331 2 400 812inteReSt AccRUed AWAiting Receipt 1 719 785 63 993 1 783 778 1 554 637non-peRFoRMing loAnS 1 363 25 329 770 370 335 061 1 132 123 945 458- Sub-standard loans 30 60 480 60 510- Doubtful loans 39 810 149 052 188 862- Impaired loans 1 363 25 329 730 530 125 529 882 751 945 458
totAl 30 084 065 866 850 84 939 648 57 017 641 172 908 205 170 057 613
Breakdown of trading securities, available-for-sale securities and investment securitiesby category of issuer at 30 June 2013 (thousand MAd)
SecURitieScredit institutions and similar esta-
blishmentspublic issuers
private issuerstotAl
06/30/2013totAl
12/31/2012Financialcompanies
non-financial companies
liSted SecURitieS 90 150 - 16 628 825 579 080 17 298 055 14 676 225
- Treasury bills and similar instruments - -
- Bonds - 208 931 208 931 -
- Other debt securities 87 009 3 156 705 207 213 3 450 927 2 764 746
- Fixed Income Funds 3 141 13 472 120 162 936 13 638 197 11 911 479
UnliSted SecURitieS 324 400 38 060 146 363 2 642 806 41 027 715 37 540 136
- Treasury bills and similar instruments 37 391 849 2 613 022 40 004 871 36 395 703
- Bonds 323 312 668 297 - 991 609 1 108 380
- Other debt securities
- Fixed Income Funds 1 088 363 29 784 31 234 36 053
totAl 414 550 38 060 146 16 629 187 3 221 886 58 325 769 52 216 361

29Attijariwafa bank Results at 30 June 2013
Value of trading securities, available-for-sale securities and investment securities at 30 June 2013 (thousand MAd)
SecURitieS gross bookvalue
currentvalue
Redemptionvalue
Unrealisedcapital gains
Unrealisedlosses provisions
tRAding SecURitieS 42 997 003 42 997 003
- Treasury bills and similar instruments 25 714 113 25 714 113 - Bonds 208 931 208 931 - Other debt securities 3 450 928 3 450 928 - Fixed Income Funds 13 623 031 13 623 031
AVAilABle-FoR-SAle SecURitieS 5 252 038 5 211 282 42 440 40 756 40 756
- Treasury bills and similar instruments 4 185 408 4 173 274 35 592 12 134 12 134 - Bonds 1 000 219 991 609 3 678 8 610 8 610 - Other debt securities - - Fixed Income Funds 66 411 46 399 3 170 20 012 20 012
inVeStMent SecURitieS 10 117 484 10 117 484
- Treasury bills and similar instruments 10 117 484 10 117 484 - Bonds- Other debt securities
details of other assets at 30 June 2013 (thousand MAd)
ASSetS AMoUnt At 06/30/2013 AMoUnt At 12/31/2012
optionS pURchASed 48 040 48 040SUndRY SecURitieS tRAnSActionS (1)
SUndRY deBtoRS 494 174 297 275Amounts due from the State 304 116 175 047Amounts due from mutual societiesSundry amounts due from staffAmounts due from customers for non-banking services 468 437Other sundry debtors 189 590 121 791
otheR SUndRY ASSetS 573 2 612AccRUAlS And SiMilAR 3 087 835 1 795 596
Adjustment accounts for off-balance sheet transactions 312 413 515 768Translation differences for foreign currencies and securities 75 75Income from derivative products and hedgingDeferred expenses 17 481 16 159Inter-company accounts between head office, branch offices and branches in Morocco 896 4 718Accounts receivable and prepaid expenses 2 369 938 1 005 149Other accruals and similar 387 032 253 727
non-peRFoRMing loAnS on SUndRY tRAnSActionS 116 115 115 525
totAl 3 746 737 2 259 048
(1) PCEC 341, 3463 and 3469 if in debit
cAtegoRY
gross amount at the begin-
ning of the exercise
Amount of acquisitions during the exercise
Amount of transfers or withdrawals during the exercise
gross amount at the end of
the exercise
depreciation provisions net amountat the end
of the exercise
Allocation during
the exercise
Aggregate depreciate
Allocation in the
exercise
provision write
downs
Aggregate provisions
leASed And Rented ASSetS 1 321 436 314 560 -26 939 1 666 256 46 523 529 214 1 137 042
leASed intAngiBle ASSetS
equipment leasing 1 293 002 312 638 -30 764 1 636 404 46 523 507 278 1 129 126- Movable assets under lease 393 399 312 638 706 037 706 037- Leased movable assets 899 603 -30 764 930 367 46 523 507 278 423 089- Movable assets unleased after cancellationproperty leasing 25 647 25 647 21 936 3 711- Immovable assets under lease- Immovable leased assets 25 647 25 647 21 936 3 711- Immovable assets unleased after cancellationRents awaiting receiptRestructured rentsRents in arrears 2 787 1 922 3 825 4 205 4 205Non-performing loans
Rented ASSetS
Rented movable propertyRented propertyRents awaiting receiptRestructured rentsRents in arrearsNon-performing rents
totAl 1 321 436 314 560 -26 939 1 666 256 46 523 529 214 1 137 042
leased and rented assets at 30 June 2013 (thousand MAd)
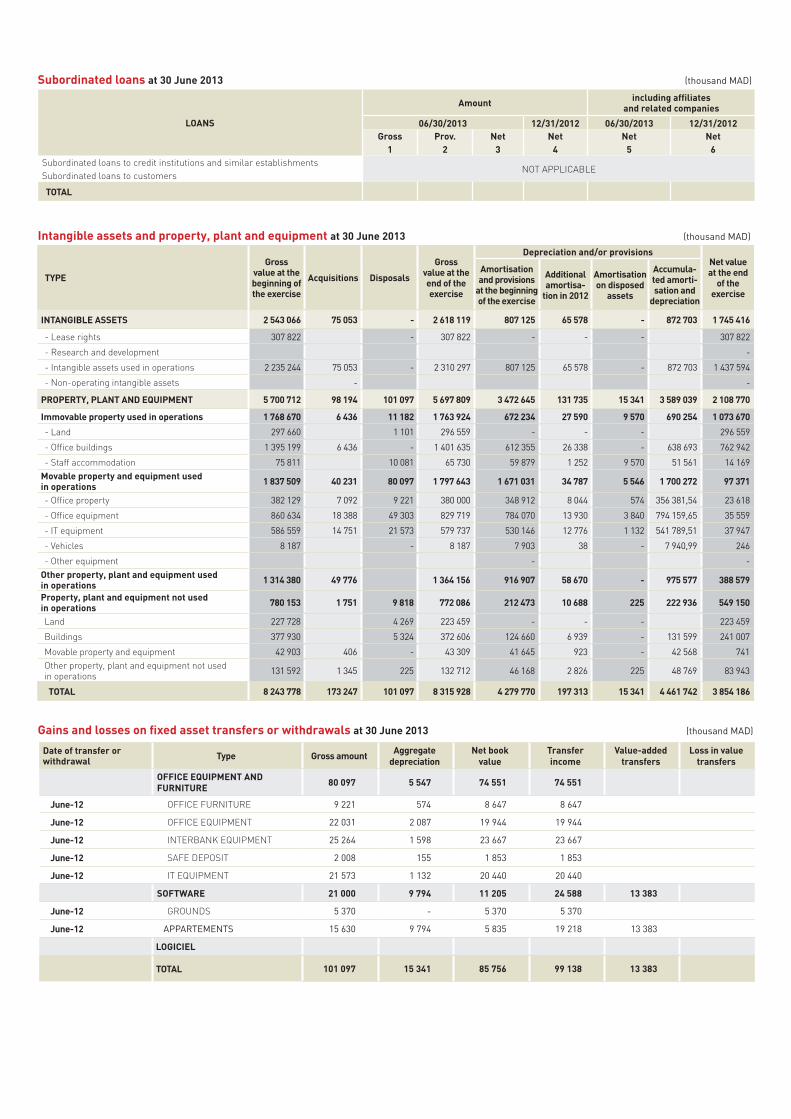
Subordinated loans at 30 June 2013 (thousand MAd)
loAnS
Amount including affiliatesand related companies
06/30/2013 12/31/2012 06/30/2013 12/31/2012gross prov. net net net net
1 2 3 4 5 6Subordinated loans to credit institutions and similar establishments
NOT APPLICABLESubordinated loans to customers
totAl
intangible assets and property, plant and equipment at 30 June 2013 (thousand MAd)
tYpe
grossvalue at the beginning of the exercise
Acquisitions disposals
grossvalue at the end of the exercise
depreciation and/or provisionsnet valueat the end
of theexercise
Amortisation and provisions
at the beginning of the exercise
Additional amortisa-
tion in 2012
Amortisation on disposed
assets
Accumula-ted amorti-sation and
depreciation
intAngiBle ASSetS 2 543 066 75 053 - 2 618 119 807 125 65 578 - 872 703 1 745 416
- Lease rights 307 822 - 307 822 - - - 307 822
- Research and development -
- Intangible assets used in operations 2 235 244 75 053 - 2 310 297 807 125 65 578 - 872 703 1 437 594
- Non-operating intangible assets - -
pRopeRtY, plAnt And eQUipMent 5 700 712 98 194 101 097 5 697 809 3 472 645 131 735 15 341 3 589 039 2 108 770
immovable property used in operations 1 768 670 6 436 11 182 1 763 924 672 234 27 590 9 570 690 254 1 073 670
- Land 297 660 1 101 296 559 - - - 296 559
- Office buildings 1 395 199 6 436 - 1 401 635 612 355 26 338 - 638 693 762 942
- Staff accommodation 75 811 10 081 65 730 59 879 1 252 9 570 51 561 14 169 Movable property and equipment used in operations 1 837 509 40 231 80 097 1 797 643 1 671 031 34 787 5 546 1 700 272 97 371
- Office property 382 129 7 092 9 221 380 000 348 912 8 044 574 356 381,54 23 618
- Office equipment 860 634 18 388 49 303 829 719 784 070 13 930 3 840 794 159,65 35 559
- IT equipment 586 559 14 751 21 573 579 737 530 146 12 776 1 132 541 789,51 37 947
- Vehicles 8 187 - 8 187 7 903 38 - 7 940,99 246
- Other equipment - - other property, plant and equipment used in operations 1 314 380 49 776 1 364 156 916 907 58 670 - 975 577 388 579
property, plant and equipment not used in operations 780 153 1 751 9 818 772 086 212 473 10 688 225 222 936 549 150
Land 227 728 4 269 223 459 - - - 223 459
Buildings 377 930 5 324 372 606 124 660 6 939 - 131 599 241 007
Movable property and equipment 42 903 406 - 43 309 41 645 923 - 42 568 741 Other property, plant and equipment not used in operations 131 592 1 345 225 132 712 46 168 2 826 225 48 769 83 943
totAl 8 243 778 173 247 101 097 8 315 928 4 279 770 197 313 15 341 4 461 742 3 854 186
date of transfer or withdrawal type gross amount Aggregate
depreciationnet book
valuetransferincome
Value-added transfers
loss in value transfers
oFFice eQUipMent And FURnitURe 80 097 5 547 74 551 74 551
June-12 OFFICE FURNITURE 9 221 574 8 647 8 647
June-12 OFFICE EQUIPMENT 22 031 2 087 19 944 19 944
June-12 INTERBANK EQUIPMENT 25 264 1 598 23 667 23 667
June-12 SAFE DEPOSIT 2 008 155 1 853 1 853
June-12 IT EQUIPMENT 21 573 1 132 20 440 20 440
SoFtWARe 21 000 9 794 11 205 24 588 13 383
June-12 GROUNDS 5 370 - 5 370 5 370
June-12 APPArtEMENts 15 630 9 794 5 835 19 218 13 383
logiciel
totAl 101 097 15 341 85 756 99 138 13 383
gains and losses on fixed asset transfers or withdrawals at 30 June 2013 (thousand MAd)

31Attijariwafa bank Results at 30 June 2013
investments in affiliates and other long-term investments at 30 June 2013 (thousand MAd)
nAMe oF the iSSUingcoMpAnY
Sectorof activity
Sharecapital
Share of equity held
grossbook value
net book value
data from the issuing company’s most recent financial statements
contri-bution to current year’s
incomeYear-end
netassets
netincome
A. inVeStMentS in AFFiliAte coMpAnieS 11 398 644 11 188 130 1 181 401
ATTIJARI FINANCES CORPORATE INVESTMENT BANKING 10 000 100.00% 10 000 10 000 06/30/13 47 653 33 145 35 001 OMNIUM DE GESTION MAROCAIN S.A."OGM" HOLDING COMPANY 885 000 100.00% 2 047 900 2 047 900 06/30/13 1 659 971 303 937 400 000
SOMACOVAM ASSET MANAGEMENT 5 000 100.00% 30 000 7 936 - WAFA GESTION ASSET MANAGEMENT 4 900 66.00% 236 369 236 369 06/30/13 90 807 23 276 47 625 ATTIJARI INVEST. 5 000 100.00% 5 000 5 000 06/30/12 49 808 4 765 - WAFA BOURSE SECURITIES BROKERAGE 20 000 100.00% 40 223 39 601 06/30/12 39 601 -1 542 -
WAFA PATRIMOINE PRIVATE PORTFOLIO MANAGEMENT 10 000 66.00% 1 700 1 700 -
ATTIJARI OPERATIONS 1 000 100.00% 1 000 1 000 - ATTIJARI AFRICA 2 000 100.00% 2 000 2 000 - ATTIJARI CIB AFRICA 2 000 100.00% 2 000 2 000 - ATTIJARI IT AFRICA 1 000 100.00% 1 000 1 000 - ATTIJARIWAFA BANK MIDDLE EAST LIMITED 1 000 100.00% 8 194 8 194 - STE MAROCAINE DE GESTION ET TRAI-TEMENT INFORMATIQUE "SOMGETI" IT 300 100.00% 100 100 12/31/11 585 -18 -
AGENA MAGHREB SALE OF IT EQUIPMENT 11 000 74.96% 33 - 12/31/11 -6 692 -20 - ATTIJARI CAPITAL DEVELOPEMENT RISK CAPITAL 10 000 100.00% 10 000 10 000 12/31/11 24 698 2 543 - ATTIJARI PROTECTION SECURITY 4 000 83.75% 3 350 3 350 - BCM CORPORATION HOLDING COMPANY 200 000 100.00% 200 000 200 000 06/30/13 253 189 36 186 30 000 CASA MADRID DEVELOPPEMENT DEVELOPMENT CAPITAL 10 000 50.00% 5 000 4 999 12/31/11 9 997 121 -
DINERS CLUB DU MAROC MANAGEMENT OF PAYMENT CARDS 1 500 100.00% 1 675 - 12/31/11 1 209 -55 -
MEDI TRADE TRADING 1 200 20.00% 240 135 06/30/12 674 - - AL MIFTAH PROPERTY 100 100.00% 243 59 06/30/12 60 -1 - WAFA COURTAGE 1 000 100.00% 2 397 2 397 06/30/12 6 006 1 667 10 000 WAFA COMMUNICATION 3 000 86.67% 2 600 336 12/31/11 388 -85 - WAFA FONCIERE PROPERTY MANAGEMENT 2 000 100.00% 3 700 2 299 06/30/12 2 300 -60 -
WAFA INVESTISSEMENT INVESTMENT HOLDING COMPANY 55 000 100.00% 55 046 15 010 -
WAFA SYSTEMES CONSULTING IT CONSULTING 5 000 99.88% 4 994 4 994 12/31/11 5 881 389 -
WAFA SYSTEMES DATA IT 1 500 100.00% 1 500 1 500 12/31/11 1 717 21 - WAFA SYSTEMES FINANCES IT SOLUTIONS 2 000 100.00% 2 066 2 066 12/31/11 2 851 96 -
WAFA TRUST FINANCIAL SERVICES 100.00% 1 500 1 500 06/30/12 1 616 -55 -
WAFATRADE 10 000 100.00% 9 999 7 173 12/31/12 7 173 151 - ATTIJARIA AL AAKARIA AL MAGHRIBIA PROPERTY 50 000 100.00% 51 449 51 449 12/31/12 101 265 40 093 25 000 SOCIETE IMMOBILIERE ATTIJARIA AL YOUSSOUFIA PROPERTY 300 50.00% 25 25 -
STE IMMOB.BOULEVARD PASTEUR " SIBP" PROPERTY 3 350 100.00% 11 863 4 592 12/31/12 4 504 49 - SOCIETE IMMOBILIERE RANOUIL PROPERTY 15 000 100.00% 15 531 3 162 - SOCIETE IMMOBILIERE DE L'HIVERNAGE SA PROPERTY 300 100.00% 5 266 3 439 12/31/12 3 663 -223 -
SOCIETE IMMOBILIERE MAIMOUNA PROPERTY 300 100.00% 299 299 12/31/12 784 7 - STE IMMOBILIERE MARRAKECH EXPANSION PROPERTY 300 100.00% 2 685 349 12/31/12 311 19 -
SOCIETE IMMOBILIERE ZAKAT PROPERTY 100 100.00% 100 - 06/30/12 -1 110 -3 - AYK 124 000 99.76% 187 400 72 000 - CAPRI PROPERTY 50 000 100.00% 71 686 71 686 06/30/13 58 725 496 7 000 ATTIJARI IMMOBILIER PROPERTY 2 400 KEuro 100.00% 92 442 92 442 06/30/13 17 608 KEuro 1 087 KEuro 26 712 ATTIJARI INTERNATIONAL BANK "AIB" OFFSHORE BANK 35 050 99.85% 323 518 323 518 06/30/13 267 953 44 260 69 895 WAFACASH MONEY TRANSFERS 50 000 100.00% 164 364 164 364 06/30/13 95 368 39 809 70 000 WAFA IMMOBILIER PROPERTY 113 180 50.91% 634 783 634 783 06/30/13 1 436 736 170 219 193 026 WAFASALAF CONSUMER FINANCE 20 000 100.00% 20 000 20 000 06/30/13 32 314 8 410 10 000 WAFA LLD LEASING 150 000 57.83% 86 983 86 983 06/30/13 714 975 71 683 28 916 WAFABAIL LEASE-FINANCING 50 000 100.00% 50 510 50 510 - DAR ASSAFAA LITAMWIL 1 000 KEuro 100.00% 10 950 10 950 -
ANDALUMAGHREB HOLDING 126 390 KEuro 100.00% 1 964 504 1 964 504 06/30/13 138 600 KEuro 13 667 KEuro -
ANDALUCARTAGE HOLDING 39 557 KEuro 100.00% 402 924 402 924 06/30/13 39 351 KEuro - -
ATTIJARIWAFA FINANZARIA SPA 1 122 000 KFCFA 100.00% 257 508 257 508 06/30/13 5 849 441 KFCFA
1 067 367 KFCFA -
ATTIJARIWAFA EURO FINANCES 50 Kusd 50.00% 731 264 731 264 06/30/13 19 542 Kusd 7 005 Kusd 29 729
CAFIN HOLDING COMPANY 11 450 000 KFCFA 4.90% 35 979 35 979 06/30/13 72 418 812 KFCFA
5 088 228 KFCFA 6 337
KASOVI HOLDING COMPANY 5 002 870 KFCFA 51.00% 689 599 689 599 06/30/13 20 935 275 KFCFA
1 911 027 KFCFA 5 844
COMPAGNIE BANCAIRE DE L'AFRIQUE OCCIDENTALE"CBAO" BANKING 10 000 000 KFCFA 51.00% 648 084 648 084 06/30/13 36 829 339
KFCFA 5 934 539
KFCFA 30 080
BANQUE INTERNATIONALE POUR LE MALI "BIM SA" BANKING 5 000 000 KFCFA 95.00% 292 488 292 488 06/30/13 12 767 070
KFCFA 1 114 948
KFCFA 36 124
SOCIETE IVOIRIENNE DE BANQUE "SIB " BANKING 7 743 670 KFCFA 91.00% 608 734 608 734 06/30/13 16 231 585 KFCFA
3 088 648 KFCFA 33 144
CREDIT DU SENEGAL BANKING 10 000 000 KFCFA 58.71% 848 842 848 842 06/30/13 21 174 537 KFCFA
2 272 605 KFCFA 52 441
CREDIT DU CONGO BANKING 10 010 KEuro 100.00% 113 120 113 120 06/30/13 9 991 KEuro - - UNION GABONAISE DE BANQUES "UGB GABON" BANKING 10 000 000 KFCFA 51.00% 379 110 379 110 06/30/13 28 024 379
KFCFA 3 792 216
KFCFA 34 527
ATTIJARI AFRIQUE PARTICIPATIONS BANKING 963 963 SOCIETE CAMEROUNAISE DE BANQUE BANKING 100.00% 5 842 5 842 WAFACAMBIO 963 963 WAFABANK OFFSHORE DE TANGER 100.00% 5 842 5 842

Amounts owing to credit institutions and similar establishments at 30 June 2013 (thousand MAd)
AMoUntS oWing
credit institutions and similar establishments in Morocco creditinstitutions
overseas
total06/30/2013
total12/31/2012
Bank Al Maghrib,the treasury and post
office accountsBanks
other credit institutions and similar
establishmentscURRent AccoUntS in cRedit 2 41 528 759 009 1 444 927 2 245 466 940 813
noteS giVen AS SecURitY 23 540 686 1 400 025 24 940 711 32 557 483
- overnight 1 199 970 1 199 970 800 764
- term 22 340 716 1 400 025 23 740 741 31 756 719
cASh BoRRoWingS 8 191 627 3 386 591 6 960 600 18 538 818 13 380 266
- overnight 2 301 000 869 263 545 781 3 716 044 3 869 382
- term 5 890 627 2 517 328 6 414 819 14 822 774 9 510 884
FinAnciAl BoRRoWingS 2 403 82 2 485 2 690
otheR deBtS 49 472 25 878 75 350 53 979
inteReSt pAYABle 44 753 18 926 63 679 37 409
totAl 23 592 563 9 659 058 4 190 353 8 424 535 45 866 509 46 972 640
customer deposits at 30 June 2013 (thousand MAd)
depoSitS public sectorprivate sector total
06/30/2013 total
12/31/2012Financialcompanies
non-financialcompanies other customers
CURRENT ACCOUNTS IN CREDIT 2 749 023 2 100 510 21 810 251 78 120 702 104 780 486 102 614 499SAVINGS ACCOUNTS 22 479 551 22 479 551 21 944 341TERM DEPOSITS 4 349 167 7 508 207 9 600 519 18 939 037 40 396 930 39 852 721OTHER ACCOUNTS IN CREDIT 7 837 1 560 064 7 744 881 1 005 039 10 317 821 6 506 068ACCRUED INTEREST PAYABLE 967 220 2 825 970 045 998 789
totAl 7 106 027 11 168 781 40 122 871 120 547 156 178 944 833 171 916 418
investments in affiliates and other long-term investments at 30 June 2013 (thousand MAd)
nAMe oF the iSSUingcoMpAnY
Sectorof activity
Sharecapital
Share of equity held
grossbook value
net book value
data from the issuing company’s most recent financial statements
contri-bution to current year’s
incomeYear-end net
assetsnet
income
B- otheR inVeStMentS 526 606 461 813 369 082 2 675 170 95 569 57 168
NouVEllEs sIdErurGIEs INdus-trIEllEs METALS AND MINING 3 415 000 2,72% 92 809 92 809 -
soNAsId METALS AND MINING 28 391 5 649 - AttIjArIWAFA BANK BANKING 623 623 - sINCoMAr 300 47,50% - AGrAM INVEst 40 060 27,82% 10 938 7 492 26 934 -11 -
AM INVEstIssEMENt MoroCCo INVESTMENT HOLDING COMPANY 400 000 3,25% 13 000 13 000 -
BouzNIKA MArINA PROPERTY DEVELOPMENT 500 500 - EuroCHEquEs MAroC 363 364 - FoNds d'INVEstIssEMENt IGrANE 70 000 18,26% 12 782 3 219 06/30/12 17 630 -6 559 - IMMoBIlIErE INtErBANCAIrE "G.P.B.M."
PROFESSIONAL BANKER’S ASSOCIATION 19 005 20,00% 3 801 3 801 -
IMPrEssIoN PrEssE EdItIoN (IPE) PUBLISHING 400 400 - MoussAFIr HotEls HOTEL MANAGEMENT 193 000 33,34% 64 342 64 343 12/31/11 299 081 47 525 13 808 sAlIMA HoldING HOLDING COMPANY 150 000 13,33% 16 600 16 600 12/31/11 257 807 3 068 - s.E.d. FEs 10 000 10,00% - stE d'AMENAGEMENt du PArC NouACEr"sAPINo" PROPERTY DEVELOPMENT 60 429 22,69% 13 714 13 714 06/30/12 225 678 3 221 13 200
tANGEr FrEE zoNE PROPERTY DEVELOPMENT 105 000 25,71% 58 221 58 221 3 240 tECHNoloPArK CoMPANY "MItC" SERVICES PROVIDER 8 150 7 784 - World trAdE CENtEr - MAroClEAr SECURITIES CUSTODIAN 20 000 6,58% 1 342 1 342 12/31/11 215 907 24 686 - HAWAzIN PROPERTY 960 12,50% 704 - - INtAj PROPERTY 576 12,50% 1 041 549 -
EXP sErVICEs MAroC s.A. RISK CENTRALISATION SERVICES 20 000 3,00% 600 600 -
H PArtNErs 1 400 010 7,14% 100 000 72 962 06/30/12 1 021 479 -6 231 - MoroCCAN FINANCIAl BoArd 20 000 20 000 - MAroC NuMErIquE FuNd 157 643 6,34% 10 000 9 556 06/30/12 150 647 3 239 - FoNCIErE EMErGENCE 120 017 8,06% 12 087 12 087 - AltErMEd MAGHrEB Eur 5 247 5 247 - INtEr MutuEllEs AssIstANCE 894 894 - WAFA IMA AssIstANCE 15 356 15 356 - 3 P FuNd BANKING 80 020 5,00% 4 000 4 000 - BANquE d'AFFAIrE tuNIsIENNE 198 741 2 583 2 583 06/30/12 373 643 27 686 - CENtrE MoNEtIquE INtErBANCAIrE ELECTRONIC BANKING 98 200 22,40% 22 000 22 000 25 520
soCIEtE INtErBANK MANAGEMENT OF BANK CARDS 11 500 16,00% 1 840 1 840 1 400
sMAEX 37 450 11,42% 4 278 4 278 12/31/11 86 364 -1 055 - c - SiMilAR inVeStMentS 646 630 645 343 - C/C ASSOCIATED 630 795 629 508 OTHER SIMILAR INVESTMENTS 15 835 15 835 totAl 12 571 881 12 295 286 2 675 170 95 569 1 238 569
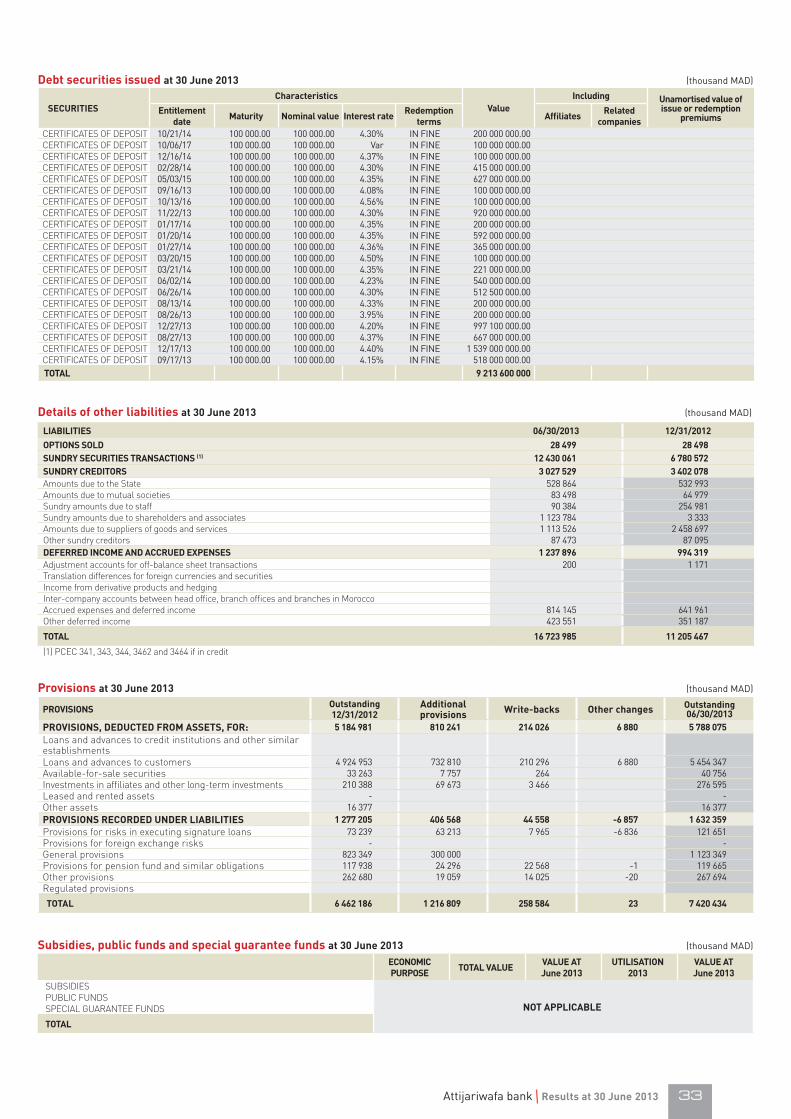
33Attijariwafa bank Results at 30 June 2013
details of other liabilities at 30 June 2013 (thousand MAd)
liABilitieS 06/30/2013 12/31/2012optionS Sold 28 499 28 498SUndRY SecURitieS tRAnSActionS (1) 12 430 061 6 780 572SUndRY cReditoRS 3 027 529 3 402 078Amounts due to the State 528 864 532 993Amounts due to mutual societies 83 498 64 979Sundry amounts due to staff 90 384 254 981Sundry amounts due to shareholders and associates 1 123 784 3 333Amounts due to suppliers of goods and services 1 113 526 2 458 697Other sundry creditors 87 473 87 095deFeRRed incoMe And AccRUed eXpenSeS 1 237 896 994 319Adjustment accounts for off-balance sheet transactions 200 1 171Translation differences for foreign currencies and securitiesIncome from derivative products and hedgingInter-company accounts between head office, branch offices and branches in MoroccoAccrued expenses and deferred income 814 145 641 961Other deferred income 423 551 351 187
totAl 16 723 985 11 205 467
(1) PCEC 341, 343, 344, 3462 and 3464 if in credit
provisions at 30 June 2013 (thousand MAd)
pRoViSionS outstanding 12/31/2012
Additionalprovisions Write-backs other changes outstanding
06/30/2013pRoViSionS, dedUcted FRoM ASSetS, FoR: 5 184 981 810 241 214 026 6 880 5 788 075 Loans and advances to credit institutions and other similar establishmentsLoans and advances to customers 4 924 953 732 810 210 296 6 880 5 454 347 Available-for-sale securities 33 263 7 757 264 40 756 Investments in affiliates and other long-term investments 210 388 69 673 3 466 276 595 Leased and rented assets - - Other assets 16 377 16 377 pRoViSionS RecoRded UndeR liABilitieS 1 277 205 406 568 44 558 -6 857 1 632 359 Provisions for risks in executing signature loans 73 239 63 213 7 965 -6 836 121 651 Provisions for foreign exchange risks - - General provisions 823 349 300 000 1 123 349 Provisions for pension fund and similar obligations 117 938 24 296 22 568 -1 119 665 Other provisions 262 680 19 059 14 025 -20 267 694 Regulated provisionstotAl 6 462 186 1 216 809 258 584 23 7 420 434
econoMic pURpoSe totAl VAlUe VAlUe At
June 2013UtiliSAtion
2013VAlUe AtJune 2013
SUBSIDIES
not ApplicABlePUBLIC FUNDSSPECIAL GUARANTEE FUNDS
totAl
Subsidies, public funds and special guarantee funds at 30 June 2013 (thousand MAd)
SecURitieScharacteristics
Valueincluding Unamortised value of
issue or redemption premiums
entitlement date Maturity nominal value interest rate Redemption
terms Affiliates Relatedcompanies
CERTIFICATES OF DEPOSIT 10/21/14 100 000.00 100 000.00 4.30% IN FINE 200 000 000.00 CERTIFICATES OF DEPOSIT 10/06/17 100 000.00 100 000.00 Var IN FINE 100 000 000.00 CERTIFICATES OF DEPOSIT 12/16/14 100 000.00 100 000.00 4.37% IN FINE 100 000 000.00 CERTIFICATES OF DEPOSIT 02/28/14 100 000.00 100 000.00 4.30% IN FINE 415 000 000.00 CERTIFICATES OF DEPOSIT 05/03/15 100 000.00 100 000.00 4.35% IN FINE 627 000 000.00 CERTIFICATES OF DEPOSIT 09/16/13 100 000.00 100 000.00 4.08% IN FINE 100 000 000.00 CERTIFICATES OF DEPOSIT 10/13/16 100 000.00 100 000.00 4.56% IN FINE 100 000 000.00 CERTIFICATES OF DEPOSIT 11/22/13 100 000.00 100 000.00 4.30% IN FINE 920 000 000.00 CERTIFICATES OF DEPOSIT 01/17/14 100 000.00 100 000.00 4.35% IN FINE 200 000 000.00 CERTIFICATES OF DEPOSIT 01/20/14 100 000.00 100 000.00 4.35% IN FINE 592 000 000.00 CERTIFICATES OF DEPOSIT 01/27/14 100 000.00 100 000.00 4.36% IN FINE 365 000 000.00 CERTIFICATES OF DEPOSIT 03/20/15 100 000.00 100 000.00 4.50% IN FINE 100 000 000.00 CERTIFICATES OF DEPOSIT 03/21/14 100 000.00 100 000.00 4.35% IN FINE 221 000 000.00 CERTIFICATES OF DEPOSIT 06/02/14 100 000.00 100 000.00 4.23% IN FINE 540 000 000.00 CERTIFICATES OF DEPOSIT 06/26/14 100 000.00 100 000.00 4.30% IN FINE 512 500 000.00 CERTIFICATES OF DEPOSIT 08/13/14 100 000.00 100 000.00 4.33% IN FINE 200 000 000.00 CERTIFICATES OF DEPOSIT 08/26/13 100 000.00 100 000.00 3.95% IN FINE 200 000 000.00 CERTIFICATES OF DEPOSIT 12/27/13 100 000.00 100 000.00 4.20% IN FINE 997 100 000.00 CERTIFICATES OF DEPOSIT 08/27/13 100 000.00 100 000.00 4.37% IN FINE 667 000 000.00 CERTIFICATES OF DEPOSIT 12/17/13 100 000.00 100 000.00 4.40% IN FINE 1 539 000 000.00 CERTIFICATES OF DEPOSIT 09/17/13 100 000.00 100 000.00 4.15% IN FINE 518 000 000.00 totAl 9 213 600 000
debt securities issued at 30 June 2013 (thousand MAd)

Subordinated debts at 30 June 2013 (thousand MAd)
currencyof issue
Value of loan in currency
of issue
price(1) Rate Maturity
(2)
terms for early redemption, subordination and
convertibility(3)
Value of loanin MAdK
including related businesses including other related businesses
Valuein MAdK
2013
Valuein MAdK
2012
Valuein MAdK
2013
Valuein MAdK
2012
MAD 3,85% 7 YEARS 1 417 400 MAD 4,10% 7 YEARS 950 000 MAD 4,30% 10 YEARS 879 600 MAD 4,35% 7 YEARS 476 800 MAD 4,35% 7 YEARS 798 300 MAD 4,53% 10 YEARS 290 000 MAD 4,60% 5 YEARS 948 700 MAD 4,76% 7 YEARS 50 000 MAD 4,77% 7 YEARS 201 700 MAD 4,78% 7 YEARS 723 200 MAD 5,00% 10 YEARS 710 000 MAD 5,10% 10 YEARS 1 000 000 MAD 5,60% 10 YEARS 1 120 400 MAD 5,60% 5 YEARS 540 000 MAD 5,01% 5 YEARS 710 000 totAl 10 816 100
(1) BAM price at 06/30/2013 - (2) Possibly for an unspecified period – (3) Refer to the subordinated debt contract note
coMMitMentS 06/30/2013 12/31/2012
FinAncing coMMitMentS And gUARAnteeS giVen 50 610 833 49 671 811Financing commitments given to credit institutions and similar establishments 532 532Import documentary creditsAcceptances or commitments to be paid 532 532Confirmed credit linesBack-up commitments on securities issuanceIrrevocable leasing commitmentsOther financing commitments givenFinancing commitments given to customers 15 269 618 14 149 817Import documentary credits 11 450 053 10 770 486Acceptances or commitments to be paid 3 200 255 2 411 742Confirmed credit linesBack-up commitments on securities issuanceIrrevocable leasing commitments 619 310 967 589Other financing commitments givenguarantees given to credit institutions and similar establishments 6 346 623 6 025 257Confirmed export documentary credits 70 428Acceptances or commitments to be paidCredit guarantees given 1751893,451Other guarantees and pledges given 4 524 302 6 025 257Non-performing commitmentsguarantees given to customers 28 994 059 29 496 204Credit guarantees given 784 695 605 165Guarantees given to government bodies 15 546 772 15 788 069Other guarantees and pledges given 12 086 782 12 571 858Non-performing commitments 575 810 531 112FinAncing coMMitMentS And gUARAnteeS ReceiVed 15 934 337 16 445 087Financing commitments received from credit institutions and similar establishmentsConfirmed credit linesBack-up commitments on securities issuanceOther financing commitments receivedguarantees received from credit institutions and similar establishments 15 892 614 16 404 755Credit guarantees receivedOther guarantees received 15 892 614 16 404 755guarantees received from the State and other organisations providing guarantees 41 723 40 332Credit guarantees received 41 723 40 332Other guarantees received
Financing and guarantee commitments at 30 June 2013 (thousand MAd)
Shareholders equity at 30 June 2013 (thousand MAd)
ShAReholdeRS’ eQUitY outstanding 12/31/2012 Appropriation of income other changes outstanding 06/30/2013
Revaluation reserve 420 420 Reserves and premiums related to share capital 19 890 528 1 499 471 662 401 22 052 401 Legal reserve 192 996 - 192 996 Other reserves 12 243 440 1 499 471 13 742 912 Issue, merger and transfer premiums 7 454 092 662 401 8 116 493 Share capital 2 012 431 - 22 841 2 035 272 Called-up share capital 2 012 431 22 841 2 035 272 Uncalled share capitalNon-voting preference sharesFund for general banking risksShareholders’ unpaid share capitalRetained earnings (+/-) 691 -962 14 -257 net income (loss) awaiting appropriation (+/-)net income (+/-) 3 309 697 -3 309 697 2 089 431 totAl 25 213 767 -1 811 188 685 256 26 177 268
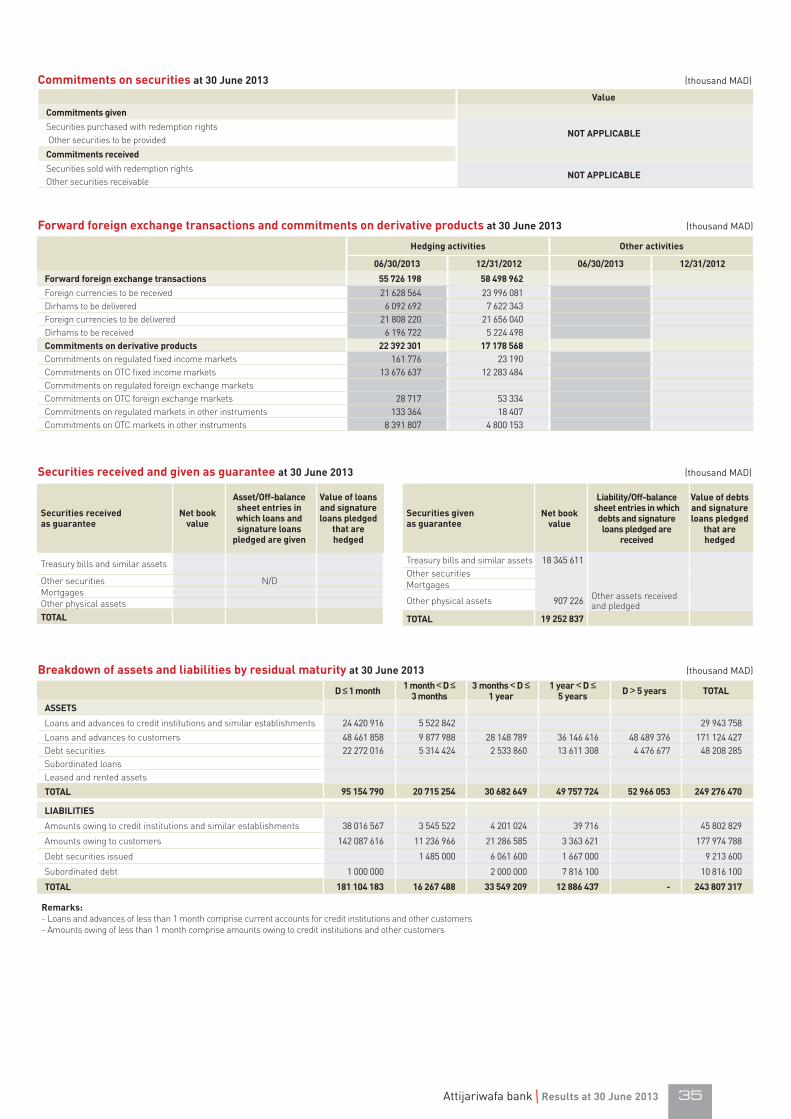
35Attijariwafa bank Results at 30 June 2013
Forward foreign exchange transactions and commitments on derivative products at 30 June 2013 (thousand MAd)
hedging activities other activities
06/30/2013 12/31/2012 06/30/2013 12/31/2012
Forward foreign exchange transactions 55 726 198 58 498 962Foreign currencies to be received 21 628 564 23 996 081Dirhams to be delivered 6 092 692 7 622 343Foreign currencies to be delivered 21 808 220 21 656 040Dirhams to be received 6 196 722 5 224 498commitments on derivative products 22 392 301 17 178 568Commitments on regulated fixed income markets 161 776 23 190Commitments on OTC fixed income markets 13 676 637 12 283 484Commitments on regulated foreign exchange marketsCommitments on OTC foreign exchange markets 28 717 53 334Commitments on regulated markets in other instruments 133 364 18 407Commitments on OTC markets in other instruments 8 391 807 4 800 153
Value
commitments givenSecurities purchased with redemption rights
not ApplicABle Other securities to be provided
commitments receivedSecurities sold with redemption rights
not ApplicABleOther securities receivable
commitments on securities at 30 June 2013 (thousand MAd)
Securities received as guarantee
net book value
Asset/off-balance sheet entries in which loans and signature loans
pledged are given
Value of loans and signature loans pledged
that are hedged
Treasury bills and similar assets
Other securities N/DMortgagesOther physical assets totAl
Securities givenas guarantee
net book value
liability/off-balance sheet entries in which debts and signature loans pledged are
received
Value of debts and signature loans pledged
that are hedged
Treasury bills and similar assets 18 345 611 Other securitiesMortgages
Other physical assets 907 226 Other assets received and pledged
totAl 19 252 837
Securities received and given as guarantee at 30 June 2013 (thousand MAd)
d ≤ 1 month 1 month < d ≤ 3 months
3 months < d ≤ 1 year
1 year < d ≤ 5 years d > 5 years totAl
ASSetS
Loans and advances to credit institutions and similar establishments 24 420 916 5 522 842 29 943 758
Loans and advances to customers 48 461 858 9 877 988 28 148 789 36 146 416 48 489 376 171 124 427Debt securities 22 272 016 5 314 424 2 533 860 13 611 308 4 476 677 48 208 285Subordinated loansLeased and rented assets
totAl 95 154 790 20 715 254 30 682 649 49 757 724 52 966 053 249 276 470
liABilitieS
Amounts owing to credit institutions and similar establishments 38 016 567 3 545 522 4 201 024 39 716 45 802 829
Amounts owing to customers 142 087 616 11 236 966 21 286 585 3 363 621 177 974 788
Debt securities issued 1 485 000 6 061 600 1 667 000 9 213 600
Subordinated debt 1 000 000 2 000 000 7 816 100 10 816 100
totAl 181 104 183 16 267 488 33 549 209 12 886 437 - 243 807 317
Breakdown of assets and liabilities by residual maturity at 30 June 2013 (thousand MAd)
Remarks:- Loans and advances of less than 1 month comprise current accounts for credit institutions and other customers- Amounts owing of less than 1 month comprise amounts owing to credit institutions and other customers
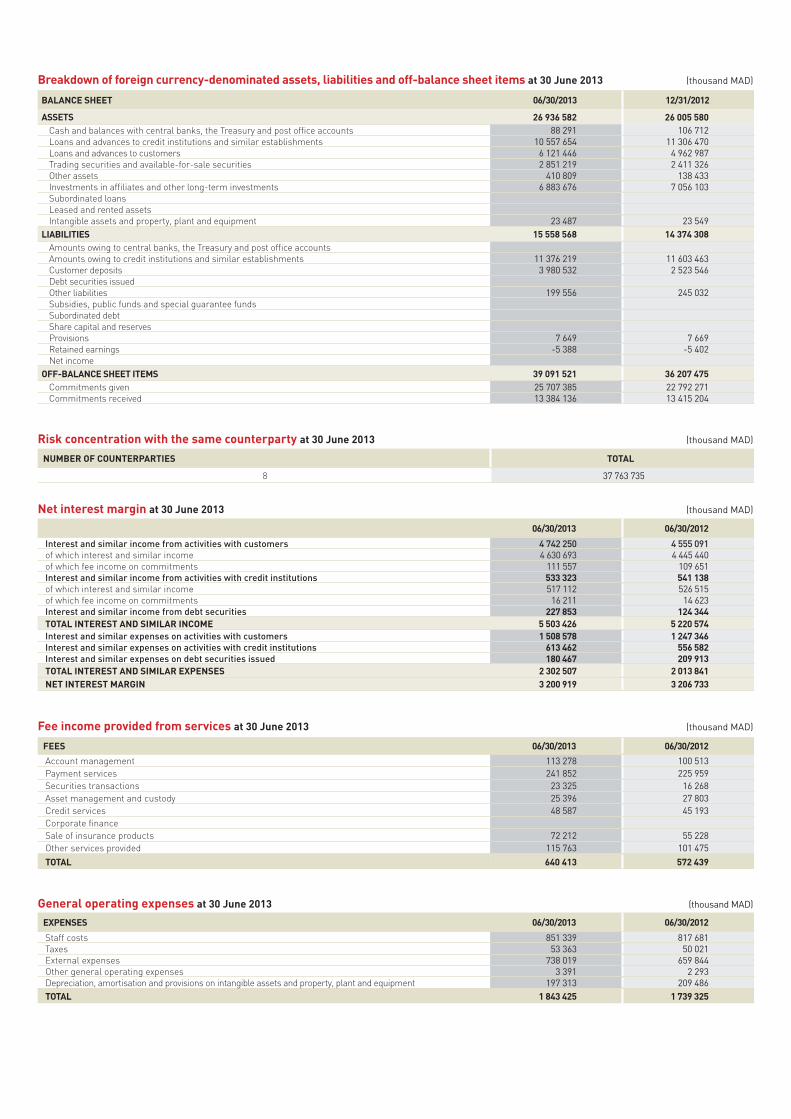
nUMBeR oF coUnteRpARtieS totAl
8 37 763 735
Risk concentration with the same counterparty at 30 June 2013 (thousand MAd)
06/30/2013 06/30/2012
Interest and similar income from activities with customers 4 742 250 4 555 091 of which interest and similar income 4 630 693 4 445 440 of which fee income on commitments 111 557 109 651 Interest and similar income from activities with credit institutions 533 323 541 138 of which interest and similar income 517 112 526 515 of which fee income on commitments 16 211 14 623 Interest and similar income from debt securities 227 853 124 344 totAl inteReSt And SiMilAR incoMe 5 503 426 5 220 574 Interest and similar expenses on activities with customers 1 508 578 1 247 346 Interest and similar expenses on activities with credit institutions 613 462 556 582 Interest and similar expenses on debt securities issued 180 467 209 913 totAl inteReSt And SiMilAR eXpenSeS 2 302 507 2 013 841 net inteReSt MARgin 3 200 919 3 206 733
net interest margin at 30 June 2013 (thousand MAd)
BAlAnce Sheet 06/30/2013 12/31/2012
ASSetS 26 936 582 26 005 580Cash and balances with central banks, the Treasury and post office accounts 88 291 106 712Loans and advances to credit institutions and similar establishments 10 557 654 11 306 470Loans and advances to customers 6 121 446 4 962 987Trading securities and available-for-sale securities 2 851 219 2 411 326Other assets 410 809 138 433Investments in affiliates and other long-term investments 6 883 676 7 056 103Subordinated loansLeased and rented assetsIntangible assets and property, plant and equipment 23 487 23 549
liABilitieS 15 558 568 14 374 308Amounts owing to central banks, the Treasury and post office accountsAmounts owing to credit institutions and similar establishments 11 376 219 11 603 463Customer deposits 3 980 532 2 523 546Debt securities issuedOther liabilities 199 556 245 032Subsidies, public funds and special guarantee fundsSubordinated debtShare capital and reservesProvisions 7 649 7 669Retained earnings -5 388 -5 402Net income
oFF-BAlAnce Sheet iteMS 39 091 521 36 207 475Commitments given 25 707 385 22 792 271Commitments received 13 384 136 13 415 204
Breakdown of foreign currency-denominated assets, liabilities and off-balance sheet items at 30 June 2013 (thousand MAd)
eXpenSeS 06/30/2013 06/30/2012
Staff costs 851 339 817 681 Taxes 53 363 50 021 External expenses 738 019 659 844 Other general operating expenses 3 391 2 293 Depreciation, amortisation and provisions on intangible assets and property, plant and equipment 197 313 209 486 totAl 1 843 425 1 739 325
general operating expenses at 30 June 2013 (thousand MAd)
FeeS 06/30/2013 06/30/2012
Account management 113 278 100 513 Payment services 241 852 225 959 Securities transactions 23 325 16 268 Asset management and custody 25 396 27 803 Credit services 48 587 45 193 Corporate financeSale of insurance products 72 212 55 228 Other services provided 115 763 101 475
totAl 640 413 572 439
Fee income provided from services at 30 June 2013 (thousand MAd)

37Attijariwafa bank Results at 30 June 2013
cAtegoRY 06/30/2013 06/30/2012
Available-for-sale securities - Investments in affiliates and other long-term investments 1 258 488 1 007 982
totAl 1 258 488 1 007 982
income from equity securities at 30 June 2013 (thousand MAd)
incoMe And eXpenditUReS 06/30/2013 06/30/2012
+ Gains on trading securities 684 193 608 874 - Losses on trading securities 103 680 34 937 income from activities in trading securities 580 513 573 937 + Capital gains on disposal of available-for-sale securities 55 1 493 + Write-back of provisions for impairment of available-for-sale securities 264 3 534 - Losses on disposal of available-for-sale securities 699 - - Provisions for impairment of available-for-sale securities 7 757 1 625 income from activities in available-for-sale securities -8 137 3 402 + Gains on foreign exchange transactions - transfers 159 199 681 901 + Gains on foreign exchange transactions - notes 42 958 40 658 - Losses on foreign exchange transactions - transfers 25 373 571 999 - Losses on foreign exchange transactions - notes 402 1 675 income from foreign exchange activities 176 383 148 885 + Gains on fixed income derivative products 11 027 199 166 + Gains on foreign exchange derivative products 68 874 116 559 + Gains on other derivative products 85 256 -15 782 - Losses on fixed income derivative products -67 979 243 753 - Losses on foreign exchange derivative products 35 686 50 390 - Losses on other derivative products 35 747 6 705 income from activities in derivatives products 161 703 -904
income from market activities at 30 June 2013 (thousand MAd)
other income and expenses at 30 June 2013 (thousand MAd)
i - deteRMining incoMe AMoUnt
Income from ordinary activities after items of income and expenditure 2 821 057 Tax write-backs on ordinary activities (+) 335 207 Tax deductions on ordinary activities (-) 1 272 568 Theoretical taxable income from ordinary activities (=) 1 883 696 Theoretical tax on income from ordinary activities (-) 696 968 Income after tax from ordinary activities (=) 2 124 089
ii- SpeciFic tAX tReAtMent inclUding BeneFitS gRAnted BY inVeStMent codeS UndeR SpeciFic legAl pRoViSionS
determining income after tax from ordinary activities at 30 June 2013 (thousand MAd)
detailed information on value added tax at 30 June 2013 (thousand MAd)
tYpe
Balance at the beginning of the
exercise1
transactions liable to VAt during the period
2
VAt declarations during the period
3
Balance at the endof the exercise
(1+2-3=4)
A. VAt collected 77 484 663 565 682 540 58 510 B. Recoverable VAt 155 001 354 213 291 239 217 975 On expenses 95 788 255 894 212 896 138 787 On fixed assets 59 213 98 319 78 343 79 189 c. VAt payable or VAt credit = (A-B) -77 517 309 352 391 301 -159 466
otheR BAnKing incoMe And eXpenSeS 06/30/2013 06/30/2012
Other banking income 1 051 827 1 636 403 Other banking expenses 559 363 1 301 670 totAl 492 464 334 733
otheR non-BAnKing incoMe And eXpenSeS 06/30/2013 06/30/2012 Non-banking operating income 87 700 14 567 Non-banking operating expenses - - totAl 87 700 14 567
Provisions and losses on irrecoverable loans 1 324 398 760 538 Provision write-backs and amounts recovered on impaired loans 285 751 174 526
non-cURRent incoMe And eXpenSeS 06/30/2013 06/30/2012 Non-current income 2 186 21 Non-current expenses 37 761 69 830

Reconciliation of net income for accounting and tax purposes at 30 June 2013 (thousand MAd)
ReconciliAtion StAteMent Amount Amount
i- net incoMe FoR AccoUnting pURpoSeS 2 089 431 Net profit 2 089 431 Net loss
ii- tAX WRite-BAcKS 1 064 354 1 – Current 1 064 354
Income tax 696 050 Losses related to tax controlLosses on irrecoverable loans not provisioned 8 739 General provisions 300 000 Provisions for pension funds and similar obligation 24 296 Non-deductible exceptional expenses 1 138 Contribution for the social cohesion support 33 097 Personal gifts 1 034
2- Non-Currentiii- tAX dedUctionS 1 272 568
1- Current 1 272 568 100% allowance on income from investments in affiliates 1 250 000 Write-back of investmentWrite-back of provisions used 22 568
2- Non-Current - totAl 3 153 785 1 272 568
iV - gRoSS incoMe FoR tAX pURpoSeS 1 881 217 - Gross profit for tax purposes if T1 > T2 (A) 1 881 217 - Gross loss for tax purposes if T2 > T1 (B)
V - tAX loSS cARRY FoRWARdS (c) (1)
- Financial year Y-4- Financial year Y-3- Financial year Y-2- Financial year Y-1
Vi - net incoMe FoR tAX pURpoSeS 1 881 217Net profit for tax purposes (A-C) 1 881 217Net loss for tax purposes (B)
Vii - AccUMUlAted deFeRRed depReciAtion AlloWAnceS
Viii - AccUMUlAted tAX loSSeS to Be cARRied FoRWARd- Financial year Y-4- Financial year Y-3- Financial year Y-2- Financial year Y-1
(1) up to the value of gross profit for tax purposes (A)
name of main shareholders or associates Adressnumber of shares held % of share
capitalprevious period current period A- doMeStic ShAReholdeRS* S.N.I ANGLE RUES D'ALGER ET DUHAUME CASA 94 272 485 97 307 658 47.81%* WAFACORP 42 BD ABDELKRIM AL KHATTABI CASA 57 602 58 466 0.03%* AL WATANIYA 83 AVENUE DES FAR CASA 2 683 942 2 683 942 1.32%* WAFA ASSURANCE 1 RUE ABDELMOUMEN CASA 13 257 604 13 456 468 6.61%* GROUPE MAMDA & MCMA 16 RUE ABOU INANE RABAT 16 379 156 16 461 396 8.09%* AXA ASSURANCES MAROC 120 AVENUE HASSAN II CASA 2 778 517 2 778 517 1.37%* REGIME COLLECTIF D'ALLOCATION ET DE RETRAITE 140 PLACE MY EL HASSAN RABAT 7 839 293 8 665 385 4.26%* CAISSE MAROCAINE DE RETRAITE 140 PLACE MY EL HASSAN RABAT 4 616 769 4 616 769 2.27%* CIMR BD ABDELMOUMEN CASA 4 697 256 4 760 397 2.34%* CAISSE DE DEPOT ET DE GESTION 140 PLACE MY EL HASSAN RABAT 4 694 810 4 694 810 2.31%* OPCVM ET AUTRES DIVERS ACTIONNAIRES ************************** 39 250 038 37 327 804 18.34%
B- FoReign ShAReholdeRS
*SANTUSA HOLDING PASEO DE LA CASTELLANA N° 24 MADRID (SPAIN) 10 715 614 10 715 614 5.26%
totAl - ii 201 243 086 203 527 226 100.00%
Shareholding structure at 30 June 2013

39Attijariwafa bank Results at 30 June 2013
customer accounts at 30 June 201306/30/2013 12/31/2012
Current accounts 133 355 128 265Current accounts of Moroccans living abroad 704 852 690 632Other current accounts 1 452 116 1 381 391Factoring liabilitiesSavings accounts 691 174 661 295Term accounts 16 473 18 922Certificates of deposit 3 504 3 170Other deposit accounts 652 873 582 398
3 654 347 3 466 073
BRAnch netWoRK 06/30/2013 12/31/2012
Permanent counters 1021 1010Occasional counters 2 2Cash dispensers and ATMs 1059 1007Overseas branches 59 50Overseas representative offices 10 19
Branch network at 30 June 2013
StAFF 06/30/2013 12/31/2012
Salaried staff 7 226 7 090 Staff in employment 7 226 7 090 Full-time staff 7 226 7 090 Administrative and technical staff (full-time)Banking staff (full-time)Managerial staff (full-time) 3 785 3 633 Other staff (full-time) 3 441 3 416 Including Overseas staff 42 41
Staff at 30 June 2013
Appropriation of income at 30 June 2013 (thousand MAd)
VAlUe VAlUe
A- origin of appropriated income B- Appropriation of income
Earnings brought forward 691 to legal reserve 1 499 471 Net income awaiting appropriation dividends 1 811 188 Net income for the financial year 3 309 697 other items for appropriation -14 deduction from income Earnings carried forward -257 other deductions
totAl A 3 310 388 totAl B 3 310 388
ii. poSt-BAlAnce Sheet iteMS not RelAted to thiS FinAnciAl YeAR KnoWn BeFoRe pUBlicAtion oF the FinAnciAl StAteMentS
dates indication of event. Favorable not applicable. unfavourable not applicable
Key dates and post-balance sheet events at 30 June 2013i- KeY dAteS. Balance sheet date (1) 30 June 2013. Date for drawing up the financial statements (2) Sept. 2013
(1) Justification in the event of any change to the balance sheet date(2) Justification in the event that the statutory 3-month period for drawing up the financial statements is exceeded
Summary of key items over the last three periods at 30 June 2013 (thousand MAd)
iteM JUne 2013 deceMBeR 2012 deceMBeR 2011
ShAReholdeRS’ eQUitY And eQUiVAlent 26 177 267 25 213 767 21 444 555 opeRAtionS And incoMe in FYNet banking income 5 615 429 9 665 297 8 973 062 Pre-tax income 2 785 482 4 819 712 4 604 514 Income tax 696 050 1 510 015 1 449 837 Dividend distribution 1 811 188 1 640 466 1 543 968
peR ShARe inFoRMAtion (in MAd)Earning per shareDividend per share 9.00 8.50 8.00
StAFFtotal staff costs 851 339 1 610 608 1 540 770 Average number of employees during the period
