13 september 2021 initiating coverage apl apollo tubes
TRANSCRIPT
13 September 2021 Initiating coverage
APL Apollo Tubes
HSIE Research is also available on Bloomberg ERH HDF <GO> & Thomson Reuters
Journey from a semi-commodity player to a branded one
APL Apollo Tubes (APL) is India’s leading structural steel tube manufacturer with
a capacity of 2.6 million tonne per annum (mtpa) and a pan-India presence. APL’s
market share enhanced from 27% in FY16 to 50% in FY21, led by a strong
distribution network, branding, offering of customized & innovative products and
capacity enhancement. APL’s strategy to focus on rural areas and tier 2/3 cities paid
off well during the reverse migration last year. With 24% CAGR in both revenue
and PAT over FY11-21, it has emerged as one of the pioneers in the segment, much
ahead of competitors. Going ahead, we expect APL to post revenue/PAT CAGRs of
20%/34% over FY21-24E, led by an increased mix of value-added products (75% in
FY25 vs 57% in FY21), capacity expansion, improved margins, and enhanced
government spending on infra. APL’s valuation has sharply rerated on market
share gains, debt reduction, robust growth visibility, and margin expansion. It is
trading close to the average multiple of building material stocks as 75% of its
product mix caters to this segment. We expect it continue to trade at such premium
multiple and initiate coverage on APL with a BUY rating at a TP of INR2,226/share
(35x FY24E EPS).
Pioneer in structural steel segment: APL has reported a strong 24% CAGR topline
and earnings growth over the past decade, led by customised product offerings,
adoption of latest technologies, capacity expansion, vast distribution network, brand
building, and a strong balance sheet. This has led to superiority over peers in the
space and has helped it enhance market share to 50% (in FY21) vs 27% in FY16.
Furthermore, with an increasing share of value-added products, the company has
managed to garner a premium value for its products.
Building a strong brand: APL has successfully captured the mindshare of fabricators
and architects, making its steel tubes as their first choice for applications. Along with
innovative products and offerings, APL has aggressively focused on creating a strong
brand image through large-scale print and TV commercials, sponsorships of mega
sports events and roping in of celebrities as brand ambassadors. These efforts have
allowed it to successfully creep into the rural areas, which are yielding strong results.
Far ahead of peers: Having a 50% market share, adopting the latest technologies and
withholding a strong brand image, APL stands much ahead of its competitors. Its
pan-India distribution network (2x of its nearest peer), enhanced capacity (3x of the
nearest peer) and broad array of product offerings (3x more SKUs) have helped it
gain 5x market share vs peers. 40% of its products literally face zero competition,
which allows it to command premium value and higher margins. Using advanced
technology, it has managed to offer customised products in a much shorter duration
than peers, placing it much ahead of them; we believe it would continue to stay
ahead, going forward.
Initiate with a BUY: We expect APL’s revenue/PAT to grow at CAGRs 20%/34% over
FY21-24E, led by healthy volume growth, margin expansion, reduced working
capital, and reduced debt. We thereby initiate coverage with a BUY rating and a TP of
INR2,226/share (based on 35x FY24E EPS). The multiple of 35x is based on the APL’s
superior performance, operational efficiency and strong positive outlook going
ahead.
Consolidated Financial Summary (INR mn, Mar YE) FY17 FY18 FY19 FY20 FY21 FY22E FY23E FY24E
Net Sales 39,239 53,348 71,523 77,232 84,998 1,04,855 1,25,649 1,46,034
EBITDA 3,330 3,710 3,928 4,773 6,787 8,669 10,738 12,928
EBITDAM (%) 8.5 7.0 5.5 6.2 8.0 8.3 8.5 8.9
APAT 1,521 1,581 1,482 2,380 3,602 5,067 6,982 8,711
AEPS (INR) 12.9 13.3 12.4 19.1 28.8 36.6 50.4 62.9
EV/EBITDA (x) 42.4 38.7 36.9 31.3 31.4 30.2 24.2 20.0
P/E (x) 88.9 86.0 92.2 59.9 58.9 51.4 37.3 29.9
RoE (%) 23.9 20.5 16.5 20.5 23.6 26.0 28.0 27.5
Source: Company, HSIE Research
BUY
CMP(as on 09 Sept 2021) INR 1,879
Target Price INR 2,226
NIFTY 17,369
KEY STOCK DATA
Bloomberg code APAT IN
No. of Shares (mn) 125
MCap (INR bn) / ($ mn) 235/3,155
6m avg traded value (INR mn) 457
52 Week high / low INR 1,901/460
STOCK PERFORMANCE (%)
3M 6M 12M
Absolute (%) 37.3 41.7 288.7
Relative (%) 25.0 27.4 236.1
SHAREHOLDING PATTERN (%)
Jun-21 Mar-21
Promoters 36.9 37.0
FIs & Local MFs 9.4 10.0
FPIs 25.7 24.2
Public & Others 28.0 28.8
Pledged Shares - -
Source : BSE
Anuj Upadhyay
+91-22-6171-7356
Page | 2
APL Apollo Tubes: Initiating Coverage
Contents
Company snapshot ...................................................................................................... 3
Innovative products designed to customer specifications ..................................... 5
Brand building a key focus area ................................................................................. 8
Structural steel market in India and future growth ................................................. 9
Growth in construction sector to drive demand for structural steel ................... 11
APL also eyeing to venture into heavy construction industry ............................ 13
Tricoat acquisition enhances product mix and margins ....................................... 14
How APL outpaces its peers in margin ................................................................... 16
Capex plan – directed at value-added products .................................................... 17
Earnings to be boosted by strong volume growth and margin expansion ........ 18
Valuation: Buy ............................................................................................................ 21
Financials ..................................................................................................................... 25
Page | 3
APL Apollo Tubes: Initiating Coverage
Company snapshot
APL Apollo Tubes (APL) is one of India's leading manufacturers of branded electric
resistance welded (ERW) structural steel pipes, which has a capacity of 2.6 mn tonne
per annum (mtpa) spread across 10 manufacturing facilities. These capacities are
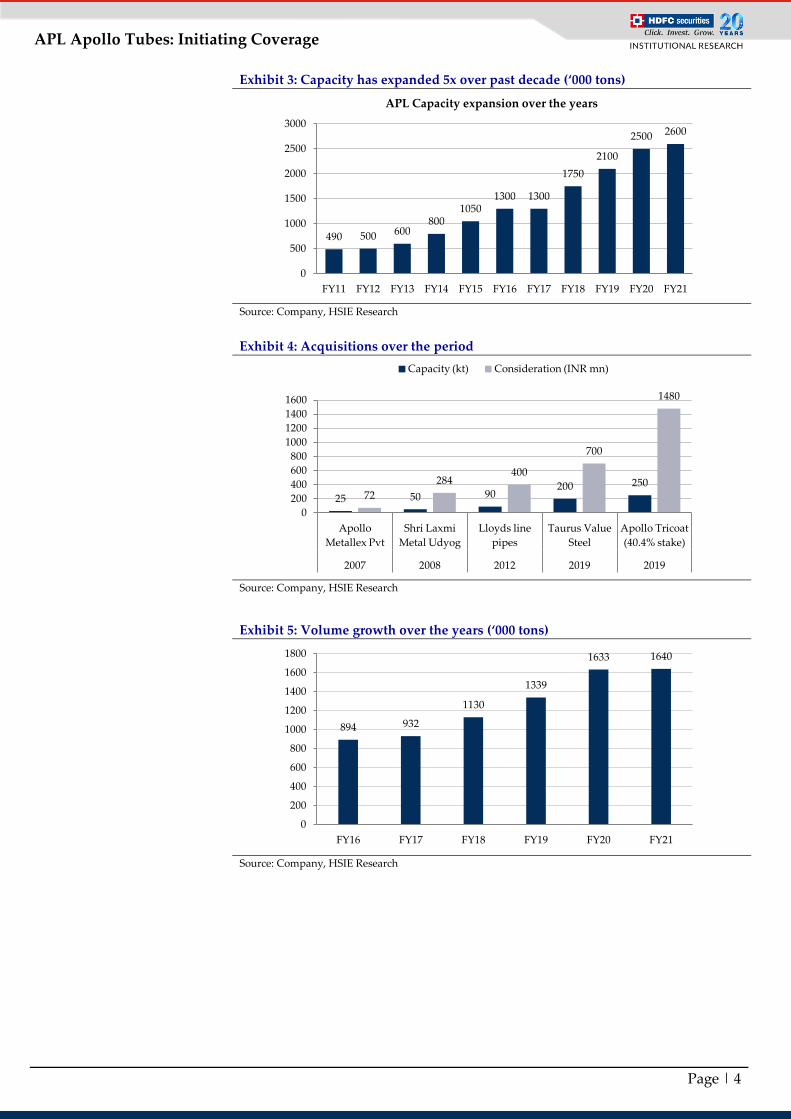
evenly spread across the country and have grown at a CAGR of 23% over the past 11
years from 0.27 mtpa in FY10 to 2.6 mtpa by FY21. APL has built up this capacity
through both the organic and inorganic routes. The major acquisitions include Apollo
Metalex Pvt in 2007, Shri Lakshmi Metal Udyog in 2008, Lloyds Line Pipes in 2012,
and Taurus Value Steel and Apollo Tricoat in 2019.
The volume growth over the same period has largely mirrored the capacity
expansion, as all these capacities were operational in nature at the time of acquisition.
The volumes have grown at a CAGR of 23% over FY10-FY21 to 1.64 mtpa, led by
capacity expansion, vast distribution network (+800 distributers, +50,000 retailers,
+0.2mn fabricators and 29 warehouses), innovative product range (+1,500 SKUs) and
strong brand image. The company’s market share have also increased to 50% across
the ERW segment in FY21 compared to 27% in FY16.
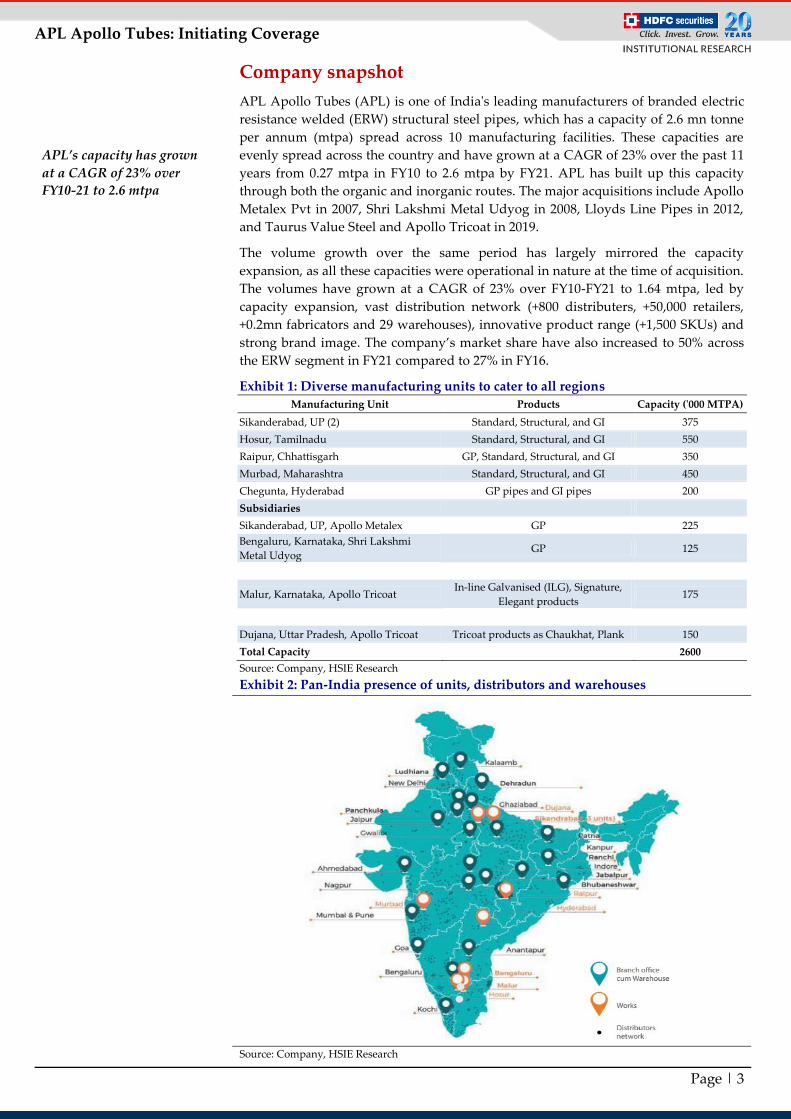
Exhibit 1: Diverse manufacturing units to cater to all regions
Manufacturing Unit Products Capacity ('000 MTPA)
Sikanderabad, UP (2) Standard, Structural, and GI 375
Hosur, Tamilnadu Standard, Structural, and GI 550
Raipur, Chhattisgarh GP, Standard, Structural, and GI 350
Murbad, Maharashtra Standard, Structural, and GI 450
Chegunta, Hyderabad GP pipes and GI pipes 200
Subsidiaries
Sikanderabad, UP, Apollo Metalex GP 225
Bengaluru, Karnataka, Shri Lakshmi
Metal Udyog GP 125
Malur, Karnataka, Apollo Tricoat In-line Galvanised (ILG), Signature,
Elegant products 175
Dujana, Uttar Pradesh, Apollo Tricoat Tricoat products as Chaukhat, Plank 150
Total Capacity 2600
Source: Company, HSIE Research
Exhibit 2: Pan-India presence of units, distributors and warehouses
Source: Company, HSIE Research
APL’s capacity has grown
at a CAGR of 23% over
FY10-21 to 2.6 mtpa
Page | 4
APL Apollo Tubes: Initiating Coverage
Exhibit 3: Capacity has expanded 5x over past decade (‘000 tons)
Source: Company, HSIE Research
Exhibit 4: Acquisitions over the period
Source: Company, HSIE Research
Exhibit 5: Volume growth over the years (‘000 tons)
Source: Company, HSIE Research
490 500 600 800
1050 1300 1300
1750
2100
2500 2600
0
500
1000
1500
2000
2500
3000
FY11 FY12 FY13 FY14 FY15 FY16 FY17 FY18 FY19 FY20 FY21
APL Capacity expansion over the years
25 50 90 200 250
72
284 400
700
1480
0
200
400
600
800
1000
1200
1400
1600
Apollo
Metallex Pvt
Shri Laxmi
Metal Udyog
Lloyds line
pipes
Taurus Value
Steel
Apollo Tricoat
(40.4% stake)
2007 2008 2012 2019 2019
Capacity (kt) Consideration (INR mn)
894 932
1130
1339
1633 1640
0
200
400
600
800
1000
1200
1400
1600
1800
FY16 FY17 FY18 FY19 FY20 FY21
Page | 5
APL Apollo Tubes: Initiating Coverage
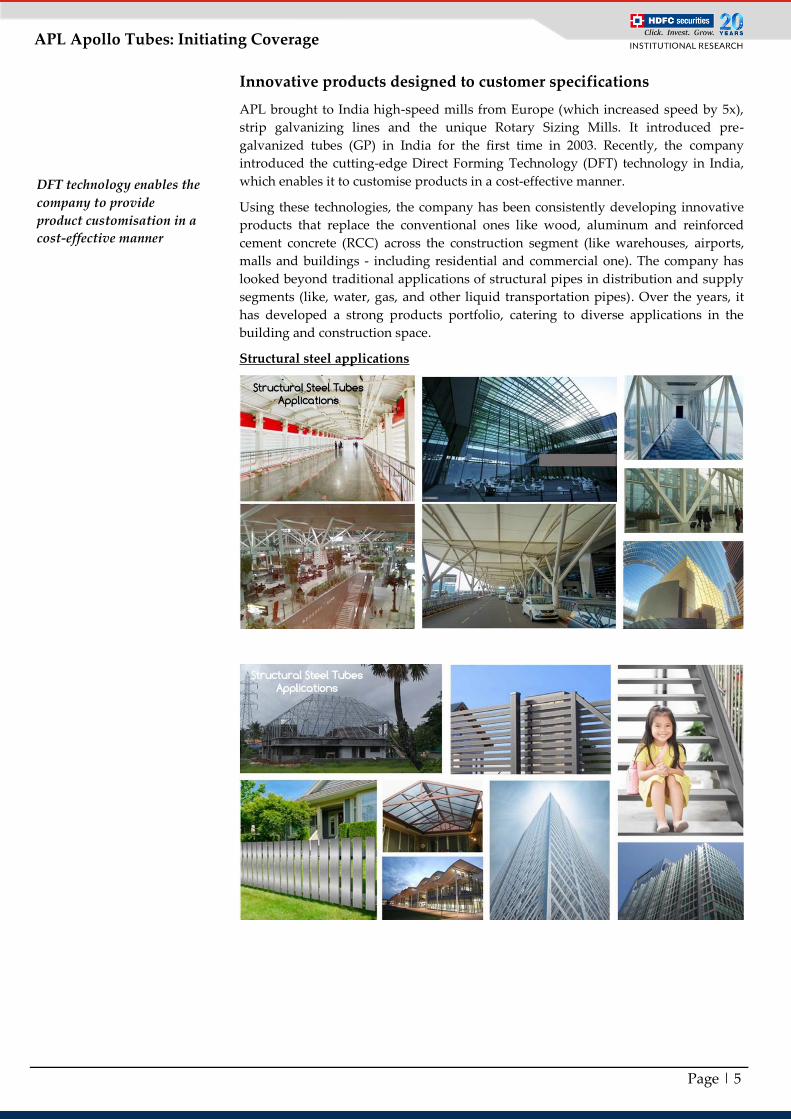
Innovative products designed to customer specifications
APL brought to India high-speed mills from Europe (which increased speed by 5x),
strip galvanizing lines and the unique Rotary Sizing Mills. It introduced pre-
galvanized tubes (GP) in India for the first time in 2003. Recently, the company
introduced the cutting-edge Direct Forming Technology (DFT) technology in India,
which enables it to customise products in a cost-effective manner.
Using these technologies, the company has been consistently developing innovative
products that replace the conventional ones like wood, aluminum and reinforced
cement concrete (RCC) across the construction segment (like warehouses, airports,
malls and buildings - including residential and commercial one). The company has
looked beyond traditional applications of structural pipes in distribution and supply
segments (like, water, gas, and other liquid transportation pipes). Over the years, it
has developed a strong products portfolio, catering to diverse applications in the
building and construction space.
Structural steel applications
DFT technology enables the
company to provide
product customisation in a
cost-effective manner
Page | 6
APL Apollo Tubes: Initiating Coverage
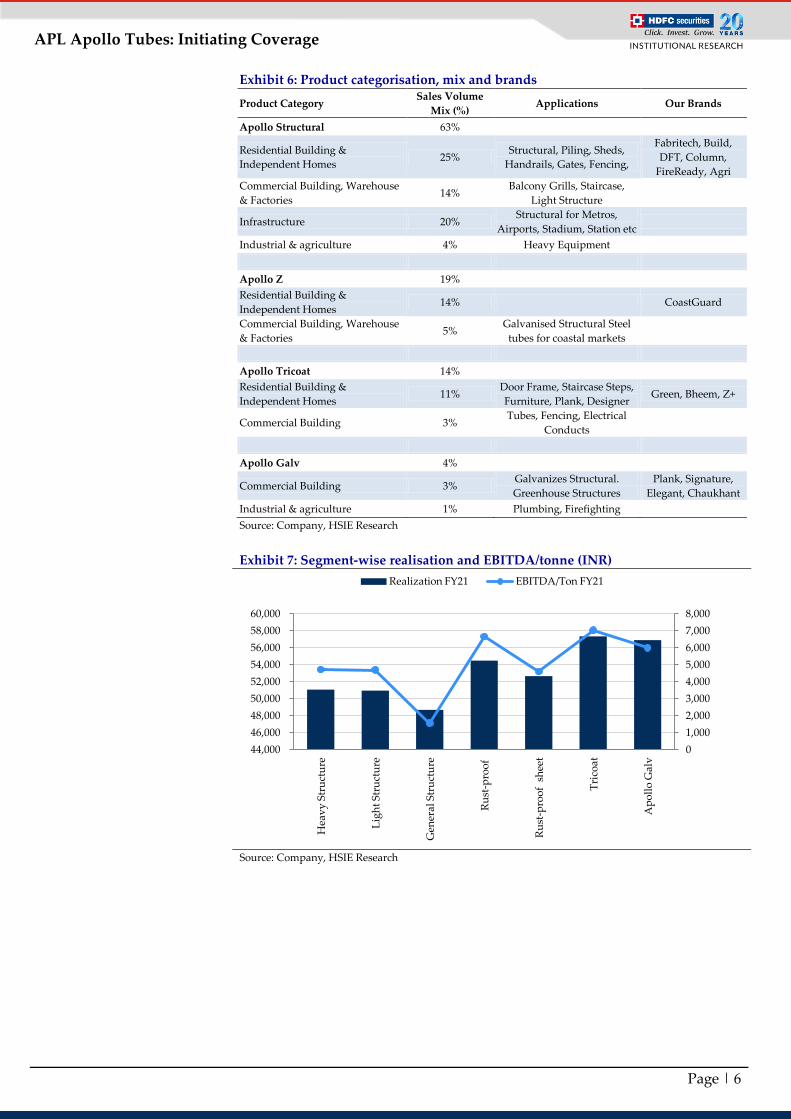
Exhibit 6: Product categorisation, mix and brands
Product Category Sales Volume
Mix (%) Applications Our Brands
Apollo Structural 63%
Residential Building &
Independent Homes 25%
Structural, Piling, Sheds,
Handrails, Gates, Fencing,
Fabritech, Build,
DFT, Column,
FireReady, Agri
Commercial Building, Warehouse
& Factories 14%
Balcony Grills, Staircase,
Light Structure
Infrastructure 20% Structural for Metros,
Airports, Stadium, Station etc
Industrial & agriculture 4% Heavy Equipment
Apollo Z 19%
Residential Building &
Independent Homes 14% CoastGuard
Commercial Building, Warehouse
& Factories 5%
Galvanised Structural Steel
tubes for coastal markets
Apollo Tricoat 14%
Residential Building &
Independent Homes 11%
Door Frame, Staircase Steps,
Furniture, Plank, Designer Green, Bheem, Z+
Commercial Building 3% Tubes, Fencing, Electrical
Conducts
Apollo Galv 4%
Commercial Building 3% Galvanizes Structural.
Greenhouse Structures
Plank, Signature,
Elegant, Chaukhant
Industrial & agriculture 1% Plumbing, Firefighting
Source: Company, HSIE Research
Exhibit 7: Segment-wise realisation and EBITDA/tonne (INR)
Source: Company, HSIE Research
0
1,000
2,000
3,000
4,000
5,000
6,000
7,000
8,000
44,000
46,000
48,000
50,000
52,000
54,000
56,000
58,000
60,000
Hea
vy
Str
uct
ure
Lig
ht
Str
uct
ure
Gen
eral
Str
uct
ure
Ru
st-p
roo
f
Ru
st-p
roo
f s
hee
t
Tri
coat
Ap
oll
o G
alv
Realization FY21 EBITDA/Ton FY21
Page | 7
APL Apollo Tubes: Initiating Coverage
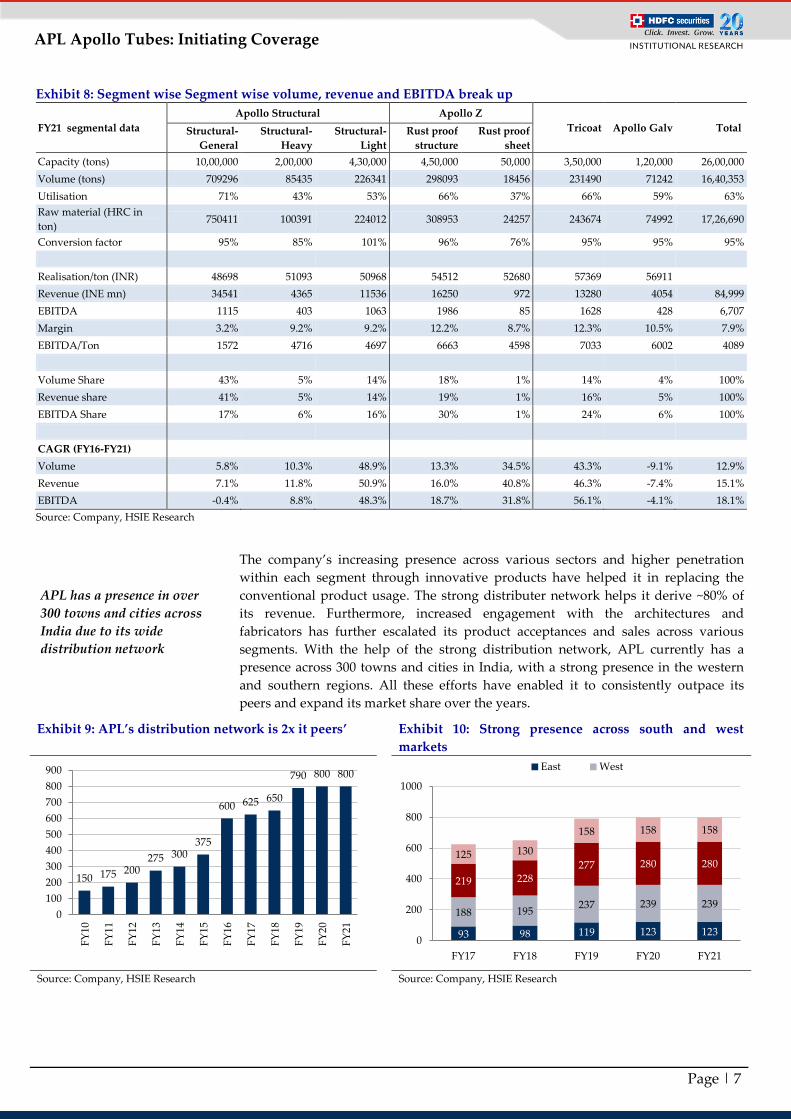
Exhibit 8: Segment wise Segment wise volume, revenue and EBITDA break up
FY21 segmental data
Apollo Structural Apollo Z
Tricoat Apollo Galv Total Structural-
General
Structural-
Heavy
Structural-
Light
Rust proof
structure
Rust proof
sheet
Capacity (tons) 10,00,000 2,00,000 4,30,000 4,50,000 50,000 3,50,000 1,20,000 26,00,000
Volume (tons) 709296 85435 226341 298093 18456 231490 71242 16,40,353
Utilisation 71% 43% 53% 66% 37% 66% 59% 63%
Raw material (HRC in
ton) 750411 100391 224012 308953 24257 243674 74992 17,26,690
Conversion factor 95% 85% 101% 96% 76% 95% 95% 95%
Realisation/ton (INR) 48698 51093 50968 54512 52680 57369 56911
Revenue (INE mn) 34541 4365 11536 16250 972 13280 4054 84,999
EBITDA 1115 403 1063 1986 85 1628 428 6,707
Margin 3.2% 9.2% 9.2% 12.2% 8.7% 12.3% 10.5% 7.9%
EBITDA/Ton 1572 4716 4697 6663 4598 7033 6002 4089
Volume Share 43% 5% 14% 18% 1% 14% 4% 100%
Revenue share 41% 5% 14% 19% 1% 16% 5% 100%
EBITDA Share 17% 6% 16% 30% 1% 24% 6% 100%
CAGR (FY16-FY21)
Volume 5.8% 10.3% 48.9% 13.3% 34.5% 43.3% -9.1% 12.9%
Revenue 7.1% 11.8% 50.9% 16.0% 40.8% 46.3% -7.4% 15.1%
EBITDA -0.4% 8.8% 48.3% 18.7% 31.8% 56.1% -4.1% 18.1%
Source: Company, HSIE Research
The company’s increasing presence across various sectors and higher penetration
within each segment through innovative products have helped it in replacing the
conventional product usage. The strong distributer network helps it derive ~80% of
its revenue. Furthermore, increased engagement with the architectures and
fabricators has further escalated its product acceptances and sales across various
segments. With the help of the strong distribution network, APL currently has a
presence across 300 towns and cities in India, with a strong presence in the western
and southern regions. All these efforts have enabled it to consistently outpace its
peers and expand its market share over the years.
Exhibit 9: APL’s distribution network is 2x it peers’ Exhibit 10: Strong presence across south and west
markets
Source: Company, HSIE Research Source: Company, HSIE Research
150 175 200 275 300
375
600 625 650
790 800 800
0
100
200
300
400
500
600
700
800
900
FY
10
FY
11
FY
12
FY
13
FY
14
FY
15
FY
16
FY
17
FY
18
FY
19
FY
20
FY
21
93 98 119 123 123
188 195 237 239 239
219 228 277 280 280
125 130
158 158 158
0
200
400
600
800
1000
FY17 FY18 FY19 FY20 FY21
East West
APL has a presence in over
300 towns and cities across
India due to its wide
distribution network
Page | 8
APL Apollo Tubes: Initiating Coverage
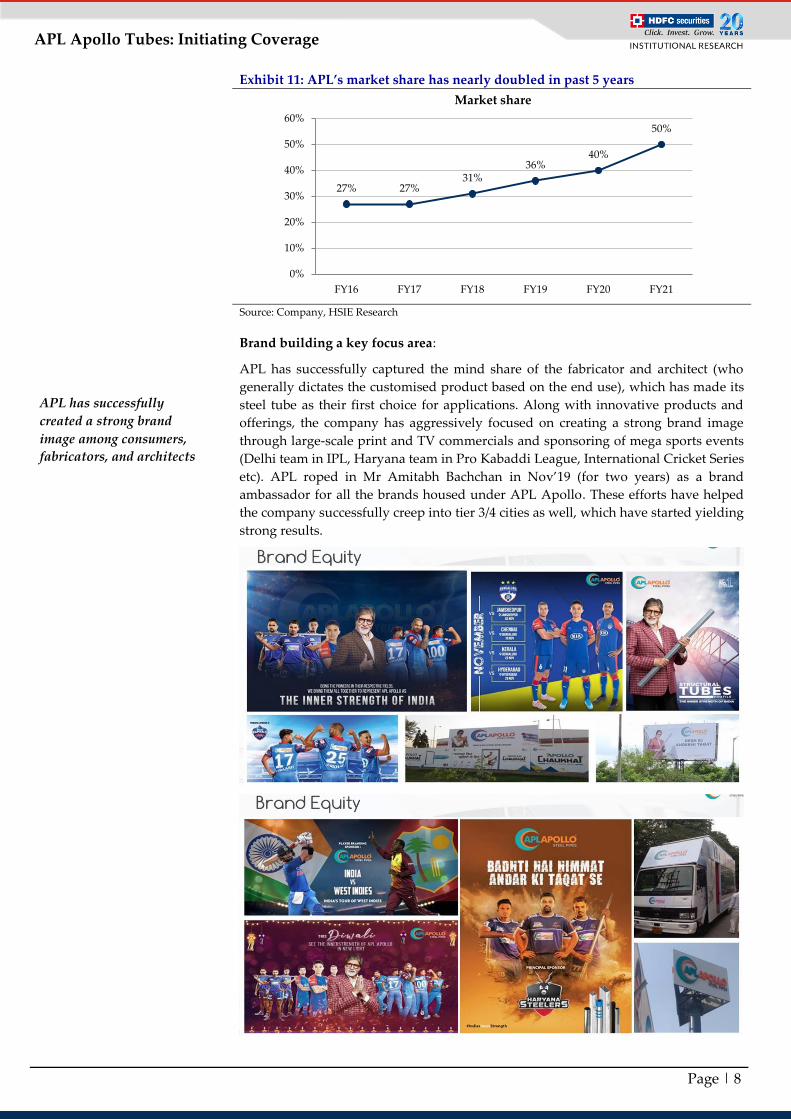
Exhibit 11: APL’s market share has nearly doubled in past 5 years
Source: Company, HSIE Research
Brand building a key focus area:
APL has successfully captured the mind share of the fabricator and architect (who
generally dictates the customised product based on the end use), which has made its
steel tube as their first choice for applications. Along with innovative products and
offerings, the company has aggressively focused on creating a strong brand image
through large-scale print and TV commercials and sponsoring of mega sports events
(Delhi team in IPL, Haryana team in Pro Kabaddi League, International Cricket Series
etc). APL roped in Mr Amitabh Bachchan in Nov’19 (for two years) as a brand
ambassador for all the brands housed under APL Apollo. These efforts have helped
the company successfully creep into tier 3/4 cities as well, which have started yielding
strong results.
27% 27% 31%
36% 40%
50%
0%
10%
20%
30%
40%
50%
60%
FY16 FY17 FY18 FY19 FY20 FY21
Market share
APL has successfully
created a strong brand
image among consumers,
fabricators, and architects
Page | 9
APL Apollo Tubes: Initiating Coverage
The company’s sales during the pandemic remained largely unaffected due to strong
demand from rural and smaller town where the impact of pandemic was relatively
lower than in the larger towns and cities. The company registered nearly 60% of its
FY21 revenue from the tier 2 and rural areas, largely due to reverse migration from
urban to rural areas during the pandemic. However, going ahead, management
expects its sales to be equally split between rural and urban segments.
Structural steel market in India and future growth
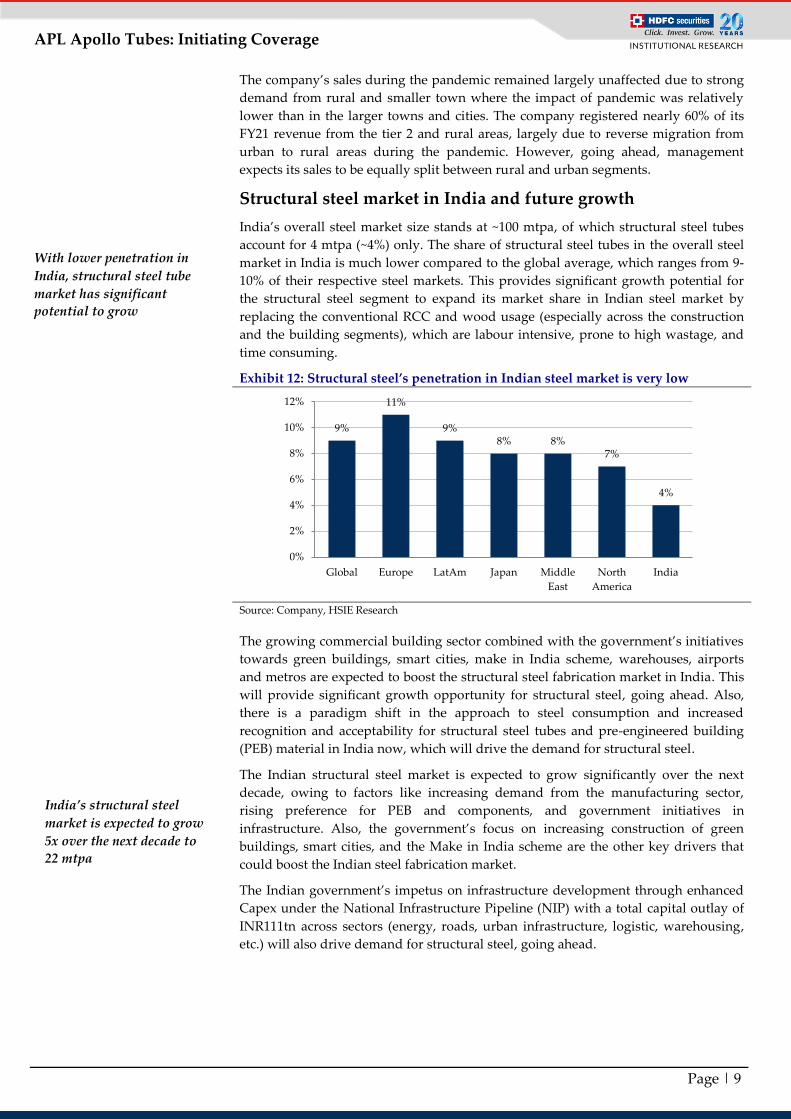
India’s overall steel market size stands at ~100 mtpa, of which structural steel tubes
account for 4 mtpa (~4%) only. The share of structural steel tubes in the overall steel
market in India is much lower compared to the global average, which ranges from 9-
10% of their respective steel markets. This provides significant growth potential for
the structural steel segment to expand its market share in Indian steel market by
replacing the conventional RCC and wood usage (especially across the construction
and the building segments), which are labour intensive, prone to high wastage, and
time consuming.
Exhibit 12: Structural steel’s penetration in Indian steel market is very low
Source: Company, HSIE Research
The growing commercial building sector combined with the government’s initiatives
towards green buildings, smart cities, make in India scheme, warehouses, airports
and metros are expected to boost the structural steel fabrication market in India. This
will provide significant growth opportunity for structural steel, going ahead. Also,
there is a paradigm shift in the approach to steel consumption and increased
recognition and acceptability for structural steel tubes and pre-engineered building
(PEB) material in India now, which will drive the demand for structural steel.
The Indian structural steel market is expected to grow significantly over the next
decade, owing to factors like increasing demand from the manufacturing sector,
rising preference for PEB and components, and government initiatives in
infrastructure. Also, the government’s focus on increasing construction of green
buildings, smart cities, and the Make in India scheme are the other key drivers that
could boost the Indian steel fabrication market.
The Indian government’s impetus on infrastructure development through enhanced
Capex under the National Infrastructure Pipeline (NIP) with a total capital outlay of
INR111tn across sectors (energy, roads, urban infrastructure, logistic, warehousing,
etc.) will also drive demand for structural steel, going ahead.
9%
11%
9% 8% 8%
7%
4%
0%
2%
4%
6%
8%
10%
12%
Global Europe LatAm Japan Middle
East
North
America
India
With lower penetration in
India, structural steel tube
market has significant
potential to grow
India’s structural steel
market is expected to grow
5x over the next decade to
22 mtpa
Page | 10
APL Apollo Tubes: Initiating Coverage
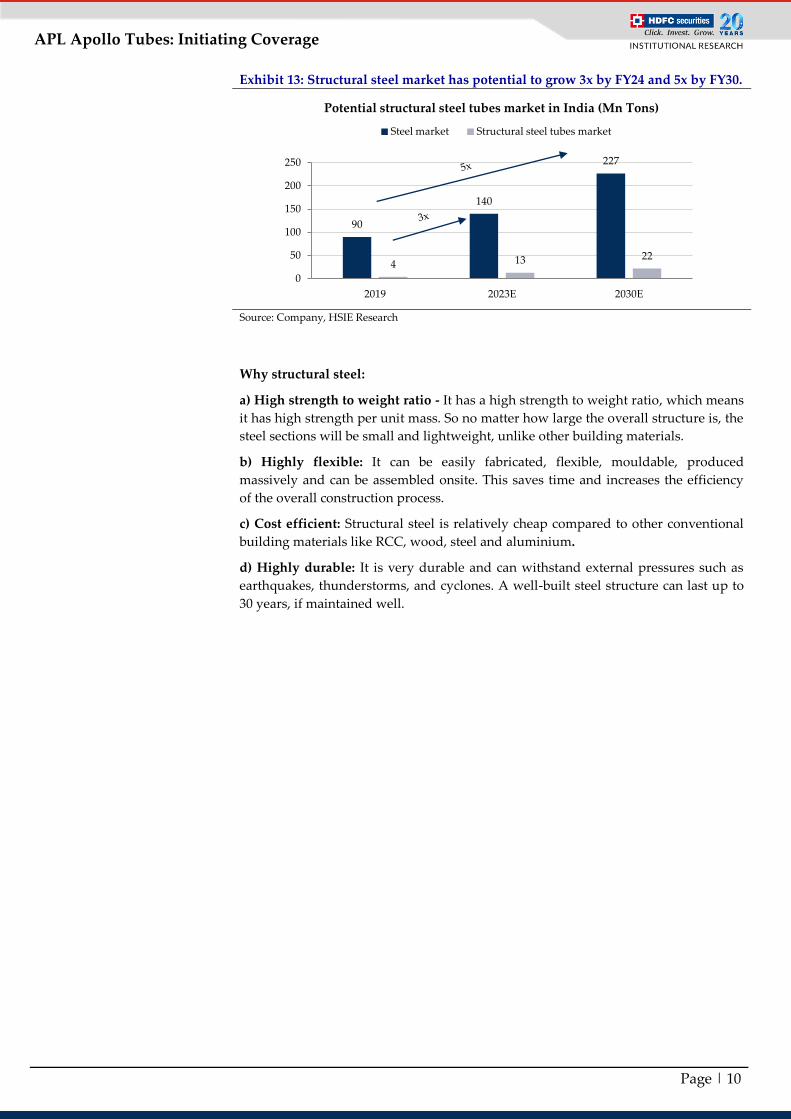
Exhibit 13: Structural steel market has potential to grow 3x by FY24 and 5x by FY30.
Source: Company, HSIE Research
Why structural steel:
a) High strength to weight ratio - It has a high strength to weight ratio, which means
it has high strength per unit mass. So no matter how large the overall structure is, the
steel sections will be small and lightweight, unlike other building materials.
b) Highly flexible: It can be easily fabricated, flexible, mouldable, produced
massively and can be assembled onsite. This saves time and increases the efficiency
of the overall construction process.
c) Cost efficient: Structural steel is relatively cheap compared to other conventional
building materials like RCC, wood, steel and aluminium.
d) Highly durable: It is very durable and can withstand external pressures such as
earthquakes, thunderstorms, and cyclones. A well-built steel structure can last up to
30 years, if maintained well.
90
140
227
4 13 22
0
50
100
150
200
250
2019 2023E 2030E
Potential structural steel tubes market in India (Mn Tons)
Steel market Structural steel tubes market
Page | 11
APL Apollo Tubes: Initiating Coverage
Growth in construction to drive demand for structural steel
Logistics sector:
India’s logistic sector is expected to witness strong investment on the back of
exponential growth in e-commerce, online shopping and revival in economic activity,
which has propelled the need to ramp up supply and storage pace in the sector.
Among the key drivers for growth in the warehousing sector are the third-party and
fourth-party logistics sector, which have been forecasted to grow at a CAGR of 11.5%
from 2020 to 2025, whereas the e-commerce sector is expected to grow at a CAGR of
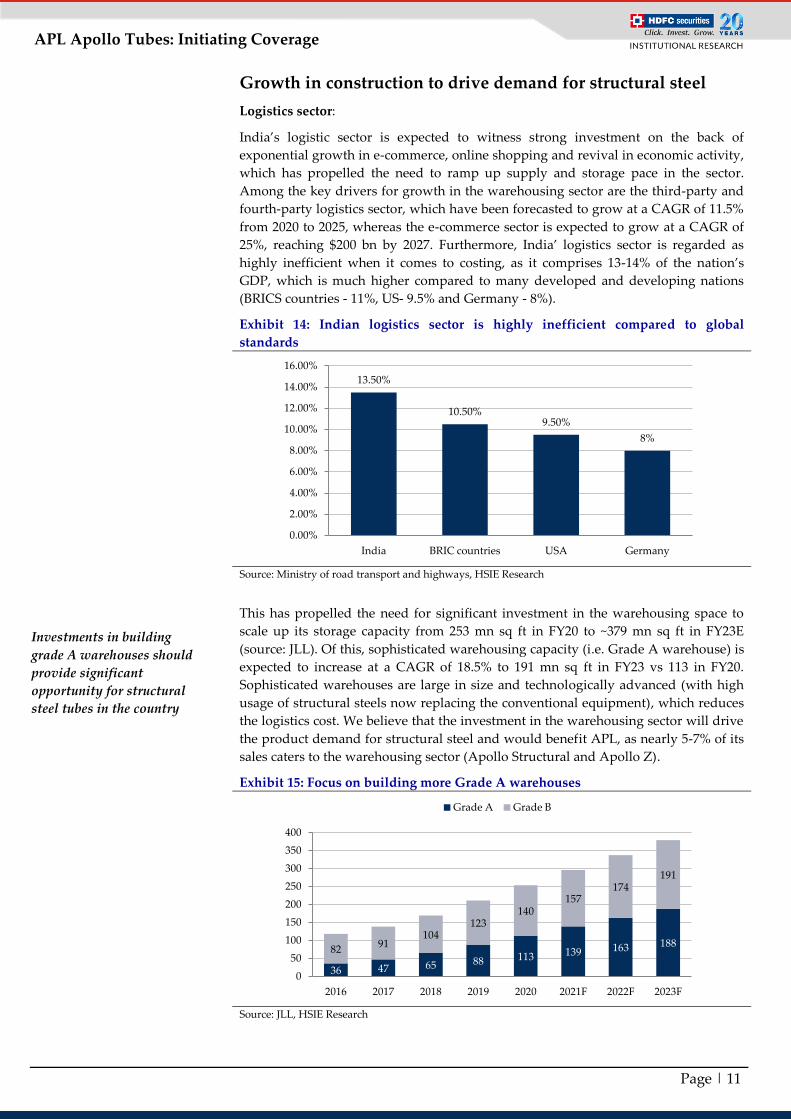
25%, reaching $200 bn by 2027. Furthermore, India’ logistics sector is regarded as
highly inefficient when it comes to costing, as it comprises 13-14% of the nation’s
GDP, which is much higher compared to many developed and developing nations
(BRICS countries - 11%, US- 9.5% and Germany - 8%).
Exhibit 14: Indian logistics sector is highly inefficient compared to global
standards
Source: Ministry of road transport and highways, HSIE Research
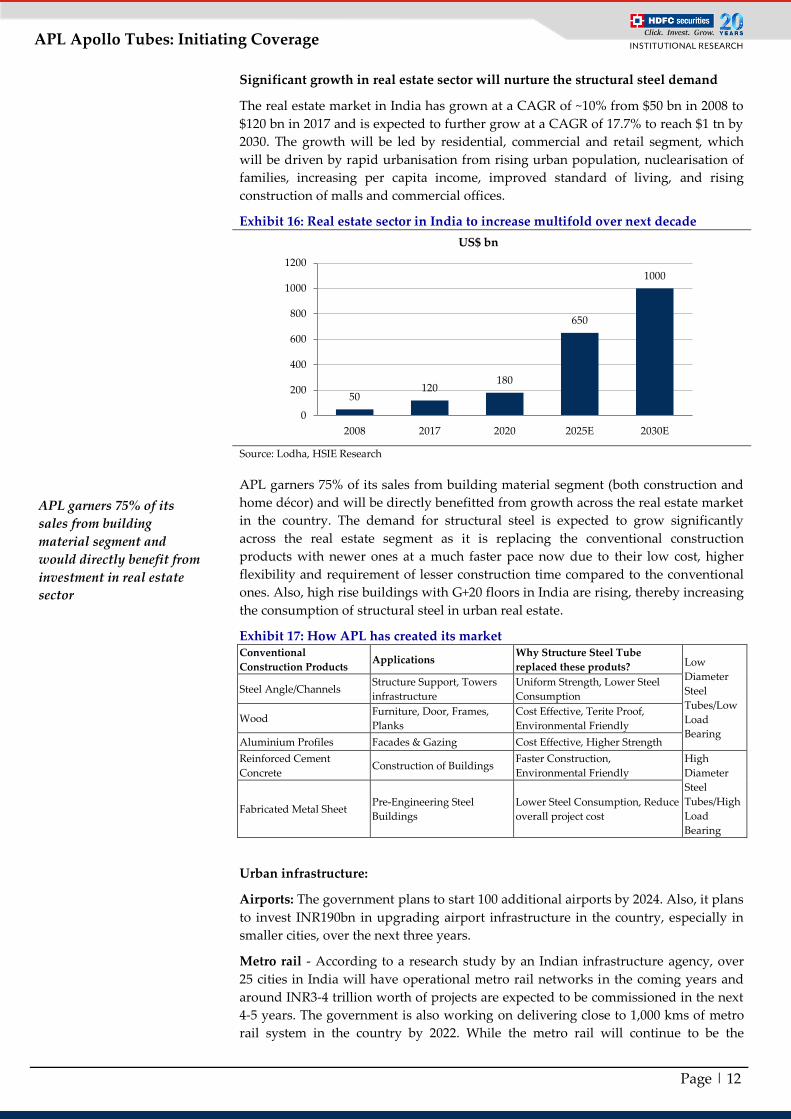
This has propelled the need for significant investment in the warehousing space to
scale up its storage capacity from 253 mn sq ft in FY20 to ~379 mn sq ft in FY23E
(source: JLL). Of this, sophisticated warehousing capacity (i.e. Grade A warehouse) is
expected to increase at a CAGR of 18.5% to 191 mn sq ft in FY23 vs 113 in FY20.
Sophisticated warehouses are large in size and technologically advanced (with high
usage of structural steels now replacing the conventional equipment), which reduces
the logistics cost. We believe that the investment in the warehousing sector will drive
the product demand for structural steel and would benefit APL, as nearly 5-7% of its
sales caters to the warehousing sector (Apollo Structural and Apollo Z).
Exhibit 15: Focus on building more Grade A warehouses
Source: JLL, HSIE Research
13.50%
10.50% 9.50%
8%
0.00%
2.00%
4.00%
6.00%
8.00%
10.00%
12.00%
14.00%
16.00%
India BRIC countries USA Germany
36 47 65 88 113 139 163 188 82
91 104
123 140
157 174
191
0
50
100
150
200
250
300
350
400
2016 2017 2018 2019 2020 2021F 2022F 2023F
Grade A Grade B
Investments in building
grade A warehouses should
provide significant
opportunity for structural
steel tubes in the country
Page | 12
APL Apollo Tubes: Initiating Coverage
Significant growth in real estate sector will nurture the structural steel demand
The real estate market in India has grown at a CAGR of ~10% from $50 bn in 2008 to
$120 bn in 2017 and is expected to further grow at a CAGR of 17.7% to reach $1 tn by
2030. The growth will be led by residential, commercial and retail segment, which
will be driven by rapid urbanisation from rising urban population, nuclearisation of
families, increasing per capita income, improved standard of living, and rising
construction of malls and commercial offices.
Exhibit 16: Real estate sector in India to increase multifold over next decade
Source: Lodha, HSIE Research
APL garners 75% of its sales from building material segment (both construction and
home décor) and will be directly benefitted from growth across the real estate market
in the country. The demand for structural steel is expected to grow significantly
across the real estate segment as it is replacing the conventional construction
products with newer ones at a much faster pace now due to their low cost, higher
flexibility and requirement of lesser construction time compared to the conventional
ones. Also, high rise buildings with G+20 floors in India are rising, thereby increasing
the consumption of structural steel in urban real estate.
Exhibit 17: How APL has created its market Conventional
Construction Products Applications
Why Structure Steel Tube
replaced these produts? Low
Diameter
Steel
Tubes/Low
Load
Bearing
Steel Angle/Channels Structure Support, Towers
infrastructure
Uniform Strength, Lower Steel
Consumption
Wood Furniture, Door, Frames,
Planks
Cost Effective, Terite Proof,
Environmental Friendly
Aluminium Profiles Facades & Gazing Cost Effective, Higher Strength
Reinforced Cement
Concrete Construction of Buildings
Faster Construction,
Environmental Friendly
High
Diameter
Steel
Tubes/High
Load
Bearing
Fabricated Metal Sheet Pre-Engineering Steel
Buildings
Lower Steel Consumption, Reduce
overall project cost
Urban infrastructure:
Airports: The government plans to start 100 additional airports by 2024. Also, it plans
to invest INR190bn in upgrading airport infrastructure in the country, especially in
smaller cities, over the next three years.
Metro rail - According to a research study by an Indian infrastructure agency, over
25 cities in India will have operational metro rail networks in the coming years and
around INR3-4 trillion worth of projects are expected to be commissioned in the next
4-5 years. The government is also working on delivering close to 1,000 kms of metro
rail system in the country by 2022. While the metro rail will continue to be the
50 120
180
650
1000
0
200
400
600
800
1000
1200
2008 2017 2020 2025E 2030E
US$ bn
APL garners 75% of its
sales from building
material segment and
would directly benefit from
investment in real estate
sector
Page | 13
APL Apollo Tubes: Initiating Coverage
dominant mode of commuting, various other models such as rapid rail and light rail
will also witness growth.
The growth across both these segments will drive demand for structural steel and,
with APL having a major 50% share in the segment, it will be a major beneficiary.
APL is working to create a market for heavy structural steel tubes in India
The company is targeting to offer its products for construction of heavy structures.
Many state governments and private developers are planning to construct hospitals,
malls and commercial complexes using tubular technology. APL plans to supply its
heavy diameter products (300x300 and upcoming 500x500) for building structures in
these kind of upcoming projects.
Benefits of using steel tubes for building such structures:
20% less usage of conventional steel in structure
10% savings in total project cost
Faster project completion – conventional method of using RCC in
construction generally takes around 2.5-3 years for the entire construction of
a building. Using structural tubes allow the fabrication work to take place in
the fabricators’ workshops and only the assembly of structure takes place at
the site
Environment friendly completion
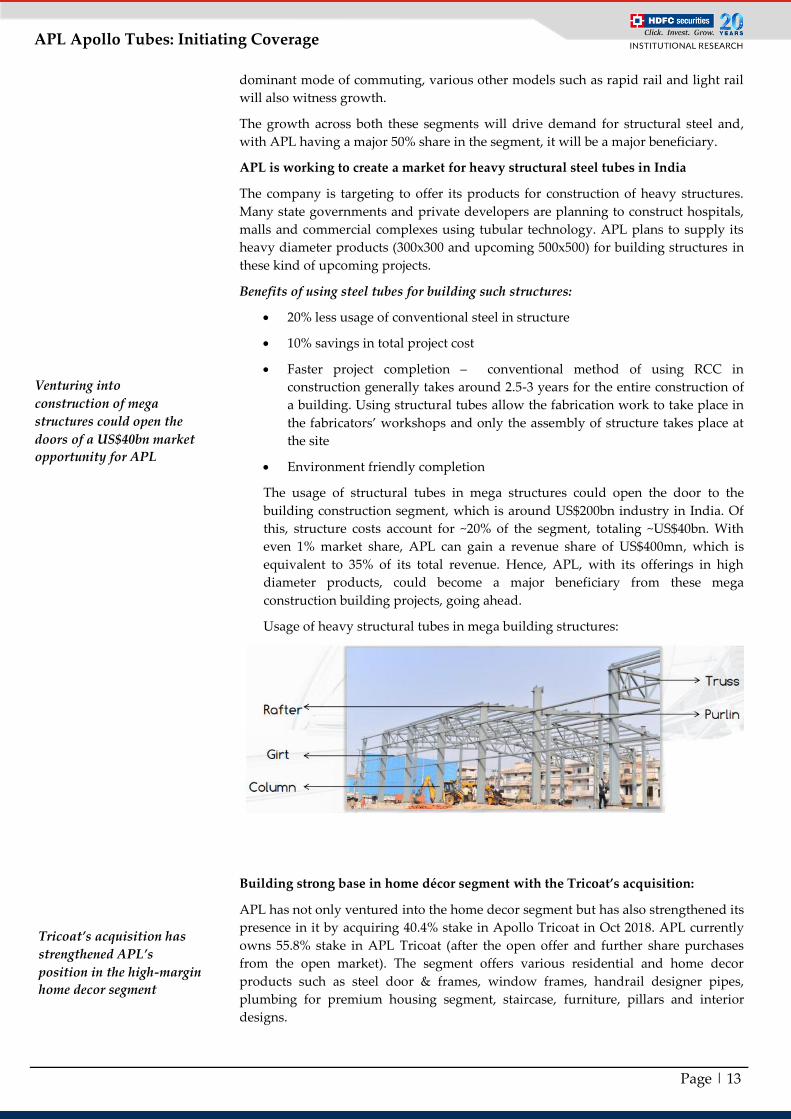
The usage of structural tubes in mega structures could open the door to the
building construction segment, which is around US$200bn industry in India. Of
this, structure costs account for ~20% of the segment, totaling ~US$40bn. With
even 1% market share, APL can gain a revenue share of US$400mn, which is
equivalent to 35% of its total revenue. Hence, APL, with its offerings in high
diameter products, could become a major beneficiary from these mega
construction building projects, going ahead.
Usage of heavy structural tubes in mega building structures:
Building strong base in home décor segment with the Tricoat’s acquisition:
APL has not only ventured into the home decor segment but has also strengthened its
presence in it by acquiring 40.4% stake in Apollo Tricoat in Oct 2018. APL currently
owns 55.8% stake in APL Tricoat (after the open offer and further share purchases
from the open market). The segment offers various residential and home decor
products such as steel door & frames, window frames, handrail designer pipes,
plumbing for premium housing segment, staircase, furniture, pillars and interior
designs.
Venturing into
construction of mega
structures could open the
doors of a US$40bn market
opportunity for APL
Tricoat’s acquisition has
strengthened APL’s
position in the high-margin
home decor segment
Page | 14
APL Apollo Tubes: Initiating Coverage
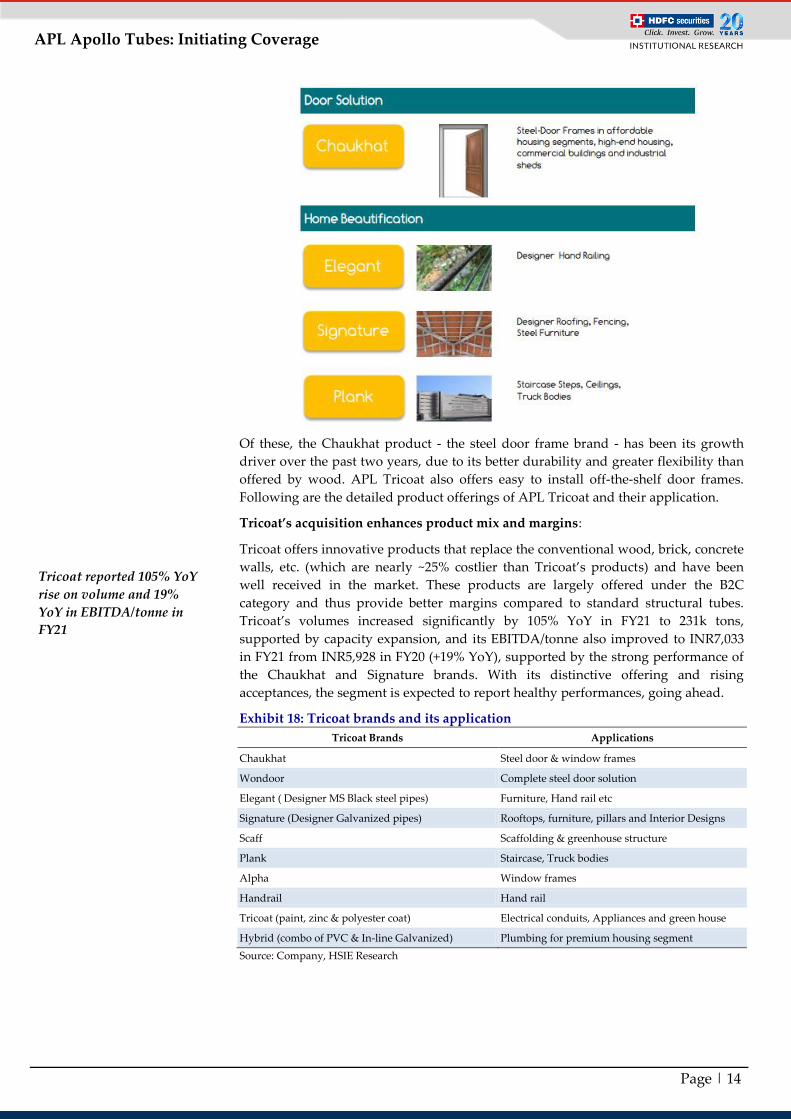
Of these, the Chaukhat product - the steel door frame brand - has been its growth
driver over the past two years, due to its better durability and greater flexibility than
offered by wood. APL Tricoat also offers easy to install off-the-shelf door frames.
Following are the detailed product offerings of APL Tricoat and their application.
Tricoat’s acquisition enhances product mix and margins:
Tricoat offers innovative products that replace the conventional wood, brick, concrete
walls, etc. (which are nearly ~25% costlier than Tricoat’s products) and have been
well received in the market. These products are largely offered under the B2C
category and thus provide better margins compared to standard structural tubes.
Tricoat’s volumes increased significantly by 105% YoY in FY21 to 231k tons,
supported by capacity expansion, and its EBITDA/tonne also improved to INR7,033
in FY21 from INR5,928 in FY20 (+19% YoY), supported by the strong performance of
the Chaukhat and Signature brands. With its distinctive offering and rising
acceptances, the segment is expected to report healthy performances, going ahead.
Exhibit 18: Tricoat brands and its application
Tricoat Brands Applications
Chaukhat Steel door & window frames
Wondoor Complete steel door solution
Elegant ( Designer MS Black steel pipes) Furniture, Hand rail etc
Signature (Designer Galvanized pipes) Rooftops, furniture, pillars and Interior Designs
Scaff Scaffolding & greenhouse structure
Plank Staircase, Truck bodies
Alpha Window frames
Handrail Hand rail
Tricoat (paint, zinc & polyester coat) Electrical conduits, Appliances and green house
Hybrid (combo of PVC & In-line Galvanized) Plumbing for premium housing segment
Source: Company, HSIE Research
Tricoat reported 105% YoY
rise on volume and 19%
YoY in EBITDA/tonne in
FY21

Page | 15
APL Apollo Tubes: Initiating Coverage
Rising focus on value-added products:
Tricoat’s acquisition is very much in line with the management focus to enhance the
share of value-added products in its portfolio. Currently, the company has 57% of its
products in the high-margin category (EBITDA/tonne in the range of INR5,000-
INR7,500) and 40% of its product sales mix literally faces zero competition from its
peers. We expect the high-margin products to continue to dominate the product mix,
supported by its planned capacity addition in the next few years. Management
targets to enhance the share of value-added products to 75% in the next 2-3 years,
which should help normalise margin pressure amidst steel price fluctuations.
Exhibit 19: EBITDA/tonne across categories (INR) Exhibit 20: Share of value-added products on rise
Source: Company, HSIE Research Source: Company, HSIE Research
Much ahead of its peers
With a 2.6 mtpa capacity and 63% utilisation level, APL is far ahead of its peers with
50% share in the domestic market, which is significantly higher than the second-
largest player’s (which has 9% market share). The dominance in the competition is
largely led by the continuous introduction of innovative products across segments
that are largely acceptable in the market. Furthermore, with its large and strong
distribution network and reach towards the end customer, the company is far ahead
of its peers. Also, nearly 60% of its product mix comprises value-added products
(high margin) and ~40% of its products face no competition at all in the market.
Exhibit 21: APL’s capacity is 3x its next peers’ Exhibit 22: APL’s distributors is 2x its next peers’
Source: Company, HSIE Research Source: Company, HSIE Research
1657
4722 4718
6582 7072
6040
0
2,000
4,000
6,000
8,000
FY21
Structural-General Structural-Heavy
Structural-Light Apollo Z
60% 57% 58% 58% 55% 43%
6% 5% 5% 6% 6%
6%
3% 5% 6% 8% 5%
13%
18% 20% 21% 21% 21%
19%
0% 0% 0% 0% 7% 14% 13% 13% 10% 7% 6% 4%
0%
20%
40%
60%
80%
100%
FY16 FY17 FY18 FY19 FY20 FY21
Structural-General Structural-Heavy Structural-Light
Apollo Z Tricoat Apollo Galv
2600
925
580
168
0
500
1,000
1,500
2,000
2,500
3,000
APL Apollo Surya Roshini Hitech Rama Steel
Tubes
Capacity ('000 TPA)
800
250
390 300
0
200
400
600
800
1,000
APL Apollo Surya Roshini Hitech Rama Steel
Tubes
No. of distributors
APL targets to scale up
proportion of value-added
products to 75% by FY25 vs
57% in FY21
40% of APL’s products face
almost zero competition
from its peers

Page | 16
APL Apollo Tubes: Initiating Coverage
Exhibit 23: APL enjoys much better margins Exhibit 24: APL generates 2x return vs its peers
Source: Company, HSIE Research Source: Company, HSIE Research
How APL outpaces its peers in margin
APL procures 2% of the Indian steel consumption and 10% of Indian HR coil
consumption. This enables it to obtain a 2% discount on its purchase, which
many of its peers fail to take advantage of.
It has a pan-India presence with plants in the north, west, south and central
India, which lead to significant saving in freight costs (4-6%). Steel tubes are
largely regional in nature and, thus, with its vast distribution network and pan-
India presence, the company receives 1-2% higher margin compare to its peers.
In nearly 40% of its portfolio, it doesn’t face any competition as it produces a
basket of many small products with nearly +1,500 SKUs, +50,000 retailers, +800
distributors and 29 warehouses and depots in the country. APL derives nearly
80% of its sales from distributors. With this support, the company has a strong
presence in more than 300 towns and cities in the country. The nearest competitor
has 590 SKUs, 21,000 retailer’s access and a dealer base of 390, all far below APL’s
network.
The adoption of better technology provides the company unparalleled cost
advantage compared to its peers. The company purchased the DFT in 2016 from
an Italian company Olympia. DFT enables the possibility to produce any
customized size of Hollow Section, included in the mill range, without roll
change. DFT helps customize any pipe, without roll change, which not only
lowers the raw material cost (~2-8%) but also saves lot of time, as in the case of
conventional technology, all pipes are first made round (in shape) and then given
another shape, i.e., square, hollow, rectangle etc., which increases the conversion
cost. In DFT, the entire rolling process is automated, which takes 1-2 hours,
where in case of conventional method takes 8 hours to 2 days as the entire line
has to be changed manually. This reduces the set-up time significantly. Product
customisation has helped APL create a large and diversified client base since it
can meet different requirements.
Backward integration – the company has entered backward integration in
structural steel manufacturing process by introducing cold roll milling. Through
this technology, it downsizes the standard HRC coil width from 2mm to 1.2mm-
1.4mm (which is used for manufacturing of high-value products). Earlier, the
company was getting these sized customized HRC from Tata Steel and JSW Steel
at a much higher price and these products were also made available to
competitors. However, with the involvement of the cold roll milling at its
manufacturing facility, it is not only able to save on the process cost but has also
created a barrier for its peers to enter the value-added products segment, as both
82.1
43.3
13.4 4.7
8% 6.30% 5.30%
4.90%
0%
2%
4%
6%
8%
10%
0
20
40
60
80
100
APL Apollo Surya Roshini Hitech pipes Rama steel
Revenue (INR bn) EBITDA margin (RHS)
25%
12% 12%
6%
27%
13% 13%
8%
0%
5%
10%
15%
20%
25%
30%
APL Apollo Surya Roshini Hitech Pipes Rama Steel
APL enjoys economies of
scale compared to peers,
which helps it gain better
margins
With backward
integration, APL is not
only able to save on the
process cost but has also
created a barrier for its
peers
Page | 17
APL Apollo Tubes: Initiating Coverage
Tata steel and JSW steel now manufacture only standard 2mm width HRC sheets
since APL (its largest HRC customer) has stopped taking customised HRC sheets.
Furthermore, both Hitech and Surya Roshni lack such strong balance sheets to be
able to carry out backward integration.
Thus, APL has been a pioneer in adopting and bringing new technologies such as
DFT, in line galvanisation (ILG) and products like pre-galvanised tubes into India,
which allow for cost-effective customisation to meet client requirements.
Capex plan – directed at value-added product
APL has planned a capacity expansion of 1.4 mtpa (0.4 mtpa in FY22, 0.6 mtpa in
FY23 and 0.4mtpa in FY24). Of this, 1 mtpa capacity will be across its Raipur facility
while the balance 0.4mtpa capacity will be across other units. The expansion will be
towards:
a) 0.2 mtpa for 500x500 diameter steel tubes which will be used in heavy
building structures
b) 0.2 mtpa towards 500x500 diameter color coated structural tubes (first of their
kind in the Indian market)
c) 0.8 mtpa towards existing product categories.
All these expansions will be in value-added segments, which are expected to garner
an EBITDA/tonne of INR6,000. The company plans to incur Capex of
INR3.25bn/INR2.5bn/INR2.0bn in FY22E/FY23E/24E for the same, which would be
met through internal cash flows.
Cash & carry model reduces working capital stress; aim of becoming net debt free
by FY23
APL Apollo’s net debt has reduced, from INR7.9bn in FY20 to INR1.6bn at the end
FY21. This was possible as the company switched over to the cash & carry business
model and stopped giving credit to its distributors and customers. This practice
significantly lowered its receivables from INR4.8bn in FY20 to INR1.3bn in FY21 and
reduced its working capital requirement. Its net working capital days also reduced
from 25 days in FY20 to 8 in FY21 due to the cash & carry model. The surplus cash
thus generated was utilised towards debt repayment. Management is confident of
maintaining similar working capital levels, going ahead as well, and thus targets to
become net debt free by FY23.
APL plans to add 1.4 mtpa
capacity by FY24 - directed
at value-added products
Page | 18
APL Apollo Tubes: Initiating Coverage
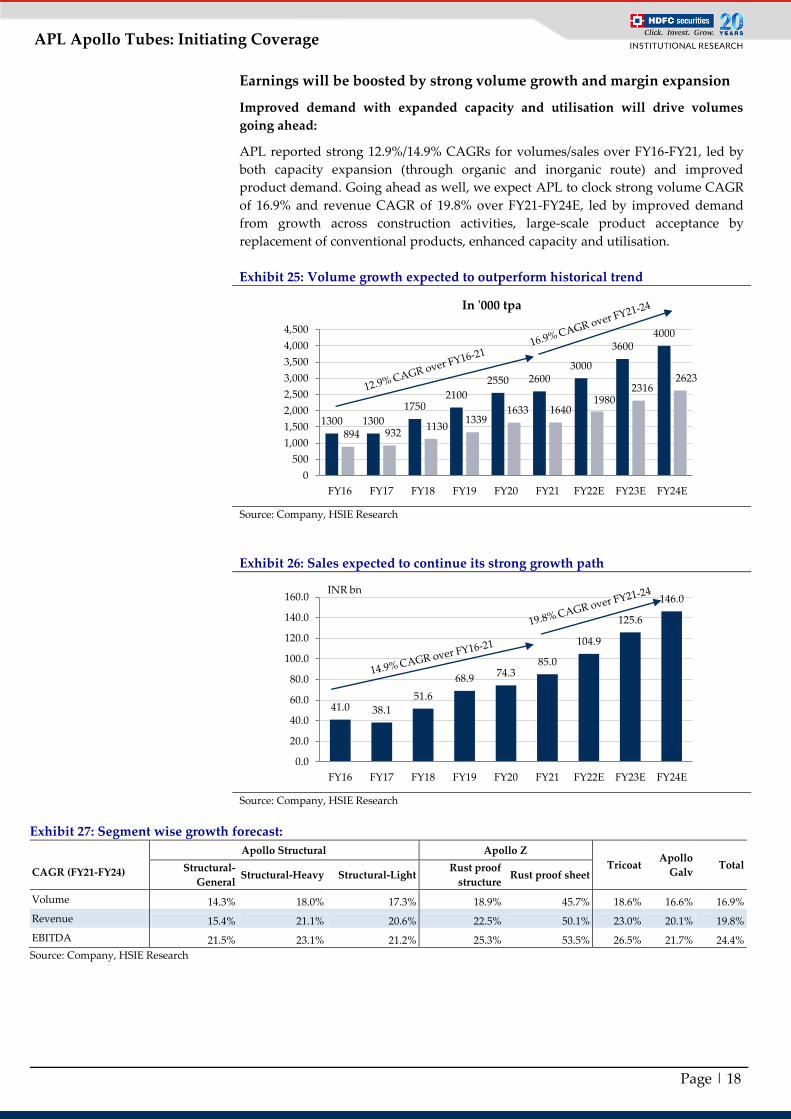
Earnings will be boosted by strong volume growth and margin expansion
Improved demand with expanded capacity and utilisation will drive volumes
going ahead:
APL reported strong 12.9%/14.9% CAGRs for volumes/sales over FY16-FY21, led by
both capacity expansion (through organic and inorganic route) and improved
product demand. Going ahead as well, we expect APL to clock strong volume CAGR
of 16.9% and revenue CAGR of 19.8% over FY21-FY24E, led by improved demand
from growth across construction activities, large-scale product acceptance by
replacement of conventional products, enhanced capacity and utilisation.
Exhibit 25: Volume growth expected to outperform historical trend
Source: Company, HSIE Research
Exhibit 26: Sales expected to continue its strong growth path
Source: Company, HSIE Research
Exhibit 27: Segment wise growth forecast:
CAGR (FY21-FY24)
Apollo Structural Apollo Z
Tricoat Apollo
Galv Total Structural-
General Structural-Heavy Structural-Light
Rust proof
structure Rust proof sheet
Volume 14.3% 18.0% 17.3% 18.9% 45.7% 18.6% 16.6% 16.9%
Revenue 15.4% 21.1% 20.6% 22.5% 50.1% 23.0% 20.1% 19.8%
EBITDA 21.5% 23.1% 21.2% 25.3% 53.5% 26.5% 21.7% 24.4%
Source: Company, HSIE Research
1300 1300
1750 2100
2550 2600 3000
3600 4000
894 932 1130
1339 1633 1640
1980 2316
2623
0
500
1,000
1,500
2,000
2,500
3,000
3,500
4,000
4,500
FY16 FY17 FY18 FY19 FY20 FY21 FY22E FY23E FY24E
In '000 tpa
41.0 38.1
51.6
68.9 74.3
85.0
104.9
125.6
146.0
0.0
20.0
40.0
60.0
80.0
100.0
120.0
140.0
160.0
FY16 FY17 FY18 FY19 FY20 FY21 FY22E FY23E FY24E
INR bn
Page | 19
APL Apollo Tubes: Initiating Coverage
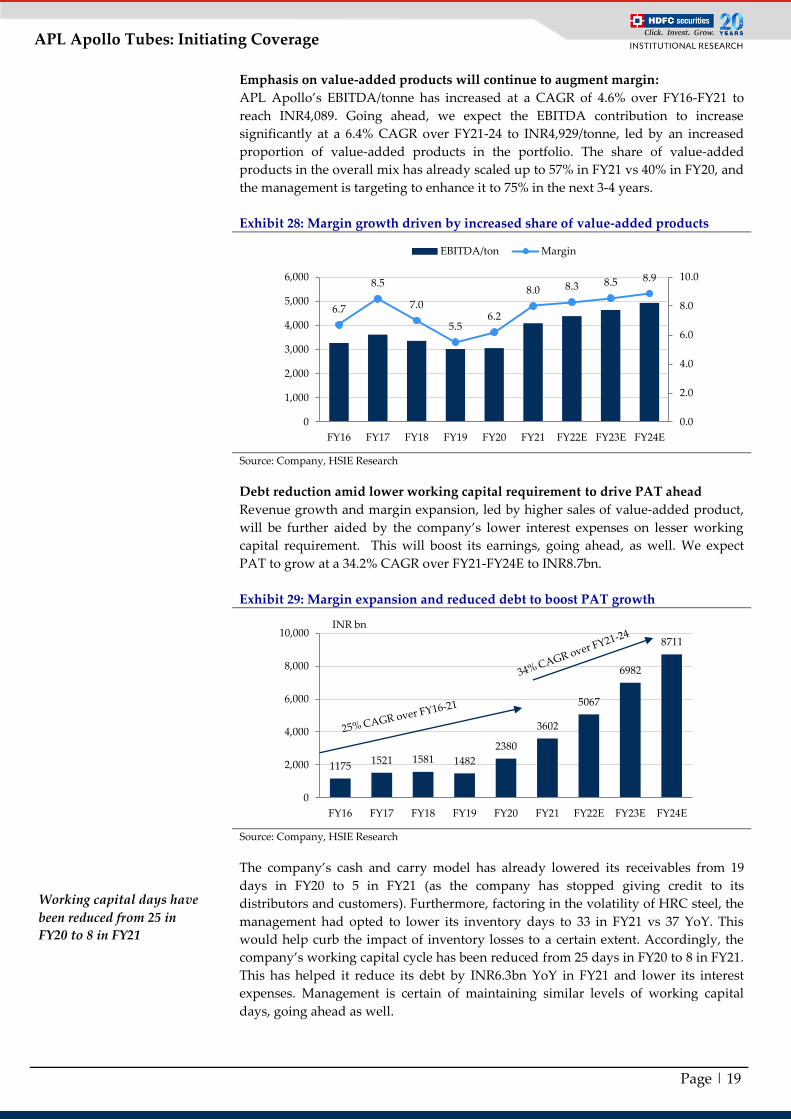
Emphasis on value-added products will continue to augment margin:
APL Apollo’s EBITDA/tonne has increased at a CAGR of 4.6% over FY16-FY21 to
reach INR4,089. Going ahead, we expect the EBITDA contribution to increase
significantly at a 6.4% CAGR over FY21-24 to INR4,929/tonne, led by an increased
proportion of value-added products in the portfolio. The share of value-added
products in the overall mix has already scaled up to 57% in FY21 vs 40% in FY20, and
the management is targeting to enhance it to 75% in the next 3-4 years.
Exhibit 28: Margin growth driven by increased share of value-added products
Source: Company, HSIE Research
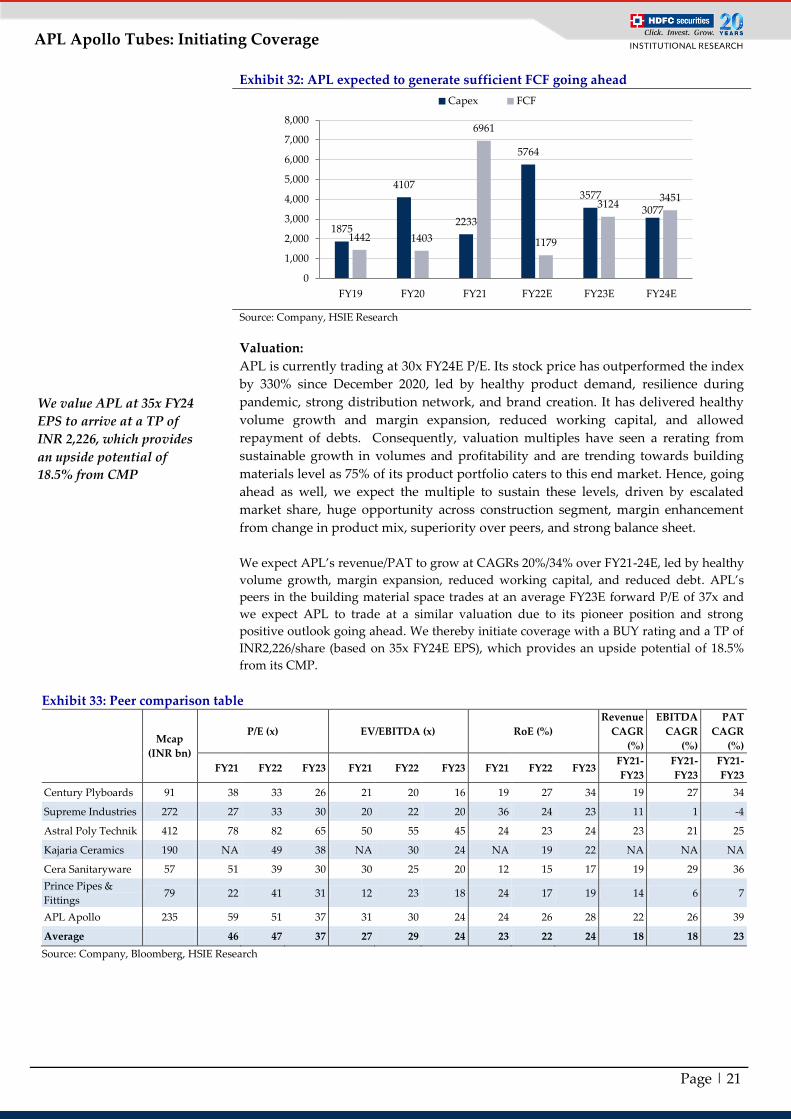
Debt reduction amid lower working capital requirement to drive PAT ahead
Revenue growth and margin expansion, led by higher sales of value-added product,
will be further aided by the company’s lower interest expenses on lesser working
capital requirement. This will boost its earnings, going ahead, as well. We expect
PAT to grow at a 34.2% CAGR over FY21-FY24E to INR8.7bn.
Exhibit 29: Margin expansion and reduced debt to boost PAT growth
Source: Company, HSIE Research
The company’s cash and carry model has already lowered its receivables from 19
days in FY20 to 5 in FY21 (as the company has stopped giving credit to its
distributors and customers). Furthermore, factoring in the volatility of HRC steel, the
management had opted to lower its inventory days to 33 in FY21 vs 37 YoY. This
would help curb the impact of inventory losses to a certain extent. Accordingly, the
company’s working capital cycle has been reduced from 25 days in FY20 to 8 in FY21.
This has helped it reduce its debt by INR6.3bn YoY in FY21 and lower its interest
expenses. Management is certain of maintaining similar levels of working capital
days, going ahead as well.
6.7
8.5
7.0
5.5 6.2
8.0 8.3 8.5 8.9
0.0
2.0
4.0
6.0
8.0
10.0
0
1,000
2,000
3,000
4,000
5,000
6,000
FY16 FY17 FY18 FY19 FY20 FY21 FY22E FY23E FY24E
EBITDA/ton Margin
1175 1521 1581 1482
2380
3602
5067
6982
8711
0
2,000
4,000
6,000
8,000
10,000
FY16 FY17 FY18 FY19 FY20 FY21 FY22E FY23E FY24E
INR bn
Working capital days have
been reduced from 25 in
FY20 to 8 in FY21

Page | 20
APL Apollo Tubes: Initiating Coverage
Exhibit 30: Company targets to become net debt free by FY23E (x)
Source: Company, HSIE Research
Returns ratio to remain healthy, led by strong earnings growth:
Margin expansion and improved working capital cycle would boost return ratios,
going ahead. We expect APL Apollo’s RoE to improve from 23.6% in FY21 to 27.5% in
FY24E. RoCE is expected to improve to 31.9% in FY24E vs 24.4% in FY21.
Exhibit 31: Margin expansion and operational efficiency to drive returns ahead
Source: Company, HSIE Research
Internal accrual sufficient to meet Capex requirement: Healthy growth, scale up in margin, reduced working capital, limited Capex
requirement and strong return ratios will improve the company’s free cash flow,
going ahead. We expect the company to generate an operating cash flow of
INR20.2bn over FY22-24, which would be sufficient to meet its Capex requirement of
~INR12.4bn over the next three years, providing a strong free cash flow of INR7.8bn
over the same period.
49 44
50
35
24
8 7 8 12
1.1
[VALUE] 0.8 0.7
0.4
0.1 0.1 0.0 -0.1
-0.3
0.2
0.7
1.2
1.7
2.2
0
10
20
30
40
50
60
70
80
FY16 FY17 FY18 FY19 FY20 FY21 FY22E FY23E FY24E
Working capital days D/E
22 24
21
16
21
24 26
28 27
22 21 21 18 18
24
29 31 32
0
5
10
15
20
25
30
35
FY16 FY17 FY18 FY19 FY20 FY21 FY22E FY23E FY24E
RoE ROCE
APL expects to generate
OCF of INR 20.2bn over
FY22-24 and incur a Capex
of INR12.4bn over the same
period
Page | 21
APL Apollo Tubes: Initiating Coverage
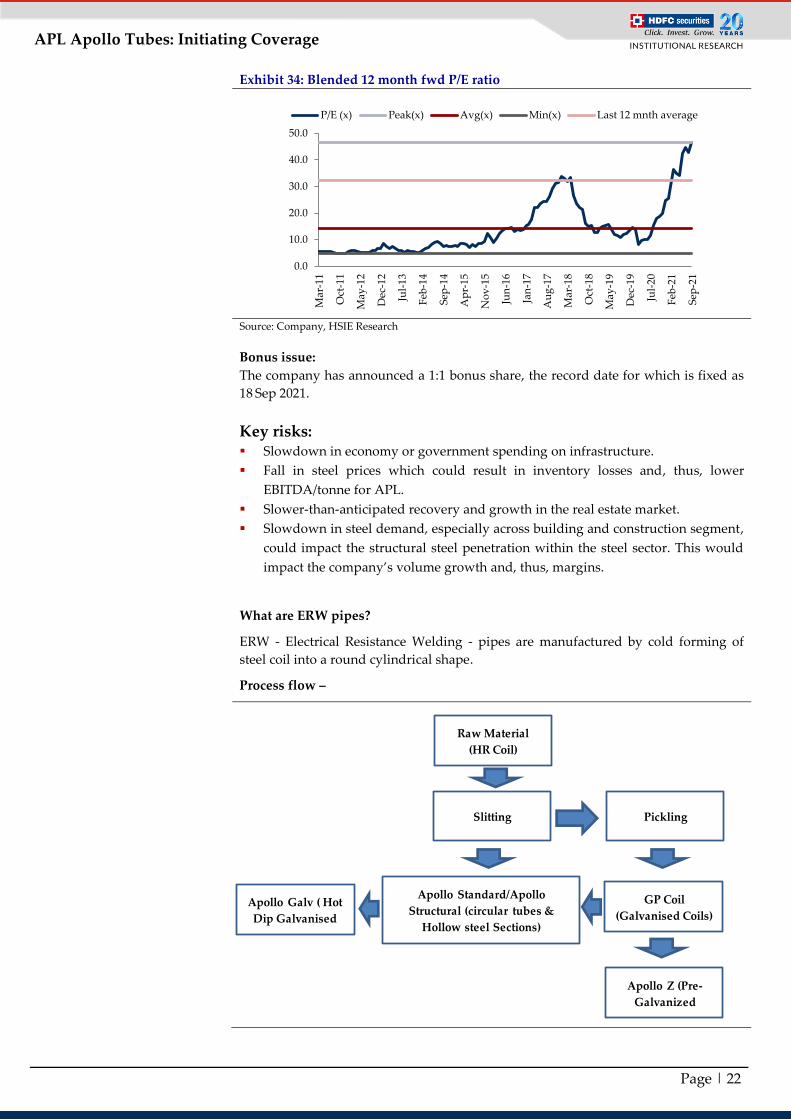
Exhibit 32: APL expected to generate sufficient FCF going ahead
Source: Company, HSIE Research
Valuation:
APL is currently trading at 30x FY24E P/E. Its stock price has outperformed the index
by 330% since December 2020, led by healthy product demand, resilience during
pandemic, strong distribution network, and brand creation. It has delivered healthy
volume growth and margin expansion, reduced working capital, and allowed
repayment of debts. Consequently, valuation multiples have seen a rerating from
sustainable growth in volumes and profitability and are trending towards building
materials level as 75% of its product portfolio caters to this end market. Hence, going
ahead as well, we expect the multiple to sustain these levels, driven by escalated
market share, huge opportunity across construction segment, margin enhancement
from change in product mix, superiority over peers, and strong balance sheet.
We expect APL’s revenue/PAT to grow at CAGRs 20%/34% over FY21-24E, led by healthy
volume growth, margin expansion, reduced working capital, and reduced debt. APL’s
peers in the building material space trades at an average FY23E forward P/E of 37x and
we expect APL to trade at a similar valuation due to its pioneer position and strong
positive outlook going ahead. We thereby initiate coverage with a BUY rating and a TP of
INR2,226/share (based on 35x FY24E EPS), which provides an upside potential of 18.5%
from its CMP.
Exhibit 33: Peer comparison table
Mcap
(INR bn)
P/E (x) EV/EBITDA (x) RoE (%)
Revenue
CAGR
(%)
EBITDA
CAGR
(%)
PAT
CAGR
(%)
FY21 FY22 FY23 FY21 FY22 FY23 FY21 FY22 FY23 FY21-
FY23
FY21-
FY23
FY21-
FY23
Century Plyboards 91 38 33 26 21 20 16 19 27 34 19 27 34
Supreme Industries 272 27 33 30 20 22 20 36 24 23 11 1 -4
Astral Poly Technik 412 78 82 65 50 55 45 24 23 24 23 21 25
Kajaria Ceramics 190 NA 49 38 NA 30 24 NA 19 22 NA NA NA
Cera Sanitaryware 57 51 39 30 30 25 20 12 15 17 19 29 36
Prince Pipes &
Fittings 79 22 41 31 12 23 18 24 17 19 14 6 7
APL Apollo 235 59 51 37 31 30 24 24 26 28 22 26 39
Average 46 47 37 27 29 24 23 22 24 18 18 23
Source: Company, Bloomberg, HSIE Research
1875
4107
2233
5764
3577
3077
1442 1403
6961
1179
3124 3451
0
1,000
2,000
3,000
4,000
5,000
6,000
7,000
8,000
FY19 FY20 FY21 FY22E FY23E FY24E
Capex FCF
We value APL at 35x FY24
EPS to arrive at a TP of
INR 2,226, which provides
an upside potential of
18.5% from CMP
Page | 22
APL Apollo Tubes: Initiating Coverage
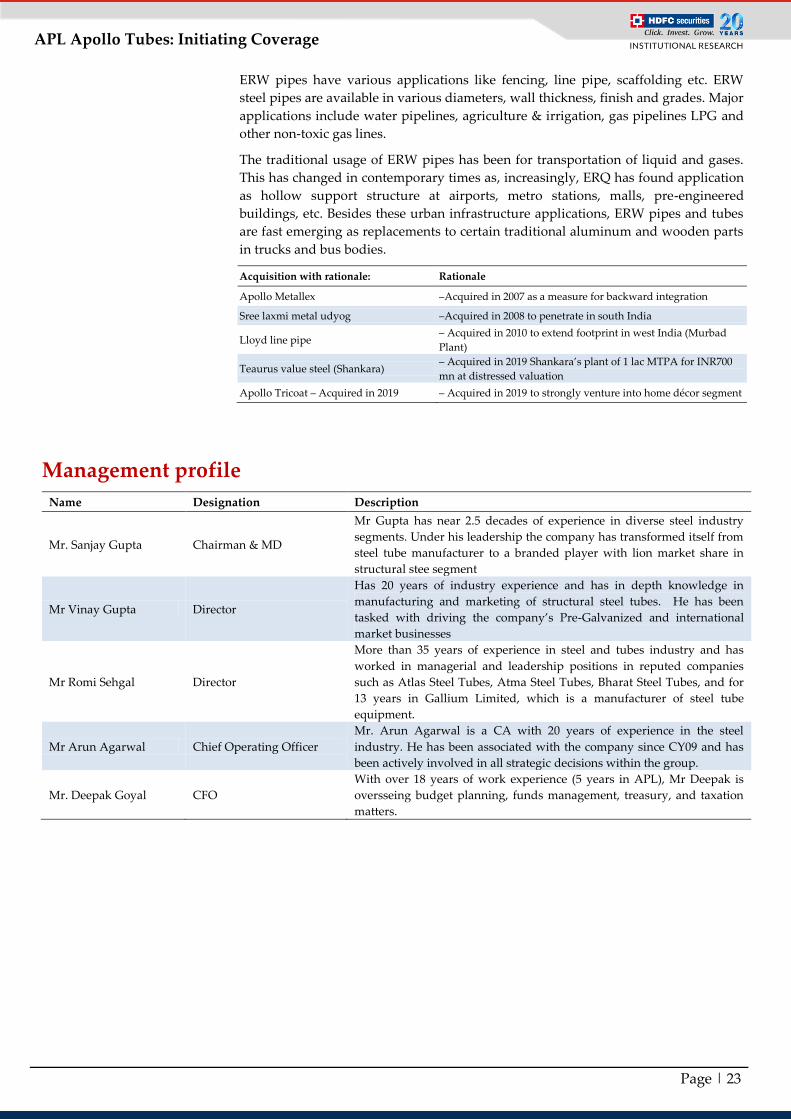
Exhibit 34: Blended 12 month fwd P/E ratio
Source: Company, HSIE Research
Bonus issue:
The company has announced a 1:1 bonus share, the record date for which is fixed as
18 Sep 2021.
Key risks: Slowdown in economy or government spending on infrastructure.
Fall in steel prices which could result in inventory losses and, thus, lower
EBITDA/tonne for APL.
Slower-than-anticipated recovery and growth in the real estate market.
Slowdown in steel demand, especially across building and construction segment,
could impact the structural steel penetration within the steel sector. This would
impact the company’s volume growth and, thus, margins.
What are ERW pipes?
ERW - Electrical Resistance Welding - pipes are manufactured by cold forming of
steel coil into a round cylindrical shape.
Process flow –
0.0
10.0
20.0
30.0
40.0
50.0
Mar
-11
Oct
-11
May
-12
Dec
-12
Jul-
13
Feb
-14
Sep
-14
Ap
r-15
No
v-1
5
Jun
-16
Jan
-17
Au
g-1
7
Mar
-18
Oct
-18
May
-19
Dec
-19
Jul-
20
Feb
-21
Sep
-21
P/E (x) Peak(x) Avg(x) Min(x) Last 12 mnth average
Raw Material
(HR Coil)
Slitting Pickling
Apollo Galv ( Hot
Dip Galvanised
Apollo Standard/Apollo
Structural (circular tubes &
Hollow steel Sections)
GP Coil
(Galvanised Coils)
Apollo Z (Pre-
Galvanized
Page | 23
APL Apollo Tubes: Initiating Coverage
ERW pipes have various applications like fencing, line pipe, scaffolding etc. ERW
steel pipes are available in various diameters, wall thickness, finish and grades. Major
applications include water pipelines, agriculture & irrigation, gas pipelines LPG and
other non-toxic gas lines.
The traditional usage of ERW pipes has been for transportation of liquid and gases.
This has changed in contemporary times as, increasingly, ERQ has found application
as hollow support structure at airports, metro stations, malls, pre-engineered
buildings, etc. Besides these urban infrastructure applications, ERW pipes and tubes
are fast emerging as replacements to certain traditional aluminum and wooden parts
in trucks and bus bodies.
Acquisition with rationale: Rationale
Apollo Metallex –Acquired in 2007 as a measure for backward integration
Sree laxmi metal udyog –Acquired in 2008 to penetrate in south India
Lloyd line pipe – Acquired in 2010 to extend footprint in west India (Murbad
Plant)
Teaurus value steel (Shankara) – Acquired in 2019 Shankara’s plant of 1 lac MTPA for INR700
mn at distressed valuation
Apollo Tricoat – Acquired in 2019 – Acquired in 2019 to strongly venture into home décor segment
Management profile
Name Designation Description
Mr. Sanjay Gupta Chairman & MD
Mr Gupta has near 2.5 decades of experience in diverse steel industry
segments. Under his leadership the company has transformed itself from
steel tube manufacturer to a branded player with lion market share in
structural stee segment
Mr Vinay Gupta Director
Has 20 years of industry experience and has in depth knowledge in
manufacturing and marketing of structural steel tubes. He has been
tasked with driving the company’s Pre-Galvanized and international
market businesses
Mr Romi Sehgal Director
More than 35 years of experience in steel and tubes industry and has
worked in managerial and leadership positions in reputed companies
such as Atlas Steel Tubes, Atma Steel Tubes, Bharat Steel Tubes, and for
13 years in Gallium Limited, which is a manufacturer of steel tube
equipment.
Mr Arun Agarwal Chief Operating Officer
Mr. Arun Agarwal is a CA with 20 years of experience in the steel
industry. He has been associated with the company since CY09 and has
been actively involved in all strategic decisions within the group.
Mr. Deepak Goyal CFO
With over 18 years of work experience (5 years in APL), Mr Deepak is
oversseing budget planning, funds management, treasury, and taxation
matters.
Page | 24
APL Apollo Tubes: Initiating Coverage
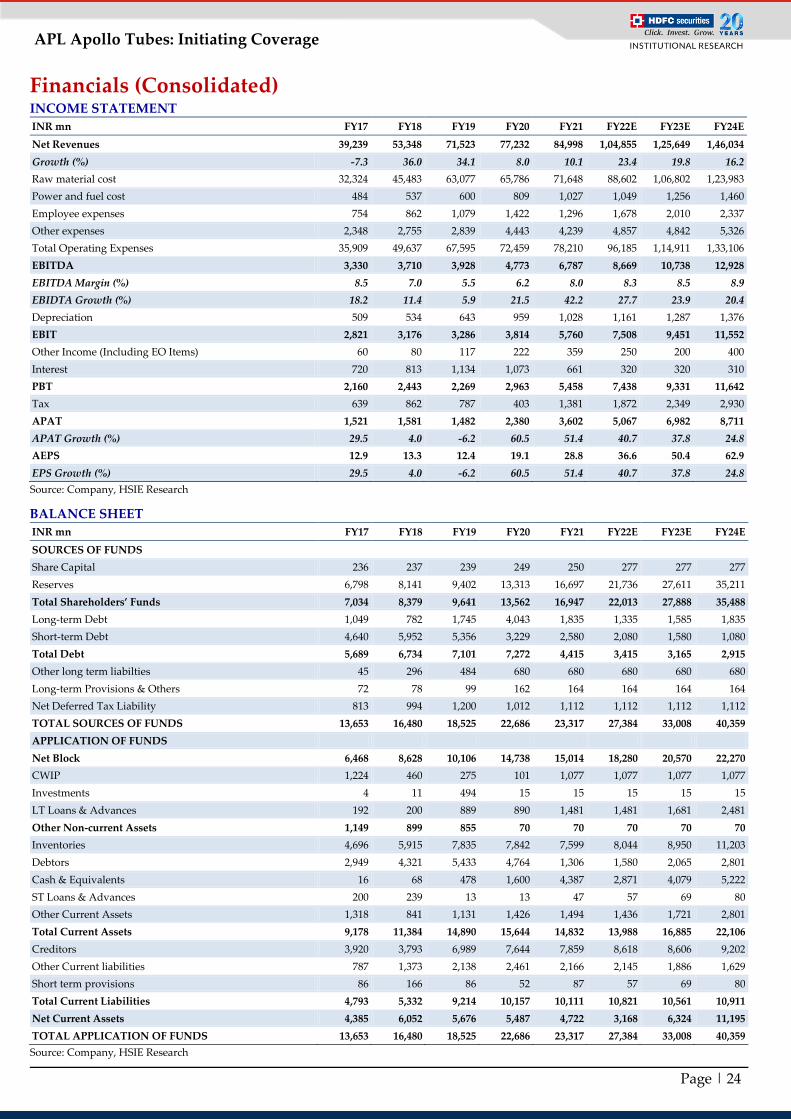
Financials (Consolidated) INCOME STATEMENT
INR mn FY17 FY18 FY19 FY20 FY21 FY22E FY23E FY24E
Net Revenues 39,239 53,348 71,523 77,232 84,998 1,04,855 1,25,649 1,46,034
Growth (%) -7.3 36.0 34.1 8.0 10.1 23.4 19.8 16.2
Raw material cost 32,324 45,483 63,077 65,786 71,648 88,602 1,06,802 1,23,983
Power and fuel cost 484 537 600 809 1,027 1,049 1,256 1,460
Employee expenses 754 862 1,079 1,422 1,296 1,678 2,010 2,337
Other expenses 2,348 2,755 2,839 4,443 4,239 4,857 4,842 5,326
Total Operating Expenses 35,909 49,637 67,595 72,459 78,210 96,185 1,14,911 1,33,106
EBITDA 3,330 3,710 3,928 4,773 6,787 8,669 10,738 12,928
EBITDA Margin (%) 8.5 7.0 5.5 6.2 8.0 8.3 8.5 8.9
EBIDTA Growth (%) 18.2 11.4 5.9 21.5 42.2 27.7 23.9 20.4
Depreciation 509 534 643 959 1,028 1,161 1,287 1,376
EBIT 2,821 3,176 3,286 3,814 5,760 7,508 9,451 11,552
Other Income (Including EO Items) 60 80 117 222 359 250 200 400
Interest 720 813 1,134 1,073 661 320 320 310
PBT 2,160 2,443 2,269 2,963 5,458 7,438 9,331 11,642
Tax 639 862 787 403 1,381 1,872 2,349 2,930
APAT 1,521 1,581 1,482 2,380 3,602 5,067 6,982 8,711
APAT Growth (%) 29.5 4.0 -6.2 60.5 51.4 40.7 37.8 24.8
AEPS 12.9 13.3 12.4 19.1 28.8 36.6 50.4 62.9
EPS Growth (%) 29.5 4.0 -6.2 60.5 51.4 40.7 37.8 24.8
Source: Company, HSIE Research
BALANCE SHEET
INR mn FY17 FY18 FY19 FY20 FY21 FY22E FY23E FY24E
SOURCES OF FUNDS
Share Capital 236 237 239 249 250 277 277 277
Reserves 6,798 8,141 9,402 13,313 16,697 21,736 27,611 35,211
Total Shareholders’ Funds 7,034 8,379 9,641 13,562 16,947 22,013 27,888 35,488
Long-term Debt 1,049 782 1,745 4,043 1,835 1,335 1,585 1,835
Short-term Debt 4,640 5,952 5,356 3,229 2,580 2,080 1,580 1,080
Total Debt 5,689 6,734 7,101 7,272 4,415 3,415 3,165 2,915
Other long term liabilties 45 296 484 680 680 680 680 680
Long-term Provisions & Others 72 78 99 162 164 164 164 164
Net Deferred Tax Liability 813 994 1,200 1,012 1,112 1,112 1,112 1,112
TOTAL SOURCES OF FUNDS 13,653 16,480 18,525 22,686 23,317 27,384 33,008 40,359
APPLICATION OF FUNDS
Net Block 6,468 8,628 10,106 14,738 15,014 18,280 20,570 22,270
CWIP 1,224 460 275 101 1,077 1,077 1,077 1,077
Investments 4 11 494 15 15 15 15 15
LT Loans & Advances 192 200 889 890 1,481 1,481 1,681 2,481
Other Non-current Assets 1,149 899 855 70 70 70 70 70
Inventories 4,696 5,915 7,835 7,842 7,599 8,044 8,950 11,203
Debtors 2,949 4,321 5,433 4,764 1,306 1,580 2,065 2,801
Cash & Equivalents 16 68 478 1,600 4,387 2,871 4,079 5,222
ST Loans & Advances 200 239 13 13 47 57 69 80
Other Current Assets 1,318 841 1,131 1,426 1,494 1,436 1,721 2,801
Total Current Assets 9,178 11,384 14,890 15,644 14,832 13,988 16,885 22,106
Creditors 3,920 3,793 6,989 7,644 7,859 8,618 8,606 9,202
Other Current liabilities 787 1,373 2,138 2,461 2,166 2,145 1,886 1,629
Short term provisions 86 166 86 52 87 57 69 80
Total Current Liabilities 4,793 5,332 9,214 10,157 10,111 10,821 10,561 10,911
Net Current Assets 4,385 6,052 5,676 5,487 4,722 3,168 6,324 11,195
TOTAL APPLICATION OF FUNDS 13,653 16,480 18,525 22,686 23,317 27,384 33,008 40,359
Source: Company, HSIE Research
Page | 25
APL Apollo Tubes: Initiating Coverage
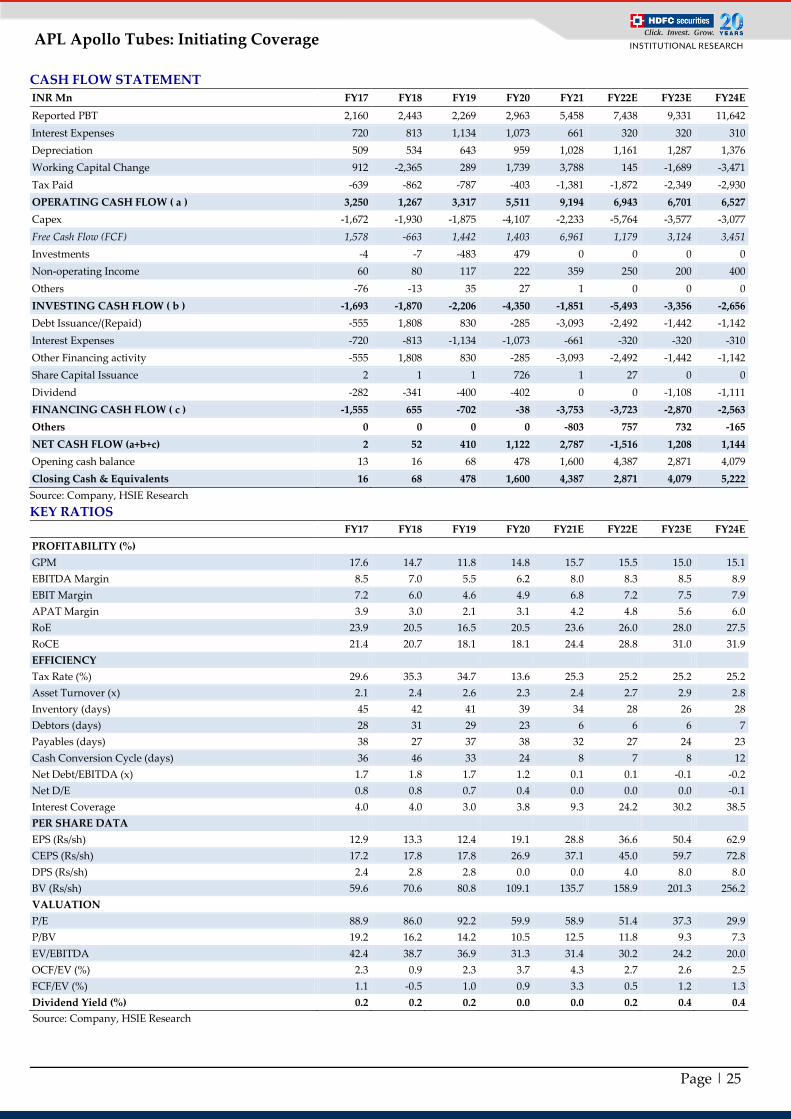
CASH FLOW STATEMENT
INR Mn FY17 FY18 FY19 FY20 FY21 FY22E FY23E FY24E
Reported PBT 2,160 2,443 2,269 2,963 5,458 7,438 9,331 11,642
Interest Expenses 720 813 1,134 1,073 661 320 320 310
Depreciation 509 534 643 959 1,028 1,161 1,287 1,376
Working Capital Change 912 -2,365 289 1,739 3,788 145 -1,689 -3,471
Tax Paid -639 -862 -787 -403 -1,381 -1,872 -2,349 -2,930
OPERATING CASH FLOW ( a ) 3,250 1,267 3,317 5,511 9,194 6,943 6,701 6,527
Capex -1,672 -1,930 -1,875 -4,107 -2,233 -5,764 -3,577 -3,077
Free Cash Flow (FCF) 1,578 -663 1,442 1,403 6,961 1,179 3,124 3,451
Investments -4 -7 -483 479 0 0 0 0
Non-operating Income 60 80 117 222 359 250 200 400
Others -76 -13 35 27 1 0 0 0
INVESTING CASH FLOW ( b ) -1,693 -1,870 -2,206 -4,350 -1,851 -5,493 -3,356 -2,656
Debt Issuance/(Repaid) -555 1,808 830 -285 -3,093 -2,492 -1,442 -1,142
Interest Expenses -720 -813 -1,134 -1,073 -661 -320 -320 -310
Other Financing activity -555 1,808 830 -285 -3,093 -2,492 -1,442 -1,142
Share Capital Issuance 2 1 1 726 1 27 0 0
Dividend -282 -341 -400 -402 0 0 -1,108 -1,111
FINANCING CASH FLOW ( c ) -1,555 655 -702 -38 -3,753 -3,723 -2,870 -2,563
Others 0 0 0 0 -803 757 732 -165
NET CASH FLOW (a+b+c) 2 52 410 1,122 2,787 -1,516 1,208 1,144
Opening cash balance 13 16 68 478 1,600 4,387 2,871 4,079
Closing Cash & Equivalents 16 68 478 1,600 4,387 2,871 4,079 5,222
Source: Company, HSIE Research
KEY RATIOS FY17 FY18 FY19 FY20 FY21E FY22E FY23E FY24E
PROFITABILITY (%)
GPM 17.6 14.7 11.8 14.8 15.7 15.5 15.0 15.1
EBITDA Margin 8.5 7.0 5.5 6.2 8.0 8.3 8.5 8.9
EBIT Margin 7.2 6.0 4.6 4.9 6.8 7.2 7.5 7.9
APAT Margin 3.9 3.0 2.1 3.1 4.2 4.8 5.6 6.0
RoE 23.9 20.5 16.5 20.5 23.6 26.0 28.0 27.5
RoCE 21.4 20.7 18.1 18.1 24.4 28.8 31.0 31.9
EFFICIENCY
Tax Rate (%) 29.6 35.3 34.7 13.6 25.3 25.2 25.2 25.2
Asset Turnover (x) 2.1 2.4 2.6 2.3 2.4 2.7 2.9 2.8
Inventory (days) 45 42 41 39 34 28 26 28
Debtors (days) 28 31 29 23 6 6 6 7
Payables (days) 38 27 37 38 32 27 24 23
Cash Conversion Cycle (days) 36 46 33 24 8 7 8 12
Net Debt/EBITDA (x) 1.7 1.8 1.7 1.2 0.1 0.1 -0.1 -0.2
Net D/E 0.8 0.8 0.7 0.4 0.0 0.0 0.0 -0.1
Interest Coverage 4.0 4.0 3.0 3.8 9.3 24.2 30.2 38.5
PER SHARE DATA
EPS (Rs/sh) 12.9 13.3 12.4 19.1 28.8 36.6 50.4 62.9
CEPS (Rs/sh) 17.2 17.8 17.8 26.9 37.1 45.0 59.7 72.8
DPS (Rs/sh) 2.4 2.8 2.8 0.0 0.0 4.0 8.0 8.0
BV (Rs/sh) 59.6 70.6 80.8 109.1 135.7 158.9 201.3 256.2
VALUATION
P/E 88.9 86.0 92.2 59.9 58.9 51.4 37.3 29.9
P/BV 19.2 16.2 14.2 10.5 12.5 11.8 9.3 7.3
EV/EBITDA 42.4 38.7 36.9 31.3 31.4 30.2 24.2 20.0
OCF/EV (%) 2.3 0.9 2.3 3.7 4.3 2.7 2.6 2.5
FCF/EV (%) 1.1 -0.5 1.0 0.9 3.3 0.5 1.2 1.3
Dividend Yield (%) 0.2 0.2 0.2 0.0 0.0 0.2 0.4 0.4
Source: Company, HSIE Research
Page | 26
APL Apollo Tubes: Initiating Coverage
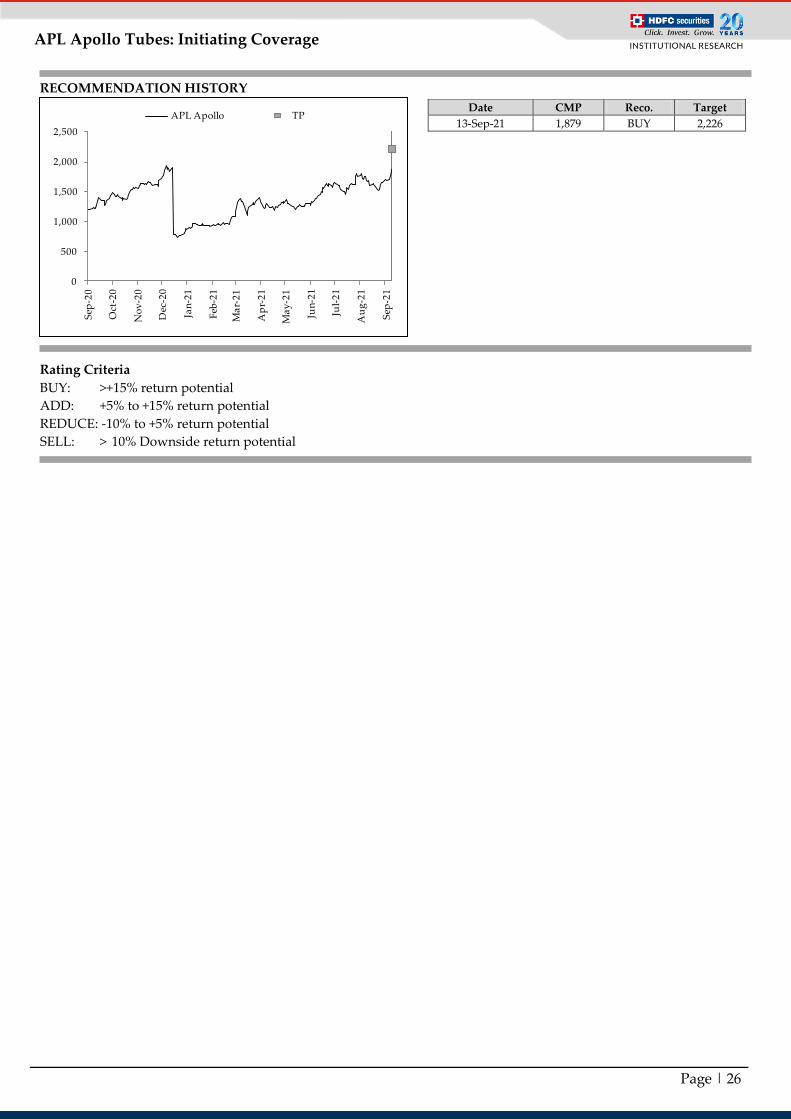
Rating Criteria
BUY: >+15% return potential
ADD: +5% to +15% return potential
REDUCE: -10% to +5% return potential
SELL: > 10% Downside return potential
Date CMP Reco. Target
13-Sep-21 1,879 BUY 2,226
RECOMMENDATION HISTORY
0
500
1,000
1,500
2,000
2,500
Sep
-20
Oct
-20
No
v-2
0
Dec
-20
Jan
-21
Feb
-21
Ma
r-2
1
Ap
r-2
1
Ma
y-2
1
Jun
-21
Jul-
21
Au
g-2
1
Sep
-21
APL Apollo TP
Page | 27
APL Apollo Tubes: Initiating Coverage
Disclosure: I, Anuj Upadhyay, MBA, author and the name subscribed to this report, hereby certify that all of the views expressed in this research report accurately reflect our views about the subject issuer(s) or securities. HSL has no material adverse disciplinary history as on the date of publication of this report. We also certify that no part of our compensation was, is, or will be directly or indirectly related to the specific recommendation(s) or view(s) in this report. Research Analyst or his/her relative or HDFC Securities Ltd. does not have any financial interest in the subject company. Also Research Analyst or his relative or HDFC Securities Ltd. or its Associate may have beneficial ownership of 1% or more in the subject company at the end of the month immediately preceding the date of publication of the Research Report. Further Research Analyst or his relative or HDFC Securities Ltd. or its associate does not have any material conflict of interest. Any holding in stock –No HDFC Securities Limited (HSL) is a SEBI Registered Research Analyst having registration no. INH000002475. Disclaimer: This report has been prepared by HDFC Securities Ltd and is solely for information of the recipient only. The report must not be used as a singular basis of any investment decision. The views herein are of a general nature and do not consider the risk appetite or the particular circumstances of an individual investor; readers are requested to take professional advice before investing. Nothing in this document should be construed as investment advice. Each recipient of this document should make such investigations as they deem necessary to arrive at an independent evaluation of an investment in securities of the companies referred to in this document (including merits and risks) and should consult their own advisors to determine merits and risks of such investment. The information and opinions contained herein have been compiled or arrived at, based upon information obtained in good faith from sources believed to be reliable. Such information has not been independently verified and no guaranty, representation of warranty, express or implied, is made as to its accuracy, completeness or correctness. All such information and opinions are subject to change without notice. Descriptions of any company or companies or their securities mentioned herein are not intended to be complete. HSL is not obliged to update this report for such changes. HSL has the right to make changes and modifications at any time. This report is not directed to, or intended for display, downloading, printing, reproducing or for distribution to or use by, any person or entity who is a citizen or resident or located in any locality, state, country or other jurisdiction where such distribution, publication, reproduction, availability or use would be contrary to law or regulation or what would subject HSL or its affiliates to any registration or licensing requirement within such jurisdiction. If this report is inadvertently sent or has reached any person in such country, especially, United States of America, the same should be ignored and brought to the attention of the sender. This document may not be reproduced, distributed or published in whole or in part, directly or indirectly, for any purposes or in any manner. Foreign currencies denominated securities, wherever mentioned, are subject to exchange rate fluctuations, which could have an adverse effect on their value or price, or the income derived from them. In addition, investors in securities such as ADRs, the values of which are influenced by foreign currencies effectively assume currency risk. It should not be considered to be taken as an offer to sell or a solicitation to buy any security. This document is not, and should not, be construed as an offer or solicitation of an offer, to buy or sell any securities or other financial instruments. This report should not be construed as an invitation or solicitation to do business with HSL. HSL may from time to time solicit from, or perform broking, or other services for, any company mentioned in this mail and/or its attachments. HSL and its affiliated company(ies), their directors and employees may; (a) from time to time, have a long or short position in, and buy or sell the securities of the company(ies) mentioned herein or (b) be engaged in any other transaction involving such securities and earn brokerage or other compensation or act as a market maker in the financial instruments of the company(ies) discussed herein or act as an advisor or lender/borrower to such company(ies) or may have any other potential conflict of interests with respect to any recommendation and other related information and opinions. HSL, its directors, analysts or employees do not take any responsibility, financial or otherwise, of the losses or the damages sustained due to the investments made or any action taken on basis of this report, including but not restricted to, fluctuation in the prices of shares and bonds, changes in the currency rates, diminution in the NAVs, reduction in the dividend or income, etc. HSL and other group companies, its directors, associates, employees may have various positions in any of the stocks, securities and financial instruments dealt in the report, or may make sell or purchase or other deals in these securities from time to time or may deal in other securities of the companies / organizations described in this report. HSL or its associates might have managed or co-managed public offering of securities for the subject company or might have been mandated by the subject company for any other assignment in the past twelve months. HSL or its associates might have received any compensation from the companies mentioned in the report during the period preceding twelve months from the date of this report for services in respect of managing or co-managing public offerings, corporate finance, investment banking or merchant banking, brokerage services or other advisory service in a merger or specific transaction in the normal course of business. HSL or its analysts did not receive any compensation or other benefits from the companies mentioned in the report or third party in connection with preparation of the research report. Accordingly, neither HSL nor Research Analysts have any material conflict of interest at the time of publication of this report. Compensation of our Research Analysts is not based on any specific merchant banking, investment banking or brokerage service transactions. HSL may have issued other reports that are inconsistent with and reach different conclusion from the information presented in this report. Research entity has not been engaged in market making activity for the subject company. Research analyst has not served as an officer, director or employee of the subject company. We have not received any compensation/benefits from the subject company or third party in connection with the Research Report. HDFC securities Limited, I Think Techno Campus, Building - B, "Alpha", Office Floor 8, Near Kanjurmarg Station, Opp. Crompton Greaves, Kanjurmarg (East), Mumbai 400 042 Phone: (022) 3075 3400 Fax: (022) 2496 5066 Compliance Officer: Binkle R. Oza Email: [email protected] Phone: (022) 3045 3600 HDFC Securities Limited, SEBI Reg. No.: NSE, BSE, MSEI, MCX: INZ000186937; AMFI Reg. No. ARN: 13549; PFRDA Reg. No. POP: 11092018; IRDA Corporate Agent License No.: CA0062; SEBI Research Analyst Reg. No.: INH000002475; SEBI Investment Adviser Reg. No.: INA000011538; CIN - U67120MH2000PLC152193
HDFC securities
Institutional Equities
Unit No. 1602, 16th Floor, Tower A, Peninsula Business Park,
Senapati Bapat Marg, Lower Parel, Mumbai - 400 013
Board: +91-22-6171-7330 www.hdfcsec.com