14 multimodal analysis · analysis procedure manual version 2 14-2 last updated 11/2018 exhibit...
TRANSCRIPT

Analysis Procedure Manual Version 2 14-1 Last Updated 11/2018
14 MULTIMODAL ANALYSIS
14.1 Purpose
In order to truly quantify the operation of a roadway segment, all of the modes that use it
need to be analyzed. This includes pedestrians, bicycles, transit in addition to
automobiles and trucks. This chapter will eventually cover a reasonable range of different
multimodal analysis types and modal considerations that will apply to plans and projects
of all detail levels.
14.2 Multimodal Analysis Methodologies
The current generation of multimodal analysis methodologies are generally a perception-
based rating system of the safety, comfort, and convenience of transportation facilities
from the perspective of the user, whether a motorist, bicyclist, pedestrian or transit rider.
The range of methodologies presented in this chapter is meant to be complementary, not
competitive, and have been tested for compatibility. There are many types of multimodal
analysis methodologies available; however, not all are suitable for all applications. The
overall context of the plan or project and the resulting scope of work will control the
ultimate methodological choice. Some methods require very specific data which may not
typically be collected in a high level study such as a transportation system plan. Some
methods are too simple and will not be able to answer the questions posed in the design
of a modernization project.
Applicability of multimodal analysis methods by project type is illustrated in Exhibit
14-1. Methods increase in detail from left to right, while plan/project types increase in
complexity from top to bottom. As the application increases in level of detail, more
specific questions can be addressed, but the analysis will require more data and resources.
Regardless of method applied, it is important to include some sort of multimodal analysis
on all analysis efforts.

Analysis Procedure Manual Version 2 14-2 Last Updated 11/2018
Exhibit 14-1 Multimodal Analysis Tool Applications1
Qualitative
Multimodal
Assessment
Level of Traffic
Stress2
Multimodal Level
of Service
Regional
Transportation Plan
(RTP)
Transportation
System Plan (TSP)
Facility
Plan/Interchange
Area Management
Plan (IAMP)
Project
Development
Development
Review
1Solid circles represent the preferred methodology. Outlined circles represent where methodology can also
be used. 2Use of LTS for project development and development review should be limited to a screening-based
analysis to quickly identify existing and future needs
Any project or plan could use any single level or multiple levels of multimodal analysis,
but many levels of analysis are more suited to a particular application. For example,
Level of Traffic Stress (LTS) could be used at a system level to identify key locations,
which then can be analyzed further using Multimodal Level of Service (MMLOS).
The primary tool for Regional Transportation Plans (RTP) is LTS as this methodology
can be easily adapted to use travel demand model inputs or can be generalized enough to
apply to a whole region without too much data and effort. The Qualitative Multimodal
Assessment (QMA) can be used to fill in other modes that are not covered by LTS. These
methods require limited data, most of which can be obtained from existing inventories,
aerial photography, or from “windshield” field surveys. These methods will be able to
identify areas of concern whether in system connectivity (LTS) or in operations
(Qualitative Multimodal Assessment).
Transportation System Plans (TSP) have enough detail in the inventory and analysis to
provide for adequate QMA and/or LTS analyses. Do not duplicate modes between the
two methodologies if both are used in a single effort.
More detailed planning efforts such as facility plans and Interchange Area Management
Plans (IAMP) typically will use MMLOS-based methods as there is a need for more
objective results especially in comparisons of alternatives. This level usually will have a
higher amount of detailed data available which is consistent with the smaller analysis

Analysis Procedure Manual Version 2 14-3 Last Updated 11/2018
segments and more specific detail required. Most elements could be obtained without
doing a detailed field inventory, provided that unobstructed, high-quality aerials that can
be used for the basis of measurements are available. These data levels will make
comparison easier across concepts and time periods with less subjectivity than with
QMA. LTS and/or QMA can still be used if a plan will be relatively standalone. Plans
that need to be consistent with future potential project development efforts especially
with environmental assessments or environmental impact statements should use
MMLOS-based methods for alternatives and limit LTS/QMA to screening analysis.
Project development requires the highest amount of data as objective design-level
decisions need to be supported. The MMLOS methods are the most rigorous and
commensurate with the typical available data. LTS can also be used as an initial
screening measure to identify areas with existing or future needs. Analysis with the
MMLOS segment and intersection methodologies even with appropriate ODOT defaults
will take more effort and have a greater chance of needing additional specific field
inventory data.
Assessing multimodal impacts in development review will typically involve use of LTS
to quickly identify existing/future needs or development impacts and then using MMLOS
techniques to identify mitigation scenarios. The urban context will need to be taken into
account as the more urban an area is, even a standard zone change (i.e. residential to
commercial) may require more detail. Transportation Planning Rule (TPR) -0060
analysis for a plan amendment can likely rely on more use of LTS (however, transit is
only available at the MMLOS level) Transportation Impact Analyses (TIA) would likely
need to primarily use MMLOS techniques in order to capture the specific scenario
details.
While the designation of Multimodal Mixed Use (MMA) areas are based solely on safety
concerns, once the designation is in place, non-automobile multimodal impacts can still
be analyzed. Depending on the level of effort desired for a plan/project/TIA that involves
a MMA, the multimodal analysis could use any of the methodologies.
14.3 Qualitative Multimodal Assessment
The Qualitative Multimodal Assessment (QMA) methodology is based on work done by
David Evans and Associates and generally uses the principles of the full version 2010
Highway Capacity Manual (HCM) MMLOS but was modified to stay consistent as much
as possible with the more objective methods presented later in this chapter. This
methodology uses the roadway characteristics and applies a context-based subjective
“Excellent/Good/Fair/Poor” rating. This method is best applied when comparing different
alternatives side-by-side to each other but can also be used with a single scenario to
compare the proposed improvement to existing conditions and to applicable standards.
For example, a six foot sidewalk is standard in a residential area and would be rated
Good (or Excellent if it had a buffer). Ratings can be “averaged” to obtain one for every
mode, or they can be shown for every element if more detail is desired like in a technical
appendix. This method is most appropriate when one or more of the following conditions
apply:

Analysis Procedure Manual Version 2 14-4 Last Updated 11/2018
The subject roadway does not easily divide into segments with uniform
characteristics between intersections.
The subject roadway has rural/suburban characteristics with infrequent or no
signal control, where the MMLOS methodology is not applicable.
Insufficient data are available to complete a MMLOS analysis
Future alternatives may not have enough detail to properly quantify roadway
characteristics required by other methodologies.
The full HCM MMLOS is most applicable to urban roadways with uniform segments
broken up by signalized intersections. The MMLOS only evaluates segments bracketed
by signalized intersections but the qualitative assessment can be done at all types of
traffic control (e.g. roundabouts). Many communities do not have any signals or have too
few signals to make the full HCM MMLOS method usable. In addition, this methodology
allows for a multimodal look at a reasonable cost without requiring intensive data
gathering. For most planning efforts, design details are not generally available until later,
within phases such as refinement plans or project development, so it can be difficult to
properly create the MMLOS inputs. All of the elements below should be considered for
each mode. However, not all of the elements below will be contextually applicable in
every community (i.e. volumes not sufficient for traffic signals or all-way stop control) so
deviations can occur but should be documented.
14.3.1 Pedestrian
On segments, the following factors are considered:
Outside travel lane width: Wider travel lanes are rated better than narrower
travel lanes because of the larger buffer space between vehicles and pedestrians.
Bicycle lane/shoulder width: The addition of bicycle lanes or shoulders creates
greater separation between vehicles and pedestrian traffic and acts as a buffer.
Wider facilities are rated better than narrow or non-existent facilities.
Presence of buffers (landscaped or other): Buffer presence that separates
pedestrians from traffic results in an improved rating. Wider buffers are rated
better than narrower or non-existent ones.
Sidewalk/path presence: The presence of sidewalks or paths will rate higher
versus shoulders or no facilities at all. Wider sidewalks/paths rate better than
narrower or non-existent ones.
Lighting: The presence of lighting, whether roadway or pedestrian-scale, is rated
If a roadway has limited facilities because they are provided on parallel roadways
(i.e. bike boulevards), consideration should be given to also applying the
methodology to that parallel facility. This way the complete picture of the
multimodal facilities offered along a corridor can be shown.
Analysis Procedure Manual Version 2 14-5 Last Updated 11/2018
better than roadways without lighting.
Travel lanes and speed of motorized traffic: Less travel lanes and lower
vehicle speeds will rate higher than more lanes and higher speeds.
At intersections, the following factors are considered:
Traffic control: Intersections with a traffic signal or all-way stop control with
crosswalks are rated better than locations with only two-way stop control or
locations without crosswalks.
Crossing width: Fewer turn or through travel lanes to be crossed is rated better
than more turn/though lanes because the exposure to traffic and potential conflicts
are less.
Median islands: The presence of a median island is rated better than no islands as
two-stage crossings are possible at unsignalized crossings.
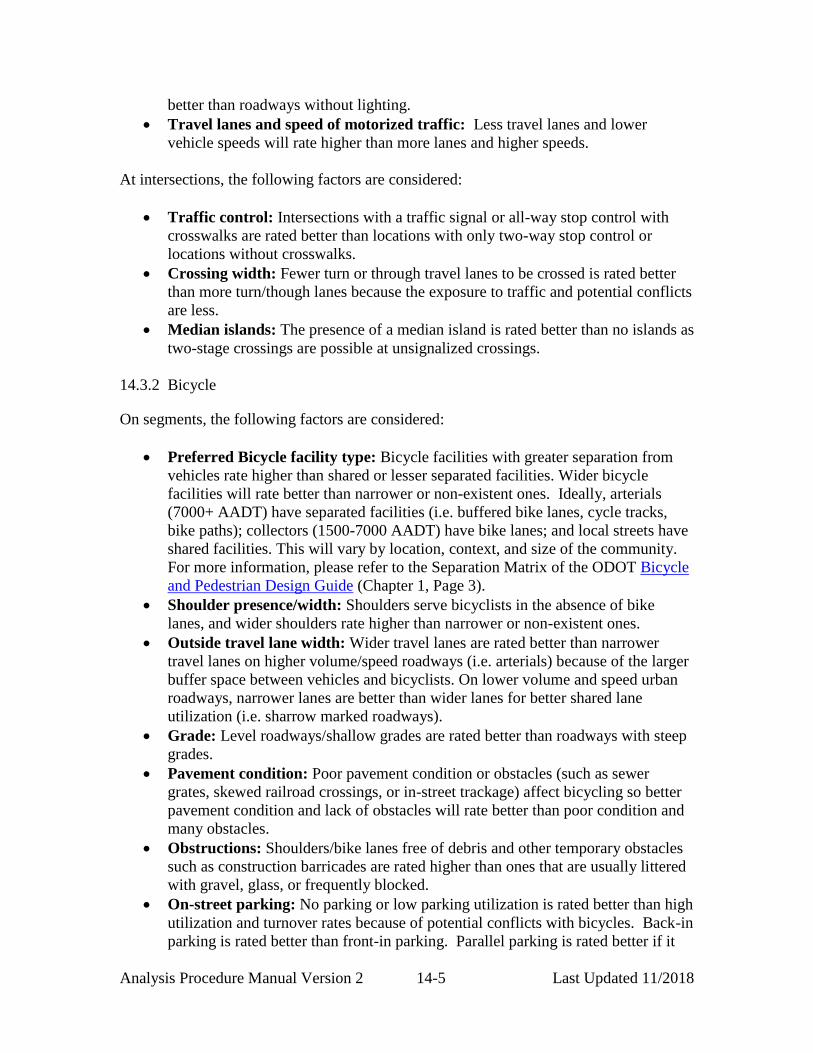
14.3.2 Bicycle
On segments, the following factors are considered:
Preferred Bicycle facility type: Bicycle facilities with greater separation from
vehicles rate higher than shared or lesser separated facilities. Wider bicycle
facilities will rate better than narrower or non-existent ones. Ideally, arterials
(7000+ AADT) have separated facilities (i.e. buffered bike lanes, cycle tracks,
bike paths); collectors (1500-7000 AADT) have bike lanes; and local streets have
shared facilities. This will vary by location, context, and size of the community.
For more information, please refer to the Separation Matrix of the ODOT Bicycle
and Pedestrian Design Guide (Chapter 1, Page 3).
Shoulder presence/width: Shoulders serve bicyclists in the absence of bike
lanes, and wider shoulders rate higher than narrower or non-existent ones.
Outside travel lane width: Wider travel lanes are rated better than narrower
travel lanes on higher volume/speed roadways (i.e. arterials) because of the larger
buffer space between vehicles and bicyclists. On lower volume and speed urban
roadways, narrower lanes are better than wider lanes for better shared lane
utilization (i.e. sharrow marked roadways).
Grade: Level roadways/shallow grades are rated better than roadways with steep
grades.
Pavement condition: Poor pavement condition or obstacles (such as sewer
grates, skewed railroad crossings, or in-street trackage) affect bicycling so better
pavement condition and lack of obstacles will rate better than poor condition and
many obstacles.
Obstructions: Shoulders/bike lanes free of debris and other temporary obstacles
such as construction barricades are rated higher than ones that are usually littered
with gravel, glass, or frequently blocked.
On-street parking: No parking or low parking utilization is rated better than high
utilization and turnover rates because of potential conflicts with bicycles. Back-in
parking is rated better than front-in parking. Parallel parking is rated better if it
Analysis Procedure Manual Version 2 14-6 Last Updated 11/2018
includes a buffer from the bike lane.
Travel lanes and speed of motorized traffic: Less travel lanes and lower
vehicle speeds will rate higher than more lanes and higher speeds.
At intersections, the following factors are considered:
Traffic control: Intersections with a traffic signal or all-way stop control with
crosswalks are rated better than locations with only two-way stop control or
locations without crosswalks. Intersections with bike signals are rated the highest.
Crossing width: Fewer turn or through travel lanes to be crossed is rated better
than more turn/though lanes because the exposure to traffic and potential conflicts
are less.
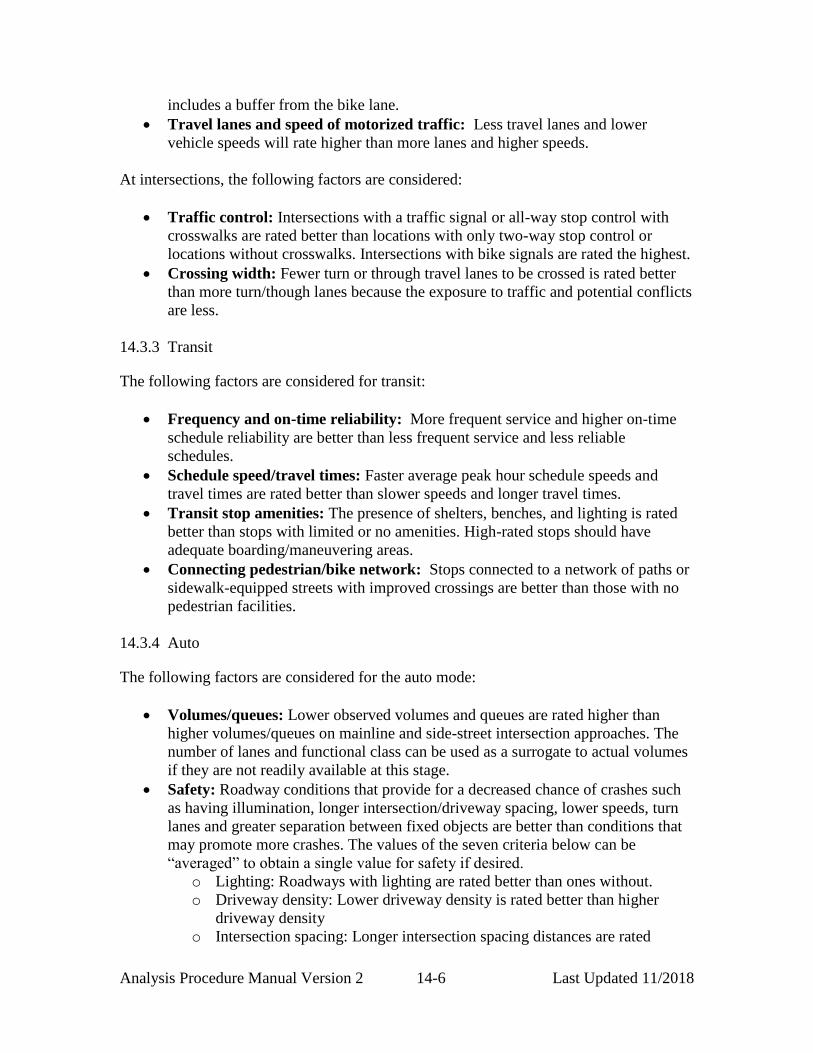
14.3.3 Transit
The following factors are considered for transit:
Frequency and on-time reliability: More frequent service and higher on-time
schedule reliability are better than less frequent service and less reliable
schedules.
Schedule speed/travel times: Faster average peak hour schedule speeds and
travel times are rated better than slower speeds and longer travel times.
Transit stop amenities: The presence of shelters, benches, and lighting is rated
better than stops with limited or no amenities. High-rated stops should have
adequate boarding/maneuvering areas.
Connecting pedestrian/bike network: Stops connected to a network of paths or
sidewalk-equipped streets with improved crossings are better than those with no
pedestrian facilities.
14.3.4 Auto
The following factors are considered for the auto mode:
Volumes/queues: Lower observed volumes and queues are rated higher than
higher volumes/queues on mainline and side-street intersection approaches. The
number of lanes and functional class can be used as a surrogate to actual volumes
if they are not readily available at this stage.
Safety: Roadway conditions that provide for a decreased chance of crashes such
as having illumination, longer intersection/driveway spacing, lower speeds, turn
lanes and greater separation between fixed objects are better than conditions that
may promote more crashes. The values of the seven criteria below can be
“averaged” to obtain a single value for safety if desired.
o Lighting: Roadways with lighting are rated better than ones without.
o Driveway density: Lower driveway density is rated better than higher
driveway density
o Intersection spacing: Longer intersection spacing distances are rated

Analysis Procedure Manual Version 2 14-7 Last Updated 11/2018
higher than shorter intersection spacing.
o Speed: Lower speeds are rated higher than higher speeds
o Fixed objects: Roadways with fewer fixed objects (trees, signs, barriers,
etc.) close to the roadway (less than 25 feet) are rated higher than ones
with more.
o Median/traffic separators: Presence of a median and/or traffic separators
are rated higher than segments without.
o Turn Lanes: Intersection/driveway approaches with turn lanes are rated
higher than approaches without turn lanes.
Example 14-1 Qualitative Multimodal Application
This example is based on work by David Evans and Associates on the OR99 Corridor
Plan, but has been simplified and modified from the original analysis to illustrate the
methodology.
The study area on OR99 in Talent, Oregon south of Medford is approximately one mile
in length with a single traffic signal at Rapp Road. South of Rapp Road the area becomes
increasingly less dense and suburban/rural to the southern city limits. There are limited
bicycle, pedestrian, and transit facilities. OR99 is currently a four-lane undivided section,
so a five-lane and a three-lane scenario was developed for analyzing potential future
project alternatives. Conditions along the OR 99 corridor (limited signalization, limited
data, and difficult to subdivide into homogenous segments) support the use of a
qualitative MMLOS analysis to assess the multimodal aspects of existing and future
scenarios. The table at the end of the example summarizes the analysis results.
Pedestrian & Bicycle Facilities - Existing Conditions
No existing separate pedestrian or bicycle facilities are in the corridor except the Bear
Creek Greenway Trail located to the east of OR99 but not adjacent to the highway in this
location. Pedestrians must walk on the shoulder and bicycles must share the right lane
with vehicles, so the pedestrian and bicycle facilities are rated poor throughout.
Pedestrian & Bicycle Facilities - Future Scenarios
Both future scenarios would add a sidewalk or path to each side of the highway and
would include a buffer on at least one side of the highway and bike lanes on both sides.
The segments were rated as good for these conditions. The less travel lanes in the three-
lane scenario rated higher than the five lane scenario as it creates a better environment for
bicycles and pedestrians. At intersections, the three-lane scenario was rated better than
the five-lane scenario because there would be fewer travel lanes for a pedestrian or a
bicyclist to cross.
Transit Facilities – Existing and Future
Conditions are not expected to change in any substantial way from existing conditions.
While connectivity to stops would increase, frequency, reliability, speed and travel time
will be unchanged, therefore positive change will not be enough to change the grade
overall.

Analysis Procedure Manual Version 2 14-8 Last Updated 11/2018
Auto Facilities – Existing and Future
The assessment reflects the volumes and the safety evaluation. Analysis of existing
conditions and both future scenarios resulted in relatively lower volumes with shorter
queues on side street approaches. The low volumes minimize conflicts between through
and turning vehicles so the safety conditions are relatively close for all scenarios.
Segment/
Intersection
Mode
Pedestrian Bicycle Transit Auto
Existing Conditions – (Four Lanes)
Rapp Rd to Arnos
Rd
Poor Poor Fair Good
OR99 at Arnos Rd Poor Poor Fair Good
Arnos Rd to Creel
Rd
Poor Poor Fair Good
OR 99 at Creel Rd Poor Poor Fair Good
Scenario 1 - Five lanes
Rapp Rd to Arnos
Rd
Good Fair Fair Good
OR99 at Arnos Rd Fair Fair Fair Good
Arnos Rd to Creel
Rd
Good Fair Fair Good
OR 99 at Creel Rd Fair Fair Fair Good
Scenario 2 – Three lanes
Rapp Rd to Arnos
Rd
Good Good Fair Good
OR99 at Arnos Rd Good Good Fair Good
Arnos Rd to Creel
Rd
Good Good Fair Good
OR 99 at Creel Rd Good Good Fair Good
14.4 Bicycle Level of Traffic Stress
The Bicycle Level of Traffic Stress methodology breaks road segments into four
classifications for measuring the effects of traffic-based stress on bicycle riders. The
original methodology can be obtained from the paper, “Low Stress Bicycling and
Network Connectivity”, Mineta Transportation Institute, Report 11-19, May 2012. The
version of the methodology described in this section has been modified from the original
to correct inconsistencies in the tables, allow for additional intersection and bicycle
features, and allow for more flexibility and engineering judgment in practice. Support for
left turn lanes, one-way streets, roundabouts, buffered bike lanes, and shared lane
markings have been added. A methodology for high-speed rural applications has been
added since the original was for primarily urban areas. More detailed information on
changes is provided in the specific topic areas.

Analysis Procedure Manual Version 2 14-9 Last Updated 11/2018
This measure of traffic stress quantifies the perceived safety issue of being in close
proximity to vehicles whether on a spacing distance or speed basis. The methodology
does not include explicit consideration of traffic volumes as the proximity stress is
present regardless of how much traffic happens to be occurring at that time. For example,
a bicyclist travelling on a higher-speed arterial in the early morning hours without any
bike lanes will still be having traffic (even though volumes are low) passing by closely
and at high speeds. This bicyclist will experience higher stress than one riding in a
buffered bike lane under the same conditions because the proximity to traffic is greater.
An analogy to this would be as a pedestrian, having sidewalks with landscaped buffers is
much more pleasant to walk on than curb-tight sidewalks right next to moving traffic.
There are places in the methodology where there is implicit consideration of volumes,
such as in the ability to cross intersections and interactions with turn lanes. Full
consideration of traffic volumes require the use of more detailed methodologies, however
the level of detail required is not necessarily consistent with the typical planning
application but more project-like.
This methodology allows a quick assessment of system connectivity without going into
the data requirements (i.e. traffic volumes) and calculations of the HCM Bicycle
Multimodal Level-of-Service (MMLOS) method and is well suited for high-level plans
such as corridor and transportation system plans (TSP). This method can also be used in
detailed refinement-level plans and projects as a screening or flagging tool. Most of the
data should be available as part of TSP inventories and/or supplemented with aerial
photos. Depending on the community, TSP inventories may be limited to collector and
arterial streets. Field inventory may still be needed to verify elements or supplement
when vegetation or other obstructions make it difficult to see. Traffic counts/daily
volumes are not required except for higher-speed rural applications. The methodology is
designed for urban application, but can also be used for rural locations. The methodology
is visual-based so the results can be easily communicated from the engineer to other
agency and local government staff and the general public.
The tendencies of the general population to choose the bicycle as a mode and make route
choices can be broken into four overall groupings based on City of Portland, [Oregon]
surveys (Exhibit 14-2). While the percentages may change in different cities and
rural/suburban areas, the groupings are still applicable.
Analysis Procedure Manual Version 2 14-10 Last Updated 11/2018
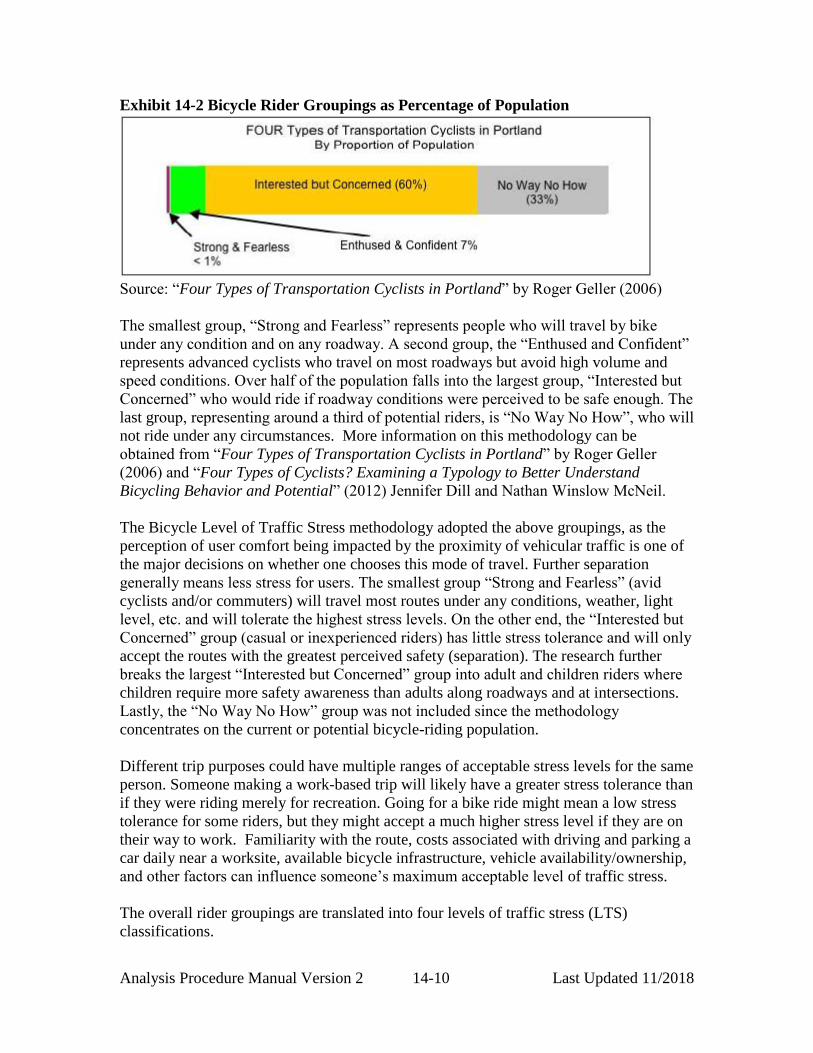
Exhibit 14-2 Bicycle Rider Groupings as Percentage of Population
Source: “Four Types of Transportation Cyclists in Portland” by Roger Geller (2006)
The smallest group, “Strong and Fearless” represents people who will travel by bike
under any condition and on any roadway. A second group, the “Enthused and Confident”
represents advanced cyclists who travel on most roadways but avoid high volume and
speed conditions. Over half of the population falls into the largest group, “Interested but
Concerned” who would ride if roadway conditions were perceived to be safe enough. The
last group, representing around a third of potential riders, is “No Way No How”, who will
not ride under any circumstances. More information on this methodology can be
obtained from “Four Types of Transportation Cyclists in Portland” by Roger Geller
(2006) and “Four Types of Cyclists? Examining a Typology to Better Understand
Bicycling Behavior and Potential” (2012) Jennifer Dill and Nathan Winslow McNeil.
The Bicycle Level of Traffic Stress methodology adopted the above groupings, as the
perception of user comfort being impacted by the proximity of vehicular traffic is one of
the major decisions on whether one chooses this mode of travel. Further separation
generally means less stress for users. The smallest group “Strong and Fearless” (avid
cyclists and/or commuters) will travel most routes under any conditions, weather, light
level, etc. and will tolerate the highest stress levels. On the other end, the “Interested but
Concerned” group (casual or inexperienced riders) has little stress tolerance and will only
accept the routes with the greatest perceived safety (separation). The research further
breaks the largest “Interested but Concerned” group into adult and children riders where
children require more safety awareness than adults along roadways and at intersections.
Lastly, the “No Way No How” group was not included since the methodology
concentrates on the current or potential bicycle-riding population.
Different trip purposes could have multiple ranges of acceptable stress levels for the same
person. Someone making a work-based trip will likely have a greater stress tolerance than
if they were riding merely for recreation. Going for a bike ride might mean a low stress
tolerance for some riders, but they might accept a much higher stress level if they are on
their way to work. Familiarity with the route, costs associated with driving and parking a
car daily near a worksite, available bicycle infrastructure, vehicle availability/ownership,
and other factors can influence someone’s maximum acceptable level of traffic stress.
The overall rider groupings are translated into four levels of traffic stress (LTS)
classifications.

Analysis Procedure Manual Version 2 14-11 Last Updated 11/2018
LTS 1 – Represents little traffic stress and requires less attention, so is suitable for
all cyclists. This includes children that are trained to safely cross intersections
(around 10 yrs. old/5th grade) alone and supervising riding parents of younger
children. Generally, the age of 10 is the earliest age that children can adequately
understand traffic and make safe decisions which is also the reason that many
youth bike safety programs target this age level. Traffic speeds are low and there
is no more than one lane in each direction. Intersections are easy to cross by
children and adults. Typical locations include residential local streets and
separated bike paths/cycle tracks.
LTS 2 – Represents little traffic stress but requires more attention than young
children can handle, so is suitable for teen and adult cyclists with adequate bike
handling skills. Traffic speeds are slightly higher but speed differentials are still
low and roadways can be up to three lanes wide in total for both directions.
Intersections are not difficult to cross for most teenagers and adults. Typical
locations include collector-level streets with bike lanes or a central business
district.
LTS 3 – Represents moderate stress and suitable for most observant adult cyclists.
Traffic speeds are moderate but can be on roadways up to five lanes wide in both
directions. Intersections are still perceived to be safe by most adults. Typical
locations include low-speed arterials with bike lanes or moderate speed non-
multilane roadways.
LTS 4 – Represents high stress and suitable for experienced and skilled cyclists.
Traffic speeds are moderate to high and can be on roadways from two to over five
lanes wide in both directions. Intersections can be complex, wide, and or high
volume/speed that can be perceived as unsafe by adults and are difficult to cross.
Typical locations include high-speed or multilane roadways with narrow or no
bike lanes.
14.4.1 Additional Rider Factors
The Bicycle Level of Stress does not include other factors that may be important to
bicycle riders that should be taken into consideration when applying this methodology.
These can include presence of steep or long climbs, poor pavement condition, heavy
vehicle use, narrow travel lanes, neighborhood crime, noise, absence of lighting, high
driveway density, skewed railroad crossings, in-pavement streetcar/railroad tracks, and
curbside conditions (snow removal or litter/gravel in the roadway). Congested conditions
can also be considered if they add difficulty to getting gaps in traffic to get into a right or
left turn lane for instance. Roadway locations with either a documented (reported total
bike crashes including any injury or fatal ones) or a perceived (near misses, known
unreported crashes) crash history should be flagged for reference.
Some of these can be significant determinants to the comfort of potential cyclists and

Analysis Procedure Manual Version 2 14-12 Last Updated 11/2018
may, at times, degrade a segment by one or even two levels rendering a route
unacceptable. If a number of these considerations exist, the stress levels can be optionally
adjusted to account for them or they can be placed on a stress map or in a separate
graphic to flag them as concerns. These can also come into play when determining
alternate paths to high-stress routes. As some of these can be subjective, adequate
documentation should be provided outlining the reasons for the deviations. Roadways
where biking is prohibited, such as certain urban freeways, should also be noted.
14.4.2 LTS Targets
A target level of traffic stress for the bikeway system may be identified in an attempt to
maximize the bicycle mode share with the available resources. A LTS 2 is often used as
the target as it will typically appeal to the majority of the potential bike-riding population
and maximize the available bicycle mode share. Other LTS levels may also be used as
targets depending on a jurisdiction’s needs and maturity of the available bike network.
When evaluating networks near schools (within ¼ mile), the desirable level of traffic
stress is LTS 1 since LTS 1 is targeted at 10-yr olds (5th grade) or parents of younger
children. Elementary school-age children should be able to travel between homes and
schools without having to cross arterial streets (LTS 3 and 4). Ideally, elementary schools
and their related attendance boundaries should be placed to allow at least a few LTS 1
routes. Middle and high school placement may not allow only LTS 1 routes but routes
should be no more than LTS 2 since older children can use these without difficulty.
14.4.3 LTS Criteria
The traffic stress criteria in the LTS methodology is broken into three categories. Table-
based criteria are applied separately for segments, intersection approaches, and
intersection crossings. Depending on the community context and the detail level desired,
segments can be block-by block or be between higher functionally-classified roadways
(arterials or collectors). The overall methodology can usually be simplified based on the
general consistency of facility types, as certain elements (i.e. no turn lanes, no bike lanes,
limited speeds, etc.) may not exist in a particular community. Segments are typically
considered to be two-way but there are areas where conditions are not the same on each
side of the street (i.e. parking only on one side). Both directions can be reported
separately, or the worst direction reported. The methodology uses the worst overall LTS
value for each overall segment. For example, if a segment has a LTS 2 but there is an
intersection approach at the end of the segment at LTS 4, then the whole segment is
coded LTS 4. The same applies for entire routes which are typically reported in a single
direction between two points of interest and can contain many segments and
intersections. It is likely that the LTS will be different (i.e. right turn lane vs. left turn
lane) in the two directions, so both directions should be reported. One poor crossing at
LTS 4 will render a route unacceptable to most people even though the rest of the route is
at LTS 2.

Analysis Procedure Manual Version 2 14-13 Last Updated 11/2018
14.4.4 LTS Segment Criteria
The LTS segment criteria are broken into three classes: physically separated paths and
lanes, standard bike lanes, and without bike lanes (mixed traffic). The physically
separated paths include bike paths and cycle tracks which may be separated from motor
vehicles by landscaped buffers, curbs, or on-street parking (for cycle tracks). Physically-
separated bike paths and lanes (assuming full bike standards) are generally classified as
LTS 1.
Marked bike lanes have different criteria depending on whether they are adjacent to a
parking lane or not, as shown in Exhibit 14-3 and Exhibit 14-4. These exhibits are
formatted differently from the original methodology to fix inconsistencies with roadways
with bike lanes having higher stress levels than roadways without bike lanes. In addition,
slight changes were made so bike lane width makes a difference in the lower stress levels.
Buffered bike lanes have been added to Exhibit 14-4 to account for their increased
positive separation effects Existing bike lanes without a useable width of at least 4’
(caused by striped too-narrow widths, drainage grates, poor curb-gutter/pavement
interfaces , etc.) should be recorded as mixed traffic instead. Bike lanes less than 4’ do
not provide adequate separation from motor vehicles.
The criteria are based on through lanes per direction, the sum of the width of the bike and
parking lanes, speed limit or prevailing speed, and any bike lane blockage (in commercial
areas from driveways, loading zones, stopped buses, or parking maneuvers). For these
and following tables, the criteria aggregate following the weakest link principle: the
dimension with the worst level of stress governs. For example, a roadway with one lane
per direction, 25 mph, but has frequent bike lane blockages will be at LTS 3 which
overrides the LTS 1 values of the other components.
Exhibit 14-3 Bike Lane with Adjacent Parking Lane Criteria
1 Lane per direction ≥2 lanes per direction
Prevailing or
Posted
Speed
≥ 15’ bike
lane +
parking
14’ – 14.5’
bike lane +
parking
≤ 13’ bike
lane +
parking or
Frequent
blockage1
≥ 15’ bike
lane +
parking
≤ 14.5’ bike
lane +
parking or
Frequent
blockage1
≤25 mph LTS 1 LTS 2 LTS 3 LTS 2 LTS 3
30 mph LTS 1 LTS 2 LTS 3 LTS 2 LTS 3
35 mph LTS 2 LTS 3 LTS 3 LTS 3 LTS 3
≥40 mph LTS 2 LTS 4 LTS 4 LTS 3 LTS 4 1Typically occurs in urban areas (i.e. delivery trucks, parking maneuvers, stopped buses).

Analysis Procedure Manual Version 2 14-14 Last Updated 11/2018
Exhibit 14-4 Bike Lane without Adjacent Parking Lane Criteria
1 Lane per direction ≥2 lanes per
direction
Prevailing
or Posted
Speed
≥ 7’
(Buffered
bike lane)
5.5’ – 7’
Bike lane
≤ 5.5’
Bike lane
Frequent
bike lane
blockage1
≥ 7’
(Buffered
bike
lane)
<7’ bike
lane or
frequent
blockage1
≤30 mph LTS 1 LTS 1 LTS 2 LTS 3 LTS 1 LTS 3
35 mph LTS 2 LTS 3 LTS 3 LTS 3 LTS 2 LTS 3
≥40 mph LTS 3 LTS 4 LTS 4 LTS 4 LTS 3 LTS 4 1Typically occurs in urban areas (i.e. delivery trucks, parking maneuvers, stopped buses).
Mixed traffic conditions are roadways without any bike markings (including widened
shoulders not marked as bike lanes). Mixed traffic segment criteria for urban/suburban
sections are based on the speed limit or the prevailing speed if different, and the number
of lanes by direction, as shown in Exhibit 14-5. This exhibit was reformatted into “lanes
per direction” from the original methodology, for consistency with the other segment
criteria exhibits and to fix the with/without bike lane issue previously mentioned.
Designated bike boulevards or marked shared low-speed “sharrow” routes also are
considered as mixed traffic conditions, but depending on judgment and area context, may
have LTS levels reduced by one. Markings and signs give bicyclists more perceived
safety and warn drivers about potential bicycles being in the roadway which tends to
lower overall speeds.
Exhibit 14-5 Urban/Suburban Mixed Traffic Criteria
Prevailing
Speed or
Speed Limit
(mph)
Unmarked
Centerline
1 lane per
direction
2 lanes per
direction
3+ lanes per
direction
≤ 251 LTS 1 LTS 2 LTS 3 LTS 4
30 LTS 2 LTS 3 LTS 4 LTS 4
≥ 35 LTS 3 LTS 4 LTS 4 LTS 4 1Presesence of “sharrow” markings may reduce the LTS by a level for 25 mph or less
sections depending on overall area context.
14.4.5 LTS Intersection Approach Criteria
Intersection approach criteria are based on the presence and type of right or left turn
(vehicular) lanes. If there are no turn lanes on an approach, then this portion of the
methodology is skipped.
ODOT Bicycle Design Guide standards have the right turn lane to the right of the bike
lane so the bike lane continues straight and requires vehicles to turn and yield to
bicyclists across a marked dashed bike lane (see Exhibit 14-6a). Locations where the
through travel lane becomes a right turn lane (lane drop) may have a more stressful

Analysis Procedure Manual Version 2 14-15 Last Updated 11/2018
design where the bike lane shifts to the left while the travel lane continues straight
(Exhibit 14-6b). In this case, the bike lane cannot be to the right of a right-turn lane
unless controlled by a separate bicycle signal (see Exhibit 14-6c), as the through bicycle
lane would directly conflict with the right turn lane with the potential for many “right-
hook” type crashes. Other intersection designs may have the bike lane end where the
right turn lane begins (i.e. T-intersections, roundabouts) and re-appear on the other side
of the intersection (Exhibit 14-6d).
Exhibit 14-6 Right Turn Lane Types
The right turn criteria are based on whether the bike lane stays straight or shifts to the
left, turn lane length and turning speed. The longer the turn lane, the longer a bicyclist
will have traffic on both sides in close proximity if continuing straight, or mixing with
traffic if turning right. When the bike lane stays straight, turn lanes of 150’ or less (100’
is typical for most urban applications) and low turning speed (15 mph is a common for
most residential and commercial areas) will have a LTS 2 as seen in Exhibit 14-7.
Longer turn lanes, higher turning speeds or at skewed intersections will result in a LTS 3
rating. Dual shared or exclusive right turn lanes are typically in very high volume
locations which add additional stress and are LTS 4.
a) Straight Bike Lane
Alignment
d) Bike Lane Ends
Before Intersection
c) Lane Drop – allowed
only with a bike signal
b) Left Bike Lane
Alignment (Lane drop)
Analysis Procedure Manual Version 2 14-16 Last Updated 11/2018
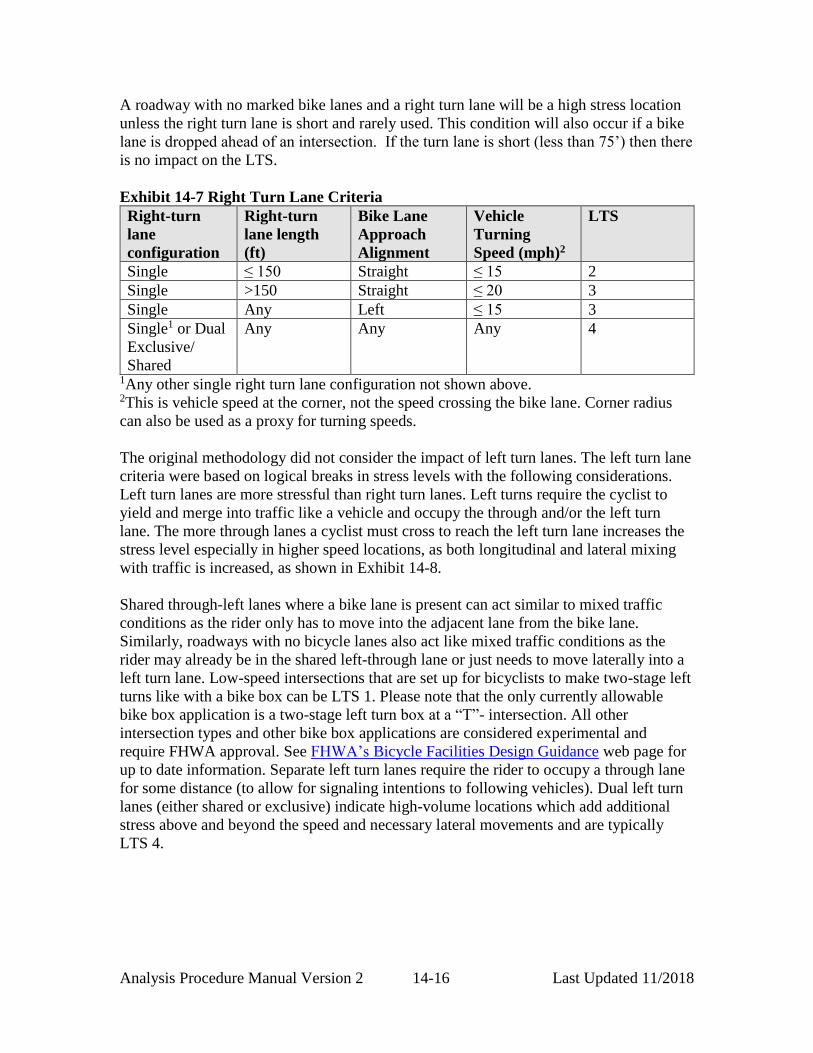
A roadway with no marked bike lanes and a right turn lane will be a high stress location
unless the right turn lane is short and rarely used. This condition will also occur if a bike
lane is dropped ahead of an intersection. If the turn lane is short (less than 75’) then there
is no impact on the LTS.
Exhibit 14-7 Right Turn Lane Criteria
Right-turn
lane
configuration
Right-turn
lane length
(ft)
Bike Lane
Approach
Alignment
Vehicle
Turning
Speed (mph)2
LTS
Single ≤ 150 Straight ≤ 15 2
Single >150 Straight ≤ 20 3
Single Any Left ≤ 15 3
Single1 or Dual
Exclusive/
Shared
Any Any Any 4
1Any other single right turn lane configuration not shown above. 2This is vehicle speed at the corner, not the speed crossing the bike lane. Corner radius
can also be used as a proxy for turning speeds.
The original methodology did not consider the impact of left turn lanes. The left turn lane
criteria were based on logical breaks in stress levels with the following considerations.
Left turn lanes are more stressful than right turn lanes. Left turns require the cyclist to
yield and merge into traffic like a vehicle and occupy the through and/or the left turn
lane. The more through lanes a cyclist must cross to reach the left turn lane increases the
stress level especially in higher speed locations, as both longitudinal and lateral mixing
with traffic is increased, as shown in Exhibit 14-8.
Shared through-left lanes where a bike lane is present can act similar to mixed traffic
conditions as the rider only has to move into the adjacent lane from the bike lane.
Similarly, roadways with no bicycle lanes also act like mixed traffic conditions as the
rider may already be in the shared left-through lane or just needs to move laterally into a
left turn lane. Low-speed intersections that are set up for bicyclists to make two-stage left
turns like with a bike box can be LTS 1. Please note that the only currently allowable
bike box application is a two-stage left turn box at a “T”- intersection. All other
intersection types and other bike box applications are considered experimental and
require FHWA approval. See FHWA’s Bicycle Facilities Design Guidance web page for
up to date information. Separate left turn lanes require the rider to occupy a through lane
for some distance (to allow for signaling intentions to following vehicles). Dual left turn
lanes (either shared or exclusive) indicate high-volume locations which add additional
stress above and beyond the speed and necessary lateral movements and are typically
LTS 4.

Analysis Procedure Manual Version 2 14-17 Last Updated 11/2018
Exhibit 14-8 Left Turn Lane Criteria
Prevailing
Speed or
Speed Limit
(mph)
No lane
crossed1
1 lane crossed
2+ lanes
crossed
Dual shared
or exclusive
left turn lane2
≤25 LTS 2 LTS 2 LTS 3 LTS 4
30 LTS 2 LTS 3 LTS 4 LTS 4
≥ 35 LTS 3 LTS 4 LTS 4 LTS 4 1For shared through left lanes or where mixed traffic conditions occur (no bike lanes) 2Any other single left turn lane configuration not shown above.
14.4.6 LTS Unsignalized Intersection Crossing Criteria
Unsignalized intersection crossings can act as a barrier to bicyclists especially with a high
number of lanes or higher speeds. The crossing can be an impediment to travel if the
bicyclist has to cross six or more lanes at any speed or has to cross a 35 mph (or greater)
four-lane street. The criteria for unsignalized intersection crossings depend on the
presence of a median of sufficient width to provide for a two-stage crossing.
Pedestrian/bicycle over/underpasses would be considered as separate facilities and are
LTS 1.
Signalized crossings usually do not create a barrier as the signal provides a protected way
across and are not considered in the methodology. Signalized intersections do pose risks
for right-turn “hook” crashes, however, especially where right turn lanes are not present.
Bicyclists may have also difficulty triggering the signal detection (vs. walking the bike
across the street as a pedestrian). There may be areas where engineering judgment is
required in assigning stress levels higher than LTS 1 at signalized intersections for these
reasons. The presence of bike signals may be a mitigating factor in higher-risk areas thus
keeping the LTS at 1.
Roundabouts were not included in the original research, but a single-lane roundabout
assuming mixed traffic conditions (Exhibit 14-5) where the bicyclist takes the lane with
the typical sub-25 mph speeds should be LTS 2. Dual-lane roundabouts should also use
the mixed traffic conditions for two lanes (LTS 3). Dual-lane roundabouts may require
bicyclists to cross a through lane to turn left which would have a similar application to
Exhibit 14-8, however the mixed traffic conditions will likely still control. Right-turn
bypass lanes within the roundabout would be considered as right turn lanes as shown in
Exhibit 14-7.
For rating routes, only include the effect of the left turn lane if the route
requires a left turn. For through and right turn movements, include the effect of
the right turn criteria.

Analysis Procedure Manual Version 2 14-18 Last Updated 11/2018
Where there is no median refuge, with two-way crossings of up to three lanes, the LTS
ranges from 1 to 3 depending on speed, as seen in Exhibit 14-9. For crossings of four to
five lanes, the LTS ranges from 2 to 4.
Exhibit 14-9 Unsignalized Intersection Crossing Without a Median Refuge Criteria1
Prevailing Speed
or
Speed Limit (mph)
Total Lanes Crossed (Both Directions)2
≤ 3 Lanes 4 -5 Lanes ≥ 6 Lanes
≤ 25 LTS 1 LTS 2 LTS 4
30 LTS 1 LTS 2 LTS 4
35 LTS 2 LTS 3 LTS 4
≥ 40 LTS 3 LTS 4 LTS 4 1For street being crossed. 2For one-way streets use Exhibit 14-10.
In a change from the original methodology, to better accommodate one-way streets, the
intersection crossing with a median refuge criteria was changed to lanes per direction
versus total lanes crossed. One-way streets carry higher volumes than two-way streets of
the same number of lanes and thus can have greater stress levels applied to them. Use
Exhibit 14-10 for one-way street applications.
Exhibit 14-10 has the maximum number of lanes a bicyclist encounters on each side of a
median refuge. Adding a median refuge of at least six feet in width (10 feet for LTS 1
eligibility) will decrease the LTS versus when a refuge is not present. The presence of
turn lanes are also accounted for as they add conflict points and vehicle paths to the
awareness needs.
Exhibit 14-10 Unsignalized Intersection Crossing With a Median Refuge Criteria1
Prevailing Speed
or
Speed Limit (mph)
Maximum Through/Turn Lanes Crossed per Direction
1-2 Lanes 2-3 Lanes 4+ Lanes
≤ 25 LTS 12 LTS 12 LTS 2
30 LTS 12 LTS 2 LTS 3
35 LTS 2 LTS 3 LTS 4
≥ 40 LTS 3 LTS 4 LTS 4 1For street being crossed. 2Refuge should be at least 10 feet to accommodate a wide range of bicyclists (i.e. bicycle
with a trailer) for LTS 1, otherwise LTS=2 for refuges 6 to <10 feet.
Since crossings are not part of a link, the LTS to cross the major street is applied to the
minor street. If the crossing LTS is greater than the minor street link LTS, the crossing
LTS applies (controls) to that link.
14.4.7 Rural Applications
While the original methodology was designed only for urban applications, it can be used
Analysis Procedure Manual Version 2 14-19 Last Updated 11/2018
for rural roadways that have posted or operating speeds less than 45 mph. Rural roadways
with speeds less than 45 mph tend to be one or two-lane local, undeveloped roadways
that 1) connect rural communities, 2) exist in parks or other recreational areas or 3)
provide a connection to a tourist destination. These are typically low volume and have no
or little paved shoulder width. Sight distances are likely to be lower (sharper vertical and
horizontal curves) because of the lower road design standards used. LTS will be primarily
based on speed in these cases. Use the regular LTS mixed traffic criteria shown in Exhibit
14-5 for these roadways and Exhibit 14-9 or Exhibit 14-10 for intersections. Approach
criteria will probably not be applicable because low volume roadways generally do not
have turning lanes.
Application of the LTS methodology to the typical higher-speed rural environment
requires considering shoulder widths and volumes. Daily bi-directional (combined)
volumes are necessary for this method. The normal LTS methodology tops out at 40 mph,
while most typical state and county rural roadways are posted at 45 - 55 mph.
A large portion of the bicycle-vehicle crashes occur when a vehicle attempts to overtake a
bicyclist on a roadway with no or little available paved shoulder width. The wider the
shoulder the less likely a bicyclist will be in the same path as vehicles. The occurrence of
bike crashes is highest on higher volume rural facilities with little or no paved shoulders,
poorly placed rumble strips, or deteriorated shoulder pavement conditions.
Narrow or no shoulders and higher volumes (increased overtaking conflicts) will increase
the stress level. Unless an adjacent separated multi-use path/bike lane is provided (LTS
1), most rural roadways do not have bike lanes and bicyclists will depend on paved
shoulders. Exhibit 14-11 shows the LTS for typical rural conditions for higher speed rural
roadways.
Rural intersection crossing stress levels will be typically based on approach volumes and
number of lanes (Exhibit 14-12). Since the rural environment is more unpredictable
(higher speeds and motorists are less likely to be aware of or anticipate bicyclists) than
the urban environment, the minimum LTS is 2.
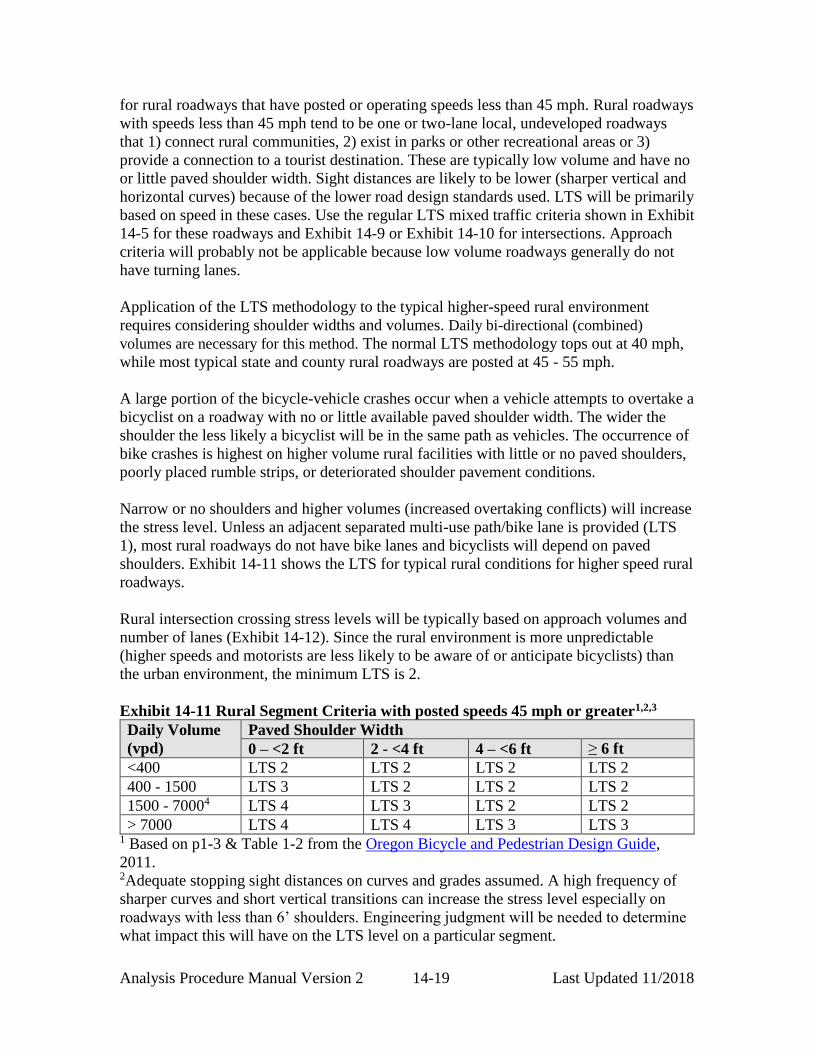
Exhibit 14-11 Rural Segment Criteria with posted speeds 45 mph or greater1,2,3
Daily Volume
(vpd)
Paved Shoulder Width
0 – <2 ft 2 - <4 ft 4 – <6 ft ≥ 6 ft
<400 LTS 2 LTS 2 LTS 2 LTS 2
400 - 1500 LTS 3 LTS 2 LTS 2 LTS 2
1500 - 70004 LTS 4 LTS 3 LTS 2 LTS 2
> 7000 LTS 4 LTS 4 LTS 3 LTS 3 1 Based on p1-3 & Table 1-2 from the Oregon Bicycle and Pedestrian Design Guide,
2011. 2Adequate stopping sight distances on curves and grades assumed. A high frequency of
sharper curves and short vertical transitions can increase the stress level especially on
roadways with less than 6’ shoulders. Engineering judgment will be needed to determine
what impact this will have on the LTS level on a particular segment.

Analysis Procedure Manual Version 2 14-20 Last Updated 11/2018
3Segments with flashing warning beacons announcing presence of bicyclists (typically
done on narrower long bridges or tunnels) may, depending on judgment, reduce the LTS
by one, but no less than LTS 2. 4Over 1500 AADT, the Oregon Bicycle and Pedestrian Design Guide indicates the need
for shoulders.
Exhibit 14-12 Unsignalized Rural Intersection Crossing with posted speeds 45 mph or
greater1
Daily Volume
(vpd)
≤ 3 Lanes 4 -5 Lanes ≥ 6 Lanes
<400 LTS 2 n/a n/a
400 - 1500 LTS 2 n/a n/a
1500 - 7000 LTS 2 LTS 3 n/a
> 7000 LTS 3 LTS 4 LTS 4 1For roadway being crossed.
For intersection approaches, the presence of left or right lanes will increase the LTS at
least by one level as they greatly increase the chance that vehicles will cut across the
bicyclist’s path or that the bicyclists will need to utilize these lanes to turn. Low volume
roadways (less than 1500 ADT) are not likely to have turn lanes.
14.4.8 Route Connectivity using LTS
The LTS designations should be mapped on the system network. This can be facilitated
with GIS or with a travel demand model if available. The objective of mapping is to
identify locations with LTS values exceeding a desired level that may then be targeted for
improvements. Exhibit 14-13 shows an example of using LTS showing the different
stress levels. The high stress routes can easily be contrasted against the lower stress ones.
Analysis Procedure Manual Version 2 14-21 Last Updated 11/2018
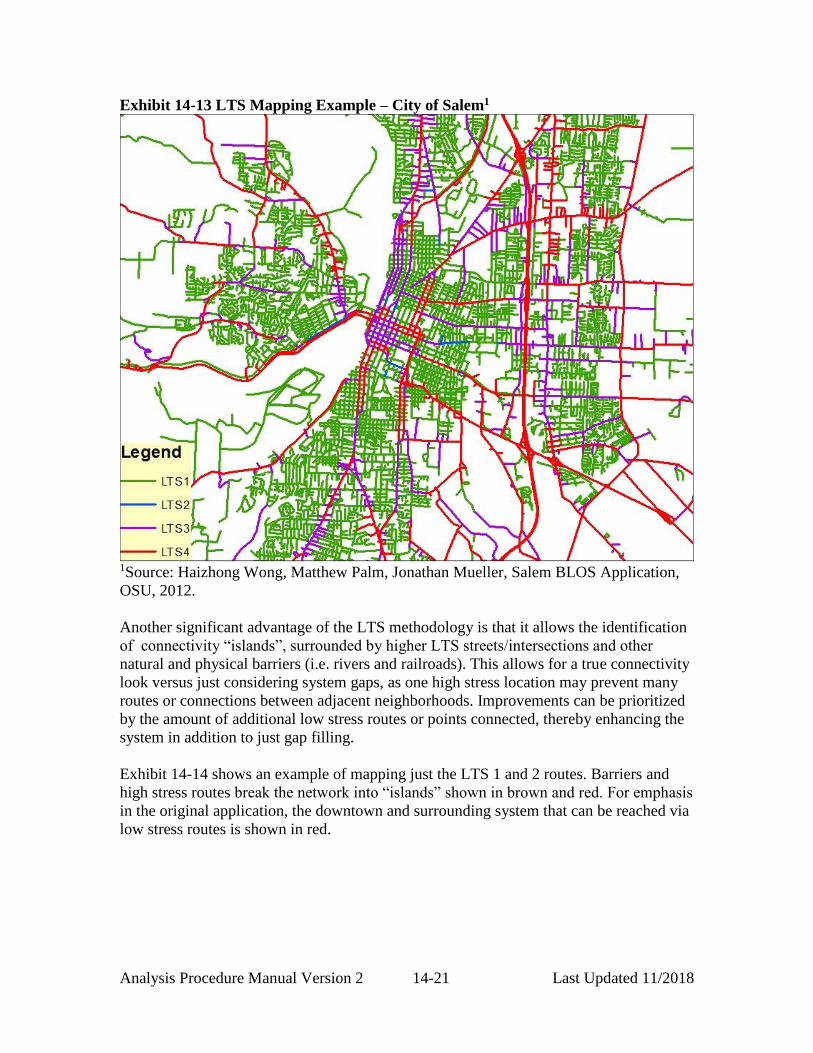
Exhibit 14-13 LTS Mapping Example – City of Salem1
1Source: Haizhong Wong, Matthew Palm, Jonathan Mueller, Salem BLOS Application,
OSU, 2012.
Another significant advantage of the LTS methodology is that it allows the identification
of connectivity “islands”, surrounded by higher LTS streets/intersections and other
natural and physical barriers (i.e. rivers and railroads). This allows for a true connectivity
look versus just considering system gaps, as one high stress location may prevent many
routes or connections between adjacent neighborhoods. Improvements can be prioritized
by the amount of additional low stress routes or points connected, thereby enhancing the
system in addition to just gap filling.
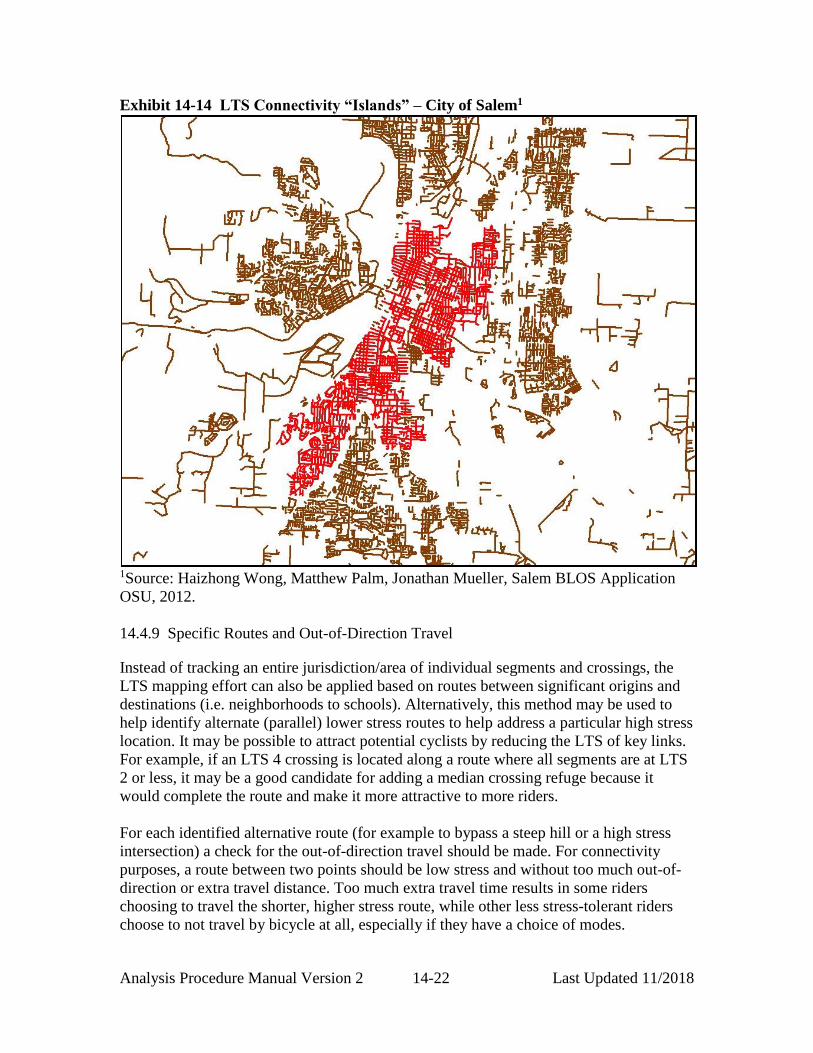
Exhibit 14-14 shows an example of mapping just the LTS 1 and 2 routes. Barriers and
high stress routes break the network into “islands” shown in brown and red. For emphasis
in the original application, the downtown and surrounding system that can be reached via
low stress routes is shown in red.
Analysis Procedure Manual Version 2 14-22 Last Updated 11/2018
Exhibit 14-14 LTS Connectivity “Islands” – City of Salem1
1Source: Haizhong Wong, Matthew Palm, Jonathan Mueller, Salem BLOS Application
OSU, 2012.
14.4.9 Specific Routes and Out-of-Direction Travel
Instead of tracking an entire jurisdiction/area of individual segments and crossings, the
LTS mapping effort can also be applied based on routes between significant origins and
destinations (i.e. neighborhoods to schools). Alternatively, this method may be used to
help identify alternate (parallel) lower stress routes to help address a particular high stress
location. It may be possible to attract potential cyclists by reducing the LTS of key links.
For example, if an LTS 4 crossing is located along a route where all segments are at LTS
2 or less, it may be a good candidate for adding a median crossing refuge because it
would complete the route and make it more attractive to more riders.
For each identified alternative route (for example to bypass a steep hill or a high stress
intersection) a check for the out-of-direction travel should be made. For connectivity
purposes, a route between two points should be low stress and without too much out-of-
direction or extra travel distance. Too much extra travel time results in some riders
choosing to travel the shorter, higher stress route, while other less stress-tolerant riders
choose to not travel by bicycle at all, especially if they have a choice of modes.

Analysis Procedure Manual Version 2 14-23 Last Updated 11/2018
According to the original research report1, riders can typically tolerate up to 25% extra
distance since the vast majority of trips are within 25% of the shortest-path available.
However, most bicyclists choose trip paths that are only 10% longer than the shorter
higher-stress routes, so 10% is a good target value. A 10% target represents a half-mile
of extra travel on a five mile trip. Short trips should not have detours of longer than 1/3
mile which represents two minutes of travel time at 10 mph. In addition, the 25%
maximum threshold for connectivity can also be used to predict route selection, to plan
way-finding routes, or even analyze detour routes around a construction zone.
Routes can be assessed for acceptable out-of-direction travel if the either of the following
relationships is true:
Lk/L4 ≤ 1.25; OR
Lk – L4 ≤ 1,760 feet (0.33 mile)
Where Lk = route distance at any given stress level, k.
L4 = route distance using any links with stress levels up to and including LTS 4 (but not
including links where riding is prohibited).
Note: Some routes with hills or many stops (or any of the previously mentioned
additional considerations) may decrease desirability even though the criteria above are
met.
1 Low-Stress Bicycling and Network Connectivity, Mekuria, Furth, & Nixon, Mineta Transportation
Institute, May 2012, pp14-15.

Analysis Procedure Manual Version 2 14-24 Last Updated 11/2018
Example 14-2 Alternate Route Out-of-Direction Travel
This example illustrates the impact of out-of-direction travel on alternate routing. Two
routes, one short and one long, are shown bypassing a signalized intersection with high-
stress approaches in the figure below. These are only two routes of the many that are
available to use.
City of Burns US20 LTS Example
For the (exaggerated) short route, the normal high-stress route through the intersection is
700 feet. Adding in the two extra blocks of travel (600’ total) to cross on a lower-stress
path creates a 1300 foot route. While the total length of extra travel distance is acceptable
as 600 feet is less than 1,760 feet, the overall extra trip distance as a proportion of the
total is not, as 1300 feet/700 feet = 1.86 or 86% extra distance. For this route, bicyclists
are unlikely to take the alternate path. Higher stress-tolerant users will just deal with the
Alternate route to bypass
intersection with high
stress approaches
OR78
US
20
Alternate route to bypass
US20 mixed traffic
conditions and intersection
with high stress approaches
LTS 1
LTS 2
LTS 3
LTS 4

Analysis Procedure Manual Version 2 14-25 Last Updated 11/2018
LTS 4 section while less tolerant users will likely take another mode such as walking or
driving.
For the longer route, the normal higher-stress route is 2,650 feet through the downtown
section and across the intersection. Like with the short route, the extra distance is 600 feet
for a total route distance of 3,250 feet. In this case, the extra distance has less of a
proportional impact on the trip as 3,250 feet/2,650 feet is 1.23 or 23%. This is less than
the 25% threshold so bicyclists may choose this route instead, especially if they are less-
stress tolerant. This distance is still greater than the desirable 10% level so not all
(especially higher-stress tolerant riders) will use this particular route. This path would
need to be over twice as long to meet the 10% level with even just a couple extra blocks
out of direction.
14.4.10Solutions to Decrease LTS Level
There are a number of ways to lower stress levels and to achieve a desired LTS level on a
segment, approach, or crossing. For more detail on these solutions, please refer to the
Oregon Bicycle and Pedestrian Design Guide, the ODOT Traffic Manual, and the ODOT
Highway Design Manual. A few examples (not exhaustive):
Creating conventional bike lanes, buffered bike lanes, raised bike lanes, and
bike boulevards.
Creating segregated bike facilities such as cycle tracks or bike paths.
Safety measures in design, such as couplets, medians, or pedestrian refuges. If
four lanes of vehicular capacity is still needed then investigating a couplet
may also achieve stress reductions.
Increase width of outside lanes on roadways too narrow for striped bike lanes
to create more buffer space and room for bicyclists.
Paving/widening shoulders or removing parking.
Reducing the number of lanes through a road diet.
Install road markings (such as sharrows) and way-finding signs.
Addition of flashing pedestrian activated beacons (PABs) or mid-block
pedestrian hybrid beacons (i.e. PHB can improve higher-volume crossing
locations.
Removing or improving barriers, such as providing a safe grade-separated
crossing over highways or railroads.
Improving the pavement conditions on the shoulders of roadways.
Adding left-turn bike boxes (see Section 14.4.5 LTS Intersection Approach
Criteria for limitations).
Adding bike signals to clarify bike movements.
Reducing speeds, enforcement of speeds limit or education about speed.

Analysis Procedure Manual Version 2 14-26 Last Updated 11/2018
14.4.11LTS Application Example
Example 14-3 Level of Traffic Stress
This example illustrates the use of LTS for the central section of the City of Burns in
eastern Oregon in Harney County. This covers the signalized junction of US20 and OR78
in downtown Burns as well as including surrounding residential areas. Data were quickly
obtained by using available state highway inventory data and views from commercial
aerial photos.
Segment LTS: Most roadway sections are two lanes and 25 mph except for US20 west of the OR78
junction which has four lanes. No bike lanes are in the example area so all roadways are
considered mixed traffic, which will be LTS 2 for the two-lane major roadways (US20
and OR78), LTS 3 for the four-lane section of US20, and LTS 1 for the local streets (no
marked centerlines).
Approach LTS: On the southbound and westbound approaches to the US20/OR78 junction, the right turn
lanes are both a full block long with an adjacent shared-through left lane. These right
turn lanes will create a high stress level for a bicyclist as it forces them to mix directly
with right turning traffic if they wish to turn right or mix with through traffic in the
southbound shared through-left lane if they wish to continue southbound. Because these
are greater than 150 feet and do not have an adjacent bike lane, these are both coded LTS
4. The adjacent shared left-through lanes on both approaches would have an LTS 2, but
the LTS 4 right turn lane arrangement supersedes it.
On the northbound approach, there is a short 50’ right turn lane with an adjacent shared –
left lane. The right turn lane is short, so there is no additional impact on the LTS. The
adjacent shared though-left lane would be an LTS 2, as no lane would need to be crossed
since an approaching bicyclist will end up in this lane if they are not turning right. Here,
the approach LTS 2 will override the segment LTS 1 value.
The eastbound approach has a left-lane drop lane where the left turn lane is a full block
long with an adjacent through-right lane. Since mixed traffic conditions exist, the
bicyclist would just move into the left turn lane. This would be at a LTS 2 level, but the
segment LTS 3 level would still control.
Crossing LTS: The signalized intersection of US20 & OR78 is LTS 1. However, this is overridden on
the southbound and westbound approaches by the LTS 4 for the approaches; on the
eastbound side by the LTS 3 four lane sections; and on the northbound side for the LTS 2
approach. On the four-lane portion of US20, the local street crossings are increased to
LTS 2 which affects the coding of local street segments that are adjacent to US20.
Summary:
Analysis Procedure Manual Version 2 14-27 Last Updated 11/2018
Since the highest LTS controls, and using the US20/OR78 intersection as an example, the
approach criteria is greater than the segment or crossing criteria, except for the eastbound
approach where it matches the LTS 3 value. The resulting LTS at the intersection can be
seen in the figure below.
Most of the roadway system in the example is LTS 1 or 2. The long right turn lanes
coupled with the absence of bike lanes on US20 and OR78 approaching the highway
junction convert a potential route using these roadways into LTS 4, which most bicyclists
will avoid. While the various parts of the city are generally well connected with LTS 1 or
LTS 2 networks, it is easy to see the disconnect created along the primary arterials by the
intersection of US 20 and OR 78.

Analysis Procedure Manual Version 2 14-28 Last Updated 11/2018
Example LTS Map
14.5 Pedestrian Level of Traffic Stress
14.5.1 Purpose
The purpose of the Pedestrian Level of Traffic Stress (PLTS) is to create a high-level
inventory and a walkability/connectivity performance rating of pedestrian facilities in a
community without needing a significant amount of data. The Pedestrian Level of Traffic
Stress methodology classifies roadway segments according to the level of pressure or
strain experienced by pedestrians and other sidewalk users. Other users include non-
motorized forms of transportation as well as motorized power chairs, scooters, and other
Non-standard right turn
lane with no bike lane
Four-lane roadway crossing
controls minor street LTS.
OR78
US
20
Local streets are LTS 1
based on two lanes
and 25 mph.
Segment LTS based on
two lanes of mixed traffic
at 25 mph.
Local street crossings
of US20 are LTS 1.
LTS 1
LTS 2
LTS 3
LTS 4

Analysis Procedure Manual Version 2 14-29 Last Updated 11/2018
wheeled mobility devices which are permitted and assumed to use pedestrian facilities2.
The PLTS method would typically be used during the creation of a Regional
Transportation Plan (RTP), or Transportation System Plan (TSP). It can also be used for
screening in a facility plan or project (See Section 14.2 for more information on
applications). This methodology is intended for use in urban areas. It can be used in rural
conditions where pedestrian facilities exist, however the method will yield a high PLTS
where there is higher speed traffic.
14.5.2 Methodology
PLTS was created to be a companion with the Bicycle Level of Traffic Stress (BLTS)3.
Both methods group facilities into four different stress levels for segments, intersection
approaches and intersection crossings. It is recommended that BLTS and PLTS be
performed at the same time to completely understand the multimodal and intermodal
deficiencies of an area. New techniques were developed to support the pedestrian
segment method while the intersection crossings are adapted from the BLTS method, as
these were based on a pedestrian’s view of comfort and perceived safety. Like BLTS, the
PLTS methodology does not require extensive data collection; much of the needed data is
collected routinely and some of the data collected for PLTS overlaps with BLTS.
Segment data:
Sidewalk condition and width
Buffer type and width
Bike lane width
Parking width
Number of lanes and posted speed
Illumination presence
General land use
Crossing data:
Functional class
Number of lanes and posted speeds
Roadway average daily traffic (ADT) [optional]
Sidewalk ramps
Median refuge & illumination presence
Signalized general intersection features
2 A non-motorized form of transportation refers to vehicles that would not use the roadway to travel on a
roadway. Motorized power chairs, scooters, and other wheeled mobility devices are permitted and assumed
to use pedestrian facilities. 3 The BLTS methodology is based on the paper, Low Stress Bicycling and Network Connectivity, Mineta
Transportation Institute, Report 11-19, May 2012 that was adapted by the Oregon Department of
Transportation in 2014. This version can be found in the “Analysis Procedures Manual,” Oregon
Department of Transportation, Version 2, June 2015.
Analysis Procedure Manual Version 2 14-30 Last Updated 11/2018
For state highways, a good portion of the data needed are available in ODOT’s databases
including the on-line TransGIS application. Sidewalk condition and width, buffer
presence, bike lane width, numbers of lanes, posted speeds, functional class, traffic
volumes, and sidewalk ramps are available. Other jurisdictions may have existing TSP or
public works inventories of some of these items. Use of Internet-based aerial imagery and
street-level tools will capture any remaining widths or presence variables such as parking
and buffer widths or intersection/mid-block crossing features. Sidewalk condition will
likely require some sort of field inventory if it not available from other sources. Volumes,
if used, should be from existing sources, or already counted as part of the same study.
Streets with similar characteristics with known volumes can be used as proxy for other
streets in the study area. PLTS uses four levels of traffic stress with PLTS 1 being the
lowest stress level:
PLTS 1- Represents little to no traffic stress and requires little attention to the
traffic situation. This is suitable for all users including children 10 years or
younger, groups of people and people using a wheeled mobility device (WhMD4).
The facility is a sidewalk or shared-use path with a buffer between the pedestrian
and motor vehicle facility. Pedestrians feel safe and comfortable on the pedestrian
facility. Motor vehicles are either far from the pedestrian facility and/or traveling
at a low speed and volume. All users are willing to use this facility.
PLTS 2- Represents little traffic stress but requires more attention to the traffic
situation than of which young children may be capable. This would be suitable for
children over 10, teens and adults. All users should be able to use the facility but,
some factors may limit people using WhMDs. Sidewalk condition should be good
with limited areas of fair condition. Roadways may have higher speeds and/or
higher volumes. Most users are willing to use this facility.
PLTS 3- Represents moderate stress and is suitable for adults. An able-bodied
adult would feel uncomfortable but safe using this facility. This includes higher
speed roadways with smaller buffers. Small areas in the facility may be
impassable for a person using a WhMD and/or requires the user to travel on the
shoulder/bike lane/street. Some users are willing to use this facility.
PLTS 4- Represents high traffic stress. Only able-bodied adults with limited route
choices would use this facility. Traffic speeds are moderate to high with narrow or
no pedestrian facilities provided. Typical locations include high speed, multilane
roadways with narrow sidewalks and buffers. This also includes facilities with no
sidewalk. This could include evident trails next to roads or ‘cut through’ trails.
Only the most confident or trip-purpose driven users will use this facility.
It should be noted that the trip purpose and route options affect the level of stress a
person is willing to experience. A person making a work-based trip is typically willing to
4 A wheeled mobility device (WhMD) includes walkers, manual wheelchairs, power base chairs, and
light weight scooters. Each of these devices requires the operator to maneuver and set the direction of
travel. All of these devices can be operated independently and do not require additional people to
maneuver the device. The American with Disability Act (ADA) (1990) sets limits on the vertical
change in a surface to 0.5 inches.

Analysis Procedure Manual Version 2 14-31 Last Updated 11/2018
experience a greater stress level than a person using the facility for recreation or exercise.
Other elements including time of day, cost associated with other modes, ownership of
vehicles, etc., influence the level of stress a person is willing to experience.
Additional Pedestrian Considerations
PLTS does not include some additional factors that may influence the overall level of
traffic stress. These considerations may be somewhat subjective and may not be easily
measured. These factors include, but are not limited to, steep grades, neighborhood
crime/personal security, access density, crash history, and heavy bicycle use (on sidewalk
or path). If desired, the methodology could be modified to include these factors. If one or
more negative conditions apply to a roadway, the final score can be further downgraded
with proper documentation. Additional notation should be included if the downgrade was
based on subjective observations.
14.5.3 PLTS Targets
PLTS 2 is generally a reasonable minimum target for pedestrian routes. This level of
accommodation will generally be acceptable to the majority of users. Higher stress levels
may be acceptable in limited areas depending on the land use, population types, and
roadway classifications, but they will generally not be comfortable for most users. Each
land use has specific needs for the pedestrian network and study areas should have
multiple targets for the different areas.
Facilities within a quarter mile of schools, and routes heavily used by children should use
a target of PLTS 1. This is because of the large number of children that may use the
system with little or no adult supervision. The area around elementary schools should
contain no PLTS 3 or 4 because of the associated safety concerns and the discouraging
effect that such facilities have on walking rates. Pedestrian facilities near middle and
high schools may include PLTS 2, since the students are in the older age group, but PLTS
1 routes are ideal.
Other land uses should also have a target of PLTS 1; these include downtown cores,
medical facilities, areas near assisted living/retirement centers, and transit stops.
Downtown cores, for example, should have wide sidewalks with street furniture.
Roadways near medical facilities and residential retirement complexes should have
sidewalks in good condition with adequate width.
Transit stops should have facilities that connect the passengers from the origin of their
trip to the destination of their trip. The PLTS should be overlaid with the typical ¼ mile
walking distance to transit for transit routes (or a roadway for a proposed route) to fully
show where PLTS 1 is desired.
When setting targets, looking at the end user is vital. The land use that surrounds a
corridor, pedestrian walking behavior, and local demographics will all influence the
target PLTS for a corridor.
14.5.4 PLTS Criteria

Analysis Procedure Manual Version 2 14-32 Last Updated 11/2018
PLTS measures are derived from the physical characteristics of the roadway segment and
intersection crossing. Pedestrians will go either direction on a sidewalk. If there is not a
sidewalk, pedestrians typically walk in the opposite direction of traffic and both sides of
the roadway should be classified.
The PLTS is broken into a number of different segment and crossing tables based on
several physical characteristics of the corridor.
Variable Definitions: To complete the segment PLTS analysis, information on six
different variables is used. The variable definitions are listed below:
Sidewalk5 Width: The physical width of the solid smooth surface (typically poured
concrete, but could be asphalt, brick, or concrete paver blocks) that pedestrians use. This
does not include solid surfaces that contain vegetation, additional lighting, street
furniture, parking meters, etc. If a sidewalk has frequent obstructions (posts, poles,
mailboxes, and encroaching vegetation) that limit the usable width, use the narrower or
effective width instead of the physical width.
Sidewalk Condition: The sidewalk condition is a visual high-level classification process
(see Exhibit 14-15). Sidewalk condition can vary within a block segment. Use the worst
sidewalk condition, as a section of poor sidewalk can block some users from using the
facility.
The criteria and pictures for each category are based off the Good-Fair-Poor (GFP)
Pavement Condition Rating Manual for Bicycle and Pedestrian Facilities and the
Pavement Distress Survey Manual developed by ODOT’s Pavement Services Unit. These
values are also generally compatible with the sidewalk condition ranking in ODOT’s
TransGIS tool. For each corridor segment the general pavement condition should be
considered. A sidewalk segment that contains a mix of different conditions should be
rated using the worst condition. For example, a sidewalk is smooth with only minor
cracking but has a very large fault caused by a tree root. The sidewalk would be
considered in “Very Poor” condition. For a sidewalk to be considered in ”Fair” condition,
none of the properties can be ”Poor” or “Very Poor” and at least one is in the “Fair”
category. For a sidewalk to be considered “Good”’ all of the criteria must be met and it
must be of relatively new construction. Additional examples are located in Appendix B.
5 Sidewalk refers to sidewalks, shared-use paths, and pedestrian paths. The methodology was designed to
be used for sidewalks but, can apply to other pedestrian facilities.
If obtaining data from ODOT’s online FACS_STIP or TransGIS tools for use in a
PLTS analysis, please be aware that there is no “Very Poor” equivalent at this time.
Analysts will need to field verify sidewalk sections marked as “Poor” to ensure that
there are no “Very Poor” sections within them.

Analysis Procedure Manual Version 2 14-33 Last Updated 11/2018
Exhibit 14-15 Sidewalk Condition Rating
Rating Facility Properties Example
Good No minor cracking
No patching or raveling
and has a very smooth
surface
No faulting
New construction
Fair Minor cracking
(generally hairline)
Minor patching and
possibly some minor
raveling evident. Surface
is generally smooth
Minor faulting (less than
¼”)
Poor Minor cracking in
several locations
Rough areas present but
not extensive
Faulting may be present
but less than ½” (No
major faulting)
Very Poor Major cracking patterns
Rough conditions (major
deterioration, raveling,
loose aggregate, missing
pavement, etc.)
Faulting greater than ½”
No
sidewalk No solid and smooth
surface is present on the
side of the roadway.
Pedestrians use the
travel lane, paved
shoulder, or soil
shoulder to travel along
the roadway.

Analysis Procedure Manual Version 2 14-34 Last Updated 11/2018
Physical Buffer Type: The
physical buffer is the
distance from the outside
edge of sidewalk to the edge
of pavement or curb. The
buffer type is categorized
into six major groups. This
area is also referred to as the
furniture or planter zone.
No Buffer: The
narrower sidewalk (<10 ft in
width) is adjacent to the curb
(curb tight). The facility may
still include a bike lane
and/or on street parking (see
total buffering width
distance).
Solid Surface: The buffer is a hard surface that can contain buffering elements
such as lighting, street furniture, parking meters, and bicycle racks. If the buffer is wide
enough, street trees can also be present which help improve the walking experience. The
buffer still allows people to maneuver to the roadway edge without leaving the solid
surface. The surface material can also change to indicate a buffer (i.e., stamped concrete,
pavers). Purely decorative buffers usually do not have any “furniture elements” in them.
A wide sidewalk (10+ feet) can also be itself a buffer even if there is no extra delineation.
Landscaped: the area between the edge of the sidewalk and the curb includes a
soil area with low shrubs or vegetation. The vegetation does not create a wall or reduce
pedestrian sight distance. These can also have a ditch, slope, or other topographical
feature.
Landscaped with trees: The area between the edge of the sidewalk and the curb
includes trees. Once the trees are mature, a canopy effect is created over the pedestrian
facility and the edge of roadway. Trees are spaced for heathy growing and sight distance
is not limited. This buffer type tends to be wider than a regular landscaped buffer and
also can have a ditch, slope, or other topographical feature included.
Vertical: A vertical buffer (i.e. retaining wall) elevates the pedestrian facility
higher than the roadway surface. This typically contains an additional fence or pedestrian
buffer facility.
Buffer
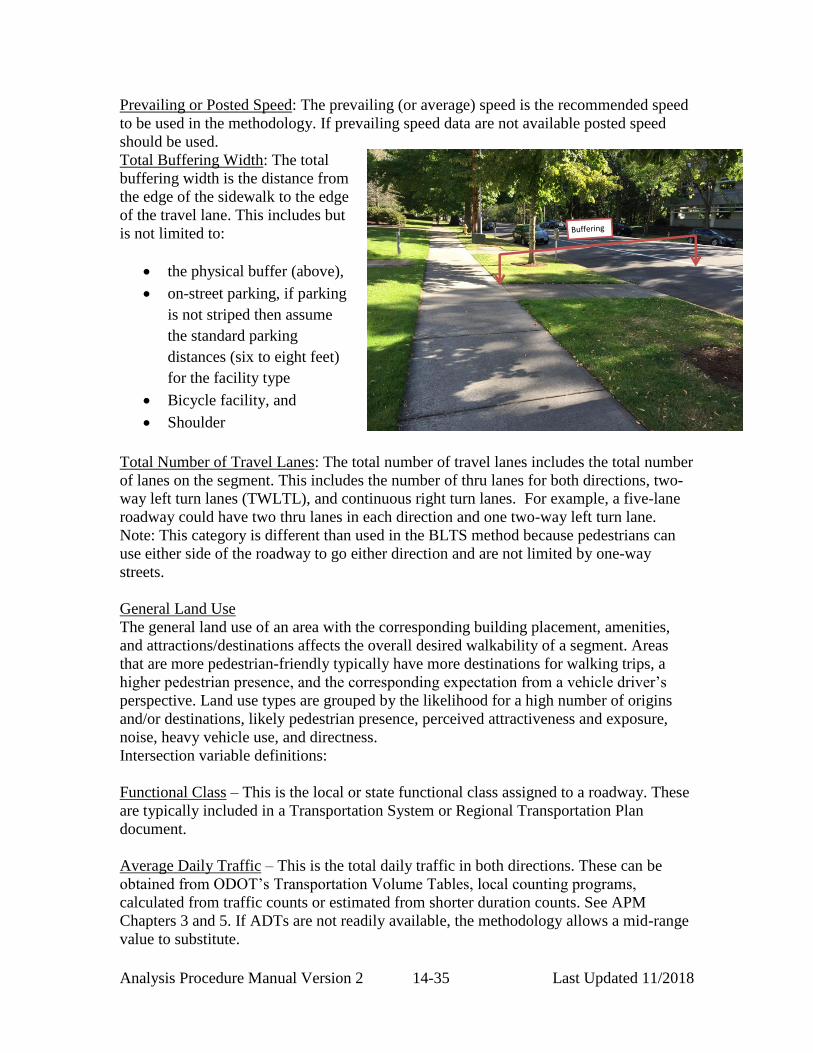
Analysis Procedure Manual Version 2 14-35 Last Updated 11/2018
Prevailing or Posted Speed: The prevailing (or average) speed is the recommended speed
to be used in the methodology. If prevailing speed data are not available posted speed
should be used.
Total Buffering Width: The total
buffering width is the distance from
the edge of the sidewalk to the edge
of the travel lane. This includes but
is not limited to:
the physical buffer (above),
on-street parking, if parking
is not striped then assume
the standard parking
distances (six to eight feet)
for the facility type
Bicycle facility, and
Shoulder
Total Number of Travel Lanes: The total number of travel lanes includes the total number
of lanes on the segment. This includes the number of thru lanes for both directions, two-
way left turn lanes (TWLTL), and continuous right turn lanes. For example, a five-lane
roadway could have two thru lanes in each direction and one two-way left turn lane.
Note: This category is different than used in the BLTS method because pedestrians can
use either side of the roadway to go either direction and are not limited by one-way
streets.
General Land Use
The general land use of an area with the corresponding building placement, amenities,
and attractions/destinations affects the overall desired walkability of a segment. Areas
that are more pedestrian-friendly typically have more destinations for walking trips, a
higher pedestrian presence, and the corresponding expectation from a vehicle driver’s
perspective. Land use types are grouped by the likelihood for a high number of origins
and/or destinations, likely pedestrian presence, perceived attractiveness and exposure,
noise, heavy vehicle use, and directness.
Intersection variable definitions:
Functional Class – This is the local or state functional class assigned to a roadway. These
are typically included in a Transportation System or Regional Transportation Plan
document.
Average Daily Traffic – This is the total daily traffic in both directions. These can be
obtained from ODOT’s Transportation Volume Tables, local counting programs,
calculated from traffic counts or estimated from shorter duration counts. See APM
Chapters 3 and 5. If ADTs are not readily available, the methodology allows a mid-range
value to substitute.

Analysis Procedure Manual Version 2 14-36 Last Updated 11/2018
14.5.5 PLTS Classifications
The PLTS criteria are broken into two primary sections. Table-based criteria are applied
separately for segments and intersection crossings. The follow sections outline the nine
tables used to classify the PLTS for a roadway. The first four tables are the roadway
segment criteria and the last five are for roadway intersections. The methodology uses the
worst overall PLTS value for each segment and intersection crossing. The worst (highest)
PLTS value of a series of segments and crossings will control a route.
Sidewalk Criteria
The condition and geometry of the sidewalk is the first criterion in the PLTS
methodology. The criterion splits sidewalks into greater than five feet and less than five
feet in width. The five foot condition is based on federal and state design codes and
recommendations. The federal standard for a sidewalk is five feet. In Oregon, the Oregon
Bicycle and Pedestrian Design Guide (OBPDG) states that the standard pedestrian zone is
six feet and those five feet may be acceptable in some areas (local and residential streets).
Short (<200’) sections can have widths as narrow as four feet. While sidewalks along a
state highway may need to be wider, sidewalks in central business districts of heavy used
pedestrian areas may also need to be wider. Guides such as the OBPDG and the Highway
Design Manual (HDM) should be referenced for more information.
Exhibit 14-16 uses the overall condition and the effective (useable) width of the sidewalk.
The purpose is to rate which groups of users can safely and comfortably utilize a facility.
A narrow (from obstructions or actual width) or low quality sidewalk will not be passable
for all user groups. The actual sidewalk width, especially if it is less than five feet, will
impact the use by disabled people while effective width rates the comfort and flow of
pedestrians along a sidewalk. The effective width is the simple average clear width of a
sidewalk segment rather than following the more-detailed Highway Capacity Manual
procedure.
Use the actual sidewalk width first in Exhibit 14-16 to see if the minimum actual width is
present, then check the effective width if the sidewalk is at least six feet wide to
determine the appropriate PLTS. If the effective width is less than five feet use the
corresponding actual width rows as obstructions will still cause impediments to disabled
users. A PLTS 1 sidewalk must be accessible to all users, have six effective feet or wider
path, and in good or fair condition. If a segment does not have illumination, consider
increasing the PLTS up one level. The impact of darkness requires increased awareness
for safety/security and especially if the sidewalk is in poor condition or is not present.
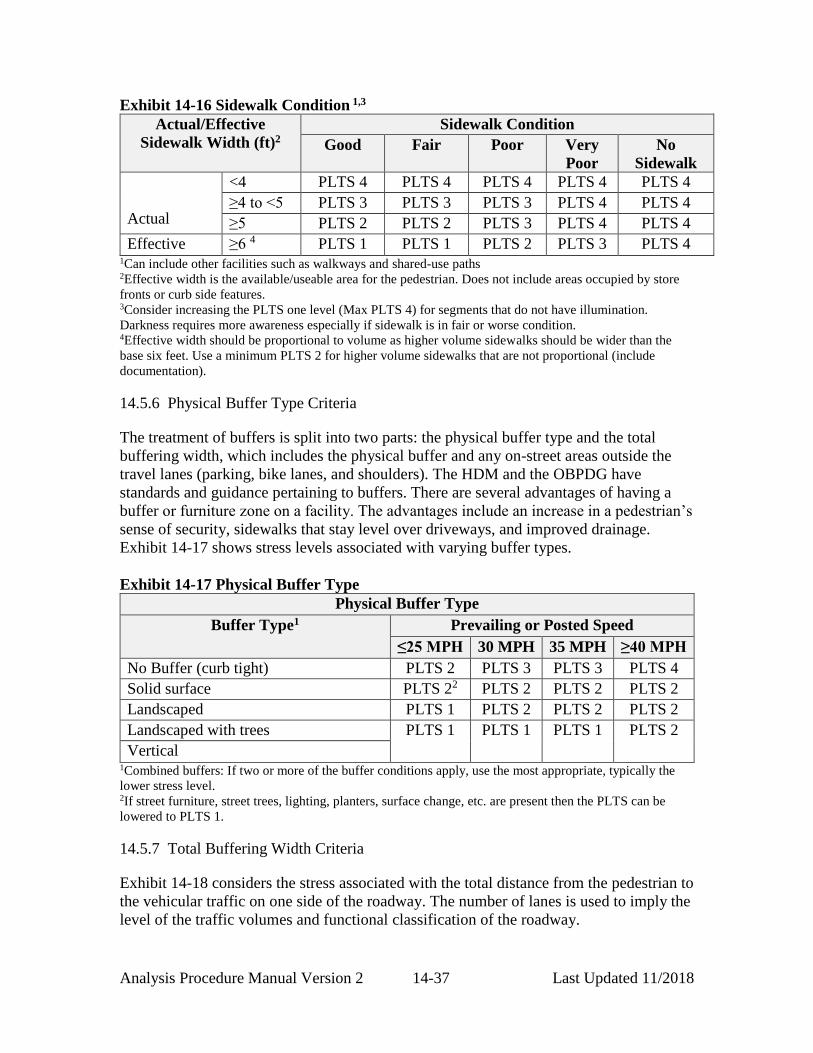
Analysis Procedure Manual Version 2 14-37 Last Updated 11/2018
Exhibit 14-16 Sidewalk Condition 1,3
Actual/Effective
Sidewalk Width (ft)2
Sidewalk Condition
Good Fair Poor Very
Poor
No
Sidewalk
Actual
<4 PLTS 4 PLTS 4 PLTS 4 PLTS 4 PLTS 4
≥4 to <5 PLTS 3 PLTS 3 PLTS 3 PLTS 4 PLTS 4
≥5 PLTS 2 PLTS 2 PLTS 3 PLTS 4 PLTS 4
Effective ≥6 4 PLTS 1 PLTS 1 PLTS 2 PLTS 3 PLTS 4 1Can include other facilities such as walkways and shared-use paths 2Effective width is the available/useable area for the pedestrian. Does not include areas occupied by store
fronts or curb side features. 3Consider increasing the PLTS one level (Max PLTS 4) for segments that do not have illumination.
Darkness requires more awareness especially if sidewalk is in fair or worse condition. 4Effective width should be proportional to volume as higher volume sidewalks should be wider than the
base six feet. Use a minimum PLTS 2 for higher volume sidewalks that are not proportional (include
documentation).
14.5.6 Physical Buffer Type Criteria
The treatment of buffers is split into two parts: the physical buffer type and the total
buffering width, which includes the physical buffer and any on-street areas outside the
travel lanes (parking, bike lanes, and shoulders). The HDM and the OBPDG have
standards and guidance pertaining to buffers. There are several advantages of having a
buffer or furniture zone on a facility. The advantages include an increase in a pedestrian’s
sense of security, sidewalks that stay level over driveways, and improved drainage.
Exhibit 14-17 shows stress levels associated with varying buffer types.
Exhibit 14-17 Physical Buffer Type
Physical Buffer Type
Buffer Type1 Prevailing or Posted Speed
≤25 MPH 30 MPH 35 MPH ≥40 MPH
No Buffer (curb tight) PLTS 2 PLTS 3 PLTS 3 PLTS 4
Solid surface PLTS 22 PLTS 2 PLTS 2 PLTS 2
Landscaped PLTS 1 PLTS 2 PLTS 2 PLTS 2
Landscaped with trees PLTS 1
PLTS 1
PLTS 1
PLTS 2
Vertical 1Combined buffers: If two or more of the buffer conditions apply, use the most appropriate, typically the
lower stress level. 2If street furniture, street trees, lighting, planters, surface change, etc. are present then the PLTS can be
lowered to PLTS 1.
14.5.7 Total Buffering Width Criteria
Exhibit 14-18 considers the stress associated with the total distance from the pedestrian to
the vehicular traffic on one side of the roadway. The number of lanes is used to imply the
level of the traffic volumes and functional classification of the roadway.
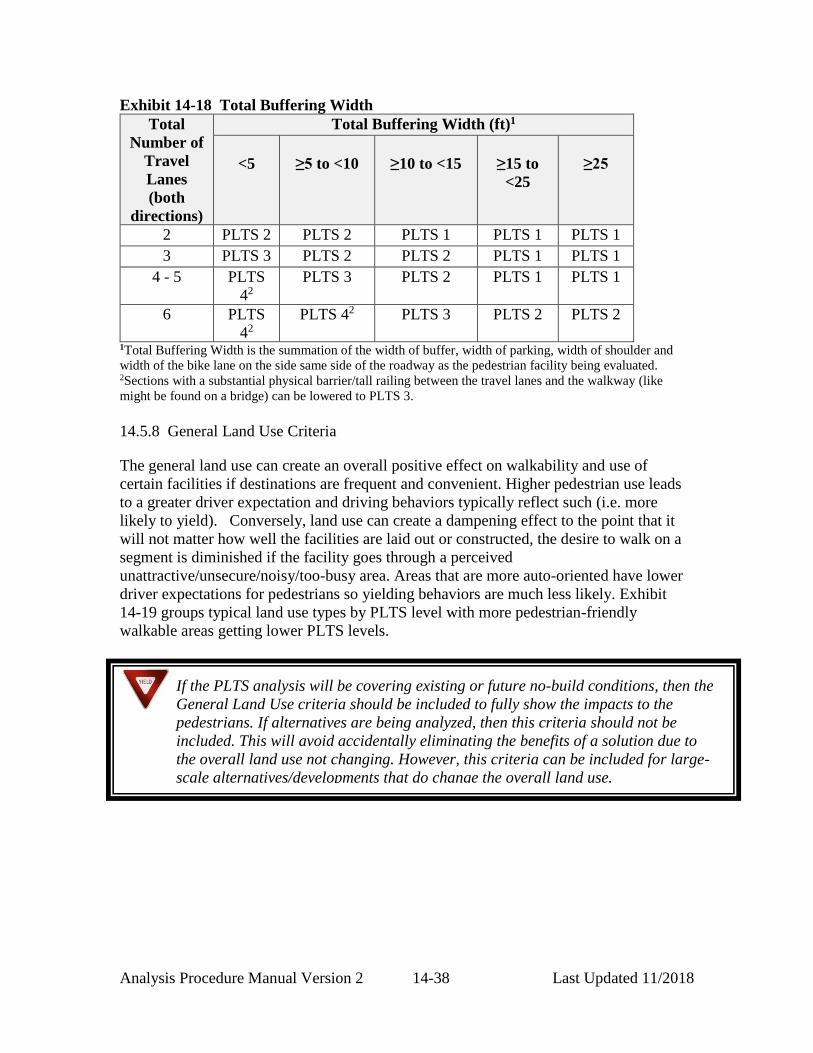
Analysis Procedure Manual Version 2 14-38 Last Updated 11/2018
Exhibit 14-18 Total Buffering Width
Total
Number of
Travel
Lanes
(both
directions)
Total Buffering Width (ft)1
<5
≥5 to <10
≥10 to <15
≥15 to
<25
≥25
2 PLTS 2 PLTS 2 PLTS 1 PLTS 1 PLTS 1
3 PLTS 3 PLTS 2 PLTS 2 PLTS 1 PLTS 1
4 - 5 PLTS
42
PLTS 3 PLTS 2 PLTS 1 PLTS 1
6 PLTS
42
PLTS 42 PLTS 3 PLTS 2 PLTS 2
1Total Buffering Width is the summation of the width of buffer, width of parking, width of shoulder and
width of the bike lane on the side same side of the roadway as the pedestrian facility being evaluated. 2Sections with a substantial physical barrier/tall railing between the travel lanes and the walkway (like
might be found on a bridge) can be lowered to PLTS 3.
14.5.8 General Land Use Criteria
The general land use can create an overall positive effect on walkability and use of
certain facilities if destinations are frequent and convenient. Higher pedestrian use leads
to a greater driver expectation and driving behaviors typically reflect such (i.e. more
likely to yield). Conversely, land use can create a dampening effect to the point that it
will not matter how well the facilities are laid out or constructed, the desire to walk on a
segment is diminished if the facility goes through a perceived
unattractive/unsecure/noisy/too-busy area. Areas that are more auto-oriented have lower
driver expectations for pedestrians so yielding behaviors are much less likely. Exhibit
14-19 groups typical land use types by PLTS level with more pedestrian-friendly
walkable areas getting lower PLTS levels.
If the PLTS analysis will be covering existing or future no-build conditions, then the
General Land Use criteria should be included to fully show the impacts to the
pedestrians. If alternatives are being analyzed, then this criteria should not be
included. This will avoid accidentally eliminating the benefits of a solution due to
the overall land use not changing. However, this criteria can be included for large-
scale alternatives/developments that do change the overall land use.
Analysis Procedure Manual Version 2 14-39 Last Updated 11/2018
Exhibit 14-19 General Land Use
PLTS Overall Land Use
1 Residential, central business districts (CBD), neighborhood
commercial, parks and other public facilities, governmental
buildings/plazas, offices/office parks
2 Low density development, rural subdivisions, un-incorporated
communities, strip commercial, mixed employment
3 Light industrial, big-box/auto-oriented commercial
4 Heavy industrial, intermodal facilities, freeway interchanges
14.5.9 Crossing Criteria
Unsignalized crossings at intersections or at mid-block can act as barriers to pedestrians,
especially where there are a high number of lanes or higher speeds. The crossing can be
an impediment to travel if the pedestrian has to cross four or more lanes at any speed or
has to cross a 35 mph (or greater) street. The criteria for unsignalized intersection
crossings depend on the functional class of the roadway, average daily traffic, speed
limit, number of lanes, and presence of a median of sufficient width to provide for a two-
stage crossing. Average daily traffic (ADT) of the roadway being crossed can be optional
if data are not available by using the footnoted columns in the following exhibits. Over
or underpasses are considered as separate facilities and are PLTS 1.
For functionally classified local and collector streets use Exhibit 14-20 for crossing with
and without a pedestrian median refuge. The vast majority of these roadways should be
under the 5,000 ADT limit for the table, but if it is known that a facility has an
abnormally high amount of traffic for its functional class (there also should be a count
performed on this section; See APM Chapter 3), it should be compared with Exhibit
14-23 or Exhibit 14-24. Also, if a collector-level roadway has more than two lanes or is
one-way, then Exhibit 14-23 or Exhibit 14-24 should be used.
Unsignalized crossings on functionally classified minor/major/principal arterial roadway
sections should use Exhibit 14-21 for crossings without pedestrian median refuges.
Sections with pedestrian refuge islands or are one-way should use Exhibit 14-23 and
Exhibit 14-24. If ADT is not available for a section (or not possible to be estimated), use
the midrange columns (as per table footnote) in these exhibits to find an appropriate
PLTS. Enhanced arterial crossings (with or without refuge islands) can use Exhibit 14-22
to lower the PLTS to a maximum two level reduction or minimum PLTS 2.
When a crossing lacks “standard” modern ramps, the facility is limited to able-bodied
users. A standard modern ramp will have a flatter grade, may have a level landing
surface, and some sort of detectable surface for visually impaired pedestrians (usually an
etched-in cross hatching). Current ADA-standard ramps have a thermoplastic “truncated
dome” insert attached to the ramp surface, so these are relatively easy to spot. Older
ramps with short and or steep grades (these almost never have any detectable surfaces)
are considered equivalent to no ramp at all. Impaired users will either not use the facility
or will be forced into an uncomfortable position by using the street via a nearby

Analysis Procedure Manual Version 2 14-40 Last Updated 11/2018
driveway. In these cases, the minimum PLTS is 3.
Pedestrian median refuges need to be at least six feet in width (10 feet for PLTS 1
eligibility) and have some sort of a raised concrete or vegetated island for protection.
Crossings at roundabouts should use PLTS 1 for a single lane crossing of an entry or exit
assuming that the splitter island is at least 10 feet wide, otherwise use PLTS 2. Two-lane
exits and entries are PLTS 2.
Increase the PLTS by one level (to a maximum PLTS 4) if the intersection or mid-block
crossing is not illuminated in Exhibits 14-20, 21, 23, and 24. Unlit crossings require more
awareness by the pedestrian as they are harder for drivers to see and/or expect in
darkness.

Analysis Procedure Manual Version 2 14-41 Last Updated 11/2018
Exhibit 14-20 Collector & Local Unsignalized Intersection Crossing 1, 2, 3, 4
Prevailing
Speed or
Speed Limit
(mph)
No Median Refuge Median Refuge Present
Total Lanes Crossed Maximum One Through/Turn
Lane Crossed per Direction 1 Lane 2 Lanes
≤ 25 PLTS 1 PLTS 1 PLTS 15
30 PLTS 1 PLTS 2 PLTS 1
35 PLTS 2 PLTS 2 PLTS 2
≥ 40 PLTS 3 PLTS 3 PLTS 3 1For street being crossed. 2Minimum PLTS 3 when crossing lacks standard ramps. 3Use Exhibit 14-23 or 14-24 for one-way streets, when ADT exceeds 5,000, or total number of lanes
exceeds two. 4Street may be considered a one-lane road when no centerline is striped and when oncoming
vehicles commonly yield to each other. 5Refuge should be at least 10 feet for PLTS 1, otherwise use PLTS 2 for refuges 6 to <10 feet.
Exhibit 14-21 Arterial Unsignalized Intersection Crossing Without a Median Refuge 1, 2
Prevailing Speed
or
Speed Limit
(mph)
Total Lanes Crossed (Both Directions)3
2 Lanes 3 Lanes
<5,000
vpd
5,000-
9,000
vpd4
>9,000
vpd
<8,000
vpd
8,000-
12,000 vpd4
>12,000
vpd
≤ 25 PLTS 2 PLTS 2 PLTS 3 PLTS 3 PLTS 3 PLTS 4
30 PLTS 2 PLTS 3 PLTS 3 PLTS 3 PLTS 3 PLTS 4
35 PLTS 3 PLTS 3 PLTS 4 PLTS 3 PLTS 4 PLTS 4
≥ 40 PLTS 3 PLTS 4 PLTS 4 PLTS 4 PLTS 4 PLTS 4 1For street being crossed. 2Minimum PLTS 3 when crossing lacks standard ramps. 3For one-way streets, use Exhibit 14-10 and 14-24. Use PLTS 4 for crossings of four or more lanes. 4Use these columns when ADT volumes are not available
Exhibit 14-22 Adjustments for Crosswalk Enhancements
Treatment Deduction Treatment Deduction
Markings1 0.5 In-street signs 1.0
Roadside signage1 0.5 Curb extensions 0.5
Lighting 0.5 Raised crosswalk 1.0
PAB 1.0 1Not applicable for roadways with pedestrian median refuges as crosswalk markings and roadside signage
assumed as part of the basic installation.

Analysis Procedure Manual Version 2 14-42 Last Updated 11/2018
Exhibit 14-23 Arterial Unsignalized Intersection Crossing (1 to 2 lanes) with a Median
Refuge 1, 2
Prevailing Speed
or
Speed Limit
(mph)
Maximum Through/Turn Lanes Crossed
per Direction
1 Lane 2 Lanes
Any <5,000 vpd 5,000-9,000 vpd4
>9,000 vpd
≤ 25 PLTS 13 PLTS 13 PLTS 2 PLTS 2
30 PLTS 2 PLTS 2 PLTS 2 PLTS 2
35 PLTS 2 PLTS 2 PLTS 2 PLTS 3
≥ 40 PLTS 3 PLTS 3 PLTS 3 PLTS 4 1For street being crossed. 2Minimum PLTS 3 when crossing lacks standard ramps. 3Refuge should be at least 10 feet for PLTS 1, otherwise use PLTS 2 for refuges 6 to <10 feet. 4Use these columns when ADT volumes are not available.
Exhibit 14-24 Arterial Unsignalized Intersection Crossing (3 or more lanes) with a
Median Refuge 1, 2
Prevailing Speed
or
Speed Limit
(mph)
Maximum Through/Turn Lanes Crossed
per Direction
3 Lanes 4+ Lanes
<8,000 vpd 8,000-12,000 vpd4
>12,000
vpd
Any
≤ 25 PLTS 13 PLTS 2 PLTS 3 PLTS 4
30 PLTS 2 PLTS 2 PLTS 3 PLTS 4
35 PLTS 3 PLTS 3 PLTS 4 PLTS 4
≥ 40 PLTS 4 PLTS 4 PLTS 4 PLTS 4 1For street being crossed. 2Minimum PLTS 3 when crossing lacks standard ramps. 3Refuge should be at least 10 feet for PLTS 1, otherwise use PLTS 2 for refuges 6 to <10 feet. 4Use these columns when ADT volumes are not available.
The PLTS to cross the major street is applied to the minor street in the direction of travel
along the route. If the crossing PLTS has a higher stress level than the minor street
segment PLTS, the crossing PLTS applies (controls) to that minor street segment.
Signalized crossings usually provide a protected way across the roadway and are
typically rated at PLTS 1 (i.e. midblock crossings with regular or HAWK-type signals).
The PLTS will be higher in areas if the following are evident:
Permissive left or right turns. Pedestrians will need to be more wary about the
potential for increased conflicts, so PLTS 2 is typically given in these cases.
Missing basic features such as lighting or countdown pedestrian signal heads will
increase the PLTS to PLTS 2.
Presence of complex elements will increase the PLTS to PLTS 3:

Analysis Procedure Manual Version 2 14-43 Last Updated 11/2018
o Multiple or narrow (less than six feet) refuge islands,
o No standard ramps,
o More than six total lanes crossed at once,
o Non-standard geometry (more than four legs, or highly skewed
approaches),
o Closed or limited crosswalks available; Free-flow or yield-controlled
channelized right turns
14.5.10Results
Mapping the PLTS for a community is a typical result from the analysis and can be easily
done using GIS. The map shows the gaps and barriers in the system which can be used to
inform stakeholders when creating a list of prioritized projects. The maps can also be
included in planning documents and used to help inventory the pedestrian facilities.
14.5.11Solutions to Decrease PLTS Level
There are several ways reduce PLTS and reach the chosen target for a roadway. Several
publications including the Oregon Bicycle and Pedestrian Design Guide, the ODOT
Traffic Manual, and the ODOT Highway Design Manual, includes design considerations
for pedestrian facilities. A few examples of actions that can reduce PLTS:
Installing pedestrian facilities, or expanding facilities where pedestrian routes
exist
Create paved surfaces where there are trails or worn paths are evident
Improving the condition of the sidewalk, including limiting vertical change and
smoothing the surface
Infilling gaps in sidewalk to create connectivity
Redesigning roadway to include wider or buffered sidewalks
Creating a multi-use path on high speed roadway
Significantly changing the roadway character and reducing speed limit
Installing additional crossing enhancements at unsignalized crossings (beacons,
lighting, curb extensions, etc.), r
removing barriers to connectivity
Redesigning buffer to include trees, large vegetation, and/or street furniture
Land use changes over time to encourage more pedestrian-scale developments
If the distance between crossing opportunities (i.e. signalized or a low-stress
unsignalized) is greater than approximately 0.10 mile, then the resulting out-of-
direction travel incurred by a pedestrian may be too great. This may deter or
impede travel along a segment if the desired route includes a major street crossing.

Analysis Procedure Manual Version 2 14-44 Last Updated 11/2018
Example 14-4 Pedestrian Level of Traffic Stress
The following section shows examples of corridor sections for each PLTS. All of the
examples are pedestrian facilities within the Salem city limits. The purpose of the
example is to illustrate different PLTSs.
Center Street at High Street
Street Name Center St at High St
Sidewalk Condition Fair
Width (ft) 12
Buffer Width (ft) 0
Buffer Type Solid Surface; street
trees present
Bike Lane Width (ft) 0
Parking Width (ft) 8
Roadway Number of Lanes 4
Posted Speed (mph) 30
Land Use Type Central business
district
Total Buffering Width (ft) 16
Center Street at High Street is located on a major roadway in downtown Salem. This
segment is within the Salem Center Mall District with storefronts along the street. The
segment contains a large 12 foot sidewalk with an effective width at least six feet and a
solid surface buffer with street trees which leads to PLTS 1 ratings in the sidewalk and
buffer type criteria. The total buffering width is just large enough to counteract the effect
of the four-lane roadway so the PLTS is 1. This location is within a central business
district so the general land use PLTS is 1. All of the categories are PLTS 1 so the overall
PLTS is 1.

Analysis Procedure Manual Version 2 14-45 Last Updated 11/2018
Street Name Center St at High St
Sidewalk Condition PLTS 1
Physical Buffer Type PLTS 1
Total Buffering Width PLTS 1
General Land Use PLTS 1
Final PLTS PLTS 1
If a mid-block crossing of Center Street was to be analyzed, then the functional class of
the roadway would need to be obtained. In this case, Center Street is an arterial. This is a
one-way four-lane section so ADT is not needed in the methodology. One-way sections
need to use the tables for arterial streets with median refuges as the total lanes crossed are
all in a single direction. The resulting PLTS would be 4 for a midblock crossing. This
compares to the PLTS of 2 for the adjacent signalized intersections with permissive turns.
Chemeketa Street between Capitol Street and 12th Street
Street Name Chemeketa St. between
Capitol St & 12th St
Sidewalk Condition Good
Width (ft) 5
Buffer Width (ft) 10
Buffer Type Landscaped with trees
Bike Lane Width (ft) 0
Parking Width (ft) 15
Roadway Number of Lanes 2
Posted Speed (mph) 25
Land Use Type Office/Residential
Total Buffering Width (ft) 25
Chemeketa Street serves as a low volume street connecting 12th Street to parking areas

Analysis Procedure Manual Version 2 14-46 Last Updated 11/2018
around the Capitol mall area. The sidewalk condition is rated as good as it is of newer
construction and has an actual width of five feet. This makes the facility a PLTS 2 under
the sidewalk condition. The physical buffer type is landscaped with trees and the roadway
has a 25 mph posted speed which makes the buffer PLTS 1. The total buffering width on
this side of the roadway is 25 feet and there are two lanes on the roadway. This leads to
the PLTS 1 for the total buffering width category. The general land use on this segment is
offices and high density residential so the PLTS is 1. The sidewalk condition controls so
the overall PLTS for this segment is 2.
Street Name Chemeketa St. between
Capitol & 12th St
Sidewalk Condition PLTS 2
Physical Buffer Type PLTS 1
Total Buffering Width PLTS 1
General Land Use PLTS 1
Final PLTS PLTS 2
If the adjacent intersection at 12th and Chemeketa were added to the segment, as would
be done if a route was being investigated, the intersection’s PLTS would not control over
the segment’s PLTS 2. This signalized intersection has permissive left turns, but is free of
complex elements, so the PLTS is 2, which is equal to the final segment PLTS.
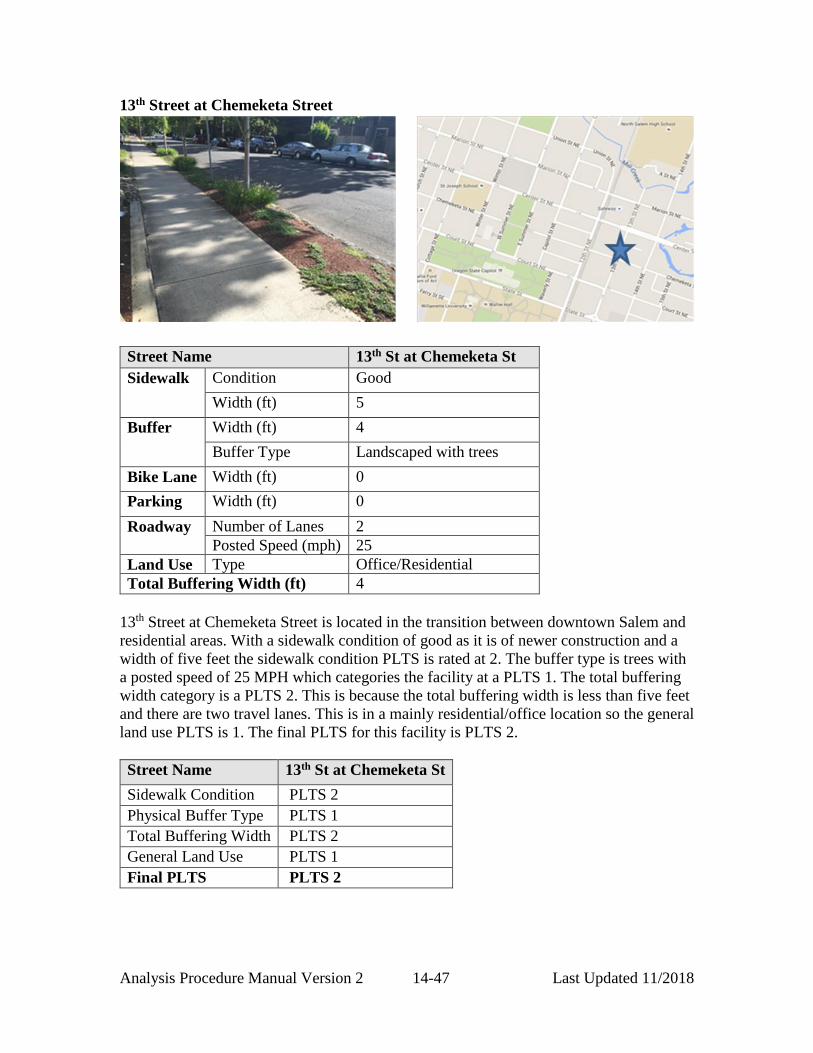
Analysis Procedure Manual Version 2 14-47 Last Updated 11/2018
13th Street at Chemeketa Street
Street Name 13th St at Chemeketa St
Sidewalk Condition Good
Width (ft) 5
Buffer Width (ft) 4
Buffer Type Landscaped with trees
Bike Lane Width (ft) 0
Parking Width (ft) 0
Roadway Number of Lanes 2
Posted Speed (mph) 25
Land Use Type Office/Residential
Total Buffering Width (ft) 4
13th Street at Chemeketa Street is located in the transition between downtown Salem and
residential areas. With a sidewalk condition of good as it is of newer construction and a
width of five feet the sidewalk condition PLTS is rated at 2. The buffer type is trees with
a posted speed of 25 MPH which categories the facility at a PLTS 1. The total buffering
width category is a PLTS 2. This is because the total buffering width is less than five feet
and there are two travel lanes. This is in a mainly residential/office location so the general
land use PLTS is 1. The final PLTS for this facility is PLTS 2.
Street Name 13th St at Chemeketa St
Sidewalk Condition PLTS 2
Physical Buffer Type PLTS 1
Total Buffering Width PLTS 2
General Land Use PLTS 1
Final PLTS PLTS 2

Analysis Procedure Manual Version 2 14-48 Last Updated 11/2018
D Street between Summer Street and Capitol Street (near Parrish Middle School)
Street Name D St between Summer St
& Capitol St
Sidewalk Condition Fair
Width (ft) 5
Buffer Width (ft) 0
Buffer Type n/a
Bike Lane Width (ft) 0
Parking Width (ft) 0
Roadway Number of Lanes 2
Posted Speed (mph) 30
Land Use Type Residential
Total Buffering Width (ft) 0
D Street between Summer Street and Capitol Street is located on the edge of downtown
Salem and Parrish Middle School in a residential area. The sidewalk is in fair condition.
There is no buffer between the sidewalk and the roadway. This, combined with the posted
speed of 30 mph, categorizes this facility at a PLTS 3 and is the controlling PLTS.
Street Name D St between
Summer & Capitol St
Sidewalk Condition PLTS 2
Physical Buffer Type PLTS 3
Total Buffering Width PLTS 2
General Land Use PLTS 1
Final PLTS PLTS 3
If a crossing of D Street was to be analyzed, then the following additional information
would be gathered:
Functional Class = Collector

Analysis Procedure Manual Version 2 14-49 Last Updated 11/2018
ADT = 1600 vehicles per day
Median refuge = Not present
Since D Street is a collector, ADT is not needed other than as a check to see that it is
under the 5000 veh/day limit (typically it can be assumed that collectors and lower are
under the limit without needing an ADT count to verify). Since there is no pedestrian
median refuge, both lanes are crossed at once on this 30 mph roadway which is a PLTS 1.
Chemeketa Street at 14th Street
Street Name Chemeketa St at 14th St
Sidewalk Condition Very Poor
Width (ft) 5
Buffer Width (ft) 8
Buffer Type Landscaped with trees
Bike Lane Width (ft) 0
Parking Width (ft) 7
Roadway Number of Lanes 2
Posted Speed
(mph)
25
Land Use Type Residential
Total Buffering Width (ft) 15
Chemeketa Street at 14th Street is an old residential street with poor sidewalk condition.
The sidewalk condition is very poor with several areas of substantial uplift and large
cracks. This leads to the PLTS rating of 4 for sidewalk condition as it will make it
impassable for disabled pedestrians and even difficult in spots for non-impaired
individuals. The posted speed is 25 mph and the buffer is a treed planter zone, so the
buffer type is rated as PLTS 1. The general land use is residential so this is a PLTS 1. The
total buffer width is 15 feet and the number of travel lanes is 2 for the roadway and
because of these attributes the total buffer distance PLTS is 2. The overall PLTS for this

Analysis Procedure Manual Version 2 14-50 Last Updated 11/2018
segment is PLTS 4.
Street Name Chemeketa St at 14th St
Sidewalk Condition PLTS 4
Physical Buffer Type PLTS 1
Total Buffering Width PLTS 2
General Land Use PLTS 1
Final PLTS PLTS 4
12th Street between Marion Street and Center Street
Street Name 12th St at Center St
Sidewalk Condition Poor
Width (ft) 3
Buffer Width (ft) 0
Buffer Type N/A
Bike Lane Width (ft) 0
Parking Width (ft) 0
Roadway Number of Lanes 4
Posted Speed (mph) 30
Land Use Type Mixed employment
Total Buffering Width (ft) 0
The 12th Street corridor is a moderate speed and volume facility in a mixed
commercial/office area. The sidewalks along the west side of the roadway are narrow at
three feet and in poor condition. This leads to a PLTS of 4 for sidewalk condition. There
is no buffer and speed of 30 mph on the roadway which leads to a PLTS 3 for the buffer
type. The total buffer distance is zero feet and the total number of travel lanes is four,
which is a PLTS 4 in the total buffer distance category. The general land use is a mix
between commercial uses, offices and large employee parking lots, so this would be
Analysis Procedure Manual Version 2 14-51 Last Updated 11/2018
generally PLTS 2. With one or more categories at PLTS 4, the segment of roadway is a
PLTS 4.
Street Name 12th St at Center St
Sidewalk Condition PLTS 4
Physical Buffer Type PLTS 3
Total Buffering Width PLTS 4
General Land Use PLTS 2
Final PLTS PLTS 4
If the adjacent intersections at 12th/Center and 12th/Marion were added to the segment as
would be done if a route was being investigated, neither intersection’s PLTS would
control the overall segment. Both signalized intersections have permissive turns, but are
free of complex elements and would have a PLTS of 2, but these are still lower than the
PLTS 4 for the segment.
14.6 Multimodal Level of Service
The Level of Service (LOS)–based methods presented in this section are intended for use
when a detailed analysis is desired such as in facility plans or projects when a no-build
alternative is compared to one or more build alternatives. These methods are not meant
for defining overall needs or making prioritization decisions, so those sorts of
applications should use the Qualitative Multimodal Assessment or Level of Traffic Stress
methodologies instead (see sections 14.2 to 14.4).
The Auto mode is not included as analysis at this level of detail would typically be done
at intersections with applications such as Synchro, Highway Capacity Software, or
Vistro. Application of the methodologies is via Excel-based calculators available on the
Transportation Development – Planning Technical Tools webpage.
14.6.1 Re-estimated Pedestrian & Bicycle Methodology Application
The pedestrian and bicycle procedures in this section are re-estimated versions of the
link-level full Highway Capacity Manual (HCM) 2010 Multimodal Level of Service
(MMLOS) methodologies. The use of probabilistic methodologies with the original
research data allowed the number of variables to be significantly reduced while
maintaining or improving accuracy of the results. These simplified procedures will still
produce a Level of Service (LOS) letter grade, will indicate the current “state of the
system, and can be done in a fraction of the time that the full MMLOS methodology
requires”.

Analysis Procedure Manual Version 2 14-52 Last Updated 11/2018
These procedures are intended for application on urban arterial (excluding
freeways)/collector-classed roadways. Roadways are segmented to ensure demand,
control, and geometry are relatively uniform within each segment. Caution should be
exercised if applying these on functionally classified local streets as results may not be
intuitive. The Qualitative Multimodal Assessment (QMA, see Section 14.3) should be
used for applications in other areas such as unincorporated communities and rural areas.
14.6.2 Pedestrian & Bicycle LOS Criteria
LOS scoring threshold criteria for pedestrian and bicycle modes are shown in Exhibit
14-25 which is based on the updated HCM values.
These methodologies only include link-level detail. There are a number of issues
with the intersection-level LOS in the full HCM MMLOS method that create non-
intuitive results when combined with the link-level LOS by obscuring or limiting
changes (the full method is rather insensitive to change compared to the links-only
portion). Non-HCM but consistent analysis procedures for capturing the LOS for
unsignalized and signalized street crossings for the bicycle and pedestrian modes
will be added at a later date.
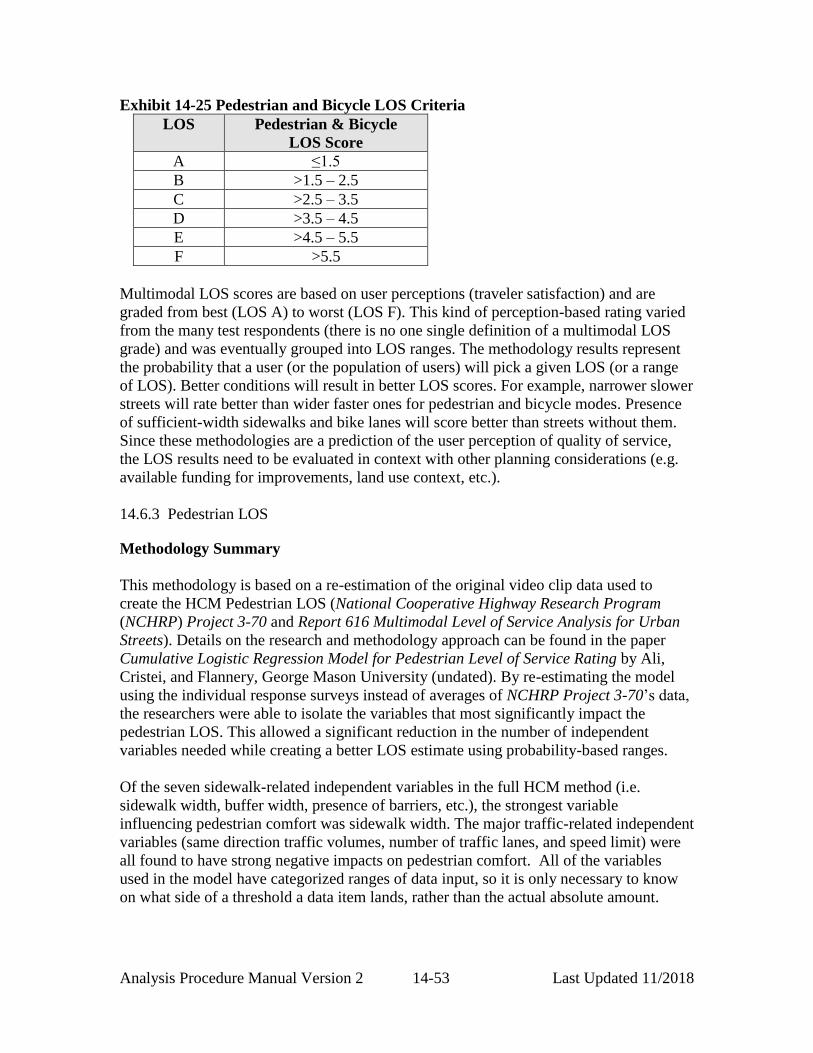
Analysis Procedure Manual Version 2 14-53 Last Updated 11/2018
Exhibit 14-25 Pedestrian and Bicycle LOS Criteria
LOS Pedestrian & Bicycle
LOS Score
A ≤1.5
B >1.5 – 2.5
C >2.5 – 3.5
D >3.5 – 4.5
E >4.5 – 5.5
F >5.5
Multimodal LOS scores are based on user perceptions (traveler satisfaction) and are
graded from best (LOS A) to worst (LOS F). This kind of perception-based rating varied
from the many test respondents (there is no one single definition of a multimodal LOS
grade) and was eventually grouped into LOS ranges. The methodology results represent
the probability that a user (or the population of users) will pick a given LOS (or a range
of LOS). Better conditions will result in better LOS scores. For example, narrower slower
streets will rate better than wider faster ones for pedestrian and bicycle modes. Presence
of sufficient-width sidewalks and bike lanes will score better than streets without them.
Since these methodologies are a prediction of the user perception of quality of service,
the LOS results need to be evaluated in context with other planning considerations (e.g.
available funding for improvements, land use context, etc.).
14.6.3 Pedestrian LOS
Methodology Summary
This methodology is based on a re-estimation of the original video clip data used to
create the HCM Pedestrian LOS (National Cooperative Highway Research Program
(NCHRP) Project 3-70 and Report 616 Multimodal Level of Service Analysis for Urban
Streets). Details on the research and methodology approach can be found in the paper
Cumulative Logistic Regression Model for Pedestrian Level of Service Rating by Ali,
Cristei, and Flannery, George Mason University (undated). By re-estimating the model
using the individual response surveys instead of averages of NCHRP Project 3-70’s data,
the researchers were able to isolate the variables that most significantly impact the
pedestrian LOS. This allowed a significant reduction in the number of independent
variables needed while creating a better LOS estimate using probability-based ranges.
Of the seven sidewalk-related independent variables in the full HCM method (i.e.
sidewalk width, buffer width, presence of barriers, etc.), the strongest variable
influencing pedestrian comfort was sidewalk width. The major traffic-related independent
variables (same direction traffic volumes, number of traffic lanes, and speed limit) were
all found to have strong negative impacts on pedestrian comfort. All of the variables
used in the model have categorized ranges of data input, so it is only necessary to know
on what side of a threshold a data item lands, rather than the actual absolute amount.

Analysis Procedure Manual Version 2 14-54 Last Updated 11/2018
Data Needs and Definitions
The simplified methodology uses four variables to estimate Pedestrian LOS. The analysis
is intended to be applied on road segments on a per direction basis like most HCM-based
methods. The variables and their category values are shown below:
Sidewalk (Actual) Width (0-5 ft or >5 ft)
Directional Traffic Volume (0-500 vph, 500-1500 vph, or >1500 vph)
Number of (Through) Traffic Lanes per direction (1, 2, 3, or 4)
(Posted) Speed Limit (20-40 mph or >40 mph)
Segments are at least defined between major (signalized) intersections or where the
threshold values change between categories. For example, a change from 30 to 35 mph
would not be significant in this method, but a change from 40 to 45 mph would be as the
value changes categories and a new segment would also need to be created. Similarly, if a
street had no sidewalks (zero feet in width) but had a section of six foot sidewalk in the
middle, then the street section would be broken into three segments (two 0-5 ft width
sections and one >5 ft width section). However, if the sidewalk section was a substandard
three foot width, then one overall segment would suffice.
Sidewalk width is the actual width, not the effective or clear width. The methodology
implicitly assumes the larger sidewalk widths may also include increased buffer space
with physical barriers (bike racks, meters, trees, etc.). These buffers and barriers
generally increase the overall comfort (assuming that any elements do not intrude into the
walking space) for a pedestrian resulting in better LOS levels.
The Directional Traffic Volume is intended to be consistent with the analysis peak hour
used for other analysis tasks, such as vehicle v/c ratio or LOS. It is possible that the final
pedestrian LOS may be different between different peak hours such as AM and PM.
Creation of the existing or future volumes should follow Chapter 5 or 6 using hourly
counts or appropriate reductions from daily counts.
The number of lanes per direction considers the impact of through and shared
through/turn lanes only. Ignore any center two-way left-turn lanes or exclusive turn lanes
as this methodology is only for segments and not for crossings. There is no difference in
the methodology between one-way and two-way segments except that all through lanes
would be considered on a one-way segment for each side of the roadway this is where the
three and four lanes per direction will be mostly applied to), instead of just half. The
speed limit used to select the category should be the posted or statutory limit (i.e. 20 mph
for downtown or 25 mph for residential areas, etc.).
The data values should be easily obtainable from inventories or aerial photographs.
Results can be shown in tables or in a GIS-created map figure. A network-wide LOS
could be estimated using a travel demand model with custom variables or expressions.
The directional volumes, speeds, and lanes are common base variables. The sidewalk
variable could be assumed, based on field data, or obtained from the model if it
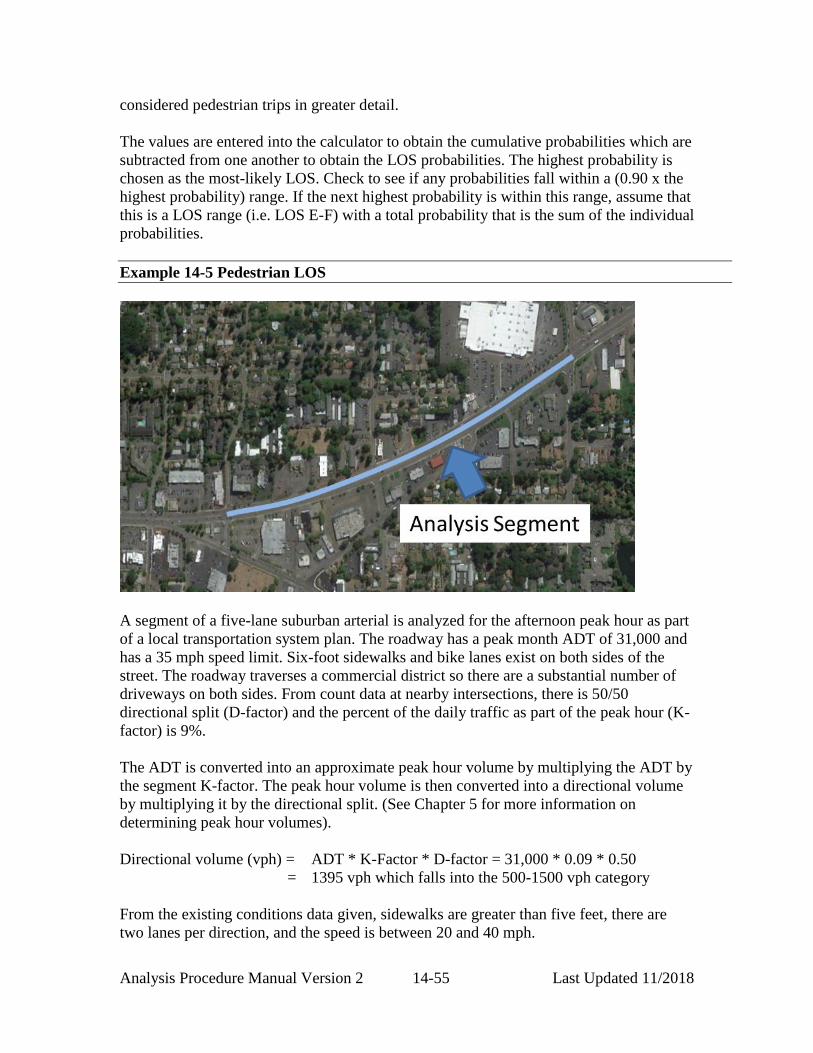
Analysis Procedure Manual Version 2 14-55 Last Updated 11/2018
considered pedestrian trips in greater detail.
The values are entered into the calculator to obtain the cumulative probabilities which are
subtracted from one another to obtain the LOS probabilities. The highest probability is
chosen as the most-likely LOS. Check to see if any probabilities fall within a (0.90 x the
highest probability) range. If the next highest probability is within this range, assume that
this is a LOS range (i.e. LOS E-F) with a total probability that is the sum of the individual
probabilities.
Example 14-5 Pedestrian LOS
A segment of a five-lane suburban arterial is analyzed for the afternoon peak hour as part
of a local transportation system plan. The roadway has a peak month ADT of 31,000 and
has a 35 mph speed limit. Six-foot sidewalks and bike lanes exist on both sides of the
street. The roadway traverses a commercial district so there are a substantial number of
driveways on both sides. From count data at nearby intersections, there is 50/50
directional split (D-factor) and the percent of the daily traffic as part of the peak hour (K-
factor) is 9%.
The ADT is converted into an approximate peak hour volume by multiplying the ADT by
the segment K-factor. The peak hour volume is then converted into a directional volume
by multiplying it by the directional split. (See Chapter 5 for more information on
determining peak hour volumes).
Directional volume (vph) = ADT * K-Factor * D-factor = 31,000 * 0.09 * 0.50
= 1395 vph which falls into the 500-1500 vph category
From the existing conditions data given, sidewalks are greater than five feet, there are
two lanes per direction, and the speed is between 20 and 40 mph.

Analysis Procedure Manual Version 2 14-56 Last Updated 11/2018
These four pieces of data are entered into the calculator and the highest probable result is
LOS C at 25.51%. Other close LOS possibilities indicated are LOS B at 21.48%, LOS D
at 21.29% and LOS E at 20.12%. The 10% significance check value (90% of the LOS C
value) is 22.96% which is greater than any of the other LOS probabilities, so the LOS C
value is reported as the final result for the first direction. The calculator will always
provide multiple segment probabilities for the purpose of helping the user decide which
LOS to report, rather than reporting just the highest probability.
LOS C has the greatest chance of selected as the user-perceived value. This also can be
thought over the percentage of the population that would view this as LOS C. Adding in
other ranges; about 50% would view this section as acceptable as LOS A-C while 50%
would view this section poorly as LOS D-F. LOS C is the approximate middle ground. A
50% poor probability is significant so some improvement is likely necessary for this
segment. The analysis is repeated for the second direction which will have the same
answer in this case as the conditions are symmetrical.
14.6.4 Bicycle LOS
Methodology Summary
This methodology is based on a re-estimation of the original video clip data used to
create the HCM Bicycle LOS in NCHRP Project 3-70 and Report 616. Details on the
research and methodology approach can be found in the paper Using Cumulative Logistic
Regression Model for Evaluating Bicycle Facilities on Urban Arterials” by Ali, Cristei,
and Flannery, George Mason University (undated).
By re-estimating the model using the individual response surveys instead of averages of
NCHRP Project 3-70’s data, the researchers were able to isolate the variables that most
significantly impact the Bicycle LOS. This allowed a significant reduction in the number
of independent variables needed while creating a better LOS estimate using probability-
based ranges. In addition, the issue with the coefficients in the full MMLOS method,
which generally prevent obtaining LOS A or B, has been eliminated.
Of the 13 independent variables in the full HCM method (e.g., volume, pavement
condition, etc.) in Project 3-70, only four were found to be significant in the re-
estimation. In addition, based on the validation in the research, it appears utilizing the
other nine variables does not warrant the level of effort needed to obtain them. In other
words, the time spent calculating pavement condition, heavy vehicles, percentage of on-
street occupied parking, etc. does not enhance the ability to obtain an accurate LOS. This
means, for many applications, there is no need to conduct further more-detailed Bicycle
Analysis Procedure Manual Version 2 14-57 Last Updated 11/2018
LOS analysis.
The method in this section is only meant for analysis applications on roadway sections
with shared-use vehicle lanes or regular bike lanes because of limitations in the original
research dataset. Higher speed/volume roadways will most likely score poorly and
indicate the need for some sort of separation of bicyclists from vehicular traffic.
Following future sections will be applicable to other facility types. The LOS of this
section would need to be compared with the generated LOS for other facility types to
either establish operational ranges or a single LOS for an alternative (LOS with shared
lane, LOS with bike lane, LOS with shared path, etc.). The Qualitative Assessment (see
Section 14.3) may be the best choice if more factors are desired to be included in a
facility plan analysis (See Section 14.2) without the limitations of the full MMLOS
method. The simplified re-estimated methodology is also consistent with the Bicycle
Level of Traffic Stress (see Section 14.4) if that method is used as a screening tool in a
detailed refinement plan or project effort as poor LOS levels will result in poor segment
stress levels and vice versa.
The major bicycle-related variables are presence or absence of a bike lane/usable paved
shoulder and the number of unsignalized conflicts per mile, both of which are responsible
for most of the variation in the LOS ratings from the response surveys and thus will have
the biggest impact on the LOS results. For example, a section of roadway without any
unsignalized driveway approaches could have a LOS D while the presence of driveways
drops the section to a LOS F. The most significant vehicle-traffic related variables are
the number of through traffic lanes and the posted speed limit, both of which have a
negative impact on bicyclist comfort. All of the variables used in the model have
categorized ranges of data input, so it is only necessary to know on which side of a
threshold is the particular data item, rather than the absolute value.
Data Needs and Definitions
The methodology uses four variables to estimate Bicycle LOS. The analysis is intended
to be applied on road segments on a per direction basis like most HCM-based methods.
Segments can be defined between major intersections or as desired. The variables and
their category values are shown below:
Number of Through Traffic Lanes per direction (1 or >1)
Bike Lane or Paved Shoulder Present (Yes or No)
(Posted) Speed Limit (<= 30 mph or >30 mph)
Unsignalized Conflicts (Yes or No)
Like with the Pedestrian LOS, segments should be created at least between major
intersections or when the variables change categories. For example, if the bike lane
disappears along a roadway then reappears later; a new segment is needed every time this
happens. Short sections should be highlighted and documented especially if they are due
to narrow bridges or other physical obstructions.

Analysis Procedure Manual Version 2 14-58 Last Updated 11/2018
The number of lanes per direction is for through and shared through/turn lanes only. An
exclusive turn lane could be considered if it extends the length of the segment. Ignore any
center two-way left-turn lanes or exclusive turn lanes as this methodology is only for
segments and not for crossings. A bike lane is assumed where there is a striped lane or
where a useable paved shoulder that allows the bicyclist to be direct conflict with traffic
exists. Mixed traffic conditions where there is no striped bike lane or shoulder stripe
should be assumed to fall into the “No” category. The speed limit used to select the
category should be the posted or statutory limit (i.e. 20 mph for downtown or 25 mph for
residential areas, etc.).
The unsignalized conflicts account for the impact of any unsignalized intersections or
driveways in the segment. All driveways (residential/commercial/industrial) should be
accounted for as each creates potential conflict locations regardless of driveway volume.
The data values should be easily obtainable from inventories or aerial photographs.
Results can be shown in tables or in a GIS-created map figure. A network-wide LOS
could be estimated using a travel demand model with some use of custom variables or
expressions. The directional speeds and lanes are common base variables. The
unsignalized conflict variable would likely need to be defaulted to “yes” unless the
facility segments were access–controlled and still legally allowed bikes. The bike lane
variable could be assumed, based on field data, or obtained from the model if it
considered bicycle trips in greater detail.
The values are entered into the calculator to obtain the cumulative probabilities which are
subtracted from one another to obtain the LOS probabilities. The highest probability is
chosen as the most-likely LOS. Check to see if any probabilities fall within a (0.90 x the
highest probability) range. The calculator will highlight any probability that falls within
90% of the highest value. If the next highest probability is within this range, assume that
this is a LOS range (i.e. LOS E-F) with a total probability that is the sum of the individual
probabilities.
This modal methodology has the highest occurrence of LOS ranges. Probabilities that are
greater than 10% apart can also be reported as a range. For example, LOS A is not
possible as a reported final LOS with the most favorable parameters, but it does have a
good likelihood of occurring. In this case, the final result could be reported as LOS B or
LOS A-B depending on the engineer’s judgment of the overall context of that particular
segment.
Example 14-6 Bicycle LOS
This example uses the same segment of roadway as described in the Pedestrian LOS
section. A segment of a five-lane suburban arterial is analyzed for the afternoon peak
hour as part of a local transportation system plan. The roadway has a 35 mph speed limit.
Six-foot sidewalks and bike lanes exist on both sides of the street. The roadway traverses
a commercial district so there are a substantial number of driveways on both sides.

Analysis Procedure Manual Version 2 14-59 Last Updated 11/2018
From the given data, the number of traffic lanes per direction exceeds one, there is a bike
lane present, the speed limit exceeds 30 mph and there are unsignalized intersection and
driveway conflicts.
The four data elements are added into the calculator and the highest probable result is
LOS F at 27.11% for the first direction. The 10% significance check (90% of LOS F) is
24.40%, which is about equal to the LOS E value at 24.41%. The calculator highlighted
the highest probability and any that fall within 90% of that value. The overall reported
result is a range and the probabilities added together which results in a 51% chance of a
LOS E-F.
The calculator will always provide multiple probabilities for every segment for the
purpose of helping the user decide which LOS to report rather than just reporting the
highest probability. In this case, the “Final LOS” column would need to be manually
overridden (as per the spreadsheet directions) to reflect a LOS E-F so it can be shown
correctly on the summary output sheet. The same LOS E-F result is computed for the
second direction as conditions are the same.
14.6.5 Separated Bikeways
The separated bikeway methodology augments the re-estimated HCM bicycle
methodology of the previous section by adding new facility types. Low-stress tolerant
users desire a greater degree of separation between them and the adjacent traffic stream.
The standard bike lane or even a buffered bike lane does not offer the amount of
separation needed especially for roadways with higher volume and/or speeds. Separated
bikeways (also known as cycle tracks or protected bike lanes) offer additional comfort
(lower stress) to the bicyclist by creating a vertical delineation between the bicycle lane
and the vehicle lanes and are a step up from a buffered bicycle lane. Vertical delineation
can be simple as a line of posts (candlesticks), to large planters, to physically separating
the bikeway with the vehicle parking strip. Exhibit 14-26 illustrates the differences in
separation for the typical bicycle facilities from least to most.
The LOS is relatively poor for sections of standard bike lanes on higher speed and/or
volume urban roadways, so adding a separated bikeway will allow for a better LOS. If a
previously conducted Bicycle Level of Traffic Stress analysis indicated system needs,
adding a separated bikeway on major routes can further enhance or help establish a low-
stress network. For separated bikeways to have the greatest benefit, they need to intersect
other lower-stress bicycle facilities such as bike boulevards, streets with standard bike or
buffered lanes, or even low-speed routes with sharrows rather than being an isolated
facility. Routes with established substantial bicycle volumes or more direct routes that
have limited use because of high-stress elements may be good candidates for separated
Analysis Procedure Manual Version 2 14-60 Last Updated 11/2018
bikeways. Separated bikeways appeal to the largest segment of current and potential
bicyclists, so having them in certain high-connectivity corridors should help to increase
the overall mode share along a route and increase the total amount of users.
The context of the corridor should be considered on whether separated bikeway is the
appropriate treatment. Not all roadways are suitable for separated bikeways. Separated
bikeways have the greatest benefit on roadways with no or limited driveways and wider
spaced intersections to maximize bicycle flow and minimize potential conflicts. Every
intersection and driveway is a point of conflict and can introduce safety and operational
issues especially when paired with adjacent parking. Parking between the travel lane and
the separated bikeway can create sight distance issues. If sight distance is not maintained
sufficiently (by prohibiting parking close to the intersection/driveway) then this may
encourage vehicles to creep out and block the bikeway while waiting to turn. Higher
volume and/or many driveways can substantially impede operations of bikes and increase
the risk of collisions. The parking can also create visibility issues for drivers to see
oncoming bicyclists (could be in both directions for a two-way bikeway) as they turn into
a driveway and across the bikeway. If access management solutions to
consolidate/minimize driveways are not possible, then a buffered bike lane may be more
appropriate in a parking and /or driveway dense location.
A constrained right-of-way, and/or existing features (e.g. number of driveways or parking
needs) may pose design challenges. This analysis should not be done in isolation as
safety shall be evaluated whether the features associated with the separated bikeway
treatment may affect bike users or another transportation mode’s safety. For example,
more substantial separators such as bollards or large planters could create a fixed-object
hazard for vehicles as they are close to the lane edge especially with higher speeds. The
analyst needs to discuss the applicability of separated bikeways with Region, Traffic-
Roadway Section, or local jurisdiction roadway/bicycle-pedestrian staff (as appropriate)
before pursuing a separated bikeway treatment.
Methodology Summary
This methodology is based on the paper, A Level-of-Service Model for Protected Bike
Lanes by Foster, Monsere, Dill and Clifton, Portland State University, 2014. The
research was based on recent video-clip data obtained in a similar manner as previous
HCM research efforts. The methodology uses the same cumulative logistic model form as
the re-estimated bike lane method (Section 14.5) so results will be consistent between the
two. The methodology is limited to segments only. Intersection crossings will be covered
in future sections.
The methodology does not cover roadways that have a substantial amount of driveways
and/or higher volume driveways as most of the research was based in central business
districts or residential areas where high numbers of driveways or high-volume driveways
or were uncommon. The most significant variables for estimating the performance of
separated bikeways are buffer type, direction of travel, and adjacent vehicle speed and
daily volume. The resulting LOS scores are based on user perceptions of each video clip
and are graded from best (LOS A) to worst (LOS F). The methodology results represent

Analysis Procedure Manual Version 2 14-61 Last Updated 11/2018
the probability that a user (or the population of users) will pick a given LOS (or a range
of LOS). Better conditions will result in better LOS scores. An Excel-based calculator is
available on ODOT’s Planning Section webpage.
Data Needs and Definitions
The methodology uses the following four variables to estimate the separated bikeway
LOS. The analysis is intended to be applied on road segments on a per direction basis like
most HCM-based methods. Segments with two-way separated bikeways only need to be
evaluated in one direction. The variables and their category values are shown below:
Buffer type (posts, planters, parking strip, raised/parking)
Direction of (bikeway) travel (one-way or two-way)
Adjacent vehicle speed (25 – 35 mph)
Average daily volume in both directions (9,000 – 30,000) vehicles per day
Segments are at least defined between major (signalized) intersections or where the
threshold values change between categories. For example, a change from 25 to 30 mph or
a change in vertical delineation type would be significant and a new segment would be
needed.
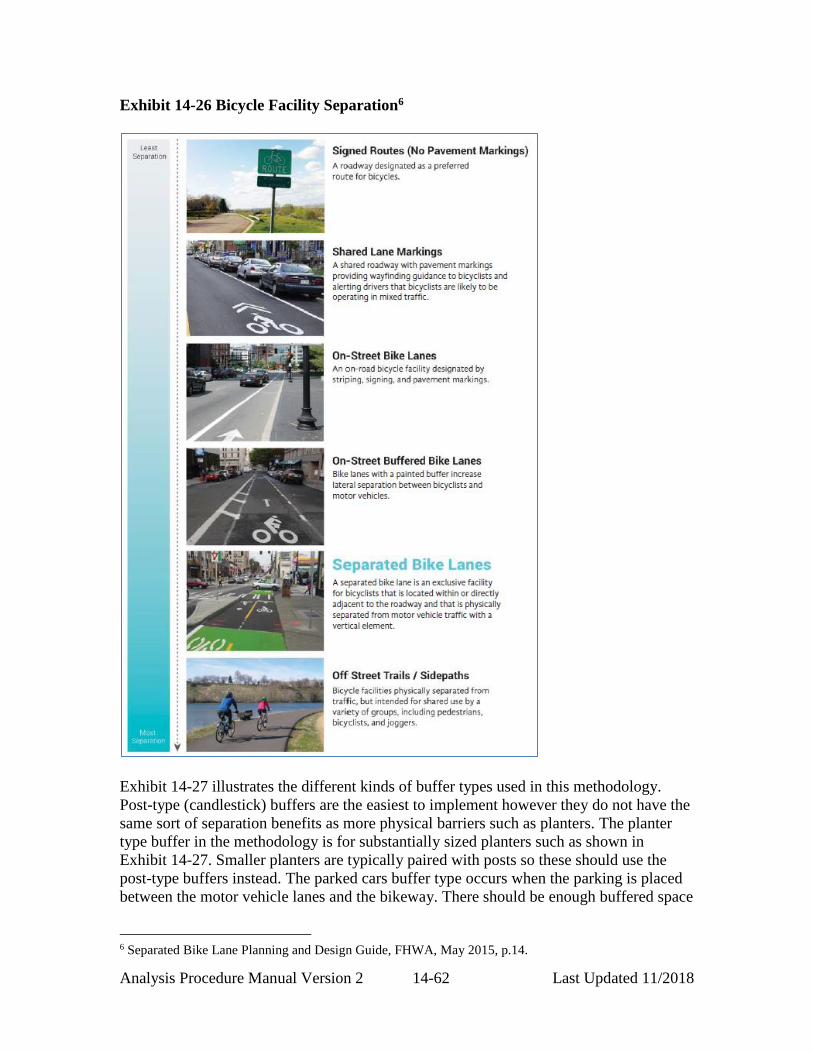
Analysis Procedure Manual Version 2 14-62 Last Updated 11/2018
Exhibit 14-26 Bicycle Facility Separation6
Exhibit 14-27 illustrates the different kinds of buffer types used in this methodology.
Post-type (candlestick) buffers are the easiest to implement however they do not have the
same sort of separation benefits as more physical barriers such as planters. The planter
type buffer in the methodology is for substantially sized planters such as shown in
Exhibit 14-27. Smaller planters are typically paired with posts so these should use the
post-type buffers instead. The parked cars buffer type occurs when the parking is placed
between the motor vehicle lanes and the bikeway. There should be enough buffered space
6 Separated Bike Lane Planning and Design Guide, FHWA, May 2015, p.14.

Analysis Procedure Manual Version 2 14-63 Last Updated 11/2018
so open vehicle doors do not interfere with the bicyclist’s path. Some designs have the
separated bikeway raised slightly higher than the adjacent travel lanes but less than the
adjacent sidewalk. If parking is provided along this type then the parking is raised to the
same level as the bikeway. This configuration is also known as a raised bike lane. Raised
bike lanes were included in the study but not called out as their own buffer type as there
were not enough separate sites. These should use the “raised/parking” buffer type as an
equivalent.
Exhibit 14-27 Separated Bikeway Buffer Types7
Most separated bikeways are one-way in the direction of roadway travel but there are
situations such as on a one-way street where a contra-flow bikeway is desired to limit
out-of-direction travel. Separated bikeways in these cases are typically two-way facilities.
Two-way separated bikeways require more considerations regarding intersections and
driveways, so coordination with ODOT Region and/or Traffic-Roadway Section staff is
necessary.
The methodology is limited to speeds between 25 and 35 mph and ADT values between
9,000 and 30,000 vehicles per day and thus will be limited in most cases to arterials in
denser urban locations. Use caution if values extend outside of these limits. Higher
volumes and speeds than the methodology limits will tend to make the LOS better than
expected while lower volumes and speeds will make the LOS worse than expected.
Lower speed and lower volume roadways will be more applicable to shared markings, a
7 Images from Separated Bike Lane Planning and Design Guide, FHWA, May 2015, pp. 83-87.
Posts Parked cars
RaisedPlanters
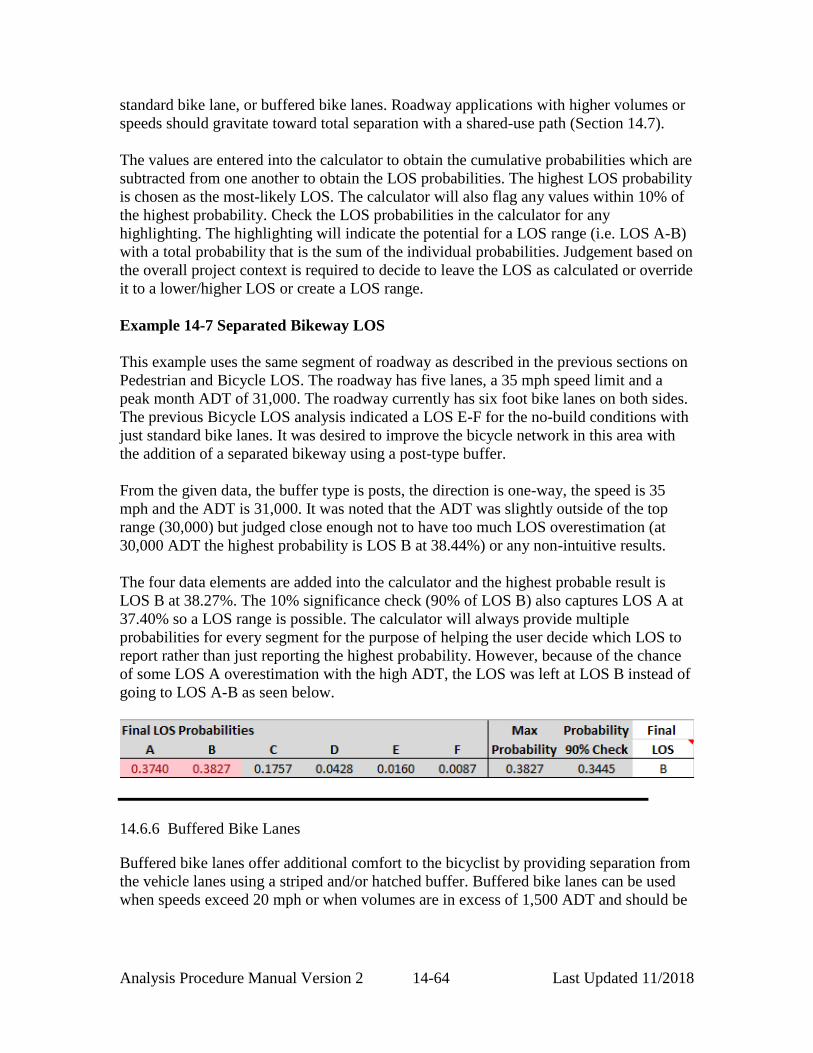
Analysis Procedure Manual Version 2 14-64 Last Updated 11/2018
standard bike lane, or buffered bike lanes. Roadway applications with higher volumes or
speeds should gravitate toward total separation with a shared-use path (Section 14.7).
The values are entered into the calculator to obtain the cumulative probabilities which are
subtracted from one another to obtain the LOS probabilities. The highest LOS probability
is chosen as the most-likely LOS. The calculator will also flag any values within 10% of
the highest probability. Check the LOS probabilities in the calculator for any
highlighting. The highlighting will indicate the potential for a LOS range (i.e. LOS A-B)
with a total probability that is the sum of the individual probabilities. Judgement based on
the overall project context is required to decide to leave the LOS as calculated or override
it to a lower/higher LOS or create a LOS range.
Example 14-7 Separated Bikeway LOS
This example uses the same segment of roadway as described in the previous sections on
Pedestrian and Bicycle LOS. The roadway has five lanes, a 35 mph speed limit and a
peak month ADT of 31,000. The roadway currently has six foot bike lanes on both sides.
The previous Bicycle LOS analysis indicated a LOS E-F for the no-build conditions with
just standard bike lanes. It was desired to improve the bicycle network in this area with
the addition of a separated bikeway using a post-type buffer.
From the given data, the buffer type is posts, the direction is one-way, the speed is 35
mph and the ADT is 31,000. It was noted that the ADT was slightly outside of the top
range (30,000) but judged close enough not to have too much LOS overestimation (at
30,000 ADT the highest probability is LOS B at 38.44%) or any non-intuitive results.
The four data elements are added into the calculator and the highest probable result is
LOS B at 38.27%. The 10% significance check (90% of LOS B) also captures LOS A at
37.40% so a LOS range is possible. The calculator will always provide multiple
probabilities for every segment for the purpose of helping the user decide which LOS to
report rather than just reporting the highest probability. However, because of the chance
of some LOS A overestimation with the high ADT, the LOS was left at LOS B instead of
going to LOS A-B as seen below.
14.6.6 Buffered Bike Lanes
Buffered bike lanes offer additional comfort to the bicyclist by providing separation from
the vehicle lanes using a striped and/or hatched buffer. Buffered bike lanes can be used
when speeds exceed 20 mph or when volumes are in excess of 1,500 ADT and should be
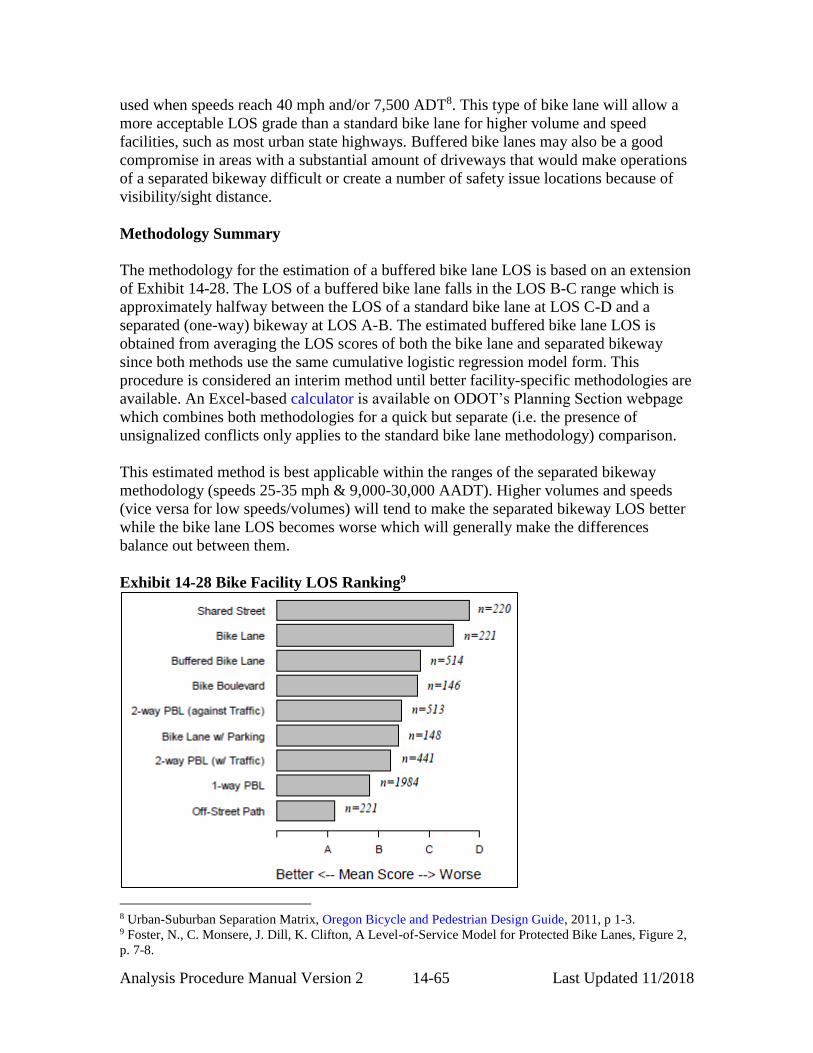
Analysis Procedure Manual Version 2 14-65 Last Updated 11/2018
used when speeds reach 40 mph and/or 7,500 ADT8. This type of bike lane will allow a
more acceptable LOS grade than a standard bike lane for higher volume and speed
facilities, such as most urban state highways. Buffered bike lanes may also be a good
compromise in areas with a substantial amount of driveways that would make operations
of a separated bikeway difficult or create a number of safety issue locations because of
visibility/sight distance.
Methodology Summary
The methodology for the estimation of a buffered bike lane LOS is based on an extension
of Exhibit 14-28. The LOS of a buffered bike lane falls in the LOS B-C range which is
approximately halfway between the LOS of a standard bike lane at LOS C-D and a
separated (one-way) bikeway at LOS A-B. The estimated buffered bike lane LOS is
obtained from averaging the LOS scores of both the bike lane and separated bikeway
since both methods use the same cumulative logistic regression model form. This
procedure is considered an interim method until better facility-specific methodologies are
available. An Excel-based calculator is available on ODOT’s Planning Section webpage
which combines both methodologies for a quick but separate (i.e. the presence of
unsignalized conflicts only applies to the standard bike lane methodology) comparison.
This estimated method is best applicable within the ranges of the separated bikeway
methodology (speeds 25-35 mph & 9,000-30,000 AADT). Higher volumes and speeds
(vice versa for low speeds/volumes) will tend to make the separated bikeway LOS better
while the bike lane LOS becomes worse which will generally make the differences
balance out between them.
Exhibit 14-28 Bike Facility LOS Ranking9
8 Urban-Suburban Separation Matrix, Oregon Bicycle and Pedestrian Design Guide, 2011, p 1-3. 9 Foster, N., C. Monsere, J. Dill, K. Clifton, A Level-of-Service Model for Protected Bike Lanes, Figure 2,
p. 7-8.
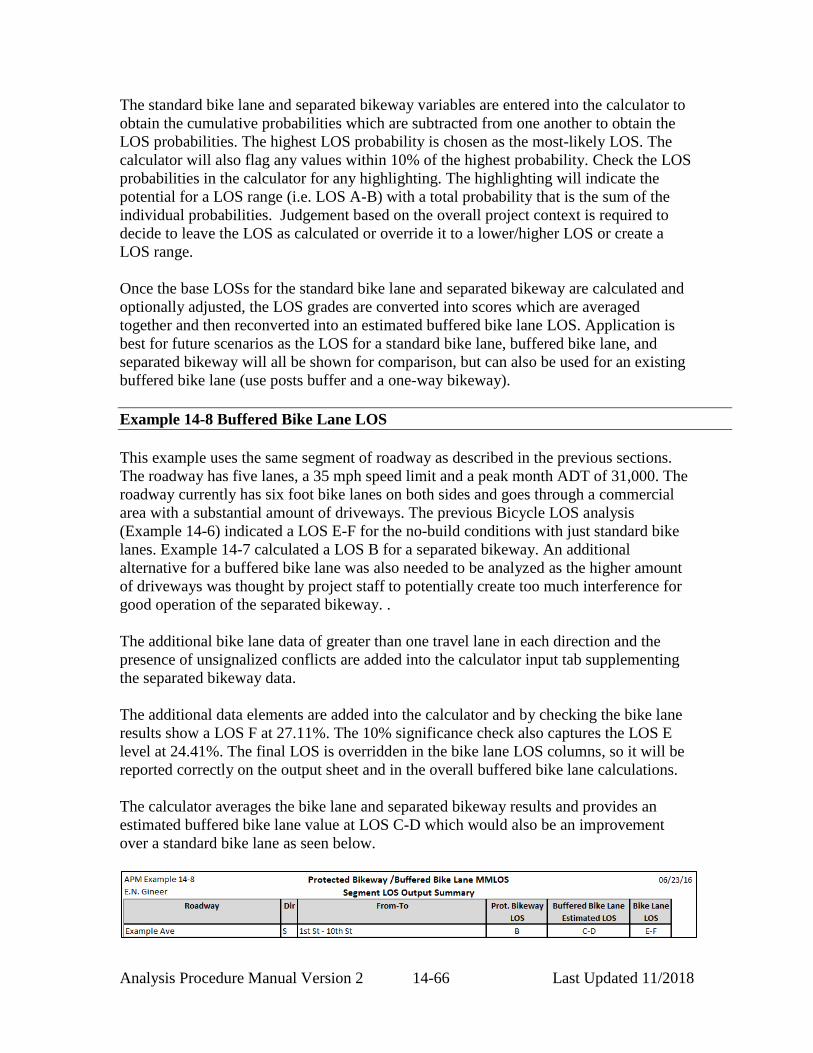
Analysis Procedure Manual Version 2 14-66 Last Updated 11/2018
The standard bike lane and separated bikeway variables are entered into the calculator to
obtain the cumulative probabilities which are subtracted from one another to obtain the
LOS probabilities. The highest LOS probability is chosen as the most-likely LOS. The
calculator will also flag any values within 10% of the highest probability. Check the LOS
probabilities in the calculator for any highlighting. The highlighting will indicate the
potential for a LOS range (i.e. LOS A-B) with a total probability that is the sum of the
individual probabilities. Judgement based on the overall project context is required to
decide to leave the LOS as calculated or override it to a lower/higher LOS or create a
LOS range.
Once the base LOSs for the standard bike lane and separated bikeway are calculated and
optionally adjusted, the LOS grades are converted into scores which are averaged
together and then reconverted into an estimated buffered bike lane LOS. Application is
best for future scenarios as the LOS for a standard bike lane, buffered bike lane, and
separated bikeway will all be shown for comparison, but can also be used for an existing
buffered bike lane (use posts buffer and a one-way bikeway).
Example 14-8 Buffered Bike Lane LOS
This example uses the same segment of roadway as described in the previous sections.
The roadway has five lanes, a 35 mph speed limit and a peak month ADT of 31,000. The
roadway currently has six foot bike lanes on both sides and goes through a commercial
area with a substantial amount of driveways. The previous Bicycle LOS analysis
(Example 14-6) indicated a LOS E-F for the no-build conditions with just standard bike
lanes. Example 14-7 calculated a LOS B for a separated bikeway. An additional
alternative for a buffered bike lane was also needed to be analyzed as the higher amount
of driveways was thought by project staff to potentially create too much interference for
good operation of the separated bikeway. .
The additional bike lane data of greater than one travel lane in each direction and the
presence of unsignalized conflicts are added into the calculator input tab supplementing
the separated bikeway data.
The additional data elements are added into the calculator and by checking the bike lane
results show a LOS F at 27.11%. The 10% significance check also captures the LOS E
level at 24.41%. The final LOS is overridden in the bike lane LOS columns, so it will be
reported correctly on the output sheet and in the overall buffered bike lane calculations.
The calculator averages the bike lane and separated bikeway results and provides an
estimated buffered bike lane value at LOS C-D which would also be an improvement
over a standard bike lane as seen below.

Analysis Procedure Manual Version 2 14-67 Last Updated 11/2018
14.6.7 Shared-use Paths
Methodology Summary
This methodology is a full application of the Highway Capacity Manual (HCM) 2010
Chapter 23 method on paved shared-use (multi-use) paths. Use this methodology with
caution on unpaved paths as the research only contained data from paved paths. A
shared-use path is completely separated from roadway traffic for the use of non-
motorized modes. Typically these paths have at least 35 feet of separation from an
adjacent roadway, but they may be closer if the barrier between the path and roadway is
substantial (i.e. soundwall, retaining wall, etc.) so that the effect of vehicular traffic is
limited. Paths may also be on their own separate right-of-way, such as along a creek in a
greenway. Paths with lesser buffers should be considered a protected bikeway or
sidewalk and analyzed with the other methods in this chapter. This methodology is
intended to work in concert with the other HCM-based “streamlined” and other segment
and intersection methodologies in this chapter. More information on shared-use paths is
available in Chapter 7 of the Oregon Bicycle and Pedestrian Design Guide.
The methodology considers the impacts on pedestrians and bicyclists by other path users
mainly through the accounting of passing (overtaking) and meeting events considering
volumes, speeds and densities. The path segment is divided into very small 0.01 mile
pieces and impact of the approaching other users (pedestrians, adult and child bicyclists,
runners and inline skaters) on a bicyclist is measured for each piece and then summed
across the entire path segment. Impact on pedestrian users is handled more simply by
considering flow rates of all path users and the relative difference between the average
pedestrian and bicycle speeds. Both bicycle and pedestrian methods measure crowding on
a path segment and how much interference there will be from passing, meeting, or being
forced to wait to pass. The methodology is segment-based so segments should start and
end at path junctions, intersections with roadways or where path width changes
substantially.
Application of the shared-use path method needs to be done via an Excel-based calculator
provided on the Transportation Development – Planning Technical Tools webpage as the
math and statistical work required is too much for simple hand calculations. This
methodology works equally well for analysis of existing or future paths. For planning
applications (proposed paths or changes to existing ones) most of the inputs can be
estimated. For actual project and detailed refinement planning efforts it is recommended
that most of the inputs come from actual design/field values. For analysis of intersections
of shared-use paths at unsignalized or signalized roadway crossings, please refer to
(future) Sections 14.5 through 14.7.
LOS Criteria
The applicable LOS criteria and descriptions for shared-use paths come from HCM
Exhibits 23-4 and 23-5 which are combined into Exhibit 14-29 and Exhibit 14-30 below.

Analysis Procedure Manual Version 2 14-68 Last Updated 11/2018
The LOS criteria is mainly based on recreational users which considers the influence of
child bicyclists, runners, skaters and walkers in addition to the bicyclist mode. More user
conflicts (passings and meetings) will result in lower LOS grades. A poor LOS indicates
less user satisfaction versus a chance of a potential route shift. Since a shared path will
generally offer the lowest stress route, route shifting is unlikely unless there are nearby
adjacent routes without out-of-direction travel and the path carries high amount of high-
stress tolerant (commuter) bicyclists that could travel comfortably on an on-street bike
facility. Poor LOS grades generally indicate that the path is too narrow for the amount of
existing or projected users.
This method and LOS criteria assume that users stay on the path surface, especially while
being passed. Frequent observations of side-stepping or use of the “shoulder” area may
indicate a path that is too narrow and/or is reaching capacity regardless of the LOS results
obtained. Also, the LOS criteria are based on user comfort and do not give any specific
indication that the facility is compliant with the Americans with Disabilities Act (ADA)
or other design standards.
Exhibit 14-29 Pedestrian and Bicycle LOS Criteria
LOS Pedestrian
Weighted Event Rate per hour
Bicycle LOS Score
A <=38 >4.0
B >38 - 60 >3.5 – 4.0
C >60 - 103 >3.0 – 3.5
D >103 - 144 >2.5 – 3.0
E >144 - 180 >2.0 – 2.5
F >180 <=2.0
Exhibit 14-30 Pedestrian and Bicycle LOS User Description
LOS Pedestrian LOS Description Bicycle LOS Description
A Optimum conditions, bicycle
conflicts rare
Optimum conditions, ample ability to
absorb more riders
B Good conditions, few bicycle
conflicts
Good conditions, some ability to absorb
more riders
C Difficult to walk two abreast Meets current demand, marginal ability
to absorb more riders
D Frequent bicycle conflicts Many conflicts, some reduction in
bicycle travel speed
E Frequent and disruptive bicycle
conflicts
Very crowded, significant reduction in
bicycle travel speed
F Significant conflicts, diminished experience
Data Needs and Definitions
These are the inputs and definitions as used in the methodology and the available
calculator.

Analysis Procedure Manual Version 2 14-69 Last Updated 11/2018
Shared-use Path Volume (users per hour) – This is the total of the non-motorized
mode users on the specific shared-use path segment in both directions. User modes
include adult and child bicyclists, pedestrians, runners and (inline) skaters. This value
may be estimated through demographics/available planning documents or from an actual
count (required for design purposes) for existing conditions. Future conditions could be
obtained from using historical bicycle/pedestrian count data or post-processed
assignments/mode splits in a metropolitan area travel demand model. Volume changes of
more than 10% should be broken into a new path segment.
Highest Directional Split – Expressed as a decimal, this is the highest total directional
flow percentage (i.e. 0.57) within the hour of analysis on the segment. Path use may be
dominated by commuter, recreational, or multi-purpose flows. If directional counts and
resulting flows are not available, then reasonable defaults can be assumed (0.55) for
commuter and (0.50) for recreational and multi-purpose (mixed) uses.
Peak Hour Factor – See APM Section 5.8 for the definition and example calculations.
For this to be obtained explicitly in this method, counts with 15-minute breakdowns are
required which may not be a common specification for bike/pedestrian counts. A default
PHF can be assumed where detailed counts are not available (0.90 to 1.00) depending on
whether this particular path segment is subject to peaking characteristics. Highly urban
areas, biking/walking friendly areas, commuter corridors, or nearby employers with high
non-motorized modal users may cause noticeable peaking on certain segments.
Segment Length (miles) – This is the length of a segment between path junctions, street
crossings, any location where the volume changes by more than 10%, or path surface
width changes.
Path Width (feet) – This is the width of the path surface. The minimum width is eight
feet and the maximum width is 20 feet as defined in this methodology. Paths less than
eight feet wide become too-narrow to function as a true multi-use path as passing
becomes challenging (typically a user has to step to the side) and are really closer to a
pedestrian foot-path. The desirable width is 12 feet but can go as low as eight feet for
pinch points with low volume and as much as 20 feet for high volume paths according to
the Oregon Bicycle and Pedestrian Design Guide. A change of one foot or more should
be broken into a new segment. For a given volume, changing of width on narrower paths
will have more impact than on wider ones.
Centerline Presence – This indicates whether a path has a marked centerline. This is a
Yes/No choice in the Input tab in the calculator tool. A marked centerline can constrain
the maneuverability freedom of users and results in lower LOS scores.
User Mode Default Parameters – The calculator assumes defaults for mode split,
average mode speed, mode speed standard deviation, and mode passing distance from the
HCM. These can be completely updated if detailed information is available or at the very
least, the mode split can be proportionally changed to reflect the typical path users or area
demographics.

Analysis Procedure Manual Version 2 14-70 Last Updated 11/2018
Example 14-9 Pedestrian & Bicycle LOS
A section of paved shared-use path links two arterials along a creek-side greenway. The
unbroken path segment is 1.2 miles long and is 12 feet wide with no marked centerlines.
A recent volume count showed 100 users of all types in the peak hour of the facility.
The count had hourly breakdowns only and it was determined in the peak hour that the
highest directional flow was 60%. A PHF was estimated at 0.95 as there was not much
influence from uses that would cause higher spikes in the user volume. The default modal
splits and other parameters were used.
The input data were entered into the calculator tool in the yellow-shaded boxes as shown
below. Mode splits, speeds, and passing distances were left as defaults in the orange-
shaded boxes.
The calculator macro tool was run and the results obtained are shown below. Both the
bicycle and pedestrian modes have a LOS B which is indicative of favorable conditions
It is recommended that at least one count on an existing or for a future multiuse path
be full featured (15-min breakdowns, directional, and by user class) so that the
calculator can be customized for the specific application. Paths with significant
commuter flows should be counted in the typical AM/PM peak periods. Paths that are
recreational or are mixed use should have counts that cover the midday peak and/or
weekend periods. It may be necessary to obtain a week-long count with daily and
hourly volumes to determine when peak periods occur if this information is not
available from sites with similar characteristics.

Analysis Procedure Manual Version 2 14-71 Last Updated 11/2018
on this analysis segment.
14.6.8 Unsignalized Intersections (TBD)

Analysis Procedure Manual Version 2 14-72 Last Updated 11/2018
14.6.9 Selecting Pedestrian Crossing Treatments – NCHRP 562
One of the main products of the National Cooperative Highway Research Program
(NCHRP) Report 562 was creation of a new spreadsheet tool that can be used as a guide
to select or screen potential pedestrian crossing treatments for plans and projects. These
treatments can range from signs and markings to full mid-block traffic signals. This tool
uses relatively little data (i.e. speeds, volumes) which is generally available to the typical
TSP planning level all the way to the project development and TIA-level efforts. Selected
treatments can also be analyzed with PLTS and MMLOS methods described earlier in
this chapter.
Treatment Categories
There are five main categories used in the tool as explained below. Most of these have
additional information shown in the solutions section of Chapter 10. For planning level
analysis, improvements should be identified using general categories rather than as
specific treatments, in order to allow for flexibility in design.
No Treatment – Occurs when the volumes of pedestrians are insufficient (<20
pedestrians per hour at 35 mph or less or <14 pedestrians per hour at greater than
35 mph). Many locations in Oregon will fall into this category. When the tool
indicates “no treatment” this means that active pedestrian devices such as beacons
or traffic control devices are not recommended. Traffic calming or pedestrian
visibility-type measures can still be considered such as curb extensions, medians,
and/or median refuge islands as appropriate. However, it is unlikely that these
would be done without additionally marking a crosswalk. The analyst will need to
review these results with Region Traffic to determine if the category should
remain as “No Treatment” or be upgraded to the “Crosswalk” category.
Crosswalk – Includes typical signing and crosswalk markings. This mainly
applies to cases with sufficient pedestrian volume but low traffic volume.
Enhanced/Active – Includes constant presence features such as illumination,
signing, markings, and pedestrian-activated beacons (PAB). This mainly apples to
areas with sufficient pedestrians but higher traffic volumes or areas with high
pedestrian volumes (>100 pedestrians per hour) and lower traffic volumes.
Red (Indication) – Includes devices that show a “red” indication to vehicles such
as pedestrian hybrid beacons (PHB) and mid-block traffic signals. These mainly
apply to areas with roadway volumes (both directions) exceeding 1400 vph and
Any crossing treatment should be reviewed by Region Traffic and/or the Traffic-
Roadway Section for its appropriateness for the given location and plan/project type.
These treatments may have additional requirements listed in the Highway Design
Manual, the Bicycle Pedestrian Design Guide, the Manual of Uniform Traffic Control
Devices, or the Traffic Manual.
Analysis Procedure Manual Version 2 14-73 Last Updated 11/2018
peak pedestrian hour volumes less than 100 per hour.
Signal – Includes conventional traffic signals at an intersection. This is a
modification of the MUTCD pedestrian warrant. While bi-directional traffic
volumes can be low as 400 vph, peak pedestrian volumes need to be at least 100
or more per hour. This category could also be applicable to the red indication
devices if in a mid-block location. At certain locations where traffic signals would
not be considered an appropriate measure (i.e. rural or an urban access-controlled
expressway), this category can be used to indicate a need for a grade-separated
pedestrian under or overcrossing.
Input Data
Posted speed limit, 85th percentile speed, or statutory speed (i.e. 25 mph
residential or 20 mph downtown)
Population category of surrounding area (less or greater than 10,000)
Bi-directional roadway vehicles per hour during the pedestrian peak hour. If a
median/pedestrian refuge island of at least six feet wide is present then each
direction needs to be analyzed separately. When an island is present two
spreadsheets will need to be worked up, one for each direction. Vehicle volume in
Line 3a will always be the total of both directions, while the volume in Line 4e,
will be each approach direction when an island is present or the total when an
island is not present. The pedestrian peak hour is typically not the same hour as
the vehicular peak hour. Typically it can occur around the lunchtime period (i.e.
12-1 PM) which will likely require longer duration traffic counts at higher
pedestrian volume locations in a plan or project.
Pedestrian volume in the pedestrian peak hour – Sum pedestrian crossings from
both directions at a mid-block location. If the analysis site is an intersection, sum
both directions on both approaches (i.e. both east-west crosswalks north and south
of the intersecting roadway).
Pedestrian warrant threshold reduction percentage –This value is not used by
ODOT and can be ignored. Entering yes or no in Line 3d of the spreadsheet will
have no effect on the results. .
Pedestrian crossing distance from curb-to-curb (ft). If a median refuge is present
It can be helpful to analyze both the pedestrian peak hour and the vehicle peak hour
especially when projecting future conditions. Treatments could be triggered with
lower pedestrian volumes and higher vehicle volumes and vice versa.
Analysis Procedure Manual Version 2 14-74 Last Updated 11/2018
use the curb-to-refuge distance for each approach.
Pedestrian walking speed – use the default walking speed of 3.5 ft/s unless a
significant number of older or younger pedestrians or those with mobility
challenges are expected, such as where schools or retirement or similar facilities
are nearby, then use 3.0 ft/s. Pedestrian lost time (startup and clearance time) –
use the default 3 seconds.
Pedestrian delay (s) – This value is normally automatically calculated but a field-
measured delay value can be entered to override the calculation.
Expected motorist compliance – Generally, use the “low” value when speeds are
30 mph or higher or when pedestrians are crossing four or more lanes of traffic,
due to low compliance rates in Oregon under those conditions.
Example 14-10 Pedestrian Crossing Treatment Selection
A state highway in a small city splits the commercial area from the residential parts of the
city. Residents report that it can be difficult to cross the roadway and it is too far out of
direction to reach the nearest traffic signal. The roadway speed is 30 mph. A count was
done and the pedestrian peak hour was determined to be from 12-1 PM and about 40
pedestrians per hour cross at this location. The bi-directional roadway volume was
determined to be 450 vph during this time at this location. The assumed pedestrian
walking speed is 3.5 ft/s, with a 30 ft curb-to- curb distance. Pedestrian yielding rates
remain low at this location regardless of the current pedestrians yielding law which may
be due to relatively low visibility of the crossing. The data is entered into the tool and a
recommendation of an enhanced or active crossing is generated.
Improvements for this location are at least crosswalk signing, marking (if not already
marked), advance stop bars, illumination, a median refuge island, or curb extensions. A
pedestrian-activated beacon (PAB) is also possible if requirements in the ODOT Traffic
Manual and other applicable manuals are met and all necessary approvals obtained.

Analysis Procedure Manual Version 2 14-75 Last Updated 11/2018

Analysis Procedure Manual Version 2 14-76 Last Updated 11/2018
14.6.10Signalized Intersections Pedestrian and Bicycle Level of Service
This methodology is adapted from the publication, “Pedestrian and Bicycle Level of
Service, Methodology for Crossing at Signalized Intersections”, from the Charlotte, NC
Department of Transportation. This intersection methodology is intended to compliment
the level of service (LOS) segment analysis methods presented in this chapter and should
be used in tandem to completely analyze a pedestrian or a bicycle facility. This
methodology is intended for project level and detailed planning studies where specific
data are plentiful and available. System planning efforts should use the Level of Traffic
Stress methodologies in Section 14.4 and 5. The methodology is based on intersection
elements that affect pedestrian and bicyclist safety and comfort using an expert
judgment/index basis rather than research-based as might be found in the Highway
Capacity Manual. These intersection elements mainly include the impacts from reducing
traffic conflicts, minimizing crossing distances, slowing down traffic speeds and raising
user awareness. This method can be used without modification for signalized mid-block
crossings (traffic signals not beacons). Traffic volumes are not explicitly used in this
methodology in most areas but are implicitly included by using surrogates such as total
crossing distance, number of lanes, speeds, and signal phasing.
This methodology can be used to assess and improve pedestrian and bicycle user comfort
for detailed planning and project development efforts by modifying design and
operational features. It can also be used to select intersection features that meet the
chosen pedestrian and bicycle LOS. The results can also be compared to traffic
operations and other analyses given the objectives and priorities of the plan/project and
the local jurisdiction. A companion spreadsheet LOS calculator was also developed and
is available on ODOT’s Planning and Technical Guidance’s Technical Tools webpage.
This methodology is intended to be used with other intersection analysis data, tools
and methods such as Highway Safety Manual crash analyses, intersection capacity
analyses, pedestrian/bicycle volumes, etc. in order to have a complete picture of the
overall operations. In addition, a number of design and operational-related
features are not part of the methodology such as sight distance, illumination,
pavement condition, signing, accessibility, and detection but should be considered
as part of any project intersection or mid-block crossing design. Please coordinate
with traffic engineering and roadway design staff in the appropriate ODOT Region
office, the Traffic-Roadway Section, or local jurisdiction regarding consideration of
these features.

Analysis Procedure Manual Version 2 14-77 Last Updated 11/2018
This point-based methodology requires a number of design and operational elements that
may be obtained from aerial/ground-level photography, field investigation, ODOT
Region/Traffic-Roadway Section/local jurisdiction staff for existing conditions. Project
alternative designs/studies along with coordinating with appropriate staff should give the
necessary information for future no-build or build conditions. These data elements are:
Pedestrian LOS
Intersection lane configurations
Median refuge presence and width
Corner refuge island presence, number, and type (painted/curbed)
Channelized right turn lane traffic control and design (high or low speed)
Curb ramp design/condition
Effective corner radius
Total signal cycle length and number of phases
Left and right turn signal phasing type
Right/left-turn-on-red presence
Pedestrian signal types and phasing
Crosswalk markings
Bicycle LOS
Intersection lane configurations
Curb lane width
Posted speed limit
Approach and departure leg bicycle facility type
Right turn lane/bike lane approach configuration
Right turn lane volume
Right turn lane length
Buffer width at intersection
Stop bar location
Shared lane markings, conflict area paint, and turn box presence
Left turn signal phasing
Right-turn-on-red presence
It is assumed that any design and operational elements evaluated in this
methodology follow applicable ODOT publications (or accepted local/national
standards and guidelines for non-state intersections) such as the Highway Design
Manual, the Bicycle & Pedestrian Design Guide, Traffic Manual, etc. This means
that, for example, appropriate widths, distances, or adequate signal timing should
be present as this methodology is primarily concerned with the presence/absence of
intersection features.
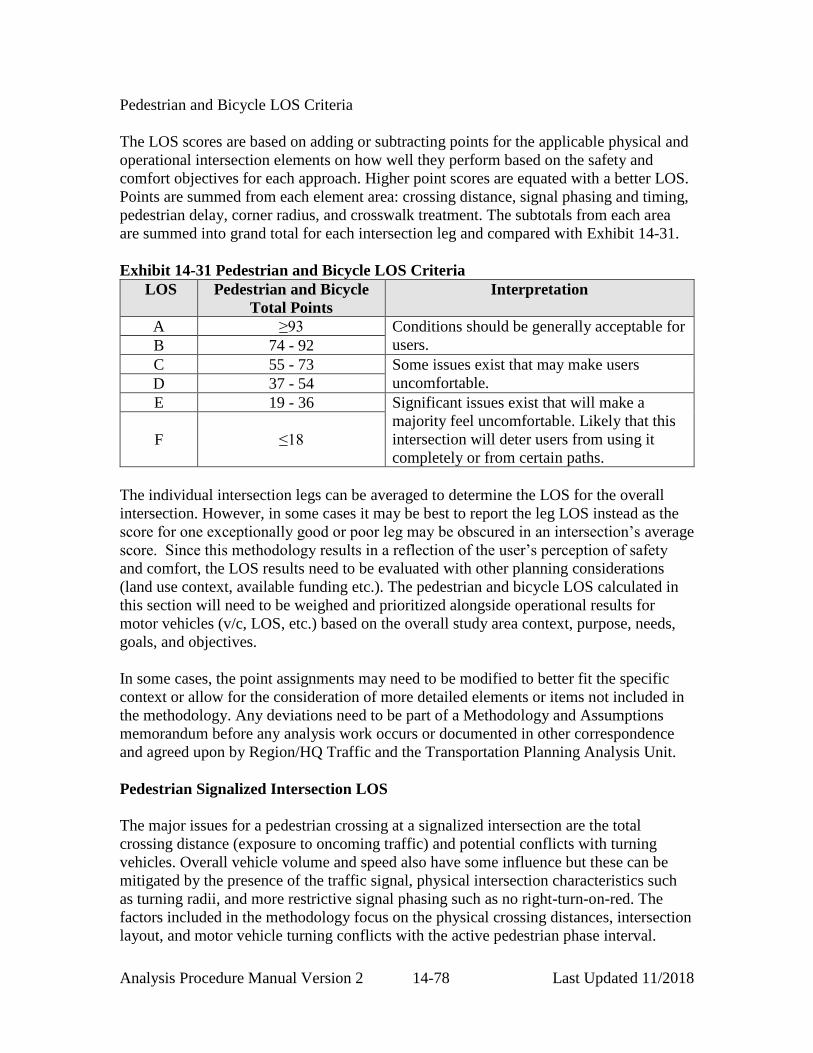
Analysis Procedure Manual Version 2 14-78 Last Updated 11/2018
Pedestrian and Bicycle LOS Criteria
The LOS scores are based on adding or subtracting points for the applicable physical and
operational intersection elements on how well they perform based on the safety and
comfort objectives for each approach. Higher point scores are equated with a better LOS.
Points are summed from each element area: crossing distance, signal phasing and timing,
pedestrian delay, corner radius, and crosswalk treatment. The subtotals from each area
are summed into grand total for each intersection leg and compared with Exhibit 14-31.
Exhibit 14-31 Pedestrian and Bicycle LOS Criteria
LOS Pedestrian and Bicycle
Total Points
Interpretation
A ≥93 Conditions should be generally acceptable for
users. B 74 - 92
C 55 - 73 Some issues exist that may make users
uncomfortable. D 37 - 54
E 19 - 36 Significant issues exist that will make a
majority feel uncomfortable. Likely that this
intersection will deter users from using it
completely or from certain paths. F ≤18
The individual intersection legs can be averaged to determine the LOS for the overall
intersection. However, in some cases it may be best to report the leg LOS instead as the
score for one exceptionally good or poor leg may be obscured in an intersection’s average
score. Since this methodology results in a reflection of the user’s perception of safety
and comfort, the LOS results need to be evaluated with other planning considerations
(land use context, available funding etc.). The pedestrian and bicycle LOS calculated in
this section will need to be weighed and prioritized alongside operational results for
motor vehicles (v/c, LOS, etc.) based on the overall study area context, purpose, needs,
goals, and objectives.
In some cases, the point assignments may need to be modified to better fit the specific
context or allow for the consideration of more detailed elements or items not included in
the methodology. Any deviations need to be part of a Methodology and Assumptions
memorandum before any analysis work occurs or documented in other correspondence
and agreed upon by Region/HQ Traffic and the Transportation Planning Analysis Unit.
Pedestrian Signalized Intersection LOS
The major issues for a pedestrian crossing at a signalized intersection are the total
crossing distance (exposure to oncoming traffic) and potential conflicts with turning
vehicles. Overall vehicle volume and speed also have some influence but these can be
mitigated by the presence of the traffic signal, physical intersection characteristics such
as turning radii, and more restrictive signal phasing such as no right-turn-on-red. The
factors included in the methodology focus on the physical crossing distances, intersection
layout, and motor vehicle turning conflicts with the active pedestrian phase interval.
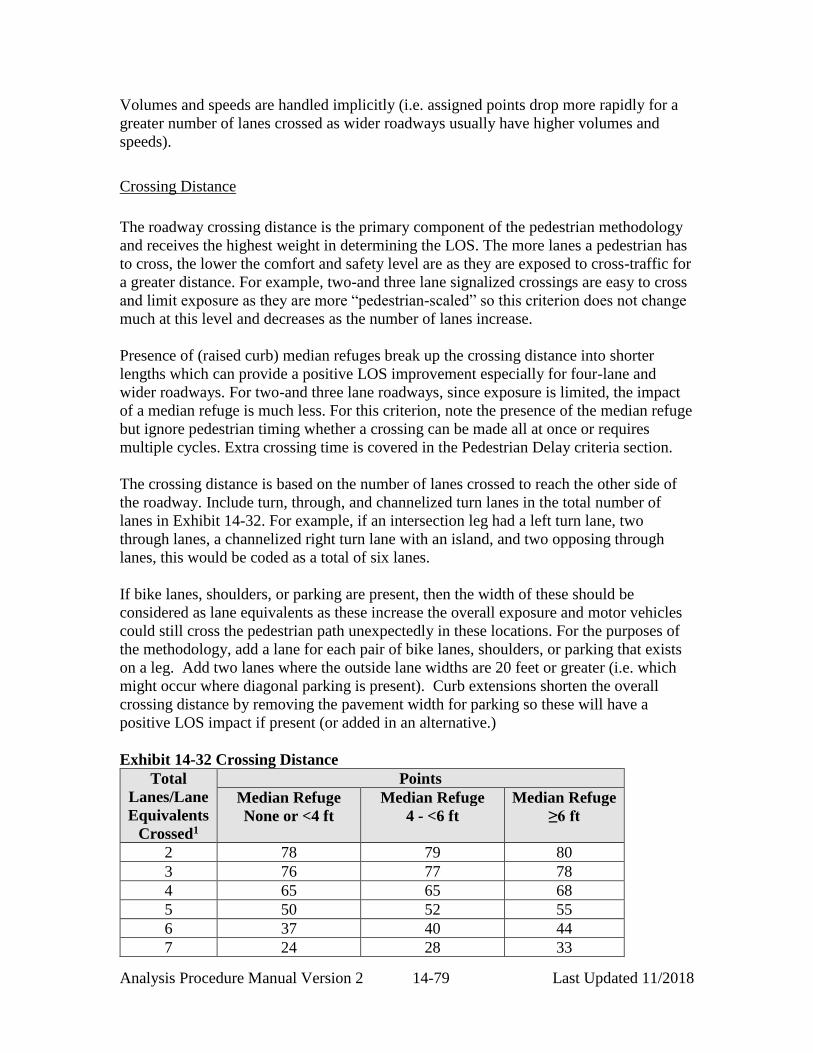
Analysis Procedure Manual Version 2 14-79 Last Updated 11/2018
Volumes and speeds are handled implicitly (i.e. assigned points drop more rapidly for a
greater number of lanes crossed as wider roadways usually have higher volumes and
speeds).
Crossing Distance
The roadway crossing distance is the primary component of the pedestrian methodology
and receives the highest weight in determining the LOS. The more lanes a pedestrian has
to cross, the lower the comfort and safety level are as they are exposed to cross-traffic for
a greater distance. For example, two-and three lane signalized crossings are easy to cross
and limit exposure as they are more “pedestrian-scaled” so this criterion does not change
much at this level and decreases as the number of lanes increase.
Presence of (raised curb) median refuges break up the crossing distance into shorter
lengths which can provide a positive LOS improvement especially for four-lane and
wider roadways. For two-and three lane roadways, since exposure is limited, the impact
of a median refuge is much less. For this criterion, note the presence of the median refuge
but ignore pedestrian timing whether a crossing can be made all at once or requires
multiple cycles. Extra crossing time is covered in the Pedestrian Delay criteria section.
The crossing distance is based on the number of lanes crossed to reach the other side of
the roadway. Include turn, through, and channelized turn lanes in the total number of
lanes in Exhibit 14-32. For example, if an intersection leg had a left turn lane, two
through lanes, a channelized right turn lane with an island, and two opposing through
lanes, this would be coded as a total of six lanes.
If bike lanes, shoulders, or parking are present, then the width of these should be
considered as lane equivalents as these increase the overall exposure and motor vehicles
could still cross the pedestrian path unexpectedly in these locations. For the purposes of
the methodology, add a lane for each pair of bike lanes, shoulders, or parking that exists
on a leg. Add two lanes where the outside lane widths are 20 feet or greater (i.e. which
might occur where diagonal parking is present). Curb extensions shorten the overall
crossing distance by removing the pavement width for parking so these will have a
positive LOS impact if present (or added in an alternative.)
Exhibit 14-32 Crossing Distance
Total
Lanes/Lane
Equivalents
Crossed1
Points
Median Refuge
None or <4 ft
Median Refuge
4 - <6 ft
Median Refuge
≥6 ft
2 78 79 80
3 76 77 78
4 65 65 68
5 50 52 55
6 37 40 44
7 24 28 33

Analysis Procedure Manual Version 2 14-80 Last Updated 11/2018
1 Outside lane widths at 20 feet or greater should be considered as two lanes. Parking, shoulders, or bike
lanes on both sides of a leg should be considered as an extra lane equivalent.
The addition of corner refuge islands break up the overall crossing distance. Corner
islands can either be of a standard design which requires more head movement by the
driver in order to check for oncoming pedestrians or a low-speed design which brings the
right turns in closer to a right angle as seen in Exhibit 14-33. Low speed islands can be
identified as having an approximate 60 degree angle between the refuge lane and the
intersecting street. The standard island with 45 or less degree corners is typically not
considered a low-speed design unless the turning radius of the refuge lane is very tight
(less than 30 feet). The presence of a raised crosswalk will effectively slow vehicles
traveling through the channelized right turn lane regardless of island design style which
will afford a better likelihood for yielding to pedestrians.
Exhibit 14-33 Standard vs. Low Speed Island Shape
A scoring adjustment is made for each corner refuge island crossed as seen in Exhibit
14-34. For example, if the overall crossing distance traverses a left turn lane, two through
lanes in each direction, and a channelized right turn lane separated by an island then the
total point would be based on six total lanes crossed (37 points) plus the refuge island (6
points) for a total of 43 points. Adjustments are also made for the traffic control for the
channelized right turn lane depending on if there is signal control, yield control or no
control (free-flow). Points decrease as the chance of a vehicle not stopping and/or not
seeing the pedestrian increase. The point reduction is less if the island is a low-speed
design type with a steeper entrance angle that forces vehicles to slow substantially as
these offer better driver visibility of oncoming traffic and pedestrians.
Exhibit 14-34 Channelized Right Turn Refuge Adjustments
Corner Refuge Island Adjustment Points
Each corner refuge island 6
Channelized Right Turn Lane Traffic
Control Adjustment
Signalized control 5
Yield control with low-speed island design
and/or raised crosswalk 2
Low-speed Standard
8 8 12 20
9 -5 0 10
10 -15 -10 0

Analysis Procedure Manual Version 2 14-81 Last Updated 11/2018
Corner Refuge Island Adjustment Points
Yield control -3
Uncontrolled (free-flow) with low-speed island
design and/or raised crosswalk 0
Uncontrolled (free-flow) -20
Curb Ramps
When a crossing lacks or has substandard curb ramps, the crossing can prevent use or
make it difficult for disabled users potentially even forcing them out into the street and
using nearby driveway ramps if available. A ramp built to ADA standards will have a
flatter grade, a level landing, and a contrasting detectable surface for visually impaired
pedestrians. Older ramps with short and/or steep grades (these almost never have any
detectable surfaces) are considered equivalent to no ramp at all. The methodology
restricts the total possible points by creating a maximum point threshold for an
intersection leg based on the overall ramp quality as seen in Exhibit 14-35. For example,
if an intersection leg did not have any curb ramps, then the maximum point value would
be 37 (LOS E) regardless of other positive features and would be the controlling factor in
this LOS. A good LOS is not possible with poor ramp conditions. The overall quality of
the crossing is based on the condition of the curb ramps on either end of the crosswalk. If
a curb ramp on one end of the crossing is good and the curb ramp on the other end is
poor, the overall quality of the crossing is rated as poor as the crossing is not accessible.
Determine the quality of each crossing based on the worst condition of the curb ramp
pairs.
Exhibit 14-35 Maximum Point Thresholds and Curb Ramp Quality
Rating Description Maximum
Point
Threshold
Good ADA-standard; truncated dome insert, level
unobstructed landing area, flat grades None
Acceptable Detectable (cross-hatched) ramp surface, level
landing area, shallow grades 73
Poor No detectable surface, obstructed/no level landing
area, steep grades, or missing ramp 37
Signal Phasing and Timing
The second-most important element in the methodology is the effect of signal phasing
and timing on potential pedestrian-vehicle conflicts. Signal phasing can remove, limit, or
create these conflicts. Protected phases are best for minimizing left and right turn
conflicts as the pedestrian phase is prohibited from coming up during the green arrow
indication for turning vehicles. Permissive phases allow for the conflict to occur as the

Analysis Procedure Manual Version 2 14-82 Last Updated 11/2018
pedestrian path is crossed by turning vehicles, which are required to yield, but may not do
so.
Left and right turn conflicts are based on turns crossing the active pedestrian path on the
subject (analysis) leg as shown in Exhibit 14-36. The conflicts are coded for movements
that cross the pedestrian path when departing the intersection, not arriving. Note that the
pedestrian crossing on the departing side of the intersection is active (going with the
through signal phases) while the arriving side is stopped. For example, in Exhibit 14-36,
the northbound left turn conflict is coded to the west leg as this movement crosses the
west leg crosswalk on green when departing the intersection, directly conflicting with
pedestrians. While this movement also crosses the south leg crosswalk upon entering the
intersection, this pedestrian movement is stopped. Each leg is analyzed in turn
determining the potential conflicts allowed or not by geometry or phasing. Exhibit 14-37
shows the different kinds of left and right turning conflicts. Higher points are awarded for
protected phasing than for permissive as shown in Exhibit 14-38 and Exhibit 14-41.
Exhibit 14-36 Vehicle Paths and Active/Stopped Crossings
Right turn-on-red is another source of conflicts, so points are increased when this conflict
is eliminated (movement is prohibited by signing). In contrast to the right turn conflict,
right turn-on-red conflicts are coded to the subject leg that contains the pedestrian path
that this movement will cross to enter the intersection. The active pedestrian crossing is
on the entering intersection leg instead of the departing leg. For example, in Exhibit
14-37, the eastbound right-turn-on-red movement is coded to the west leg as it directly
conflicts with pedestrians.
Left turn-on-red movements are a special case as they only apply for intersections of two
one-way streets or a two-way street and a one-way street. Points are assigned if a left turn
can be made legally into the proper lane on (typically the curb lane unless otherwise
marked) the one-way cross street or is prohibited by signing as shown in Exhibit 14-38.
This adjustment does not apply and is skipped for intersections of two two-way streets or
Act
ive
Ped
estr
ian
Cro
ssin
g
Stopped
Pedestrian
Crossing
NORTH
NO SCALE
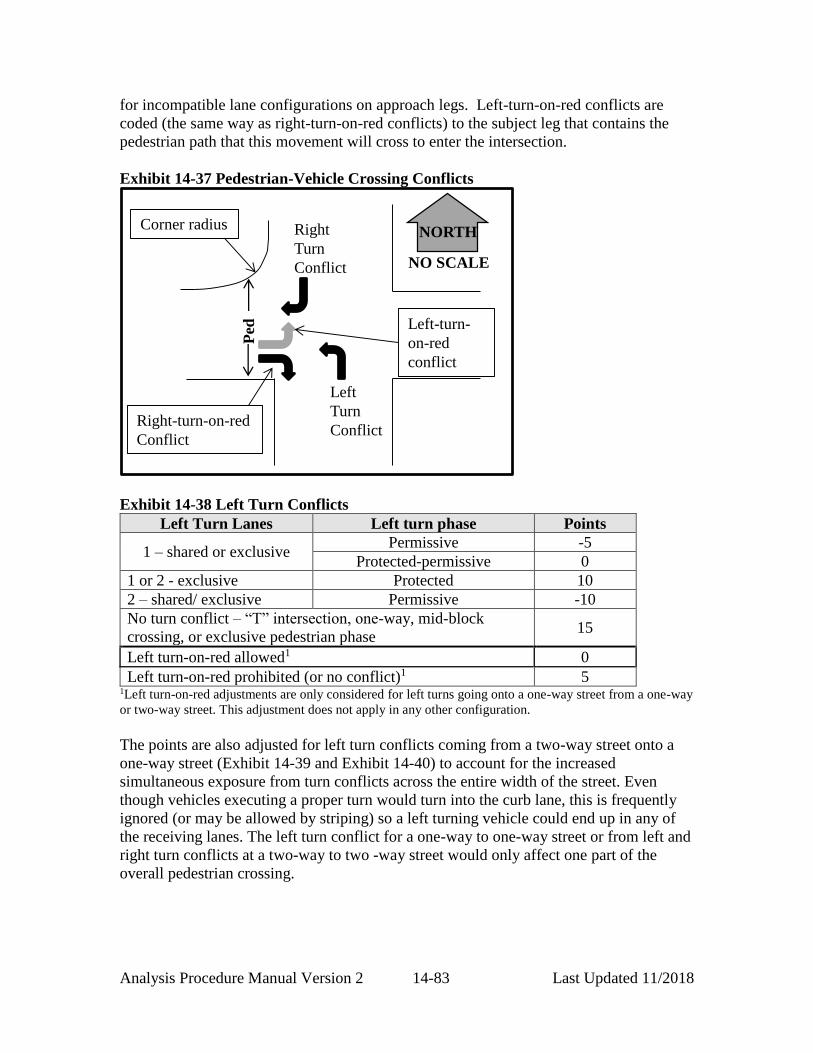
Analysis Procedure Manual Version 2 14-83 Last Updated 11/2018
for incompatible lane configurations on approach legs. Left-turn-on-red conflicts are
coded (the same way as right-turn-on-red conflicts) to the subject leg that contains the
pedestrian path that this movement will cross to enter the intersection.
Exhibit 14-37 Pedestrian-Vehicle Crossing Conflicts
Exhibit 14-38 Left Turn Conflicts
Left Turn Lanes Left turn phase Points
1 – shared or exclusive Permissive -5
Protected-permissive 0
1 or 2 - exclusive Protected 10
2 – shared/ exclusive Permissive -10
No turn conflict – “T” intersection, one-way, mid-block
crossing, or exclusive pedestrian phase 15
Left turn-on-red allowed1 0
Left turn-on-red prohibited (or no conflict)1 5 1Left turn-on-red adjustments are only considered for left turns going onto a one-way street from a one-way
or two-way street. This adjustment does not apply in any other configuration.
The points are also adjusted for left turn conflicts coming from a two-way street onto a
one-way street (Exhibit 14-39 and Exhibit 14-40) to account for the increased
simultaneous exposure from turn conflicts across the entire width of the street. Even
though vehicles executing a proper turn would turn into the curb lane, this is frequently
ignored (or may be allowed by striping) so a left turning vehicle could end up in any of
the receiving lanes. The left turn conflict for a one-way to one-way street or from left and
right turn conflicts at a two-way to two -way street would only affect one part of the
overall pedestrian crossing.
Right
Turn
Conflict
Left
Turn
Conflict Right-turn-on-red
Conflict
Ped Left-turn-
on-red
conflict
Corner radiusNORTH
NO SCALE
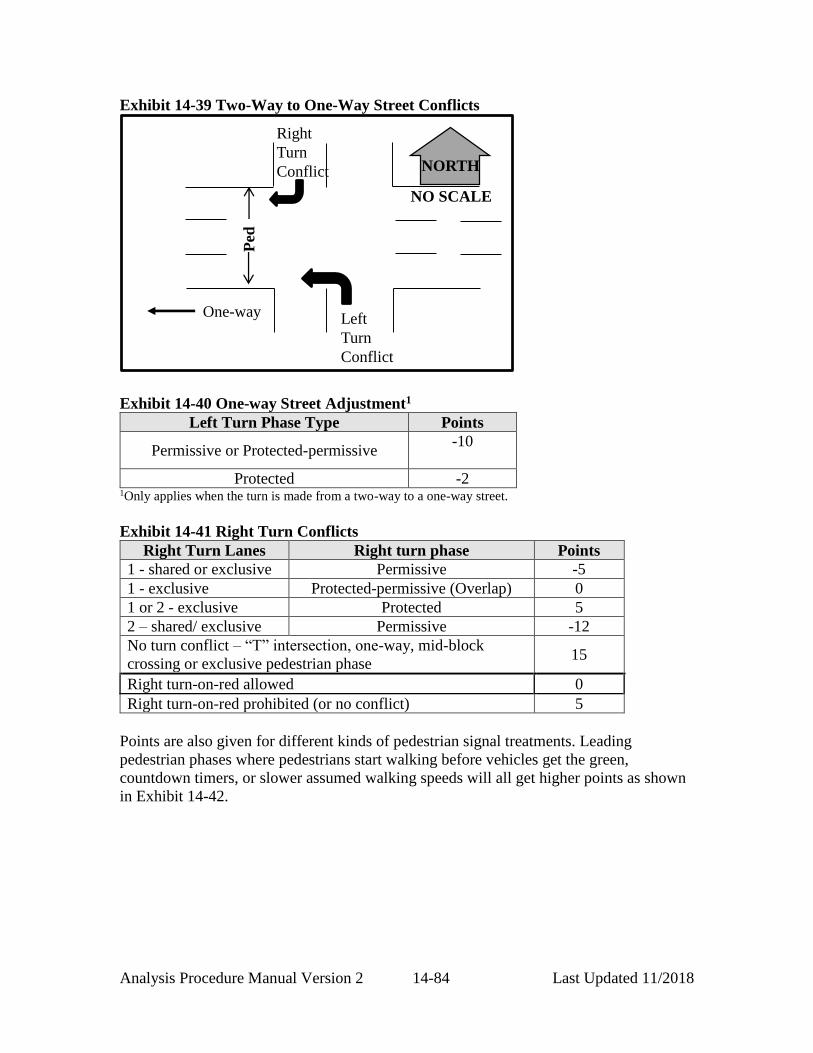
Analysis Procedure Manual Version 2 14-84 Last Updated 11/2018
Exhibit 14-39 Two-Way to One-Way Street Conflicts
Exhibit 14-40 One-way Street Adjustment1
Left Turn Phase Type Points
Permissive or Protected-permissive -10
Protected -2 1Only applies when the turn is made from a two-way to a one-way street.
Exhibit 14-41 Right Turn Conflicts
Right Turn Lanes Right turn phase Points
1 - shared or exclusive Permissive -5
1 - exclusive Protected-permissive (Overlap) 0
1 or 2 - exclusive Protected 5
2 – shared/ exclusive Permissive -12
No turn conflict – “T” intersection, one-way, mid-block
crossing or exclusive pedestrian phase 15
Right turn-on-red allowed 0
Right turn-on-red prohibited (or no conflict) 5
Points are also given for different kinds of pedestrian signal treatments. Leading
pedestrian phases where pedestrians start walking before vehicles get the green,
countdown timers, or slower assumed walking speeds will all get higher points as shown
in Exhibit 14-42.
Right
Turn
Conflict
Left
Turn
Conflict
Ped
One-way
NORTH
NO SCALE

Analysis Procedure Manual Version 2 14-85 Last Updated 11/2018
Exhibit 14-42 Pedestrian Signal Displays
Display Type Points
Standard (walk/don’t walk) 0
Leading pedestrian phase 4
Countdown timer 5
Countdown timer and walking speed basis <3.5ft/s 8
Leading pedestrian phase & countdown timer 8
Leading pedestrian phase, countdown timer and walking
speed basis <3.5ft/s 12
Pedestrian Delay
Pedestrians all expect to wait to cross for some period of time at a signalized intersection.
However, an “excessive” amount of pedestrian delay can be incurred waiting to cross a
busy intersection if multiple signal cycles are spanned and if a crossing cannot be done
all at once. Long wait times, especially when experienced on a median island, can
diminish the walking experience. Some complex intersections may require two or three
separate crossings between islands where, if not carefully managed, the cumulative wait
time could equal the walking time for a short trip. Too much delay may increase the
likelihood of someone crossing at an unprotected midblock location or not obeying the
signal indications which is a safety concern.
The pedestrian delay criteria are based on the tolerance for waiting which the maximum
would be about 45 seconds (for the typical three-phase signal). Shorter cycle lengths for
two-phase signals get increased points as potential violations would be substantially
reduced while longer lengths for four-phase signals, signals with long cycle times over
120 seconds, or intersections/mid-block crossings that require more than one cycle length
(cannot be crossed completely in one pedestrian phase) get negative points as shown in
Exhibit 14-43. Signals that have pedestrian phases that end more than five seconds before
the start of the yellow phase are regarded as being too short as the walk/don’t walk phase
could be a few seconds longer. These may incur additional delay for the pedestrian as
they would have to wait for the next cycle. Use the cycle length corresponding to the
analysis period used for other methodologies if cycle lengths vary over the day.
Intersections with longer cycles than what is shown in the table for the number of phases
should use the next higher value. For example, a three-phase signal that has a 110-second
cycle should use the point value for the four-phase signal.
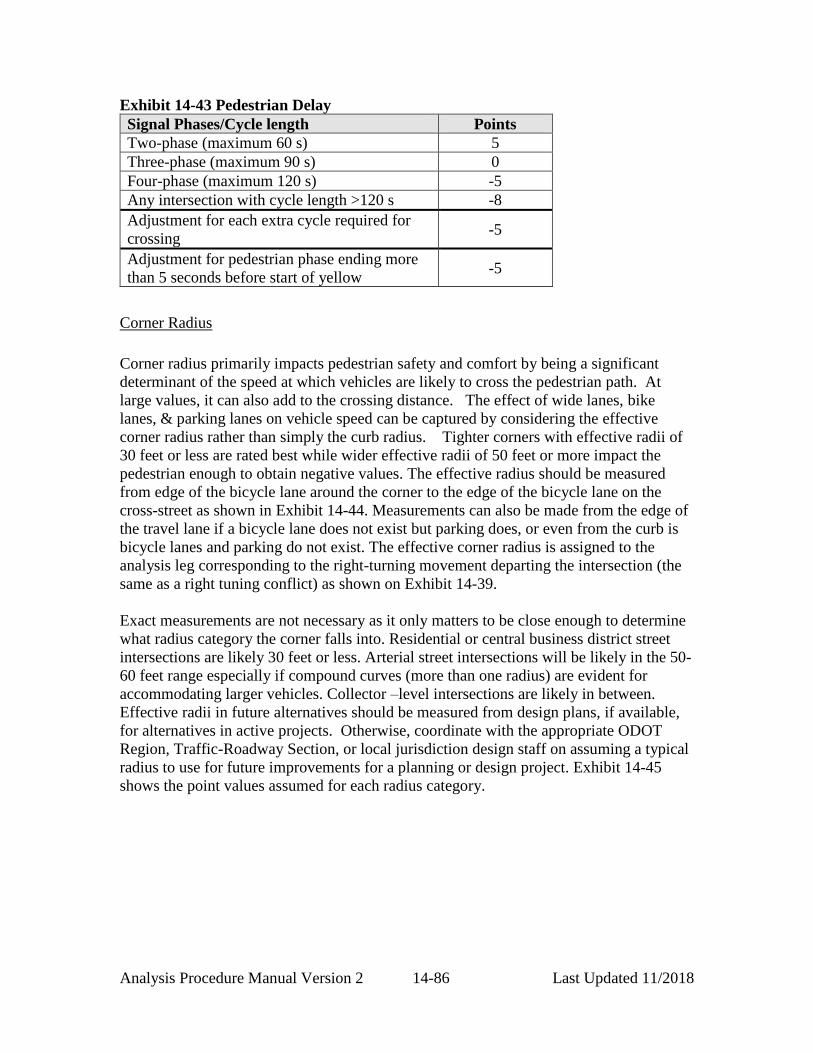
Analysis Procedure Manual Version 2 14-86 Last Updated 11/2018
Exhibit 14-43 Pedestrian Delay
Signal Phases/Cycle length Points
Two-phase (maximum 60 s) 5
Three-phase (maximum 90 s) 0
Four-phase (maximum 120 s) -5
Any intersection with cycle length >120 s -8
Adjustment for each extra cycle required for
crossing -5
Adjustment for pedestrian phase ending more
than 5 seconds before start of yellow -5
Corner Radius
Corner radius primarily impacts pedestrian safety and comfort by being a significant
determinant of the speed at which vehicles are likely to cross the pedestrian path. At
large values, it can also add to the crossing distance. The effect of wide lanes, bike
lanes, & parking lanes on vehicle speed can be captured by considering the effective
corner radius rather than simply the curb radius. Tighter corners with effective radii of
30 feet or less are rated best while wider effective radii of 50 feet or more impact the
pedestrian enough to obtain negative values. The effective radius should be measured
from edge of the bicycle lane around the corner to the edge of the bicycle lane on the
cross-street as shown in Exhibit 14-44. Measurements can also be made from the edge of
the travel lane if a bicycle lane does not exist but parking does, or even from the curb is
bicycle lanes and parking do not exist. The effective corner radius is assigned to the
analysis leg corresponding to the right-turning movement departing the intersection (the
same as a right tuning conflict) as shown on Exhibit 14-39.
Exact measurements are not necessary as it only matters to be close enough to determine
what radius category the corner falls into. Residential or central business district street
intersections are likely 30 feet or less. Arterial street intersections will be likely in the 50-
60 feet range especially if compound curves (more than one radius) are evident for
accommodating larger vehicles. Collector –level intersections are likely in between.
Effective radii in future alternatives should be measured from design plans, if available,
for alternatives in active projects. Otherwise, coordinate with the appropriate ODOT
Region, Traffic-Roadway Section, or local jurisdiction design staff on assuming a typical
radius to use for future improvements for a planning or design project. Exhibit 14-45
shows the point values assumed for each radius category.
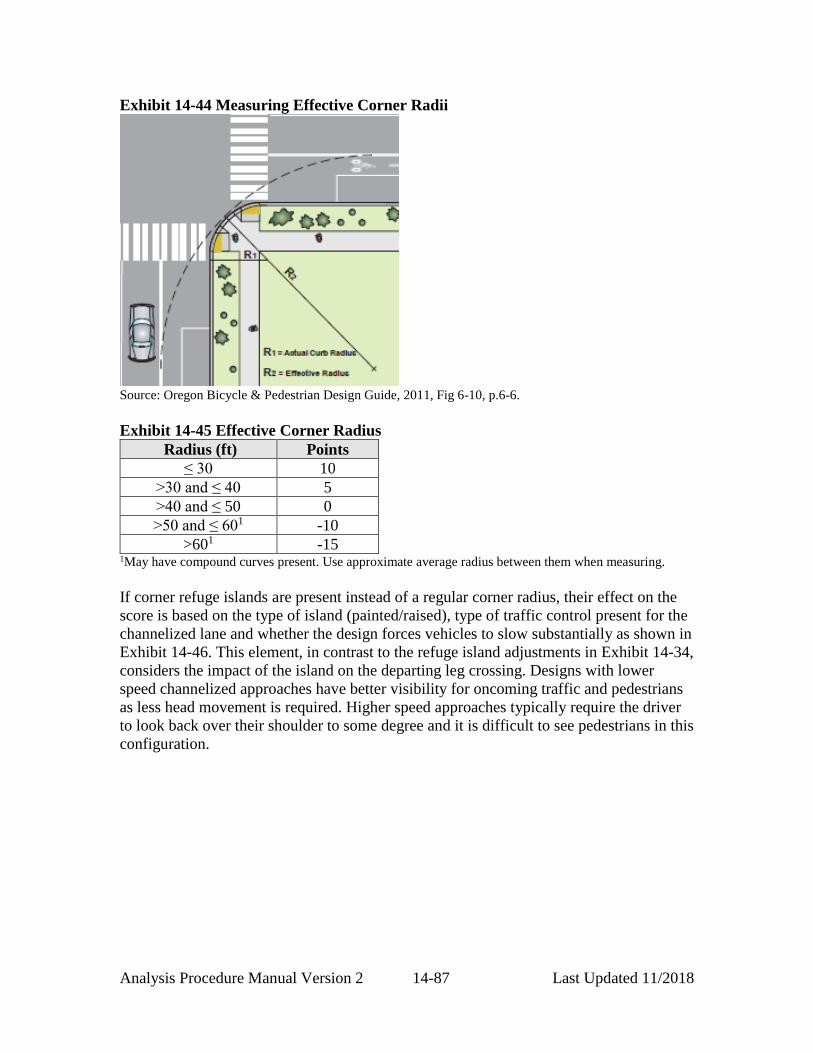
Analysis Procedure Manual Version 2 14-87 Last Updated 11/2018
Exhibit 14-44 Measuring Effective Corner Radii
Source: Oregon Bicycle & Pedestrian Design Guide, 2011, Fig 6-10, p.6-6.
Exhibit 14-45 Effective Corner Radius
Radius (ft) Points
≤ 30 10
>30 and ≤ 40 5
>40 and ≤ 50 0
>50 and ≤ 601 -10
>601 -15 1May have compound curves present. Use approximate average radius between them when measuring.
If corner refuge islands are present instead of a regular corner radius, their effect on the
score is based on the type of island (painted/raised), type of traffic control present for the
channelized lane and whether the design forces vehicles to slow substantially as shown in
Exhibit 14-46. This element, in contrast to the refuge island adjustments in Exhibit 14-34,
considers the impact of the island on the departing leg crossing. Designs with lower
speed channelized approaches have better visibility for oncoming traffic and pedestrians
as less head movement is required. Higher speed approaches typically require the driver
to look back over their shoulder to some degree and it is difficult to see pedestrians in this
configuration.

Analysis Procedure Manual Version 2 14-88 Last Updated 11/2018
Exhibit 14-46 Corner Refuge Island (in lieu of Corner Radius)
Island Type Traffic Control Right Turn
Phasing Type
Points
Painted Uncontrolled (free-flow) -20
Yield or signalized All -10
Curbed
Uncontrolled (free-flow) -20
Yield or signalized Permissive or
Permissive/Protected 0
Signalized Protected 5
Curbed – Low
Speed
Yield or signalized Permissive or
Permissive/Protected 5
Signalized Protected 10
Crosswalk Treatment
The more visible a crosswalk is, the more awareness that a driver will have to the
potential of pedestrians crossing the street. An unmarked crosswalk at a signalized
intersection gets negative points on account of additional exposure required or more risk
for the pedestrian. Crosswalk treatments beyond just the standard transverse or ladder
striping garner positive points as shown in Exhibit 14-47.
Exhibit 14-47 Crosswalk Treatment
Crosswalk Treatment Points
Unmarked -5
Marked with transverse or ladder striping 0
Raised1 and marked across entire approach 5
Raised1 and marked across channelized
right turn lane 5
1Raised crosswalks may not be appropriate on some state highway approaches or right turn lanes
Example 14-11 Signalized Intersection Pedestrian Level of Service
An urban intersection needs to be assessed for Signalized Pedestrian LOS as part of an
analysis project. The intersection is at the junction of a north-south four-lane two-way
street and a westbound two/three lane one-way street. Railroad tracks are adjacent to the
intersection across the east leg and the pedestrian stop-bar is 25’ from the edge of the
curb. There are no medians or refuges on any of the legs. Corner radius was measured at
15’ for all corners. All crosswalks are open and marked with standard transverse stripes.
All curb ramps are of modern ADA design. A site inventory revealed the following
additional signal phasing data:
Three-phase (protected-permissive in the northbound direction with permissive
turns on all other legs) signal operation running at a 65 second cycle length
Countdown timers present on all legs
Leading pedestrian phase on north and south legs

Analysis Procedure Manual Version 2 14-89 Last Updated 11/2018
Right-turn-on-red prohibited on east leg
Source: Google Earth, 2017.
The individual criteria scores were determined from the methodology for each leg and are
shown below with the general reason behind the score. Since all curb ramps are of
modern ADA design and are in good condition, there is no limitation on the maximum
number of points that a leg can have.
Criteria Score
North Leg East Leg South Leg West Leg
Crossing
Distance
5 lane
equivalents =
50 pts1
2 lanes = 78 pts
5 lane
equivalents =
50 pts1
3 lanes = 76 pts
Left turn
conflicts
No conflict
= 15 pts
No conflict
= 15 pts
Yes
(WB
permissive
turn) = -5 pts
Yes
(NB protected-
permissive
turn) = 0 pts
Left turn-on-
red Does not apply
Allowed
= 0 pts Does not apply
One-way street
adjustment Does not apply Yes = -10 pts
Right turn
conflicts
Yes
(WB
permissive
turn) = -5 pts
No conflict
= 15 pts
No conflict
= 15 pts
Yes
(SB permissive
turn) = -5 pts
Right turn-on-
red
Allowed
= 0 pts
WB prohibited
= 5 pts
No conflict
= 5 pts
No conflict
= 5 pts
Pedestrian
signal displays
Leading
pedestrian
phase &
Countdown
timers = 5 pts
Leading
pedestrian
phase &
Countdown
timers = 5 pts
NORTH
NO SCALE

Analysis Procedure Manual Version 2 14-90 Last Updated 11/2018
Criteria Score
North Leg East Leg South Leg West Leg
countdown
timers = 8 pts
countdown
timers = 8 pts
Pedestrian
delay
Three phase signal with >90 seconds cycle = 0 pts
Corner radius 15’ effective radius = 10 pts
Crosswalk
treatments Transverse striping = 0 pts
Leg Totals 78 128 83 81
Leg LOS B A B B
Intersection
LOS
= (78 + 128 + 83 + 81) / 4 = 92 B
1Note that the placement of the railroad tracks lengthens the overall crossing distance as there so safe place
to wait between the tracks and the street for westbound pedestrians. The “official” waiting area also makes
it more difficult for drivers to notice the pedestrians as they are more focused on the corner. Eastbound
pedestrians are easier to see. The extra distance is approximately 24 feet but affects westbound more than
eastbound, so one extra lane equivalent was added to the total crossing width of this leg
Bicycle Signalized Intersection LOS
The major issues for a bicyclist crossing at a signalized intersection are the amount of
separation from motor vehicles and the overall traffic speed. Most people desire the
greatest separation as possible from faster moving vehicles in order to achieve the desired
comfort (stress) level. Features that maximize separation between vehicles and bicyclists
are awarded the most points while ones that have minimal or no separation are penalized.
Turning conflicts, crossing distance (exposure), and traffic signal features are somewhat
less important, but still prominent for overall safety needs. The factors included in the
methodology affecting the bicyclist focus on separation, speed, signal phasing, physical
distances, intersection layout and turning conflicts, while volumes are handled implicitly.
Bicycle Facility & Adjacent Traffic Speed
The space dedicated to bicyclists including any separation from the motor vehicle traffic
stream and the speed of that stream are the largest factors in determining the quality of
the intersection crossing. Higher speeds (and related volumes) add difficulty for the
bicyclist on intersection approaches, especially in the conflict areas around right turn
lanes. Bicycle facilities that greater separate the bicyclist from adjacent traffic rate the
best while conditions that force the bicyclist to share the lane rate the worst. Points
decrease as roadway speed increases and/or separation decreases. Sharing roadway space
works best when the speeds are low (20-25 mph) as the bicyclist can generally keep pace
with traffic. Higher speeds at 30 mph or more require some sort of separation such as
standard, buffered or separated bike lanes. Exhibit 14-48 illustrates the arriving and
departing legs on an approach as to be used in Exhibit 14-49. Exhibit 14-49 through
Exhibit 14-53 show the point values for a given bike facility type on an arrival leg bike
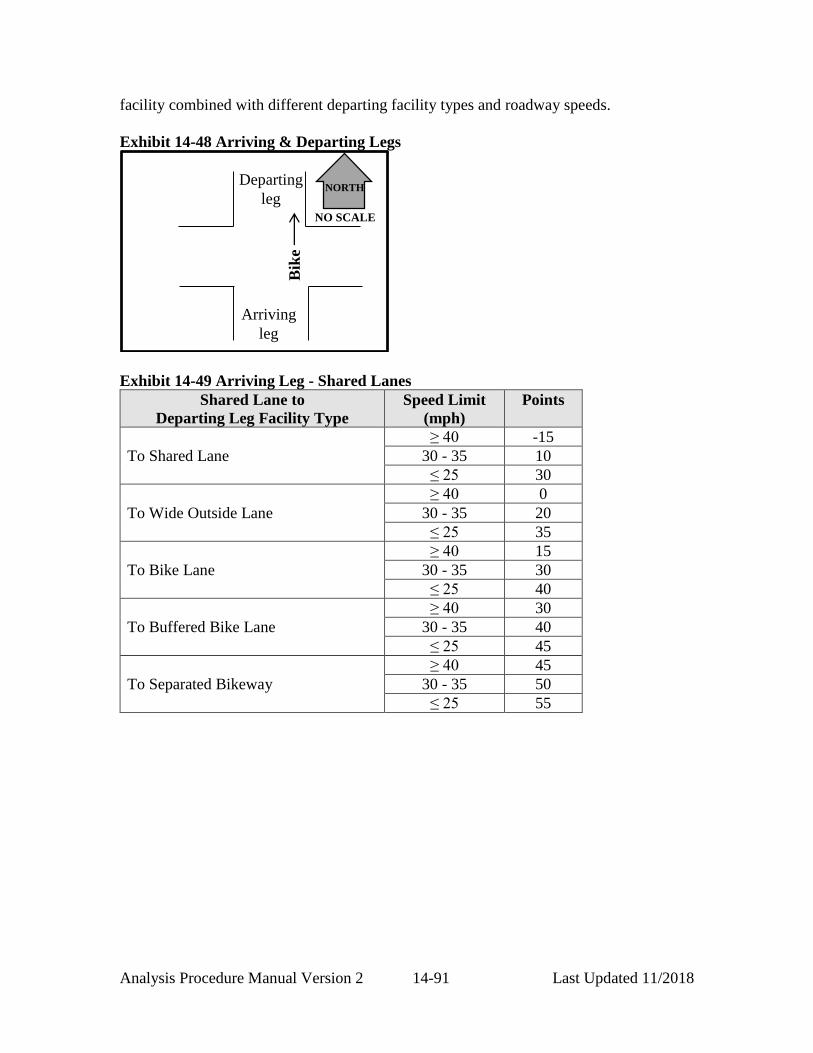
Analysis Procedure Manual Version 2 14-91 Last Updated 11/2018
facility combined with different departing facility types and roadway speeds.
Exhibit 14-48 Arriving & Departing Legs
Exhibit 14-49 Arriving Leg - Shared Lanes
Shared Lane to
Departing Leg Facility Type
Speed Limit
(mph)
Points
To Shared Lane
≥ 40 -15
30 - 35 10
≤ 25 30
To Wide Outside Lane
≥ 40 0
30 - 35 20
≤ 25 35
To Bike Lane
≥ 40 15
30 - 35 30
≤ 25 40
To Buffered Bike Lane
≥ 40 30
30 - 35 40
≤ 25 45
To Separated Bikeway
≥ 40 45
30 - 35 50
≤ 25 55
Bik
e
Departing
leg
Arriving
leg
NORTH
NO SCALE
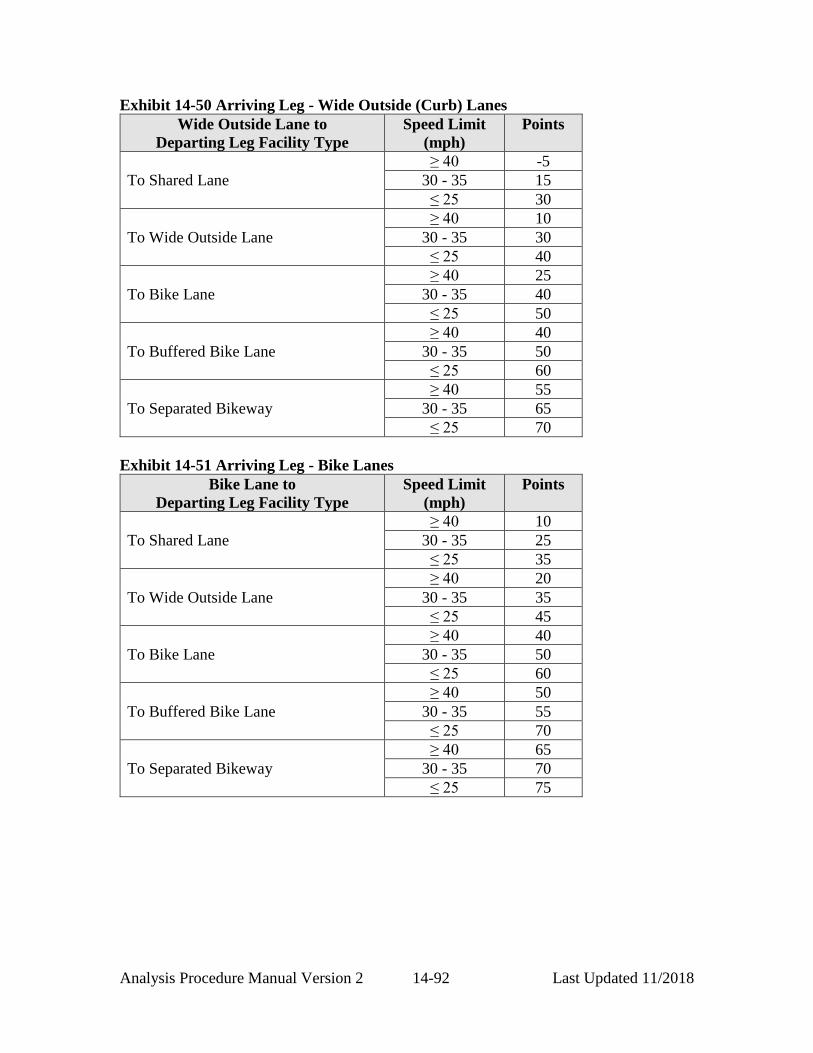
Analysis Procedure Manual Version 2 14-92 Last Updated 11/2018
Exhibit 14-50 Arriving Leg - Wide Outside (Curb) Lanes
Wide Outside Lane to
Departing Leg Facility Type
Speed Limit
(mph)
Points
To Shared Lane
≥ 40 -5
30 - 35 15
≤ 25 30
To Wide Outside Lane
≥ 40 10
30 - 35 30
≤ 25 40
To Bike Lane
≥ 40 25
30 - 35 40
≤ 25 50
To Buffered Bike Lane
≥ 40 40
30 - 35 50
≤ 25 60
To Separated Bikeway
≥ 40 55
30 - 35 65
≤ 25 70
Exhibit 14-51 Arriving Leg - Bike Lanes
Bike Lane to
Departing Leg Facility Type
Speed Limit
(mph)
Points
To Shared Lane
≥ 40 10
30 - 35 25
≤ 25 35
To Wide Outside Lane
≥ 40 20
30 - 35 35
≤ 25 45
To Bike Lane
≥ 40 40
30 - 35 50
≤ 25 60
To Buffered Bike Lane
≥ 40 50
30 - 35 55
≤ 25 70
To Separated Bikeway
≥ 40 65
30 - 35 70
≤ 25 75

Analysis Procedure Manual Version 2 14-93 Last Updated 11/2018
Exhibit 14-52 Arriving Leg - Buffered Bicycle Lanes
Buffered Bike Lane to
Departing Leg Facility Type
Speed Limit
(mph)
Points
To Shared Lane
≥ 40 20
30 - 35 30
≤ 25 40
To Wide Outside Lane
≥ 40 30
30 - 35 40
≤ 25 50
To Bike Lane
≥ 40 50
30 - 35 55
≤ 25 65
To Buffered Bike Lane
≥ 40 60
30 - 35 65
≤ 25 75
To Separated Bikeway
≥ 40 70
30 - 35 75
≤ 25 80
Protected intersections are a new intersection treatment that has a wide appeal by
separating the bicyclist from vehicles and pedestrians on all approaches. These allow for
better visibility for drivers when turning right. These can be analyzed by using Exhibit
14-53 with a separated bikeway as the departing leg. If exclusive bicycle signal phasing
exists then no left or right vehicle turn conflicts can be additionally assumed.
Exhibit 14-53 Arriving Leg - Separated Bikeways
Separated Bikeway to
Departing Leg Facility Type
Speed Limit
(mph)
Points
To Shared Lane
≥ 40 35
30 - 35 40
≤ 25 45
To Wide Outside Lane
≥ 40 40
30 - 35 45
≤ 25 55
To Bike Lane
≥ 40 60
30 - 35 70
≤ 25 75
To Buffered Bike Lane
≥ 40 70
30 - 35 75
≤ 25 80
To Separated Bikeway
≥ 40 80
30 - 35 85
≤ 25 90

Analysis Procedure Manual Version 2 14-94 Last Updated 11/2018
Left Turn Conflicts
Left turn conflicts can be problematic for bicyclists as turning vehicles are typically
travelling at higher speeds than right turns. Drivers may not see a bicyclist if they are
concentrating on getting through a gap in traffic. The greatest chance of conflict is when
the left-turn is permissive rather than purely protected. Intersection and signalization
features that reduce or eliminate conflicts are rated the best and are the second
contributing highest factor in the methodology. Exhibit 14-54 shows the bicycle-vehicle
crossing conflicts and Exhibit 14-55 shows the point values for the opposing left turn
conflicts. Left turn conflicts are coded by the approaching (arriving) leg, so the
southbound left turn conflicts in Exhibit 14-54 are coded to the north leg.
Exhibit 14-54 Bicycle-Vehicle Crossing Conflicts
Exhibit 14-55 Left Turn Conflicts
Left Turn Phase Type1 Points
Permissive 0
Protected-permissive 5
Protected 15
No turn conflict – “T” intersection or one-way streets 15
Left Turn Adjustments
Green “conflict area” paint 5
Two-stage turn box 10
Stop Bar Location
Shared stop bar – vehicles and bikes stop at common point 0
Advance stop bar/bike box – bikes stop closer to
intersection 10
1Left turn type that is opposing to the oncoming bicyclist.
Right
Turn
Conflict
Left
Turn
Conflict
Bik
e
Right turn-on-red
Conflict
NORTH
NO SCALE

Analysis Procedure Manual Version 2 14-95 Last Updated 11/2018
Right Turn Conflicts
The most common right turn conflict involves a vehicle turning right and a bicycle
heading straight (“right-hook”). The right turn conflict depends on the approach treatment
at the intersection between the positioning of the right turn lane and the bicycle facility.
Right turn conflicts are coded to the arriving approach leg, so as shown in Exhibit 14-54,
the right turn conflict on the northbound approach is coded to the south leg. The most
desirable combination is to have the bicyclist traveling straight while the vehicle yields
and merges to the right (bicycle lane is to the left of the right turn lane) as shown in
Exhibit 14-56(a). Higher speeds and/or volumes may give bicyclists pause especially if
there is a lack of yielding to bicyclists as vehicles cross over the bike lane to access the
right turn lane. Longer right turn lanes, especially under higher volume conditions can
create “sandwich” feeling for the bicyclist which can limit the actual use of the bike lane
on the approach. It is recommended that coordination with either Region Traffic or
Traffic-Roadway Section staff be done if higher speeds and volumes are prevalent in the
study area as the point assignment may need to be modified.
Configurations that require the bicyclist to shift left (Exhibit 14-56(b) or (c)) are awarded
little or no points as the vehicle yielding behavior is less as there is too much of a straight
shot into the right turn lane without a conscious need to move to the right. Exhibit
14-56(b) shows an older marking style while Exhibit 14-56(c) shows the current style.
Both require bicyclists to shift to the left and are progressively more difficult to make as
right turning volumes increase. Intersection approaches that do not have a bike facility
require the bicyclist to share the vehicle lanes and shift left should also use Exhibit
14-56(e). Sharrow markings are optional for shared right turn lanes as shown in Exhibit
14-56(e).
The least desirable configuration is Exhibit 14-56(d) where the bike lane is to the right of
the right turn lane. This configuration limits the ability of the driver to see any oncoming
bicyclists as many drivers fail to check the right hand mirror and blind spot which could
result in a “right-hook” crash. This conflict can be removed with a presence of a bicycle
signal by prohibiting right turning traffic while bicyclists have a green (and vice versa
when vehicular traffic has a green). A bicycle signal can make this particular
configuration significantly better than the standard design in Exhibit 14-56(a) by
eliminating the turn conflict. However, this configuration should only be allowed with a
bicycle signal. Adding bicycle signals will either require a significant bicycle volume, a
high right turn volume or both. The presence of green paint in the conflict areas shows
both drivers and bicyclist to be aware of potential conflicts and thus gets a positive point
Adding bicycle signal phases will impact operation of the entire intersection as
there will be less time for the other motor vehicle phases. Bicycle signal phases
may also result in more delay for bicyclists as they would be prohibited from
traveling with the vehicular phases. This tradeoff will need to be evaluated in
context of all users, the local environment and the community.

Analysis Procedure Manual Version 2 14-96 Last Updated 11/2018
adjustment.
Exhibit 14-56 Bike Lane Alignments
Right-turn on-red movements also create a safety issue as drivers are looking for
approaching vehicles and may not see an oncoming bicyclist. Adjustments for right turn
and right-turn-on-red conflicts are shown in Exhibit 14-57.
a) Straight Bike Lane
Alignment
e) Bike Lane Enters
Shared Right Turn Lane
d) Lane Drop – allowed
only with a bike signal
b) Left Bike Lane
Alignment (Lane drop)
c) Left Bike Lane
Alignment

Analysis Procedure Manual Version 2 14-97 Last Updated 11/2018
Exhibit 14-57 Right Turn Conflicts
Right Turn Conflict Type Points
No exclusive right turn lane 5
Exclusive
right turn
lane
Right turn lane <500’ develops to
the right of bike lane. Bike lane is
left of right turn lane.
(Exhibit 14.57a)
0
Right turn lane ≥500’ develops to
the right of bike lane. Bike lane is
left of right turn lane.
(Exhibit 14.57a)
-15
Right turn lane drop, bike lane
shifts left
(Exhibit 14.57b or c)
-10
Bike lane enters <100’ (including
taper) shared right turn lane. Right
turn lane volume <75 vph and at
<25 mph (Exhibit 14.57e)
0
Bike lane enters <100’ (including
taper) shared right turn lane. Right
turn lane volume <150 vph and at
<25 mph (Exhibit 14.57e)
-5
Bike lane enters >100’ (including
taper) shared right turn lane or
right turn lane volume >150 vph or
>25 mph (Exhibit 14.57e)
-10
No bike lane 0
Bike lane right of right turn lane
(Exhibit 14-57d) -20
Bike lane right of right turn lane
with bike signal 15
No right turn conflict
(“T” intersection, one-way street) 15
Right Turn Adjustments
Green “conflict area” paint 5
Shared lane use marking in shared lane 5
Right Turn-on-red Conflict
Allowed 0
Prohibited or no conflict 5
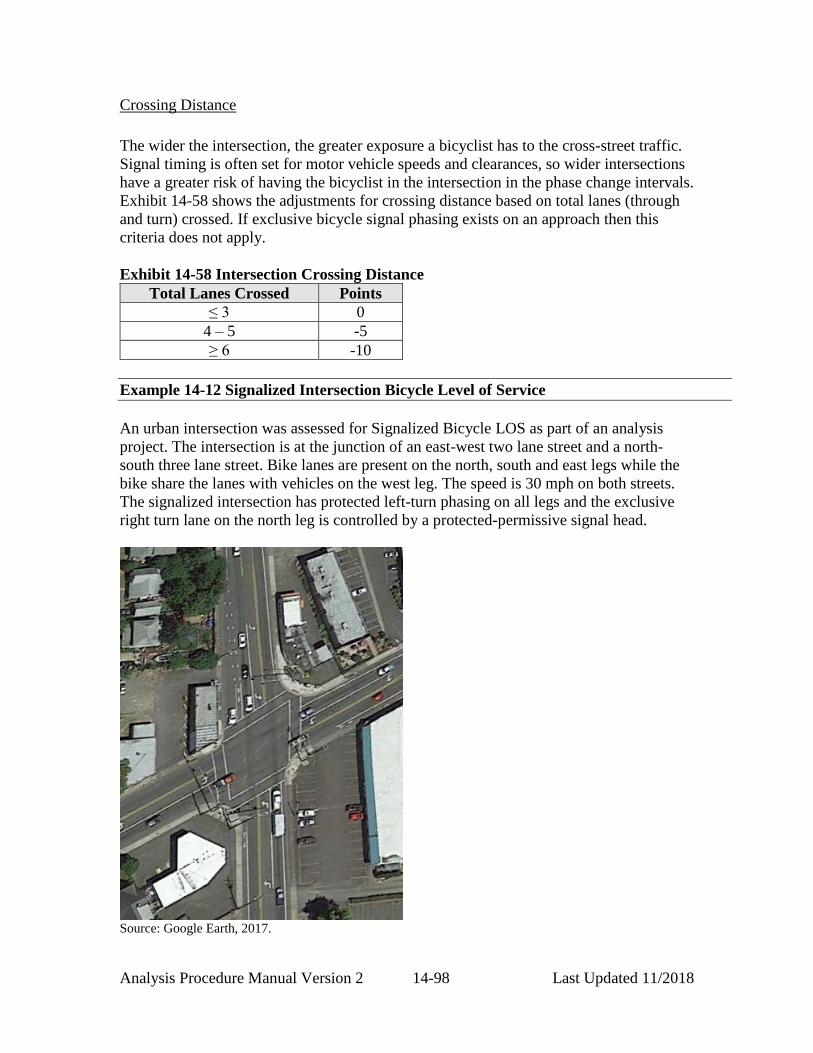
Analysis Procedure Manual Version 2 14-98 Last Updated 11/2018
Crossing Distance
The wider the intersection, the greater exposure a bicyclist has to the cross-street traffic.
Signal timing is often set for motor vehicle speeds and clearances, so wider intersections
have a greater risk of having the bicyclist in the intersection in the phase change intervals.
Exhibit 14-58 shows the adjustments for crossing distance based on total lanes (through
and turn) crossed. If exclusive bicycle signal phasing exists on an approach then this
criteria does not apply.
Exhibit 14-58 Intersection Crossing Distance
Total Lanes Crossed Points
≤ 3 0
4 – 5 -5
≥ 6 -10
Example 14-12 Signalized Intersection Bicycle Level of Service
An urban intersection was assessed for Signalized Bicycle LOS as part of an analysis
project. The intersection is at the junction of an east-west two lane street and a north-
south three lane street. Bike lanes are present on the north, south and east legs while the
bike share the lanes with vehicles on the west leg. The speed is 30 mph on both streets.
The signalized intersection has protected left-turn phasing on all legs and the exclusive
right turn lane on the north leg is controlled by a protected-permissive signal head.
Source: Google Earth, 2017.

Analysis Procedure Manual Version 2 14-99 Last Updated 11/2018
The individual criteria scores were determined from the methodology for each leg and are
shown below with the general reason behind the score.
Criteria Score
North Leg East Leg South Leg West Leg
Bicycle Facility
and Traffic
Speed
Bike lane to
bike lane; 30
mph = 50 pts
Bike lane to
shared lane; 30
mph = 25 pts
Bike lane to
bike lane; 30
mph = 50 pts
Shared lane to
bike lane; 30
mph = 30 pts
Left turn
conflicts
Protected
phasing = 15
pts
Protected
phasing = 15
pts
Protected
phasing = 15
pts
Protected
phasing = 15
pts
Stop Bar
Location
Shared stop
bar = 0 pts
Shared stop bar
= 0 pts
Shared stop bar
= 0 pts
Shared stop bar
= 0 pts
Right turn
conflicts
Exclusive
right lane;
bike lane
shifts left =
-10 pts
No exclusive
right turn lane
= 5 pts
No exclusive
right turn lane
= 5 pts
No exclusive
right turn lane
= 5 pts
Right turn-on-
red
Allowed = 0
pts
Allowed = 0
pts
Allowed = 0
pts
Allowed = 0
pts
Intersection
Crossing
Distance
3 lanes
crossed = 0 pts
4 lanes crossed
= -5 pts
3 lanes crossed
= 0 pts
3 lanes crossed
= 0 pts
Leg Totals 55 40 70 50
Leg LOS C D C D
Intersection
LOS
= (55 + 40 + 70 + 50) / 4 = 54 D
14.7 Transit LOS
14.7.1 Methodology Summary
Unlike the simplified Pedestrian and Bicycle LOS methods, there is no re-estimated
Transit LOS. Instead, this is a streamlined version of the regular HCM Transit LOS
methodology using simplifying assumptions and specific defaults. The full transit
methodology involves calculating transit vehicle running time, delay, and speeds, then
determining impacts caused by waiting times, stop amenities, and pedestrian access. Like
with other MMLOS methods, the methodology is done separately for each direction of
travel. This simplified method should only be applied to segments within the study area
that have applicable fixed-route transit.
It also would be possible to estimate the Transit LOS within a travel demand model if
transit routes were considered explicitly so the frequency could be captured. The travel
times for the various route segment would need to be summed across each major segment
and the other inputs likely defaulted with use of some custom variables or expressions.
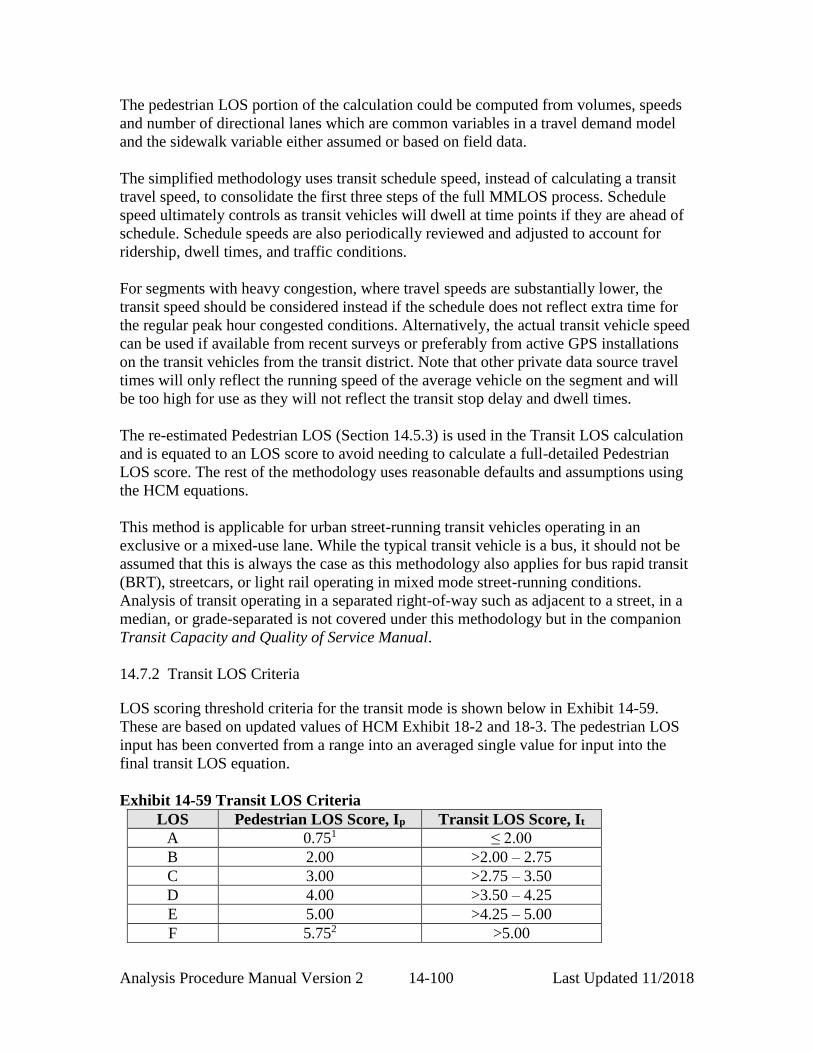
Analysis Procedure Manual Version 2 14-100 Last Updated 11/2018
The pedestrian LOS portion of the calculation could be computed from volumes, speeds
and number of directional lanes which are common variables in a travel demand model
and the sidewalk variable either assumed or based on field data.
The simplified methodology uses transit schedule speed, instead of calculating a transit
travel speed, to consolidate the first three steps of the full MMLOS process. Schedule
speed ultimately controls as transit vehicles will dwell at time points if they are ahead of
schedule. Schedule speeds are also periodically reviewed and adjusted to account for
ridership, dwell times, and traffic conditions.
For segments with heavy congestion, where travel speeds are substantially lower, the
transit speed should be considered instead if the schedule does not reflect extra time for
the regular peak hour congested conditions. Alternatively, the actual transit vehicle speed
can be used if available from recent surveys or preferably from active GPS installations
on the transit vehicles from the transit district. Note that other private data source travel
times will only reflect the running speed of the average vehicle on the segment and will
be too high for use as they will not reflect the transit stop delay and dwell times.
The re-estimated Pedestrian LOS (Section 14.5.3) is used in the Transit LOS calculation
and is equated to an LOS score to avoid needing to calculate a full-detailed Pedestrian
LOS score. The rest of the methodology uses reasonable defaults and assumptions using
the HCM equations.
This method is applicable for urban street-running transit vehicles operating in an
exclusive or a mixed-use lane. While the typical transit vehicle is a bus, it should not be
assumed that this is always the case as this methodology also applies for bus rapid transit
(BRT), streetcars, or light rail operating in mixed mode street-running conditions.
Analysis of transit operating in a separated right-of-way such as adjacent to a street, in a
median, or grade-separated is not covered under this methodology but in the companion
Transit Capacity and Quality of Service Manual.
14.7.2 Transit LOS Criteria
LOS scoring threshold criteria for the transit mode is shown below in Exhibit 14-59.
These are based on updated values of HCM Exhibit 18-2 and 18-3. The pedestrian LOS
input has been converted from a range into an averaged single value for input into the
final transit LOS equation.
Exhibit 14-59 Transit LOS Criteria
LOS Pedestrian LOS Score, Ip Transit LOS Score, It
A 0.751 ≤ 2.00
B 2.00 >2.00 – 2.75
C 3.00 >2.75 – 3.50
D 4.00 >3.50 – 4.25
E 5.00 >4.25 – 5.00
F 5.752 >5.00

Analysis Procedure Manual Version 2 14-101 Last Updated 11/2018
1The average score for LOS A is based on the minimum value of 0.00 and the highest score of 1.5. 2The average score for LOS F is based on the maximum value of 6.0 in HCM Equation 18-63 and the
minimum value of 5.50.
Like with the other modes, these LOS scores are based on user perceptions (traveler
satisfaction) and are graded from best (LOS A) to worst (LOS F). This kind of
perception-based rating varied from the many test respondents (there is no one single
definition of a multimodal LOS grade) and was eventually grouped into LOS ranges.
Better conditions will result in better LOS scores. For example, more frequent transit
service will rate better than less frequent service.
Transit LOS is heavily influenced by frequency, and frequency is influenced by land use
density and availability of capital (vehicles) and operating (employees) funds. Therefore,
a low LOS score may simply reflect the maximum feasible capability of a transit district
on a particular route and should not be immediately equated with “poor” service. Better
service (and LOS) may not be possible because of restricted funding and/or the land use
is not dense enough to support it. The funding context of a particular transit district needs
to be taken into account when reporting Transit LOS values.
Data Needs and Definitions
Transit Schedule Speed (St) – This is the speed (mph) calculated by dividing a known
segment length by the difference of two adjacent time points published in the route
timetable. If a segment covers parts of two sets of time points, then the resulting schedule
speeds should be weight averaged. If there is more than one route on a given segment,
then the schedule speeds should be averaged or weight averaged if frequencies are
different.
Transit Frequency (vs) – This is the number of transit vehicles per hour on the
directional segment. Sum up the frequency of all routes that may travel this segment.
Start with the route that has the highest frequency during the analysis hour(s). For
additional routes, note which times are offset versus ones that seem to duplicate.
For instance, a 60-minute route that runs on the same schedule as another 60-minute
route will result in one vehicle following another and should only be coded as one vehicle
per hour. If the two routes were offset (say one on the hour and the other on the half-
hour), then code this as two vehicles per hour. The route duplication does not have the
same frequency benefit for the rider compared to a more even time spacing.
For corridors with very frequent service, like with in-road bus rapid transit or light -rail
transit, consider these routes to likely control the segment as the short headways
(typically less than 10 minutes) makes it unlikely that additional routes will have times
that do not duplicate, so there will not be any additional frequency benefit. Only consider
“tripper” service (additional frequency and/or minor route changes to serve schools) if it
is active during the chosen analysis period.
From the transit frequency, the headway factor (Fh) is computed from HCM Equation 18-

Analysis Procedure Manual Version 2 14-102 Last Updated 11/2018
56:
Fh = 4.00e-1.434/ (vs+0.001)
All of the following inputs are defaults with the exception of needing the Pedestrian LOS
data in Section 14.5.3.
Passenger Load Factor (a1) – For this simplified methodology, this factor is assumed to
be 1.0, which represents that, on the average of all transit vehicles using that segment in
the desired time period, they are 80% or less full (0.8 passengers per seat). On congested
segments where passenger per seat ratios are higher than 80% and up to 100%, use
passenger load factors in or the 2nd case of HCM Equation 18-59. If overcrowding exists
on the average where the numbers of passengers exceed the number of seats (presence of
standees), please refer to the 3rd case of HCM Equation 18-59 for computing the
appropriate passenger loading factor.
Exhibit 14-60 or the 2nd case of HCM Equation 18-59. If overcrowding exists on the
average where the numbers of passengers exceed the number of seats (presence of
standees), please refer to the 3rd case of HCM Equation 18-59 for computing the
appropriate passenger loading factor.
Exhibit 14-60 Passenger Load Factors1
Passenger to Seat
Ratio
Passenger Load
Factor(a1)
<0.81 1.00
0.85 1.05
0.90 1.10
0.95 1.14
1.00 1.19
>1.00 Use HCM Equation
18-59 1Derived from Highway Capacity Manual 6th Edition Equation 18-59
Other general defaults are the threshold late time, which is the time that transit agencies
typically consider a vehicle late, set at 5.0 minutes, and the proportion of transit vehicles
arriving within the late time threshold, set at 0.75 (75% considered to be on-time). The
late time threshold proportion value could be adjusted if it is desired to estimate
reliability impacts. Both of these can be changed if more specific information is available
from a transit district.
A large part of the full methodology involves calculating perceived travel time rates and
factors which involves the transit speed, on-time ability, and stop amenities such as
benches and shelters. Passengers generally view excess waiting time worse than slower
travel speeds, but may wait longer if there are amenities.
With the above default threshold late time and the on-time arrival percentage in HCM

Analysis Procedure Manual Version 2 14-103 Last Updated 11/2018
Equation 18-61, a fixed excess wait time of 1.6 minutes is calculated. The excess wait
time is converted into the excess wait time rate of 0.41 min/mi by dividing the excess
wait time by the average trip length of 3.8 miles based on reported Oregon transit system
data in the National Transit Database. The proportion of shelters and benches in the full
methodology has been found not to be very sensitive10 to the final results and is ignored
in this simplified method. The perceived travel time rate (HCM Equation 18-58)
equation can be simplified with the above defaults and simplifications to:
Tptt (min/mi) = 60/St +0.86, where St is the transit schedule speed
Use the equation form Tptt (min/mi) = a1[60/St] +0.86, where a1 is the passenger loading
factor, if the default 1.0 value was not used.
The perceived travel time factor (Ftt) is a combination of the perceived travel time rate
and the base travel time rate, which is assumed to be defaulted at 4.0 min/mi for areas
below five million in population. There also is a default ridership elasticity factor of -0.40
which considers changes in the travel time rate. Using the above defaults in HCM
Equation 18-57, the equation reduces to:
Ftt = (5.6 + 0.6Tptt) / (1.4Tptt + 2.4)
The final Transit LOS score (It) is the combination of the wait-ride score and the
Pedestrian LOS score (Ip) based on HCM Equation 18-63. The wait-ride score portion of
the equation is the product of the perceived travel time factor Ftt and the headway factor
Fh.
It = 6.0 – 1.5 (Fh * Ftt) + 0.15Ip
The Pedestrian LOS (Ip) is calculated for the directional segment using the methodology
in Section 14.5.3. Since the Pedestrian LOS from Section 14.5.3 is based on a probability
of the entire range, the average LOS score is used for Ip in Exhibit 14-59, which is based
on HCM Exhibit 18-3. If the Pedestrian LOS results in a range of levels, then the
appropriate Pedestrian LOS scores in the second column in Exhibit 14-59 should be
averaged together. The Transit LOS score (It) is then compared to the transit score range
in the third column in Exhibit 14-59 to determine the final LOS for the directional
segment.
Example 14-13 Transit LOS
The same suburban arterial segment from the previous examples is used to continue the
multimodal analysis. There are two transit routes on this roadway segment, one on 15-
minute and one on 30-minute headways. The schedules are offset enough so the 30-
10 Carter, P., Martin, F., Nunez, M., Peters, S., Raykin, L., Salinas, J., et al. (2013). Complete Enough for
Complete Streets? Senstivity Testing of Multimodal Level of Service in the Highway Capacity Manual.
Transportation Research Record: Journal of the Transportation Research Board, No,2395, 36-37.

Analysis Procedure Manual Version 2 14-104 Last Updated 11/2018
minute route does not directly overlap the 15-minute route. For the analysis period, both
routes are operating less than 80% full.
The first step is to calculate the schedule speed of the directional segment. For the 15-
minute headway route, the available transit schedule shows seven minutes to travel from
time point A to B. Measurement of the distance via aerial photos between A and B results
in 5405 feet. The 30-minute route shows four minutes (apparently assuming less stops)
between its time points C and D that bracket the analysis segment. The distance from C
to D is measured as 6150 feet.
The schedule speed (St15) for the 15-minute route is calculated as:
St15 = (segment length in feet / 5280 feet per mile) / (travel time in minutes / 60
minutes per hour)
= (5405 ft / 5280 ft/mi) / (7 min / 60 min/hr)
= 1.024 mi / 0.117 hr
= 8.75 mph
The schedule speed (St30) for the 30-minute route is calculated as:
St30 = (segment length in feet / 5280 feet per mile) / (travel time in minutes / 60
minutes per hour)
= (6150 ft / 5280 ft/mi) / (4 min / 60 min/hr)
= 1.165 mi / 0.067 hr
= 17.48 mph
The average schedule speed (St) is weight averaged between the two routes as the 15-
minute route has four vehicles per hour (67% of total) and the 30-minute route has two
vehicles per hour (33% of total) for a total of six.
St = 8.75(0.67) + 17.48(0.33)
= 11.63 mph
Next, the headway factor (Fh) is computed from the overall transit frequency (6 veh/hr):
Fh = 4.00e-1.434/ (vs+0.001)
= 4.00e-1.434/ (6+0.001) = 3.15
The perceived travel time rate (Tptt) is computed from the overall schedule speed:
Tptt = 60/St + 0.86
=60/11.63 + 0.86
= 6.02 min/mi
The perceived travel time rate (Tptt) is inserted into the simplified travel time factor (Ftt)
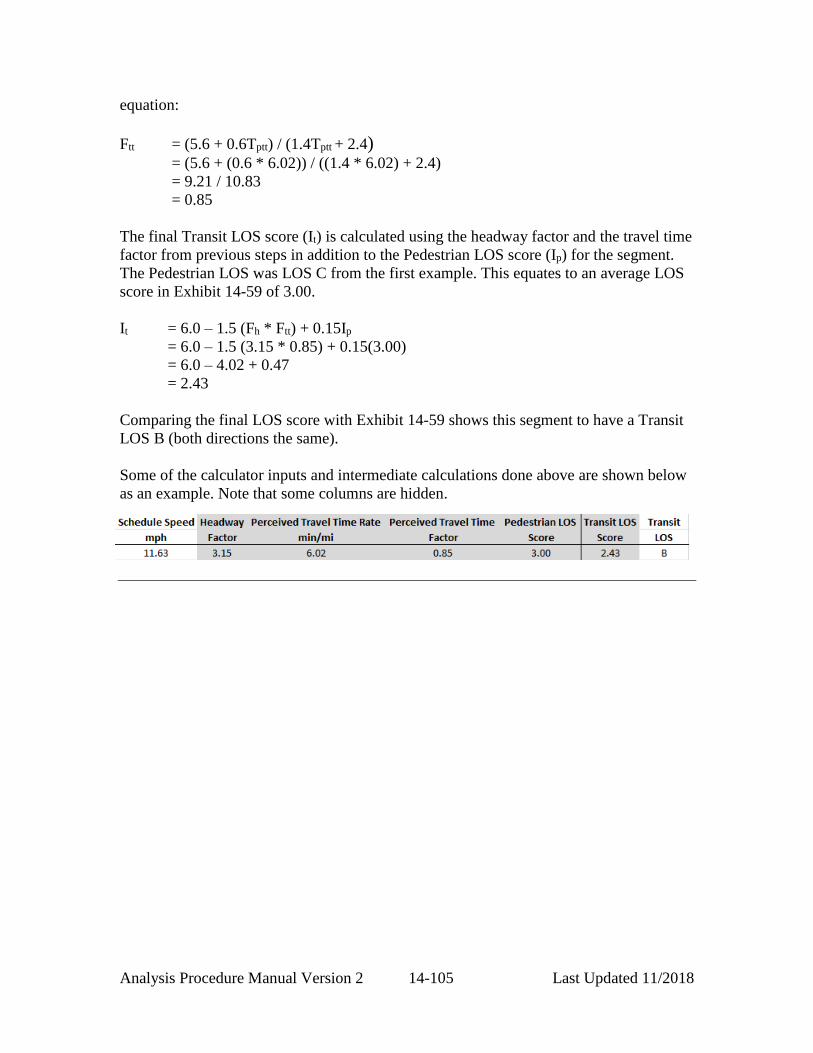
Analysis Procedure Manual Version 2 14-105 Last Updated 11/2018
equation:
Ftt = (5.6 + 0.6Tptt) / (1.4Tptt + 2.4) = (5.6 + (0.6 * 6.02)) / ((1.4 * 6.02) + 2.4)
= 9.21 / 10.83
= 0.85
The final Transit LOS score (It) is calculated using the headway factor and the travel time
factor from previous steps in addition to the Pedestrian LOS score (Ip) for the segment.
The Pedestrian LOS was LOS C from the first example. This equates to an average LOS
score in Exhibit 14-59 of 3.00.
It = 6.0 – 1.5 (Fh * Ftt) + 0.15Ip
= 6.0 – 1.5 (3.15 * 0.85) + 0.15(3.00)
= 6.0 – 4.02 + 0.47
= 2.43
Comparing the final LOS score with Exhibit 14-59 shows this segment to have a Transit
LOS B (both directions the same).
Some of the calculator inputs and intermediate calculations done above are shown below
as an example. Note that some columns are hidden.