14. tide -...
TRANSCRIPT

14. Tide
Low and high tide at the Bay of Fundy (Maine, USA):
The moon and the earth move around each other and around
the sun ⇒ TIDE
1

A simplified model for explaining tides
Colin Maclaurin (1698-1746), a Scottish mathemati-
cian, showed that a smooth sphere covered by a suf-
ficiently deep ocean under the tidal force of a single
deforming body is a prolate spheroid.
If we assume that (i) we can neglect the rota-
tion of the moon around the earth and the ef-
fect of the Sun, (ii) the earth can be modeled
by MacLaurin’s sphere, (iii) it is relevant to use
a quasi-static model for ocean dynamics ⇒ We
have an explanation for why there are two high
tides and two low tides per day.
2

(i-A) Effect of the rotation of the moon around the earth.
The moon orbits once every 28 days around the earth ⇒ the tidal
period is not 12 hours but 12 hours and 25.2 minutes.
(i-B) Effect of the sun on the
tides. The effect of the moon on
tides is much bigger than the effect
of the sun (which is much further
from the earth). At full moon and
at new moon, the effects of the
sun and the moon reinforce each
other, and the resulting big tides
are called spring tides. At the in-
tervening half-moons, the imbal-
ances cancel out and the tides are
smaller.
3

(ii) The earth cannot be modeled by a MacLaurin’s sphere.
Continents get in the way of tidal waves. The true behavior of tides
is more complicated. In the Atlantic Ocean, tidal crests and troughs
form but are unable to move around the earth; instead they more
around a perimeter of the ocean in an anticlockwise direction; this
takes about 25 hours.
(iii¡) What about the limitations of the quasi-static model? It
cannot explain the dynamics of the propagation of the tidal waves.
The quasi-static model also ignores the Corriolis force that plays an
important role and explains, for example, why tides in the English
channel are bigger on the French side.
4

Raw incoming tidal power
Tidal waves arrive from the Atlantic and
move at a speed of around 70 km/h.
Power that can be extracted from tides
can never be larger than the total power
from these waves, which have an av-
erage power of 250 GW, that’s around250×109×24
60×106×1000' 100 kWh per day per per-
son.
There are two technologies for extracting power from these tidal
waves: tidal farms and tidal pools. Tidal pools can be created
either by building barrages or lagoons.
5

Tidal stream farms
These extract energy in the
same way wind farms do.
If we assume that the same
rules apply to tidal stream
farms as wind farms, we
have that the power per unit
sea-floor area is: π200
12ρU
3
where ρ is the density of wa-
ter and U the speed of tidal
currents.
6

Regions around the British Isles
where peak tidal flows exceed 1
m/s. Red regions have water
depths greater than 100 m.
If tidal farms were to be placed in these areas, an estimated 9kWh/d per person could be generated.
7

Tidal pool
A tidal pool is an artificial pool next
to the sea, with a water-wheel/hydraulic
generator that is turned as the pool fills
or empties. The pool is filled at high tide
and is emptied at low tide.
A superb and ambitious project would be to transform the North Seainto a water pool:
8

Estimating the amount of power a tidal pool can deliverLet us estimate the power (per m2) of
an artificial tide pool that’s filled rapidly
at high tide and emptied rapidly at low
tide, generating power from both flow di-
rection. Let h = range2 and ε the efficiency
of the hydraulic generator
Phase A. The pool is at height range and there is low water in the sea. Mass ofwater per m2 = 2ρh. The change in potential energy of the water per m2 of tidalpool when flowing from the tidal pool to the sea: 2ρhgh.
Phase B. The pool is at height 0 and there is high water in the sea. The changein the water’s energy when flowing from the sea to the tidal pool: 2ρhgh.
Two phases A and B per day ⇒ Potential energy per unit area of a tidal pool that
can be exploited per day to generate electricity: 8ρhgh.
9

We therefore have a power per unit area of tidal pool equal to:
8ρ× h2 × g × ε3600× 24
By assuming a range equal to 4 m (i.e., h = 2 m) for tides and an
efficiency ε = 0.9, we have a power per unit area of tidal pool16ρ×h2×g×0.9
3600×24 '3.3 W/m2.
Since the area of the North Sea is 750,000 km2, by transforming it
into a tidal pool, we could extract 3.3×750,000×106×2460×106×1000
' 990
kWh/d per person ?!???!!!!???? ⇒ incorrect assumptions. The
pool model does not apply to the North Sea for several reasons:
h = 2 m is what is observed in estuaries but not everywhere in the
North Sea, the size of the North Sea is not negligible with respect to
the length of the tidal waves, etc.
10

Tidal pools with pumping
The pumping trick artificially increases the amplitude of the tides
in a tidal pool so as to amplify the power obtained. At high tide,
water is pumped into the tidal pool until a height b+ 2× h is
reached. The energy cost of pumping in extra water at high tide is
repaid with interest when the same water is let out at low tide.
Let us assume that generation has an efficiency of εg and that
pumping has an efficiency of εp. The energy cost of pumping water
per m2 of tidal pool to boost height by b m is b2×ρ×g2×εp and the
additional energy generated at low tide is εg × (2h+ b2)× b× ρ× g. By
defining the round trip efficiency of ε = εgεp, the optimal extra height
is b = 2h ε1−ε.
For example, with a tidal range of 2h = 4 m and a round-trip
efficiency of ε = 75%, the optimal boost is around 13 m.
11

Barrages for tidal pools
Concept: Building a barrage in an estuary where tides have a high
range to form a tidal pool. Proven technology.
Picture: Tidal barrage at
La Rance (France). Aver-
age tidal range is 8 metres.
The barrage has been pro-
ducing an average power of
60 MW since 1966.
12

Figure: The Severn barrage proposals (bottom left), and Strangford
Lough, Northern Ireland (top left), shown at the same scale as La
Rance.
13

The Severn barrage
Data: Tidal range at Cardiff is 11.3 m at spring tides and 5.8 at
neap tides. The size of the tidal pool formed by a barrage going
from Weston-super-Mare to Cardiff: 500 km2.
Using formula 8ρ×h2×g×ε3600×24 and choosing ε = 0.9, this tidal pool could
produce could produce 26.6 W/m2 at spring tides and 7 W/m2 at
neap tides. That would be equivalent to 10.6 kWh/d per person
and 1.4 kWh/d per person, respectively.
These numbers assume that the water is let in at single pulse at the
peak of high tide, and let out at single pulse at low tide. In practice,
in-flow and out-flow are spread over several hours ⇒ reduction in
power delivered. Current proposals for the barrage will generate
power in one direction ⇒ reduces the power by another 50 %.
Engineers report that current proposals would contribute around
0.81 kWh/d per person on average.
14

Tidal lagoons: an alternative to tidal barrages
Tidal lagoons utilize a circular (or more organically shaped)
retaining wall to hold high or low tides in a central pool, before
releasing them to drive turbines. Two conditions are required for
building lagoons: the water must be shallow and the tidal range
must be large.
16

There are two locations for tidal lagoons in Britain: The Wash on
the east coast and the waters off Blackpool on the West coast.
Each has an area of 400 km2. By assuming an average power of 4.5
W/m2, the power generated by these lagoons could be 1.5 kWh/d
per day.
17

Tidal stream farms (9 kWh/d per person) + the bar-
rage (0.8 kWh/d per person) + lagoons (1.5 kWh/d
per person) ' 11 kWh/d per person.
Several other reasons for being excited about tidal
power:
1. Tidal power is completely predictable, unlike sun
or wind power.
2. More constant than the sun or the wind.
3. Relatively cheap.
4. Humans live on land and not on the sea (or under
the sea), so, they won’t object to lagoons or tidal
farms.
18
But what would you answer to people who say:Extracting power from the tides slows down the earth’s rotation
so it cannot be called renewable and it may even lead to a
disaster in the long-run (if the earth stops spinning).
19

Answer: Natural tidal friction already slows down the earth’s
rotation by 2.3 milliseconds per century. The natural rotational
energy loss is roughly 3 TW (1012 W or 1012×2460×106×103 ' 400 kWh/d
per person). Many tidal energy extraction systems are just extracting
energy that would have been lost anyway in friction. But even if we
doubled or tripled the power extracted from the earth-moon system,
tidal energy would still last hundreds of millions of years.
20

15. Stuff
It is conventional to divide the energy-cost of manufacture into four
phases:
Phase R: Making raw materials. Digging minerals out of the
ground, melting them, purifying them, and modifying them into
manufacturers’ lego (e.g., plastics, glasses, metals and ceramics).
Energy costs in this phase include the transportation of the raw
materials.
Phase P: Production. Raw materials are processed into a
manufactured objects. Energy costs of this phase include packaging
and more transportation.
Phase U: Use. Energy consumed by goods when in use (e.g., a
hair-dryer uses electricity).
Phase D: Disposal. This includes the energy cost of putting goods
in a landfill, of turning them back into raw materials (recycling) and
of cleaning all the pollution associated with them.
21

Remarks: (i) Usually the total energy cost of one phase dominatesthe others. (ii) Costs of phases R and P are called the embodied orembedded energy (iii) We will just focus on the phases R and P ofa few common items: drink containers, computers, junk mail, carsand houses
Drink containers. Making one aluminium
drinks-can uses 0.6 kWh. For a 500 ml plas-
tic bottle, we need 0.7 kWh. So, a five-a-day
habit wastes 3 kWh/day.
Other packaging. An average UK inhabitant throws away 400 g ofpackaging per day, mainly food packaging. The embodied energy inpackaging is on average around 10 kWh/kg ⇒ The energy footprintof packaging is 4 kWh/d.
Computers. Energy cost per computer ' 1800 kWh. Oncecomputer every two years ⇒ 2.5 kWh per day.
22

Newspapers, magazines, and junk mail. 3 grams per page of
newspaper. Paper has an embodied energy of 10 kWh per kg. The
typical flow of junk mail, magazines, and newspapers amounts to
200 g of paper per day which is about 2 kWh per day.
Bigger stuff. Houses: Assuming that we replace a house after 100
years, the energy cost is 2.3 kWh/d. Knowing that the average
occupancy of a house is 2.3, the average energy expenditure on
house-building is 1 kWh per day per person.
Cars: A car has an embodied energy of 76,000 kWh. Assuming it
lasts 15 years, that’s an energy cost of 14 kWh per day.
Roads: Cost of 7600 kWh per meter plus a maintenance cost over
40 years equal to 37400 kWh. In the UK, there are 42000 km of
roads. So those roads cost 2 kWh/d per person.
23

Transporting goodsFreight-transport is measured in ton-kilometers.
Energy of road transporta-
tion in the UK is around
1 kWh per t-km. For a
container ship it is around
0.015 kWh per t-km.
24

Transporting goods by road. In 2006, the total amount of road
transport in Britain by trucks was 156 billion t-km. That’s 7 t-km
per person, which costs 7 kWh per day per person.
Transporting goods by water. It has been estimated that Britain’s
share of the energy costs of international shipping is 4 kWh/day per
person.
Transport of water. 162 liters used per day per person. The cost
of pumping water around and treating sewage is about 0.4 kWh per
day per person.
Retail
Supermarkets in the UK consume 11 TWh of energy per year, that’s11×1012
365×1000×60×106 = 0.5 kWh per day per person.
25

To come up with a final estimation, (i) we will assume
that all manufactured goods (e.g. vehicles, machin-
ery, white goods, and electrical and electronic equip-
ment) are manufactured abroad, (ii) we will use an
official estimate of 1.3 tons per person per year of im-
ported manufactured goods and (iii) we will consider
that the energy of production of manufactured goods
is around 10 kWh per kg ⇒ Manufactured goods cost
40 kWh per day per person.
To this number we add 2 kWh/d per person for news-
papers, 2 for roadmaking, 1 for house-making, 3 for
packaging and 12 kWh per day per person for the
transportation of goods by sea, by road and by pipe
and storage in supermarkets.
Total: 60 kWh/d per person26

16. Geothermal
Geothermal energy comes from two
mains sources: (I) radioactive decay in the
crust of the earth and (II) heat trickling
through the mantle from the earth’s core.
Where does the heat in the earth’s core come from? [A] The
earth used to be red hot and is still cooling down [B] the earth flexes
in response to the gravitational fields of the moon and sun and this
creates heat.
27
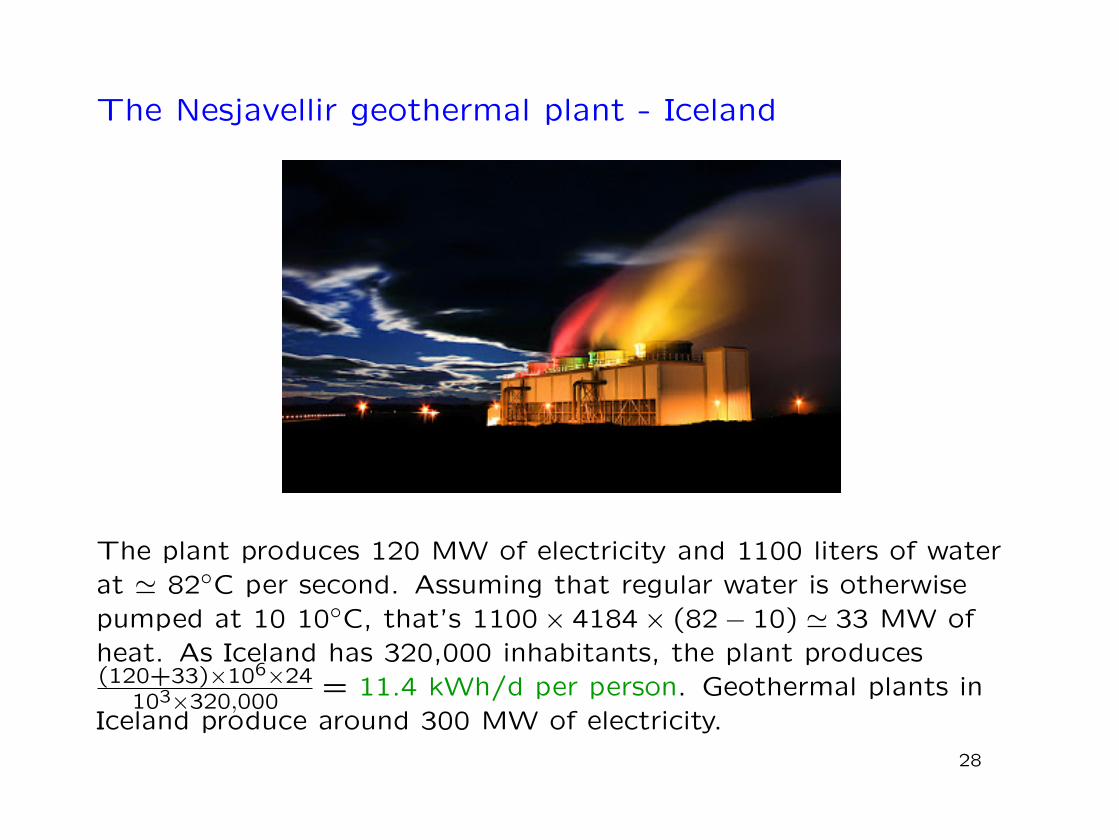
The Nesjavellir geothermal plant - Iceland
The plant produces 120 MW of electricity and 1100 liters of waterat ' 82◦C per second. Assuming that regular water is otherwisepumped at 10 10◦C, that’s 1100× 4184× (82− 10) ' 33 MW ofheat. As Iceland has 320,000 inhabitants, the plant produces(120+33)×106×24
103×320,000= 11.4 kWh/d per person. Geothermal plants in
Iceland produce around 300 MW of electricity.
28

How much geothermal energy is available?
We can estimate geothermal power of two types: [A] the power
available at an ordinary location on the earth’s crust and [B] the
power available in special hot spots like Iceland. We will assume that
the greater total resource comes from ordinary locations, since
ordinary locations are so much more numerous.
Main problem for making sustainable geothermal power: the speed
at which heat travels through solid rock limits the rate at which heat
can be sustainably sucked out of the red-hot interior of the earth. If
too many “straws” suck heat at the same place, the rock may
become colder and colder.
29

Geothermal power that would be sustainable forever
Condition for having geothermal power which is sustainable:sucking energy at a rate which is equal at most to the natural rateat which heat is already flowing out of the earth.
The rate of energy depends on the depth. The heat flow from thecenter coming through the mantle is about 10 mW/m2. The heatflow at the surface is 50 mW/m2 ⇒ Maximum rate of energy we canget per unit area is 50 mW/m2.
Additional problem: close to the surface the
temperature is too low for producing heat that
can be used for something really useful such as
heating buildings or producing electricity (remem-
ber Carnot’s rule that specifies that the limit on the max-
imum efficiency of any heat engine is 1− TcoldThot
where Tcold is
the absolute temperature of the cold reservoir and Thot is
the absolute temperature of the hot reservoir).
30

To come up with an estimate of geothermal power,
we will assume that only half of the maximum power
per m2 can be turned into useful power, that’s 25
mW/m2. We will also assume that only half of the
land is exploited for geothermal power ⇒ sustainable
geothermal power could only offer0.025×4000
2 ×241000 ' 1
kWh/d per person.
31

What do you think about this first slide of a presentation
given by the Minister Jean-Marc Nollet on geothermal power
in Wallonia?
32

Elements of answer:
1. He associates geothermal energy with oil to emphasize that
geothermal energy has real potential to enrich Wallonia just as oil
has enriched for Saudi Arabia.
2. Wallonia is not a hot spot for geothermal power as Iceland is.
So, if geothermal power was to become vastly used in Wallonia, it
could only be for a short period of time. It would be geothermal
power as mining.
3. He is right to associate geothermal power with oil in the sense
that geothermal resources in Wallonia will not last longer than oil if
they are as intensively exploited.
33

17. Public services
The cost of defense.
The UK’s defense budget is around 6% of GDP. GDP is £587
billions. We will assume that 6% of the budget of defense is spent
on energy and that the price of energy is £0.027 per kWh (Note:
6% is the fraction of GDP which is spent on energy and £0.027 is
the average price of energy ⇒ Energy spent in defense is0.06×587×109×0.06
0.027 = 80× 109 kWh = 80 TWh. In our favorite unit
that’s 80×109
60×106×365' 4 kWh per day per person.
34

The cost of nuclear defense
The money spent by the USA on manufacturing and deploying
nuclear weapons from 1945 to 1996 was $5.5 trillion of dollars (in
1996 dollars). Assuming that (i) 6% of this expenditure went on
energy (ii) an energy cost of $0.05 per kWh, and that the US
population at this times was 250 million, that’s a cost of5.5×1012×0.06
0.05×250×106×51×365' 1.4 kWh per day per American for 51 years.
Half of this energy was spent on producing
nuclear materials for bombs. One gram of
plutonium requires 24 000 kWh of energy.
The USA has produced 104 tons of pluto-
nium between 1945 and 1996 ⇒ 0.5 kWh per
day per person was spent during this period
just to produce plutonium!
35

Explosion of the Tsar bomb
The largest bomb ever exploded. Energy released: 50 million tons of
TNT. Energy in TNT: 4.184 MJ/kg. Exploding such a bomb every
year would release 50×106×1000×4.184×106
365×60×106×1000×3600' 2.65 kWh/d per
person.
36

Universities
UK universities use 5.2 billion kWh per year. Shared
out among the whole population, that is 0.24 kWh
per day per person.
We should probably talk about other public ser-
vices but it is time now to wrap up our race
between the red and the green stacks.
37

18. Can we live on renewables?
Several issues are raised by the green and red stacks that have been
built. For example, even if our red consumption stack was lower
than the green one, it would not necessarily mean that our energy
sums would add up. Indeed, for a sustainable energy plan to add up,
we need both the forms and amounts of energy consumption and
production to match up.
The questions we address here are:
1. Is the size of the red stack roughly correct?
2. Have we been unfair to renewables by underestimating their
potential?
3. What happens to the green stack when we take into account
social and economic constraints?
38

Red reflections
Official statistics for the consumption of primary energy (which
means the energy contained in raw fuels, plus wind and electricity) is
125 kWh/d per person in the UK. And ... 250 kWh/d per person in
the US.
These official statistics do not include the energy imported through
“stuff” (40 kWh/d per person) as well as the energy embodied in
food (' 15 kWh/d per person). On the other hand we did not
include the energy lost in converting energy, which accounts for 22%
of the national total.
All in all, the red stack slightly overestimates current average energy
consumption but we were targetting the consumption of a typical
affluent person rather than an average person.
39

Is the UK a good representative of an average Europeannation?
From this graph we can safely
conclude that yes, it is.
40

Green reflections
Estimates of theoretical
or practical renewable
resources in the UK by
different organisms. ⇒We have been very opti-
mistic in our estimation of
sustainable production.
41

What would you answer to someone who says:
We lived on renewables before the industrial revolution. Why
not change our lifestyle and go back to the one we had in the
middle ages to solve this energy crisis?
Data: In the middle ages, power consumption per day was on
average 20 kWh per day per person and everything was biopowered.
It required on average 10,000 m2 of land per person. Available land
per person at that time was 52,000 m2.
42

Answer: Even going back to a medevial lifestyle would not solve our
energy crisis because the available land per person in the UK is only
around 4000 m2 per person while 10,000 m2 would be needed.
43

Green ambitions meet social reality
Typical quotes with respect to renewables:
Wind farms? “No they are ugly, noisy and kill bats.”
Solar panels on roofs? “No, they are ugly.”
More biofuels? “No, it ruins the countryside.”
Hydroelectricity? “It ruins the environment and kills fish.”
Offshore wind? “Ugly. It ruins the landscape and I hate these
powerlines coming ashore.”
Wave or tidal power “Too much impact on the marine environment.”
Geothermal power “Much too expensive for the power it can
produce.”
44

This is what we may get as renewable energy after public
consultation:
There is a possibility
that after public con-
sultation, the max-
imum Britain would
get from renewables
is around 18 kWh/d
per person. This fig-
ure is even far less
than the primary en-
ergy consumption in
Britain (125 kWh/d
per person).
45

This is still progress with respect to what we had in 2006:
The breakdown of the re-
newables on the right-hand
side is scaled up 100-fold
vertically.
46

Two main conclusions of Part I
1. To make a difference, renewable facilities have to be
country-sized.
Reason behind this fact: renew-
ables are so diffuse.
Power per unit landor water area
Wind 2 W/m2
Offshore wind 3 W/m2
Tidal pools 3 W/m2
Tidal stream 6 W/m2
Solar PV panels 5-20 W/m2
Plants 0.5 W/m2
Rainwater (highlands) 0.24 W/m2
Hydroelectric facilities 11 W/m2
Geothermal 0.017 W/m2
2. It is not going to be easy to make a plan that adds up using
renewables alone.
47