14291 aberdeen smer sc006 · 2018-11-27 · gl noble denton is the trading name of gl industrial...
TRANSCRIPT

This Report is protected by copyright and may not be reproduced in whole or in part by any means without the approval in writing of GL Noble Denton. No Person, other than the Customer for whom it has been prepared, may place reliance on its contents and no duty of care is assumed by GL Noble Denton toward any Person other than the Customer. This Report must be read in its entirety and is subject to any assumptions and qualifications expressed therein. Elements of this Report contain detailed technical data which is intended for analysis only by persons possessing requisite expertise in its subject matter. GL Noble Denton is the trading name of GL Industrial Services UK Ltd Registered in England and Wales No. 3294136 Registered Office: Holywell Park, Ashby Road, Loughborough, Leicestershire, LE11 3GR UK
Prepared for: Prepared by:
Trevor Roberts Ben Kirkman
Scotia Gas Networks
2 Leesons Hill Orpington Kent BR5 2TN
GL Industrial Services UK Ltd trading as GL Noble Denton
Holywell Park Ashby Road Loughborough Leicestershire LE11 3GR United Kingdom
Tel: +44 (0)1509 28 2266 Fax: +44 (0)1509 28 3080
E-mail: [email protected]
Website: www.gl-nobledenton.com
Customer Reference: SMER SC006
Report Number: 14291 19 August 2013
Aberdeen SMER SC006
GL Noble Denton Restricted
Confidential, Restricted to: Scotia Gas Networks & GL Noble Denton

Report Number: 14291 Issue: 1.0
GL Noble Denton Restricted Page i
Report Issue / Amendment Record
Report Title: Aberdeen SMER SC006
Report Number: 14291 Project Title: Aberdeen SMER
Project SAP Code: 1/18274
Amendment details
Issue Description of Amendment Originator/Author
1.0 Original B Kirkman
Report approval
Issue Checked by Approved by Date
1.0 S Kimpton N Bryant
19 August 2013
Previous issues of this document shall be destroyed or marked SUPERSEDED
Report Number: 14291 Issue: 1.0
GL Noble Denton Restricted Page ii
Project Code: 1/18274
Distribution
Name Company
Trevor Roberts Scotia Gas Networks
2 Leesons Hill Orpington Kent BR5 2TN
Report Number: 14291 Issue: 1.0
GL Noble Denton Restricted Page iii
Executive Summary
Site name Aberdeen Offtake
DNO Scotland Gas Networks
LDZ Scotland
Error start date 21st July 2009
Error corrected date 10th August 2010
Size of error (over or under read) 1,617 GWh under-registration
Error description Following an orifice plate change the new plate was not lowered fully into the pipe. This resulted in a reduction in differential pressure and hence an under-registration of flow.
Meter type Orifice Plate
SMER Unique Reference No SC006
Compiled by Ben Kirkman (GL Noble Denton)
Report Number: 14291 Issue: 1.0
GL Noble Denton Restricted Page iv
Contents
1 Error Description ......................................................................................................................... 5
2 Methodology ................................................................................................................................ 7
2.1 Flow Profile Analysis ...................................................................................................................... 7
2.2 Carrier Checks ............................................................................................................................... 10
2.2.1 Results – Orifice Plate Removal ............................................................................... 13
2.2.2 Results – Orifice Plate Insertion ................................................................................ 13
2.2.3 Results – Repeatability ............................................................................................. 15
2.3 Carrier Data Plates ........................................................................................................................ 16
2.4 Orifice Plate Change Photographs .............................................................................................. 18
2.4.1 21st July 2009 ............................................................................................................ 18
2.4.2 27th July 2010 ............................................................................................................ 20
2.4.3 29th July 2011 ............................................................................................................ 24
2.5 On-Site Flow Testing ..................................................................................................................... 26
2.5.1 Flow Rate Drift .......................................................................................................... 27
2.5.2 Summary of Tests ..................................................................................................... 27
2.5.3 Processing of Results ............................................................................................... 38
2.6 CFD Analysis ................................................................................................................................. 39
2.6.1 Description of Model ................................................................................................. 39
2.6.2 Validation of Model ................................................................................................... 39
2.6.3 Results of 99985 Abnormal Measurement Position .................................................. 41
2.6.4 Results of 99950 Abnormal Measurement Position .................................................. 43
2.6.5 Peer Review of CFD Analysis ................................................................................... 44
3 Error Quantification ....................................................................................................................47
3.1 First Error Period (21st July 2009 to 27th July 2010).................................................................... 50
3.2 Second Error Period (27th July 2010 to 10th August 2010) ......................................................... 50
4 Recommendations ......................................................................................................................50
5 References ..................................................................................................................................51
Appendix A Daily Correction Factors ............................................................................................. A-1
Appendix B Carrier Data Plate Text ................................................................................................ B-1
B.1 Carrier Identification Plate ...........................................................................................................B-1
B.2 Carrier Information Plate .............................................................................................................B-2
Appendix C Differential Pressure Measurement Uncertainty Profile .......................................... C-1
Appendix D CFD Report .................................................................................................................. D-1
Appendix E Peer Review of CFD Report ........................................................................................ E-1
Report Number: 14291 Issue: 1.0
GL Noble Denton Restricted
Page 5
1 Error Description
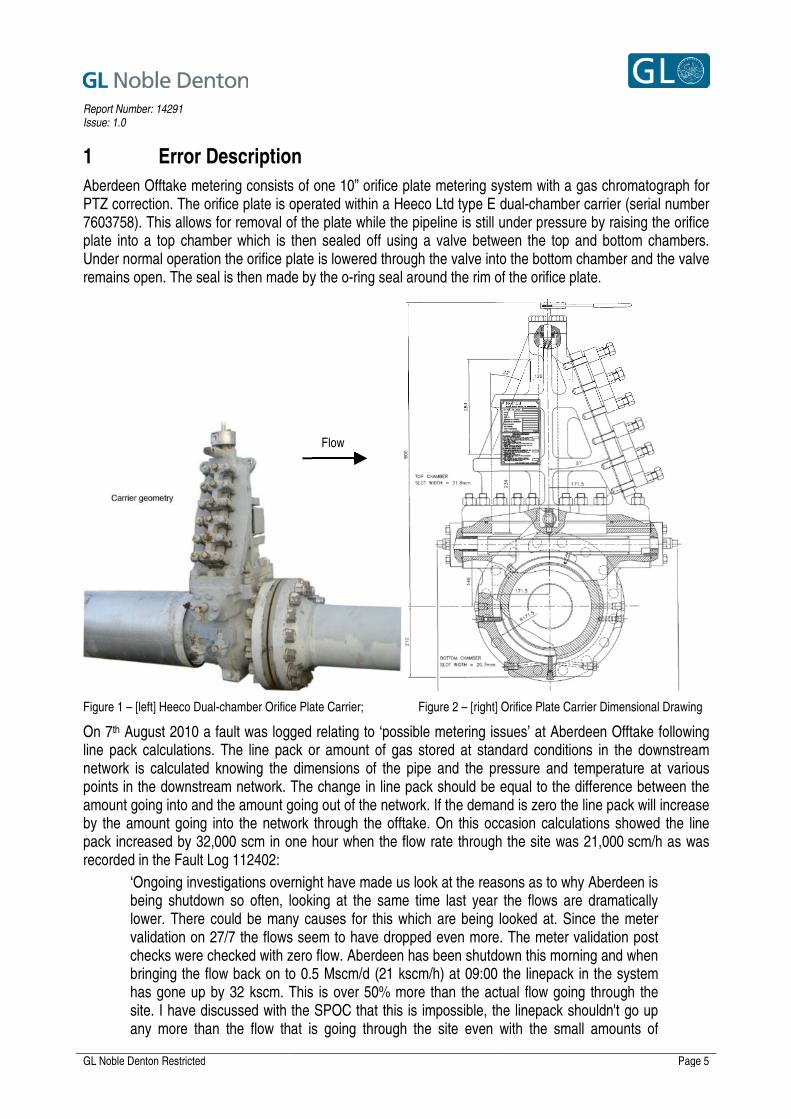
Aberdeen Offtake metering consists of one 10” orifice plate metering system with a gas chromatograph for PTZ correction. The orifice plate is operated within a Heeco Ltd type E dual-chamber carrier (serial number 7603758). This allows for removal of the plate while the pipeline is still under pressure by raising the orifice plate into a top chamber which is then sealed off using a valve between the top and bottom chambers. Under normal operation the orifice plate is lowered through the valve into the bottom chamber and the valve remains open. The seal is then made by the o-ring seal around the rim of the orifice plate.
Figure 1 – [left] Heeco Dual-chamber Orifice Plate Carrier; Figure 2 – [right] Orifice Plate Carrier Dimensional Drawing
On 7th August 2010 a fault was logged relating to ‘possible metering issues’ at Aberdeen Offtake following line pack calculations. The line pack or amount of gas stored at standard conditions in the downstream network is calculated knowing the dimensions of the pipe and the pressure and temperature at various points in the downstream network. The change in line pack should be equal to the difference between the amount going into and the amount going out of the network. If the demand is zero the line pack will increase by the amount going into the network through the offtake. On this occasion calculations showed the line pack increased by 32,000 scm in one hour when the flow rate through the site was 21,000 scm/h as was recorded in the Fault Log 112402:
‘Ongoing investigations overnight have made us look at the reasons as to why Aberdeen is being shutdown so often, looking at the same time last year the flows are dramatically lower. There could be many causes for this which are being looked at. Since the meter validation on 27/7 the flows seem to have dropped even more. The meter validation post checks were checked with zero flow. Aberdeen has been shutdown this morning and when bringing the flow back on to 0.5 Mscm/d (21 kscm/h) at 09:00 the linepack in the system has gone up by 32 kscm. This is over 50% more than the actual flow going through the site. I have discussed with the SPOC that this is impossible, the linepack shouldn't go up any more than the flow that is going through the site even with the small amounts of
Flow
Report Number: 14291 Issue: 1.0
GL Noble Denton Restricted
Page 6
demand that are going through the system. He is discuss with E&l enqineer and possibly get checked today.’
Following an on-site investigation, a mechanical team was requested.
On 10th August 2010 it was advised that the orifice plate was not set correctly. The differential pressure (DP) and flow were reading significantly lower before the plate was taken out and aligned properly. The log reads:
‘Discussed problem with [operative] whilst doing post validation checks. He advises orifice plate was not set correctly. Where as orifice plate had a pressure differential of 6 mbar it was showing 54mbar. Also when 0.5Mscm/d was put on as a flow it was actually showing 1.42 Mscm/d. Orifice plate has been taken out and aligned properly and now flow is showing correctly. Errors in meter validation are down to the issue that the flow on GTMS was showing virtually 1/3rd of its actual flow.’
Subsequent interviews were held with the mechanical operatives who undertook the orifice plate changes on 21st July 2009 and 27th July 2010. The operatives were not able to confirm the counter reading on the orifice plate carrier at the end of the operations on 21st July 2009 or at the start of the operations on 27th July 2010. However, there is some confidence that the orifice plate was left at a counter reading of 99950 on 27th July 2010.
Report Number: 14291 Issue: 1.0
GL Noble Denton Restricted
Page 7
2 Methodology
2.1 Flow Profile Analysis
During normal operation Aberdeen Offtake is controlled using a combination of flow rate setpoint and low and high pressure overrides. The flow control valve will operate to supply a flow rate equal to the setpoint. If the downstream pressure gets too low or too high (based on pressure overrides), then the flow control valve will operate to maintain the pressure above the low override or below the high override.
When maintenance is carried out affecting the flow rate readings, the flow control valve can be put into direct valve control to maintain a constant flow rate while the readings are erroneous. A fixed flow override value is entered into the flow computer to maintain the signal to the Local Gas Treatment (LGT) system which controls the injection of odorant. This is normal procedure for an orifice plate change and occurred on 21st July 2009 and 10th August 2010.
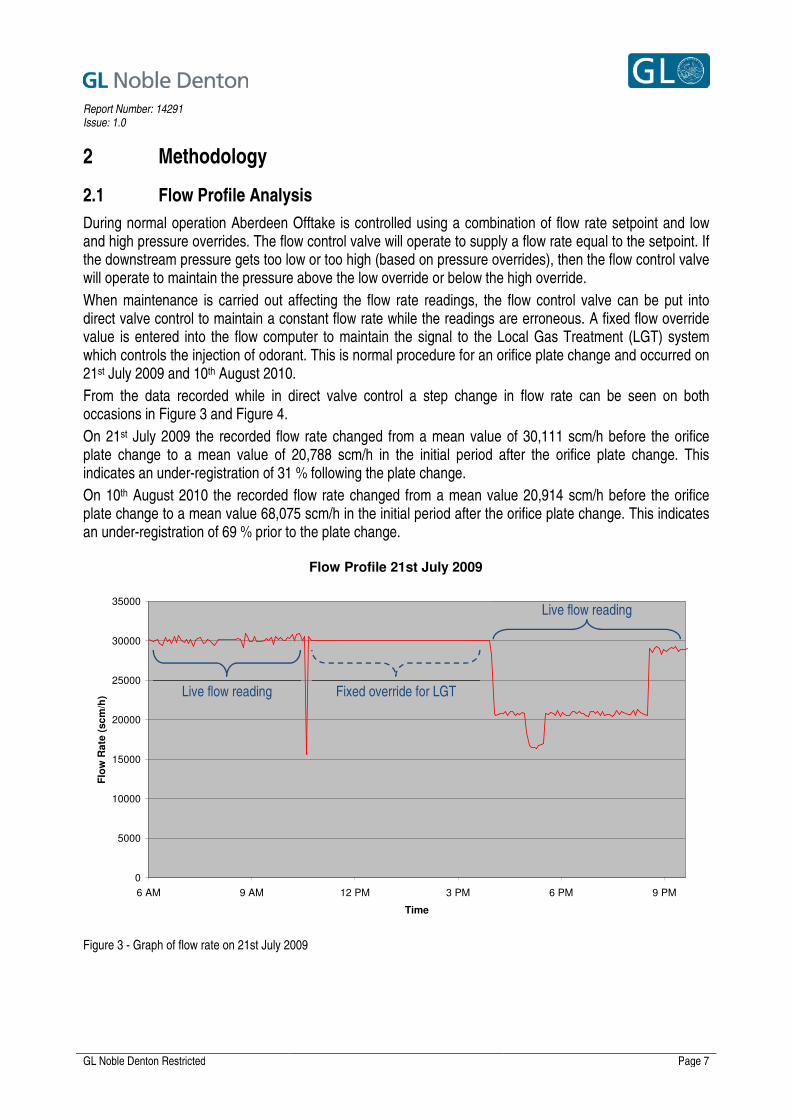
From the data recorded while in direct valve control a step change in flow rate can be seen on both occasions in Figure 3 and Figure 4.
On 21st July 2009 the recorded flow rate changed from a mean value of 30,111 scm/h before the orifice plate change to a mean value of 20,788 scm/h in the initial period after the orifice plate change. This indicates an under-registration of 31 % following the plate change.
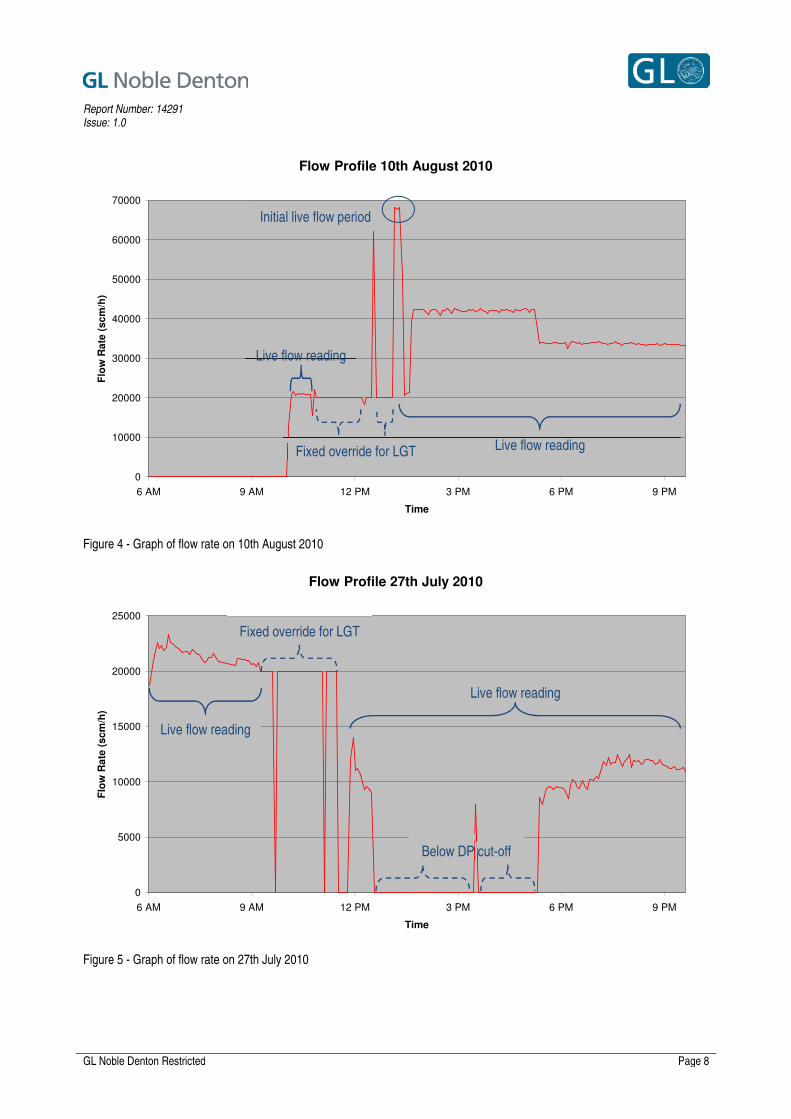
On 10th August 2010 the recorded flow rate changed from a mean value 20,914 scm/h before the orifice plate change to a mean value 68,075 scm/h in the initial period after the orifice plate change. This indicates an under-registration of 69 % prior to the plate change.
Figure 3 - Graph of flow rate on 21st July 2009
Flow Profile 21st July 2009
0
5000
10000
15000
20000
25000
30000
35000
6 AM 9 AM 12 PM 3 PM 6 PM 9 PM
Time
Flo
w R
ate
(sc
m/h
) Live flow reading Fixed override for LGT
Live flow reading
Report Number: 14291 Issue: 1.0
GL Noble Denton Restricted
Page 8
Figure 4 - Graph of flow rate on 10th August 2010
Figure 5 - Graph of flow rate on 27th July 2010
Flow Profile 10th August 2010
0
10000
20000
30000
40000
50000
60000
70000
6 AM 9 AM 12 PM 3 PM 6 PM 9 PM
Time
Flo
w R
ate
(s
cm
/h)
Flow Profile 27th July 2010
0
5000
10000
15000
20000
25000
6 AM 9 AM 12 PM 3 PM 6 PM 9 PM
Time
Flo
w R
ate
(s
cm
/h)
Live flow reading
Live flow reading
Fixed override for LGT
Initial live flow period
Live flow reading
Fixed override for LGT
Live flow reading
Below DP cut-off
Report Number: 14291 Issue: 1.0
GL Noble Denton Restricted
Page 9
Figure 5 shows that on 27th July 2010 the flow rate was transient. The flow rate could not be maintained because the pressure differential across the site was minimal. Following the orifice plate change the differential pressure was close to the low DP cut-off (0.9 mbar) and some zero flow rates were recorded.
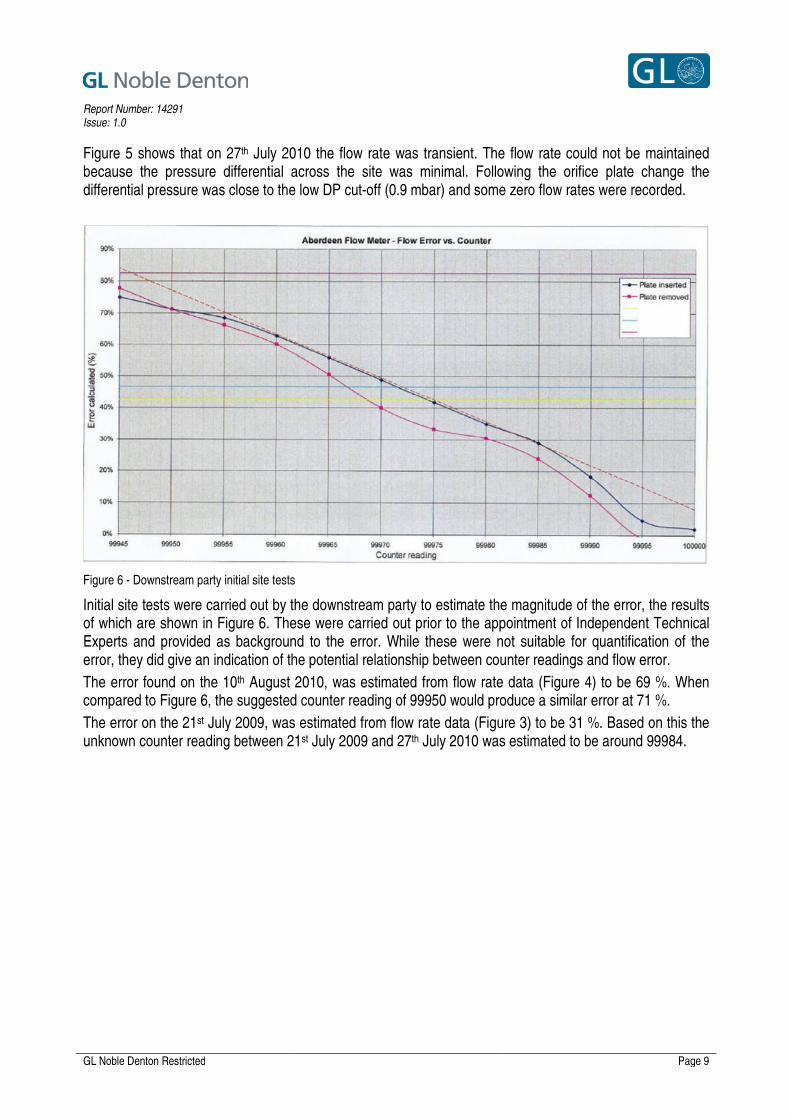
Figure 6 - Downstream party initial site tests
Initial site tests were carried out by the downstream party to estimate the magnitude of the error, the results of which are shown in Figure 6. These were carried out prior to the appointment of Independent Technical Experts and provided as background to the error. While these were not suitable for quantification of the error, they did give an indication of the potential relationship between counter readings and flow error.
The error found on the 10th August 2010, was estimated from flow rate data (Figure 4) to be 69 %. When compared to Figure 6, the suggested counter reading of 99950 would produce a similar error at 71 %.
The error on the 21st July 2009, was estimated from flow rate data (Figure 3) to be 31 %. Based on this the unknown counter reading between 21st July 2009 and 27th July 2010 was estimated to be around 99984.
Report Number: 14291 Issue: 1.0
GL Noble Denton Restricted
Page 10
2.2 Carrier Checks
The initial investigation aimed to determine the relationship between the counter reading and the physical location of the plate within the pipe.
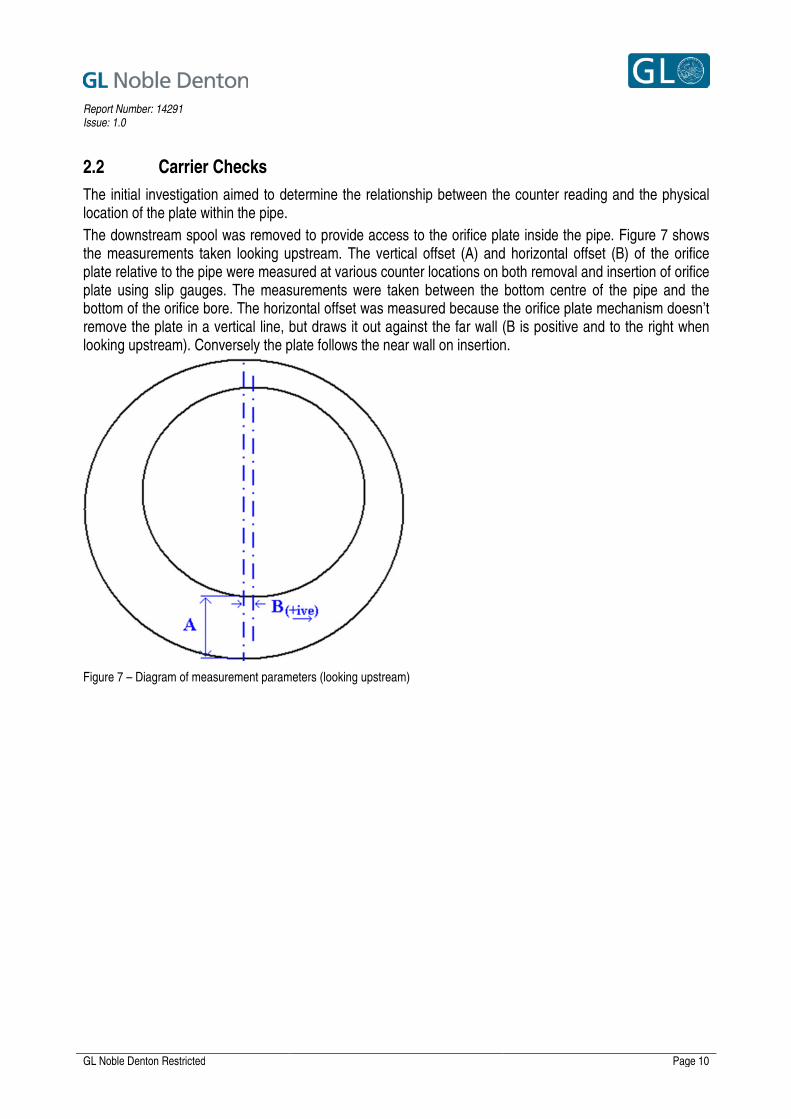
The downstream spool was removed to provide access to the orifice plate inside the pipe. Figure 7 shows the measurements taken looking upstream. The vertical offset (A) and horizontal offset (B) of the orifice plate relative to the pipe were measured at various counter locations on both removal and insertion of orifice plate using slip gauges. The measurements were taken between the bottom centre of the pipe and the bottom of the orifice bore. The horizontal offset was measured because the orifice plate mechanism doesn’t remove the plate in a vertical line, but draws it out against the far wall (B is positive and to the right when looking upstream). Conversely the plate follows the near wall on insertion.
Figure 7 – Diagram of measurement parameters (looking upstream)
Report Number: 14291 Issue: 1.0
GL Noble Denton Restricted
Page 11
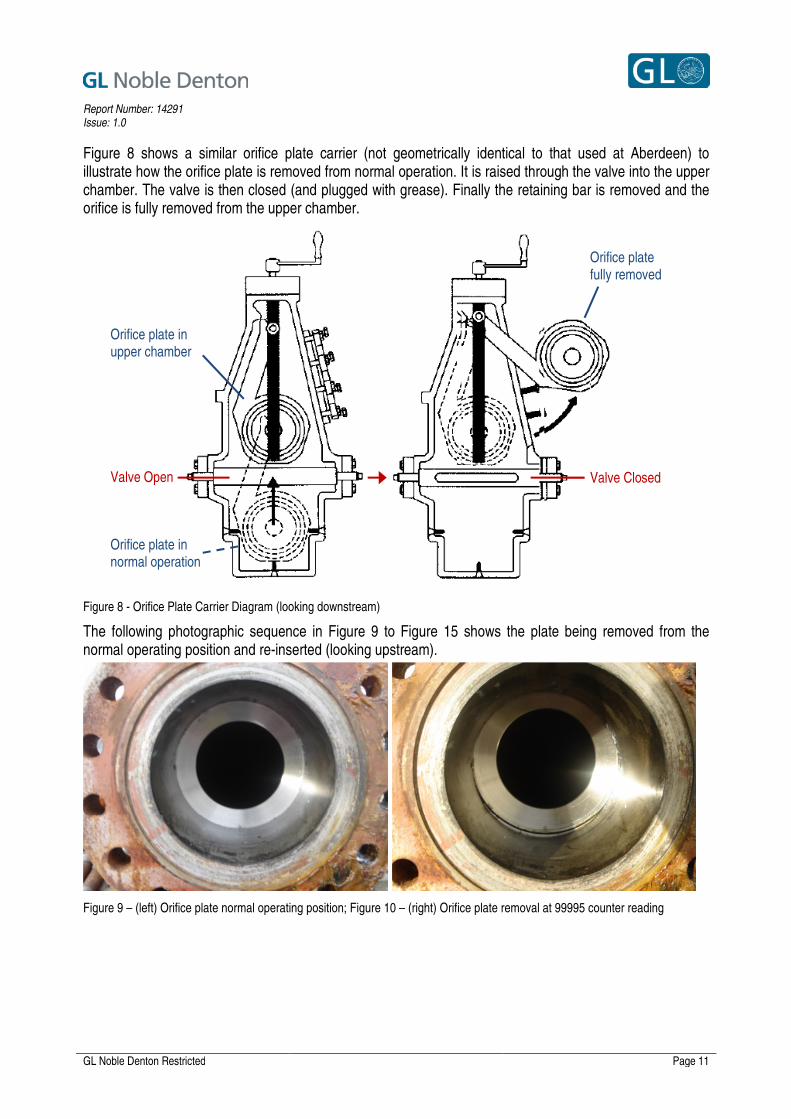
Figure 8 shows a similar orifice plate carrier (not geometrically identical to that used at Aberdeen) to illustrate how the orifice plate is removed from normal operation. It is raised through the valve into the upper chamber. The valve is then closed (and plugged with grease). Finally the retaining bar is removed and the orifice is fully removed from the upper chamber.
Figure 8 - Orifice Plate Carrier Diagram (looking downstream)
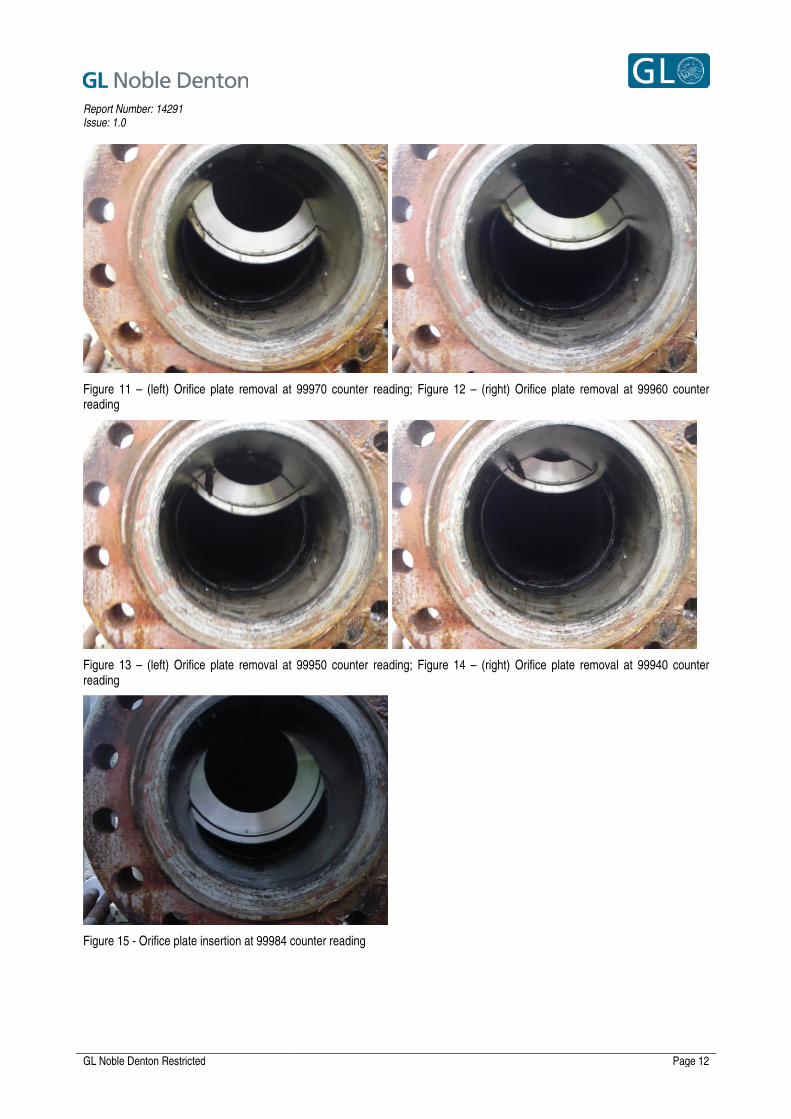
The following photographic sequence in Figure 9 to Figure 15 shows the plate being removed from the normal operating position and re-inserted (looking upstream).
Figure 9 – (left) Orifice plate normal operating position; Figure 10 – (right) Orifice plate removal at 99995 counter reading
Orifice plate in normal operation
Orifice plate in upper chamber
Orifice plate fully removed
Valve Open Valve Closed
Report Number: 14291 Issue: 1.0
GL Noble Denton Restricted
Page 12
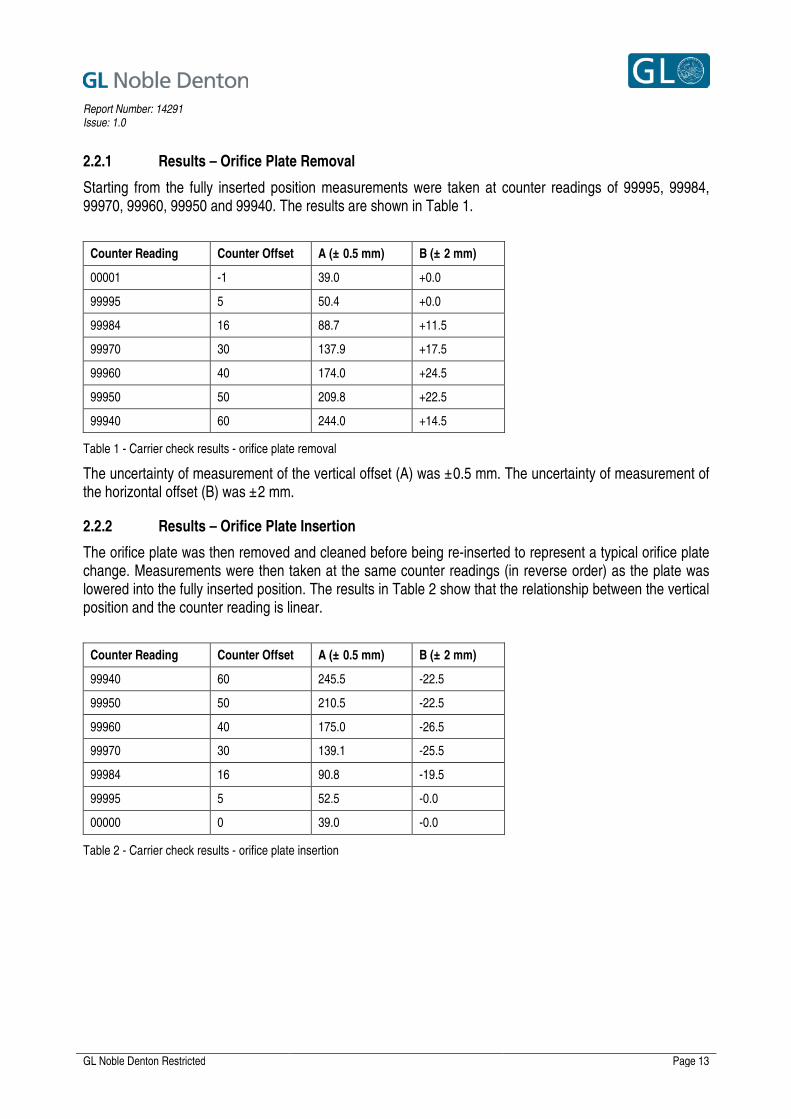
Figure 11 – (left) Orifice plate removal at 99970 counter reading; Figure 12 – (right) Orifice plate removal at 99960 counter reading
Figure 13 – (left) Orifice plate removal at 99950 counter reading; Figure 14 – (right) Orifice plate removal at 99940 counter reading
Figure 15 - Orifice plate insertion at 99984 counter reading
Report Number: 14291 Issue: 1.0
GL Noble Denton Restricted
Page 13
2.2.1 Results – Orifice Plate Removal
Starting from the fully inserted position measurements were taken at counter readings of 99995, 99984, 99970, 99960, 99950 and 99940. The results are shown in Table 1.
Counter Reading Counter Offset A (± 0.5 mm) B (± 2 mm)
00001 -1 39.0 +0.0
99995 5 50.4 +0.0
99984 16 88.7 +11.5
99970 30 137.9 +17.5
99960 40 174.0 +24.5
99950 50 209.8 +22.5
99940 60 244.0 +14.5
Table 1 - Carrier check results - orifice plate removal
The uncertainty of measurement of the vertical offset (A) was ±0.5 mm. The uncertainty of measurement of the horizontal offset (B) was ±2 mm.
2.2.2 Results – Orifice Plate Insertion
The orifice plate was then removed and cleaned before being re-inserted to represent a typical orifice plate change. Measurements were then taken at the same counter readings (in reverse order) as the plate was lowered into the fully inserted position. The results in Table 2 show that the relationship between the vertical position and the counter reading is linear.
Counter Reading Counter Offset A (± 0.5 mm) B (± 2 mm)
99940 60 245.5 -22.5
99950 50 210.5 -22.5
99960 40 175.0 -26.5
99970 30 139.1 -25.5
99984 16 90.8 -19.5
99995 5 52.5 -0.0
00000 0 39.0 -0.0
Table 2 - Carrier check results - orifice plate insertion

Report Number: 14291 Issue: 1.0
GL Noble Denton Restricted
Page 14
Figure 16 - Relationship between counter and vertical offset
Figure 17 - Relationship between counter and horizontal offset
Report Number: 14291 Issue: 1.0
GL Noble Denton Restricted
Page 15
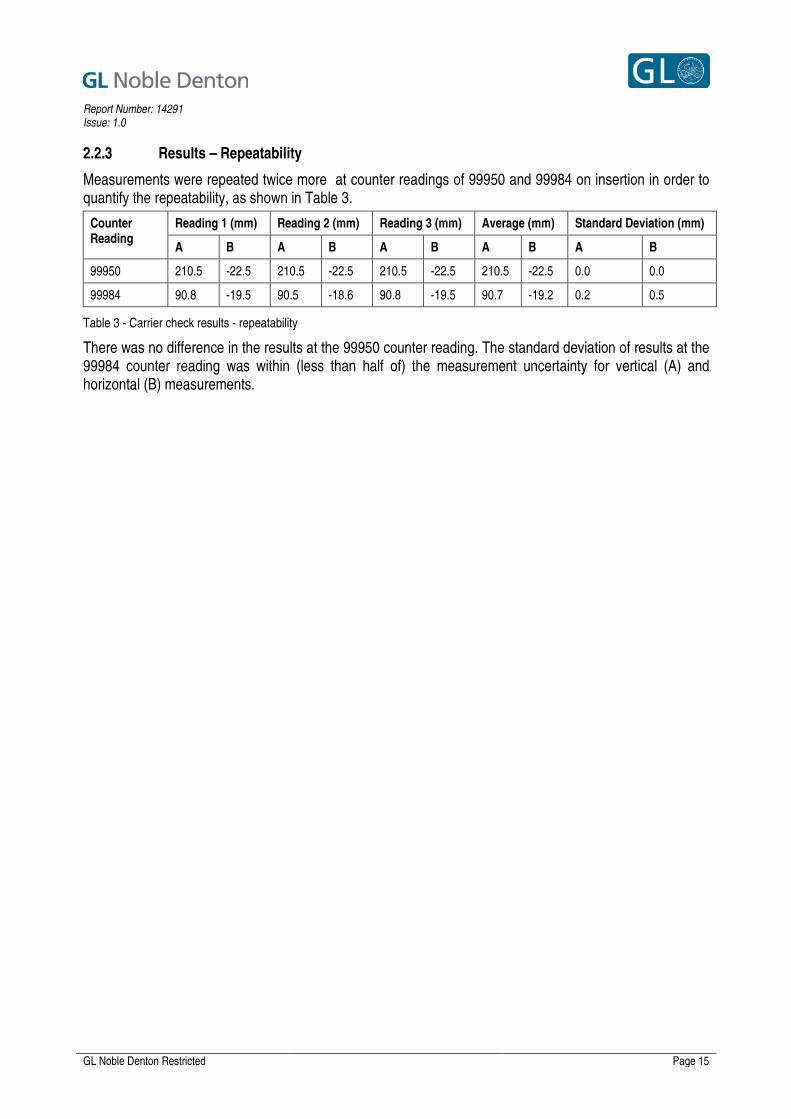
2.2.3 Results – Repeatability
Measurements were repeated twice more at counter readings of 99950 and 99984 on insertion in order to quantify the repeatability, as shown in Table 3.
Counter Reading
Reading 1 (mm) Reading 2 (mm) Reading 3 (mm) Average (mm) Standard Deviation (mm)
A B A B A B A B A B
99950 210.5 -22.5 210.5 -22.5 210.5 -22.5 210.5 -22.5 0.0 0.0
99984 90.8 -19.5 90.5 -18.6 90.8 -19.5 90.7 -19.2 0.2 0.5
Table 3 - Carrier check results - repeatability
There was no difference in the results at the 99950 counter reading. The standard deviation of results at the 99984 counter reading was within (less than half of) the measurement uncertainty for vertical (A) and horizontal (B) measurements.
Report Number: 14291 Issue: 1.0
GL Noble Denton Restricted
Page 16
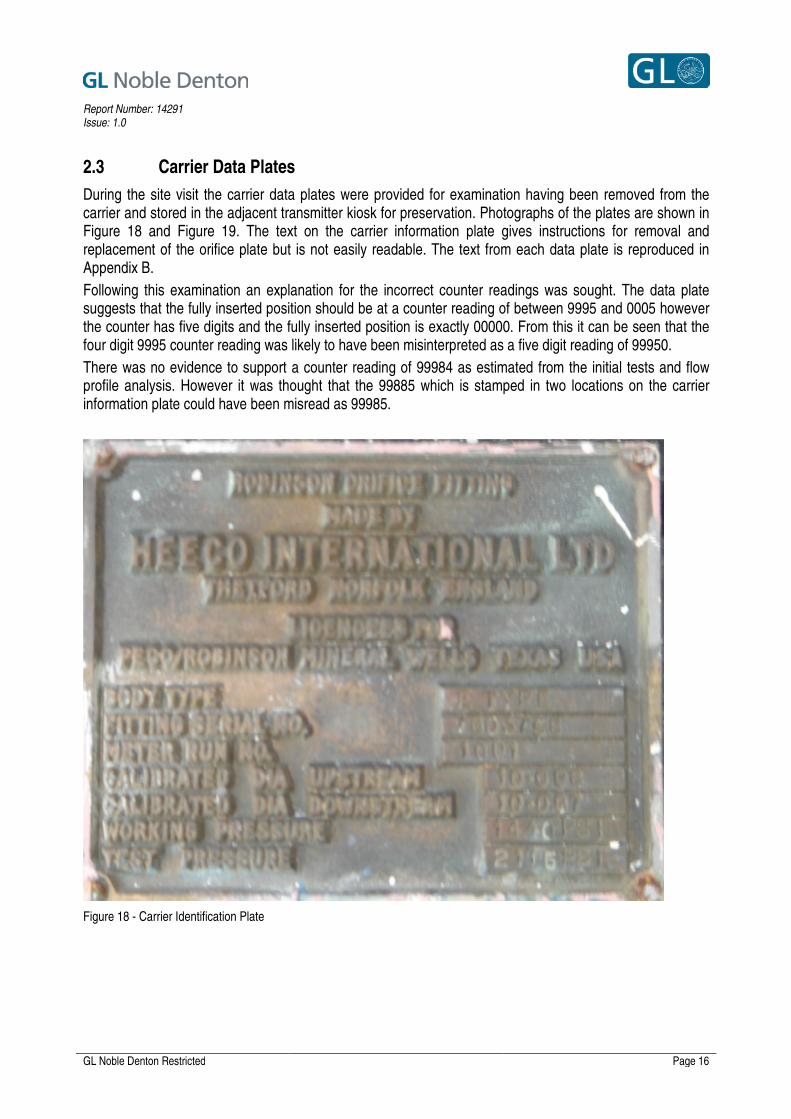
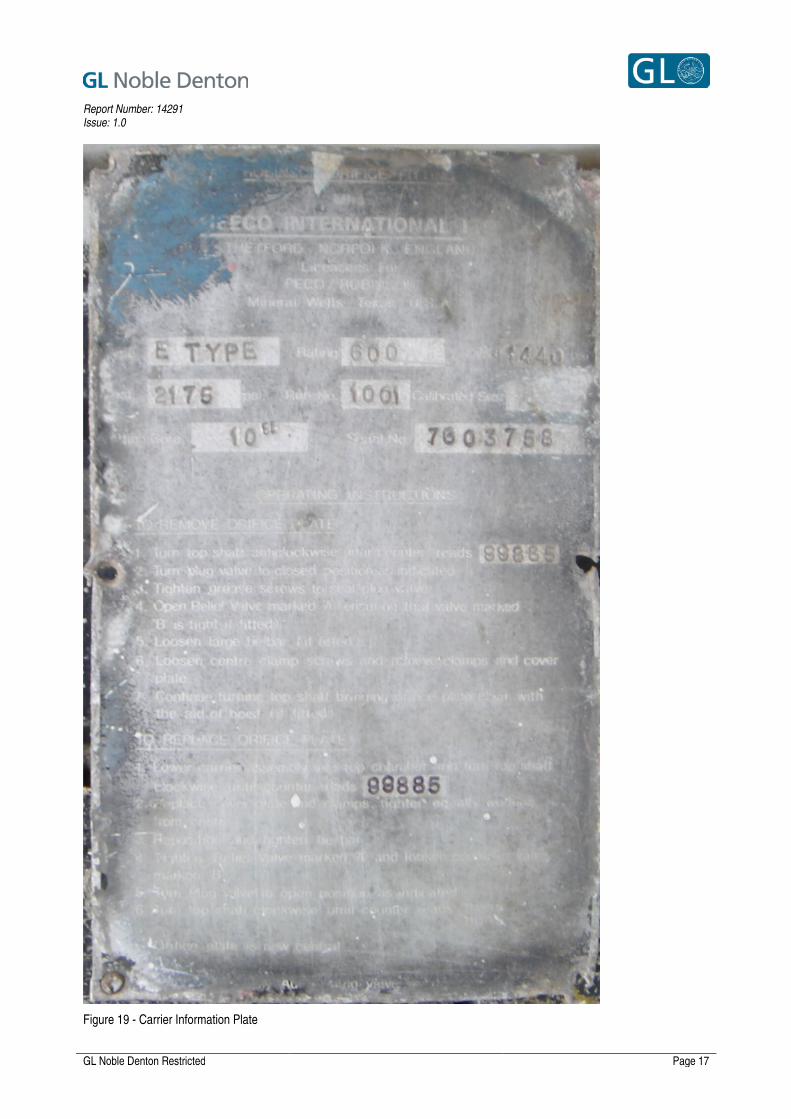
2.3 Carrier Data Plates
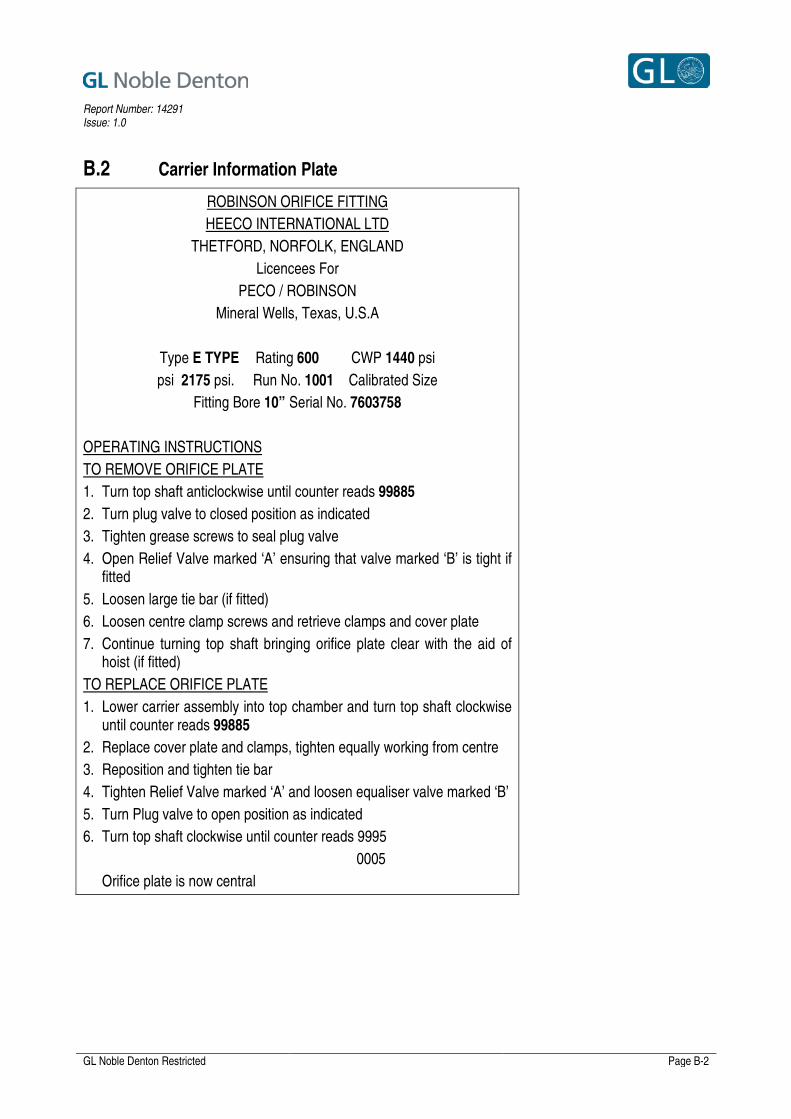
During the site visit the carrier data plates were provided for examination having been removed from the carrier and stored in the adjacent transmitter kiosk for preservation. Photographs of the plates are shown in Figure 18 and Figure 19. The text on the carrier information plate gives instructions for removal and replacement of the orifice plate but is not easily readable. The text from each data plate is reproduced in Appendix B.
Following this examination an explanation for the incorrect counter readings was sought. The data plate suggests that the fully inserted position should be at a counter reading of between 9995 and 0005 however the counter has five digits and the fully inserted position is exactly 00000. From this it can be seen that the four digit 9995 counter reading was likely to have been misinterpreted as a five digit reading of 99950.
There was no evidence to support a counter reading of 99984 as estimated from the initial tests and flow profile analysis. However it was thought that the 99885 which is stamped in two locations on the carrier information plate could have been misread as 99985.
Figure 18 - Carrier Identification Plate
Report Number: 14291 Issue: 1.0
GL Noble Denton Restricted
Page 17
Figure 19 - Carrier Information Plate
Report Number: 14291 Issue: 1.0
GL Noble Denton Restricted
Page 18
2.4 Orifice Plate Change Photographs
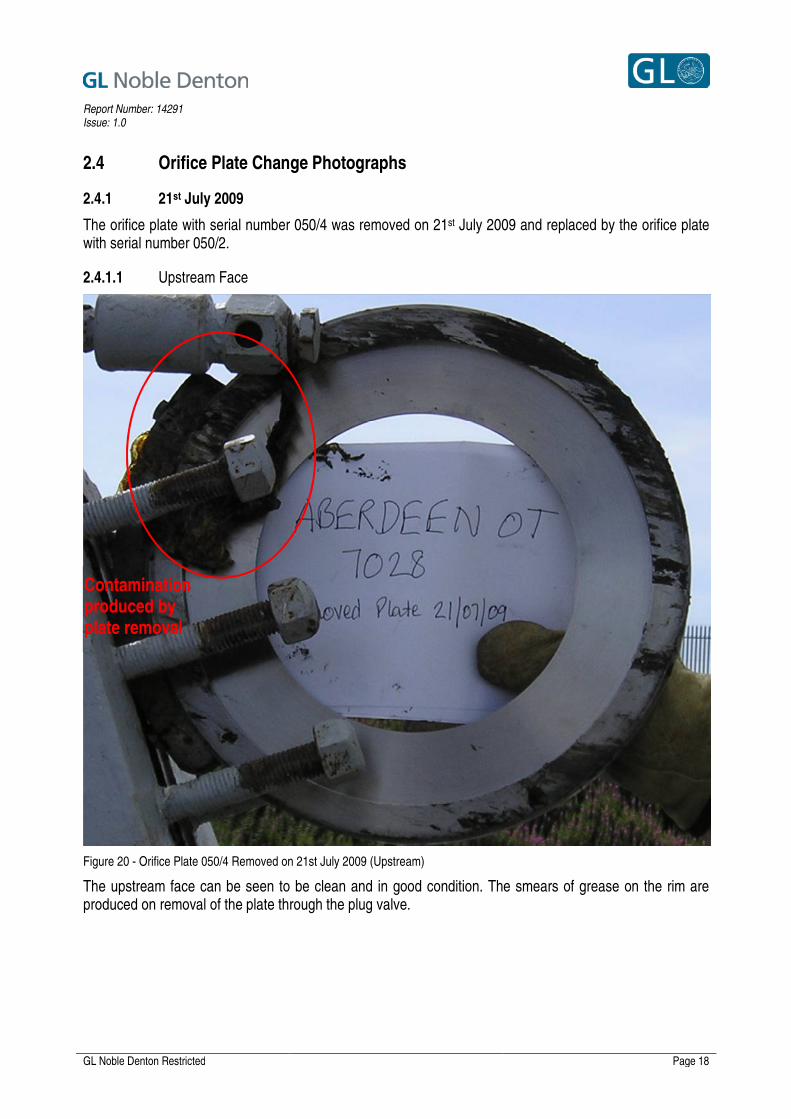
2.4.1 21st July 2009
The orifice plate with serial number 050/4 was removed on 21st July 2009 and replaced by the orifice plate with serial number 050/2.
2.4.1.1 Upstream Face
Figure 20 - Orifice Plate 050/4 Removed on 21st July 2009 (Upstream)
The upstream face can be seen to be clean and in good condition. The smears of grease on the rim are produced on removal of the plate through the plug valve.
Contamination produced by plate removal
Report Number: 14291 Issue: 1.0
GL Noble Denton Restricted
Page 19
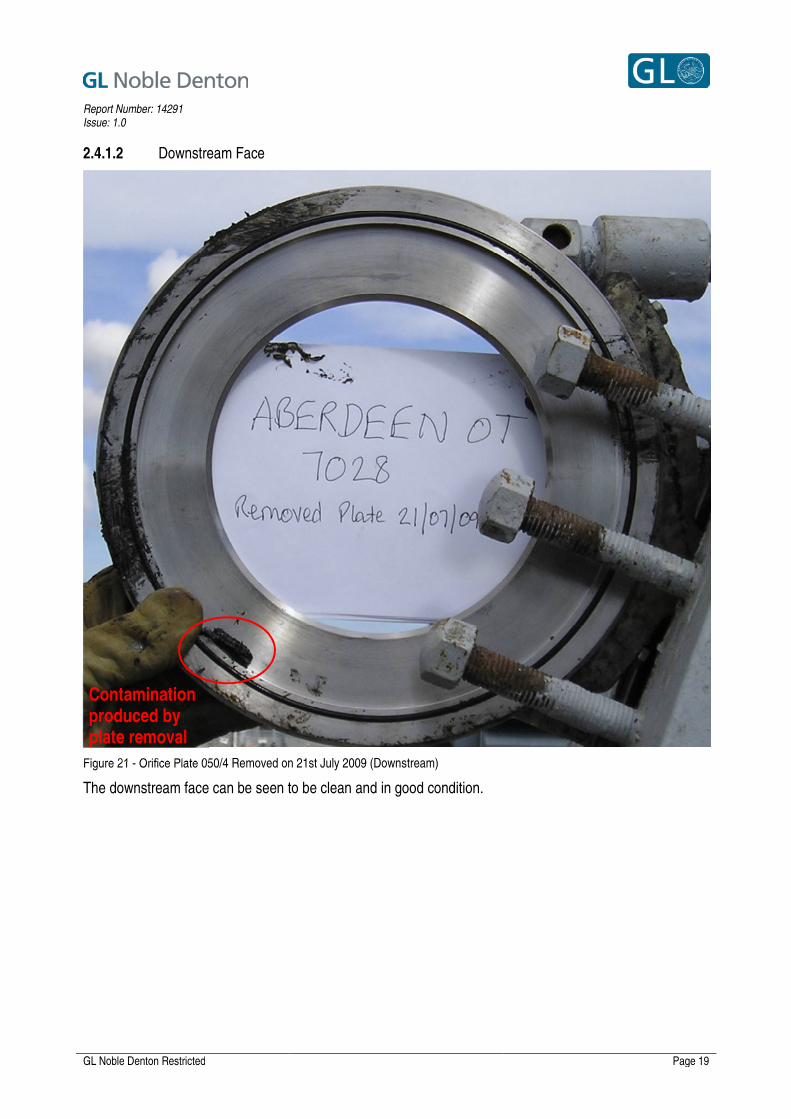
2.4.1.2 Downstream Face
Figure 21 - Orifice Plate 050/4 Removed on 21st July 2009 (Downstream)
The downstream face can be seen to be clean and in good condition.
Contamination produced by plate removal
Report Number: 14291 Issue: 1.0
GL Noble Denton Restricted
Page 20
2.4.2 27th July 2010
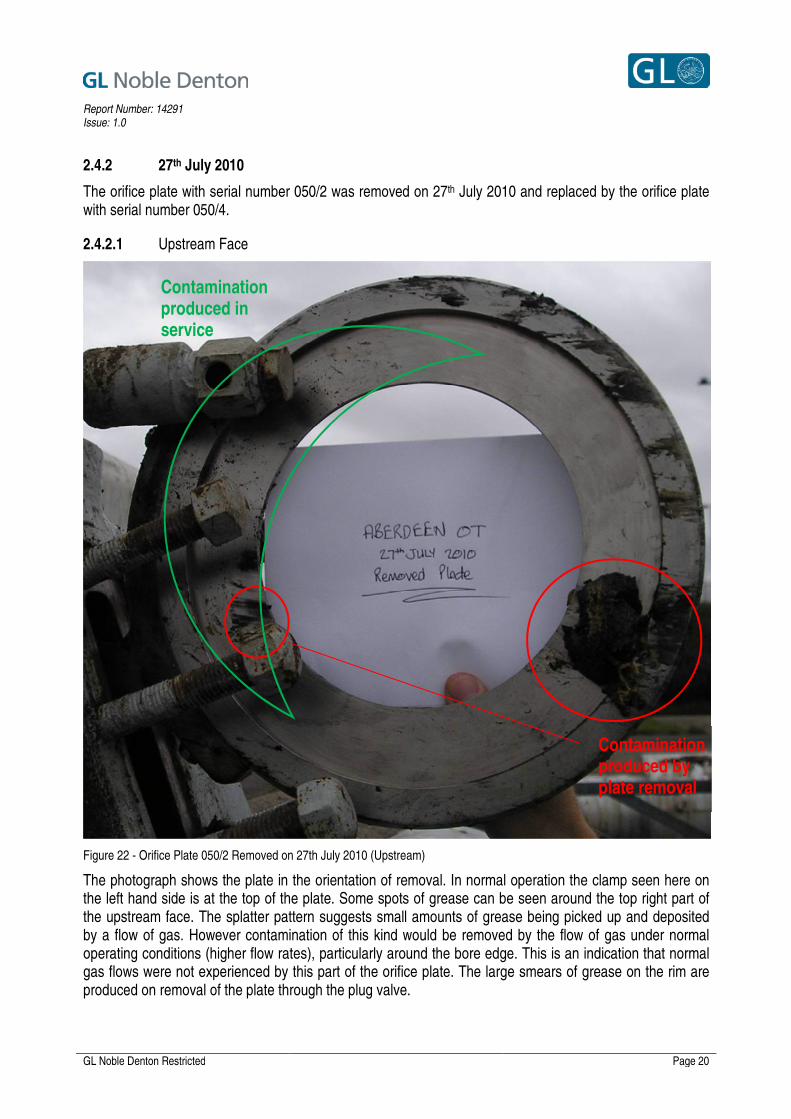
The orifice plate with serial number 050/2 was removed on 27th July 2010 and replaced by the orifice plate with serial number 050/4.
2.4.2.1 Upstream Face
Figure 22 - Orifice Plate 050/2 Removed on 27th July 2010 (Upstream)
The photograph shows the plate in the orientation of removal. In normal operation the clamp seen here on the left hand side is at the top of the plate. Some spots of grease can be seen around the top right part of the upstream face. The splatter pattern suggests small amounts of grease being picked up and deposited by a flow of gas. However contamination of this kind would be removed by the flow of gas under normal operating conditions (higher flow rates), particularly around the bore edge. This is an indication that normal gas flows were not experienced by this part of the orifice plate. The large smears of grease on the rim are produced on removal of the plate through the plug valve.
Contamination produced by plate removal
Contamination produced in service
Report Number: 14291 Issue: 1.0
GL Noble Denton Restricted
Page 21
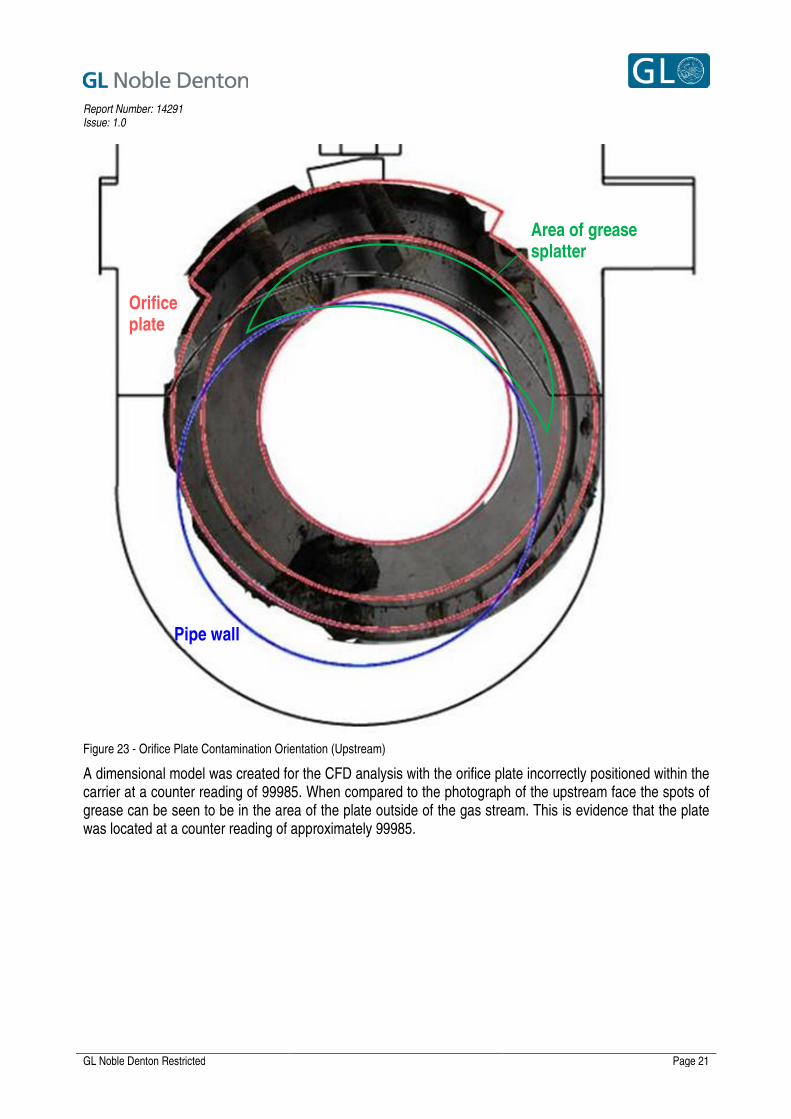
Figure 23 - Orifice Plate Contamination Orientation (Upstream)
A dimensional model was created for the CFD analysis with the orifice plate incorrectly positioned within the carrier at a counter reading of 99985. When compared to the photograph of the upstream face the spots of grease can be seen to be in the area of the plate outside of the gas stream. This is evidence that the plate was located at a counter reading of approximately 99985.
Orifice plate
Pipe wall
Area of grease splatter
Report Number: 14291 Issue: 1.0
GL Noble Denton Restricted
Page 22
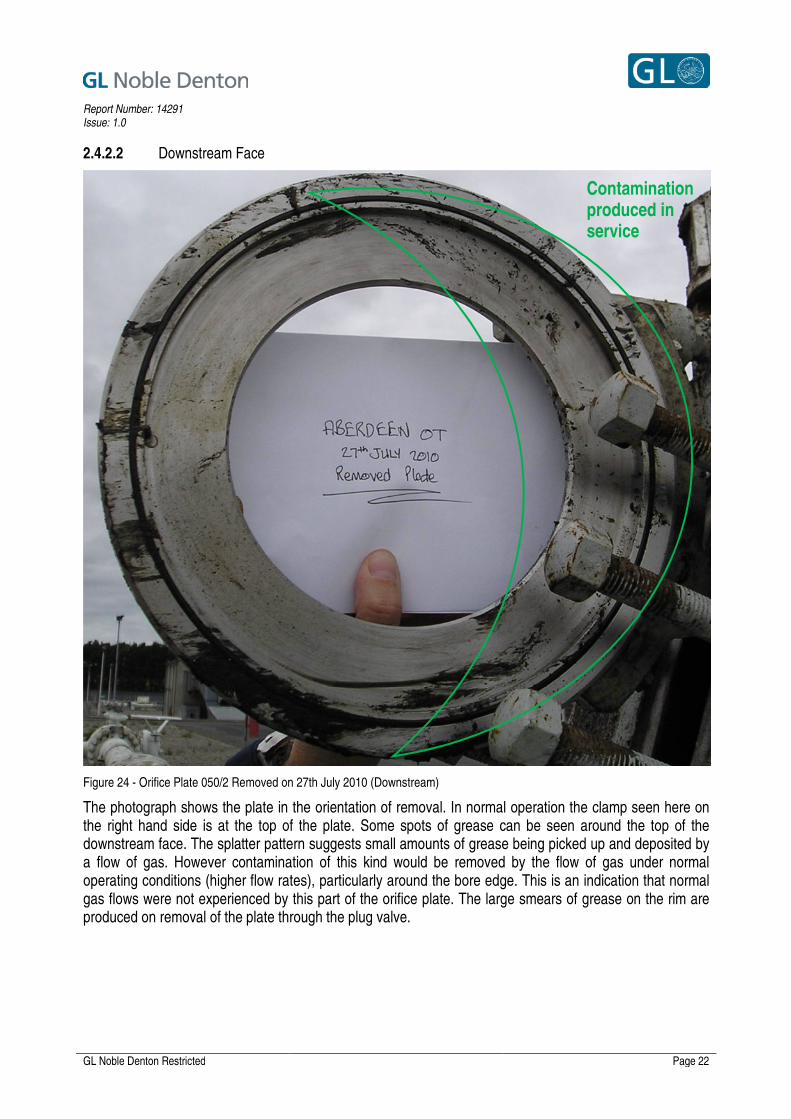
2.4.2.2 Downstream Face
Figure 24 - Orifice Plate 050/2 Removed on 27th July 2010 (Downstream)
The photograph shows the plate in the orientation of removal. In normal operation the clamp seen here on the right hand side is at the top of the plate. Some spots of grease can be seen around the top of the downstream face. The splatter pattern suggests small amounts of grease being picked up and deposited by a flow of gas. However contamination of this kind would be removed by the flow of gas under normal operating conditions (higher flow rates), particularly around the bore edge. This is an indication that normal gas flows were not experienced by this part of the orifice plate. The large smears of grease on the rim are produced on removal of the plate through the plug valve.
Contamination produced in service
Report Number: 14291 Issue: 1.0
GL Noble Denton Restricted
Page 23
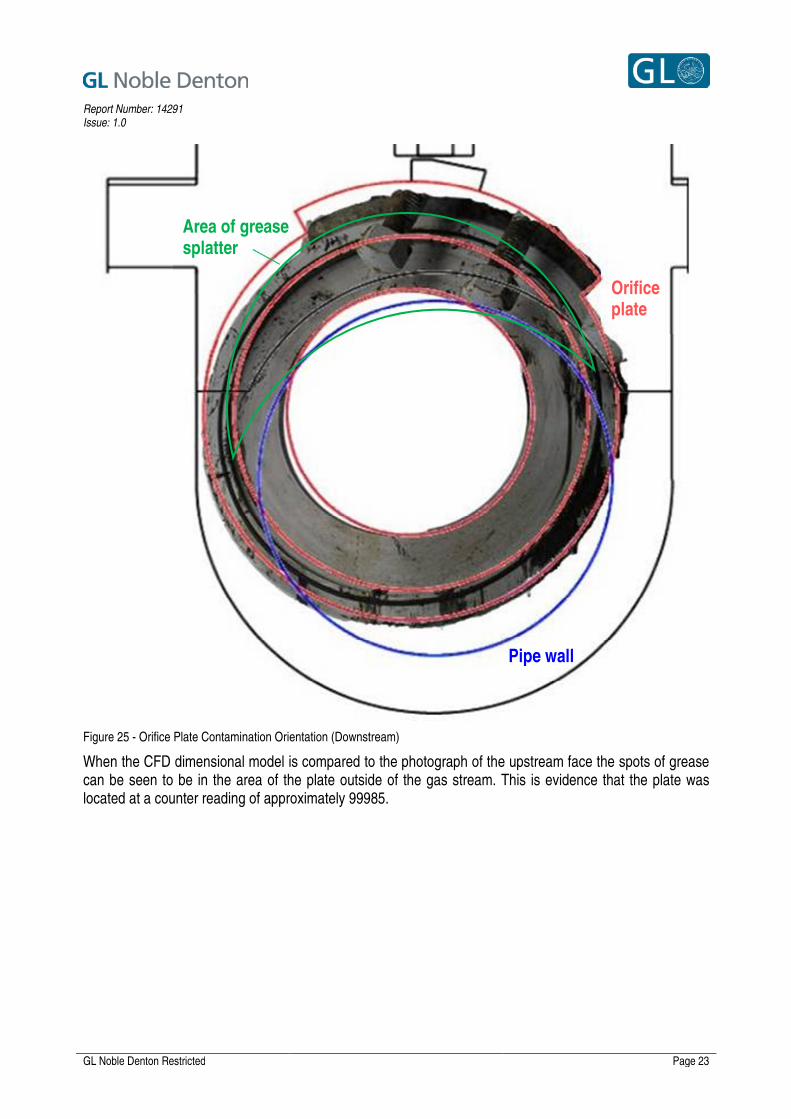
Figure 25 - Orifice Plate Contamination Orientation (Downstream)
When the CFD dimensional model is compared to the photograph of the upstream face the spots of grease can be seen to be in the area of the plate outside of the gas stream. This is evidence that the plate was located at a counter reading of approximately 99985.
Orifice plate
Pipe wall
Area of grease splatter
Report Number: 14291 Issue: 1.0
GL Noble Denton Restricted
Page 24
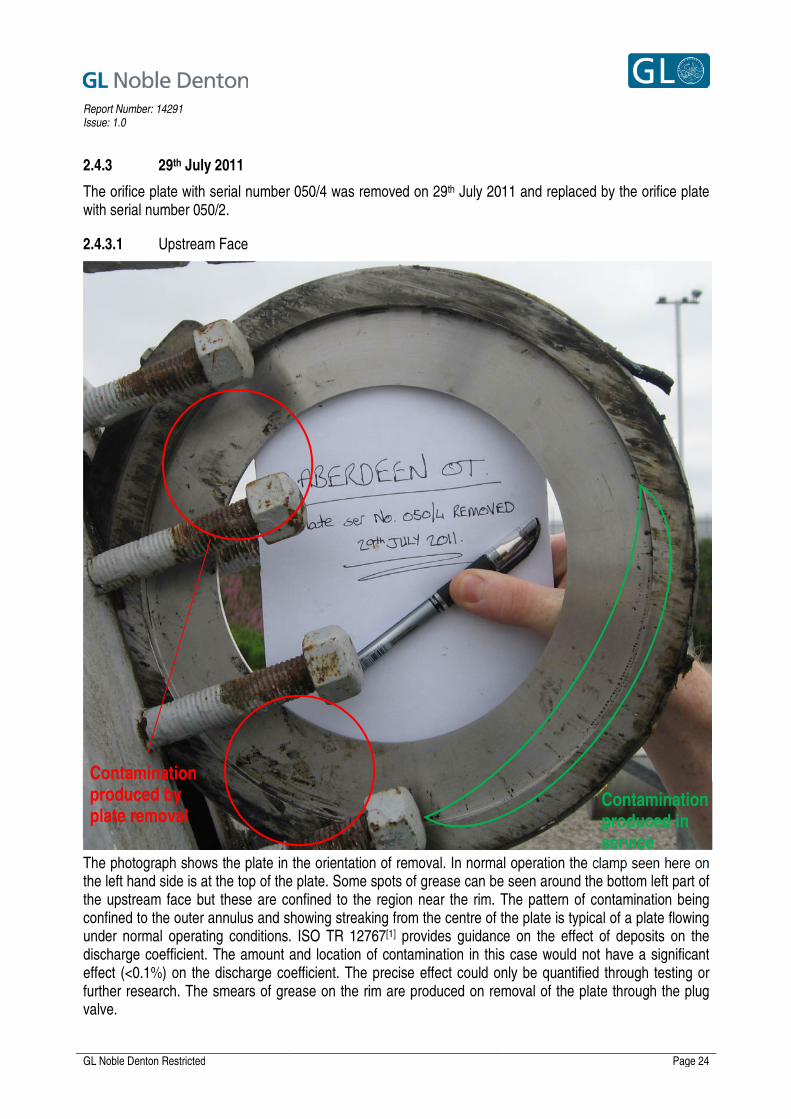
2.4.3 29th July 2011
The orifice plate with serial number 050/4 was removed on 29th July 2011 and replaced by the orifice plate with serial number 050/2.
2.4.3.1 Upstream Face
The photograph shows the plate in the orientation of removal. In normal operation the clamp seen here on the left hand side is at the top of the plate. Some spots of grease can be seen around the bottom left part of the upstream face but these are confined to the region near the rim. The pattern of contamination being confined to the outer annulus and showing streaking from the centre of the plate is typical of a plate flowing under normal operating conditions. ISO TR 12767[1] provides guidance on the effect of deposits on the discharge coefficient. The amount and location of contamination in this case would not have a significant effect (<0.1%) on the discharge coefficient. The precise effect could only be quantified through testing or further research. The smears of grease on the rim are produced on removal of the plate through the plug valve.
Contamination produced in service
Contamination produced by plate removal
Report Number: 14291 Issue: 1.0
GL Noble Denton Restricted
Page 25
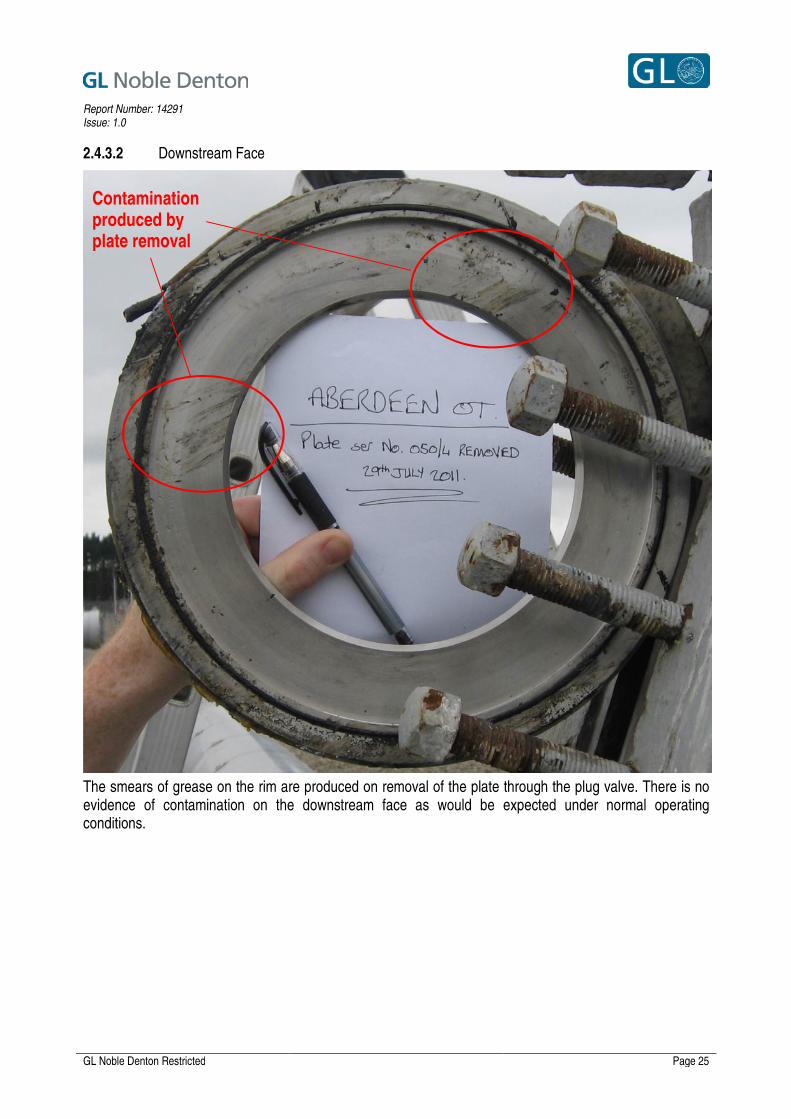
2.4.3.2 Downstream Face
The smears of grease on the rim are produced on removal of the plate through the plug valve. There is no evidence of contamination on the downstream face as would be expected under normal operating conditions.
Contamination produced by plate removal
Report Number: 14291 Issue: 1.0
GL Noble Denton Restricted
Page 26
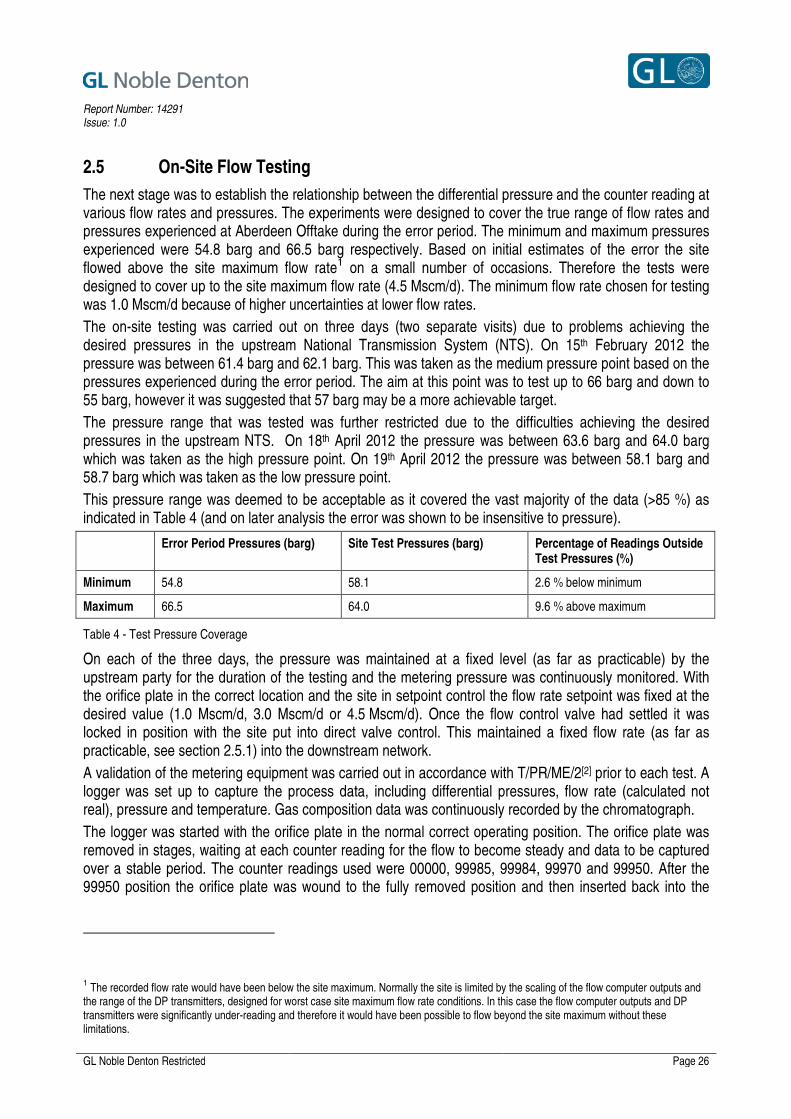
2.5 On-Site Flow Testing
The next stage was to establish the relationship between the differential pressure and the counter reading at various flow rates and pressures. The experiments were designed to cover the true range of flow rates and pressures experienced at Aberdeen Offtake during the error period. The minimum and maximum pressures experienced were 54.8 barg and 66.5 barg respectively. Based on initial estimates of the error the site flowed above the site maximum flow rate1 on a small number of occasions. Therefore the tests were designed to cover up to the site maximum flow rate (4.5 Mscm/d). The minimum flow rate chosen for testing was 1.0 Mscm/d because of higher uncertainties at lower flow rates.
The on-site testing was carried out on three days (two separate visits) due to problems achieving the desired pressures in the upstream National Transmission System (NTS). On 15th February 2012 the pressure was between 61.4 barg and 62.1 barg. This was taken as the medium pressure point based on the pressures experienced during the error period. The aim at this point was to test up to 66 barg and down to 55 barg, however it was suggested that 57 barg may be a more achievable target.
The pressure range that was tested was further restricted due to the difficulties achieving the desired pressures in the upstream NTS. On 18th April 2012 the pressure was between 63.6 barg and 64.0 barg which was taken as the high pressure point. On 19th April 2012 the pressure was between 58.1 barg and 58.7 barg which was taken as the low pressure point.
This pressure range was deemed to be acceptable as it covered the vast majority of the data (>85 %) as indicated in Table 4 (and on later analysis the error was shown to be insensitive to pressure).
Error Period Pressures (barg) Site Test Pressures (barg) Percentage of Readings Outside Test Pressures (%)
Minimum 54.8 58.1 2.6 % below minimum
Maximum 66.5 64.0 9.6 % above maximum
Table 4 - Test Pressure Coverage
On each of the three days, the pressure was maintained at a fixed level (as far as practicable) by the upstream party for the duration of the testing and the metering pressure was continuously monitored. With the orifice plate in the correct location and the site in setpoint control the flow rate setpoint was fixed at the desired value (1.0 Mscm/d, 3.0 Mscm/d or 4.5 Mscm/d). Once the flow control valve had settled it was locked in position with the site put into direct valve control. This maintained a fixed flow rate (as far as practicable, see section 2.5.1) into the downstream network.
A validation of the metering equipment was carried out in accordance with T/PR/ME/2[2] prior to each test. A logger was set up to capture the process data, including differential pressures, flow rate (calculated not real), pressure and temperature. Gas composition data was continuously recorded by the chromatograph.
The logger was started with the orifice plate in the normal correct operating position. The orifice plate was removed in stages, waiting at each counter reading for the flow to become steady and data to be captured over a stable period. The counter readings used were 00000, 99985, 99984, 99970 and 99950. After the 99950 position the orifice plate was wound to the fully removed position and then inserted back into the
1 The recorded flow rate would have been below the site maximum. Normally the site is limited by the scaling of the flow computer outputs and
the range of the DP transmitters, designed for worst case site maximum flow rate conditions. In this case the flow computer outputs and DP transmitters were significantly under-reading and therefore it would have been possible to flow beyond the site maximum without these limitations.
Report Number: 14291 Issue: 1.0
GL Noble Denton Restricted
Page 27
99950 position. The same counter readings were used (in reverse order) as the plate was lowered into the fully inserted position.
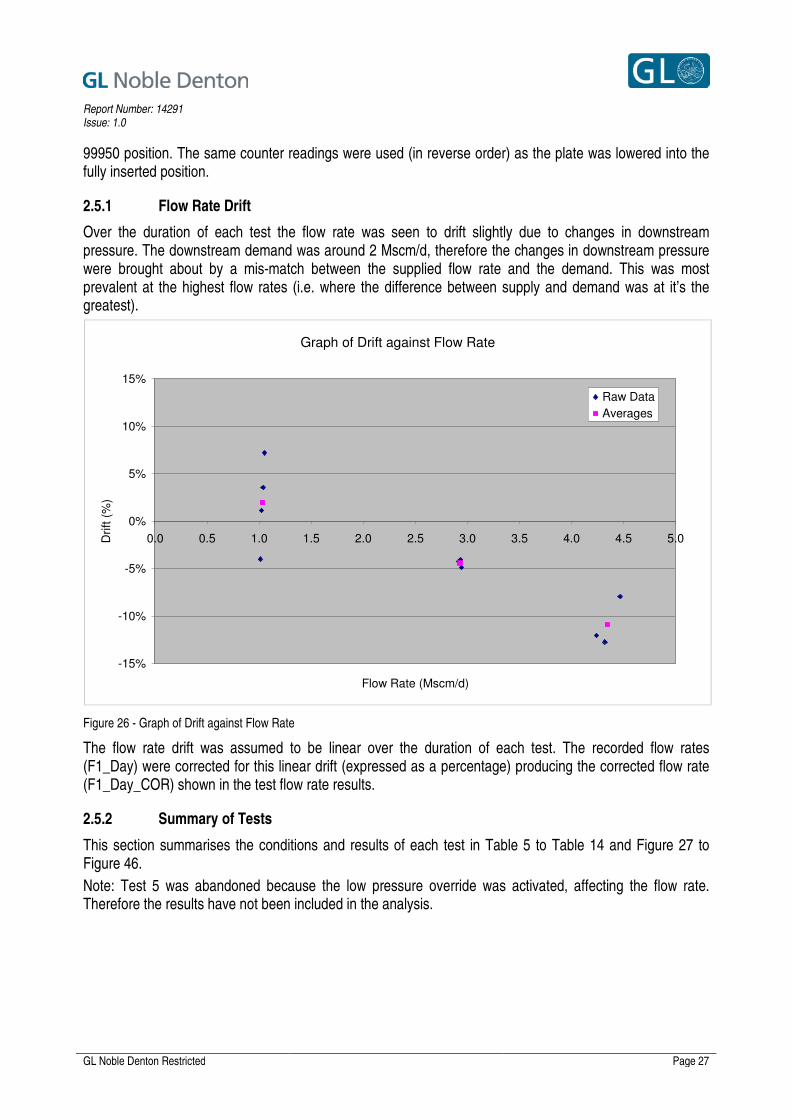
2.5.1 Flow Rate Drift
Over the duration of each test the flow rate was seen to drift slightly due to changes in downstream pressure. The downstream demand was around 2 Mscm/d, therefore the changes in downstream pressure were brought about by a mis-match between the supplied flow rate and the demand. This was most prevalent at the highest flow rates (i.e. where the difference between supply and demand was at it’s the greatest).
Figure 26 - Graph of Drift against Flow Rate
The flow rate drift was assumed to be linear over the duration of each test. The recorded flow rates (F1_Day) were corrected for this linear drift (expressed as a percentage) producing the corrected flow rate (F1_Day_COR) shown in the test flow rate results.
2.5.2 Summary of Tests
This section summarises the conditions and results of each test in Table 5 to Table 14 and Figure 27 to Figure 46.
Note: Test 5 was abandoned because the low pressure override was activated, affecting the flow rate. Therefore the results have not been included in the analysis.
Graph of Drift against Flow Rate
-15%
-10%
-5%
0%
5%
10%
15%
0.0 0.5 1.0 1.5 2.0 2.5 3.0 3.5 4.0 4.5 5.0
Flow Rate (Mscm/d)
Dri
ft (
%)
Raw Data
Averages

Report Number: 14291 Issue: 1.0
GL Noble Denton Restricted
Page 28
2.5.2.1 Test 1 Summary
Date 15th February 2012
Time 13:10
Pressure (Average) 61.5 barg
Flow Rate (Average) 1.04 Mscm/d
Flow Rate Drift +3.6 %
(+0.04 Mscm/d)
Table 5 - Test 1 Conditions
Figure 27 - Test 1 Flow Rate Results
Figure 28 - Test 1 Differential Pressure Results

Report Number: 14291 Issue: 1.0
GL Noble Denton Restricted
Page 29
2.5.2.2 Test 2 Summary
Date 15th February 2012
Time 14:03
Pressure (Average) 61.5 barg
Flow Rate (Average) 2.91 Mscm/d
Flow Rate Drift -4.2 %
(-0.12 Mscm/d)
Table 6 - Test 2 Conditions
Figure 29 - Test 2 Flow Rate Results
Figure 30 - Test 2 Differential Pressure Results

Report Number: 14291 Issue: 1.0
GL Noble Denton Restricted
Page 30
2.5.2.3 Test 3 Summary
Date 15th February 2012
Time 15:53
Pressure (Average) 62.1 barg
Flow Rate (Average) 4.47 Mscm/d
Flow Rate Drift -7.9 %
(-0.35 Mscm/d)
Table 7 - Test 3 Conditions
Figure 31 - Test 3 Flow Rate Results
Figure 32 - Test 3 Differential Pressure Results
Report Number: 14291 Issue: 1.0
GL Noble Denton Restricted
Page 31
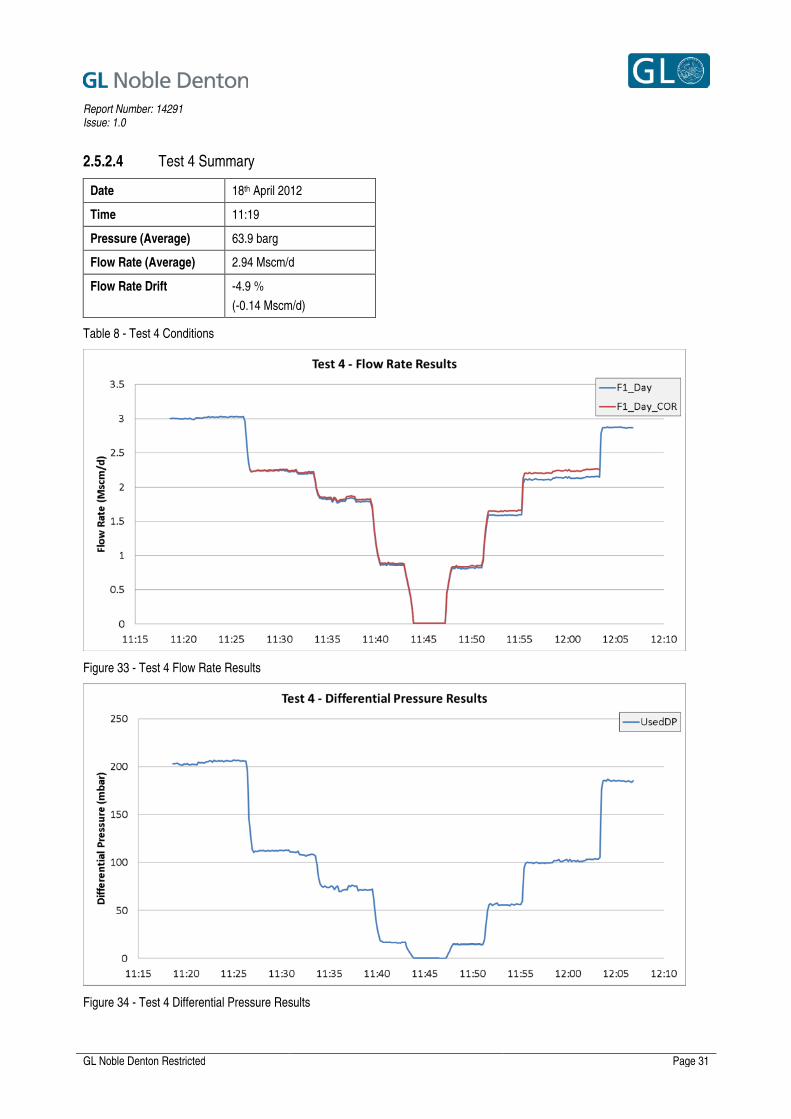
2.5.2.4 Test 4 Summary
Date 18th April 2012
Time 11:19
Pressure (Average) 63.9 barg
Flow Rate (Average) 2.94 Mscm/d
Flow Rate Drift -4.9 %
(-0.14 Mscm/d)
Table 8 - Test 4 Conditions
Figure 33 - Test 4 Flow Rate Results
Figure 34 - Test 4 Differential Pressure Results

Report Number: 14291 Issue: 1.0
GL Noble Denton Restricted
Page 32
2.5.2.5 Test 6 Summary
Date 18th April 2012
Time 13:24
Pressure (Average) 63.9 barg
Flow Rate (Average) 1.01 Mscm/d
Flow Rate Drift -4.0 %
(-0.04 Mscm/d)
Table 9 - Test 6 Conditions
Figure 35 - Test 6 Flow Rate Results
Figure 36 - Test 6 Differential Pressure Results
Report Number: 14291 Issue: 1.0
GL Noble Denton Restricted
Page 33
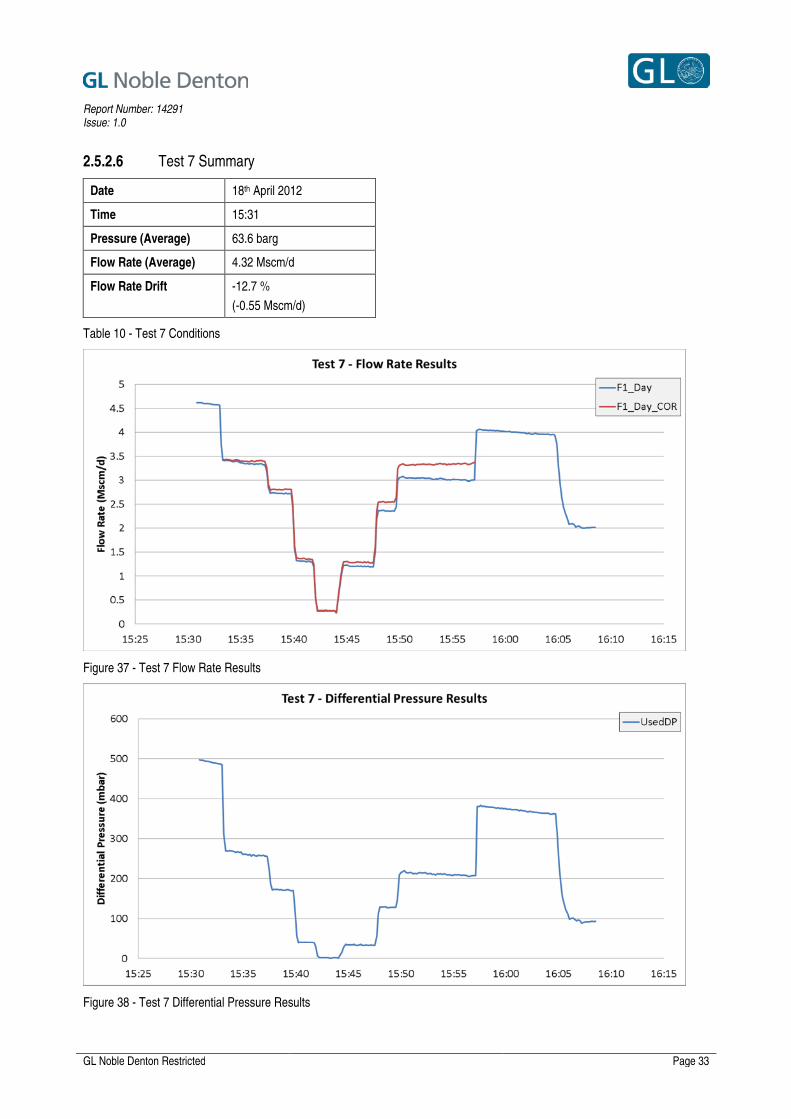
2.5.2.6 Test 7 Summary
Date 18th April 2012
Time 15:31
Pressure (Average) 63.6 barg
Flow Rate (Average) 4.32 Mscm/d
Flow Rate Drift -12.7 %
(-0.55 Mscm/d)
Table 10 - Test 7 Conditions
Figure 37 - Test 7 Flow Rate Results
Figure 38 - Test 7 Differential Pressure Results
Report Number: 14291 Issue: 1.0
GL Noble Denton Restricted
Page 34
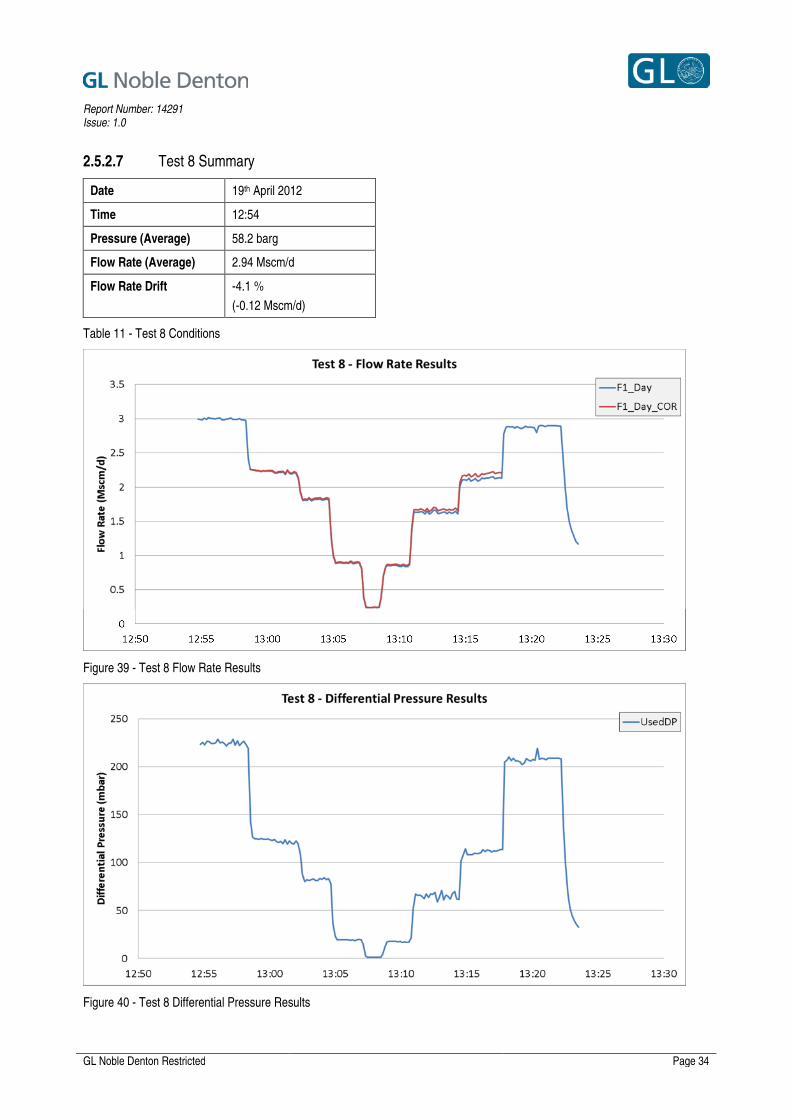
2.5.2.7 Test 8 Summary
Date 19th April 2012
Time 12:54
Pressure (Average) 58.2 barg
Flow Rate (Average) 2.94 Mscm/d
Flow Rate Drift -4.1 %
(-0.12 Mscm/d)
Table 11 - Test 8 Conditions
Figure 39 - Test 8 Flow Rate Results
Figure 40 - Test 8 Differential Pressure Results
Report Number: 14291 Issue: 1.0
GL Noble Denton Restricted
Page 35
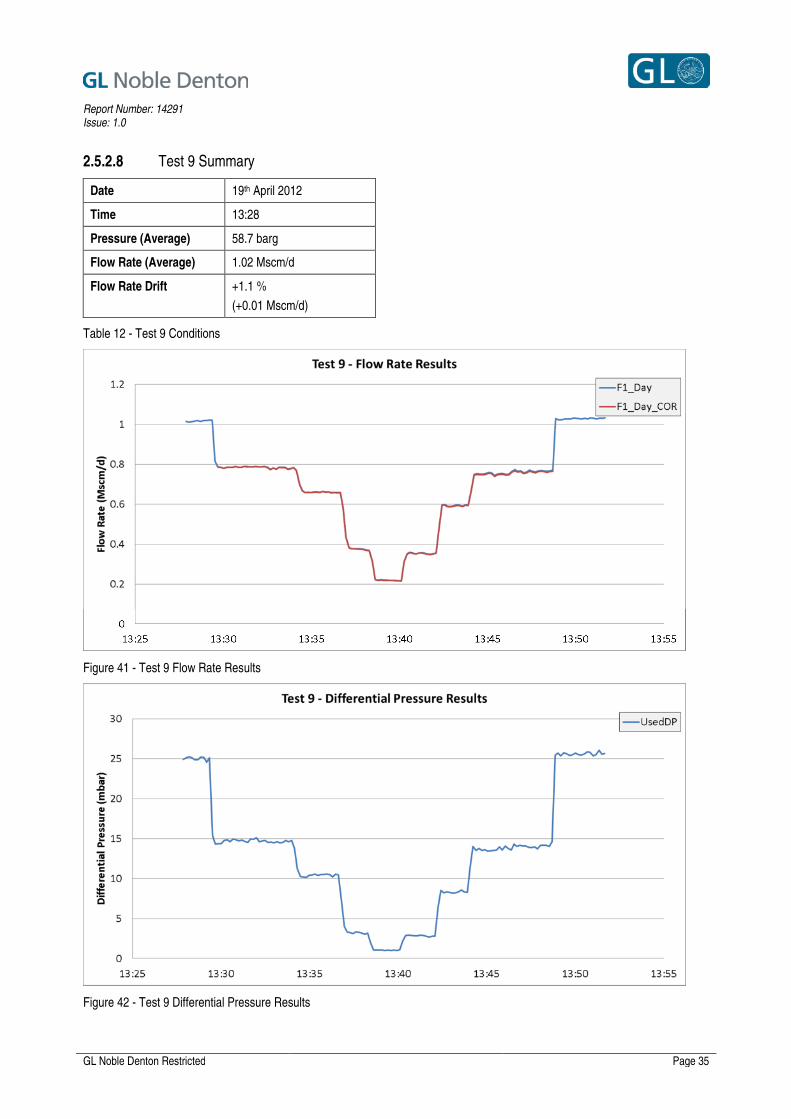
2.5.2.8 Test 9 Summary
Date 19th April 2012
Time 13:28
Pressure (Average) 58.7 barg
Flow Rate (Average) 1.02 Mscm/d
Flow Rate Drift +1.1 %
(+0.01 Mscm/d)
Table 12 - Test 9 Conditions
Figure 41 - Test 9 Flow Rate Results
Figure 42 - Test 9 Differential Pressure Results

Report Number: 14291 Issue: 1.0
GL Noble Denton Restricted
Page 36
2.5.2.9 Test 10 Summary
Date 19th April 2012
Time 14:03
Pressure (Average) 58.2 barg
Flow Rate (Average) 4.24 Mscm/d
Flow Rate Drift -12.0 %
(-0.51 Mscm/d)
Table 13 - Test 10 Conditions
Figure 43 - Test 10 Flow Rate Results
Figure 44 - Test 10 Differential Pressure Results

Report Number: 14291 Issue: 1.0
GL Noble Denton Restricted
Page 37
2.5.2.10 Test 11 Summary
Date 19th April 2012
Time 14:35
Pressure (Average) 58.6 barg
Flow Rate (Average) 1.05 Mscm/d
Flow Rate Drift +7.2 %
(+0.08 Mscm/d)
Table 14 - Test 11 Conditions
Figure 45 - Test 11 Flow Rate Results
Figure 46 - Test 11 Differential Pressure Results
Report Number: 14291 Issue: 1.0
GL Noble Denton Restricted
Page 38
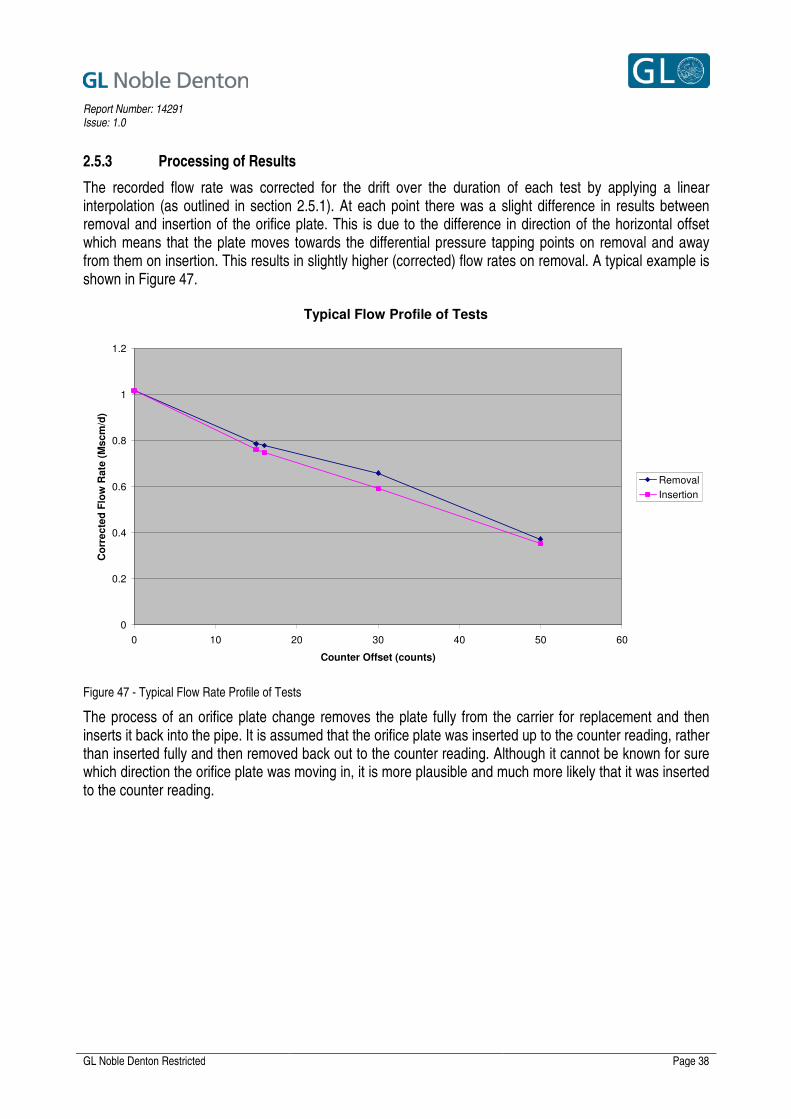
2.5.3 Processing of Results
The recorded flow rate was corrected for the drift over the duration of each test by applying a linear interpolation (as outlined in section 2.5.1). At each point there was a slight difference in results between removal and insertion of the orifice plate. This is due to the difference in direction of the horizontal offset which means that the plate moves towards the differential pressure tapping points on removal and away from them on insertion. This results in slightly higher (corrected) flow rates on removal. A typical example is shown in Figure 47.
Figure 47 - Typical Flow Rate Profile of Tests
The process of an orifice plate change removes the plate fully from the carrier for replacement and then inserts it back into the pipe. It is assumed that the orifice plate was inserted up to the counter reading, rather than inserted fully and then removed back out to the counter reading. Although it cannot be known for sure which direction the orifice plate was moving in, it is more plausible and much more likely that it was inserted to the counter reading.
Typical Flow Profile of Tests
0
0.2
0.4
0.6
0.8
1
1.2
0 10 20 30 40 50 60
Counter Offset (counts)
Co
rre
cte
d F
low
Rate
(M
sc
m/d
)
Removal
Insertion
Report Number: 14291 Issue: 1.0
GL Noble Denton Restricted
Page 39
2.6 CFD Analysis
An independent Computational Fluid Dynamics (CFD) expert modelled the abnormal orifice plate configurations and used CFD analysis to predict the resulting differential pressures at the tapping points.
The analysis was carried out in stages as detailed below to allow for validation of the model because there is no guidance or prior experience for the abnormal cases. Stages 1 to 4 were used for validation of the model and stages 5 to 8 were used to produce the final results.
1. Creation of normal model
2. CFD results of normal model compared to real site process data
3. Creation of abnormal model (99970)
4. CFD results of abnormal model (99970) compared to experimental results
5. Creation of abnormal model (99985)
6. CFD results of abnormal model (99985) compared to experimental results
7. Creation of abnormal model (99950)
8. CFD results of abnormal model (99950) compared to experimental results
The CFD model validation and final CFD predicted results form part of the CFD analysis report[3] which is reproduced in part here and reproduced in full in Appendix D.
2.6.1 Description of Model
Two common CFD models were investigated, ‘k-ω/SST (Shear Stress Transport)’[4] and ‘standard k-ε’[5], both based on Reynolds-Averaged Navier-Stokes turbulence models. They are both commonly used two-equation turbulence models, which means they include two extra transport equations to represent the turbulent properties of the flow. This allows a two equation model to account for history effects like convection and diffusion of turbulent energy.
Both models use the turbulent kinetic energy, k, as the first transported variable, which determines the energy in the turbulence. The second transported variable in the ‘k-ω/SST’ model[4] is the specific dissipation, ω. The second transported variable in the ‘k-ε’ model[5] is the turbulence dissipation, ε. Both ω and ε determine the scale of the turbulence.
The ‘k-ω/SST’ model[4] is suggested for modelling orifice plates which conform to ISO 5167[6] in existing guidance documents[7]. No specific guidance exists for modelling orifice plates which fall outside the scope of ISO 5167[6]. The ‘k-ω/SST’ model[4] was used initially for the orifice plate in normal measurement position and produced good results when compared to the real site process data. Attempts to use this model for the abnormal measurement position at a counter reading of 99970 (and later 99985) were unsuccessful producing large errors when compared to the experimental data.
The ‘standard k-ε’[5] model was then used for both the normal and abnormal measurement positions producing good results for both. This model was selected as the most accurate for the modelling of orifice plates which fall outside the scope of ISO 5167[6].
2.6.2 Validation of Model
Dimensional data was provided to the CFD expert from a combination of site measurements and drawings to build up a model of the orifice plate, carrier and upstream and downstream pipework in normal and abnormal measurement positions.
The real site process data and experimental data that were provided did not include the resultant differential pressure which was to be calculated by the CFD analysis. The differential pressures were made available for comparison, only once the results of the CFD analysis were provided. The comparison of results was

Report Number: 14291 Issue: 1.0
GL Noble Denton Restricted
Page 40
made taking into consideration the uncertainty in the differential pressure measurement as this is the dominant source of measurement uncertainty. ISO TR 12767[1] states that ‘a further effect of eccentric positioning of an orifice plate is an increased unsteadiness of the DP signal obtained. Observations have shown, for example, a marked increase in DP reading fluctuations with increasing eccentricity for all values of β between 0.4 and 0.7.’ Other sources of uncertainty from the experimental data include pressure, temperature and gas composition measurements, flow rate fluctuations and flow rate calculation method. Other sources of uncertainty from the CFD analysis include orifice plate position, orifice plate dimensions, pipe dimensions, carrier dimensions and analysis method.
2.6.2.1 Grid Independence
In CFD modelling the results may vary depending on the resolution of the grid elements used, particularly around important features. Three grids of increasing resolution were used for each test case and the results were compared to determine the extent to which grid independence had been reached. The grid with the highest resolution is considered most accurate and this is the value presented in the CFD results.
2.6.2.2 Validation of Normal Measurement Position
The CFD results for the normal measurement position differed from the real site process data by 0.6 % to 1.5 % at low flow rates where the DP measurement uncertainty was calculated to be between ±3 % and ±6 %. At higher flow rates the results differed by 0.2 % to 0.6 % where the DP measurement uncertainty was calculated to be around ±1 %.
2.6.2.3 Validation of 99970 Abnormal Measurement Position
Data was provided for four of the tests (3, 7, 8 and 10) for the abnormal measurement position at a counter reading of 99970 (on insertion). The results are shown in Table 15.
Test Actual Flow Rate (m3/h)
Experimental DP (mbar)
CFD DP (mbar) Error (%) DP Measurement Uncertainty (%)
3 2430.7522 140.19 142.43 -1.6 % ±1.5 %
7 2259.955 127.96 126.73 1.0 % ±2.0 %
8 1741.5158 65.19 62.23 4.5 % ±1.5 %
10 2472.6176 133.62 132.81 0.6 % ±1.5 %
Table 15 - CFD Results for 99970 Counter Reading
The results are around the level of the DP measurement uncertainty apart from test 8. In this case the flow rates were slightly lower, however the error was still higher than expected. This may be due in part to the increased unsteadiness of the DP signal, caused by the eccentricity, which is not accounted for. From the CFD modelling it was also possible to see the location of the plate and visualise the flow profile around it as shown in Figure 48 and 47.
Report Number: 14291 Issue: 1.0
GL Noble Denton Restricted
Page 41
Figure 48 - [left] 99970 Abnormal Measurement Position; Figure 49 - [right] 99970 Velocity Vector Distribution in Mid x-y Plane (m/s; flowing left to right)
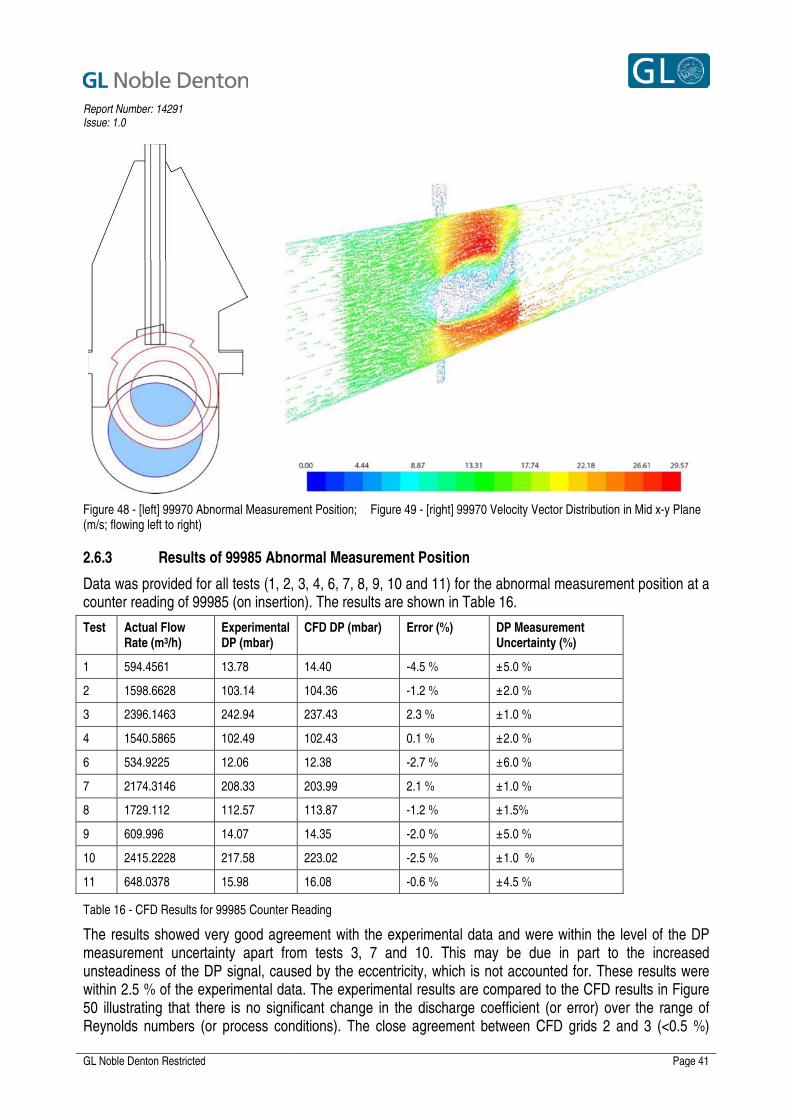
2.6.3 Results of 99985 Abnormal Measurement Position
Data was provided for all tests (1, 2, 3, 4, 6, 7, 8, 9, 10 and 11) for the abnormal measurement position at a counter reading of 99985 (on insertion). The results are shown in Table 16.
Test Actual Flow Rate (m3/h)
Experimental DP (mbar)
CFD DP (mbar) Error (%) DP Measurement Uncertainty (%)
1 594.4561 13.78 14.40 -4.5 % ±5.0 %
2 1598.6628 103.14 104.36 -1.2 % ±2.0 %
3 2396.1463 242.94 237.43 2.3 % ±1.0 %
4 1540.5865 102.49 102.43 0.1 % ±2.0 %
6 534.9225 12.06 12.38 -2.7 % ±6.0 %
7 2174.3146 208.33 203.99 2.1 % ±1.0 %
8 1729.112 112.57 113.87 -1.2 % ±1.5%
9 609.996 14.07 14.35 -2.0 % ±5.0 %
10 2415.2228 217.58 223.02 -2.5 % ±1.0 %
11 648.0378 15.98 16.08 -0.6 % ±4.5 %
Table 16 - CFD Results for 99985 Counter Reading
The results showed very good agreement with the experimental data and were within the level of the DP measurement uncertainty apart from tests 3, 7 and 10. This may be due in part to the increased unsteadiness of the DP signal, caused by the eccentricity, which is not accounted for. These results were within 2.5 % of the experimental data. The experimental results are compared to the CFD results in Figure 50 illustrating that there is no significant change in the discharge coefficient (or error) over the range of Reynolds numbers (or process conditions). The close agreement between CFD grids 2 and 3 (<0.5 %)

Report Number: 14291 Issue: 1.0
GL Noble Denton Restricted
Page 42
demonstrate acceptable grid independence. Figure 51 and 50 illustrate the location of the plate and the flow profile around it.
Figure 51 – [left] 99985 Abnormal Measurement Position; Figure 52 – [right] 99985 Velocity Vector Distribution in Mid x-y Plane (m/s; flowing left to right)
Figure 50 - Comparison of Experimental and CFD results for 99985 Counter Reading
Report Number: 14291 Issue: 1.0
GL Noble Denton Restricted
Page 43
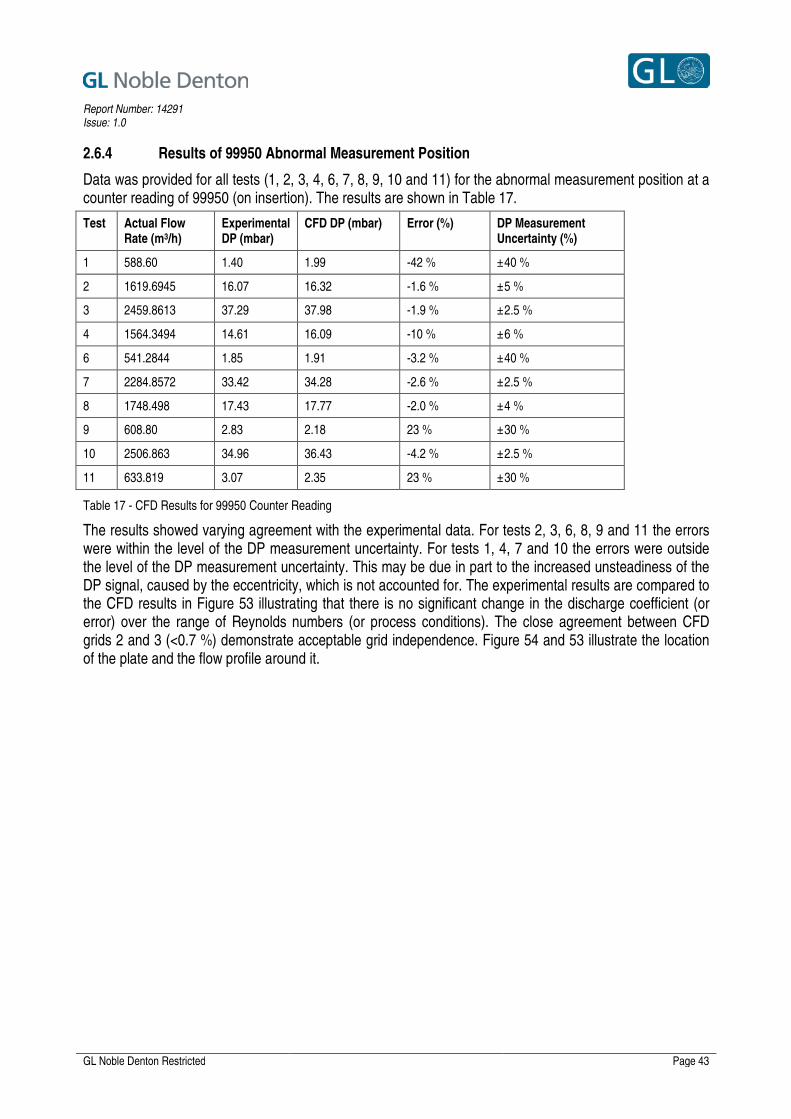
2.6.4 Results of 99950 Abnormal Measurement Position
Data was provided for all tests (1, 2, 3, 4, 6, 7, 8, 9, 10 and 11) for the abnormal measurement position at a counter reading of 99950 (on insertion). The results are shown in Table 17.
Test Actual Flow Rate (m3/h)
Experimental DP (mbar)
CFD DP (mbar) Error (%) DP Measurement Uncertainty (%)
1 588.60 1.40 1.99 -42 % ±40 %
2 1619.6945 16.07 16.32 -1.6 % ±5 %
3 2459.8613 37.29 37.98 -1.9 % ±2.5 %
4 1564.3494 14.61 16.09 -10 % ±6 %
6 541.2844 1.85 1.91 -3.2 % ±40 %
7 2284.8572 33.42 34.28 -2.6 % ±2.5 %
8 1748.498 17.43 17.77 -2.0 % ±4 %
9 608.80 2.83 2.18 23 % ±30 %
10 2506.863 34.96 36.43 -4.2 % ±2.5 %
11 633.819 3.07 2.35 23 % ±30 %
Table 17 - CFD Results for 99950 Counter Reading
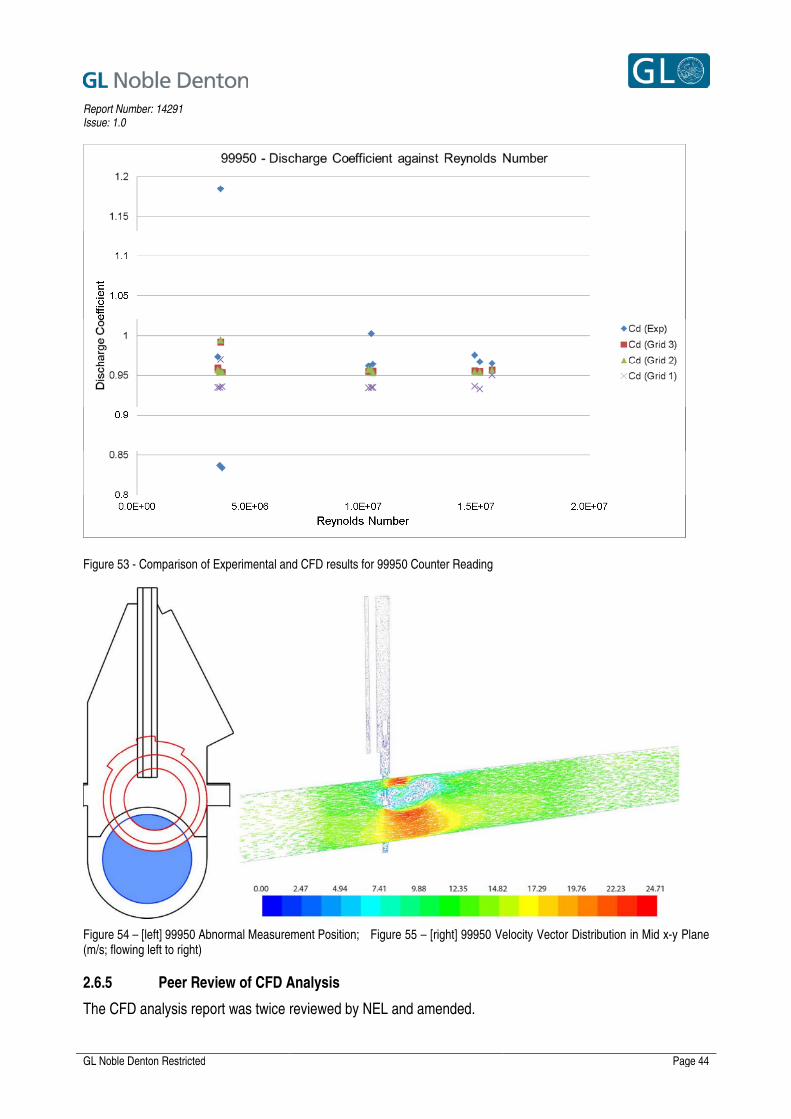
The results showed varying agreement with the experimental data. For tests 2, 3, 6, 8, 9 and 11 the errors were within the level of the DP measurement uncertainty. For tests 1, 4, 7 and 10 the errors were outside the level of the DP measurement uncertainty. This may be due in part to the increased unsteadiness of the DP signal, caused by the eccentricity, which is not accounted for. The experimental results are compared to the CFD results in Figure 53 illustrating that there is no significant change in the discharge coefficient (or error) over the range of Reynolds numbers (or process conditions). The close agreement between CFD grids 2 and 3 (<0.7 %) demonstrate acceptable grid independence. Figure 54 and 53 illustrate the location of the plate and the flow profile around it.
Report Number: 14291 Issue: 1.0
GL Noble Denton Restricted
Page 44
Figure 54 – [left] 99950 Abnormal Measurement Position; Figure 55 – [right] 99950 Velocity Vector Distribution in Mid x-y Plane (m/s; flowing left to right)
2.6.5 Peer Review of CFD Analysis
The CFD analysis report was twice reviewed by NEL and amended.
Figure 53 - Comparison of Experimental and CFD results for 99950 Counter Reading
Report Number: 14291 Issue: 1.0
GL Noble Denton Restricted
Page 45
The final review[8] (see Appendix E) concluded that grid independence was not achieved in two sets of results. These were the correctly located orifice plate model used in the validation and the 99985 long model used for comparison with the 99985 short model. The final review[8] also highlighted that some of the recommendations of the interim review had not been addressed sufficiently. These conclusions are discussed in the following sections.
2.6.5.1 Grid Independence of Correctly Located Orifice Plate Model
The three correctly located orifice plate cases were used as a starting point to validate the model. The differences between grid 2 and grid 3 for each case are stated in Table 18.
Case DP (Grid 3) (mbar) Error from Experimental (Grid 3) (%)
Change in DP (Grid 2 to Grid 3) (%)
1 12.85 0.6 0.3
2 24.50 0.2 0.3
3 442.41 0.6 0.9
Table 18 - Grid Independence of Correctly Located Orifice Plate Model
This model was used as a guide to the reliability of the CFD modelling and as such a change of 0.9 % was considered acceptable and further refinement was viewed as unnecessary.
2.6.5.2 Grid Independence of 99985 Long Model
The final review[8] focussed on the difference between the short and long models for the 99985 counter reading and as such only considered grid 1 and grid 2. It is accepted that grid independence was not established between grid 1 and grid 2 as demonstrated in Table 19. When compared to the change between grid 2 and grid 3 it can be seen that grid independence has been achieved to an acceptable tolerance.
Case Change in DP (Grid 1 to Grid 2) (%)
Change in DP (Grid 2 to Grid 3) (%)
1 1.8 0.3
2 1.5 0.3
3 1.6 0.1
4 1.6 0.0
6 2.5 0.5
7 1.8 0.0
8 1.7 0.3
9 1.7 0.3
10 1.6 0.1
11 1.8 0.2
Table 19 - Grid Independence of 99985 Long Model
2.6.5.3 Interim Review Recommendations
The final review[8] noted that no comparison had been made between the computed discharge coefficients for the orifice plate in the correctly installed location and the Reader-Harris/Gallagher (1998) equation in ISO
Report Number: 14291 Issue: 1.0
GL Noble Denton Restricted
Page 46
5167-2:2003[9]. This comparison was made by NEL within the final review[8] with good results in terms of agreement with the experiment.
The CFD report was revised following the final review to include details of the quality of the mesh and y+ values as well as state that the calculations are treated as incompressible.
The final review[8] also commented on the pressure recovery stating that it was different to other experimental and computational work, but has little effect on the discharge coefficient.
The only recommendation not met was the requirement for grid spacing around the orifice plate bore edge to be a maximum of 0.1 mm.
2.6.5.4 Rebuttal Statement
The author of the CFD analysis report issued a rebuttal statement. In this statement the author states that the ‘call for 0.1 mm meshes is too fine and resulted in meshes which were impractical to use in the present CFD calculations and resources required for such fine meshes were beyond the scope of the work. However, reasonably practical mesh resolutions were used in present calculations by employing 0.5 mm mesh spacing to mesh orifice plate edges.’
The Independent Technical Experts were satisfied that the conclusions and recommendations of the peer review had been met as far as practicable and none of the issues undermine the overall results of the CFD analysis.

Report Number: 14291 Issue: 1.0
GL Noble Denton Restricted
Page 47
3 Error Quantification
Errors were calculated for the various counter readings from the corrected flow rate data from the on-site testing. This produced very good correlation between all tests, as illustrated in Figure 56, which indicates that the error is independent of process conditions.
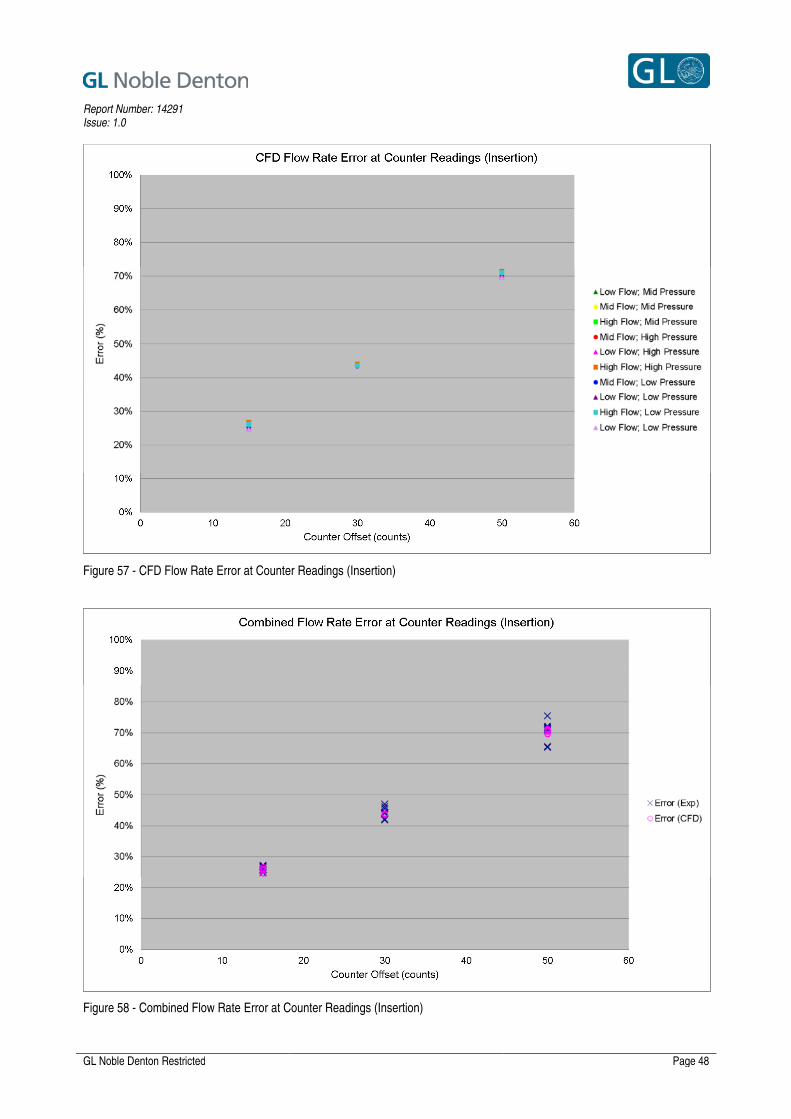
The results from the CFD analysis were used to produce equivalent error values for the various counter readings. This again produced very good correlation between all tests, as illustrated in Figure 57, which indicates that the error is independent of process conditions.
The combined results from the on-site testing and CFD analysis are shown in Figure 58 and summarised in Table 20. The mean values demonstrate very good agreement between the on-site tests and the CFD analysis.
The standard deviation is higher at a counter reading of 99950, the largest deviations being at lower flow rates. This is to be expected due to the high uncertainty levels in the DP measurement at low DPs. A typical DP measurement uncertainty profile is provided in Appendix C. This does not take into account the increased unsteadiness of the DP signal caused by the eccentricity.
Counter Reading Experimental Error (%) CFD Error (%) Difference in Mean (% relative)
Mean Std. Dev. Mean Std. Dev.
99985 26.1 % 0.7 % 25.7 % 0.7 % -1.4 %
99950 70.6 % 3.1 % 70.6 % 0.6 % 0.0 %
Table 20 - Flow Rate Error at Counter Readings (Insertion)
Figure 56 - Experimental Flow Rate Error at Counter Readings (Insertion)
Report Number: 14291 Issue: 1.0
GL Noble Denton Restricted
Page 48
Figure 57 - CFD Flow Rate Error at Counter Readings (Insertion)
Figure 58 - Combined Flow Rate Error at Counter Readings (Insertion)
Report Number: 14291 Issue: 1.0
GL Noble Denton Restricted
Page 49
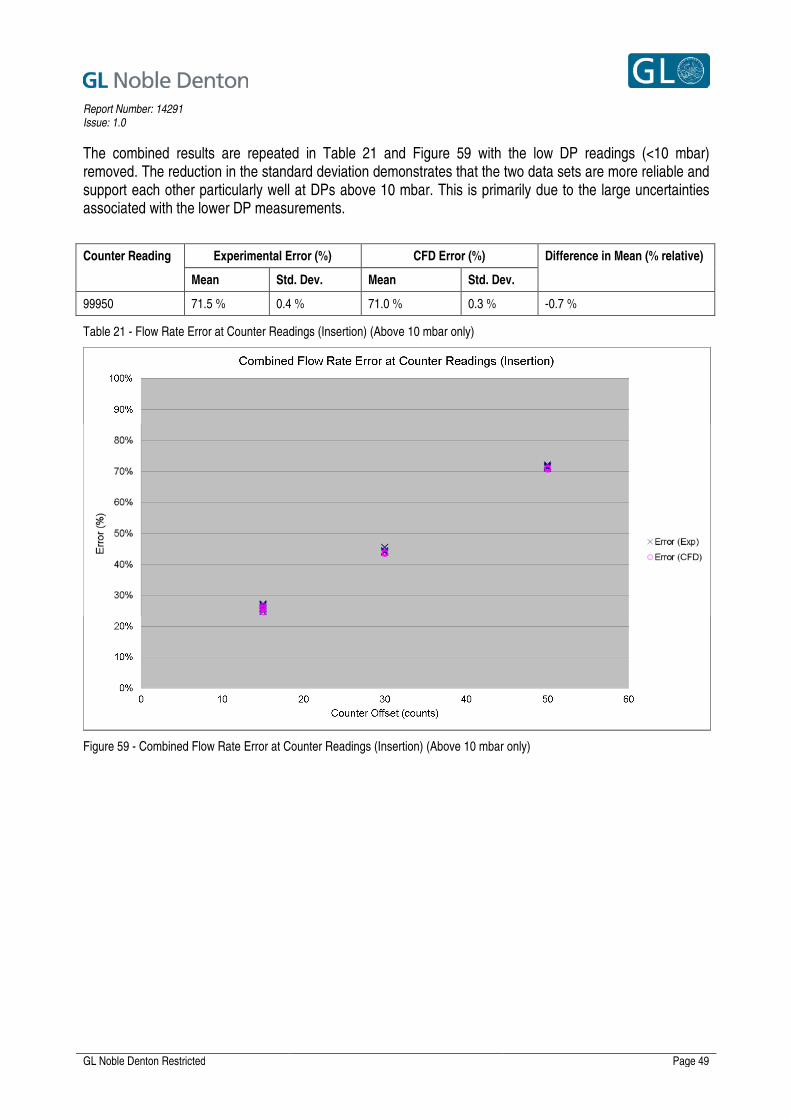
The combined results are repeated in Table 21 and Figure 59 with the low DP readings (<10 mbar) removed. The reduction in the standard deviation demonstrates that the two data sets are more reliable and support each other particularly well at DPs above 10 mbar. This is primarily due to the large uncertainties associated with the lower DP measurements.
Counter Reading Experimental Error (%) CFD Error (%) Difference in Mean (% relative)
Mean Std. Dev. Mean Std. Dev.
99950 71.5 % 0.4 % 71.0 % 0.3 % -0.7 %
Table 21 - Flow Rate Error at Counter Readings (Insertion) (Above 10 mbar only)
Figure 59 - Combined Flow Rate Error at Counter Readings (Insertion) (Above 10 mbar only)
Report Number: 14291 Issue: 1.0
GL Noble Denton Restricted
Page 50
3.1 First Error Period (21st July 2009 to 27th July 2010)
For the first error period, a counter reading of 99985 has been used based on the evidence available which includes:
• the (~31%) step change in flow rate when the plate was inserted on 21st July 2009;
• the 99885 values stamped on the carrier information plate;
• the pattern of orifice plate contamination found on the plate when removed on 27th July 2010 when compared to the offset location of the plate from physical measurements.
It has been assumed that the plate arrived at a counter reading of 99985 by insertion (not removal).
The on-site testing and CFD analysis show that the error is independent of process conditions and therefore a single value can be applied across the period. The average error from the on-site testing was an under-registration of 26.1 % with a standard deviation of 0.7 %. This results in a daily correction factor of 1.353066.
3.2 Second Error Period (27th July 2010 to 10th August 2010)
For the second error period, a counter reading of 99950 has been used based on the evidence available which includes:
• the (~69%) step change in flow rate when the plate location was corrected on 10th August 2010;
• the 9995 value stamped on the carrier information plate;
• the 99950 reading stated in the interviews conducted with the mechanical operatives that undertook the work.
It has been assumed that the plate arrived at a counter reading of 99950 by insertion (not removal).
The results at low DPs have been excluded to improve the accuracy and reliability of the datasets. The on-site testing and CFD analysis show that the error is independent of process conditions and therefore a single value can be applied across the period. The average error from the on-site testing was an under-registration of 71.5 % with a standard deviation of 0.4 %. This results in a daily correction factor of 3.506731.
4 Recommendations
It is recommended that the error, an overall under-registration of 1,617 GWh, be reconciled using the daily correction factors in Appendix A. The error was only present for part of the day on 21st July 2009 and 10th August 2010, and the error magnitude changed on 27th July 2010 therefore individual correction factors have been calculated for these days. Following this incident the downstream party produced a ‘Six Point Plan’ (available on the Joint Office of Gas Transporters’ website[10]) aimed at reducing the risk of similar events occurring in future. The site will have been under-odorising the gas during the period of the errors. The site will have been operating with higher uncertainty levels during the period of the errors.
Report Number: 14291 Issue: 1.0
GL Noble Denton Restricted
Page 51
5 References
[1] BS ISO TR 12767:1998. Measurement of fluid flow by means of pressure-differential devices – Guidelines to the Effect of Departure from the Specifications and Operating Conditions given in ISO 5167-1.
[2] T/PR/ME/2 Part 3 (SGN Adopted) Work Procedure for Validation of Equipment Associated With Measurement Systems for the Calculation of Mass, Volume & Energy Flowrate of Gas – Part 3: Flow Weighted Average Calorific Value Offtakes.
[3] Malalasekera, W. Computational Fluid Dynamics Analysis of Orifice Plate Metering Situations Under Abnormal Configurations, Version 3, August 2013. [Reproduced in Appendix D]
[4] Menter, F.R. (1993) Zonal Two Equation k-ω Turbulence Models for Aerodynamic Flows, AIAA Paper 93-2906.
[5] Launder, B.E. & Sharma, B.I. (1974) Application of the Energy Dissipation Model of Turbulence to the Calculation of Flow Near a Spinning Disc, Letters in Heat and Mass Transfer, vol. 1, no. 2, pp. 131-138.
[6] ISO 5167-1:1991. Measurement of fluid flow by means of pressure differential devices – Part 1: Orifice plates, nozzles and Venturi tubes inserted in circular cross-section conduits running full.
[7] ESDU (2011) ESDU CFD-BPG 11010-2011. CFD Best Practice Guidelines for modelling pressure losses and flow characteristics in square- and knife-edged orifice plates.
[8] Laing, M. & Reader-Harris, M. Peer Review of “Computational Fluid Dynamics Analysis of Orifice Plate Metering Situations Under Abnormal Configurations”, Version 2, Dr W. Malalasekera, May 2013. [Reproduced in Appendix E]
[9] ISO 5167-2:2003. Measurement of fluid flow by means of pressure differential devices inserted in circular cross-section conduits running full – Part 2: Orifice plates.
[10] SGN, Six Point Plan, published on the Joint Office of Gas Transporters’ website, March 2012. (http://www.gasgovernance.co.uk/sites/default/files/Six%20Point%20Plan.pdf)
Report Number: 14291 Issue: 1.0
GL Noble Denton Restricted Page A-1
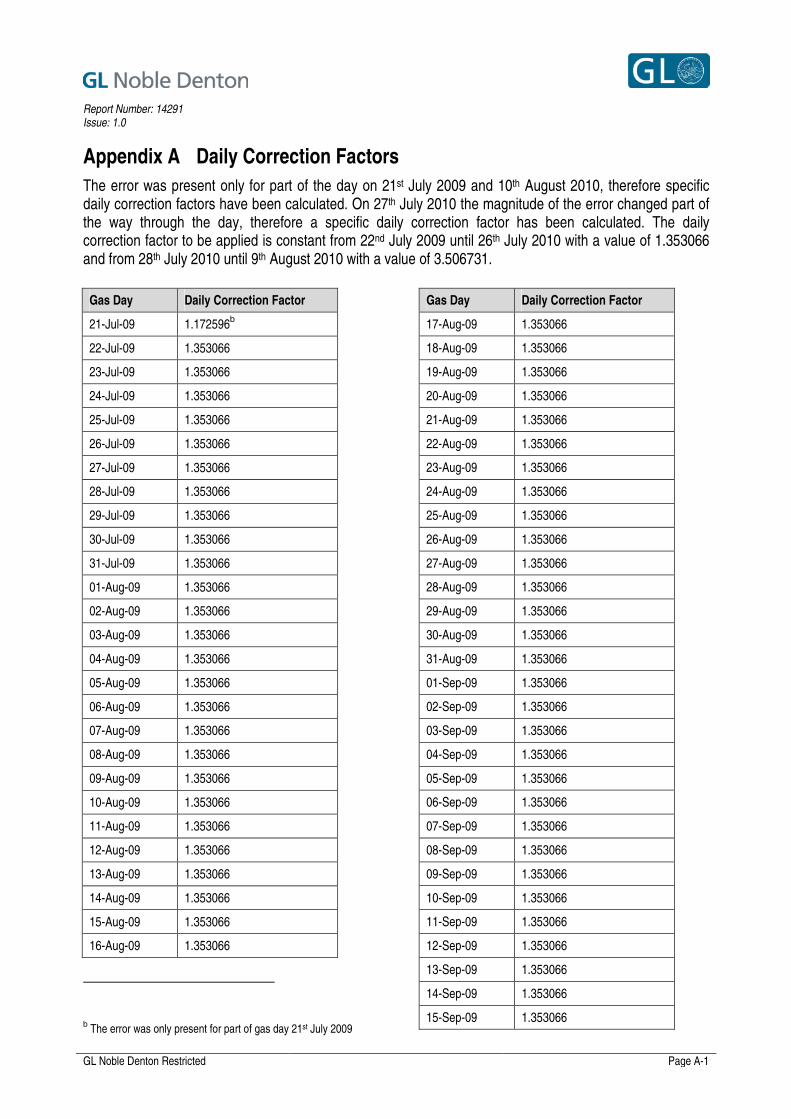
Appendix A Daily Correction Factors
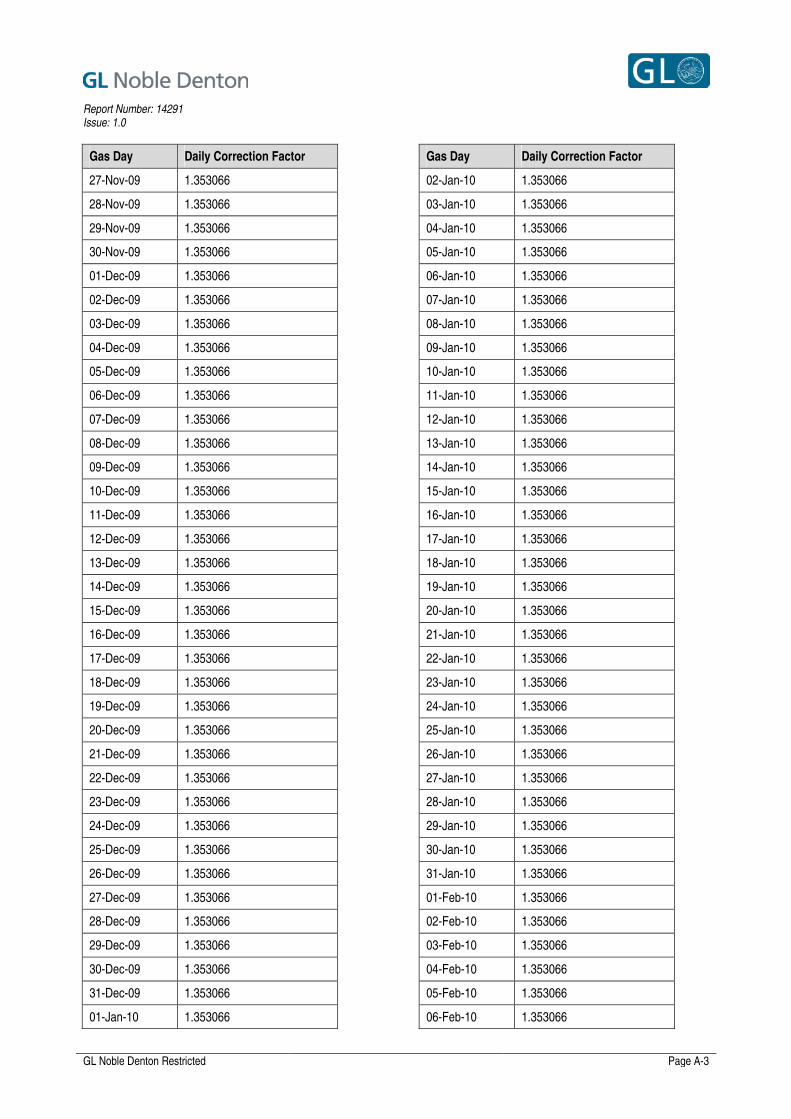
The error was present only for part of the day on 21st July 2009 and 10th August 2010, therefore specific daily correction factors have been calculated. On 27th July 2010 the magnitude of the error changed part of the way through the day, therefore a specific daily correction factor has been calculated. The daily correction factor to be applied is constant from 22nd July 2009 until 26th July 2010 with a value of 1.353066 and from 28th July 2010 until 9th August 2010 with a value of 3.506731.
Gas Day Daily Correction Factor
21-Jul-09 1.172596b
22-Jul-09 1.353066
23-Jul-09 1.353066
24-Jul-09 1.353066
25-Jul-09 1.353066
26-Jul-09 1.353066
27-Jul-09 1.353066
28-Jul-09 1.353066
29-Jul-09 1.353066
30-Jul-09 1.353066
31-Jul-09 1.353066
01-Aug-09 1.353066
02-Aug-09 1.353066
03-Aug-09 1.353066
04-Aug-09 1.353066
05-Aug-09 1.353066
06-Aug-09 1.353066
07-Aug-09 1.353066
08-Aug-09 1.353066
09-Aug-09 1.353066
10-Aug-09 1.353066
11-Aug-09 1.353066
12-Aug-09 1.353066
13-Aug-09 1.353066
14-Aug-09 1.353066
15-Aug-09 1.353066
16-Aug-09 1.353066
b The error was only present for part of gas day 21st July 2009
Gas Day Daily Correction Factor
17-Aug-09 1.353066
18-Aug-09 1.353066
19-Aug-09 1.353066
20-Aug-09 1.353066
21-Aug-09 1.353066
22-Aug-09 1.353066
23-Aug-09 1.353066
24-Aug-09 1.353066
25-Aug-09 1.353066
26-Aug-09 1.353066
27-Aug-09 1.353066
28-Aug-09 1.353066
29-Aug-09 1.353066
30-Aug-09 1.353066
31-Aug-09 1.353066
01-Sep-09 1.353066
02-Sep-09 1.353066
03-Sep-09 1.353066
04-Sep-09 1.353066
05-Sep-09 1.353066
06-Sep-09 1.353066
07-Sep-09 1.353066
08-Sep-09 1.353066
09-Sep-09 1.353066
10-Sep-09 1.353066
11-Sep-09 1.353066
12-Sep-09 1.353066
13-Sep-09 1.353066
14-Sep-09 1.353066
15-Sep-09 1.353066

Report Number: 14291 Issue: 1.0
GL Noble Denton Restricted Page A-2
Gas Day Daily Correction Factor
16-Sep-09 1.353066
17-Sep-09 1.353066
18-Sep-09 1.353066
19-Sep-09 1.353066
20-Sep-09 1.353066
21-Sep-09 1.353066
22-Sep-09 1.353066
23-Sep-09 1.353066
24-Sep-09 1.353066
25-Sep-09 1.353066
26-Sep-09 1.353066
27-Sep-09 1.353066
28-Sep-09 1.353066
29-Sep-09 1.353066
30-Sep-09 1.353066
01-Oct-09 1.353066
02-Oct-09 1.353066
03-Oct-09 1.353066
04-Oct-09 1.353066
05-Oct-09 1.353066
06-Oct-09 1.353066
07-Oct-09 1.353066
08-Oct-09 1.353066
09-Oct-09 1.353066
10-Oct-09 1.353066
11-Oct-09 1.353066
12-Oct-09 1.353066
13-Oct-09 1.353066
14-Oct-09 1.353066
15-Oct-09 1.353066
16-Oct-09 1.353066
17-Oct-09 1.353066
18-Oct-09 1.353066
19-Oct-09 1.353066
20-Oct-09 1.353066
21-Oct-09 1.353066
Gas Day Daily Correction Factor
22-Oct-09 1.353066
23-Oct-09 1.353066
24-Oct-09 1.353066
25-Oct-09 1.353066
26-Oct-09 1.353066
27-Oct-09 1.353066
28-Oct-09 1.353066
29-Oct-09 1.353066
30-Oct-09 1.353066
31-Oct-09 1.353066
01-Nov-09 1.353066
02-Nov-09 1.353066
03-Nov-09 1.353066
04-Nov-09 1.353066
05-Nov-09 1.353066
06-Nov-09 1.353066
07-Nov-09 1.353066
08-Nov-09 1.353066
09-Nov-09 1.353066
10-Nov-09 1.353066
11-Nov-09 1.353066
12-Nov-09 1.353066
13-Nov-09 1.353066
14-Nov-09 1.353066
15-Nov-09 1.353066
16-Nov-09 1.353066
17-Nov-09 1.353066
18-Nov-09 1.353066
19-Nov-09 1.353066
20-Nov-09 1.353066
21-Nov-09 1.353066
22-Nov-09 1.353066
23-Nov-09 1.353066
24-Nov-09 1.353066
25-Nov-09 1.353066
26-Nov-09 1.353066
Report Number: 14291 Issue: 1.0
GL Noble Denton Restricted Page A-3
Gas Day Daily Correction Factor
27-Nov-09 1.353066
28-Nov-09 1.353066
29-Nov-09 1.353066
30-Nov-09 1.353066
01-Dec-09 1.353066
02-Dec-09 1.353066
03-Dec-09 1.353066
04-Dec-09 1.353066
05-Dec-09 1.353066
06-Dec-09 1.353066
07-Dec-09 1.353066
08-Dec-09 1.353066
09-Dec-09 1.353066
10-Dec-09 1.353066
11-Dec-09 1.353066
12-Dec-09 1.353066
13-Dec-09 1.353066
14-Dec-09 1.353066
15-Dec-09 1.353066
16-Dec-09 1.353066
17-Dec-09 1.353066
18-Dec-09 1.353066
19-Dec-09 1.353066
20-Dec-09 1.353066
21-Dec-09 1.353066
22-Dec-09 1.353066
23-Dec-09 1.353066
24-Dec-09 1.353066
25-Dec-09 1.353066
26-Dec-09 1.353066
27-Dec-09 1.353066
28-Dec-09 1.353066
29-Dec-09 1.353066
30-Dec-09 1.353066
31-Dec-09 1.353066
01-Jan-10 1.353066
Gas Day Daily Correction Factor
02-Jan-10 1.353066
03-Jan-10 1.353066
04-Jan-10 1.353066
05-Jan-10 1.353066
06-Jan-10 1.353066
07-Jan-10 1.353066
08-Jan-10 1.353066
09-Jan-10 1.353066
10-Jan-10 1.353066
11-Jan-10 1.353066
12-Jan-10 1.353066
13-Jan-10 1.353066
14-Jan-10 1.353066
15-Jan-10 1.353066
16-Jan-10 1.353066
17-Jan-10 1.353066
18-Jan-10 1.353066
19-Jan-10 1.353066
20-Jan-10 1.353066
21-Jan-10 1.353066
22-Jan-10 1.353066
23-Jan-10 1.353066
24-Jan-10 1.353066
25-Jan-10 1.353066
26-Jan-10 1.353066
27-Jan-10 1.353066
28-Jan-10 1.353066
29-Jan-10 1.353066
30-Jan-10 1.353066
31-Jan-10 1.353066
01-Feb-10 1.353066
02-Feb-10 1.353066
03-Feb-10 1.353066
04-Feb-10 1.353066
05-Feb-10 1.353066
06-Feb-10 1.353066

Report Number: 14291 Issue: 1.0
GL Noble Denton Restricted Page A-4
Gas Day Daily Correction Factor
07-Feb-10 1.353066
08-Feb-10 1.353066
09-Feb-10 1.353066
10-Feb-10 1.353066
11-Feb-10 1.353066
12-Feb-10 1.353066
13-Feb-10 1.353066
14-Feb-10 1.353066
15-Feb-10 1.353066
16-Feb-10 1.353066
17-Feb-10 1.353066
18-Feb-10 1.353066
19-Feb-10 1.353066
20-Feb-10 1.353066
21-Feb-10 1.353066
22-Feb-10 1.353066
23-Feb-10 1.353066
24-Feb-10 1.353066
25-Feb-10 1.353066
26-Feb-10 1.353066
27-Feb-10 1.353066
28-Feb-10 1.353066
01-Mar-10 1.353066
02-Mar-10 1.353066
03-Mar-10 1.353066
04-Mar-10 1.353066
05-Mar-10 1.353066
06-Mar-10 1.353066
07-Mar-10 1.353066
08-Mar-10 1.353066
09-Mar-10 1.353066
10-Mar-10 1.353066
11-Mar-10 1.353066
12-Mar-10 1.353066
13-Mar-10 1.353066
14-Mar-10 1.353066
Gas Day Daily Correction Factor
15-Mar-10 1.353066
16-Mar-10 1.353066
17-Mar-10 1.353066
18-Mar-10 1.353066
19-Mar-10 1.353066
20-Mar-10 1.353066
21-Mar-10 1.353066
22-Mar-10 1.353066
23-Mar-10 1.353066
24-Mar-10 1.353066
25-Mar-10 1.353066
26-Mar-10 1.353066
27-Mar-10 1.353066
28-Mar-10 1.353066
29-Mar-10 1.353066
30-Mar-10 1.353066
31-Mar-10 1.353066
01-Apr-10 1.353066
02-Apr-10 1.353066
03-Apr-10 1.353066
04-Apr-10 1.353066
05-Apr-10 1.353066
06-Apr-10 1.353066
07-Apr-10 1.353066
08-Apr-10 1.353066
09-Apr-10 1.353066
10-Apr-10 1.353066
11-Apr-10 1.353066
12-Apr-10 1.353066
13-Apr-10 1.353066
14-Apr-10 1.353066
15-Apr-10 1.353066
16-Apr-10 1.353066
17-Apr-10 1.353066
18-Apr-10 1.353066
19-Apr-10 1.353066
Report Number: 14291 Issue: 1.0
GL Noble Denton Restricted Page A-5
Gas Day Daily Correction Factor
20-Apr-10 1.353066
21-Apr-10 1.353066
22-Apr-10 1.353066
23-Apr-10 1.353066
24-Apr-10 1.353066
25-Apr-10 1.353066
26-Apr-10 1.353066
27-Apr-10 1.353066
28-Apr-10 1.353066
29-Apr-10 1.353066
30-Apr-10 1.353066
01-May-10 1.353066
02-May-10 1.353066
03-May-10 1.353066
04-May-10 1.353066
05-May-10 1.353066
06-May-10 1.353066
07-May-10 1.353066
08-May-10 1.353066
09-May-10 1.353066
10-May-10 1.353066
11-May-10 1.353066
12-May-10 1.353066
13-May-10 1.353066
14-May-10 1.353066
15-May-10 1.353066
16-May-10 1.353066
17-May-10 1.353066
18-May-10 1.353066
19-May-10 1.353066
20-May-10 1.353066
21-May-10 1.353066
22-May-10 1.353066
23-May-10 1.353066
24-May-10 1.353066
25-May-10 1.353066
Gas Day Daily Correction Factor
26-May-10 1.353066
27-May-10 1.353066
28-May-10 1.353066
29-May-10 1.353066
30-May-10 1.353066
31-May-10 1.353066
01-Jun-10 1.353066
02-Jun-10 1.353066
03-Jun-10 1.353066
04-Jun-10 1.353066
05-Jun-10 1.353066
06-Jun-10 1.353066
07-Jun-10 1.353066
08-Jun-10 1.353066
09-Jun-10 1.353066
10-Jun-10 1.353066
11-Jun-10 1.353066
12-Jun-10 1.353066
13-Jun-10 1.353066
14-Jun-10 1.353066
15-Jun-10 1.353066
16-Jun-10 1.353066
17-Jun-10 1.353066
18-Jun-10 1.353066
19-Jun-10 1.353066
20-Jun-10 1.353066
21-Jun-10 1.353066
22-Jun-10 1.353066
23-Jun-10 1.353066
24-Jun-10 1.353066
25-Jun-10 1.353066
26-Jun-10 1.353066
27-Jun-10 1.353066
28-Jun-10 1.353066
29-Jun-10 1.353066
30-Jun-10 1.353066

Report Number: 14291 Issue: 1.0
GL Noble Denton Restricted Page A-6
Gas Day Daily Correction Factor
01-Jul-10 1.353066
02-Jul-10 1.353066
03-Jul-10 1.353066
04-Jul-10 1.353066
05-Jul-10 1.353066
06-Jul-10 1.353066
07-Jul-10 1.353066
08-Jul-10 1.353066
09-Jul-10 1.353066
10-Jul-10 1.353066
11-Jul-10 1.353066
12-Jul-10 1.353066
13-Jul-10 1.353066
14-Jul-10 1.353066
15-Jul-10 1.353066
16-Jul-10 1.353066
17-Jul-10 1.353066
18-Jul-10 1.353066
19-Jul-10 1.353066
20-Jul-10 1.353066
21-Jul-10 1.353066
22-Jul-10 1.353066
23-Jul-10 1.353066
24-Jul-10 1.353066
25-Jul-10 1.353066
26-Jul-10 1.353066
27-Jul-10 2.521218c
28-Jul-10 3.506731
29-Jul-10 3.506731
30-Jul-10 3.506731
31-Jul-10 3.506731
01-Aug-10 3.506731
02-Aug-10 3.506731
c The magnitude of the error changed on gas day 27th July 2010
Gas Day Daily Correction Factor
03-Aug-10 3.506731
04-Aug-10 3.506731
05-Aug-10 3.506731
06-Aug-10 3.506731
07-Aug-10 3.506731
08-Aug-10 3.506731
09-Aug-10 3.506731
10-Aug-10 1.224412d
d The error was only present for part of gas day 10th August 2010

Report Number: 14291 Issue: 1.0
GL Noble Denton Restricted Page B-1
Appendix B Carrier Data Plate Text
B.1 Carrier Identification Plate
ROBINSON ORIFICE FITTING
MADE BY
HEECO INTERNATIONAL LTD
THETFORD NORFOLK ENGLAND
LICENCEES FOR
PECO/ROBINSON MINERAL WELLS TEXAS USA
BODY TYPE
FITTING SERIAL NO.
METER RUN NO.
CALIBRATED DIA UPSTREAM
CALIBRATED DIA DOWNSTREAM
WORKING PRESSURE
TEST PRESSURE
E TYPE
7603758
1001
10.096
10.097
1440 PSI
2175 PSI
Report Number: 14291 Issue: 1.0
GL Noble Denton Restricted Page B-2
B.2 Carrier Information Plate
ROBINSON ORIFICE FITTING
HEECO INTERNATIONAL LTD
THETFORD, NORFOLK, ENGLAND
Licencees For
PECO / ROBINSON
Mineral Wells, Texas, U.S.A
Type E TYPE Rating 600 CWP 1440 psi
psi 2175 psi. Run No. 1001 Calibrated Size
Fitting Bore 10” Serial No. 7603758
OPERATING INSTRUCTIONS
TO REMOVE ORIFICE PLATE
1. Turn top shaft anticlockwise until counter reads 99885
2. Turn plug valve to closed position as indicated
3. Tighten grease screws to seal plug valve
4. Open Relief Valve marked ‘A’ ensuring that valve marked ‘B’ is tight if fitted
5. Loosen large tie bar (if fitted)
6. Loosen centre clamp screws and retrieve clamps and cover plate
7. Continue turning top shaft bringing orifice plate clear with the aid of hoist (if fitted)
TO REPLACE ORIFICE PLATE
1. Lower carrier assembly into top chamber and turn top shaft clockwise until counter reads 99885
2. Replace cover plate and clamps, tighten equally working from centre
3. Reposition and tighten tie bar
4. Tighten Relief Valve marked ‘A’ and loosen equaliser valve marked ‘B’
5. Turn Plug valve to open position as indicated
6. Turn top shaft clockwise until counter reads 9995
0005
Orifice plate is now central
Report Number: 14291 Issue: 1.0
GL Noble Denton Restricted Page C-1
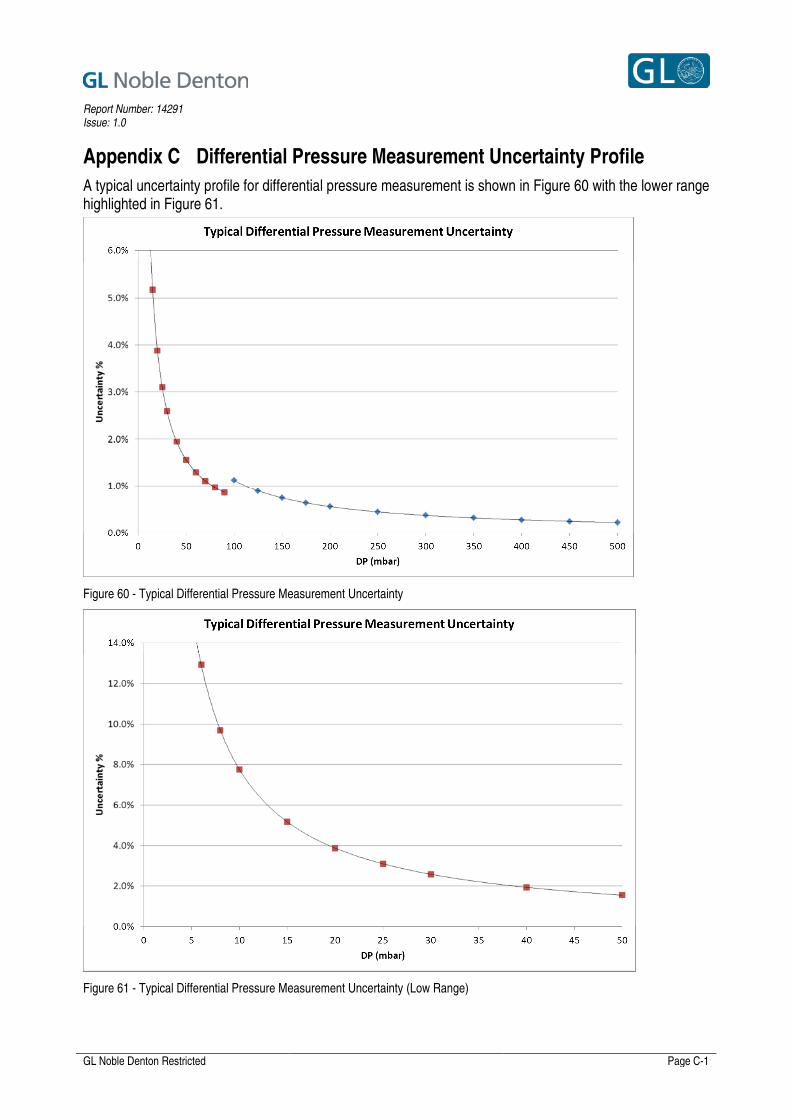
Appendix C Differential Pressure Measurement Uncertainty Profile
A typical uncertainty profile for differential pressure measurement is shown in Figure 60 with the lower range highlighted in Figure 61.
Figure 60 - Typical Differential Pressure Measurement Uncertainty
Figure 61 - Typical Differential Pressure Measurement Uncertainty (Low Range)

Report Number: 14291 Issue: 1.0
GL Noble Denton Restricted Page D-1
Appendix D CFD Report

Report Number: 14291 Issue: 1.0
GL Noble Denton Restricted Page E-1
Appendix E Peer Review of CFD Report