145-cover - wrap: warwick research archive portalwrap.warwick.ac.uk/59198/1/wrap_145-cummins.pdf ·...
TRANSCRIPT

http://wrap.warwick.ac.uk/
Original citation: Cummins, Neil, Kelly, Morgan and Ó Gráda, Cormac (2013) Living standards and plague in London, 1560–1665. Working Paper. Coventry, UK: Department of Economics, University of Warwick. (CAGE Online Working Paper Series). Permanent WRAP url: http://wrap.warwick.ac.uk/59198 Copyright and reuse: The Warwick Research Archive Portal (WRAP) makes this work of researchers of the University of Warwick available open access under the following conditions. Copyright © and all moral rights to the version of the paper presented here belong to the individual author(s) and/or other copyright owners. To the extent reasonable and practicable the material made available in WRAP has been checked for eligibility before being made available. Copies of full items can be used for personal research or study, educational, or not-for-profit purposes without prior permission or charge. Provided that the authors, title and full bibliographic details are credited, a hyperlink and/or URL is given for the original metadata page and the content is not changed in any way. A note on versions: The version presented here is a working paper or pre-print that may be later published elsewhere. If a published version is known of, the above WRAP url will contain details on finding it. For more information, please contact the WRAP Team at: [email protected]

WORKING PAPER SERIES
Centre for Competitive Advantage in the Global Economy
Department of Economics
Aug 2013 No.145
Living Standards and Plague in London,1560–1665
Neil Cummins, Morgan Kelly, and Cormac Ó Gráda

Living Standards and Plague in London,1560–1665.
Neil Cummins, Morgan Kelly, and Cormac Ó Gráda∗
Abstract
We use individual records of 920,000 burials and 630,000 baptismsto reconstruct the spatial and temporal patterns of birth and death inLondon from 1560 to 1665, a period dominated by recurrent plague.The plagues of 1563, 1603, 1625, and 1665 appear of roughly equalmagnitude, with deaths running at five to six times their usual rate,but the impact on wealthier central parishes falls markedly throughtime. Tracking the weekly spread of plague before 1665 we find a con-sistent pattern of elevated mortality spreading from the same northernsuburbs. Looking at the seasonal pattern of mortality, we find thatthe characteristic autumn spike associated with plague continued intothe early 1700s. Given that individual cases of plague and typhus arefrequently indistinguishable, claims that plague suddenly vanished af-ter 1665 should be treated with caution. Natural increase improved assmaller plagues disappeared after 1590, but fewer than half of thoseborn survived childhood.
∗We would like to thank Ancestry.com and, in particular, Kim Harrison, for permissionto download their parish records.
1

Introduction.
The central role of the urban colossus of London in driving Britain’s distinc-tive economic development before the Industrial Revolution has long beenrecognised (Wrigley 1967, Fisher 1990, Allen 2009). However, while the pop-ulation history of rural England from the sixteenth century has been wellunderstood since the monumental work of Wrigley and Schofield (1981), thedemography of London before 1665 has received little detailed attention.While many imagine that this is because its parish registers were destroyedin the Great Fire, in fact registers of most of the parishes of mid-seventeenthcentury London survive, usually back to the sixteenth century. Several stud-ies, most notably Finlay (1981), Slack (1985, Chapter 6) and Boulton (1987),have analysed small samples of these records, but a comprehensive study ofLondon population history before 1665 has been precluded by the sheer phys-ical volume of its early parish records.
However, most of these records are now available online through An-cestry.com. This study uses downloaded records of roughly 920,000 burialsand 630,000 baptisms in 117 of the 130 London parishes to reconstruct thespatial and temporal patterns of birth and death in London from 1560 to1665. We estimate that our sample comprises the individual burial recordsof over eighty per cent of those who died in London in this period. Thislarge sample allows us to estimate total births and deaths in different partsof the city in each year; to track when and where major plagues started, theirweekly spread, and their overall lethality; to examine the seasonal pattern ofmortality; and to look at the impact of living standards on births and deaths.
We find in particular that the plagues of 1563, 1603, 1625, and 1665 wereall of roughly equal relative magnitude, with burials running at 5.5 to 6 timesthe average level in the previous five years. Assuming a normal mortality rateof around 3.0–3.5 per cent, this implies that one fifth of the city’s populationdied each time, within the space of a few months. While the relative sizeof major plagues remained fairly constant, their spatial distribution changed
2

markedly. In 1563, mortality was fairly equal across parishes within the wallsand surrounding extra-mural parishes, but by 1665 mortality in the centralintra-mural parishes was considerably lower than elsewhere, reflecting themarked increase that we find in the concentration of wealthy households inthese areas.
Next we consider the weekly spread of crisis mortality in plague years,taking a surveillance approach of the sort used in epidemiology to detect dis-ease outbreaks in real time. Weekly deaths in each parish are compared witha threshold level, based on average deaths during the same and surroundingweeks in previous years, and weeks above the threshold are flagged as po-tential epidemic outbreaks. For the period 1560–1665, we find that deathsabove the crisis threshold accounted for about one fifth of total mortality:large plague epidemics were devastating but infrequent, and most Londonersdied of other causes. While major plagues dominate our period, the frequencyand lethality of smaller plague outbreaks falls markedly after 1590.
Considering at the spread of crisis mortality, in all major plague out-breaks from 1563 to 1625 we find a consistent pattern of anomalous rises inmortality first occurring in the large, poor suburbs of St Giles Cripplegateand Shoreditch, in the north of the city, and then spreading over the next 14weeks through the other parishes outside the walls, before moving inside thewalls. In 1665 the first outbreak occurs a few hundred metres to the south-west in the rapidly growing parish of St Giles in the Fields. That plagueconsistently appears away from the Thames is consistent with its being en-demic in London rather than an occasional exotic import.
It is well known that the last recorded case of plague in the London Billsoccurs in 1679, leading to a debate on the causes of its sudden disappear-ance (Appleby, 1980; Slack, 1981). However, these discussions ignore a basicdiagnostic fact: before the late nineteenth century it was considered diffi-cult, even for professional pathologists, to distinguish isolated adult cases ofplague from typhus. The symptoms of typhus and plague are often similar;
3

plague epidemics tended to follow or co-occur with outbreaks of epidemictyphus; and there is a growing epidemiological literature arguing that, whilerat fleas are responsible for minor episodes of plague, the main vector oftransmission in serious plague outbreaks is the same human body louse thatspreads epidemic typhus: see Section 3.2 below.
The difficulty of distinguishing plague from typhus makes us cautious ofclaims that plague suddenly disappeared from England after 1665. In fact,a sudden disappearance of plague is not apparent in our data on burial sea-sonality. While rural England experienced a v-shaped pattern of seasonalmortality, with deaths peaking near the start of each year and reaching aminimum in early summer, London deaths before 1665 show a strong peakin the autumn, even in years with few reported plague deaths. After the sup-posed disappearance of plague in 1679, we would expect the seasonal patternof London mortality to start to display the same late winter maximum asthe rest of England. Instead we find a strong, but gradually diminishing,autumn peak in the more affluent central parishes until the early 1700s, andin the surrounding extra-mural and out-parishes until the end of the 1720s.It does not appear possible to reject the view that isolated incidents of plaguecontinued—mis-identified, accidentally or intentionally, as typhus—until thegeneral ending of the second global plague pandemic in the 1730s.
Looking at natural increase, the popular impression is of London as an un-differentiated demographic sink where deaths considerably exceeded births.However, over different parts of London in the early seventeenth century, wefind that natural increase varied widely, with the wealthier central parishesexperiencing a positive natural increase outside plague years, the surroundingpoorer parishes suffering an average deficit of ten per cent, but with averagedeficits of thirty per cent occurring in the out-parishes. In other words, thespatial cross-section of London mortality is strongly Malthusian, with wealth-ier households replacing themselves (outside plague years, to which affluent
4

areas became less vulnerable as time passes) while poor districts suffered amarked excess of deaths over births even between major plagues.
While parish registers rarely give ages, around a half of parishes recordthat the deceased was the “son of” or “daughter of” a householder, allowingus to conclude that the death is of a young person. Deaths of children,so defined, account for 40 to 50 per cent of recorded deaths in our sample.The ratio of child deaths to baptisms gives an approximate estimate of theprobability of dying as a child, and this varies from a little under a half inricher parishes, to two thirds in outer suburbs.
Although there are several notable studies of London population for theLondon Bills period after 1665 (in particular Landers 1993, Spence 2000,Boulton and Schwarz 2010, and Davenport, Boulton and Schwarz 2010), de-tailed studies for our period at the level of parishes are few. These includeHollingsworth and Hollingsworth (1971), Finlay (1981), (Slack, 1985, Chap-ter 6), and Boulton (1987) although notable recent contributions includeRazzell and Spence (2007) and Newton (2010).1
The rest of the paper is as follows. Section 1 outlines the parish recordsthat we use and compares our estimates of deaths with those of early Lon-don Bills. Section 2 looks at the social geography of London, showing howgeographical segregation of the affluent increased between the late sixteenthand early seventeenth centuries. Section 3 imputes missing parish records toestimate total mortality in London from 1560 to 1665, focusing in particu-lar on the relative magnitude of major plagues in different parts of the city;while Section 4 uses weekly burials in the parishes in our sample to trackthe spread of plague epidemics from 1563 to 1665, while Section 5 looks atdeaths of children. Section 6 looks at the seasonality of deaths in differentparts of the city for inter-plague periods up to 1729 while Section 7 looks
1While our focus is on annual deaths and births, there is a related literature on esti-mating London’s total population beginning with Jones and Judges (1935) and continuingthrough Wrigley (1967), Sutherland (1972), Finlay and Shearer (1986) with a useful surveyin Harding (1990).
5

at the strength of the positive check in different parts of the city. FinallySection 8 imputes the number of births and estimates the rate of naturalincrease in different parts of London.
1 London Parish Records.
This paper uses records of roughly 870,000 burials and 610,000 baptisms toreconstruct the spatial and temporal patterns of birth and death in Londonfrom 1560 to 1665. We define London as the area covered by the Bills ofMortality in 1660: the 97 parishes within the Walls; the 16 parishes outsidethe Walls (these two areas making up the City of London); the 12 out-parishes in Middlesex and Surrey; and the five parishes of Westminster.2
The parishes covered, along with the starting dates of their burial records,are mapped in Figure 1: blank areas correspond to parishes outside the 1660Bill or to extra-parochial areas like Inns of Court or the Tower of London.3
The record is remarkably complete.4 We have records for 86 intra-muralparishes, although in 10 cases there are fewer than 10 years of observations.However, the missing parishes are generally the smaller ones, recording fewer
2On the changing definition of London see Harding (1990).3Parish shapefiles are taken from Southall and Burton (2004) with parishes created
after 1665 being included in their original parish. Names of the parishes in the map canbe found in Landers (1993, Appendix 3)
4In addition to the records downloaded from ancestry.com we have burial records forthe three largest Westminster parishes of St Martin in the Fields (from 1551 to 1636taken from Mason 1898 and Kitto 1936), St Clement Danes (from 1538 to 1638 basedon facsimilies of the burial register downloaded from findmypast.com), and St MargaretWestminster (from 1538 to 1638 from freereg.org.uk. The freereg series for Martin in theFields is considerably lower than the Harleian Society series used here so we are uncertainof the accuracy of this St Margaret series). Births for these three parishes are fromthe International Genealogical Index (https://familysearch.org/search/collection/igi). Weobtained birth and burial records for the fourth largest Westminster parish of St Mary leStrand (starting 1560) from findmypast facsimilies. We have also included birth and deathrecords for the intra-mural parish of St Vedast from Littledale (1902, 1903). Records forSt Giles in the Fields (from 1561) are based on our transcription of microfilm copies inthe London Metropolitan Archives.
6

than 100 deaths in 1660, and we will see below that they can be fairly reli-ably interpolated from records of surrounding parishes. For the 16 parisheswithout the walls we are missing all, or nearly all, records for the two smallparishes of Bridewell Precinct and Bartholomew the Less (each accountingfor 0.2 per cent of recorded deaths in the surviving annual Bill for 1636);while records for the large parish of St Sepulchre Holborn (5.7 per cent ofdeaths in 1636) start only in 1660, but we have extensive records for mostother parishes. For the 12 out-parishes we have records for all except thesmall parish of Lambeth (absent from the 1636 Bill, 1 per cent of deaths in1663) although we have its baptismal records from 1540 onwards. For thefive Westminster parishes, we are missing records only for the smallest parishof St Paul Covent Garden (absent from 1636 Bill, 0.8 per cent of deaths in1663).
Of surviving parish registers for our period listed by Webb (2009), onlytwo extant registers are absent from our sample, both for intra-mural parishes:the medium size parish of All Hallows Barking (starts 1558, 0.6 per cent ofdeaths in 1636) and the tiny All Hallows Bread Street (starts 1538, 0.06 percent of deaths in 1636).
The parishes in our sample therefore account for a substantial proportionof London’s population in the early seventeenth century. For 1578, the 72intra- and extra-mural parishes in our sample account for 79 per cent ofdeaths recorded in the London Bill. For 1636, the earliest annual Bill thatgives reliable deaths by parish, the parishes for which we have data accountfor 71 per cent of the London total. By region, our parishes account for62 per cent of 1636 deaths in the intra-mural parishes, 77 per cent in theextra-mural parishes, and 70 per cent in the out-parishes.
We are, in most cases, not using the original registers but downloads ofindividual records from Ancestry.com. This creates three sources of potentialerror: the registers may have been transcribed imperfectly; we may failed todownload all relevant records; or we may have failed to remove all duplicated
7

1665 only
1601−1664
1561−1600
pre−1561
Figure 1: Starting dates of available burial records in parishes covered by theLondon Bills.
entries that frequently arise from including bishops’ transcripts of the origi-nal registers 5 We can judge the accuracy of our procedure in two ways: by
5We are agnostic as to the accuracy of the parish registers as records of mortality,taking the view that so long as the proportion of deaths recorded each year in each parishremains fairly constant, we can trace the spatial and temporal variations in mortality thatconcern us here.
8

●
●
●
●
●●
●●
●●
●
●●
●
●
●
●
●●
●
●
●● ●
●
●
●
●
●●
●●
●
●
●
●
●●
●●● ●●
●
●
●
●●
●●
●●
●
●
●
●
●
●
●
●
●●
●
●
●
●●
●
●
●●
●
● ●
●
●
●
●
●
●
●
●
●
●
●
●
●
St Andrew Holborn
St Bride Fleet StreetSt Botolph Aldgate
St Giles Cripplegate
St Olave, Bermondsey
St Saviour
St James, Clerkenwell
St Leonard Shoreditch
St Mary Magdalen, Bermondsey
St Mary, Whitechapel
St Clement Danes
St Martin in the Fields
1000
2000
3000
4000
1000
2000
3000
4000
London Bills
Par
ish
Reg
iste
rs
1625
●●
●
●
●
●
●●
●●
●●●●
●
●
●●●
●
●
●
●●
●
●●
●
●●●●
●
●
●
●
●●
●●
●
●
●●
●●
●●●●
●
●
●
●●
●●
●
●●●
●
●
●
●
●
●
●
●
●
●
●
●
●
●
●
●
●
●
●
●
●●
●
St Andrew Holborn
St Bride Fleet Street
St Botolph Aldgate
St Botolph Bishopsgate
St George The Martyr
St Giles Cripplegate
St Saviour
St Giles in the Fields
St James, Clerkenwell
St Katherine By The Tower
St Leonard Shoreditch
St Mary, Whitechapel
St Martin in the Fields500
1000
1500
2000
2500
500
1000
1500
2000
2500
London BillsP
aris
h R
egis
ters
1636
●
●
●●
●
●
●
●
●
●
●●
●●
●
●
●● ●
●
●
●
●
●
●
●
●●
●
●
●●
●
● ●●
●
●
●●
●
●
●●
●
●
●
●
●●
●
●
●
●
●
●
●●
●
●
●
●●●
●
●
●
●
●
●
●
●
●
●
●
●
●
●
●
●
●
●
●
●
●
●
St Andrew Holborn
St Bride Fleet Street
St Botolph Aldgate
St Botolph Bishopsgate
St Olave, Bermondsey
St Saviour
St Giles in the Fields
St James, Clerkenwell
St Mary, WhitechapelSt Dunstan and All Saints
250
500
750
250
500
750
1000
1250
London Bills
Par
ish
Reg
iste
rs
1660
●
●
●
●
●●
●●●
●●
●
●●●
●●
●
●●
●
●
●
●
●
●
●
●●
●
●
●
●●
●
●
●●●●●
●●
●
●
●
●●
●
●●
●
●●
●
●
●
●
●
●
●
●
●
●
●●●
●
●
●
●
●
●
●
●
●
●
●
●
●
●
●
●
●
●
●
●
●
●
●
●
●
St Andrew Holborn
St Bride Fleet Street
St Botolph Aldgate
St Botolph Bishopsgate
St Giles Cripplegate
St Olave, Bermondsey
St Saviour
St Sepulchre Holborn
St Giles in the Fields
St Leonard Shoreditch
St Mary, Whitechapel
St Dunstan and All Saints
2000
4000
6000
8000
2500
5000
7500
London Bills
Par
ish
Reg
iste
rs
1665
Figure 2: Recorded Deaths in Parish Registers versus London Bills.
comparing our parish totals with parish totals in surviving London Bills; andby comparing our estimate of total deaths, after imputing missing observa-tions, with known annual totals that run continuously from 1603, and alsoexist for 1578–1582 and the plague years of 1563 and 1593.
Figure 2 gives our estimate of annual deaths compared with the totalsreported in the London Bills for three plagues—1625, 1636, and 1665—and
9

one non-plague year, 1660.6To prevent small intra-mural parishes clusteringindistinguishably around the origin, we use square-root axes.
It can be seen that, before 1665, most parish totals match the LondonBills totals fairly closely, although there are a few cases where the parishrecord is considerably lower. In particular, recorded burials in the largestparishes during the severe plague of 1625 tend to be considerably lower thantotals recorded in the Bills. Similarly, in 1665 we can see how several largeparishes appear to have given up recording individual burials, although parishclerks must have maintained running totals that they reported in their weeklymeetings to compile the London Bills.
2 The Social Geography of London.
The social geography of mid-seventeenth century London has been well knownsince Finlay (1981, 70–82) used the Settlement of Tithes 1638 to map thedistribution of “Substantial Householders” (those living in property valued ata rent of £20 or above). Finlay’s data are reproduced in the second panel ofFigure 3 which shows how the affluent were strongly concentrated in a centralbelt of intra-mural parishes, with prosperity declining as one approached thecity wall and river. Using a sample of 13 rich and 14 poor parishes, with datafrom the forced loan of 1522, the lay subsidy of 1572, the 1638 settlementof tithes, and the 1695 duty on births, marriages, and deaths, Slack (1985,170–172) found that the same parishes tended to be among the richest orpoorest over two centuries, and concluded that there was a fairly constantsocial geography of rich central parishes surrounded by a poorer periphery.This view that the social geography of London was relatively fixed during thesixteenth and seventeenth centuries is shared by Boulton (2000, 327–328).
6All parish register dates have been shifted ten days into Gregorian form. AnnualLondon Bills ran from the Thursday before Christmas (Julian Calendar), which is closeto the start of January in Gregorian form.
10

Substantial_Households_1638
Lay_Subsidy_1582
1
2
3
4
Figure 3: Spatial distribution of wealth, with parishes grouped by quartile,1582 and 1638.
To test this consensus about a fixed social geography, we analyse thespatial distribution of wealth during the late sixteenth century using a newset of data: the returns of the 1582 Lay Subsidy.7 Excluding companies, thiscovers 6,632 individuals. When we leave out servants of taxpayers, who paid4d each, this gives a sample of 5,747 taxpayers. The upper panel of Figure3 gives the median tax paid by parish, with parishes again being assigned tofour quartiles.
It can be seen that although the central parishes tend to be rich andthe peripheral ones poor, as Slack argued, the spatial distribution of wealth
7This was downloaded from the London Record Society http://www.british-history.ac.uk/source.aspx?pubid=160
11

is more diffuse in 1582 than in 1638, with less concentration in the centralparishes. We shall see below that trend of increasing self-segregation by theaffluent coincides with the tendency for plague mortality to become concen-trated in outer parishes.
We can test formally for spatial autocorrelation in these wealth datausing a Moran I test (Bivand, Pebesma and Gomez-Rubio, 2008, 258–268).For 1638, none of the included parishes outside the walls has a neighbour thatis included, so we restrict our sample to intra-mural parishes, excluding StJames Duke Place which is also isolated. The Moran statistic for no spatialautocorrelation (assigning equal weight to each of a parish’s neighbours) hasa p-value of 0.07 for 1582, consistent with the distribution of wealth withinthe walls having low spatial organisation. Adding the extra-mural parishes,which can be seen from Figure 3 to be poorer on average than those withinthe walls, causes the p-value to fall to 0.04. For 1638, the strong spatialautocorrelation is clear with a p-value for the test statistic of 0.00.
3 Reconstructing Deaths.
To estimate total annual deaths for London we need to reconstruct mortalityfor parishes in years where records are missing. Using recorded and imputedburials we can estimate annual mortality from 1560 to 1660, and compareour estimates with the totals recorded by Graunt (1662) from the LondonBills from 1603 to 1642, and from Marshall (1832) from 1643 to 1664. Grauntrecorded total burials in London, and non-plague deaths for the intra-mural,extra-mural and out-parishes: in other words, plague deaths by district arenot given. Creighton (1891, 341–344) also reports weekly mortality from1578 to 1582, and for the plagues of 1563 and 1593.
Mathematically, we are trying to impute the missing values in a matrixwhere, from 1560 to 1659, 41 per cent of the entries are missing. The canon-ical version of this problem is the Netflix Prize, where, based on ratings of
12

some films by users, the goal is to predict how these users would rate otherfilms. The most successful approach, that we will follow here, is to reducethe dimensionality of the problem through a singular value decomposition(SVD). In terms of films, each is scored according to a few different genres,and the score that each user assigns each genre is calculated, allowing thescore for an unknown film to be calculated as the vector product of thesetwo scores. We tried a variety of SVD algorithms but found that the mostreliable performance, particularly for reproducing known death totals from1578–1582, came from the procedure of Mazumder, Hastie and Tibshirani(2010) implemented in the R package softImpute.8 Because records maystop or start during a year, causing the annual total to be an underestimate,any year preceded or followed by missing entries was treated as a missingentry. Mortality in each parish in each year is expressed as a fraction ofknown deaths in 1660.
Figure 4 plots our estimates of annual burials alongside the London Billstotals for three groupings of parishes: the intra-mural parishes, the intra-and extra-mural parishes (i.e. the City of London), and the total for London.Before 1636, the London Bills only reported mortality for nine out-parishes,adding seven distant parishes after that year. Our London Totals thereforeomit the distant parishes before 1636.
8SVD procedures ignore spatial and temporal information on deaths. We attempted toincorporate these by giving each parish a location equal to the centroid of its map polygon,and using this location and year as explanatory variables for two procedures: penalizedregression splines (Wood, 2006) and regression trees Taddy, Gramacy and Polson (2011).When predicting missing values, each produced results close to known totals after 1604,but generated serious over-estimates for 1578–1582. Spatially, London mortality rateswere bowl shaped, rising as one moves outwards, and extrapolating these spatial trendsto large missing suburbs led to excessive estimates.
13

0
20000
40000
60000
1540 1560 1580 1600 1620 1640 1660
Bur
ials
London Total
0
10000
20000
30000
40000
1540 1560 1580 1600 1620 1640 1660
Bur
ials
Intra− and Extra−Mural
0
5000
10000
15000
1540 1560 1580 1600 1620 1640 1660
Bur
ials
Intra−Mural
Figure 4: Estimated versus recorded burials in groups of London parishes.
What is most notable about Figure 4 is how closely our estimates matchthe recorded London Bills totals. In particular our estimates for 1578–1582are close to those recorded by Creighton (1891, 341–344).9
Some totals for major sixteenth century plague years survive. For 1563,Creighton (1891, 305–306) gives Stow’s estimates of 20,322 deaths for theintra- and extra-mural parishes, and 3,288 for 11 out-parishes; whereas ourestimates are 21,000 for the intra- and extra-mural parishes; and for theout-parishes excluding distant parishes 3,000.
9Creighton does not give a location for these numbers but his total of 6,772 for most of1582 is close to the 6930 reported by Christie (1893, 135) for the intra- and extra-muralparishes, suggesting that Creighton’s numbers are for the intra- and extra-mural parishes.
14

For 1593 our estimate of 21,000 deaths in the intra- and extra-muralparishes exceeds the 18,000 given by Stow and Graunt (Creighton, 1891,353–354), but it is immediately evident that this latter figure is implausiblylow. The 72 parishes in our sample for that year recorded 17,273 burials, evenbefore including estimates for the 41 missing parishes. Creighton also cites anestimate of 26,000 deaths “in and about London”; and this is also the figuregiven for the intra- and extra-mural parishes from March to December 1593in the Collection of the Yearly Bills of Mortality (Birch, 1759).10 Excludingdistant parishes, our estimate for total mortality is 26,000.
3.1 Relative Magnitudes of Plagues.
These successive plagues occurred in a rapidly growing city so it is necessaryto ask how large each was relative to the size of London at the time. To dothis, we compare estimated mortality in each plague year with the mediannumber of deaths over the preceding five years, including only parishes witha complete five years of records. Given the unreliability of the 1625 burialregisters in large parishes, and to an even greater extent those for 1665, weuse London bill totals for each parish in those years; and also use the LondonBill figures for 1660–1664 to calculate normal mortality for every parish.
Given the increasing concentration of the rich in central parishes, wedivide the intra-mural parishes into two groups based on the proportion ofsubstantial households in 1638. For brevity, we refer to these as rich andpoor. The proportion of substantial households for some parishes is notgiven: these are the blank areas in Figure 3. We assign two of these—AllHallows Bread Street and St Swithin—that are completely surrounded byaffluent parishes, to the rich category; and the rest to the poor.
10This Collection also contains a bill purporting to give a breakdown by parish for 1593but gives the impossible figure of 32,000 for the intra- and extra-mural parishes and atotal of 39,000. These may possibly be combined totals for the two plague years of 1592and 1593 but the correlation with individual parish records in our sample is low.
15

Intra rich Intra poor Extra City Out-par Westminster Total1563 7.7 5.5 5.3 5.4 3.5 3.3 4.81593 4.2 4.4 4.8 4.6 3.4 3.3 4.31603 5.3 6.0 6.4 6.2 7.6 5.4 6.51625 4.6 5.8 5.6 5.5 5.4 4.0 5.31636 1.2 1.5 2.8 2.3 3.2 1.5 2.41665 3.3 5.5 6.8 6.2 6.1 4.6 5.9
Table 1: Relative mortality during plague crises.
Looking at mortality across the intra- and extra-mural parishes, Table 1shows that the plagues of 1563, 1603, 1625 and 1665 were of roughly equallethality, with deaths running from 5 to 6 times their usual level; while theplague of 1593 saw deaths running at 4.6 times normal, and in 1636 deathswere 2.3 times normal.
The major trend apparent in Table 1 is the sharp fall in mortality in thecentral parishes. In 1563 these fared worse than the rest of London but, after1603, their experience becomes markedly better than their poorer neighbours,with a rise in mortality in 1665 around half that of the extra-mural parishes.While Slack (1985, 160–163) argues that increased overcrowding made theextra-mural parishes more vulnerable to plague over time, our results donot indicate any large increase in the lethality of plague there. The largestincrease occurs in the rapidly urbanizing out-parishes which go from a plaguemortality of 3.5 times normal in earlier major plagues, to 6 times normal in1665.
Figure 5 plots the mortality in each parish during the major plagues,again relative to median mortality in the parish over the preceding five years.The changing pattern of mortality within the walls is immediately apparent.During 1563 several central parishes were among the hardest hit, and this wasstill the case, although less markedly, in 1603. By 1665, however, the mostprosperous parishes, based on the 1638 proportion of substantial householdsin Figure 3, stand out as an island of low mortality. Looking at the parishes
16

d1636 d1665
d1603 d1625
d1563 d1593
Up to 2
2 to 4
4 to 5
5 to 7
Over 7
Figure 5: Mortality in London plague years relative to median mortality inpreceding five years.
17

outside the walls, a consistent pattern emerges from 1593 onwards: the poornorthern suburbs of St Giles Cripplegate and Shoreditch are always amongthe worst hit. When we look below at the weekly spread of crisis mortalitywe shall see that these northern parishes are always the first to show unusualrises in mortality.
3.2 Plague and Typhus.
While the London Bills, and most modern authors, confidently distinguishbetween plague and typhus as causes of death, in practice the symptoms ofthe two diseases were often similar. Under “Plague—Morbid Anatomy” the1902 Encyclopedia Britannica notes that in autopsies “The appearances arethose of death from an acute infective disease, and resemble those of typhus,except for the special affection of the lymphatic glands.” In the standardVictorian reference on typhus, Murchison (1884, 219–220) notes that thesymptoms of typhus and plague are almost identical, with the characteristicpetechial spots (caused by intradermal bleeding) of typhus (hence its name ofspotted or purple fever) corresponding to plague tokens (the “ring of roses”);while swift, agonising death and the appearance of swollen lymph glands orbuboes in typhus is not uncommon. Epidemic outbreaks of the two diseasescan be distinguished by the fact that typhus rarely kills children whereasplague kills equally at all ages, but telling isolated adult cases apart wasalmost impossible before improvements in microbiology in the early twentiethcentury.
Writers on plague before the twentieth century note that severe epidemicsof plague tend to occur a year after, or concurrently with, a major typhusepidemic: In his discussion of “the praecursor Diseases of Pestilence”, Han-cock (1821, Chapter 8) notes that the London plagues of 1625, 1636, and1664, as well as most of the major European epidemics since the sixteenthcentury, were preceded by an epidemic of pestilential fever; Murchison (1884,223) observes that “many epidemics of plague in Europe have been preceded
18

and accompanied by a great prevalence of typhus”; while Crawfurd (1914,32) writes “There is scarcely a single writer of the sixteenth, seventeenth, oreighteenth centuries on the subject of fevers, who has not commented on theconcurrence of malignant fevers with epidemics of Oriental plague.”
Given the current orthodoxy that plague is spread by rat fleas, the ten-dency of epidemic typhus (spread by human body lice) to precede plagueoutbreaks appears coincidental, and it disappears from discussions of plagueafter the early twentieth century. However, based on the experience of Frenchdoctors dealing with plague outbreaks in North Africa between the 1920s andthe 1940s, Drancourt, Houhamdi and Raoult (2006) argue that, although ratfleas are indeed the vector behind minor plague outbreaks, in severe epi-demics of bubonic plague most transmission occurs through human lice andpossibly human fleas. Houhamdi et al. (2006) demonstrate that human licecan act as effective plague vectors (rat fleas are notably inefficient vectors,requiring many bites to transmit infection: Lorange et al. 2005), being ableto infect and be infected by rabbits.11
Returning to the falling impact of plague epidemics on wealthier parishes,looking at the 1613 plague in the Saxon town of Freiberg, Monecke, Mon-ecke and Monecke (2009) argue that the lower mortality in wealthy parisheswas due to their stone buildings which gave the inhabitants greater protec-tion against rats and their associated fleas. In the case of London, improvedhousing in affluent areas—“from sticks to bricks” in the words of James I(Brett-James, 1935, 15)—may have lessened the impact of plague. To theextent that serious plague was transmitted by human fleas and lice (Dran-court, Houhamdi and Raoult, 2006), greater physical segregation of rich from
11The rapid spread and high fatality rate of plague during the second pandemic fromthe early fourteenth to eighteenth centuries compared with the third pandemic starting inthe late nineteenth century led some to conclude that medieval plague was not Yersiniapestis but some haemorrhagic fever like Ebola: see for instance Cohn (2002). However,excavations of medieval plague pits have found the presence of Yersinia pestis in a closelyrelated genetic form to modern plague (Achtman, 2012). The greater role of human licein spreading earlier plagues may explain their higher lethality.
19

poor would have lessened the force of epidemics among the rich, as wouldimproved personal hygiene.12
4 Mortality Crises.
We have seen that London mortality until 1665 was characterized by suddenspikes when deaths ran at 5 to 6 times their usual level as a result of plague.The burial register data rarely give cause of death, unlike the London Billswhich list the number of plague deaths by parish. However as noted above,plague deaths suffer from severe under-registration.
To analyse crisis mortality we therefore look instead for unusual increasesin mortality, applying surveillance techniques from epidemiology. The spe-cific algorithm we use is due to Farrington et al. (1996), implemented byHohle (2007).13 To detect epidemic outbreaks in real time, these comparenumber of cases in a given week with a threshold equal to the 99 per centupper tail value of a Poisson distribution with parameter equal to the averagenumber of cases in the same and surrounding 5 weeks over the 3 previousyears, adjusted for a time trend if necessary.
Figure 6 shows annual deaths in our sample of London parishes from 1560to 1750, and the share of these deaths that are classified as crisis deaths, de-fined as the number of deaths each week in excess of the Farrington threshold.One shortcoming of the Farrington methodology is that, in years followinga severe rise in deaths, crises are hard to detect so that continued plaguedeaths the year following a major epidemic are not recorded.14 However, the
12Although, to judge from Pepys, lice remained a problem even among the affluent. Forexample: January 1, 1669: “I am louzy, having found in my head and body above 20 lice,little and great”
13Using other standard surveillance algorithms from Hohle (2007) gave almost identicalresults and they are not reported here.
14The algorithm contains an attempted correction for this, but the magnitude of plaguemortality overwhelms it.
20

0
10000
20000
30000
40000
50000
0.0
0.2
0.4
0.6
0.8
Total.Deaths
Crisis.S
hare
1600 1650 1700 1750
Figure 6: Annual deaths, and proportion of deaths in excess of the Farringtonthreshold, 1560–1750.
magnitude of these plague after-shocks are small relative to the precedingplagues.
The fundamental change in London mortality after 1665 is immediatelyevident in the fall in the number of crisis deaths. Between 1560 and 1665,these account for 18 per cent of deaths; and this falls to 1.8 per cent after1665. Annual London mortality goes from being highly volatile and unpre-dictable, to being smooth and predictable. However, even before 1665 thereis clear evidence of a diminution of crisis mortality from the 1590s onwards:from 1563 to 1593, there are ten years when crisis mortality exceeded tenper cent of deaths, but from 1594 to 1665 there are only five years. In otherwords, there appears to be a disappearance of minor plague outbreaks from1590 onwards.
There does seem to be an upward trend in crisis mortality during the firsthalf of the eighteenth century but the levels are low compared with those ofthe plague era. There is however one notable spike in 1741, during a major
21

mortality crisis in the Midlands (Wrigley and Schofield, 1981, 683) whencrisis deaths are 13 per cent of the total.
4.1 Diffusion of Plague.
By examining weekly crisis mortality in the individual parishes in our sam-ple we can track the geographical diffusion of plague during major epidemicsfrom 1563 to 1665. In particular we can look at where and when epidemicsoriginated, and how rapidly they spread. For 1665, where weekly bills col-lected by Graunt (1665) survive, we can compare the timing and patternof crises detected by the surveillance algorithm with official notifications ofplague deaths.
Figure 7 shows snapshots of the weekly mortality by parish in the threemajor plagues before 1665: 1563, 1603 and 1625. The value for each parishis the number of deaths each week relative to its Farrington threshold. Aslide show of each week in each plague year, including also 1593 and 1636,is available on our webpage. In each case, the map starts at the first weekwhere a parish experiences elevated mortality that lasts more than two weeks:with roughly one hundred parishes we can expect about one parish each weekto be above its 1 per cent Farrington threshold in the absence of mortalitycrises.
The spatial and temporal pattern of crisis mortality in the three majorplagues before 1665 is notably consistent. Elevated mortality appeared firstin mid to late June in the Northern parishes of St Giles Cripplegate andShoreditch. In the following 6–8 weeks it spread to other suburban parishes.By 14 weeks it had spread inside the walls.
That plague consistently originates away from the port suggests thatit was endemic, rather than an occasional exotic import as Slack (1981)suggests. Keeling and Gilligan (2000) simulate a model of transmission ofplague from fleas to rats to humans show that, for biologically plausibleparameters, a city with a population of 60,000 (the size of London by the
22

week_26_1563 week_21_1603 week_26_1625
week_30_1563 week_25_1603 week_30_1625
week_32_1563 week_27_1603 week_32_1625
week_34_1563 week_29_1603 week_34_1625
week_36_1563 week_31_1603 week_36_1625
week_38_1563 week_33_1603 week_38_1625
week_40_1563 week_35_1603 week_40_1625
0
1−2
2−4
4−6
>6
Figure 7: Weekly spread of crisis mortality: 1563, 1603, and 1625.
23

mid-sixteenth century) can sustain plague in its rat population for a hundredyears, supporting the view that plague was native to the city. However, theirmodel relies on some fraction of rats being able to transmit immunity to theiroffspring, whereas Drancourt, Houhamdi and Raoult (2006) point out thatplague appears to disappear completely from rodent populations betweenepizootics, and suggest instead that it is a telluric (soil based) organism thatoccasionally infects animal populations.
For 1665 we have weekly data for all London Bills parishes compiled byGraunt (1665).15 To assess weekly mortality in earlier years for parisheswhere burial registers are unavailable we assume that there is no seasonaltrend in mortality so that if dit burials took place in parish i in week t,weekly burials in that parish follow a Poisson distribution with parameterdit/52.16 These simulated burials are then used as inputs into the Farringtonprocedure.
Given the low opinion of the accuracy of the London Bills, and particu-larly their plague statistics, held by Graunt (1662), and others, it is notablethat the pattern of crisis that emerges is exactly that given in the plaguefigures in the Bills: the first outbreak of sustained crisis mortality occursin St Giles in the Fields, with the London Bills picking up the first plaguedeaths one week before the Farrington procedure. After this crisis mortalityspreads through the northern parishes over the next 8 weeks. This south-westerly shift in the source of the plague probably mirrors the changing mapof London poverty in the mid-seventeenth century with the rapid growth ofthe west of the city.
15Earlier studies of 1665 include Twigg (1993) and Champion (1995).16Allowing the Poisson parameter to show a seasonal trend of the sort outlined in Section
6 did not change the results in any way.
24

week_17_1665 week_18_1665 week_19_1665
week_20_1665 week_21_1665 week_22_1665
week_23_1665 week_24_1665 week_25_1665
week_26_1665 week_27_1665 week_28_1665
week_29_1665 week_30_1665 week_31_1665
0
1−2
2−4
4−6
>6
Figure 8: Spread of crisis mortality, 1665.
25

5 Child Deaths.
With rare exceptions, burial registers do not record age at death. However,for about half the parishes in our sample, the register records some burialsas “son of” or “daughter of”, allowing us to conclude that the deceased wasyoung, probably below fifteen. We can therefore look at how the share ofchild deaths, so defined, varied spatially and through time.
The upper panel of Figure 9 shows child deaths as a fraction of totaldeaths; while the lower one shows child deaths as a fraction of baptisms inthe same parishes. We group parishes as rich intra-mural, poor intra-mural,and, because of the limited number of early observations, group extra-muraland out-parishes together.
Looking at child deaths as a share of total deaths in the upper panel,it can be seen that the fraction is fairly similar across regions until the lateseventeenth century; and that all regions show an inverted-U shape: theshare of children in total deaths rises from around one third in the 1560sto nearly one half in the mid-seventeenth century, before falling to arounda quarter by the mid-eighteenth century. This share falls markedly in theplague years of 1625 and 1665, indicating that registration of child deathsfell in the latter parts of these years as mortality rose.
The rising share of children in recorded deaths between the late sixteenthand mid-seventeenth centuries does not appear to indicate a worsening mor-tality experience for children: in the lower panel we can see that the ratioof children’s deaths to baptisms at this time remains fairly stable, rising inthe 1640s and 1650s as the share of children being baptised falls; while theratio of births to total deaths improves (Figure 14). This suggests that thebenefits of the mortality improvement in the early seventeenth century wentdisproportionately to adults or that children were a larger share of the pop-ulation. After our period, the ratio of child deaths to baptisms shows animproving trend in the late seventeenth and early eighteenth centuries.
26

0.1
0.2
0.3
0.4
0.5
0.6
1600 1650 1700 1750
Sha
re
Intra.Rich
Intra.Poor
Other
Share of Deaths Classified as Children
1
2
3
1600 1650 1700 1750
Rat
io
Intra.Rich
Intra.Poor
Other
Child Deaths Relative to Baptisms
Figure 9: Share of children in deaths, and ratio of child deaths to baptisms,in regions of London, 1560–1750
Across regions, the bottom panel of Figure 9 shows that the centralparishes had a consistently lower ratio of child deaths to baptisms com-pared with the extra-mural and out-parishes. To a first approximation thisannual ratio of child deaths to births gives the probability of dying during
27

Intra rich Intra poor Extra City Out-par Total1563 7.0 4.6 5.5 4.2 5.41593 3.5 5.6 4.7 4.7 2.7 4.21603 3.9 5.7 5.2 4.8 5.6 5.51625 3.3 4.1 4.2 4.2 3.3 3.91636 1.1 1.2 2.7 2.2 3.0 2.31665 1.8 3.3 2.3 2.5 3.5 2.8
Table 2: Relative child mortality during plague crises.
childhood.17 For the inter-plague period 1605–1624 we find that roughly halfof those born survived childhood: the ratio of child deaths to baptisms is0.45 in both rich and poor intra-mural parishes, and 0.55 in extra-mural andout-parishes. These rates are similar to estimates for four parishes by Finlay(1981, Table 5.15). For the sixteenth century, looking at the inter-plague pe-riod 1565–1592, intra-mural parishes again record a child-death to baptismratio of 0.45, but the extra-mural and out-parishes together have a ratio of0.67. Over the entire period 1560 to 1624, the ratios are 0.47 and 0.55 for therich and poor intra-mural parishes respectively, and 0.66 for the extra-muraland out-parishes.
Studies of the relative impact of plague on children compared with adultsare ambiguous, with Hollingsworth and Hollingsworth (1971) finding a muchhigher child mortality rate in the poor parish of St Botolph Bishopsgate in1603; whereas Ell (1989) for Venice in 1630 and Signoli et al. (2002) for
17Suppose that pi is the fraction of children born in a year who die at age i. Wesuppose that, outside plague years, this is fairly constant from year to year. It followsthat child deaths in year t Dt = Σi=0piBt−i, where Bt is births in year t. Assuming thatannual births increase at constant rate g it follows that the ratio of child deaths to birthsDt/Bt = Σi=0pi/ (1 + g)i ≈ Σi=0pi when g is small or when most child deaths occur atlow ages, as was the case in London. For St Botolph Bishopsgate in 1603, Hollingsworthand Hollingsworth (1971, Table 8) calculate that the annualized death rate for childrenunder one was 314 per thousand, 40 for those aged 1–5, and 10 or below after this. For1728, the earliest Bill giving mortality by age group, of deaths under age 20, 69 per centwere under 2, and 17 per cent aged 2 to 5.
28

0.05
0.06
0.07
0.08
0.09
0.10
0.11
2 4 6 8 10 12
1613−1623
0.05
0.06
0.07
0.08
0.09
0.10
0.11
2 4 6 8 10 12
1650−1663
0.05
0.06
0.07
0.08
0.09
0.10
0.11
2 4 6 8 10 12
1670−1689
0.05
0.06
0.07
0.08
0.09
0.10
0.11
2 4 6 8 10 12
1690−1709
0.05
0.06
0.07
0.08
0.09
0.10
0.11
2 4 6 8 10 12
1710−1729
0.05
0.06
0.07
0.08
0.09
0.10
0.11
2 4 6 8 10 12
1730−1749
Figure 10: Share of deaths by months in intra-mural, extra-mural, and out-parishes.
eighteenth century Provence estimating a lower rate. Table 2 reproducesTable 1 for children, looking at mortality in plague years relative to theaverage over preceding years, and finds, particularly for the period of morereliable registration before 1625, that children usually fared slightly betterthan the general population.
29

6 Seasonality.
How did mortality vary during the year? For rural England at this time,Wrigley and Schofield (1981, 293) show that mortality peaked in March andreached a minimum in July. By contrast, plague mortality usually peaked inthe autumn, and this is the pattern we see in London before 1665, even inyears with few recorded plague deaths between major epidemics. Typhus inEngland, by contrast, showed little seasonality, with epidemics occurring atany time of the year, with a slight prevalence in colder months (Murchison,1884, 66–68).
Figure 10 shows the seasonal pattern of mortality for the parishes inour sample, divided into groups for the intra-mural, extra-mural, and out-parishes which are coloured red, blue, and green respectively. Each year iscomposed of 13 four week months, and the diagram shows the share of totaldeaths over the period that occurred in each month. Mortality of childrenshows the same pattern in every case. The first two panels focus on twoperiods between major plague episodes, 1613–23 (when the London Billsrecord between 9 and 37 plague deaths per year out of a total ranging from7,500 to 11,000) and 1650–1663 (with 4 to 36 plague deaths reported annuallyout of a total of 9,000 to 20,000 deaths). Looking at the first period, theintra-mural parishes shows a summer minimum and winter peak, but theextra-mural and out-parishes both show strong autumn peaks consistent withfairly substantial mortality from plague or some other disease associated withwarm weather. For 1650–1663, all three areas, but especially the extra-muralparishes, show a strong autumn peak.
After 1665, the conventional story of the sudden disappearance of plaguewould lead us to expect a rapid transition to the winter peak pattern ofmortality shown by the rest of England. However, looking at the third panelof Figure 10, for 1670–1689, all districts continue to show a very markedautumn peak in mortality that persists, although substantially weaker andlower than January mortality, during 1690–1709. By 1710–1729, the intra-
30

0
5
10
0
5
10
0
5
10
Intra.muralE
xtra.muralOut.parishes
1550 1600 1650 1700 1750
Mon
th
Figure 11: Heat-map of monthly mortality by district, 1560–1750.
mural area has reached the standard v-shaped mortality profile but the extra-mural and out-parishes continue to show marked autumn peaks. It is onlyafter 1730, in the last panel, that all regions show a v-shaped profile.
Figure 11 gives a heat-map of monthly mortality share (again using 4week months) where months are assigned into quartiles according to theirshare of annual mortality. The pre-1665 plague era pattern is apparent, withdark squares towards the top of each diagram corresponding to large autumnshares of mortality. Looking at the top panel, for the intra-mural parishes,this pattern of autumn peaks continues until the 1690s, when a marked late-winter peak appears along the bottom of the diagram.
It therefore appears that the same seasonal pattern of mortality as duringearlier periods between plague epidemics persisted after 1665 until the 1720s,most strongly in the poorer extra-mural and out-parishes. This seasonalityis consistent with the continued presence of plague but could, of course, beassociated with some other autumn disease, perhaps dysentery. However, thequestion then arises of how this unknown disease suddenly disappeared after1730. Given the similarity of plague to typhus it therefore appears possiblethat isolated cases of plague may have continued to occur annually in theautumn in London until the 1720s, as they had in earlier intervals betweenepidemics, but were recorded as typhus or other fevers.
31
7 Positive Checks.
To what extent did London deaths respond to living standards? In Kellyand Ó Gráda (2013) it is shown that England, outside London, saw thedisappearance of the positive check during the early seventeenth century,while London after 1665 showed a continued strong positive check until theearly eighteenth century.
As in Kelly and Ó Gráda (2013) we assume that the death rate is a simplelog-linear function of past death rates and real wages
ln(Dt/Nt) = α + β′ ln(Dt−1/Nt−1) + γ′ ln(wt) (1)
where D are annual deaths, N is population, w is the real wage. The righthand side variables are vectors of current and lagged values. In what followswe do not know population levels N , only annual deaths. We thereforeassume in each regression that annual population growth is roughly constantNt = (1 + g)Nt−1
It follows that
ln(Dt) = α̃ + β′ ln(Dt−1) + γ′ ln(wt) + δ t (2)
where α̃ = α+(β1 + β2 + . . .) g+(β2 + 2β3 + . . .) g ln (N1) and δ = (1 − β1 − β2 − . . .) g ln (N1).Kelly and Ó Gráda (2013) show that an advantage of this logarithmic spec-ification is that it is robust to systematic under-registration of deaths ormis-measurement of living standards: as long as the measured values are afairly constant fraction of the true values, the elasticities β and γ will becorrectly estimated.
We estimate this regression using deaths imputed above from 1560 to 1664for the intra-mural, extra-mural, out-parishes, and Westminster in Table 3.In estimating real wages we tried the reconstructions for London by Allen(2007) and for English farm labourers by Clark (2007), but the former hadno explanatory power and we only report results for the Clark series here. In
32

Total Intra-m Extra-m Out-parishes Westminster(Intercept) 6.52∗∗ 5.63∗∗ 5.59∗∗ 5.22∗∗ 0.69
(1.25) (1.07) (1.25) (1.23) (1.06)Trend 0.01∗∗ 0.01∗∗ 0.01∗∗ 0.01∗∗ 0.00
(0.00) (0.00) (0.00) (0.00) (0.00)Lag deaths 0.37∗∗ 0.29∗∗ 0.42∗∗ 0.46∗∗ 0.83∗∗
(0.09) (0.10) (0.09) (0.09) (0.08)Lag 2 deaths −0.06 −0.09 −0.03 −0.03 0.03
(0.05) (0.05) (0.06) (0.06) (0.07)Wage −0.37∗ −0.22 −0.43∗ −0.47∗ −0.38
(0.19) (0.18) (0.21) (0.21) (0.23)Lag wage 0.21 0.26 0.24 0.16 0.40
(0.19) (0.19) (0.21) (0.22) (0.24)Plague year 1.44∗∗ 1.40∗∗ 1.51∗∗ 1.34∗∗ 1.10∗∗
(0.10) (0.10) (0.11) (0.11) (0.13)Post-plague year −0.79∗∗ −0.64∗∗ −0.90∗∗ −0.89∗∗ −1.26∗∗
(0.17) (0.17) (0.18) (0.17) (0.16)R2 0.83 0.76 0.80 0.87 0.87Plague years are 1563, 1593, 1603, and 1625
Table 3: Positive Check in London, 1560–1664.
Table 3 it can be seen that mortality is more strongly influenced by currentreal wages as one moves from affluent to poor areas: current wage has a smalland insignificant impact on deaths within the walls or in Westminster, butaffects deaths in the extra-mural and out-parishes with an elasticity of 0.4.
Figure 12 shows the relationship between deaths by region and real wagesfor each year between 1560 and 1664. The major plague years identified inTable 3 are omitted. In each figure there are a cluster of observations tothe northeast of the main series, which are labelled in the first panel givingLondon totals, which correspond to smaller episodes of plague.
The varying impact of living standards on mortality possibly reflects or-ganisation of public charity as well as living standards: the intra- and extra-
33

●
●
●
●
●
● ●
●
●
●
●
●
●
●
●
●
●
●
●
●
●
●
●
●
●
●
●
●
●
●
●
●
●
●
●
●
●
●
●
●
●
●
●
●
●
●
●
●
●
●
●
●
●●
●
●
●
●
●
●
●
●
●
●
●
●
●
●
●
●
●
●●
●
●
●
●
●
●
●
●
●
●
●
●
●
●
●
●
●
●
●
●
●
●
●
●
●
●
●
1570
1578
1582
1592
1641
1654 1656
1664
8.0
8.5
9.0
9.5
4.00 4.25 4.50Wage
Tota
l
●●
●
●
●
●
●
●
● ●
●
●
●
●
●
●
●
●
●●
●
●
●
●
●
●
●
●
●
●●
●
●
●
●
●
●
●
●
●
●
●
●
●
●
●
●
●
●
●
● ●
●
●
●
●
●
●●
●
●
●
●●
●
●
●
●●
●
●
●
●
●
●
●
●
●
●
●
●
●
●
●
●
●
●
●
●
●
●
●●
●●
●
●
●
●
●
6.8
7.2
7.6
8.0
4.00 4.25 4.50Wage
Intr
a.m
ural
●
●
●
●
●
●
●
●
●
●
●
●
●
●
●
●
●
●
●
●
●
●
●
●
●
●
●
●
●
●
●
●
●
●
●
●
●
●
●
●
●
●
●
● ●
●
●
●
●●●
●
●
●
●
●
●
●
●
●
●
●
●
●
●
●
●
●
●
●
●
●●
●
●
●
●
●
●
●
●
●
●
●
●
●
●
●
●
●
●
●
●
●
●
●
●
●
●
●
7.0
7.5
8.0
8.5
9.0
4.00 4.25 4.50Wage
Ext
ra.m
ural
●
●
●
●
●
●
●
●
●
●
●
●
●
●
●
●
●
●
●
●
●
●
●
●
●
●
●
●●
●●
●
●●
●
●
●
●
●
●
●●
●
●
●
●
●
●
●
●●
●
●●
●
●
● ●
●
● ●
●
●●
●
●
●
●
●
●
●
●
●
●
●
●
●
●
●
●
●
●
●
●
●
●
●
●●
●●
●
●
●
●
●
●
●
●
●
6
7
8
4.00 4.25 4.50Wage
Out
.par
ishe
s
Figure 12: Annual deaths and real wages (in logs) for regions of London,1560–1664.
mural parishes had a well organized system of public relief with systematictransfers between rich and poor parishes, while the rapidly growing out-parishes were almost entirely reliant on their own resources for poor relief(Slack, 1989, 182). For rural England between 1600 and 1650, and for Lon-don after 1650, Kelly and Ó Gráda (2013) show that mortality is affectedby wages with a lag of one year, probably as a result of disease spreadinggradually through the population. For the regressions here, by contrast, theimpact of wages on mortality is immediate, the same pattern that Kelly andÓ Gráda (2013) find for peasants before the Black Death and for rural Eng-land in the late sixteenth century. This immediate response of mortality to
34

living standards may reflect a large population surviving close to the edge ofbiological subsistence, or immigration of the rural poor after bad harvests:Appleby (1975) finds a connection between bread prices and mortality fromtyphus—a disease of filth and over-crowding—during the late seventeenthand early eighteenth centuries. An influx of the rural poor may also ex-plain why Clark’s agricultural labourer wage series is a better predictor ofmortality than Allen’s London one.
The close connection between typhus and plague that we noted aboveraises the possibility that falls in rural wages may have precipitated plagueepidemics in London by first increasing the concentration of rural immigrantsvulnerable to typhus. However, we can find no simple connection betweenwage falls and plague outbreaks suggesting that a more complicated dynamicbetween human lice, typhus and plague is at work.
Whereas the Black Death of the fourteenth century led to large risesin living standards, it is notable that plague mortality has little impact onwages because new migrants rapidly replaced dead Londoners. Looking atthe nominal wages of craftsmen and labourers in London around the plaguesof 1593, 1603, 1625, 1636, and 1665 Boulton (1996) finds a slight increase forcraftsmen after 1593 and 1603; but little overall impact on wages. As Graunt(1662) noted, births, which serve as a measure of population, recovered topre-plague levels within two years: see Figure 13 below.
8 Births.
A complication in imputing births is that, unlike deaths, we have no completeset of parish totals for any year: the London Bills only record aggregatesover large groups of parishes. In addition the number of children baptised inAnglican churches falls sharply after 1639.18 To impute births we took the
18For the large parish of St James Clerkenwell annual baptismal totals are implausiblylow for the entire period, usually one third of recorded burials, but we did not attempt tocorrect this.
35
2500
5000
7500
10000
12500
1560 1580 1600 1620 1640 1660
Bap
tism
s
Estimate
Bills
Total Baptisms
0
1000
2000
3000
4000
5000
1560 1580 1600 1620 1640 1660
Bap
tism
s
Intra.mural
Extra.mural
Out.parishes
Westminster
Baptisms by Area
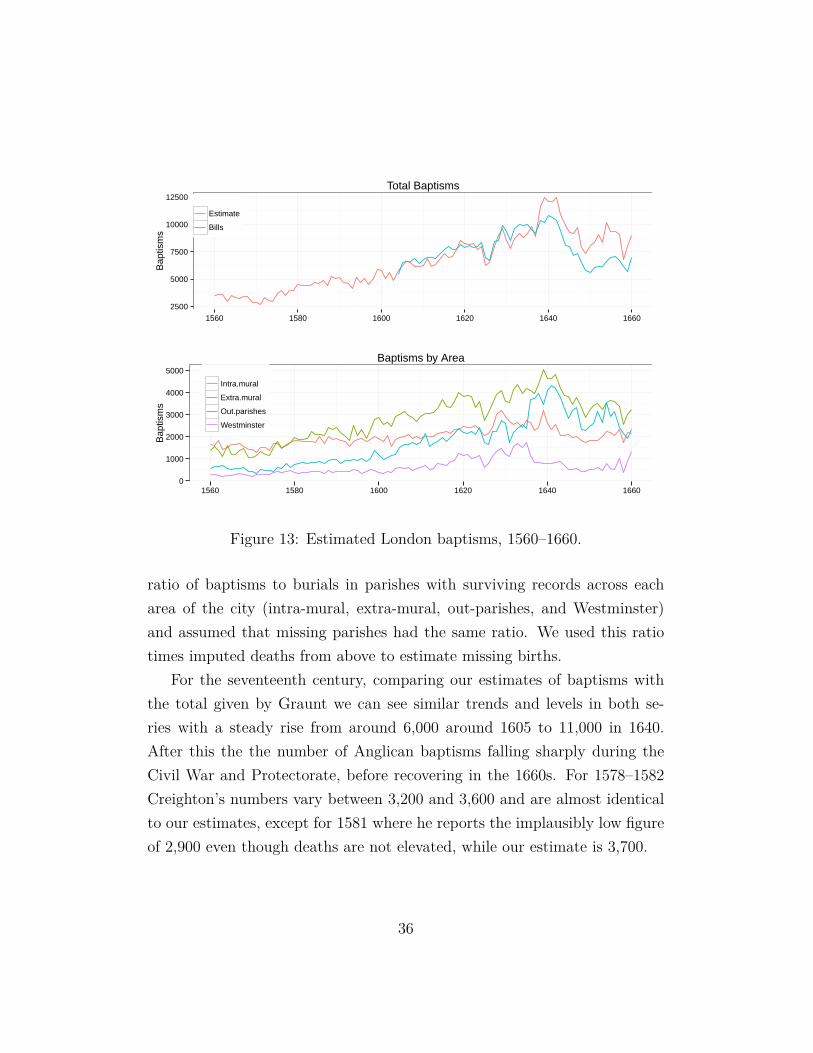
Figure 13: Estimated London baptisms, 1560–1660.
ratio of baptisms to burials in parishes with surviving records across eacharea of the city (intra-mural, extra-mural, out-parishes, and Westminster)and assumed that missing parishes had the same ratio. We used this ratiotimes imputed deaths from above to estimate missing births.
For the seventeenth century, comparing our estimates of baptisms withthe total given by Graunt we can see similar trends and levels in both se-ries with a steady rise from around 6,000 around 1605 to 11,000 in 1640.After this the the number of Anglican baptisms falling sharply during theCivil War and Protectorate, before recovering in the 1660s. For 1578–1582Creighton’s numbers vary between 3,200 and 3,600 and are almost identicalto our estimates, except for 1581 where he reports the implausibly low figureof 2,900 even though deaths are not elevated, while our estimate is 3,700.
36
Looking at the sixteenth century, our results are consistent with the es-tablished view that London’s population roughly doubled between 1560 and1600: our estimate of total baptisms rises from 3,000 to 6,000. However, ourresults suggest that this rise was not continuous, with most growth occurringin the 1570s and 1580s, with the number of births appearing static duringthe 1560s and 1590s.
The second panel of Figure 13 shows total estimated baptisms for the fourregions of London (with the distant parishes included as out-parishes fromthe beginning) and shows the slow growth of population inside the walls,with the intra-mural parishes being overtaken by the extra-mural ones bythe 1570s, and matched by the out-parishes by the early 1600s. It can beseen that the growth of Westminster only begins around 1600 and that it isstill small relative to the other districts by 1640.
Considering the preventive check, we ran similar regressions to those fordeaths across the different regions of London, using estimated births from1560 to the end of reliable registration in 1639, but did not find any largeor significant connection with living standards, and do not report the resultshere.
8.1 Natural Increase.
Figure 14 shows the annual ratio of baptisms to burials from 1560 to theend of informative baptismal records in 1639 for London and its three sub-divisions, with the intra-mural parishes again split into rich and poor basedon the proportion of substantial households in 1638. The ratio is computedfrom the set of parishes in each region and each year that report both bap-tisms and burials: we use actual rather than imputed values, and, again,years preceded or succeeded by missing values are also set to missing.
It is immediately apparent that the notion of London as an undifferen-tiated demographic sink where burials uniformly exceeded baptisms is notsustainable, particularly after 1600. The marked improvement in the ratio
37

0.0
0.5
1.0
1.5
2.0
0.0
0.5
1.0
1.5
2.0
0.0
0.5
1.0
1.5
2.0
0.0
0.5
1.0
1.5
2.0
0.0
0.5
1.0
1.5
2.0
TotalIntra.rich
Intra.poorE
xtra.mural
Out.parishes
1560 1580 1600 1620 1640
Figure 14: Annual ratio of baptisms to burials in regions of London, 1560–1639
of births to deaths appears to be associated with the disappearance of minorplague outbreaks after 1590 noted above.
Looking at the interquartile range of birth to death ratios, the total forLondon ran from 0.7 to 0.9: in the median year births were 80 per cent ofdeaths. However, this interquartile range varied from between 1.0 and 1.3in the affluent intra-mural parishes, through a range of 0.8 to 1.0 in poorerintra-mural parishes and 0.6 to 0.9 in the extra-mural parishes, to from 0.4to 0.7 in the out-parishes.19 When the out-parishes are excluded, the medianratio of births to deaths in the intra- and extra-mural parishes is 0.9 with aninterquartile range from 0.7 to 1.0.
19The relatively favourable demographic regime in the century before 1665 comparedwith the eighteenth century is also noted by Razzell (2011).
38

In other words, the spatial gradient of replacement ratios across Lon-don is markedly Malthusian, with prosperous families usually able to repro-duce themselves, outside plague years (whose impact, as we have seen, fellmarkedly in wealthier areas), while households in the poorer suburbs usuallysuffered a sharp excess of deaths over births, even in intervals between majorplagues. The ratio of births to deaths becomes more favourable in the sec-ond half of the period, from 1600 to 1639, with a median ratio of 1.1 for thewealthier parishes within the walls, 0.9 for the poorer intra- and extra-muralparishes, and 0.7 for the out-parishes.
Looking at absolute numbers across the 130 parishes, we estimate thatthe average annual deficit of deaths over births was 2,000 in the 1560s, 2,700in the 1570s, 1,500 in the 1580s, 3,800 in the 1590s, 5,100 in the 1600s, 900in the 1610s, 6,500 in the 1620s, and 1,900 in the 1630s. As a fraction ofthe average annual natural increase for England estimated by Wrigley andSchofield (1981), London’s excess mortality equalled 7 per cent of England’snatural increase in the 1560s, 8 per cent in the 1570s, 4 per cent in the 1580s,16 per cent in the 1590s, 12 per cent in the 1600s, 3 per cent in the 1610s,23 per cent in the 1620s, and 7 per cent in the 1630s.
8.2 Fall in Baptisms in Plague Years.
Faced with plague, the natural reaction of those who were able to was toflee to somewhere safer. Slack (1985, 166–169) argues that flight among theaffluent increased as the seventeenth century progressed. The extent of flightmay be gauged by the fall in baptisms. We would expect fewer baptismsin plague years because, first, pregnant mothers and newborns would die;and, secondly, some mothers would flee. Given the roughly similar mortalityincrease in the four big plagues, if we find a higher fall in births in laterplagues it would suggest increased flight.
Comparing 1625 with the more severe plague of 1603 we can see supportfor Slack’s view, with a larger fall in births despite lower mortality, indicating
39

Intra rich Intra poor Extra-m. City Out-parishes Total1563 1.1 0.8 0.8 0.9 1.3 0.91593 0.8 0.9 0.8 0.8 1.1 0.91603 0.9 0.7 0.9 0.9 1.1 0.91625 0.7 0.7 0.6 0.7 0.8 0.71636 0.8 0.9 0.9 0.9 1.0 0.91665 0.7 0.9 0.7 0.7 0.9 0.8
Table 4: Births in plague years relative to median over previous five years.
population flight. Births fall by less in poor intra-mural parishes and theextra-mural parishes in 1665 than in 1625 but the large fall in rich parishes,despite their relatively low mortality, is again consistent with a large exodusof population.
9 Conclusions.
While dramatic, the detailed demographic history of London in the late six-teenth and early seventeenth centuries has largely been a mystery. In thispaper we analysed a large sample of London parish records, allowing us toreconstruct the spatial and temporal properties of London mortality in theplague era, and to see how these responded to living standards. We foundthat mortality in the major plagues ran around five to six times normal mor-tality, while the impact of plague on richer city parishes fell through timeand its impact on suburban parishes rose. Looking at the spatial diffusion ofplague we find a consistent pattern of crisis mortality first emerging in thepoor northern suburbs of St Giles Cripplegate and Shoreditch (until 1665,when it starts in St Giles in the Fields) and spreading over the next 14 weeksaround the suburbs, and then inside the walls. Looking at the seasonality ofmortality, we found that mortality before 1665 peaks in the autumn as wewould expect with plague, but that this pattern persists for several decades
40

after the supposed disappearance of plague, especially in poorer suburbs ofthe city.
Given the magnitude of the topic, this paper is not intended as a com-prehensive or conclusive treatment of London’s demography in the centurybefore the Restoration. In particular, by making our weekly data on burials,baptisms, and marriages for the 130 parishes publicly available in a uniformformat, along with other details of the parishes, we hope to encourage othersto pursue this research further.
References
Achtman, Mark. 2012. “Insights from Genomic Comparisons of Geneti-cally Monomorphic Bacterial Pathogens.” Philosophical Transactions of theRoyal Society B: Biological Sciences 367:860–867. 19
Allen, Robert C. 2007. Prices and Wages in London and Southern England,1259–1914. http://www.nuff.ox.ac.uk/users/allen/studer/london.xls. 32
Allen, Robert C. 2009. The British Industrial Revolution in Global Perspec-tive. Cambridge: Cambridge University Press. 2
Appleby, Andrew B. 1975. “Nutrition and Disease: The Case of London,1550-1750.” Journal of Interdisciplinary History 6:1–22. 35
Appleby, Andrew B. 1980. “The Disappearance of the Plague: A ContinuingPuzzle.” Economic History Review 33:161–173. 3
Birch, T. 1759. A Collection of the Yearly Bills of Mortality. London: A.Millar. 15
Bivand, Roger S., Edzer J. Pebesma and Virgilio Gomez-Rubio. 2008. AppliedSpatial Data Analysis with R. New York: Springer. 12
41

Boulton, Jeremy. 1987. Neighbourhood and Society: A London Suburb in theSeventeenth Century. Cambridge: Cambridge University Press. 2, 5
Boulton, Jeremy. 1996. “Wage Labour in Seventeenth-century London.” Eco-nomic History Review 49:268–290. 35
Boulton, Jeremy. 2000. London 1540–1700. In The Cambridge Urban Historyof Britain, ed. Peter Clark. Vol. 2 Cambridge: Cambridge University Press.10
Boulton, Jeremy and Leonard Schwarz. 2010. “Yet Another Inquiry into theTrustworthiness of Eighteenth-Century London’s Bills of Mortality.” LocalPopulation Studies 2010(85):28–45. 5
Brett-James, Norman G. 1935. The Growth of Stuart London. London:George Allen and Unwin. 19
Champion, J.A.I. 1995. London’s Dreadful Visitation: The Social Geographyof the Great Plague in 1665. London: Historical Geography ResearchGroup. 24
Christie. 1893. Some Account of Parish Clerks, More Especially of the An-cient Fraternity (Bretherne and Sisterne) of S. Nicholas, Now Known asthe Worshipful Company of Parish Clerks. London: Privately Printed. 14
Clark, Gregory. 2007. “The Long March of History: Farm Wages, Pop-ulation, and Economic Growth, England 1209-1869.” Economic HistoryReview 60:97–135. 32
Cohn, Samuel K. 2002. “The Black Death: End of a Paradigm.” AmericanHistorical Review 107:703–738. 19
Crawfurd, Raymond. 1914. Plague and Pestilence in Literature and Art.Oxford: Oxford University Press. 19
42

Creighton, Charles. 1891. A History of Epidemics in Britain from A.D. 664to the Extinction of Plague. Cambridge: Cambridge University Press. 12,14, 15
Davenport, Romola, Jeremy Boulton and Leonard Schwarz. 2010. In-fant and Young Adult Mortality in London’s West End, 1750–1824.Working paper Newcastle University: The Pauper Lives Project.http://research.ncl.ac.uk/pauperlives/infantandchildmortality.pdf. 5
Drancourt, Michel, Linda Houhamdi and Didier Raoult. 2006. “Yersiniapestis as a Telluric, Human Ectoparasite-borne Organism.” Lancet Infec-tious Diseases 6:234–241. 19, 24
Ell, Stephen R. 1989. “Three Days in October of 1630: Detailed Examinationof Mortality during an Early Modern Plague Epidemic in Venice.” Reviewsof Infectious Diseases 11:128–139. 28
Farrington, C. P., N. J. Andrews, A. D. Beale and M. A. Catchpole. 1996.“A Statistical Algorithm for the Early Detection of Outbreaks of InfectiousDisease.” Journal of the Royal Statistical Society. Series A (Statistics inSociety) 159(3):pp. 547–563. 20
Finlay, Roger. 1981. Population and Metropolis: the Demography of London,1580-1650. Cambridge: Cambridge University Press. 2, 5, 10, 28
Finlay, Roger and Beatrice Shearer. 1986. Population Growth and SuburbanExpansion. In London 1500-1700: The Making of the Metropolis, ed. A.L.Beier and Roger Finlay. London: Longman. 5
Fisher, F. J. 1990. London and the English Economy, 1500-1700. London:Hambledon Continuum. 2
Graunt, John. 1662. Natural and Political Observations Made Upon the Billsof Mortality. London: . 12, 24, 35
43

Graunt, John. 1665. London’s Dreadful Visitation; or a Collection of All theBills of Mortality for the Present Year. London: E. Cores. 22, 24
Hancock, Thomas. 1821. Researches into the Laws and Phenomena of Pesti-lence; Including a Medical Sketch and Review of Plague of London in 1665;and Remarks of Quarantine. London: William Phillips. 18
Harding, Vanessa. 1990. “The Population of London, 1550-1700: A Reviewof the Published Evidence.” London Journal 15:111–128. 5, 6
Hohle, Michael. 2007. “surveillance: An R package for the Surveillance ofInfectious Diseases.” Computational Statistics 22:571–582. 20
Hollingsworth, M. F. and T. H. Hollingsworth. 1971. “Plague MortalityRates by Age and Sex in the Parish of St. Botolph’s without Bishopsgate,London, 1603.” Population Studies 25(131–146). 5, 28
Houhamdi, L., H. Lepidi, M. Drancourt and D. Raoult. 2006. “ExperimentalModel to Evaluate the Human Body Louse as a Vector of Plague.” Journalof Infectious Diseases 194:1589–1596. 19
Jones, P. E. and A. V. Judges. 1935. “London Population in the Late Sev-enteenth Century.” Economic History Review 6:45–63. 5
Keeling, M. J. and C. A. Gilligan. 2000. “Bubonic plague: A MetapopulationModel of a Zoonosis.” Proceedings of the Royal Society Series B 267:2219–2230. 22
Kelly, Morgan and Cormac Ó Gráda. 2013. “Living Standards and Mortalityin England since the Middle Ages.” Economic History Review . 32, 34
Kitto, J. V. 1936. The Register of St Martin-in-the-Fields, London. Part II(1619 to 1636). London: Harleian Society. 6
44

Landers, John. 1993. Death and the Metropolis: Studies in the DemographicHistory of London 1670–1830. Cambridge: Cambridge University Press.5, 6
Littledale, Willoughby A. 1902. The Registers of St Vedast, Foster Lane,1558 to 1836, and St Michael Le Quern, 1685 to 1836. Volume 1. Vol. 1Christenings London: Harleian Society. 6
Littledale, Willoughby A. 1903. The Registers of St Vedast, Foster Lane,1558 to 1836, and St Michael Le Quern, 1685 to 1836. Volume 2. Vol. 2Weddings and Burials London: Harleian Society. 6
Lorange, E A, B L Race, F Sebbane and J B Hinnebusch. 2005. “Poor vectorcompetence of fleas and the evolution of hypervirulence in Yersinia pestis.”Journal of Infectious Diseases 191:1907–1912. 19
Marshall, John. 1832. Mortality of the Metropolis. London: . 12
Mason, Thomas. 1898. A Register of Baptisms, Marriages and Burials in theParish of St Martin in the Fields, 1550-1619. London: Harleian Society. 6
Mazumder, Rahul, Trevor Hastie and Robert Tibshirani. 2010. “SpectralRegularization Algorithms for Learning Large Incomplete Matrices.” Jour-nal of Machine Learning Research 11:2287–2322. 13
Monecke, Stefan, Hannelore Monecke and Jochen Monecke. 2009. “Mod-elling the Black Death. A Historical Case Study and Implications for theEpidemiology of Bubonic Plague.” International Journal of Medical Mi-crobiology 299(8):582 – 593. 19
Murchison, Charles. 1884. A Treatise on the Continued Fevers of GreatBritain. Third ed. London: Longmans Green. 18, 30
45

Newton, Gill. 2010. “Infant Mortality Variations, Feeding Practices and So-cial Status in London between 1550 and 1750.” Social History of Medicine24:260–280. 5
Razzell, Peter. 2011. “Infant Mortality in London, 1538-1850: a Method-ological Study.” Local Population Studies 87:45–64. 38
Razzell, Peter and Christine Spence. 2007. “The History of Infant, Child anddult Mortality in London, 1550-1850.” London Journal 32:271–292. 5
Signoli, Michel, Isabelle Seguy, Jean-Noel Biraben and Olivier Dutour. 2002.“Paleodemography and Historical Demography in the Context of an Epi-demic: Plague in Provence in the Eighteenth Century.” Population (EnglishEdition) 57:829–854. 28
Slack, Paul. 1981. “The Disappearance of the Plague: An Alternative View.”Economic History Review pp. 469–476. 3, 22
Slack, Paul. 1985. The Impact of Plague in Tudor and Stuart England. Lon-don: Routledge and Kegan Paul. 2, 5, 10, 16, 39
Slack, Paul. 1989. Poverty and Policy in Tudor and Stuart England. London:Longman. 34
Southall, H.R. and N. Burton. 2004. GIS of the Ancient Parishes of Englandand Wales, 1500-1850. Colchester: . 6
Spence, Craig. 2000. London in the 1690s: A Social Atlas. London: Centrefor Metropolitan History. 5
Sutherland, Ian. 1972. When was the Great Plague? Mortality in London1563 to 1665. In Population and Social Change, ed. D. V. Glass and R.Revelle. London: Edward Arnold. 5
46

Taddy, M.A., R.B. Gramacy and N. Polson. 2011. “Dynamic Trees for Learn-ing and Design.” Journal of the American Statistical Association 106:109–123. 13
Twigg, Graham. 1993. Plague in London: Spatial and Temporal Aspects ofMortality. In Epidemic Disease in London, ed. J. A. I. Champion. WorkingPaper Series London: Centre for Metropolitan History. 24
Webb, Cliff. 2009. London and Middlesex Burials Register Indexes and theirOnline Availability. Reseach Aids 51 West Surrey Family History Society.7
Wood, Simon N. 2006. Generalized Additive Models: An Introduction withR. London: Chapman and Hall. 13
Wrigley, E. A. 1967. “A Simple Model of London’s Importance in ChangingEnglish Society and Economy 1650-1750.” Past and Present (37):pp. 44–70.2, 5
Wrigley, E. A. and R. Schofield. 1981. The Population History of England,1541–1871. London: Edward Arnold. 2, 22, 30, 39
47