1464 ieee sensors journal, vol. 18, no. 4, february 15...
TRANSCRIPT
1464 IEEE SENSORS JOURNAL, VOL. 18, NO. 4, FEBRUARY 15, 2018
An Automated Microfluidic Assay for PhotonicCrystal Enhanced Detection and Analysis
of an Antiviral Antibody CancerBiomarker in Serum
Caitlin M. Race, Lydia E. Kwon, Myles T. Foreman, Qinglan Huang, Hakan Inan, Sailaja Kesiraju,Phuong Le, Sung Jun Lim, Andrew M. Smith, Richard C. Zangar, Utkan Demirci,
Karen S. Anderson, and Brian T. Cunningham, Fellow, IEEE
Abstract— We report on the implementation of an automatedplatform for detecting the presence of an antibody biomarkerfor human papillomavirus-associated oropharyngeal cancer froma single droplet of serum, in which a nanostructured photoniccrystal surface is used to amplify the output of a fluorescence-linked immunosorbent assay. The platform is comprised of amicrofluidic cartridge with integrated photonic crystal chipsthat interfaces with an assay instrument that automates theintroduction of reagents, wash steps, and surface drying. Uponassay completion, the cartridge interfaces with a custom laser-scanning instrument that couples light into the photonic crystal atthe optimal resonance condition for fluorescence enhancement.The instrument is used to measure the fluorescence intensityvalues of microarray spots corresponding to the biomarkersof interest, in addition to several experimental controls thatverify correct functioning of the assay protocol. In this paper,we report both dose-response characterization of the systemusing anti-E7 antibody introduced at known concentrations intoserum and characterization of a set of clinical samples fromwhich results were compared with a conventional enzyme-linkedimmunosorbent assay performed in microplate format. Thedemonstrated capability represents a simple, rapid, automated,and high-sensitivity method for the multiplexed detection ofprotein biomarkers from a low-volume test sample.
Manuscript received August 8, 2017; revised November 10, 2017; acceptedNovember 11, 2017. Date of publication November 24, 2017; date of currentversion January 18, 2018. This work was supported by the National Institutesof Health under Grant 5R33CA177446-02 and Grant 5R01GM086382-03. Theassociate editor coordinating the review of this paper and approving it for pub-lication was Dr. Marco Petrovich. (Caitlin M. Race and Lydia E. Kwon con-tributed equally to this work.) (Corresponding author: Brian T. Cunningham.)
C. M. Race, M. T. Foreman, and Q. Huang are with the Departmentof Electrical and Computer Engineering, University of Illinois atUrbana–Champaign, Urbana, IL 61801 USA.
L. E. Kwon is with the Department of Bioengineering, University of Illinoisat Urbana–Champaign and College of Medicine, University of Illinois atUrbana–Champaign, Urbana, IL 61801 USA.
H. Inan and U. Demirci are with the Canary Center at Stanford for CancerEarly Detection, Stanford University, Stanford, CA 94305 USA.
S. Kesiraju and K. S. Anderson are with the Biodesign Institute, ArizonaState University, Tempe, AZ 85281 USA.
P. Le, S. J. Lim, and A. M. Smith are with the Department of Bioengineer-ing, University of Illinois at Urbana–Champaign, Urbana, IL 61801 USA.
R. C. Zangar is with the Pacific Northwest National Laboratory, Richland,WA 99354 USA.
B. T. Cunningham is with the Department of Electrical and ComputerEngineering and the Department of Bioengineering, University of Illinois atUrbana–Champaign, Urbana, IL 61801 USA (e-mail: [email protected]).
This paper has supplementary downloadable multimedia material availableat http://ieeexplore.ieee.org provided by the authors. The SupplementaryMaterial contains supplemental figures. This material is 227 KB in size.
Digital Object Identifier 10.1109/JSEN.2017.2777529
Index Terms— Automated, assay, biomarker, cancer, E7,fluorescence, human papillomavirus, immunoassay, microfluidic,oropharyngeal cancer, photonic crystal, point-of-care, serum.
I. INTRODUCTION
THE last decade has seen a heightened interest in the dis-covery of new biomarkers and the development of more
sensitive and specific biosensors for the screening, diagnosis,and monitoring of diseases at the point of care (POC). Canceris commonly diagnosed via biopsy, which is highly invasiveand impractical for serial sampling to monitor the efficacy oftreatment. Biopsy is also inadequate for the detection of cancerin the early stages, when the likelihood of a palpable tumoris lowest and positive prognosis is highest [1]–[3].
Unlike the traditional biopsy, a liquid biopsy involves thedetection of biomarkers within bodily fluids, such as blood,which can be obtained in a minimally invasive manner [4]–[6].Blood-based protein [3], [7]–[11], nucleic acid [12]–[16],and circulating tumor cell [17], [18] biomarkers continueto be identified and clinically validated. It is now widelyrecognized that panels, rather than individual biomarkers, arenecessary for accurate cancer identification and patient strati-fication [3], [4]. Integrated with a microfluidic platform, liquidbiopsies are especially suitable for testing a few droplets ofsample for multiplexed biomarker screening, early diagnosis,routine monitoring of treatment effectiveness, and regularfollow-up for detecting remission.
Low biomarker concentration (picomolar range for proteins)in a liquid biopsy, especially during early-stage cancer [3],is an important technological challenge that can be addressedby methods for achieving a lower limit of detection (LOD)and improved signal-to-noise ratio (SNR). One such approachis the protein microarray, which generally utilizes the naturalaffinity of antigen-antibody interactions in immunoassays.Furthermore, DNA [19], [20] and protein [9], [20]–[23]microarrays printed on photonic crystal (PC) surfaces canresult in signal amplification of up to 8000x compared tomicroarray assays performed on ordinary glass substrates andscanned using a conventional fluorescence reader. Thus itis desirable to integrate PC-based fluorescence amplificationtechnology into an automated platform for detecting blood-borne cancer biomarkers from a liquid biopsy [20].
1558-1748 © 2017 IEEE. Personal use is permitted, but republication/redistribution requires IEEE permission.See http://www.ieee.org/publications_standards/publications/rights/index.html for more information.
RACE et al.: AUTOMATED MICROFLUIDIC ASSAY FOR PHOTONIC CRYSTAL ENHANCED DETECTION AND ANALYSIS 1465
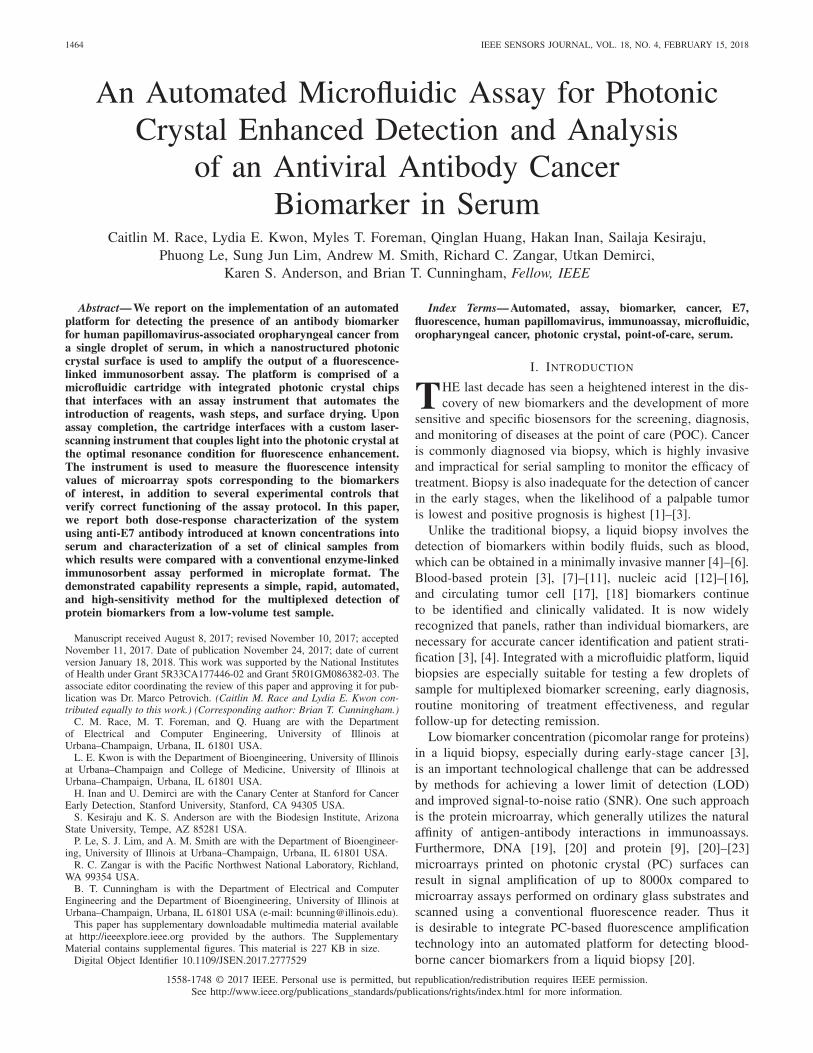
Fig. 1. (a) Schematic of the photonic crystal (PC) structure, composed of a high refractive index (RI) TiO2 layer and low RI SiO2 layer on a siliconsubstrate. (b) A 2 mm × 8 mm PC with some visible protein spots on a penny for size comparison. (c) Photo of the PC-integrated single- (left) andfour-channel (right) cartridges, with food coloring to indicate sample flow channel. Sample is introduced through the sample inlet holes, outlined in red. In thefour-channel cartridge, the center hole (purple) serves as the common inlet for reagents once connected to the automated flow system. Scale bar = 10 mm.(d) Exploded view of the four-channel microfluidic cartridge. Clear = acrylic, Blue = double-sided adhesive (DSA) layers (thickness = 150 µm), Orange =2 mm × 8 mm × 725 µm PC, Gray = glass coverslip. (e) Schematic view of assembled four-channel cartridge.
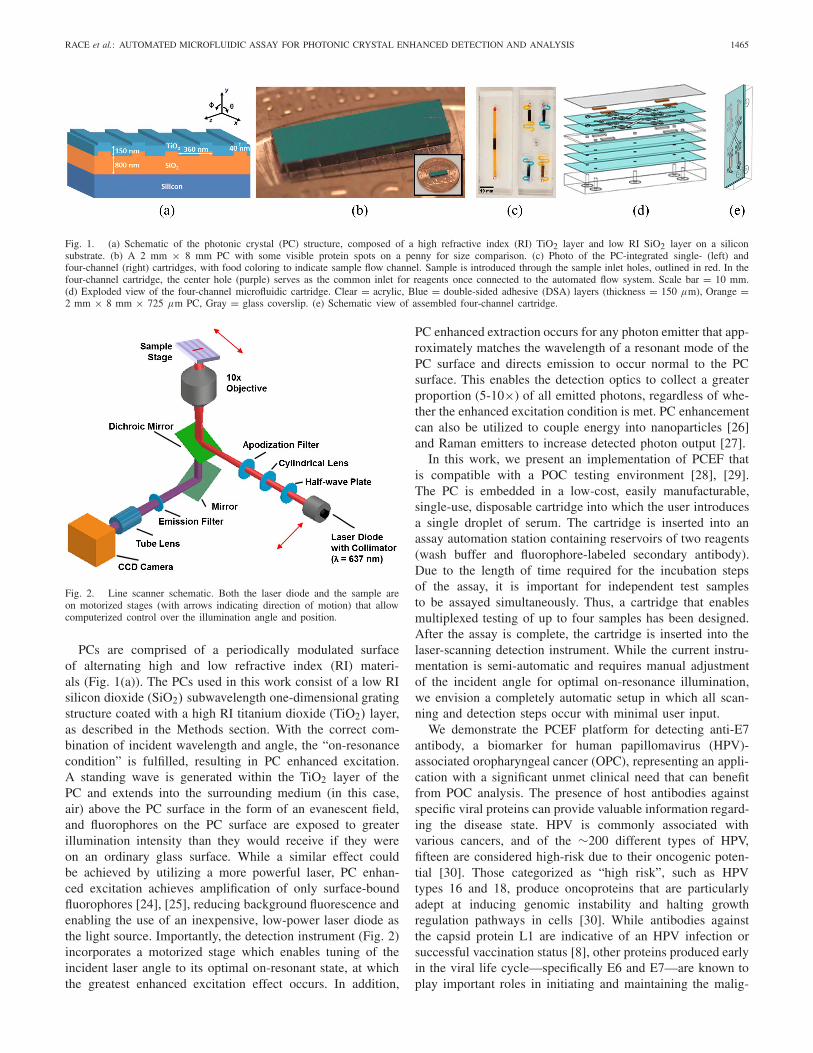
Fig. 2. Line scanner schematic. Both the laser diode and the sample areon motorized stages (with arrows indicating direction of motion) that allowcomputerized control over the illumination angle and position.
PCs are comprised of a periodically modulated surfaceof alternating high and low refractive index (RI) materi-als (Fig. 1(a)). The PCs used in this work consist of a low RIsilicon dioxide (SiO2) subwavelength one-dimensional gratingstructure coated with a high RI titanium dioxide (TiO2) layer,as described in the Methods section. With the correct com-bination of incident wavelength and angle, the “on-resonancecondition” is fulfilled, resulting in PC enhanced excitation.A standing wave is generated within the TiO2 layer of thePC and extends into the surrounding medium (in this case,air) above the PC surface in the form of an evanescent field,and fluorophores on the PC surface are exposed to greaterillumination intensity than they would receive if they wereon an ordinary glass surface. While a similar effect couldbe achieved by utilizing a more powerful laser, PC enhan-ced excitation achieves amplification of only surface-boundfluorophores [24], [25], reducing background fluorescence andenabling the use of an inexpensive, low-power laser diode asthe light source. Importantly, the detection instrument (Fig. 2)incorporates a motorized stage which enables tuning of theincident laser angle to its optimal on-resonant state, at whichthe greatest enhanced excitation effect occurs. In addition,
PC enhanced extraction occurs for any photon emitter that app-roximately matches the wavelength of a resonant mode of thePC surface and directs emission to occur normal to the PCsurface. This enables the detection optics to collect a greaterproportion (5-10×) of all emitted photons, regardless of whe-ther the enhanced excitation condition is met. PC enhancementcan also be utilized to couple energy into nanoparticles [26]and Raman emitters to increase detected photon output [27].
In this work, we present an implementation of PCEF thatis compatible with a POC testing environment [28], [29].The PC is embedded in a low-cost, easily manufacturable,single-use, disposable cartridge into which the user introducesa single droplet of serum. The cartridge is inserted into anassay automation station containing reservoirs of two reagents(wash buffer and fluorophore-labeled secondary antibody).Due to the length of time required for the incubation stepsof the assay, it is important for independent test samplesto be assayed simultaneously. Thus, a cartridge that enablesmultiplexed testing of up to four samples has been designed.After the assay is complete, the cartridge is inserted into thelaser-scanning detection instrument. While the current instru-mentation is semi-automatic and requires manual adjustmentof the incident angle for optimal on-resonance illumination,we envision a completely automatic setup in which all scan-ning and detection steps occur with minimal user input.
We demonstrate the PCEF platform for detecting anti-E7antibody, a biomarker for human papillomavirus (HPV)-associated oropharyngeal cancer (OPC), representing an appli-cation with a significant unmet clinical need that can benefitfrom POC analysis. The presence of host antibodies againstspecific viral proteins can provide valuable information regard-ing the disease state. HPV is commonly associated withvarious cancers, and of the ∼200 different types of HPV,fifteen are considered high-risk due to their oncogenic poten-tial [30]. Those categorized as “high risk”, such as HPVtypes 16 and 18, produce oncoproteins that are particularlyadept at inducing genomic instability and halting growthregulation pathways in cells [30]. While antibodies againstthe capsid protein L1 are indicative of an HPV infection orsuccessful vaccination status [8], other proteins produced earlyin the viral life cycle—specifically E6 and E7—are known toplay important roles in initiating and maintaining the malig-

1466 IEEE SENSORS JOURNAL, VOL. 18, NO. 4, FEBRUARY 15, 2018
Fig. 3. (a) Schematic of protein microarray printed on the 2 mm × 8 mm PC surface. (b) Bright-field microscope image of protein microarray beforewashing unbound proteins, where the red region corresponds to the area scanned with the line scanner, with the vertical laser line moving in the direction ofthe red arrow. (c) Schematic of fluorescence-linked immunosorbent assay (FLISA). ① Human serum was manually pipetted into the microfluidic cartridge andincubated for three hours. ② Phosphate buffered saline with Tween 20 (PBST) was flowed in for 30 s at 30 mBar. ③ Alexa Fluor 647-conjugated secondaryantibody was incubated for 1 hour. ④ PBST was followed by drying with N2 gas. (d) Fluorescence intensity image obtained using the PCEF laser line scanner.(e) Result of the automated spot-finding algorithm. Protein columns for (b, d, e) are as follows: ① AF-SA, ② - ④ Protein A/G, ⑤ cE2 protein, ⑥ GST,⑦ E7 protein, ⑧ BSA, and ⑨ representative background. Columns 5 and 6 were not evaluated here.
nant transformation of host cells, including the degradation oftumor suppressors p53 and Rb [30]. 40-80% of OPC caseshave been attributed to HPV, and of these, up to 90% arecaused by HPV16 [31]. Importantly, 63-69% of OPC caseshave been demonstrated to be seropositive for HPV16 E7, withIgG antibodies to either E6 or E7 detected in less than 4%of healthy controls [7], [32], [33]. The identification ofHPV association is clinically important, as the recommendedtherapy will be partially determined by HPV exposure, andHPV-OPC patients have a better prognosis than non-HPV-associated OPC patients [31]. Here, we focus on using thePCEF assay platform to detect anti-E7 IgG antibodies inspiked serum samples and in clinical samples with unknownanti-E7 antibody concentration to demonstrate its potential usein clinical diagnostic applications.
II. METHODS
A. Preparation of the Photonic Crystal Sensorin Disposable Cartridges
PCs with a 40 nm grating depth, 360 nm period, 36% dutycycle, and 150 nm-thick, high refractive index (RI) TiO2 layeratop an 840 nm-thick low RI SiO2 layer (Fig. 1(a)) werefabricated on 8-inch-diameter silicon wafers and diced into2 mm × 8 mm pieces (Fig. 1(b)) for incorporation withinsingle- and four-channel microfluidic cartridges (Fig. 1(c))as described previously [20], [22]. Fabrication upon siliconwafers using tools and methods that are conventional forintegrated circuit manufacturing assures a high degree of intra-PC uniformity and reproducibility between independent PCswithin a wafer and between wafers. All PCs have a resonant
wavelength near 628 nm, with a bandwidth of ∼2 nm, anda resonant reflection efficiency of ∼80%. The devices aredesigned for utilization in an air environment, and resonantreflection spectra have been reported previously [20].
In preparation for deposition of capture proteins, thePCs were treated with (3-glycidyloxypropyl)trimethoxysi-lane (GPTMS) using a vapor-phase silanization process,as follows: PCs were sonicated sequentially in acetone,isopropanol, and ultrapure water for two minutes each, driedwith N2, and then heated in an oven at 80°C for 10 minutes.PCs underwent oxygen plasma treatment for 2 minutes at100 W and 0.75 mTorr. Plasma treated PCs were immediatelyplaced in a closed glass container with GPTMS under nitrogenand incubated overnight (12-16 hours) in a vacuum ovenat 80°C and 30 Torr. After silanization, the PCs were sequen-tially sonicated in toluene, methanol, and ultrapure water fortwo minutes each, dried with N2, and stored for up to a monthunder vacuum prior to protein microarray printing.
The protein microarray consists of ten rows of each pro-tein column (shown schematically in Fig. 3(a)): 50 µg/mLAlexa Fluor 647 conjugated streptavidin (AF-SA, posi-tive control); 160 µg/mL bovine serum albumin (BSA, nega-tive control); 12.5, 25, and 50 µg/mL Protein A/G(experimental control); and 457.6 µg/mL protein E7 (preparedby the Anderson Lab at Arizona State University, ASU [34]).Protein microarrays were printed in-house using a non-contactprinter (GeSiM Nano-Plotter 2.1) with piezoelectric pipettingtips (Nano-Tip A-J, designed for dispensing 0.25 nL droplets).Printing was performed in an enclosed environment at ambienttemperature (24-28°C) and 60% relative humidity. Proteinswere incubated overnight under these same conditions, allow-
RACE et al.: AUTOMATED MICROFLUIDIC ASSAY FOR PHOTONIC CRYSTAL ENHANCED DETECTION AND ANALYSIS 1467
ing the formation of covalent bonds between the amines ofthe proteins and the epoxy functional groups on the silanizedPC. The protein microarrays were then imaged using a bright-field microscope (Fig. 3(b)) and dried in the desiccator for atleast 10 minutes to minimize spot smearing. The PCs wereblocked with 1% casein in 1× PBS (Bio-Rad) for one hour toinhibit nonspecific binding. PCs were transferred into 1× PBS(Sigma-Aldrich), removed after 10 minutes, dried with N2, andstored in a sealed, desiccated container at 4°C.
A custom-designed alignment press was used to assemble25 mm × 75 mm × 8 mm single-channel and four-channelcartridges from layers of laser-machined acrylic of varyingthicknesses and double-sided adhesive (DSA; 3M, #8212) ofapproximately 150 µm thickness. The cartridges are com-posed of: (1) a ¼-inch acrylic base layer, (2) three connectiveDSA layers, (3) a 1/32-inch PC cavity layer, and (4) a flowlayer composed of two DSA layers (Fig. 1(d, e)). PCs withprotein microarrays were inserted into the assembled cartridge,and the top was sealed with a 0.170 mm glass coverslip withminimal autofluorescence (Schott NEXTERION) immediatelybefore performing the assay.
B. Fluorescence-Linked Immunosorbent Assay (FLISA)in the Automated Microfluidic Platform
The fluorescence-linked immunosorbent assay (FLISA) wasperformed in the microfluidic cartridges as shown in Fig. 3(c).For the dose-response assays, 6 µL of a twenty-fold dilutionof human male AB serum (Sigma-Aldrich) in PBS spiked withknown concentrations of mouse anti-E7 antibody (Santa CruzBiotechnology) was manually pipetted into each of the foursample inlet holes in the four-channel cartridge. Forty clinicalsamples which had previously been approved for clinicaltesting as part of the HOTSPOT study (IRB-36563) [35]were provided by the Anderson Lab (ASU). Assays on theclinical samples were performed in single-channel cartridgeswith 10 µL of twenty-fold dilutions of the clinical samplein PBS.
The test sample was introduced by micropipette into theinlet hole of the microfluidic cartridge, where capillary actiondrew the liquid to cover the PC surface. Following a 3-hr incu-bation of the sample at room temperature, the cartridgeswere connected to an automated setup for controlled flow ofreagents. To wash away unbound material from the serumsample, PBS-Tween 20 (PBST, Sigma-Aldrich) was flowedfor 30 s at 30 mBar, followed by N2 gas for 10 s at 50 mBar,and flow-through of secondary antibody tagged with AlexaFluor 647 (Jackson ImmunoResearch) for 20 s at 30 mBar.The secondary antibody, used to label the captured analytes,was comprised of one of the following: (1) A 1:1 mix-ture of 1 µg/mL goat anti-mouse antibody (for detectingspiked mouse anti-E7 antibody) and 1 µg/mL goat anti-humanantibody (for detecting unidentified human antibodies boundto Protein A/G spots), used for the dose-response assaysand (2) 1 µg/mL goat anti-human antibody, used for assaysperformed on clinical samples. PCs were incubated with thesecondary antibody solution for 1 hour at room temperature,followed by automated flow of PBST for 30 s at 30 mBar.
PCs were then dried with N2 flowing through the channel for4 minutes. Finally, cartridges were removed, covered in foil,and stored in a desiccator at room temperature for at least twohours, until scanned.
C. Laser Line-Scanning Detection Instrument
The laser line-scanning instrument, shown schematicallyin Fig. 2, incorporates an apodization filter into the opticalpath after the cylindrical lens. The laser line has a Gaussianprofile as measured along the length of the scan line, whichresults in non-uniform illumination of the fluorescent spotsacross the width of the chip, as spots in the center of theline receive approximately 2× greater intensity than spotsdisplaced only 200 µm from the center. The consequence ofthis non-uniform illumination is a large standard deviation ofspot intensities of replicate assay spots. The apodization filterpartially attenuates the center of the scan line, resulting inmore uniform illumination and ensuring that the fluorescenceintensity at the line edge is similar to the fluorescence intensityat the center (Supp. Fig. 1(a)). The apodization filter wasfabricated by depositing a thin 12 nm layer of gold, 4 mmin diameter, at the center of an optically transparent glassplate (Supp. Fig. 1(b)).
The surface of the PC was scanned using the custom-designed laser line-scanning instrument to capture images ofthe fluorescently tagged protein spots (Fig. 3(d)). Importantly,the instrument is able to precisely adjust the incident angleof the laser illumination via motor-controlled linear translationof the distal end of the optical fiber that supplies light to thePC. The focal point of the cylindrical lens is at the back focalplane of the objective lens, so linear translation of the fiber tipresults in modulation of the angle of light incident on the PCsurface. In our system, a 500 µm linear translation of the fiberend results in an approximately 1.59° modulation of the angleof incidence, and the angle can be controlled with 0.025 degreeaccuracy.
To initiate the scanning process, the PC resonance angleat the anti-E7 spots was measured directly by scanning theincident angle from 0 to 8 degrees. Anti-E7 spots near the edgeof the PC were used for this procedure so as not to photobleachthe spots that are later scanned for analysis and quantification.The on-resonance angle of the anti-E7 spots, at which maxi-mum fluorescence intensity is emitted, was recorded. Then, thesample stage was translated to an unscanned area of the chipto perform an on-resonance scan followed by an off-resonancescan (at an incident angle of 8°). On- and off-resonance scansare performed in the same area, encompassing 3-4 rows percolumn of printed protein spot on the PC surface, to estimatethe enhancement factor contributed by the enhanced excitationmechanism.
The pixel size of the CCD camera is approximately16 µm × 16 µm. After 10× magnification, this equates to a1.6 µm × 1.6 µm square region of the sample, so images weregathered at 2 µm increments in the direction perpendicularto the laser line. A sliding window algorithm combines thefluorescence intensities of five consecutive scan lines perlocation to generate a single fluorescence intensity image of

1468 IEEE SENSORS JOURNAL, VOL. 18, NO. 4, FEBRUARY 15, 2018
the surface. In other words, although the pixel width in thescan direction is only 2 µm, we capture a 10 µm imageto get fluorescence information for 2 pixels away from thecenter in either direction. This ensures that we get the bestestimate of fluorescence output due to the Gaussian intensitydistribution of the laser intensity in the direction perpendicularto the scanning line.
To perform data analysis on the fluorescence intensityimages, we have implemented an automated algorithm to findand analyze the spots (Fig. 3(e)). The algorithm uses Bernsenfiltering and watershedding to identify local differences inintensity and to separate any unintended “satellite spots”(smaller, residue spots formed when more than one dropletis expelled from the printer tip during protein microarrayprinting) from the main printed protein spots [36]. Spots arealso filtered by size and shape to exclude non-elliptical objectsand background artifacts. This algorithm takes as input theraw fluorescence intensity data and outputs spot statistics,including median intensity, standard deviation, and averageintensity of each column of spots. Each column representseither the positive control, negative control, experimentalcontrol, or target biomarker.
A representative blank area of the PC is selected to deter-mine the background intensity, and its median intensity issubtracted from the median intensity of the correspondingprotein spot, thereby accounting for vertical variations in thePC or in the laser line illumination. This method provides min-imum covariance between spots, compared to other statisticalanalysis methods (e.g., average or maximum spot intensity,excluding background subtraction) [37]. The enhanced exci-tation factor, defined as the on-resonance intensity divided bythe off-resonance intensity per assay column, is computedby averaging each background-subtracted spot column andprovides insight as to how accurately the on-resonance anglehas been determined.
III. RESULTS AND DISCUSSION
A. Validating the Method for Finding On-Resonance Angle
To validate our method of finding the on-resonance angle,we used semiconductor quantum dots (QDs) to quantifythe output intensity at incremental deviations from whatwe determined to be the optimal resonance angle. QDs donot photobleach as quickly as organic fluorophores, enablingrepeated scanning of the PC with a relatively stable emittedlight intensity between subsequent scans. Even though thewavelength of the 637 nm laser in the scanning setup is notthe optimal excitation wavelength for QDs, it is sufficientlywithin their excitation spectrum to cause them to emit adetectable signal. We obtained the on-resonance angle fordifferent concentrations of the anti-E7 antibody and measuredthe fluorescence intensity at angles near the on-resonanceangle (Supp. Fig. 2). The background-subtracted QD intensityis always maximized at the on-resonance angle, with theintensity decreasing as the incident angle deviates from theresonance condition. While intensity is largest at the reso-nance condition, the decay on either side is asymmetric. Thisdiscrepancy can be explained by the order in which these
scans at different angles were performed, as the QDs graduallyphotobleach (significant decrease in intensity could not bedetected after 3 minutes of continuous illumination) [38]. ThePCs were first scanned at the on-resonance condition, followedby −0.2°, then +0.2°, then −0.4°, and finally +0.4° awayfrom the on-resonance condition.
B. System Automation for Rapid Disease ScreeningThe assay workflow was devised to make the entire system
automated and amenable to rapid processing for POC assays.The cartridge presented here is capable of testing four samplessimultaneously and may be expanded to many more. Theability to multiplex samples decreased the time required to runbatches of samples by approximately 7-10 minutes for eachadditional sample. A four-channel cartridge holder incorpo-rating flanged tubing and press-fit connections was designedto interface with the cartridge and automated flow system.The use of laser-cut acrylic is cost-effective ($0.62/cartridge)for single-use disposable applications, especially compared to3D-printed cartridges ($5/cartridge).
The automated spot-finding and analysis algorithm des-cribed in the Methods section reduced both data analysis timeand user bias. Our algorithm ensures that all spots are analyzedin the same manner and that comparison between differentdata sets is statistically valid. While other groups have reportedspot-finding algorithms [39], ours is specifically applicable forfluorescence assays, which includes distinguishing main spotsfrom satellite spots while tolerating non-uniformity in spotsize, location, and spacing on the PC surface.
C. Dose-Response CharacterizationA dose-response curve for anti-E7 antibody spiked into
serum was generated for concentrations ranging from 1 ng/mLto 1000 ng/mL (6.7 pM to 6.7 nM) for both on- and off-resonance conditions. Intensities obtained from calibrationtests performed on different days were compared to each otherby normalizing to the intensity at 100 ng/mL anti-E7 antibodyon the corresponding day. A comparison of the on- and off-resonance calibration curves (Fig. 4) demonstrates the abilityof the enhanced excitation phenomenon at on-resonance tobring spot intensities above the LOD to detect spots that other-wise would be classified as undetectable. While spot intensitiesfor samples below 10 ng/mL are below the noise (defined as3 standard deviations above the background) at off-resonance,the fluorescence enhancement of the on-resonance conditionbrings the spot intensities clearly above the numerical LODat 10 ng/mL and even allows the spots to be visually detectableat 1 ng/mL (Fig. 4 inset). Due to signal saturation as a resultof the enhancement, the sigmoidal curve begins to plateausooner—between 100 and 250 ng/mL—in the on-resonancecondition, while the off-resonance calibration curve does notappear to plateau within the range of tested concentrations.Furthermore, the approximate linear range of the on-resonancecondition is narrower and spans the lower end of concentra-tion values, ranging between 25 and 200 ng/mL, while thelinear range at the off-resonance condition is broader butspans the higher end of the concentration values (approx-imately 100-500 ng/mL). By scanning a sample at both

RACE et al.: AUTOMATED MICROFLUIDIC ASSAY FOR PHOTONIC CRYSTAL ENHANCED DETECTION AND ANALYSIS 1469
Fig. 4. Dose-response curves obtained at (a) off-resonance and(b) on-resonance conditions for concentrations ranging from 1 ng/mLto 1 µg/mL of anti-E7 antibody. Intensities were normalized to the 100 ng/mLfor each assay date. Insets show the line-scan images of the anti-E7 spots for1, 10, and 100 ng/mL. Error bars represent ±1 standard deviation.
on- and off-resonance conditions, the platform could poten-tially quantify concentrations between 25 and 500 ng/mL(0.17-3.33 nM) of the target antibody in a sample, whiledetecting concentrations as low as 1 ng/mL (6.7 pM).
In addition to increasing the spot intensity, the on-resonancecondition results in higher noise as intrinsic variability inthe assay is amplified, resulting in varying enhancementfactors (Supp. Fig. 3) and larger error bars at on-resonancecompared to those at off-resonance. This intrinsic variabilityis predominantly caused by variations in spot density thatoccur during the drying process, called the coffee-ring effect,where the center has a lower protein density and a higherdensity ring is formed on the edge of the spot. The PC issensitive to these variations, meaning that the on-resonancecondition is either for the center or outer part of the ring, butnot both. Additionally, non-specific binding introduces back-ground noise that we were not successfully able to eliminateon these samples.
D. Clinical Samples
A total of forty clinical samples (gathered from 20 OPCpatients and 20 healthy controls) were assayed using the PCEFplatform at on- and off-resonance. Conventional ELISAs wererun concurrently on aliquots of the same samples by theDemirci Lab (Stanford University) [34]. Our goal here wasto evaluate the diagnostic capability of the PCEF platform
to provide positive/negative discrimination of the presence ofanti-E7 antibody, rather than to assess the clinical relevanceof the antigen-antibody interaction of protein E7 and anti-E7antibody in OPC patients. Therefore, the ELISA—an estab-lished diagnostic method—was chosen as the gold standardreference.
All OPC patient samples, plus three control samples, haddetectable anti-E7 antibody when tested with ELISA, resultingin a total of 23 positive ELISA samples and 17 negative ELISAsamples. Samples were filtered out of the final analysis ifany inconsistencies (i.e., low positive control spot intensityor enhanced background instead of target spot) were presentin the raw PCEF images and/or intensity values, reducingthe final sample size from 40 to 31 (14 ELISA-positive and17 ELISA-negative).
Receiver-Operator Characteristic (ROC) curves were gen-erated based on the normalized spot intensities for bothon- and off-resonance conditions from this final set of data,as shown in Fig. 5(a, b). As mentioned previously, the averagesof the background-subtracted median spot intensities werenormalized by the averaged background-subtracted medianspot intensity for serum spiked with 100 ng/mL anti-E7antibody, which served as a positive control for each batchof tests. The area under the curve (AUC) was 0.83 and 0.76 atoff- and on-resonance, respectively, with an optimal specificityof 0.71 at a sensitivity of 0.79 for both off- and on-resonanceconditions. Based on this specificity-sensitivity pair, the cutoffintervals were determined to be [0.20, 0.32) and [0.57, 0.61)for off- and on-resonance, respectively. In other words, sam-ples with normalized intensity values greater than or equalto 0.32 were considered positive, while those with normalizedintensity values less than 0.20 were considered negative atoff-resonance. Similarly, at on-resonance, samples with nor-malized intensity greater than or equal to 0.61 were consideredpositive, while those less than 0.57 were considered negative.The cutoff range is relatively large at off-resonance due tothe limited number of samples and the tendency for thevalues to be clustered at the lower range at the off-resonancecondition (Fig. 5(c)). However, the range is much smaller aton-resonance, which tends to enhance the signal such that thevalues are spread out toward the upper range (Fig. 5(d)).
In almost all cases, the fluorescence intensity of theanti-E7 antibody spots was enhanced to a visible level atthe on-resonance condition. The samples were enhanced vari-ably between the off- and on-resonance conditions, with anenhanced excitation factor ranging between 10× and 25× formost samples, and up to 100-200× in a few cases. (Note thatthe enhanced extraction factor of ∼10× is always active.)The intensities are noticeably higher at on-resonance comparedto those at off-resonance, hence several samples which wereconsidered negative at off-resonance became positive whenmeasured at the on-resonance angle.
While Supp. Table I tabulates the results from all theacceptable samples, Fig. 5(e) shows the off- and on-resonanceE7 spot images obtained with PCEF, compared to the ELISAresults and OPC status of select samples. Samples 1 and 2 rep-resent those samples in which both the off- and on-resonanceresults correlated with both the ELISA and OPC status.

1470 IEEE SENSORS JOURNAL, VOL. 18, NO. 4, FEBRUARY 15, 2018
Fig. 5. Results from 14 ELISA-positive and 17 ELISA-negative clinical samples. (a, b) Receiver-operator characteristic (ROC) curves for off-resonance andon-resonance conditions, using normalized spot intensities. Optimal specificity = 0.71 and sensitivity = 0.79 selected for further analysis. AUC = area under thecurve (c, d) Scatter plot of background-subtracted intensity values before normalization for off-resonance and on-resonance. Bars show average ±1 standarddeviation. Dotted line indicates the cutoff intensity value (1.7865 × 10³ and 8.347 × 10⁴ for off- and on-resonance, respectively). (e) PCEF results atoff- and on-resonance, compared to ELISA results and OPC status for select samples, ① through ⑨, representing different variations in agreement betweenPCEF and ELISA results.
Samples 3 through 9 represent samples in which there werediscrepancies between the quantitative PCEF results and theELISA status. More specifically, samples 3 through 5 indicateinstances where at least one PCEF result (off- or on-resonance)was positive for an ELISA-negative sample. Overall, the highrate of false positives (29%) may be attributed to the increasedability of the PCEF system to enhance the signal intensity,perhaps indicating a higher sensitivity than the ELISA.Meanwhile, samples 6 through 9 represent cases in whichat least one PCEF result was negative for an ELISA-positivesample. Sample 9 is the one case in which both PCEF resultswere negative for an ELISA-positive sample. When treatedseparately, the false negative rate was 14% for both theoff-resonance and on-resonance conditions. However, whenthe two results are combined such that any sample found to beabove the cutoff range for either off- or on-resonance is con-sidered to be positive, the false negative rate decreases to 7%,while the false positive rate increases to 41% (correspondingto 59% specificity and 92% sensitivity).
Furthermore, a qualitative (rather than quantitative) analysisby visual inspection of the on-resonance images at a fixedintensity range from 0 to 3.2×10⁵ arbitrary units (A.U.) showsall of the ELISA-positive samples to be positive, resulting in asensitivity of 1.0 (but specificity of 0.12). A similar qualitativeanalysis of the off-resonance images at a fixed range from 0 to1.0 × 105 A.U. results in a specificity of 0.76 and sensitivityof 0.64. As seen with sample 9, a relatively high backgroundcan result in a low numerical value, so that it is found to bebelow the cutoff value in a quantitative analysis, even thoughit is clearly visible in a qualitative analysis.
The detection of anti-E7 antibody in the plasma samples ofhealthy controls in the “false positive” cases discussed abovecan be attributed to the fact that these biomarkers may bedetected in the blood serum before the tumor has taken adetectable form. Of the possible biomarkers for HPV16, thelate proteins such as L1 and L2 are detectable in patients whohave HPV16, whether it is currently active or not. It has beenhypothesized that the early proteins, such as E7, may be moreindicative of a cancer-related HPV infection, because theseproteins are produced in the cytoplasm of cells and are notreadily exposed to the blood. However, as long as an infectedcell undergoes apoptosis or necrosis, antibodies against theprotein may still be detected in the blood independent ofthe presence of a tumor, potentially explaining the detectionof anti-E7 antibody in the serum of OPC-negative healthycontrols. However, the enhanced fluorescence mechanism ofour assay increased the false positive rate, and the resultssuggest that the anti-E7 antibody may not be as promisingfor the clinical diagnosis of HPV-OPC as initially expected.
IV. CONCLUSION
Technologies for understanding disease pathogenesis, moni-toring disease progression, and determining treatment efficacyare important for prompt diagnosis and improved prognosisof diseases, particularly cancer. Diagnostic tools best suitedfor this purpose are simple, rapid, and automated, with theability to detect multiple targets in a biomarker panel froma low sample volume extracted through a minimally invasivemethod such as a finger-prick. In this work, we presented afluorescence-based platform combining automated microflu-

RACE et al.: AUTOMATED MICROFLUIDIC ASSAY FOR PHOTONIC CRYSTAL ENHANCED DETECTION AND ANALYSIS 1471
idic assay instrumentation with a photonic crystal resonancecoupling system that significantly reduces user error, decreasestesting time, and has the potential for multiplexed biomarkerpanel detection. The potential for the PCEF assay system tobe used in clinical applications was demonstrated by a dose-response characterization and clinical sample testing fromsingle droplets of serum for anti-E7 antibody, a potentialbiomarker for HPV-OPC. An estimated combined linear rangeof 25-500 ng/mL (0.17-3.33 nM) was demonstrated when thedose-response of both off- and on-resonance conditions wasconsidered, while concentrations as low as 1 ng/mL (6.7 pM)were visually detectable at on-resonance. In particular, thePCEF assay system was compared to the conventional ELISAtest and has been shown to be able to bring undetectable spotsat the off-resonance condition and in the ELISA above thedetectable range. The current system, with its combined 7%false negative rate and 41% false positive rate, could serveas a useful tool for early screening, with semi-quantitativeresults placing clinical samples as either positive, negative,or indeterminate if the values lay within the cutoff interval.
The system can be further characterized and improved tomake it more suitable for use as a quantitative diagnostictool, which requires higher specificity. The protein microarraycapability in the assay workflow can incorporate additionalclinically relevant proteins in a protein biomarker panel tofurther improve the specificity of the system for diseases suchas HPV-OPC. Furthermore, while the LOD achievable with thePCEF platform may be unnecessarily low for serum anti-E7antibody—the clinically relevant range of which was shown tobe in the high pM to low nM range via ELISA—this platformis easily adaptable to other diseases with significantly lowbiomarker concentrations.
ACKNOWLEDGMENTS
The authors thank Dr. Weili Chen for fabricating theapodization filter, Ted Lao for implementing the watersheddingalgorithm, and Austin Stilger for assembling the microfluidiccartridges. The authors also thank the staff at the Microand Nanotechnology Laboratory and colleagues from theNano Sensors Group at the University of Illinois at Urbana-Champaign for their suggestions and helpful discussions.
REFERENCES
[1] J. D. Brooks, “Translational genomics: The challenge of developingcancer biomarkers,” Genome Res., vol. 22, pp. 183–187, Feb. 2012.
[2] L. Wu and X. Qu, “Cancer biomarker detection: Recent achievementsand challenges,” Chem. Soc. Rev., vol. 44, pp. 2963–2997, May 2015.
[3] J. F. Rusling, C. V. Kumar, J. S. Gutkind, and V. Patel, “Measurementof biomarker proteins for point-of-care early detection and monitoringof cancer,” Analyst, vol. 135, pp. 2496–2511, Oct. 2010.
[4] G. Brock, E. Castellanos-Rizaldos, L. Hu, C. Coticchia, and J. Skog,“Liquid biopsy for cancer screening, patient stratification and monitor-ing,” Trans. Cancer Res., vol. 4, pp. 280–290, Jun. 2015.
[5] I. A. Cree, “Liquid biopsy for cancer patients: Principles and practice,”Pathogenesis, vol. 2, nos. 1–2, pp. 1–4, 2015.
[6] N. Karachaliou, C. Mayo-de-Las-Casas, M. A. Molina-Vila, andR. Rosell, “Real-time liquid biopsies become a reality in cancer treat-ment,” Ann. Trans. Med., vol. 3, p. 36, Mar. 2015.
[7] K. S. Anderson et al., “Souza, A. B. Riemer, J. Lorch, R. Haddad,“Serum antibodies to the HPV16 proteome as biomarkers for head andneck cancer,” Brit. J. Cancer, vol. 104, pp. 1896–1905, Jun. 2011.
[8] R. Ewaisha, I. Meshay, J. Resnik, B. A. Katchman, andK. S. Anderson, “Programmable protein arrays for immunoprofilingHPV-associated cancers,” Proteomics, vol. 16, pp. 1215–1224,Apr. 2016.
[9] C.-S. Huang et al., “Application of photonic crystal enhanced flu-orescence to cancer biomarker microarrays,” Anal. Chem., vol. 83,pp. 1425–1430, Feb. 2011.
[10] C. E. Jackson et al., “The incremental prognostic and clinical value ofmultiple novel biomarkers in heart failure,” Eur. J. Heart Fail, vol. 18,pp. 1491–1498, Apr. 2016.
[11] K. Lawrenson et al., “Identification of novel candidate biomarkersof epithelial ovarian cancer by profiling the secretomes of three-dimensional genetic models of ovarian carcinogenesis,” Int. J. Cancer,vol. 137, pp. 1806–1817, Oct. 2015.
[12] C. Bettegowda et al., “Detection of circulating tumor DNA in early- andlate-stage human malignancies,” Sci. Trans. Med., vol. 6, p. 224ra24,Feb. 2014.
[13] S.-J. Dawson et al., “Analysis of circulating tumor DNA to mon-itor metastatic breast cancer,” New England J. Med., vol. 368,pp. 1199–1209, Mar. 2013.
[14] T. M. Kichukova, N. T. Popov, H. Y. Ivanov, and T. I. Vachev,“Circulating microRNAs as a novel class of potential diagnostic bio-markers in neuropsychiatric disorders,” Folia Med., vol. 57, pp. 159–172,Jul./Dec. 2015.
[15] R. J. A. Nilsson et al., “Blood platelets contain tumor-derived RNAbiomarkers,” Blood, vol. 118, pp. 3680–3683, Sep. 2011.
[16] N. Vatandoost et al., “Early detection of colorectal cancer: Fromconventional methods to novel biomarkers,” J. Cancer Res. Clin. Oncol.,vol. 142, pp. 341–351, Feb. 2016.
[17] A. Alva et al., “Circulating tumor cells as potential biomarkers in bladdercancer,” J. Urol., vol. 194, pp. 790–798, Sep. 2015.
[18] M. Ilie et al., “‘Sentinel’ circulating tumor cells allow early diagnosisof lung cancer in patients with chronic obstructive pulmonary disease,”PLoS ONE, vol. 9, no. 10, p. e111597, 2014.
[19] P. C. Mathias et al., “Improved sensitivity of DNA microarraysusing photonic crystal enhanced fluorescence,” Anal. Chem., vol. 82,pp. 6854–6861, Aug. 2010.
[20] S. George et al., “Sensitive detection of protein and miRNA cancerbiomarkers using silicon-based photonic crystals and a resonance cou-pling laser scanning platform,” Lab Chip, vol. 13, pp. 4053–4064,Oct. 2013.
[21] S. I. Jones, Y. Tan, M. Shamimuzzaman, S. George, B. T. Cunningham,and L. Vodkin, “Direct detection of transcription factors in cotyle-dons during seedling development using sensitive silicon-substrate pho-tonic crystal protein arrays,” Plant Physiol., vol. 167, pp. 639–649,Mar. 2015.
[22] Y. Tan, T. Tang, H. Xu, C. Zhu, and B. T. Cunningham, “High sensitivityautomated multiplexed immunoassays using photonic crystal enhancedfluorescence microfluidic system,” Biosensors Bioelectron., vol. 73,pp. 32–40, Nov. 2015.
[23] P. C. Mathias, N. Ganesh, and B. T. Cunningham, “Application ofphotonic crystal enhanced fluorescence to a cytokine immunoassay,”Anal. Chem., vol. 80, pp. 9013–9020, Dec. 2008.
[24] N. Ganesh, P. C. Mathias, W. Zhang, and B. T. Cunningham, “Dis-tance dependence of fluorescence enhancement from photonic crystalsurfaces,” J. Appl. Phys., vol. 103, p. 083104, Apr. 2008.
[25] P. C. Mathias, H.-Y. Wu, and B. T. Cunningham, “Employing two dis-tinct photonic crystal resonances to improve fluorescence enhancement,”Appl. Phys. Lett., vol. 95, p. 021111, Jul. 2009.
[26] W. Zhang, N. Ganesh, P. C. Mathias, and B. T. Cunningham, “Enhancedfluorescence on a photonic crystal surface incorporating nanorod struc-tures,” Small, vol. 4, pp. 2199–2203, 2008.
[27] S.-M. Kim, W. Zhang, and B. T. Cunningham, “Coupling discrete metalnanoparticles to photonic crystal surface resonant modes and applicationto Raman spectroscopy,” Opt. Exp., vol. 18, pp. 4300–4309, Mar. 2010.
[28] C. M. Race, L. Kwon, and B. T. Cunningham, “Achieving uniformityand reproducibility for photonic crystal fluorescence enhanced diseasediagnostic microarrays,” in Proc. IEEE SENSORS, Oct./Nov. 2016,pp. 1–3.
[29] L. Kwon, C. Race, M. Foreman, and B. Cunningham, “An automatedmicrofluidic assay for the detection of cancer biomarkers in serumusing photonic crystal enhanced fluorescence,” in Proc. IEEE SENSORS,Oct./Nov. 2016, pp. 1–3.
[30] C. A. Moody and L. A. Laimins, “Human papillomavirus oncoproteins:Pathways to transformation,” Nature Rev. Cancer, vol. 10, pp. 550–560,Jul. 2010.

1472 IEEE SENSORS JOURNAL, VOL. 18, NO. 4, FEBRUARY 15, 2018
[31] S. Marur, G. D’Souza, W. H. Westra, and A. A. Forastiere,“HPV-associated head and neck cancer: A virus-related cancer epi-demic,” Lancet Oncol., vol. 11, pp. 781–789, Aug. 2010.
[32] G. D’Souza et al., “Oral human papillomavirus (HPV) infection in HPV-positive patients with oropharyngeal cancer and their partners,” J. Clin.Oncol., vol. 32, pp. 2408–2415, Aug. 2014.
[33] G. D’Souza et al., “Case-control study of human papillomavirus andoropharyngeal cancer,” New England J. Med., vol. 356, pp. 1944–1956,May 2007.
[34] H. Inan et al., “Isolation, detection, and quantification of cancer bio-markers in HPV-associated malignancies,” Sci. Rep., vol. 7, Jun. 2017,Art. no. 3322.
[35] K. S. Anderson et al., “Souza, S. I. Pai, J. N. Cheng, R. Alam, “Biologicpredictors of serologic responses to HPV in oropharyngeal cancer:The HOTSPOT study,” Oral Oncol., vol. 51, pp. 751–758, Aug. 2015.
[36] J. Bernsen, “Dynamic thresholding of gray level images,” in Proc. Int.Conf. Pattern Recognit., 1986, pp. 1251–1255.
[37] A. M. White, D. S. Daly, and R. C. Zangar, “Analysis of high-throughputELISA microarray data,” Bioinform. Comparative Proteomics, vol. 694,pp. 191–211, Nov. 2011.
[38] X. Wu et al., “Immunofluorescent labeling of cancer marker Her2and other cellular targets with semiconductor quantum dots,” NatureBiotechnol., vol. 21, pp. 41–46, Dec. 2003.
[39] A. M. White, D. S. Daly, S. M. Varnum, K. K. Anderson, N. Bollinger,and R. C. Zangar, “ProMAT: Protein microarray analysis tool,” Bioin-formatics, vol. 22, pp. 1278–1279, May 2006.
Caitlin M. Race received the B.E.E. andM.S. degrees in electrical and computer engineer-ing from the University of Minnesota–Twin Citiesin 2011 and 2012, respectively. She is currentlypursuing the Ph.D. degree with the University ofIllinois at Urbana–Champaign, Urbana, IL, USA,under the supervision of Prof. B. T. Cunningham.She was a Graduate Research Assistant with theUniversity of Illinois at Urbana–Champaign. Herresearch focuses on the design and characteriza-tion of optical biosensors and device fabricationprocesses.
Lydia E. Kwon received the B.S. degree inbiomedical engineering from the University ofCalifornia at Davis, Davis, CA, USA, in 2012.She is currently pursuing the M.D. and Ph.D. dualdegrees at the University of Illinois at Urbana–Champaign. Her research, under the direction ofProf. B. T. Cunningham, focuses on the develop-ment of biological assays for the detection of variousdisease biomarkers using optical biosensors.
Myles T. Foreman received the B.S. degree from Texas A&M Universityin 2014, and the M.S. degree from the University of Illinois at Urbana–Champaign in 2016. His main area of research at the University of Illinoiswas in biosensors and photonics focusing in electromagnetics. He attended theUniversity of Colorado at Boulder as a Ph.D. student with a research focuson high-efficiency RF power amplifiers until 2017. He is currently an RFengineer at Lockheed Martin Missiles and Fire Control, working on antennaengineering and radar cross section analysis.
Qinglan Huang, photograph and biography not available at the time ofpublication.
Hakan Inan received the master’s and Ph.D.degrees in nanotechnology. He joined ProfessorUtkan Demirci’s Laboratory at Stanford Universityin 2014 as a Visiting Graduate Student, wherehe has been performing his research. He had12 years of teaching experience in high schooland undergraduate level, where he taught chemistryand biochemistry. He is currently a Post-DoctoralResearch Scholar with the Medicine Faculty, CanaryCancer Early Detection Center, Stanford University,Stanford, CA, USA. He is working on microfluidics-
and nanotechnology-based diagnostic devices and techniques for cancerdiagnosis and prognosis for point-of-care applications.
Sailaja Kesiraju, photograph and biography not available at the time ofpublication.
Phuong Le, photograph and biography not available at the time of publication.
Sung Jun Lim received the Ph.D. degree in chem-istry from the Pohang University of Science andTechnology (POSTECH), South Korea, in 2010.He was a Post-Doctoral Researcher at POSTECHfrom 2010 to 2012 and with the University ofIllinois at Urbana–Champaign from 2012 to 2016.He is currently a Senior Researcher with the DaeguGyeongbuk Institute of Science and Technology,South Korea. His major research interests includethe synthesis and characterization of colloidal semi-conductor nanocrystals, widely known as quantum
dots, and their applications toward biological imaging and optoelectronics.
Andrew M. Smith received the B.S. degree in chemistry and the Ph.D.degree in bioengineering from the Georgia Institute of Technology. Hejoined the University of Illinois at Urbana–Champaign faculty in 2012,followed by a post-doctoral training at Emory University. He is currentlyan Assistant Professor of Bioengineering, Materials Science, and Engineer-ing, and the Technology Entrepreneurship at the University of Illinois atUrbana–Champaign and the Carle Illinois College of Medicine. He hasauthored 51 publications, and holds seven patents granted or pending in thefields of nanomaterials engineering, single-molecule imaging, and molecularpathology.
Richard C. Zangar, photograph and biography not available at the time ofpublication.
Utkan Demirci received the B.S. degree in electricalengineering from the University of Michigan inAnn Arbor in 1999, and the M.S. and Ph.D. degreesin electrical engineering from Stanford Universityin 2001 and 2005, respectively. He is currentlya tenured Professor of Radiology and ElectricalEngineering (by courtesy) at the Canary Center atStanford for Cancer Early Detection, Stanford Uni-versity School of Medicine, where he leads a pro-ductive group of 20 researchers. His laboratory isfocused on creating micro- and nano-scale tech-
nologies that manipulate cells to enable solutions for real-world problemsin medicine. His group has pioneering contribution in multiple fields,including infectious diseases, fertility, cancer diagnostics, cell encapsulation,cryobiology, and biofabrication. He holds over 20 patents, provisional, anddisclosures and his patents have been translated into products through multiplestart-up companies, including DxNOW, Koek Biotechnology, and LEVITAS.His research interests involve the application of microfluidics, nanoscaletechnologies, and acoustics in medicine as it pertains to portable, inexpensive,disposable viral load technology platforms for HIV in resource-constrainedsettings for global health problems, and 3-D bioprinting and tissue models,including 3-D cancer and neural cultures. He has received many awards,including the IEEE EMBS Early Career, the NSF Career, the MIT TR-35,and the Fellow-Elect of the American Institute of Biological and MedicalEngineering. Some of the technologies developed in his laboratory arecurrently clinically available across the globe, with over 10 000 live births inUSA, Europe, and Turkey being attributed to the sperm selection technologythat came out of Dr. Demirci’s Laboratory.
Karen S. Anderson, photograph and biography not available at the time ofpublication.
RACE et al.: AUTOMATED MICROFLUIDIC ASSAY FOR PHOTONIC CRYSTAL ENHANCED DETECTION AND ANALYSIS 1473
Brian T. Cunningham (F’12) received the Ph.D.degree with the University of Illinois at Urbana–Champaign in 1990. He joined the ResearchDivision of Raytheon, Lexington, MA, USA,from 1991 to 1995, where he was the Group Leaderfor Infrared Sensors Fabrication. He joined theMicromachined Sensors Group at the Charles StarkDraper Laboratory, Cambridge, MA, USA, in 1995,as a Senior Member of the technical staff, wherehe later served in management roles that includedGroup Leader for MEMS Sensors, and the Technical
Director for Bioengineering Programs. At Draper Laboratory, he initiatedefforts in biosensors, microfluidics, and tissue engineering. In 2000, he becamethe Founder and the CTO of SRU Biosystems, a company established tocommercialize photonic crystal biosensors, detection instruments, and assaysfor applications in drug discovery and diagnostics. He joined the facultyof the Department of Electrical and Computer Engineering, University ofIllinois at Urbana–Champaign, as an Associate Professor, in 2004, wherehe established the Nanosensors Group at the Micro and NanotechnologyLaboratory (MNTL). At Illinois, he served as the Director of the NSF-FundedCenter for Innovative Instrumentation Technology, the first Industry/UniversityCooperative Research Center at MNTL, and served among the initial facultyto join the newly formed Bioengineering Department, where he was thefounding Director of the Bioengineering Graduate Program. He established
the first M.Eng. professional master’s program in bioengineering with strongparticipation from the UIUC Business School with a specialization inbioinstrumentation. He was appointed as the Interim Director of the MNTLin 2013, and was selected as the Director of MNTL in 2014. He was namedas the Donald Biggar Willett Professor of engineering in 2015.
He has authored or co-authored over 166 peer-reviewed journal papers,over 84 issued U.S. patents, over 133 conference talks, and has deliv-ered over 117 invited lectures. His research interests include biophotonics,bionanophotonics, micro/nanofabrication processes and materials, BioMEMS,lab-on-a-chip, microfluidics, biosensing, and applications in drug discovery,health diagnostics, mobile point-of-use detection systems, life scienceresearch, environmental monitoring, animal health, and food safety. Hiskey technical contributions and achievements stem from his invention andthe application of nanostructured photonic surfaces that efficiently coupleelectromagnetic energy into biological analytes, enabling the high signal-to-noise sensing of materials that include small molecules, nucleic acids, proteins,virus particles, cells, and tissues. He has made key foundational contributionsto the application of mobile devices (such as smartphones) to point-of-usedetection systems that provide equivalent capabilities to laboratory-basedinstruments. He is a Fellow of AAAS, NAI, OSA, and AIMBE. His work hasbeen recognized through the IEEE Sensors Council Technical AchievementAward (2010), the Engineering in Medicine and Biology Society TechnicalAchievement Award (2014), and the IEEE Sensors Council DistinguishedLectureship (2013).