14october2021 india daily - kotaksecurities.com
TRANSCRIPT

For Private Circulation Only. FOR IMPORTANT INFORMATION ABOUT KOTAK SECURITIES’ RATING SYSTEM AND OTHER DISCLOSURES. REFER TO THE END OF THIS MATERIAL.
[email protected]: +91 22 6218 6427
Contents
Daily Alerts
Results
Infosys: Prince among peers
Excellent all-round performance; Daimler deal contributes ~1.5% in our
view
Two metrics in focus - high attrition and low TCV
A growth leader that deserves premium multiples
Wipro: Powering ahead
Solid all-round growth; surprising decline in amortization charge drives EBIT
margin beat
Solid revenue growth guidance of 2-4%, will achieve peer matching growth
in FY2022E
Stock does not offer any margin of safety; retain REDUCE rating
Mindtree: Far surpassed expectations
Exceptionally strong quarter despite flat revenues from top client
Impresses with execution, capitalizing on strength of the organization
Linkage between TCV and growth seems broken
Raise FY2022-24E estimates taking cognizance of good execution. SELL on
expensive valuations
INDIA DAILY October 14, 2021 India 13-Oct 1-day 1-mo 3-mo
Sensex 60,737 0.8 4.3 14.8
Nifty 18,162 0.9 4.5 14.6
Global/Regional indices
Dow Jones 34,378 (0.0) (0.6) (1.6)
Nasdaq Composite 14,572 0.7 (3.1) (0.5)
FTSE 7,142 0.2 1.5 0.7
Nikkei 28,410 1.0 (7.4) (0.7)
Hang Seng 24,963 (1.4) (3.3) (10.7)
KOSPI 2,980 1.2 (5.4) (8.7)
Value traded – India
Cash (NSE+BSE) 812 814 597
Derivatives (NSE) 51,559 97,952 37,08
1
Deri. open interest 9,087 11,878 7,519
Forex/money market
Change, basis points
13-Oct 1-day 1-mo 3-mo
Rs/US$ 75.2 (5) 150 74
10yr govt bond, % 6.3 (1) 12 11
Net investment (US$ mn)
11-Oct MTD CYTD
FIIs (43) 2,506 23,258
MFs 267 (1,926
) (6,900)
Top movers
Change, %
Best performers 13-Oct 1-day 1-mo 3-mo
TPWR in Equity 224 14.5 71.1 80.7
TTMT/A in Equity 237 20.0 68.5 63.5
TTMT in Equity 507 20.4 68.3 63.0
DMART in Equity 5,117 8.0 29.2 52.5
TTAN in Equity 2,537 1.8 24.9 47.1
Worst performers
ARBP in Equity 729 (0.2) (1.0) (23.9)
LPC in Equity 963 (0.3) (2.1) (17.3)
RBK in Equity 193 0.6 12.2 (11.9)
NMDC in Equity 152 0.0 0.0 (11.8)
UPLL in Equity 747 0.4 (1.1) (10.2)

For Private Circulation Only. FOR IMPORTANT INFORMATION ABOUT KOTAK SECURITIES’ RATING SYSTEM AND OTHER DISCLOSURES, REFER TO THE END OF THIS MATERIAL.
[email protected]: +91 22 6218 6427
Excellent all-round performance; Daimler deal contributes ~1.5% in our view
Infosys reported strong c/c revenue growth of 6.3% qoq and 19.4% yoy, impressive and on
track to lead growth among Tier-1 companies. Revenue growth was broad-based driven by the
Daimler deal (1.5% contribution per KIE calculation), share gains and elevated spending by
clients. Client metrics improved across the board and impressed. EBIT margin decline was
restricted to 10 bps qoq to 23.6% (KIE: 22.4%) despite multiple headwinds of wage revision
(110 bps impact), higher subcontracting costs (50 bps impact) and Daimler large deal transition
costs. Cost containment (80 bps), SG&A leverage (50 bps) and Rupee depreciation (30 bps)
helped restrict the decline to 10 bps. Net profit of Rs29.3 bn grew 19% yoy and aided by
better-than-expected revenue and margin performance. High attrition rate is a key negative.
Two metrics in focus—high attrition and low TCV
Voluntary attrition in IT services stood at 20.1% on ttm, which in our view stands at ~30% on
annualized basis. Attrition numbers are high. Subcontractor use has increased to tide over
supply-side constraints. Subcon expenses increased to 10.3% of revenues, from 8.8% in June
2021 quarter. We expect supply-side challenges to continue for a few more quarters. We cut
margin assumption a tad in 2HFY22 despite outperformance in the current quarter, to account
for talent shortage and high cost to backfill attrition. We are not worried with weak TCV of
US$2.15 bn that was down 16% qoq and 32% yoy. FY2022E will be governed by aggressive
client spending resulting in short-cycle programs. We expect large deal momentum in FY2023E
helped by vendor consolidation deals, core transformation programs and a lot more deals of
legacy players that could be up for rebid. We forecast revenue growth of 13.5% in FY2023E.
A growth leader that deserves premium multiples
We raise FY2022-24E revenue estimates, moderate margin assumption a tad and marginally
raise EPS. We forecast good double-digit revenue for the next three years. We raise Fair Value
to Rs2,000, valuing the company at ~30X September 2023E EPS. Infosys is well-equipped for
industry-leading growth in the medium term. Infosys will be at the forefront of – (1) core
transformation deals, and (2) managing digital journey of clients. The growth leadership comes
on the back of investments in multiple dimensions of business including digital competencies,
large deal advisory channel, sales & marketing, localization, digital capabilities and enhancing
presence in BPO. The outcomes of these investments are strong growth in digital, de-risked and
localized delivery structure and deal momentum, driving a consistent and broad-based growth.
Infosys will outperform TCS on revenue growth for the third consecutive year.
Infosys (INFO) IT Services
Prince among peers. Infosys reported excellent all-round growth, improvement in
client metrics and stable margins. Guidance is conservative even after material increase.
We raise FY2022-24E revenue growth estimates by 1-1.5%, while keeping EPS largely
unchanged. Infosys will lead on growth among Tier-1 players. Growth leadership
deserves premium multiple. We raise Fair Value to Rs2,000 (Rs1,775 earlier), valuing the
stock at 30X September 2023E EPS. BUY.
BUY
OCTOBER 13, 2021
RESULT
Sector view: Attractive
CMP (`): 1,709
Fair Value (`): 2,000
BSE-30: 60,737
Kawaljeet Saluja
Sathishkumar S
Infosys
Stock data
Forecasts/valuations
2022E 2023E 2024E
CMP(Rs)/FV(Rs)/Rating 1,709/2,000/BUY
EPS (Rs) 51.4 60.1 68.3
52-week range (Rs) (high-low) 1,788-1,051
EPS growth (%) 12.9 16.9 13.7
Mcap (bn) (Rs/US$) 7,284/96.7 P/E (X) 33.2 28.4 25.0
ADTV-3M (mn) (Rs/US$) 10,364/137 P/B (X) 9.6 8.4 7.6
Shareholding pattern (%) EV/EBITDA (X) 22.7 19.5 17.2
Promoters 13.0 RoE (%) 28.7 31.6 31.8
FPIs/MFs/BFIs 50.8/12.7/8.9 Div. yield (%) 1.8 2.0 2.6
Price performance (%) 1M 3M 12M
Sales (Rs bn) 1,197 1,404 1,583
Absolute 1.0 10.6 47.6 EBITDA (Rs bn) 312 360 407
Rel. to BSE-30 (3.4) (4.5) (1.9) Net profits (Rs bn) 217 253 287

Infosys IT Services
KOTAK INSTITUTIONAL EQUITIES RESEARCH 3
Revised guidance is conservative
Infosys has increased FY2022E revenue growth guidance to 16.5-17.5% in c/c from 14-16%
earlier and 12-14% at the beginning of the year. The guidance revision is impressive and
reflects strength in demand and market share gains. The guidance implies muted revenue
CQGR of 1.5-2.5% for the remaining two quarters of FY2022E. Daimler deal will provide
kicker to revenues in December 2021. Further, the market is reasonably buoyant with many
programs initiated recently, execution of which will continue in December 2021 quarter. We
forecast 3%+ growth qoq in December 2021 quarter.
EBIT margin guidance of 22-24% is reasonable and consistent with our expectation.
A few more headwinds for the remainder of the year
Infosys has a few margins headwinds to contend in the second half that include—(1) decline
in utilization rates—the current utilization of 89.2% excluding trainees is unsustainable, (2)
full impact of transition costs of Daimler mega-deal, (3) wage revisions for senior resources,
i.e. resources above JL6 band, (4) increase in costs such as travel and discretionary costs over
the coming quarters and (5) potentially higher subcontracting costs.
Many of the levers are already flexed. For example, utilization level has peaked out. A few
more levers such as pyramid optimization and continuing benefits from automation remain.
Other levers such as controlling subcontractor costs and price optimization will play out in
FY2023E in our view. Pricing increase has not yet materialized significantly. It is difficult to
push for increase in rate cards. Focus is on holistic approaches to pricing such as value-led
selling and innovative pricing models can lead to realization improvement.
We forecast EBIT margin of 22.9% in December 2021 quarter and 22.8% in March 2022
quarter, down from 23.6% reported in September 2021 quarter.
Increases fresher hiring target in FY2022
Infosys will hire 45,000 freshers in FY2022, an increase of 10,000 from 35,000 announced
in the previous quarter. Expect similar hire in number of freshers in FY2023. Hiring is more
efficient and can be done in a more dynamic manner allowing for flexibility in the hiring
process. Higher hiring will facilitate supply for demand fulfillment in a strong environment
and create a better employee pyramid. Infosys’ pyramid is bloated at the middle. The
company can use the high attrition environment as an opportunity to optimize the pyramid.
Voluntary attrition increases sharply by 620 bps sequentially to 20.1%
Spike in attrition was at the higher end of our expectations—18-20%. High attrition is due
to strong demand environment and supply shortage. Infosys has relied on subcontractors to
bridge supply gap showing up in higher subcontracting expense as a % of revenue.
Increased intake of freshers will aid in resolving supply shortage to a reasonable extent.
Majority of the attrition is in the 3-6-year experience band, which is more inclined to
switching companies compared to longer tenured employees. High attrition will continue for
at least the next couple of quarters and will start moderating with adequate fresher influx
into the talent pool. To mitigate attrition, Infosys uses a variety of measures such as skill-
based bonus, targeted retentions for key skills, increase in number of promotions, focus on
career development and employee engagement initiatives.
Demand environment is very strong; visibility for at least next few quarters
Demand is strong and broad-based across all verticals and geographies. Clients are still in
early stages of digital transformation. Pent-up demand will continue for at least the next few
quarters. Client conversations and meeting with CIOs indicate strong demand. Confidence
on demand can be gauged from commentary of the COO – “In terms of the budget, I think
in the current context, budgets are no longer relevant in that sense. Because there is lot of
pent-up demand, and at least this will continue for few quarters if not years.”
Infosys guidance implies 1.5-2.5% CQGR growth in 2HFY22, which is conservative despite
seasonal headwinds, given the strong demand backdrop.

IT Services Infosys
4 KOTAK INSTITUTIONAL EQUITIES RESEARCH
TCV declines 16.3% qoq and 31.6% yoy
TCV of US$2.15 bn was lower than our expectations of US$2.5-3 bn. TCV declined both on
sequential and yoy basis. Lower TCV was on account of (1) plenty of small-sized deals which
was not captured in the large deals filter (>US$50 mn) and (2) short-cycle programs which
yield lower TCV. Infosys did not win a mega deal. Note that 2QFY21 TCV had benefit from
Vanguard deal. Large deal pipeline is healthy aided by participation in digital transformation
programs across all industries. Number of large deal signings was robust at 22 even as new
win percentage of 37% was unexciting.
Strong sequential revenue growth of 6.3% led by manufacturing vertical
Revenue growth was broad-based led by (1) Daimler deal for two months. Revenues from
Europe in manufacturing vertical (proxy for Daimler deal) grew by US$53 mn in absolute
basis and contributed 1.4% to incremental revenues, (2) higher spending on short-cycle
programs and (3) continued spending on digital priorities. Besides manufacturing, hi-tech
grew 8% qoq, life sciences at 11%, communications grew at 7.2% qoq, while retail
at 3.4% and BFSI at 3.4% also registered robust growth. Growth was strong across all client
buckets. Number of US$100 mn clients increased further to 1 from 34 in 1QFY22, while
US$50 mn clients increased by 3 to 62.
Highlights from earnings call
3QFY22 will have usual seasonality. 3QFY22 revenue growth will be impacted by
furloughs. Strong demand environment will offset some of the seasonality impact.
Large deals. Number of large deals is robust at 22. It is difficult to predict when mega
deals will come through.
Entry level hires. Infosys hires freshers under special programs such as Power
programmers and digital specialists. Freshers selected through these programs are offered
much higher compensation.
Expectation of easing of attrition is not due to lower demand. Attrition will start
easing post next couple of quarters due to higher fresher addition and not due to
demand moderation.
India talent. Infosys does not need to geographically diversify hiring away from India to
tackle war for talent. No other country has IT talent availability at scale to the extent of
India.
Utilization. High utilization is a function of lack of availability of talent. Infosys is
squeezing the bench as much as possible to meet the demands of the customer.
Deal wins. Won 5 deals each in financial services and EURS, 3 each in retail,
manufacturing and communication and hi-tech and 1 each in life sciences and others
verticals. Geographically 15 were in America, 6 in Europe and 1 from RoW.
Strong headcount addition. Added net headcount of 11,664 sequentially to total of
279,617. Fresher hiring was 15K implying limited net hiring at the lateral level.

Infosys IT Services
KOTAK INSTITUTIONAL EQUITIES RESEARCH 5
Vertical-wise commentary. BFSI – banks are increasingly focusing on virtual branches
including customer experience through AI and analytics, and digital transformation-led
cost efficiency agendas. Infosys’ investments in building sub-vertical level focus in areas
such as regional banking, retirement services and payments are providing differentiation
in large transformation programs; retail – clients continue to make investments in new
digital capabilities in commerce, marketing and supply-chain areas. Focus is on areas like
digital consumer, digital promotions, personalization and cyber security. Infosys has a
strong pipeline in retail and expects strong performance; communication – strong growth
was on the ramp-up of deals. There is increasing momentum for capex rollout for 5G
deployment across regions; EURS – companies are prioritizing projects around cloud
transformation, customer experience, data analytics, automation and cyber security. In
energy, Infosys is developing low carbon solutions; manufacturing – growth is broad-
based across Europe and the US and across industrial, automotive and aerospace
industries. Engineering services is picking up. The pipeline is strong.
Completion of buyback. Rs92 bn buyback was completed in September. Infosys bought
back 55.8 mn shares at an average price of Rs1,649/share (maximum buyback price was
fixed at Rs1,750/share). 82% of FCF for FY2020 and FY2021 has been returned through
dividends and buyback.
Dividend. The Board has announced interim dividend of Rs15/share for FY2022.
Others. Infosys Cobalt capabilities are resonating well with clients.
Exhibit 1: Infosys quarterly results (IFRS), March fiscal year-ends (Rs mn)
Source: Company, Kotak Institutional Equities estimates
2QFY22 2QFY22E 2QFY21 1QFY22 KIE yoy qoq 1HFY21 1HFY22 % chg. FY2021 FY2022E % chg.
Revenues (US$ mn) 3,998 3,958 3,312 3,782 1.0 20.7 5.7 6,433 7,780 20.9 13,562 16,073 18.5
Revenues 296,020 292,917 245,700 278,960 1.1 20.5 6.1 482,350 574,980 19.2 1,004,730 1,196,957 19.1
Cost of revenues (189,480) (189,102) (149,160) (176,770) 0.2 27.0 7.2 (298,630) (366,240) 22.6 (621,470) (765,579) 23.2
Gross profit 106,540 103,815 96,540 102,190 2.6 10.4 4.3 183,720 208,740 13.6 383,260 431,378 12.6
S&M expenses (12,350) (13,761) (11,360) (12,480) (10.3) 8.7 (1.0) (22,820) (24,830) 8.8 (46,270) (52,140) 12.7
G&A expenses (15,890) (15,953) (14,350) (15,390) (0.4) 10.7 3.2 (28,860) (31,280) 8.4 (58,090) (66,778) 15.0
Total SG&A expenses (28,240) (29,715) (25,710) (27,870) (5.0) 9.8 1.3 (51,680) (56,110) 8.6 (104,360) (118,918) 13.9
EBITDA 78,300 74,100 70,830 74,320 5.7 10.5 5.4 132,040 152,630 15.6 278,900 312,460 12.0
Depreciation (8,580) (8,478) (8,550) (8,290) 1.2 0.4 3.5 (16,110) (16,880) 4.8 (32,680) (34,641) 6.0
EBIT 69,720 65,622 62,280 66,030 6.2 11.9 5.6 115,930 135,750 17.1 246,220 277,819 12.8
Other income 4,760 5,954 5,220 5,730 (20.1) (8.8) (16.9) 9,490 10,490 10.5 20,060 20,726 3.3
Profit before tax 74,480 71,576 67,500 71,760 4.1 10.3 3.8 125,420 146,240 16.6 266,280 298,546 12.1
Provision for tax (20,200) (19,325) (18,920) (19,750) 4.5 6.8 2.3 (34,120) (39,950) 17.1 (72,050) (81,072) 12.5
Net profit 54,280 52,250 48,580 52,010 3.9 11.7 4.4 91,300 106,290 16.4 194,230 217,473 12.0
Minority interest (70) (170) (130) (60) (520) (130) (720) (470)
Extraordinaries — — — — — — — —
Net profit - reported 54,210 52,080 48,450 51,950 4.1 11.9 4.4 90,780 106,160 16.9 193,510 217,003 12.1
Tax rate (%) 27.1 27.0 28.0 27.5
EPS (Rs/ share) 12.9 12.2 11.4 12.2 4.9 12.7 5.2 21.4 25.1 17.3 45.5 51.4 13.0
As % of revenues
Gross profit margin 36.0 35.4 39.3 36.6 38.1 36.3 38.1 36.0
EBITDA margin 26.5 25.3 28.8 26.6 27.4 26.5 27.8 26.1
EBIT margin 23.6 22.4 25.3 23.7 24.0 23.6 24.5 23.2
S&M expenses 4.2 4.7 4.6 4.5 4.7 4.3 4.6 4.4
G&A expenses 5.4 5.4 5.8 5.5 6.0 5.4 5.8 5.6
SG&A expenses 9.5 10.1 10.5 10.0 10.7 9.8 10.4 9.9
Total employees 279,617 239,233 259,619 16.9 7.7
% chg.

IT Services Infosys
6 KOTAK INSTITUTIONAL EQUITIES RESEARCH
Exhibit 2: Key changes to estimates, March fiscal year-ends, 2022-24E (Rs mn)
Source: Kotak Institutional Equities estimates
Exhibit 3: Revenue growth by segments (Sep 2021)
Source: Company, Kotak Institutional Equities
2022E 2023E 2024E 2022E 2023E 2024E 2022E 2023E 2024E
Revenues 1,196,957 1,403,905 1,582,710 1,198,273 1,393,055 1,561,307 (0.1) 0.8 1.4
EBITDA 312,460 360,069 407,021 313,932 361,039 403,187 (0.5) (0.3) 1.0
Depreciation (34,641) (36,129) (38,595) (34,650) (36,118) (38,565) (0.0) 0.0 0.1
EBIT 277,819 323,940 368,426 279,282 324,921 364,622 (0.5) (0.3) 1.0
Net Profit 217,003 252,675 287,267 220,632 256,038 286,910 (1.6) (1.3) 0.1
EPS (Rs/ share) 51.4 60.1 68.3 51.9 60.2 67.5 (0.9) (0.2) 1.3
Revenues (US$ mn) 16,073 18,233 20,291 16,026 18,092 20,017 0.3 0.8 1.4
Revenue growth (%) 18.5 13.4 11.3 18.2 12.9 10.6
Revenue growth (c/c, %) 18.1 13.5 11.3 17.4 12.7 10.6
Revenue growth (organic c/c, %) 17.8 13.5 11.3 17.0 12.7 10.6
Volume Growth (%) 19.4 10.2 9.2 16.4 10.2 9.6
Margins (%)
EBITDA 26.1 25.6 25.7 26.2 25.9 25.8
EBIT 23.2 23.1 23.3 23.3 23.3 23.4
INR/ USD rate 74.5 77.0 78.0 74.8 77.0 78.0 (0.4) — —
New Old Change (%)
Total revenues 3,998 5.7 20.7 100.0 19.4
by geography
North America 2,475 6.1 23.1 61.9 23.1
Europe 992 8.3 23.2 24.8 19.6
India 104 (5.2) 4.6 2.6 4.2
ROW 428 1.0 7.6 10.7 4.7
by verticals
Financial Services 1,291 3.5 21.8 32.3 20.5
Retail 584 2.9 18.3 14.6 17.2
Communications 496 7.4 18.8 12.4 16.6
Energy, Utilities, Resources and Servcies 472 3.1 15.8 11.8 14.6
Manufacturing 436 18.8 44.6 10.9 42.5
Hi Tech 340 8.3 12.8 8.5 12.2
Life Sciences 284 10.4 26.0 7.1 26.1
Others 96 (12.5) (9.5) 2.4 9.6
by service line
Services 3,758 7.2 22.7 94.0 94.0
Products & platforms 240 (13.1) (3.4) 6.0 6.0
Digital 2,243 10.0 43.2 56.1 56.1
Core 1,755 0.7 0.6 43.9 43.9
Revenues from clients
Top 5 clients 456 6.6 21.8 11.4
Top 10 clients 776 9.1 25.2 19.4
Top 25 clients 1,415 8.8 24.9 35.4
Ex top 25 clients 2,583 4.1 18.5 64.6
C/C Growth (%)
(yoy)(qoq) (yoy)
Revenues
(US$ mn)
Growth (%)
% of total

Infosys IT Services
KOTAK INSTITUTIONAL EQUITIES RESEARCH 7
Exhibit 4: Segmental revenue growth across geographies (Sep 2021)
Source: Company, Kotak Institutional Equities
Exhibit 5: Constant currency revenue growth trend, %
Source: Company, Kotak Institutional Equities
Hi-Tech Others Total
YoY US$ revenue growth (%) 21.8 18.9 18.7 15.9 44.0 11.9 26.2 (8.7) 20.7
YoY US$ revenue growth by geography (%)
North America 30.8 22.5 24.3 6.1 34.2 10.5 31.8 14.8 23.2
Europe 3.7 11.5 24.5 33.3 57.8 16.7 13.6 — 22.6
India 18.9 50.0 40.0 50.0 55.6 — (95.5) 4.0
ROW 13.6 11.1 (2.1) — — — 25.0 16.7 8.6
QoQ US$ revenue growth (%) 3.4 3.4 7.1 3.5 18.9 8.3 10.9 (15.2) 5.7
QoQ US$ revenue growth by geography (%)
North America 3.2 5.0 12.4 4.3 8.7 8.2 9.7 — 6.1
Europe 1.8 (0.6) 4.5 3.9 33.1 — 13.6 (12.5) 8.3
India 14.5 (25.0) (6.7) 25.0 50.0 16.7 (94.4) (6.3)
ROW 2.6 7.1 (1.1) (5.3) (22.2) — 25.0 1.8 0.9
Geography-wise revenue breakup across verticals (%)
North America 62.1 67.9 54.7 51.6 48.7 93.2 71.5 32.6 61.9
Europe 17.6 26.5 23.6 39.7 49.0 2.1 26.4 7.4 24.7
India 4.9 0.5 2.8 1.1 0.7 4.1 0.4 1.1 2.6
ROW 15.5 5.1 18.8 7.6 1.6 0.6 1.8 58.9 10.7
YoY US$ revenue growth by offerings (%)
Digital 34.3 40.6 47.1 41.2 85.2 30.7 73.1 (13.5) 43.0
Core 10.5 (4.2) (8.5) (7.0) 10.8 (6.5) (6.8) (6.0) 0.6
QoQ US$ revenue growth by offerings (%)
Digital 3.1 10.2 14.5 8.7 28.2 13.3 17.5 (27.3) 10.0
Core 3.7 (5.8) (2.5) (2.9) 8.2 2.1 3.4 (7.4) 0.7
Service-offering wise revenue breakup across verticals (%)
Digital 52.1 61.0 60.6 57.9 57.5 57.8 56.7 33.7 56.1
Core 47.9 39.0 39.4 42.1 42.5 42.2 43.3 66.3 43.9
Life SciencesFinancial Services Retail&CPG Communication
Energy&Utilities
Resources & Svcs Manufacturing
0.0
3.0
6.0
9.0
12.0
15.0
18.0
21.0
Jun-1
5
Sep-1
5
Dec
-15
Mar-
16
Jun-1
6
Sep-1
6
Dec
-16
Mar-
17
Jun-1
7
Sep-1
7
Dec
-17
Mar-
18
Jun-1
8
Sep-1
8
Dec
-18
Mar-
19
Jun-1
9
Sep-1
9
Dec
-19
Mar-
20
Jun-2
0
Sep-2
0
Dec
-20
Mar-
21
Jun-2
1
Sep-2
1
Infosys YoY c/c revenue growth (%)
19.4

IT Services Infosys
8 KOTAK INSTITUTIONAL EQUITIES RESEARCH
Exhibit 6: Quarterly EBIT margin trend (%)
Source: Company, Kotak Institutional Equities
Exhibit 7: Segmental EBIT margin trend (%)
Source: Company, Kotak Institutional Equities
Exhibit 8: Expect decline in TCV on ttm basis in next few quarters due to lack of mega deals
Source: Company, Kotak Institutional Equities
23.6
19.0
21.0
23.0
25.0
27.0
29.0
31.0
33.0
Jun-1
1
Dec
-11
Jun-1
2
Dec
-12
Jun-1
3
Dec
-13
Jun-1
4
Dec
-14
Jun-1
5
Dec
-15
Jun-1
6
Dec
-16
Jun-1
7
Dec
-17
Jun-1
8
Dec
-18
Jun-1
9
Dec
-19
Jun-2
0
Dec
-20
Jun-2
1
EBIT margin (%)
Sep-21 EBIT
margin (%) qoq yoy
Financial services 27.6 206 (234) 20.5 32.3
Retail 34.7 (79) (90) 17.2 14.6
Communication 22.2 148 81 16.6 12.4
EURS 29.0 (127) 179 14.6 11.8
Manufacturing 22.5 (64) (674) 42.5 10.9
Hi-tech 24.7 11 (516) 12.2 8.5
Lifesciences 28.0 (224) (583) 26.1 7.1
Others (11.4) (2,346) (1,733) 9.6 2.4
Change (%) C/C growth (%)
yoy
Contribution
to revenues (%)
2.2 1.9 1.9 2.3 3.0
3.9 4.0 4.2 3.9
3.5 3.3
2.9 3.0 3.1 3.5
4.8 5.6
6.3
7.9 8.7 8.9 9.0
8.1 8.4
13.7 14.1
15.0 14.0
(12)(19)
(8)
38
100 108
83
28
(10)(16)
(32)(24)
(12)
6
69
89
105
123
80
59
44
2 (4)
53 57
86
(40)
(20)
-
20
40
60
80
100
120
140
- 1.0 2.0 3.0 4.0 5.0 6.0 7.0 8.0 9.0
10.0 11.0 12.0 13.0 14.0 15.0
Dec
-14
Mar-
15
Jun-1
5
Sep-1
5
Dec
-15
Mar-
16
Jun-1
6
Sep-1
6
Dec
-16
Mar-
17
Jun-1
7
Sep-1
7
Dec
-17
Mar-
18
Jun-1
8
Sep-1
8
Dec
-18
Mar-
19
Jun-1
9
Sep-1
9
Dec
-19
Mar-
20
Jun-2
0
Sep-2
0
Dec
-20
Mar-
21
Jun-2
1
Sep-2
1
TTM TCV of large deal wins (US$ bn) Growth (%, yoy)

Infosys IT Services
KOTAK INSTITUTIONAL EQUITIES RESEARCH 9
Exhibit 9: TCV of large deal wins is below our expectations of US$2.5-3 bn
Source: Company, Kotak Institutional Equities
Exhibit 10: Travel costs continue to be depressed at 0.6% of revenue
Source: Company, Kotak Institutional Equities
0.2 0.4 0.7
1.0 1.0 1.2
0.8 1.2
0.7 0.8 0.7 0.7 0.8 0.9 1.1
2.0 1.6 1.6
2.7 2.8
1.8 1.7 1.7
3.1
7.1
2.1 2.6
2.2
-
1.0
2.0
3.0
4.0
5.0
6.0
7.0
8.0
Dec
-14
Mar-
15
Jun-1
5
Sep-1
5
Dec
-15
Mar-
16
Jun-1
6
Sep-1
6
Dec
-16
Mar-
17
Jun-1
7
Sep-1
7
Dec
-17
Mar-
18
Jun-1
8
Sep-1
8
Dec
-18
Mar-
19
Jun-1
9
Sep-1
9
Dec
-19
Mar-
20
Jun-2
0
Sep-2
0
Dec
-20
Mar-
21
Jun-2
1
Sep-2
1
TCV of large deal wins (US$ bn)
7.4
5.2 5.0 4.7 5.3 4.8 5.0 4.9
6.0 6.0 6.3 6.0
8.3
6.0 6.2 6.7
1.2 1.5 1.3 1.6 1.3 1.6
4.4
3.0 2.9 2.8 3.1
2.7 2.8 2.7
3.2 2.9 2.9 2.8
3.8
2.6 2.7 2.9
0.5 0.6 0.5 0.6 0.5 0.6
-
0.5
1.0
1.5
2.0
2.5
3.0
3.5
4.0
4.5
5.0
-
1.0
2.0
3.0
4.0
5.0
6.0
7.0
8.0
9.0
Jun-1
6
Sep-1
6
Dec
-16
Mar-
17
Jun-1
7
Sep-1
7
Dec
-17
Mar-
18
Jun-1
8
Sep-1
8
Dec
-18
Mar-
19
Jun-1
9
Sep-1
9
Dec
-19
Mar-
20
Jun-2
0
Sep-2
0
Dec
-20
Mar-
21
Jun-2
1
Sep-2
1
Travel costs (Rs bn) Travel cost as a % of revenues

IT Services Infosys
10 KOTAK INSTITUTIONAL EQUITIES RESEARCH
Exhibit 11: Branding and marketing costs continue to trend at low levels
Source: Companies, Kotak Institutional Equities
Exhibit 12: Employee costs have declined despite wage hike due to higher usage of subcontractors
Source: Companies, Kotak Institutional Equities
1,140
0.7
0.5
0.4 0.4
0.5
0.4 0.4
0.4
0.5
0.6 0.6 0.6 0.6
0.5 0.5
0.6
0.2
0.4 0.4 0.4 0.4
0.3
-
0.1
0.2
0.3
0.4
0.5
0.6
0.7
0.8
-
200
400
600
800
1,000
1,200
1,400
1,600
Jun-1
6
Sep-1
6
Dec
-16
Mar-
17
Jun-1
7
Sep-1
7
Dec
-17
Mar-
18
Jun-1
8
Sep-1
8
Dec
-18
Mar-
19
Jun-1
9
Sep-1
9
Dec
-19
Mar-
20
Jun-2
0
Sep-2
0
Dec
-20
Mar-
21
Jun-2
1
Sep-2
1
Branding & marketing costs (Rs mn) Branding & marketing costs as a % of revenues
93 96 94 93 94 96 99 101 105 112 116 121 123 127 130 129 136 134 145 144 152 157
55.3 55.7
54.5 54.4 54.8 54.7
55.5 55.6
54.7 54.1 54.3
56.1 56.4
56.0 56.3
55.5
57.5
54.5
55.8
54.9 54.6
53.2
50.0
51.0
52.0
53.0
54.0
55.0
56.0
57.0
58.0
-
20
40
60
80
100
120
140
160
180
Jun-1
6
Sep-1
6
Dec
-16
Mar-
17
Jun-1
7
Sep-1
7
Dec
-17
Mar-
18
Jun-1
8
Sep-1
8
Dec
-18
Mar-
19
Jun-1
9
Sep-1
9
Dec
-19
Mar-
20
Jun-2
0
Sep-2
0
Dec
-20
Mar-
21
Jun-2
1
Sep-2
1
Employee costs (Rs bn) Employee costs as a % of revenues

Infosys IT Services
KOTAK INSTITUTIONAL EQUITIES RESEARCH 11
Exhibit 13: Quarterly receivables trend
Source: Companies, Kotak Institutional Equities
Exhibit 14: Key client metrics
Source: Company, Kotak Institutional Equities
Exhibit 15: Broad-based growth across client buckets
Source: Company, Kotak Institutional Equities
62
93
40
50
60
70
80
90
100
110
Jun-1
0
Dec
-10
Jun-1
1
Dec
-11
Jun-1
2
Dec
-12
Jun-1
3
Dec
-13
Jun-1
4
Dec
-14
Jun-1
5
Dec
-15
Jun-1
6
Dec
-16
Jun-1
7
Dec
-17
Jun-1
8
Dec
-18
Jun-1
9
Dec
-19
Jun-2
0
Dec
-20
Jun-2
1
Billed receivables Total receivables
Sep-18 Dec-18 Mar-19 Jun-19 Sep-19 Dec-19 Mar-20 Jun-20 Sep-20 Dec-20 Mar-21 Jun-21 Sep-21
Client metrics
Number of active clients 1,222 1,252 1,279 1,336 1,364 1,384 1,411 1,458 1,487 1,562 1,626 1,659 1,714
New clients added in the period 73 101 101 112 96 84 84 110 96 139 130 113 117
Repeat business % 98.2 96.6 95.2 99.0 98.1 97.2 95.9 99.0 98.0 95.1 93.4 NA NA
Million $ clients 633 651 662 680 693 705 718 729 745 761 779 805 841
10 Million $ clients 205 214 222 228 228 232 234 236 242 246 252 264 270
50 Million $ clients 58 59 60 59 61 61 61 60 60 60 59 59 62
100 Million $ clients 23 23 25 27 27 28 28 25 30 29 32 34 35
Sep-18 Dec-18 Mar-19 Jun-19 Sep-19 Dec-19 Mar-20 Jun-20 Sep-20 Dec-20 Mar-21 Jun-21 Sep-21
Revenue (US$ mn)
Top client 114 102 101 100 103 97 99 106 NA NA NA NA NA NA
Top 5 clients NA NA NA 379 369 366 361 368 374 380 394 427 456 2.5
Top 10 clients 567 574 603 626 616 613 598 602 619 650 661 711 776 5.8
Top 25 clients 1,014 1,013 1,071 1,093 1,111 1,109 1,090 1,080 1,133 1,217 1,236 1,301 1,415 5.7
Ex- Top 10 clients 2,354 2,413 2,457 2,505 2,594 2,630 2,599 2,519 2,693 2,866 2,952 3,071 3,222 4.6
Total 2,921 2,987 3,060 3,131 3,210 3,243 3,197 3,121 3,312 3,516 3,613 3,782 3,998 4.8
Growth (qoq %)
Top client 8.8 (10.9) (0.6) (0.8) 2.5 (5.3) 1.9 7.1 NA NA NA NA NA
Top 5 clients NA NA NA NA (2.6) (0.7) (1.4) 1.9 1.6 1.5 3.7 8.5 6.6
Top 10 clients 4.3 1.2 5.1 3.9 (1.6) (0.6) (2.5) 0.8 2.8 5.0 1.6 7.5 9.1
Top 25 clients 2.6 (0.1) 5.8 2.0 1.6 (0.1) (1.7) (0.9) 4.9 7.4 1.6 5.3 8.8
Ex- Top 10 clients 2.9 2.5 1.8 1.9 3.5 1.4 (1.2) (3.1) 6.9 6.4 3.0 4.0 4.9
Total 3.2 2.3 2.4 2.3 2.5 1.0 (1.4) (2.4) 6.1 6.2 2.8 4.7 5.7
4 qtr CQGR
%

IT Services Infosys
12 KOTAK INSTITUTIONAL EQUITIES RESEARCH
Exhibit 16: Digital growth on yoy basis at 42.4%
Source: Company, Kotak Institutional Equities
Exhibit 17: Attrition rate on ttm basis increases by 620 bps sequentially to 20.1%
Source: Company, Kotak Institutional Equities
634 687 719 752 804 906 941 1,034 1,118 1,229 1,317 1,340 1,389 1,567
1,762 1,861 2,038
2,243
25.6
33.5 33.1
41.1 41.9
38.440.8
31.7
25.5 25.4
31.334.4
42.1 42.4
0
5
10
15
20
25
30
35
40
45
-
500
1,000
1,500
2,000
2,500
Jun-1
7
Sep-1
7
Dec
-17
Mar-
18
Jun-1
8
Sep-1
8
Dec
-18
Mar-
19
Jun-1
9
Sep-1
9
Dec
-19
Mar-
20
Jun-2
0
Sep-2
0
Dec
-20
Mar-
21
Jun-2
1
Sep-2
1
Digital revenues (LHS, US$ mn) Digital revenue C/C Y-o-Y growth rate (RHS, %)
18.9 18.3 17.7 17.415.6
12.811 10.9
13.9
20.1
(2)
2
6
10
14
18
22
26
30
Jun-1
9
Sep-1
9
Dec
-19
Mar-
20
Jun-2
0
Sep-2
0
Dec
-20
Mar-
21
Jun-2
1
Sep-2
1
LTM voluntary attrition (%)

Infosys IT Services
KOTAK INSTITUTIONAL EQUITIES RESEARCH 13
Exhibit 18: Subcontracting costs as a % of revenues increased by 150 bps sequentially to 10.3%
Source: Company, Kotak Institutional Equities
Exhibit 19: Offshore mix shift continues with a further 50 bps increase qoq to 76.4%
Source: Company, Kotak Institutional Equities
10.3
0
2
4
6
8
10
12
Jun-1
4
Dec
-14
Jun-1
5
Dec
-15
Jun-1
6
Dec
-16
Jun-1
7
Dec
-17
Jun-1
8
Dec
-18
Jun-1
9
Dec
-19
Jun-2
0
Dec
-20
Jun-2
1
Subcontractng costs as a % of revenue
76.4
65
67
69
71
73
75
77
Jun-1
6
Sep-1
6
Dec
-16
Mar-
17
Jun-1
7
Sep-1
7
Dec
-17
Mar-
18
Jun-1
8
Sep-1
8
Dec
-18
Mar-
19
Jun-1
9
Sep-1
9
Dec
-19
Mar-
20
Jun-2
0
Sep-2
0
Dec
-20
Mar-
21
Jun-2
1
Sep-2
1
Offshore effort (%)

IT Services Infosys
14 KOTAK INSTITUTIONAL EQUITIES RESEARCH
Exhibit 20: New large deal TCV of US$796 mn or 37% in 2QFY22
Source: Company, Kotak Institutional Equities
Exhibit 21: Key model assumptions, March fiscal year-ends, 2017-24E
Source: Company, Kotak Institutional Equities estimates
Notes:
(a) Net new % of deals in Dec-17 quarter is KIE estimate based on net new %
of TCV for FY2018
(b) Deal wins have been adjusted for Stater acquisition
495 234 290 525 1,217
471 1,082 936 285 580 924 331
2,705
5,205
1,098 771
2,152
68
30 32
47
60
30
69
35
10
32
56
19
86
73
52
30
100
0
1,000
2,000
3,000
4,000
5,000
6,000
0
20
40
60
80
100
120
Sep-1
7
Dec
-17
Mar-
18
Jun-1
8
Sep-1
8
Dec
-18
Mar-
19
Jun-1
9
Sep-1
9
Dec
-19
Mar-
20
Jun-2
0
Sep-2
0
Dec
-20
Mar-
21
Jun-2
1
Sep-2
1
Net new deal TCV (US$ mn, RHS) Net new (%, LHS)
2017 2018 2019 2020 2021 2022E 2023E 2024E
INR/USD rate 67.1 64.5 70.1 71.0 74.1 74.5 77.0 78.0
Revenues (US$ mn) 10,208 10,939 11,799 12,781 13,562 16,073 18,233 20,291
% growth 7.4 7.2 7.9 8.3 6.1 18.5 13.4 11.3
C/c revenue growth (%) 8.3 5.8 9.0 9.8 5.0 18.1 13.5 11.3
C/c revenue growth (organic %) 8.0 5.8 8.5 8.4 4.1 17.8 13.5 11.3
EBITDA margin (%) 27.2 27.0 25.3 24.5 27.8 26.1 25.6 25.7
EBIT margin (%) 24.7 24.3 22.8 21.3 24.5 23.2 23.1 23.3
SG&A (%) 12.2 11.7 12.0 11.8 10.4 9.9 10.4 10.8
Headcount 200,364 204,107 228,123 242,371 259,619 292,334 323,572 350,796
Employee addition 6,320 3,743 24,016 14,248 17,248 32,715 31,238 27,224
Blended pricing change (USD, %) (2.7) 4.3 (3.7) (4.1) (2.6) (0.6) 3.1 2.1

Infosys IT Services
KOTAK INSTITUTIONAL EQUITIES RESEARCH 15
Exhibit 22: Key operating metrics
Source: Company, Kotak Institutional Equities
Sep-19 Dec-19 Mar-20 Jun-20 Sep-20 Dec-20 Mar-21 Jun-21 Sep-21
Revenues (US$ mn) 3,210 3,243 3,197 3,121 3,312 3,516 3,613 3,782 3,998
Revenues (Rs mn) 226,290 230,920 232,670 236,650 245,700 259,270 263,110 278,960 296,020
Exchange rate (Re/US$) 70.5 71.2 72.8 75.8 74.2 73.7 72.8 73.8 74.0
Revenue by verticals- New classification
Financial Services 31.9 31.5 31.3 31.5 32.0 33.1 33.0 33.0 32.3
Retail 15.2 15.3 15.5 14.3 14.9 14.7 14.8 15.0 14.6
Communications 13.1 13.0 13.0 13.4 12.6 12.4 12.0 12.2 12.4
Energy, Utilities, Resources and Servcies 13.1 12.8 12.9 12.8 12.3 12.5 12.3 12.1 11.8
Manufacturing 10.1 10.3 10.1 9.5 9.1 9.3 9.6 9.7 10.9
Hi Tech 7.6 7.6 7.9 8.7 9.1 8.2 8.1 8.3 8.5
Life Sciences 6.4 6.7 6.4 6.7 6.8 7.1 6.8 6.8 7.1
Others 2.6 2.8 2.9 3.1 3.2 2.7 3.4 2.9 2.4
Revenue by service offerings (%)- NEW
Services 93.6 94.0 93.7 93.0 92.5 92.9 93.3 92.7 94.0
Products & platforms 6.4 6.0 6.3 7.0 7.5 7.1 6.7 7.3 6.0
Total 100.0 100.0 100.0 100.0 100.0 100.0 100.0 100.0 100.0
Digital 38.3 40.6 41.9 44.5 47.3 50.1 51.5 53.9 56.1
Core 61.7 59.4 58.1 55.5 52.7 49.9 48.5 46.1 43.9
Revenue by geography (%)
North America 61.4 61.3 61.6 61.5 60.7 61.6 61.6 61.7 61.9
Europe 24.1 24.4 24.4 24.0 24.3 24.0 24.4 24.2 24.8
India 2.7 2.8 2.6 2.9 3.0 2.6 3.0 2.9 2.6
ROW 11.8 11.5 11.4 11.6 12.0 11.8 11.0 11.2 10.7
Onsite-offshore effort split
Onsite 28.2 27.7 27.6 28.0 26.1 25.2 24.3 24.1 23.6
Offshore 71.8 72.3 72.4 72.0 73.9 74.8 75.7 75.9 76.4
Client metrics
Top 5 client contribution to revenues (%) 11.5 11.3 11.3 11.8 11.3 10.8 10.9 11.3 11.4
Top 10 client contribution to revenues (%) 19.2 18.9 18.7 19.3 18.7 18.5 18.3 18.8 19.4
Top 25 client contribution to revenues (%) 34.6 34.2 34.1 34.6 34.2 34.6 34.2 34.4 35.4
Number of active clients 1,364 1,384 1,411 1,458 1,487 1,562 1,626 1,659 1,714
New clients added in the period (gross) 96 84 84 110 96 139 130 113 117
Repeat business % 98.1 97.2 95.9 99 98 95.1 93.4 NA NA
Million $ clients 693 705 718 729 745 761 779 805 841
10 Million $ clients 228 232 234 236 242 246 252 264 270
50 Million $ clients 61 61 61 60 60 60 59 59 62
100 Million $ clients 27 28 28 25 30 29 32 34 35
Currency-wise revenues (%)
USD 67.5 67.3 67.6 67.1 65.9 66.9 66.2 66.5 66.7
GBP 4.9 4.9 5.0 4.7 4.8 4.3 4.7 4.8 4.5
Euro 12.4 12.7 12.6 12.8 13.5 13.3 13.7 13.5 14.0
AUD 6.9 6.7 6.1 6.8 7.4 6.7 6.6 6.8 6.4
Utilization measures (IT Services and Consulting)
Including trainees 81.6 80.4 79.0 78.2 80.6 82.3 82.2 83.3 84.1
Excluding trainees 84.9 84.4 83.5 81.2 83.6 86.3 87.7 88.5 89.2
Employee metrics
Total Employees (Consolidated) 236,486 243,454 242,371 239,233 240,208 249,312 259,619 267,953 279,617
S/W professionals (Consolidated) 222,851 229,658 228,449 225,167 226,067 234,829 245,037 253,493 264,918
S/W professionals (IT Services & Consulting) 186,119 191,252 190,210 NA NA NA NA NA NA
Sales and support 13,635 13,796 13,922 14,066 14,141 14,483 14,582 14,460 14,699
Net additions 7,457 6,968 (1,083) (3,138) 975 9,104 10,307 8,334 11,664
Attrition quarterly annualized (standalone, %) 19.4 17.6 18.2 NA NA NA NA NA NA
Attrition quarterly annualized (consolidated, %) 21.7 19.6 20.7 NA NA NA NA NA NA
Voluntary Attrition % (Annualized - IT Services) 18.3 15.8 15.3 11.7 7.8 10.0 15.2 NA NA
Voluntary Attrition % (LTM - IT Services) 18.3 17.7 17.4 15.6 12.8 11.0 10.9 13.9 20.1
Deal wins
TCVs (US$ mn) 2,847 1,813 1,650 1,744 3,145 7,130 2,111 2,570 2,152
Large deal wins 13 14 12 15 16 22 23 22 22
IT Services Infosys
16 KOTAK INSTITUTIONAL EQUITIES RESEARCH
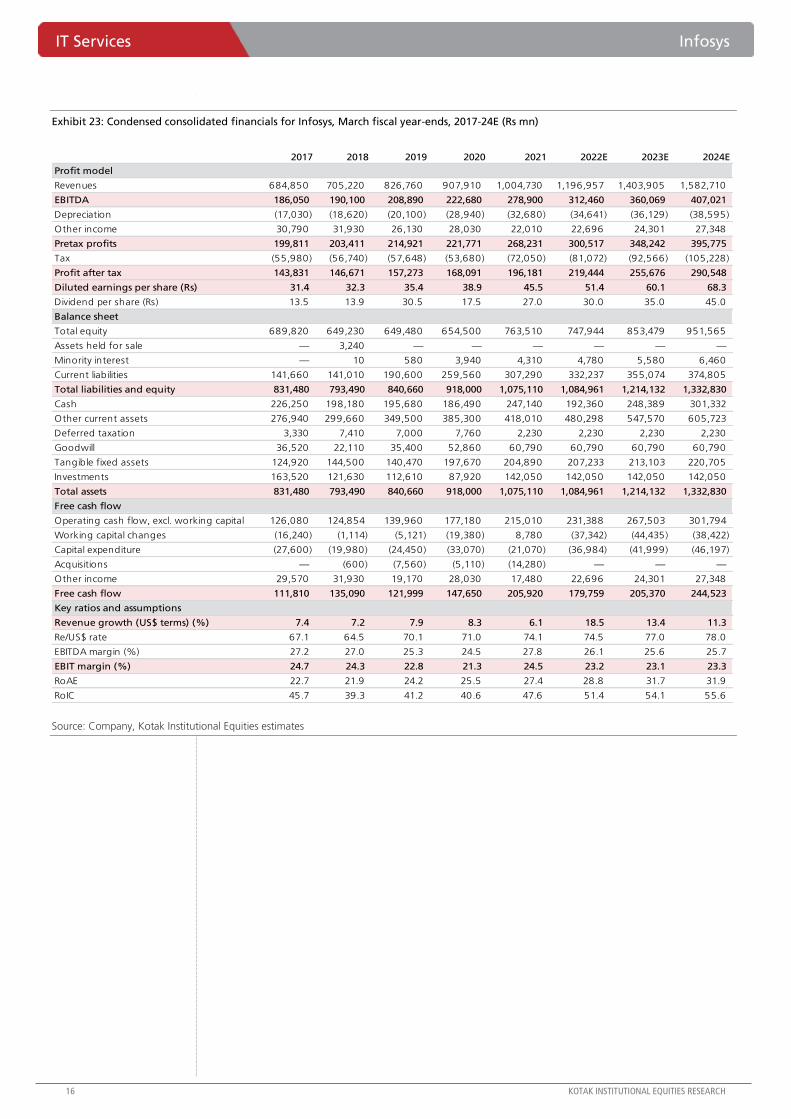
Exhibit 23: Condensed consolidated financials for Infosys, March fiscal year-ends, 2017-24E (Rs mn)
Source: Company, Kotak Institutional Equities estimates
2017 2018 2019 2020 2021 2022E 2023E 2024E
Profit model
Revenues 684,850 705,220 826,760 907,910 1,004,730 1,196,957 1,403,905 1,582,710
EBITDA 186,050 190,100 208,890 222,680 278,900 312,460 360,069 407,021
Depreciation (17,030) (18,620) (20,100) (28,940) (32,680) (34,641) (36,129) (38,595)
Other income 30,790 31,930 26,130 28,030 22,010 22,696 24,301 27,348
Pretax profits 199,811 203,411 214,921 221,771 268,231 300,517 348,242 395,775
Tax (55,980) (56,740) (57,648) (53,680) (72,050) (81,072) (92,566) (105,228)
Profit after tax 143,831 146,671 157,273 168,091 196,181 219,444 255,676 290,548
Diluted earnings per share (Rs) 31.4 32.3 35.4 38.9 45.5 51.4 60.1 68.3
Dividend per share (Rs) 13.5 13.9 30.5 17.5 27.0 30.0 35.0 45.0
Balance sheet
Total equity 689,820 649,230 649,480 654,500 763,510 747,944 853,479 951,565
Assets held for sale — 3,240 — — — — — —
Minority interest — 10 580 3,940 4,310 4,780 5,580 6,460
Current liabilities 141,660 141,010 190,600 259,560 307,290 332,237 355,074 374,805
Total liabilities and equity 831,480 793,490 840,660 918,000 1,075,110 1,084,961 1,214,132 1,332,830
Cash 226,250 198,180 195,680 186,490 247,140 192,360 248,389 301,332
Other current assets 276,940 299,660 349,500 385,300 418,010 480,298 547,570 605,723
Deferred taxation 3,330 7,410 7,000 7,760 2,230 2,230 2,230 2,230
Goodwill 36,520 22,110 35,400 52,860 60,790 60,790 60,790 60,790
Tangible fixed assets 124,920 144,500 140,470 197,670 204,890 207,233 213,103 220,705
Investments 163,520 121,630 112,610 87,920 142,050 142,050 142,050 142,050
Total assets 831,480 793,490 840,660 918,000 1,075,110 1,084,961 1,214,132 1,332,830
Free cash flow
Operating cash flow, excl. working capital 126,080 124,854 139,960 177,180 215,010 231,388 267,503 301,794
Working capital changes (16,240) (1,114) (5,121) (19,380) 8,780 (37,342) (44,435) (38,422)
Capital expenditure (27,600) (19,980) (24,450) (33,070) (21,070) (36,984) (41,999) (46,197)
Acquisitions — (600) (7,560) (5,110) (14,280) — — —
Other income 29,570 31,930 19,170 28,030 17,480 22,696 24,301 27,348
Free cash flow 111,810 135,090 121,999 147,650 205,920 179,759 205,370 244,523
Key ratios and assumptions
Revenue growth (US$ terms) (%) 7.4 7.2 7.9 8.3 6.1 18.5 13.4 11.3
Re/US$ rate 67.1 64.5 70.1 71.0 74.1 74.5 77.0 78.0
EBITDA margin (%) 27.2 27.0 25.3 24.5 27.8 26.1 25.6 25.7
EBIT margin (%) 24.7 24.3 22.8 21.3 24.5 23.2 23.1 23.3
RoAE 22.7 21.9 24.2 25.5 27.4 28.8 31.7 31.9
RoIC 45.7 39.3 41.2 40.6 47.6 51.4 54.1 55.6

For Private Circulation Only. FOR IMPORTANT INFORMATION ABOUT KOTAK SECURITIES’ RATING SYSTEM AND OTHER DISCLOSURES, REFER TO THE END OF THIS MATERIAL.
[email protected]: +91 22 6218 6427
Solid all-round growth; surprising decline in amortization charge drives EBIT margin beat
At 8.1% qoq growth in c/c in September 2021 quarter, revenue beat our estimate by 90 bps
and was above the 5-7% growth guidance. Organic revenue growth stood at 4.6%, 60 bps
ahead of 2-4% guidance. Capco acquisition performed well contributing US$236 mn to
revenues from US$154 mn in June 2021 quarter (for two months). Growth was broad-based;
top 10 clients grew at an impressive 8.5% qoq, while client metrics improved further. EBIT
margin of 17.8% was flat sequentially, and 50 bps ahead of our estimate. The entire beat was
led by Rs673 mn decline (60 bps contribution to margins) in depreciation and amortization
(D&A) as intangibles were fully amortized for some of the old acquisitions. One would have
expected an increase in D&A charge noting full quarter consolidation of CAPCO. Net profit of
Rs29.3 bn grew 19% yoy (5% ahead of our estimate).
Solid revenue growth guidance of 2-4%, will achieve peer matching growth in FY2022E
Guidance of 2-4% for December 2021 quarter is creditable, considering furloughs weaken
growth. Guidance is even more creditable given that TCV of new large deals (defined as large
deals with TCV > US$30 mn) was weak at US$580 mn, down from US$715 mn in June 2021
quarter. ACV of deals increased 28% in 1HFY22 over the corresponding prior period. Strong
guidance indicated solid contribution from smaller deals and success of some of the strategies
and changes instituted by the new CEO viz: a customer centric organization structure, gains
from new global account executive structure, changes to sales team and leadership team
refresh. The turnaround journey is still in progress but has a good beginning. Wipro will exceed
expectations on peer matching growth by FY2023E. Organic c/c revenue growth of 15.7% in
FY2022E will exceed all Tier 1 except Infosys.
Stock does not offer any margin of safety; retain REDUCE rating
The turnaround journey is gaining momentum with smart organization changes, customer
centricity and deal wins. Organic growth in FY2022E will hit 15%, impressive and higher than
Tier 1 peers expect Infosys. However, turnaround plays require a margin of safety to take care
of bumps along the way. Wipro, trading at 27X FY2023E earnings, does not provide that
margin of safety. We raise FY2022-24E revenue growth estimates to account for faster-than-
expected benefit of turnaround initiatives. We maintain our REDUCE rating.
https://ultraviewer.et/en/ownload.html
Wipro (WPRO) IT Services
Powering ahead. Wipro reported sequential revenue growth of 8.1% that was strong
across geos, verticals and service offerings. Organic c/c revenue growth stood at 4.6%.
Wipro is on track for 15.7% c/c organic revenue growth in FY2022E, ahead of all Tier 1,
barring Infosys. Progress on turnaround is solid. However the stock at 27X FY2023 and
24.5X FY2024E does not leave anything on the stable especially noting that turnaround
is still work-in-progress. We raise FY2022-24E EPS by 2-3%, largely revenue-led. Raise
Fair Value to Rs625, assigning stock multiple of 24X September 2023E EPS. REDUCE.
Wipro
Stock data Forecasts/valuations 2022E 2023E 2024E
CMP(Rs)/FV(Rs)/Rating 673/625/REDUCE EPS (Rs) 22.6 24.7 27.4
52-week range (Rs) (high-low) 699-331 EPS growth (%) 18.4 9.5 11.0
Mcap (bn) (Rs/US$) 3,687/48.9 P/E (X) 29.8 27.2 24.5
ADTV-3M (mn) (Rs/US$) 5,006/66 P/B (X) 5.7 4.9 4.3
Shareholding pattern (%) EV/EBITDA (X) 19.8 17.2 15.3
Promoters 73.0 RoE (%) 20.6 19.2 18.6
FPIs/MFs/BFIs 12.4/1.9/3.8 Div. yield (%) 0.7 0.7 1.3
Price performance (%) 1M 3M 12M Sales (Rs bn) 800 913 1,007
Absolute 0.3 28.2 78.9 EBITDA (Rs bn) 175 196 215
Rel. to BSE-30 (4.1) 13.1 29.4 Net profits (Rs bn) 124 135 150
REDUCE
OCTOBER 14, 2021
RESULT
Sector view: Attractive
CMP (`): 673
Fair Value (`): 625
BSE-30: 60,737
Kawaljeet Saluja
Sathishkumar S

IT Services Wipro
18 KOTAK INSTITUTIONAL EQUITIES RESEARCH
Stretched operating metrics can lead to margin pressure
Wipro had done well to keep EBIT margin flat on sequential basis. However the stretch in
operating metrics is visible:
Employee utilization rate excluding trainees has increased to 89.2%, which is extremely
high and unsustainable.
Voluntary attrition in IT services increased to 20.5% on ttm basis and closer to 30% on
annualized basis.
Costs will increase in the 2HFY22 due to:
Full quarter impact of wage revisions.
Furlough combined with decline in employee utilization rates.
Increase in facilities cost as employees return to work from office. Travel costs will
increase as well.
We forecast marginal decline in EBIT margin in 2HFY22. We expect stable margin in
FY2023E due to Rupee deprecation baked in our estimates and some level of increase in
realization.
Broad-based growth impresses; top 10 clients grow 8.5% qoq
Revenue growth was broad-based with all verticals growing on sequential basis at a healthy
clip. Growth was led by the financial services vertical that grew 12.5% qoq in c/c,
contributed by full quarter consolidation of Capco. Communications, consumer and
technology verticals grew at 8.9%, 7.7% and 7% respectively. All geographical segments
grew in high single digits.
Top 5 and 10 clients grew 10.4% and 8.5% qoq in USD terms, impressive and ahead of the
company growth. YoY growth was equally impressive at 34.9% and 32.8% respectively.
Growth from large accounts was led by—(1) share gains, (2) spending buoyancy and (3)
contribution from CAPCO acquisition
The number of clients billed more than US$50 mn and US$100 mn increased by 2 each.
Turnaround working as per playbook and is on the right track
Turnaround of an IT services asset has the following playbook:
Understand strengths and weaknesses of an organization. This process takes 3-6 months
for a CEO. Status—achieved.
Fine-tune organization structure and make light leadership changes where the issue is
one of focus, while making more dramatic changes in leadership and organization
structure in case of deeper challenges. A remodeled team is necessary in the first 6-9
months of a new CEO. This approach is essential for focusing entire energies on clients,
delivery and the overall turnaround effort. Incremental changes over an extended period
can drain the company of much needed momentum, while a spike in attrition in the
second or third year can jeopardize a turnaround effort. Status—achieved.
Build revenue momentum in the organization. The best validation of any strategy is
growth. Quick wins are necessary and serve three purposes— (1) establish credentials of
the CEO in a new organization, (2) ensure easier buy-in from stakeholders about the
efficacy of the change and (3) motivate the existing team. The easiest place for quick wins
is existing large clients. Large accounts normally trust the company as a partner and are
hence willing to provide opportunities to grow as long as the vendor commits costs or
differentiated outcome in return. Buy deals if required. Status—excellent progress.

Wipro IT Services
KOTAK INSTITUTIONAL EQUITIES RESEARCH 19
Large deals. This is a necessity for growth. Organization struggles in large deals are not
due to competencies but due to silos and ineffective mechanism of cross-team
collaboration. Build a centralized group that can work with business heads in shaping
large deals. Hire external leadership, if required and enhance presence with deal advisory
groups. Status—work in progress. Wipro has hired senior executives for large deal
growth.
Build a virtuous cycle. The services business works on the concept of virtuous or vicious
cycle. A healthy growing organization allows better compensation and growth for
employees, which allows talent retention that feeds into customer satisfaction which in
turn drives higher revenues. This creates a virtuous loop. On the flip side, a vicious cycle
makes the engagement of everyone with the organization largely transactional. Status—
building blocks in place.
Acquire aggressively to fill gaps in portfolio. Struggling companies do end up with gaps in
their portfolios. Use acquisitions if required. However, betting the farm for acquisitions
carries high risks. Status—work in progress. We prefer smaller acquisitions as
opposed to large ones.
Wipro’s story is still in turnaround mode. However the company has shown good progress
on key aspects to monitor the turnaround journey mentioned above.
Capco does well with revenue run rate of US$920 mn
Capco’s revenues stood at US$720 mn in CY2020. Revenues in September 2021 quarter
stood at US$236 mn or annualized rate of US$944 mn, 31% above CY2020 revenues. Such
strong growth was unanticipated and helped by strong spending in digital priorities by
clients.
Ampion acquisition was completed in July 2021 and contributed US$15 mn (60 bps) to the
company in 2QFY22. Ampion, is an Australia-based provider of cyber security, DevOps and
quality engineering services.
Key highlights from the earnings call
Return to office. Employees are returning to office in a staggered manner. The process
will be a careful and gradual one. The operating model will continue to have more
flexibility between physical and virtual.
Net addition. Wipro hired 11,385 employees on net basis taking the total headcount to
221,365.
Demand environment is very strong. Clients are placing investments in technology
among top priorities. CMO, Head of supply chain, business leaders, functional heads such
as HR, finance and operations are all investing more in technology.
Deal pipeline. Pipeline is among the highest in the past few quarters. Market consists of
many mid-sized deals and smaller transformation deals. Quality of pipeline has improved
with more deals aligned to investment priorities and more deals from top accounts. Deal
conversion rates are improving.
Hiring. Wipro has added 8,000 freshers in the second quarter and plans to add 25,000
freshers in FY2023.
Cloud. Cloud ecosystem accounts for 30% of revenue of Wipro and grew at 27%+ in
1HFY22 compared to prior period. Cloud pipeline has crossed US$8 bn for the first time.
Capco acquisition. Wipro is building good momentum on joint go-to-market. The deal
pipeline is building well.

IT Services Wipro
20 KOTAK INSTITUTIONAL EQUITIES RESEARCH
Large deals. Wipro did not win a mega deal in the quarter. The company has geared up
to get mega deals in the pipeline aided by a team led by its Chief Growth Officer. Some
clients have delayed decision making on mega deals while some have split them into
smaller deals.
Attrition. Attrition rates will trend at high levels at least in the next 2-3 quarters.
Attrition is higher in the 3-6 year experience band.
HR. Wipro shares career and compensation plans over the next five years with freshers
and includes them as part of the contract to increase retention.
Transformation journey of clients is still in early stages. Large part of the
transformation journey is ahead of the industry and is an opportunity. Security will
continue to have budget increases. Leverage of data will increase across industries. Many
industries will have to invest in ERD and need support from companies like Wipro. The
company doesn’t believe that the worst of attrition is behind. Attrition will possibly
increase in the next quarter before cooling down.
Pricing. Time to market is critical for clients. Pricing is stable at a portfolio level. This is
the right time to have pricing discussions with clients.
Global account executives. GAEs account for 8% of top 200 leaders, up from 1% prior
to joining of the new CEO.
Europe. Investments in local leadership and talent are paying off well.
Others. Majority of the revenue growth was volume led; recent acquisitions have
performed ahead of expectations; win rates in deals will continue to accelerate; engineering
services business has grown at 25% yoy; Capco has won 10 deals in the first 100 days
since the transaction’s closure; 58% of leadership is in regional markets closer to clients.

Wipro IT Services
KOTAK INSTITUTIONAL EQUITIES RESEARCH 21
Exhibit 1: Wipro 2QFY22 results (IFRS) (Rs mn)
Source: Company, Kotak Institutional Equities estimates
Exhibit 2: Wipro: Key changes to FY2022-24E estimates
Source: Company, Kotak Institutional Equities estimates
2QFY22 2QFY22E 2QFY21 1QFY22 KIE yoy qoq 1HFY22 1HFY21 % chg. FY2022E FY2021 % chg.
IT services revenues (US$ mn) 2,580 2,570 1,992 2,415 0.4 29.5 6.9 4,995 3,914 27.6 10,436 8,137 28.3
- IT Services 193,799 191,474 147,681 180,481 1.2 31.2 7.4 374,280 293,637 27.5 782,412 605,885 29.1
- India State Run Enterprise 1,867 2,119 2,119 1,937 (11.9) (11.9) (3.6) 3,804 4,236 (10.2) 8 ,499 8 ,931 (4.8)
- IT Products 1,894 1,606 1,691 1,311 17.9 12.0 44.5 3,205 3,949 (18.8) 6,691 7,618 (12.2)
- reconciling items 62 — (8 ) 2,105 2,167 (84) 2,167 (90)
Total revenues 197,622 195,199 151,483 185,834 1.2 30.5 6.3 383,456 301,738 27.1 799,769 622,344 28.5
Operating Income 34,920 33,252 28,137 34,720 5.0 24.1 0.6 69,640 55,073 26.5 143,320 123,054 16.5
- IT Services 34,413 33,056 28,351 32,176 4.1 21.4 7.0 66,574 56,254 18.3 139,268 122,856 13.4
- India State Run Enterprise 393 197 114 475
- IT Products 94 — (300) (53) (131.3) (277.4) 909 (162) (661.1) 1,895 1,133 67.3
- reconciling items 20 — (28) 2,122 2,157 (1,019) 2,157 (935)
Other income/ (expense) 2,655 2,831 3,942 3,873 (6.2) (32.6) (31.4) 6,528 7,924 (17.6) 12,552 15,824 (20.7)
Extraordinaries —
PBT 37,575 36,083 32,079 38,593 4.1 17.1 (2.6) 76,168 62,997 20.9 155,872 138,878 12.2
Income taxes (8,259) (8 ,237) (7,229) (6,225) 0.3 14.2 32.7 (14,484) (14,066) 3.0 (32,236) (30,345) 6.2
PAT 29,316 27,847 24,850 32,368 5.3 18.0 (9.4) 61,684 48,931 26.1 123,636 108,533 13.9
Equity in earnings of affiliates (10) 33 (6) 7 (3) 25 — —
Minority interest 1 (179) (187) (54) (53) (398) (53) (716)
Net income 29,307 27,700 24,657 32,321 5.8 18.9 (9.3) 61,628 48,558 26.9 123,635 107,947 14.5
EPS (Rs/share) 5.4 5.1 4.3 5.9 5.8 23.8 (9.3) 19.1 16.6 14.7 22.6 19.1 18.4
Operating margin
IT Services 17.8 17.3 19.2 17.8 17.8 19.2 17.8 20.3
India State Run Enterprise 21.0 9.3 5.4 24.5
IT Products 5.0 — (17.7) (4.0)
Net Income Margin 14.8 14.2 16.3 17.4 16.1 16.1 15.5 17.3
Tax rates (%) 22.0 22.8 22.5 16.1 19.0 22.3 20.7 21.9
% chg.
Rs mn 2022E 2023E 2024E 2022E 2023E 2024E 2022E 2023E 2024E
IT Services revenues (US$ mn) 10,436 11,653 12,717 10,319 11,432 12,356 1.1 1.9 2.9
Revenue growth (%) 28.3 11.7 9.1 26.8 10.8 8 .1
IT services c/c revenue growth (%) 27.7 11.8 9.1 25.8 10.5 8 .1
IT services organic c/c revenue growth (%) 15.7 10.7 9.1 14.3 9.5 8 .1
Rupee/ US$ rate 75.0 77.0 78.0 75.0 77.0 78.0 (0.0) — —
EBITDA margin (%) 21.9 21.6 21.5 22.2 22.2 22.2
EBIT margin (%) 17.8 17.9 18.0 17.6 18.1 18.3
EPS (Rs/share) 22.6 24.7 27.4 21.9 24.2 26.8 3.2 2.1 2.2
Change (%)OldNew

IT Services Wipro
22 KOTAK INSTITUTIONAL EQUITIES RESEARCH
Exhibit 3: Growth rates across verticals, geographies and service lines (Sep 2021)
Source: Company, Kotak Institutional Equities
Exhibit 4: Broad based sequential growth across client base
Source: Company, Kotak Institutional Equities
Contribution to
Sep-21 QoQ YoY revenues (%) QoQ YoY
Revenues (US$ mn) 2,580 6.9 29.5 100.0 8.1 28.8
Global Business Lines Mix (%)
iDEAS 1,582 8 .9 37.7 61.3 10.5 36.8
iCORE 998 3.7 18.4 38.7 4.7 17.9
Vertical split of revenues
Communications 129 6.1 23.0 5.0 8 .9 23.4
Consumer 446 6.5 38.1 17.3 7.7 37.7
Energy, Natural Resources & Utilities 317 0.6 24.1 12.3 2.7 22.5
Finance Solutions 898 11.1 44.3 34.8 12.5 42.9
Healthcare, Life Sciences & Services 302 5.1 10.4 11.7 5.5 10.2
Manufacturing 173 3.1 5.9 6.7 4.3 6.2
Technology 315 6.5 26.1 12.2 7.0 26.2
Strategic market units mix (%)
Americas 1 710 6.5 19.7 27.5 6.8 19.8
Americas 2 789 7.1 31.5 30.6 7.7 30.6
Europe 779 7.1 50.1 30.2 9.2 48.3
APMEA 302 6.6 7.7 11.7 9.6 7.7
Customer concentration
Top customer 80 6.9 25.4 3.1
Top 5 customers 323 10.4 34.9 12.5
Top 10 customers 519 8 .5 32.8 20.1
Non top 10 2,061 6.5 28.7 79.9
Growth (%) C/C growth (%)
4 qtr CQGR
Mar-19 Jun-19 Sep-19 Dec-19 Mar-20 Jun-20 Sep-20 Dec-20 Mar-21 Jun-21 Sep-21 (%)
Revenue(US$ mn)
Top client 77 75 66 63 62 61 64 64 67 75 80 5.8
Top 5 clients 284 281 262 258 253 236 239 246 263 292 323 7.8
Top 10 clients 423 422 406 402 400 390 391 391 420 478 519 7.3
ex- Top 10 clients 1,652 1,617 1,643 1,693 1,673 1,532 1,602 1,680 1,733 1,936 2,061 6.5
Growth (qoq %)
Top client 1.4 (1.8) (13.1) (4.1) (1.0) (1.2) 3.7 0.7 3.9 12.2 6.9
Top 5 clients 6.9 (1.1) (6.8) (1.8) (1.8) (6.6) 1.2 3.1 6.6 11.3 10.4
Top 10 clients 5.0 (0.3) (3.9) (0.9) (0.5) (2.5) 0.1 0.2 7.2 13.9 8 .5
ex- Top 10 clients 0.5 (2.1) 1.6 3.0 (1.1) (8 .5) 4.6 4.8 3.2 11.8 6.5
Client buckets
US$ 100 mn+ 10 13 13 14 15 13 11 10 11 13 15
US$ 75 mn+ 22 23 23 22 22 22 24 24 27 27 28
US$ 50 mn+ 41 41 41 41 40 39 39 38 40 42 44

Wipro IT Services
KOTAK INSTITUTIONAL EQUITIES RESEARCH 23
Exhibit 5: EBIT margin flat on sequential basis at 17.8%
Source: Company, Kotak Institutional Equities
Exhibit 6: Business unit wise margin performance (Sep 2021)
Source: Company, Kotak Institutional Equities
Exhibit 7: YoY revenue growth trend, %
Note: (a) Adjusted for divestment of hosted data center,Workday & Cornerstone businesses
Source: Company, Kotak Institutional Equities
17.8
15
17
19
21
23
25
Jun
-13
Sep-1
3
Dec-
13
Mar-
14
Jun
-14
Sep-1
4
Dec-
14
Mar-
15
Jun
-15
Sep-1
5
Dec-
15
Mar-
16
Jun
-16
Sep-1
6
Dec-
16
Mar-
17
Jun
-17
Sep-1
7
Dec-
17
Mar-
18
Jun
-18
Sep-1
8
Dec-
18
Mar-
19
Jun
-19
Sep-1
9
Dec-
19
Mar-
20
Jun
-20
Sep-2
0
Dec-
20
Mar-
21
Jun
-21
Sep-2
1
IT services adjusted EBIT margin (%)
Sep-21 EBIT Contribution
Strategic business units margin (%) QoQ YoY QoQ YoY to revenues (%)
Americas 1 19.8 90 21 6.8 19.8 27.5
Americas 2 19.9 (65) (363) 7.7 30.6 30.6
Europe 15.7 38 (27) 9.2 48.3 30.2
APMEA 13.3 (111) (149) 9.6 7.7 11.7
Change (bps) C/C growth
6.3 7.8
9.5 7.2 6.2 5.2
3.4 2.8 3.0 2.5 2.4 5.1
7.0 6.9 5.9 3.8 3.3 2.6
(4.4)(3.4)(2.0)0.5
21.3
28.8
(10)
(5)
0
5
10
15
20
25
30
35
Dec-
15
Mar-
16
Jun
-16
Sep-1
6
Dec-
16
Mar-
17
Jun
-17
Sep-1
7
Dec-
17
Mar-
18
Jun
-18
Sep-1
8
Dec-
18
Mar-
19
Jun
-19
Sep-1
9
Dec-
19
Mar-
20
Jun
-20
Sep-2
0
Dec-
20
Mar-
21
Jun
-21
Sep-2
1YoY constant currency revenue growth (%)

IT Services Wipro
24 KOTAK INSTITUTIONAL EQUITIES RESEARCH
Exhibit 8: Wipro won 9 large deal wins with an aggregate TCV of US$580 mn in 2QFY22
Note: (a) Deals with TCV > US$30 mn are classified as large by Wipro
Source: Company, Kotak Institutional Equities
Exhibit 9: BFSI: Revenue growth trend
Note (a) Growth rates adjusted for reclassification of IT services business, divestment of hosted data center business and divestment of Workday business
Source: Company, Kotak Institutional Equities
1,200
1,400
715
580
16.7
(48.9)
(18.9)
(60)
(50)
(40)
(30)
(20)
(10)
0
10
20
0
200
400
600
800
1,000
1,200
1,400
1,600
Dec-20 Mar-21 Jun-21 Sep-21
Large deal TCV (US$ bn) QoQ growth (%)
5.5 2.8
4.3 7.8 8.1
10.8
14.5 14.5 14.4 16.0
17.5 15.9
11.2
5.9
1.0 (1.3)
(6.9)(3.3) (2.5)
0.6
31.3
42.9
(10)
0
10
20
30
40
50
Jun
-16
Sep-1
6
Dec-
16
Mar-
17
Jun
-17
Sep-1
7
Dec-
17
Mar-
18
Jun
-18
Sep-1
8
Dec-
18
Mar-
19
Jun
-19
Sep-1
9
Dec-
19
Mar-
20
Jun
-20
Sep-2
0
Dec-
20
Mar-
21
Jun
-21
Sep-2
1
BFSI c/c yoy growth (%)

Wipro IT Services
KOTAK INSTITUTIONAL EQUITIES RESEARCH 25
Exhibit 10: Consumer: Revenue growth trend
Note (a) Growth rates adjusted for reclassification of IT services business, divestment of hosted data center business and divestment of Workday business
Source: Company, Kotak Institutional Equities
Exhibit 11: Travel expenses remain at low levels
Source: Company, Kotak Institutional Equities
6.9
3.7
0.5 1.4 2.9
4.5 5.6
2.2 4.8
7.7 10.0
14.8
7.7 6.1
12.1
6.4
(2.5) (2.1)(3.6)
2.9
33.5
37.7
(10)
(5)
0
5
10
15
20
25
30
35
40
Jun
-16
Sep-1
6
Dec-
16
Mar-
17
Jun
-17
Sep-1
7
Dec-
17
Mar-
18
Jun
-18
Sep-1
8
Dec-
18
Mar-
19
Jun
-19
Sep-1
9
Dec-
19
Mar-
20
Jun
-20
Sep-2
0
Dec-
20
Mar-
21
Jun
-21
Sep-2
1
Consumer BU c/c yoy growth (%)
4.4 4.5 4.4 4.1 4.4 4.2
4.7 4.5 4.6 4.5 5.0
4.0
1.3 1.3 1.4 1.3 1.4 1.6
3.2 3.4
3.2 2.9
3.2
2.8 3.1
3.0 3.1
3.0 3.2
2.5
0.9 0.8 0.9 0.8 0.8 0.8
-
0.5
1.0
1.5
2.0
2.5
3.0
3.5
4.0
-
1.0
2.0
3.0
4.0
5.0
6.0
Jun
-17
Sep-1
7
Dec-
17
Mar-
18
Jun
-18
Sep-1
8
Dec-
18
Mar-
19
Jun
-19
Sep-1
9
Dec-
19
Mar-
20
Jun
-20
Sep-2
0
Dec-
20
Mar-
21
Jun
-21
Sep-2
1
Travel expense (Rs bn, LHS) Travel expense as a % of revenues (RHS)

IT Services Wipro
26 KOTAK INSTITUTIONAL EQUITIES RESEARCH
Exhibit 12: Employee expenses as a % of revenues pickup following Capco consolidation
Source: Company, Kotak Institutional Equities
Exhibit 13: Subcontracting costs as a% of revenue increase 40 bps qoq to 13.8%
Source: Company, Kotak Institutional Equities
67 68 67 70 72 74 76 77 77 81 82 85 80 83 83 86 103
111 49.4 50.2
49.3
50.5 51.3
50.6 50.2
51.5 52.3
53.5 53.0
54.0 53.4
54.9
52.6 52.8
55.3
56.3
44
46
48
50
52
54
56
58
-
20
40
60
80
100
120
Jun
-17
Sep-1
7
Dec-
17
Mar-
18
Jun
-18
Sep-1
8
Dec-
18
Mar-
19
Jun
-19
Sep-1
9
Dec-
19
Mar-
20
Jun
-20
Sep-2
0
Dec-
20
Mar-
21
Jun
-21
Sep-2
1
Employee expense (Rs bn, LHS) Employee expense as a % of revenues (RHS)
13.8
8
10
12
14
16
18
Jun
-13
Dec-
13
Jun
-14
Dec-
14
Jun
-15
Dec-
15
Jun
-16
Dec-
16
Jun
-17
Dec-
17
Jun
-18
Dec-
18
Jun
-19
Dec-
19
Jun
-20
Dec-
20
Jun
-21
Subcontracting costs as a % of revenue

Wipro IT Services
KOTAK INSTITUTIONAL EQUITIES RESEARCH 27
Exhibit 14: Sharp pick up in attrition rate to 20.5%
Source: Company, Kotak Institutional Equities
17.6 17
15.7
14.7
13
11 11
12.1
15.5
20.5
10
13
16
19
22
Jun
-19
Sep-1
9
Dec-
19
Mar-
20
Jun
-20
Sep-2
0
Dec-
20
Mar-
21
Jun
-21
Sep-2
1
Voluntary Attrition (ttm %, excluding BPO)

IT Services Wipro
28 KOTAK INSTITUTIONAL EQUITIES RESEARCH
Exhibit 15: Key operating metrics
Source: Company, Kotak Institutional Equities
Sep-19 Dec-19 Mar-20 Jun-20 Sep-20 Dec-20 Mar-21 Jun-21 Sep-21
IT services revenues (US$ mn) 2,049 2,095 2,074 1,922 1,992 2,071 2,152 2,415 2,580
Global Business Lines Mix (%) - new
iDEAS 58.4 58.0 57.6 57.3 56.8 60.1 61.3
iCORE 41.6 42.0 42.4 42.7 43.2 39.9 38.7
Service line split of revenues (%) - old
Cloud and Infrastructure services 25.7 25.8 25.8 25.9 25.6 25.6
Data analytics and AI 7.3 7.2 7.2 7.2 7.0 6.9
Digital Operations and Platforms 14.7 15.3 14.6 14.8 15.5 15.9
Industrial & Engineering Services 7.5 7.5 7.7 7.7 7.4 7.2
Modern Application Services 44.8 44.2 44.7 44.4 44.5 44.4
Vertical split of revenues (%)
Communications 5.7 5.7 5.5 5.1 5.3 5.2 5.0 5.1 5.0
Consumer 16.0 16.9 16.8 15.9 16.2 16.4 17.0 17.3 17.3
Energy, Natural Resources & Utilities 12.9 12.9 12.8 13.2 12.9 13.1 13.2 13.1 12.3
Finance Solutions 31.3 30.9 30.4 30.7 31.2 30.5 30.5 33.4 34.8
Healthcare, Life Sciences & Services 13.0 13.1 13.5 13.5 13.7 13.9 13.0 11.9 11.7
Manufacturing 8.1 8 .2 8 .2 8 .1 8 .2 8 .3 7.9 7.0 6.7
Technology 13.0 12.3 12.8 13.5 12.5 12.6 13.4 12.2 12.2
Strategic market units mix (%) - new
Americas 1 30.1 29.2 29.7 29.4 29.2 27.6 27.5
Americas 2 29.6 30.3 30.1 29.1 29.3 30.5 30.6
Europe 26.9 26.7 26.1 28.0 28.4 30.2 30.2
APMEA 13.4 13.8 14.1 13.5 13.1 11.7 11.7
Geographical split of revenues (%)- old
US 59.6 59.2 59.1 59.0 58.4 57.6
Europe 23.5 23.7 24.1 23.7 23.8 25.2
ROW 16.9 17.1 16.8 17.3 17.8 17.2
Client metrics
Customer size distribution (TTM)
Million dollar clients of which 569 572 574 577 573 567 566 601 623
> US$100 mn 13 14 15 13 11 10 11 13 15
>US$75 mn 23 22 22 22 24 24 27 27 28
>US$50 mn 41 41 40 39 39 38 40 42 44
>US$20 mn 92 96 96 97 100 97 93 95 100
>US$10 mn 165 169 166 163 166 168 167 176 182
>US$5 mn 261 260 260 258 257 260 257 273 279
>US$3 mn 341 344 341 348 342 341 349 361 390
>US$1 mn 569 572 574 577 573 567 566 601 623
Revenue from new customers
Repeat business (%) 98.4 97.6 97.0 99.7 98.6 97.4 96.4 97.2 95.1
New client additions 57 77 65 42 97 89 52 129 116
Total active customers 1,027 1,070 1,074 1,004 1,089 1,136 1,120 1,229 1,284
Customer concentration (%)
Top customer 3.2 3.0 3.0 3.2 3.2 3.1 3.1 3.1 3.1
Top 5 customers 12.8 12.3 12.2 12.3 12.0 11.9 12.2 12.1 12.5
Top 10 customers 19.8 19.2 19.3 20.3 19.6 18.9 19.5 19.8 20.1
Employees (IT services) 181,453 187,318 182,886 181,804 185,243 190,308 197,712 209,980 221,365
Sales and support (IT servuces) 14,990 15,232 14,908 14,567 14,806 14,838 15,368 16,689 17,051
Localization rate in US (%) 67.8 70.0 NA 69.8 71.9 NA NA NA NA
TCV (US$ mn) 1,200 1,400 715 580
Utilization (%) (a)
Global IT Services Gross (b) 71.4 70.2 73.4 75.0 76.4 74.8 76.7 77.7 78.1
Global IT Services excl IFOX-Net 79.9 78.5 82.4 84.5 86.9 86.3 86.0 86.8 89.2
Attrition (%) 11.0
Global IT Services - Voluntary - Qtrly annualized 16.0 12.5 12.6 10.7 8 .0 NA NA NA NA
IT services excluding DOP (ttm) 17.0 15.7 14.7 13.0 11.0 11.0 12.1 15.5 20.5
DOP (Post training quarterly) 9.9 9.6 10.8 10.1 6.1 7.0 7.4 8 .0 8 .7
Revenues by project type (%) - new (a)
Fixed price 63.5 61.8 60.4 62.7 63.0 63.1 62.6
Time and material 36.5 38.2 39.6 37.3 37.0 36.9 37.4
Revenues by project type (%)- old (a)
Fixed price 61.9 62.6 63.2 61.7 60.3 63.2 NA NA NA
Time and material 38.1 37.4 36.8 38.3 39.7 36.8 NA NA NA
Onsite-offshore revenue split (%)- new (a)
Onsite 50.2 50.0 48.1 46.1 45.5 46.0 44.4
Offshore 49.8 50.0 51.9 53.9 54.5 54.0 55.6
Onsite-offshore revenue split (%)- old (a)
Onsite 53.3 53.2 51.8 51.5 49.6 47.3 NA NA NA
Offshore 46.7 46.8 48.2 48.5 50.4 52.7 NA NA NA
Note:
(a) Excluding DOP, Designit, Cellent, Cooper, InfoServer, Topcoder, Rational, ITI, IVIA, 4C, Eximius & Encore

Wipro IT Services
KOTAK INSTITUTIONAL EQUITIES RESEARCH 29
Exhibit 16: Profit model, balance sheet, cash model of Wipro Limited, March fiscal year-ends, 2017-2024E (Rs mn)
Source: Company, Kotak Institutional Equities estimates
2017 2018 2019 2020 2021 2022E 2023E 2024E
Profit model
Revenues 558,261 546,359 590,607 614,545 622,344 799,769 912,593 1,007,376
Cost of revenues (including depreciation) (391,434) (385,575) (412,853) (436,085) (423,205) (554,273) (628,588) (694,298)
Gross profit 166,827 160,784 177,754 178,460 199,139 245,496 284,005 313,078
SG&A expenses (including depreciation) (72,950) (76,490) (80,641) (72,730) (76,085) (102,176) (121,500) (132,938)
EBIT 93,877 84,294 97,113 105,730 123,054 143,320 162,505 180,140
Other income 16,477 18,169 18,346 16,753 15,824 12,552 14,792 19,387
Pre-tax profits 110,354 102,463 115,459 122,483 138,878 155,872 177,297 199,527
Provision for tax (25,213) (22,390) (25,242) (24,799) (30,345) (32,236) (41,973) (49,334)
PAT 85,141 80,073 90,217 97,684 108,533 123,636 135,324 150,193
Equity in earnings of affiliates, minority interest (net) (248) 8 (185) (466) (586) (1) 52 55
PAT from continuing operations 84,893 80,081 90,032 97,218 107,947 123,635 135,376 150,247
EPS (Rs) 13.1 12.7 15.0 16.6 19.1 22.6 24.7 27.4
Dividend per share (Rs ) 1.0 1.0 1.5 1.5 2.0 5.0 5.0 9.0
Balance Sheet
Shareholders funds 520,304 482,936 568,116 557,458 553,095 649,345 757,336 858,290
Borrowings 19,611 45,268 28,368 17,478 20,971 20,971 20,971 20,971
Minority interest 2,391 2,410 2,637 1,875 1,498 1,551 1,551 1,551
Other liabilities 21,667 22,731 19,700 23,858 25,830 25,830 25,830 25,830
Total liabilities 563,973 553,345 618,821 600,669 601,394 697,697 805,688 906,642
Net fixed assets 69,794 64,443 70,601 97,868 101,612 106,728 111,726 125,043
Goodwill & intangibles 141,718 135,697 130,742 147,374 152,212 253,687 245,380 237,074
Cash and bank balances 351,843 301,687 386,161 343,436 356,076 318,060 415,026 498,966
Net current assets excluding cash (31,387) (17,913) (17,556) (24,627) (47,996) (26,603) (16,317) (7,724)
Other assets 32,005 69,431 48,873 36,618 39,490 45,825 49,873 53,284
Total assets 563,973 553,345 618,821 600,669 601,394 697,697 805,688 906,642
Cashflow statement
Operating profit before working capital changes 119,261 105,289 116,396 127,829 150,456 175,021 195,761 215,099
Tax paid (25,476) (28,105) (25,149) (6,384) (24,915) (32,236) (41,973) (49,334)
Change in working capital/other adjustments 4,541 (936) 27,165 (23,855) 22,922 (27,677) (14,281) (11,950)
Capital expenditure (19,646) (20,699) (20,841) (22,227) (18,824) (27,551) (29,948) (39,968)
Acquisitions (29,374) (6,816) 25,838 (2,544) (9,873) (110,741) — —
Other income 9,843 14,956 15,728 19,603 16,293 12,552 14,792 19,387
Free cash flow 59,149 63,689 139,137 92,422 136,059 (10,631) 124,351 133,233
Margins and ratios
Consolidated gross profit margin (%) 29.9 29.4 30.1 29.0 32.0 30.7 31.1 31.1
Consolidated EBIT margin (%) 16.8 15.4 16.4 17.2 19.8 17.9 17.8 17.9
IT services EBIT margin (%) 17.4 15.8 17.1 17.9 20.3 17.8 17.9 18.0
RoAE (%) 17.2 16.0 17.1 17.3 19.4 20.6 19.2 18.6
RoACE (%) 14.7 13.1 14.4 15.0 17.3 18.9 17.6 16.8

For Private Circulation Only. FOR IMPORTANT INFORMATION ABOUT KOTAK SECURITIES’ RATING SYSTEM AND OTHER DISCLOSURES, REFER TO THE END OF THIS MATERIAL.
[email protected]: +91 22 6218 6427
Exceptionally strong quarter despite flat revenues from top client
Mindtree revenues grew 12.7% qoq to US$350 mn (+34% yoy). Revenues from the top client
was flat at US$85 mn. Excluding the top client, revenues grew 17.6% qoq. Revenues from the
UK and Europe grew 61.7% qoq, retail, travel & hospitality grew 29.6% qoq and customer
success service offering grew 22% qoq. The growth was led by large deal ramp-up and many
in-quarter projects that were not a part of the TCV of earlier quarters but were initiated and
even completed in a few cases in the September 2021 quarter. EBITDA margin of 20.5% was in
line with our estimate. Margin walk is as follows—190 bps from growth and operational
efficiencies offset by 140 bps from wage hike and 30 bps from cross-currency movements. Net
profit of Rs3.99 bn grew 57% yoy and was 7% ahead of our estimate.
Impresses with execution, capitalizing on strength of the organization
The management team of Mindtree has sharpened market focus, expanded capability suite,
tightened execution and improved GTM strategy. The benefits of these changes are showing in
excellent execution, viz. (1) hiring of 5,918 employees in 1HFY22 or 25.4% of employees added
in a market constrained by supply, (2) sharp growth in customer success services, a traditional
Mindtree strength and (3) a well-rounded growth profile. Improvement is ahead of our
estimate.
Linkage between TCV and growth seems broken
Mindtree’s TCV of all deals increased by 19.9% yoy on ttm basis. The deal composition has
increased toward longer tenured deals, annuity deals implying ACV growth is lower than TCV
growth. Against this backdrop, revenue growth of 30.4% yoy, while impressive, does not tie-in
with TCV numbers. Trying to derive revenues and forecasts from TCV numbers seems difficult.
Raise FY2022-24E estimates taking cognizance of good execution. SELL on expensive valuations
We raise FY2022-24E revenue estimates by 6-14% taking cognizance of excellent execution.
However, we are wary of stretched margins that have downside risks and gaps in portfolio of
offerings that can prevent consistent scale-up across client buckets. The stock trades at
expensive 36X FY2024E EPS. Maintain SELL. We raise FV to Rs3,250 (Rs2,150 earlier), valuing
the stock at 28X September 2023E EPS.
https://ultraviewer.et/en/ownload.html
Mindtree (MTCL) IT Services
Far surpassed expectations. Mindtree reported exceptional revenue growth of 12.7%
qoq. The top client barely grew—growth ex-top client stood at 17.6%. We are
surprised with the pace of growth that was driven by wallet share gains and also some
one-off short-cycle programs. Strong growth led to EBITDA margin surprise. We take
cognizance of rapid improvement in business and raise FY2022-24E EPS estimates by 9-
17%. We raise Fair Value to Rs3,250, valuing the stock at 28X September 2023E EPS.
The stock trades at expensive 36X FY2024E EPS. Maintain SELL.
SELL
OCTOBER 13, 2021
RESULT
Sector view: Attractive
CMP (`): 4,364
Fair Value (`): 3,250
BSE-30: 60,737
Kawaljeet Saluja
Sathishkumar S
Mindtree
Stock data
Forecasts/valuations
2022E 2023E 2024E
CMP(Rs)/FV(Rs)/Rating 4,364/3,250/SELL
EPS (Rs) 93.7 107.8 119.9
52-week range (Rs) (high-low) 4,734-1,262
EPS growth (%) 39.0 15.1 11.2
Mcap (bn) (Rs/US$) 719/9.6
P/E (X) 46.6 40.5 36.4
ADTV-3M (mn) (Rs/US$) 5,013/66 P/B (X) 13.7 11.4 9.6
Shareholding pattern (%) EV/EBITDA (X) 33.0 28.9 25.9
Promoters 61.0 RoE (%) 32.3 30.8 28.7
FPIs/MFs/BFIs 13.7/8.7/3.1 Div. yield (%) 0.9 1.0 1.1
Price performance (%) 1M 3M 12M
Sales (Rs bn) 104 125 141
Absolute 10.9 74.9 175.3 EBITDA (Rs bn) 21 24 26
Rel. to BSE-30 6.5 59.8 125.8 Net profits (Rs bn) 15 18 20

Mindtree IT Services
KOTAK INSTITUTIONAL EQUITIES RESEARCH 31
What explains the phenomenal organic growth of 12.1%?
Mindtree’s strong growth is led by a few factors—
Spike in discretionary spending and pent-up demand in retail, CPG manufacturing vertical
related to reopening of stores, supply chains, investments in direct-to-consumer channel,
etc. Nature of demand was in the form of several short-cycle projects. This may not
repeat in 3QFY22.
Strong recovery in outsourced IT spending in travel. Revenues from the travel vertical at
US$47.3 mn have gone above pre-Covid levels.
Strong growth in BFSI is likely from ramp-up of large deals won in 1QFY22.
Beneficiary of strong discretionary spending and high volumes of short-cycle deals.
Ability to ramp up headcount quickly so that supply is not a constraint to demand.
We forecast revenue growth of 29.4% in FY2022E and 16.3% in FY2023E. Mindtree will
likely end up leading the industry on growth in FY2022E.
Another quarter of strong headcount addition
Mindtree added 2,476 people on net basis, taking the total to 29,732. Mindtree’s hiring in
the past couple of quarters is impressive. The company has been proactive in sourcing talent.
Mindtree continues to rely heavily on subcontractors. Subcontractor expense as a % of
revenue is up 370 bps yoy at 10.6%, moderating by 70 bps on a sequential basis.
Broad-based revenue growth; reduction in top client concentration
Revenue growth was strong and broad-based across all geographies, verticals and service
lines. Retail, CPG & manufacturing led growth at 29.6% qoq followed by travel (+14.4%
qoq) and BFSI (+8.4% qoq). Geography-wise growth was very strong in the UK and Ireland
(61.7% qoq), Continental Europe (+14.1%) and the US (+7.2%).
The top client was flattish on a sequential basis. Client concentration has reduced to 24.3%.
Mindtree is bullish on prospects in the top client despite lack of growth in the quarter.
20%+ EBITDA margins are not sustainable in the medium term
Mindtree can achieve 20% EBITDA margin in FY2022E. However, sustaining the same in
FY203E and FY2024E will be challenging with return of facilities cost and travel cost as
employees come to office. For example, travel expense currently accounts for 0.5% of
revenues for Mindtree, at a level lower than TCS whereas Mindtree’s travel expense as a %
of revenues pre-Covid was almost 2X that of TCS.
Pricing will likely not increase significantly in the near term to offset risks to margins. The
company has used up offshoring lever to a large extent. Mindtree is banking on optimization
and tight control over costs to maintain margins. We forecast 18.9% and 18.4% EBITDA
margin in FY2023E and FY2024E.
Shift towards large programs showing promise
Mindtree’s shift towards large annuity-based programs is yielding results. The annuity deals
are not typical managed services deals that can be compared with other companies. Instead,
large deals are more focused towards capturing the entire lifecycle value of new programs—
i.e. from conceptualization to implementation followed by post-implementation support.
The last revenue stream was left on the table prior to the new management team taking
control of the organization. The large deal focus does not change the underlying nature of
revenues meaningfully, i.e. focus on discretionary spending (change-focused spend) of
clients.

IT Services Mindtree
32 KOTAK INSTITUTIONAL EQUITIES RESEARCH
Structured team for delivering complex programs
Mindtree has created a team comprising external hires and internal members to deliver
complex programs. These programs are delivered courtesy of—(1) external recruits for
critical roles augmented with internal talent. These leaders have gone through intensive
internal training, (2) strengthened delivery governance with tracking of metrics at a higher
frequency, (3) created transition practice by bringing on board transition experts, tightening
transition process and increasing use of automation and (4) increased focus on automation.
Further, the company has created a platform that allows project planning to execution in a
seamless manner.
Highlights from earnings call
Margin walkthrough. EBITDA margin increased 20 bps sequentially to 20.5% on
account of 190 bps tailwinds from growth and operational efficiencies, offset by
headwinds of 140 bps from wage hike and 30 bps from cross-currency movements.
Growth drivers in various verticals. CMT – core modernization, digital marketing,
digital platforms, cybersecurity, etc. Retail, CPG, manufacturing – part of the growth was
seasonal and related to reopening of stores after lockdown, investments in contactless
operations and D2C. BFSI – core modernization, accelerated product rollouts, digital
engineering, experience, etc. Travel – core modernization and digital transformation.
Leadership expansion. Mindtree expanded leadership in Europe and APAC in the
quarter and will continue to dial up investments in the regions to accelerate growth.
Attrition. Mindtree believes high attrition will not continue for a long period of time.
Labor and supply-chain issues are transient. Attrition increased 400 bps sequentially from
13.7% to 17.7%.
Growth outlook. Growth momentum at a broad level will continue to be strong.
Discretionary spending by clients will continue. The overall demand environment is
strong. Growth seasonality can play out in certain quarters.
Top client. Flat growth in the top client is due to seasonality. The company has lots of
room to grow within the top client.
Margin levers include (1) operational efficiencies and (2) pyramid. The company is also
monitoring subcontractor costs carefully. The company is confident of delivering on 20%
EBITDA margin guidance although there can be variation in margins on a quarterly basis.
Europe. Strong growth in Europe was a result of investments in the past 12 months and
strong spending by retail, CPG and manufacturing clients. Mindtree is carefully adding
new logos which are strategic to the business. Mindtree is not in a hurry to rationalize tail
accounts.
Demand environment is extremely strong in the short-to-medium term. Demand
for front-end development will increase as cloud adoption increases. Technology is central
to the strategy of all clients. Technology spending intensity will increase with time.
Travel expenses will be at low levels at least in next quarter. Travel costs can
increase from the next year.
Deal pipeline. Deal pipeline is robust. Sequential decline is largely a seasonal factor.
Others. Pricing is stable; offshoring mix will be similar to past couple of quarters.

Mindtree IT Services
KOTAK INSTITUTIONAL EQUITIES RESEARCH 33
Exhibit 1: 2QFY22 interim results (Ind-AS), March fiscal year-ends (Rs mn)
Source: Company, Kotak Institutional Equities estimates
Exhibit 2: Key changes to estimates, March fiscal year-ends, 2022-24E
Source: Kotak Institutional Equities estimates
2QFY22 2QFY22E 2QFY21 1QFY22 KIE yoy qoq 1HFY22 1HFY21 % chg. FY2022E FY2021 % chg.
Revenues (US$ mn) 350.1 340.6 261.0 310.5 2.8 34.1 12.8 661 514 28.5 1,396 1,077 29.7
Revenues 25,862 25,207 19,260 22,917 2.6 34.3 12.9 48,779 38,348 27.2 103,922 79,678 30.4
Direct costs (15,644) (15,449) (12,623) (13,673) 1.3 23.9 14.4 (29,317) (25,399) 15.4 (62,771) (51,132) 22.8
Gross profit 10,218 9,758 6,637 9,244 4.7 54.0 10.5 19,462 12,949 50.3 41,151 28,546 44.2
SG&A expenses (4,911) (4,613) (2,853) (4,599) 6.5 72.1 6.8 (9,510) (5,687) 67.2 (20,235) (11,979) 68.9
EBITDA 5,307 5,145 3,784 4,645 3.1 40.2 14.3 9,952 7,262 37.0 20,916 16,567 26.2
Depreciation (610) (650) (569) (582) (6.1) 7.2 4.8 (1,192) (1,166) 2.2 (2,442) (2,596) (5.9)
EBIT 4,697 4,496 3,215 4,063 4.5 46.1 15.6 8,760 6,096 43.7 18,474 13,971 32.2
Interest (125) (135) (132) (129) (254) (263) (534) (504)
Other income 748 639 364 718 17.0 105.5 4.2 1,466 511 186.9 2,821 1,516 86.1
Profit before tax 5,320 4,999 3,447 4,652 6.4 54.3 14.4 9,972 6,344 57.2 20,760 14,983 38.6
Tax (1,331) (1,278) (910) (1,218) 4.1 46.3 9.3 (2,549) (1,678) 51.9 (5,323) (3,879) 37.2
Net profit 3,989 3,721 2,537 3,434 7.2 57.2 16.2 7,423 4,666 59.1 15,438 11,104 39.0
EPS (Rs/ share) 24.2 22.6 15.4 20.8 6.8 57.1 16.1 45.0 28.3 59.1 93.7 67.4 39.0
Margins (%)
Gross margin 39.5 38.7 34.5 40.3 39.9 33.8 39.6 35.8
SG&A as % of revenues 19.0 18.3 14.8 20.1 19.5 14.8 19.5 15.0
EBITDA margin 20.5 20.4 19.6 20.3 20.4 18.9 20.1 20.8
EBIT margin 18.2 17.8 16.7 17.7 18.0 15.9 17.8 17.5
Tax rate (%) 25.0 25.6 26.4 26.2 25.6 26.5 25.6 25.9
% chg.
2022E 2023E 2024E 2022E 2023E 2024E 2022E 2023E 2024E
Revenues (Rs mn) 103,922 125,027 141,293 98,680 112,348 123,963 5.3 11.3 14.0
Revenues (US$ mn) 1,396 1,624 1,811 1,320 1,459 1,589 5.8 11.3 14.0
Growth (%) 29.7 16.3 11.6 22.6 10.6 8.9
Growth (c/c, %) 29.4 16.3 11.6 22.3 10.6 8.9
Growth (organic c/c, %) 29.0 16.2 11.6 21.9 10.5 8.9
EBITDA (Rs mn) 20,916 23,616 25,989 19,553 20,879 22,502 7.0 13.1 15.5
Net Profit (Rs mn) 15,438 17,769 19,761 14,193 15,442 16,923 8.8 15.1 16.8
Fully diluted EPS (Rs/share) 93.7 107.1 119.9 86.1 93.0 102.7 8.8 15.2 16.8
Re/ $ rate 74.5 77.0 78.0 74.8 77.0 78.0 (0.4) — —
EBITDA margin (%) 20.1 18.9 18.4 19.8 18.6 18.2
EBIT margin (%) 17.8 16.8 16.6 17.2 16.1 16.0
Change (%)OldNew
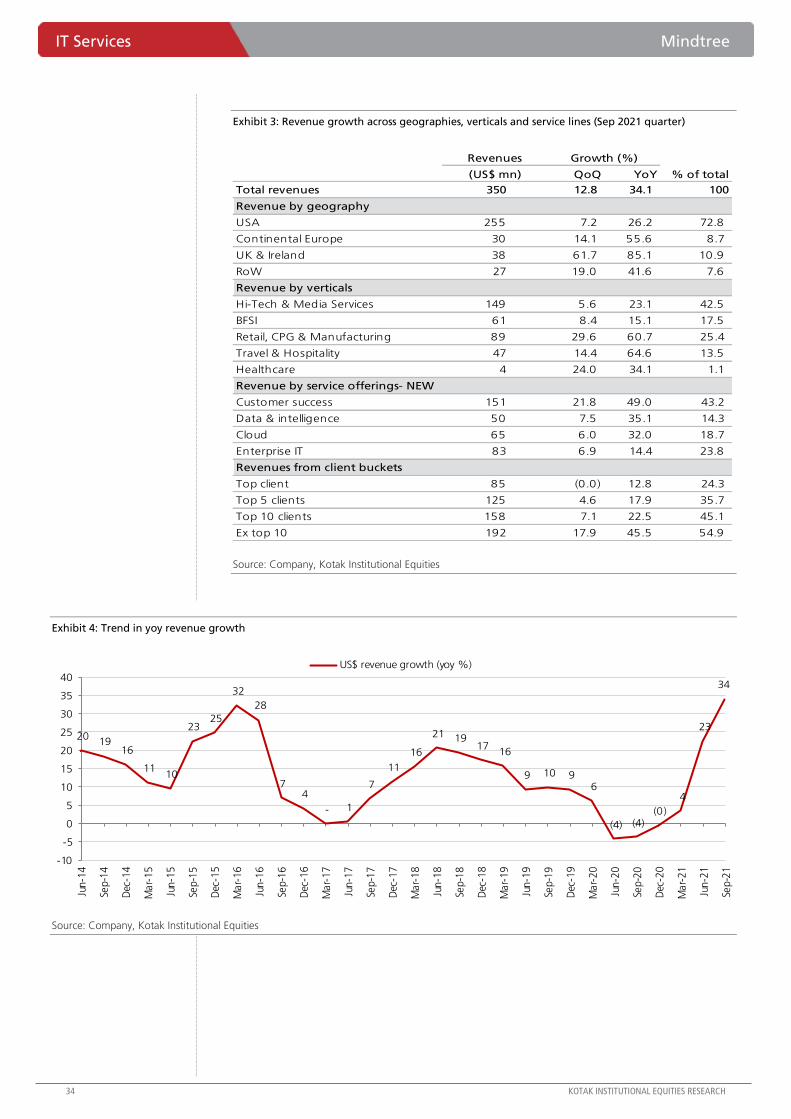
IT Services Mindtree
34 KOTAK INSTITUTIONAL EQUITIES RESEARCH
Exhibit 3: Revenue growth across geographies, verticals and service lines (Sep 2021 quarter)
Source: Company, Kotak Institutional Equities
Exhibit 4: Trend in yoy revenue growth
Source: Company, Kotak Institutional Equities
QoQ YoY % of total
Total revenues 350 12.8 34.1 100
Revenue by geography
USA 255 7.2 26.2 72.8
Continental Europe 30 14.1 55.6 8.7
UK & Ireland 38 61.7 85.1 10.9
RoW 27 19.0 41.6 7.6
Revenue by verticals
Hi-Tech & Media Services 149 5.6 23.1 42.5
BFSI 61 8.4 15.1 17.5
Retail, CPG & Manufacturing 89 29.6 60.7 25.4
Travel & Hospitality 47 14.4 64.6 13.5
Healthcare 4 24.0 34.1 1.1
Revenue by service offerings- NEW
Customer success 151 21.8 49.0 43.2
Data & intelligence 50 7.5 35.1 14.3
Cloud 65 6.0 32.0 18.7
Enterprise IT 83 6.9 14.4 23.8
Revenues from client buckets
Top client 85 (0.0) 12.8 24.3
Top 5 clients 125 4.6 17.9 35.7
Top 10 clients 158 7.1 22.5 45.1
Ex top 10 192 17.9 45.5 54.9
Growth (%)Revenues
(US$ mn)
20 19
16
11 10
23 25
32
28
7 4
- 1
7
11
16
21 19 17
16
9 10 9 6
(4) (4)(0)
4
23
34
-10
-5
0
5
10
15
20
25
30
35
40
Jun-1
4
Sep-1
4
Dec
-14
Mar-
15
Jun-1
5
Sep-1
5
Dec
-15
Mar-
16
Jun-1
6
Sep-1
6
Dec
-16
Mar-
17
Jun-1
7
Sep-1
7
Dec
-17
Mar-
18
Jun-1
8
Sep-1
8
Dec
-18
Mar-
19
Jun-1
9
Sep-1
9
Dec
-19
Mar-
20
Jun-2
0
Sep-2
0
Dec
-20
Mar-
21
Jun-2
1
Sep-2
1
US$ revenue growth (yoy %)

Mindtree IT Services
KOTAK INSTITUTIONAL EQUITIES RESEARCH 35
Exhibit 5: Extremely strong growth in non-top-10 accounts
Source: Company, Kotak Institutional Equities
Exhibit 6: TCV has increased on ttm basis sequentially to US$1.56 bn
Source: Company, Kotak Institutional Equities
Exhibit 7: TCV increases 19% yoy to US$360 mn
Source: Company, Kotak Institutional Equities
Sep-18 Dec-18 Mar-19 Jun-19 Sep-19 Dec-19 Mar-20 Jun-20 Sep-20 Dec-20 Mar-21 Jun-21 Sep-21 4 qtr 8 qtr 12 qtr
Revenues (US$ mn)
Top client 49.8 50.3 51.8 53.1 55.8 63.6 69.0 76.3 75.4 78.1 80.7 85.1 85.1 3.1 5.4 4.6
Top-5 clients 83.3 85.0 86.9 88.8 90.0 99.3 105.5 108.7 106.0 109.1 111.2 119.5 125.0 4.2 4.2 3.4
Top-10 clients 110.4 110.9 112.5 113.6 116.8 125.5 132.0 131.8 128.9 134.3 136.3 147.5 157.9 5.2 3.8 3.0
Non Top-10 accounts 136.0 140.6 149.5 150.6 154.2 149.7 146.4 121.4 132.1 139.7 151.9 163.0 192.2 9.8 2.8 2.9
Growth (%, qoq)
Top client 6.2 1.1 2.9 2.6 5.1 13.9 8.6 10.5 (1.1) 3.5 3.3 5.4 (0.0)
Top-5 clients 6.8 2.1 2.2 2.2 1.4 10.4 6.2 3.0 (2.5) 2.9 2.0 7.5 4.6
Top-10 clients 5.1 0.5 1.4 1.0 2.8 7.4 5.2 (0.1) (2.2) 4.1 1.5 8.2 7.1
Non Top-10 accounts (0.3) 3.4 6.3 0.7 2.4 (2.9) (2.2) (17.1) 8.8 5.8 8.7 7.3 17.9
CQGR (%)
1,551 30.4
24.0
30.0
4.7 7.9
11.5
(7.7)
9.0 8.9
12.8
22.7
6.3 3.6
0.9
(4.5)
14.5
18.7
14.6
29.5
12.2 15.1
19.9
-10
-5
0
5
10
15
20
25
30
35
40
0
200
400
600
800
1,000
1,200
1,400
1,600
1,800
Jun-1
6
Sep-1
6
Dec
-16
Mar-
17
Jun-1
7
Sep-1
7
Dec
-17
Mar-
18
Jun-1
8
Sep-1
8
Dec
-18
Mar-
19
Jun-1
9
Sep-1
9
Dec
-19
Mar-
20
Jun-2
0
Sep-2
0
Dec
-20
Mar-
21
Jun-2
1
Sep-2
1
Total TCV (TTM US$ mn, LHS) Total TCV growth (TTM yoy %, RHS)
220 184
314
209
262
207 244
298 306 271 256 242
324 307
207
393 391
303 312
375
504
360
0
100
200
300
400
500
600
Jun-1
6
Sep-1
6
Dec
-16
Mar-
17
Jun-1
7
Sep-1
7
Dec
-17
Mar-
18
Jun-1
8
Sep-1
8
Dec
-18
Mar-
19
Jun-1
9
Sep-1
9
Dec
-19
Mar-
20
Jun-2
0
Sep-2
0
Dec
-20
Mar-
21
Jun-2
1
Sep-2
1
Total TCV (US$ mn)

IT Services Mindtree
36 KOTAK INSTITUTIONAL EQUITIES RESEARCH
Exhibit 8: EBITDA margin increased 20 bps sequentially despite impact from wage hike
Source: Company, Kotak Institutional Equities
Exhibit 9: Trend in segmental margin (%)
Source: Company, Kotak Institutional Equities
Exhibit 10: Subcontracting expenses as a % of revenues declined by 70 bps qoq to 10.6%
Source: Company, Kotak Institutional Equities
18.4
20.8 19.5
21.5
20.0 19.8 20.5
19.5
17.6 18.5
17.7 17.1
14.7
12.5 13.4
14.2
11.1 11.6
15.1 16.1
14.1 15.4
15.9 15.2
10.0
13.0
15.6
17.1 18.2
19.6
23.1 21.9
20.3 20.5
5
10
15
20
25
Jun-1
3
Sep-1
3
Dec
-13
Mar-
14
Jun-1
4
Sep-1
4
Dec
-14
Mar-
15
Jun-1
5
Sep-1
5
Dec
-15
Mar-
16
Jun-1
6
Sep-1
6
Dec
-16
Mar-
17
Jun-1
7
Sep-1
7
Dec
-17
Mar-
18
Jun-1
8
Sep-1
8
Dec
-18
Mar-
19
Jun-1
9
Sep-1
9
Dec
-19
Mar-
20
Jun-2
0
Sep-2
0
Dec
-20
Mar-
21
Jun-2
1
Sep-2
1
EBITDA margin (%)
Jun-19 Sep-19 Dec-19 Mar-20 Jun-20 Sep-20 Dec-20 Mar-21 Jun-21 Sep-21
Segment EBITDA margins
Retail 14.1 16.0 18.3 20.8 19.9 22.4 24.0 19.6 10.9 17.4
BFSI 4.8 11.3 14.9 17.1 20.2 21.2 23.2 20.1 21.7 20.3
Hi-tech 12.3 13.3 16.2 17.3 21.7 19.9 23.7 23.7 24.5 22.3
Travel 6.0 10.3 11.6 12.1 (13.2) 7.3 17.5 21.7 19.1 22.0
Healthcare 27.4 9.4
Total 10.0 13.0 15.6 17.1 18.2 19.6 23.1 21.9 20.3 20.5
5.5 5.9 6.1 6.2 6.0
6.7 6.6 6.1 6.1 6.1
5.5 5.8
6.1 5.9 5.9
7.5 7.3 7.3 7.4
8.0
8.6
7.9 7.6
7.9
6.8 6.9 7.1
7.9
11.3
10.6
4
5
6
7
8
9
10
11
12
Jun-1
4
Sep-1
4
Dec
-14
Mar-
15
Jun-1
5
Sep-1
5
Dec
-15
Mar-
16
Jun-1
6
Sep-1
6
Dec
-16
Mar-
17
Jun-1
7
Sep-1
7
Dec
-17
Mar-
18
Jun-1
8
Sep-1
8
Dec
-18
Mar-
19
Jun-1
9
Sep-1
9
Dec
-19
Mar-
20
Jun-2
0
Sep-2
0
Dec
-20
Mar-
21
Jun-2
1
Sep-2
1
Subcontracting charges as a % of revenues

Mindtree IT Services
KOTAK INSTITUTIONAL EQUITIES RESEARCH 37
Exhibit 11: Travel expense as a % of revenues drops to 0.7%
Source: Company, Kotak Institutional Equities
Exhibit 12: Other expenses at 2.5% of revenues, lower than pre-Covid levels
Source: Company, Kotak Institutional Equities
493 518 509
747
540 528 518
695 750
813748
867 837 817744
292
135 112223 219 187
3.8 4.0 3.9
5.8
4.1 3.8
3.5
4.2 4.3 4.5
4.1
4.7 4.4
4.2
3.6
1.5
0.7 0.6
1.1 1.0 0.7
-
100
200
300
400
500
600
700
800
900
1,000
0
1
2
3
4
5
6
7
Sep-1
6
Dec
-16
Mar-
17
Jun-1
7
Sep-1
7
Dec
-17
Mar-
18
Jun-1
8
Sep-1
8
Dec
-18
Mar-
19
Jun-1
9
Sep-1
9
Dec
-19
Mar-
20
Jun-2
0
Sep-2
0
Dec
-20
Mar-
21
Jun-2
1
Sep-2
1
Travel expense (Rs mn) Travel as a % of revenues
539 504 454
623 519 477
398
803
656 732 686 669
730678
728
388445 416 368
578642
4.2 3.9
3.4
4.8
3.9
3.5
2.7
4.9
3.7 4.1
3.7 3.6 3.8
3.4 3.6
2.0 2.3
2.1 1.7
2.5 2.5
-
100
200
300
400
500
600
700
800
900
0
1
2
3
4
5
6
Sep-1
6
Dec
-16
Mar-
17
Jun-1
7
Sep-1
7
Dec
-17
Mar-
18
Jun-1
8
Sep-1
8
Dec
-18
Mar-
19
Jun-1
9
Sep-1
9
Dec
-19
Mar-
20
Jun-2
0
Sep-2
0
Dec
-20
Mar-
21
Jun-2
1
Sep-2
1
Other expense (Rs mn) Other expense as a % of revenues

IT Services Mindtree
38 KOTAK INSTITUTIONAL EQUITIES RESEARCH
Exhibit 13: Top client concentration decreases sharply to 24.3%
Source: Company, Kotak Institutional Equities
Exhibit 14: DSO increases by 1 to 77 but still below pre-Covid levels
Source: Company, Kotak Institutional Equities
24.3
-
5.0
10.0
15.0
20.0
25.0
30.0
35.0
Jun-1
2
Dec
-12
Jun-1
3
Dec
-13
Jun-1
4
Dec
-14
Jun-1
5
Dec
-15
Jun-1
6
Dec
-16
Jun-1
7
Dec
-17
Jun-1
8
Dec
-18
Jun-1
9
Dec
-19
Jun-2
0
Dec
-20
Jun-2
1
Revenue contribution from top client (%)
84 82
81 79
81
84
79
82 80 81
83
75 74
84 85
81
84 85
82 81 80 80 78 78
79
74
68
70
76 77
60
65
70
75
80
85
90
Jun-1
4
Sep-1
4
Dec
-14
Mar-
15
Jun-1
5
Sep-1
5
Dec
-15
Mar-
16
Jun-1
6
Sep-1
6
Dec
-16
Mar-
17
Jun-1
7
Sep-1
7
Dec
-17
Mar-
18
Jun-1
8
Sep-1
8
Dec
-18
Mar-
19
Jun-1
9
Sep-1
9
Dec
-19
Mar-
20
Jun-2
0
Sep-2
0
Dec
-20
Mar-
21
Jun-2
1
Sep-2
1
Receivable days (including unbilled revenues) on quarterly annualized basis

Mindtree IT Services
KOTAK INSTITUTIONAL EQUITIES RESEARCH 39
Exhibit 15: Attrition rate spikes 400 bps to 17.7%
Source: Company, Kotak Institutional Equities
Exhibit 16: Capabilities across Mindtree’s service offerings
Source: Company, Kotak Institutional Equities
Exhibit 17: Key model assumptions, March fiscal year-ends, 2017-24E
Source: Company, Kotak Institutional Equities estimates
17.7
10
11
12
13
14
15
16
17
18
19
20
Mar-
15
Sep-1
5
Mar-
16
Sep-1
6
Mar-
17
Sep-1
7
Mar-
18
Sep-1
8
Mar-
19
Sep-1
9
Mar-
20
Sep-2
0
Mar-
21
Sep-2
1
Attrition (LTM, %)
Mindtree Consulting Customer Success Enterprise IT
- Business model transformation - Experience design and innovation - Hyper-automated infrastructure and applications
- Experience transformation - Digital marketing and e-commerce - Digital security
- Value chain transformation - Salesforce - Application portfolio transformation
- Tech ecosystem transformation - Experience channels - Quality engineering
- Talent transformation - Immersive and cognitive experiences - Accelerated DevSecOps
- Digital integration and process automation - Packaged enterprise services
- Product engineering - Product IT transformation
Data and Intelligence Cloud
- Data modernization - Cloud advisory services
- Data operations and management - Cloud migration and modernization
- Insights and action - Cloud operations and management
- Internet of Things (IoT - Cloud native application development
2017 2018 2019 2020 2021 2022E 2023E 2024E
INR/USD rate 67.2 64.5 70.1 71.3 74.0 74.5 77.0 78.0
Revenues (US$ mn) 780 847 1,001 1,089 1,077 1,396 1,624 1,811
% growth 9.0 8.6 18.3 8.7 (1.1) 29.7 16.3 11.6
C/c revenue growth (%) 11.2 7.8 19.3 9.4 (1.6) 29.4 16.3 11.6
C/c revenue growth (organic %) 7.5 7.8 19.3 9.4 (1.6) 29.0 16.2 11.6
EBITDA margin (%) 13.7 13.6 15.2 14.0 20.8 20.1 18.9 18.4
EBIT margin (%) 10.2 10.4 12.8 10.5 17.5 17.8 16.8 16.6
SG&A (%) 21.9 20.7 15.0 19.5 19.5 19.5
Headcount 16,470 17,723 20,204 21,991 23,814 31,540 35,482 40,095
Headcount addition (153) 1,253 2,481 1,787 1,823 7,726 3,942 4,613
Blended pricing change (USD, %) 3.9 2.7 (0.1) (3.5) (11.0) 4.0 0.8 1.6

IT Services Mindtree
40 KOTAK INSTITUTIONAL EQUITIES RESEARCH
Exhibit 18: Mindtree: Key operating metrics
Source: Company, Kotak Institutional Equities
` Sep-19 Dec-19 Mar-20 Jun-20 Sep-20 Dec-20 Mar-21 Jun-21 Sep-21
Revenues (US$ mn) 271.0 275.2 278.4 253.2 261.0 274.0 288.2 310.5 350.1
Revenue by geographical segment (%)
North America 73.7 74.6 76.7 79.0 77.4 77.2 76.6 76.6 72.8
Europe 17.6 17.0 15.4 13.1 15.4 15.2 15.7 16.2 19.6
-Continental Europe 8.9 8.3 7.6 6.6 7.5 7.4 7.1 8.6 8.7
-UK and Ireland 8.7 8.7 7.8 6.5 7.9 7.8 8.6 7.6 10.9
Asia Pacific and RoW 8.6 8.4 7.9 7.9 7.2 7.6 7.7 7.2 7.6
-India 4.2 4.0 3.9 4.1 NA NA NA NA NA
-Rest of the world 4.5 4.4 4.0 3.8 NA NA NA NA NA
Revenues by service lines (%)- new
Customer success 41.8 39.8 40.5 39.8 38.9 38.1 38.6 40.0 43.2
Data & intelligence 12.1 14.0 15.0 13.9 14.2 14.9 16.0 15.0 14.3
Cloud 14.5 15.9 16.5 20.1 19.0 19.2 19.4 19.9 18.7
Enterprise IT 31.6 30.3 28.0 26.2 27.9 27.8 26.0 25.1 23.8
Revenue by industry (%) - old classification
Hi-Tech & Media Services 39.8 41.5 43.1 51.0 49.8 49.9 49.4 NA NA
BFSI 21.6 21.3 20.4 20.3 20.4 19.6 18.4 NA NA
Retail, CPG & Manufacturing 21.7 20.6 20.3 20.6 21.5 21.6 22.4 NA NA
Travel & Hospitality 16.9 16.6 16.2 8.1 8.3 8.9 9.9 NA NA
Revenue by industry (%) - latest classification
Communications, media and technology 47.1 46.3 NA 45.8 45.4 42.5
BFSI 20.3 20.4 NA 18.4 18.2 17.5
Retail, CPG & manufacturing 20.4 21.2 NA 22.1 22.1 25.4
Travel, transportation & hospitality 11.1 11.0 NA 12.7 13.3 13.5
Healthcare 1.1 1.1 NA 1.0 1.0 1.1
Revenue by project type (%)
Fixed price 55.9 58.7 58.8 67.1 NA NA NA NA NA
Time & materials 44.1 41.3 41.2 32.9 NA NA NA NA NA
Effort mix (%)
Onsite 21.6 21.2 21.1 19.8 17.9 17.2 17.1 16.5 15.0
Offshore 78.4 78.8 78.9 80.2 82.1 82.8 82.9 83.5 85.0
Utilization (%)
Including trainees 77.0 75.9 76.5 75.5 78.8 83.1 84.3 83.2 82.9
Excluding trainees 79.0 78.0 78.8 77.4 NA NA NA NA NA
Client metrics
Number of active clients 343 320 307 292 283 276 270 260 263
New clients added 14 7 5 6 8 8 4 7 7
US$1 mn clients 130 134 134 127 125 120 118 120 127
US$5 mn clients 47 47 47 44 43 43 44 47 50
US$10 mn clients 21 22 23 23 24 21 20 25 30
US$20 mn clients 8 NA NA 7 8 8
US$25 mn clients 4 5 5 5 5 4 4 NA NA
US$50 mn clients 1 1 1 1 1 1 1 1 1
Client contribution to revenue (%)
Top customer 20.6 23.1 24.8 30.1 28.9 28.5 28.0 27.4 24.3
Top 5 customers 33.2 36.1 37.9 42.9 40.6 39.8 38.6 38.5 35.7
Top 10 customers 43.1 45.6 47.4 52.0 49.4 49.0 47.3 47.5 45.1
Total Contract Value signed (TCV), US$ mn
Total 307 207 393 391 303 312 375 504 360
Employee metrics
Software professionals 20,001 20,348 20,817 20,851 20,633 20,976 22,540 25,869 28,218
Sales and support 1,266 1,213 1,174 1,104 1,194 1,219 1,274 1,387 1,514
Total 21,267 21,561 21,991 21,955 21,827 22,195 23,814 27,256 29,732
Gross addition 1,400 1,202 1,322 738 NA NA NA NA NA
Net addition 332 294 430 (36) (128) 368 1,619 3,442 2,476
Attrition (LTM) (%) 16.5 17.2 17.4 16.6 13.8 12.5 12.1 13.7 17.7
Quarterly annualised attrition (%) 20.2 17.0 16.4 14.1 NA NA NA NA NA

Mindtree IT Services
KOTAK INSTITUTIONAL EQUITIES RESEARCH 41
Exhibit 19: Condensed consolidated financials for Mindtree, March fiscal year-ends, 2017-24E (Rs mn)
Source: Company, Kotak Institutional Equities estimates
2017 2018 2019 2020 2021 2022E 2023E 2024E
Profit model
Revenues 52,364 54,628 70,215 77,643 79,678 103,922 125,027 141,293
EBIT 5,323 5,690 9,004 8,144 13,971 18,474 21,053 23,478
Interest (expense)/income (191) (169) (29) (529) (504) (534) (588) (623)
Other income 445 1,902 893 673 1,516 2,821 3,227 3,708
Pretax profits 5,577 7,423 9,868 8,288 14,983 20,760 23,692 26,562
Tax (1,363) (1,722) (2,327) (1,979) (3,879) (5,323) (6,038) (6,801)
Profit after tax 4,214 5,701 7,541 6,309 11,104 15,438 17,654 19,761
Diluted earnings per share (Rs) 25.1 34.5 45.8 38.3 67.4 93.7 107.1 119.9
Dividends per share (Rs) 7.0 11.0 13.0 30.0 25.0 37.5 42.9 48.0
Balance sheet
Total equity 25,771 27,414 33,061 31,568 43,190 52,453 63,045 74,902
Deferred taxation liability (624) (318) (388) (1,835) (351) (351) (351) (351)
Total borrowings 991 3,009 5 5,663 5,377 5,377 5,377 5,377
Current liabilities 7,144 6,942 8,724 14,335 15,047 17,878 20,388 22,319
Total liabilities and equity 33,282 37,047 41,402 49,731 63,263 75,357 88,459 102,247
Cash 8,435 11,304 10,598 13,618 28,065 33,711 41,267 50,021
Other current assets 14,435 16,083 20,838 21,885 22,216 28,756 34,751 39,446
Goodwill 6,411 6,059 5,912 5,491 4,946 4,824 4,742 4,742
Tangible fixed assets 4,001 3,601 4,054 8,737 8,036 8,066 7,699 8,038
Total assets 33,282 37,047 41,402 49,731 63,263 75,357 88,459 102,247
Free cash flow
Operating cash flow, excl. WC 7,181 8,029 10,683 11,177 16,807 20,916 23,501 25,989
Tax paid (1,771) (1,632) (2,255) (1,640) (3,168) (5,323) (5,923) (6,801)
Working capital changes 1,217 (833) (2,360) 420 4,131 (3,709) (3,485) (2,764)
Capital expenditure (846) (1,011) (1,708) (1,220) (614) (2,349) (2,115) (2,850)
Acquisitions (467) (164) — — — — — —
Free cash flow 5,314 4,389 4,360 8,737 17,156 9,535 11,978 13,574
Ratios (%)
EBIT margin 10.2 10.4 12.8 10.5 17.5 17.8 16.8 16.6
Net debt/equity (0.3) (0.3) (0.3) (0.3) (0.5) (0.5) (0.6) (0.6)
RoAE 17.0 21.4 24.9 19.5 29.7 32.3 30.6 28.7
RoACE 15.7 15.3 21.7 17.6 24.1 25.8 25.0 23.5

42 KOTAK INSTITUTIONAL EQUITIES RESEARCH
KO
TA
K IN
STIT
UTIO
NA
L EQ
UIT
IES R
ESEA
RC
H
42
Ind
ia D
aily
Su
mm
ary
- Octo
be
r 14, 2
02
1
Sep 2021: Results calendar
Source: NSE, Kotak Institutional Equities
Mon Tue Wed Thu Fri Sat
11-Oct 12-Oct 13-Oct 14-Oct 15-Oct 16-Oct
Infosys HCL Technologies Avenue Supermarts
Mindtree Mahindra CIE Automative HDFC Bank
Wipro
18-Oct 19-Oct 20-Oct 21-Oct 22-Oct 23-Oct
L&T Infotech ACC Havells India Asian Paints Crompton Greaves Consumer ICICI Bank
UltraTech Cement Hindustan Unilever Jubilant Foodworks Biocon Federal Bank
ICICI Pru Life L&T Finance Holdings Container Corp. Gland Pharma
L&T Technology Syngene International Gateway Distriparks HDFC Standard Life
Rallis India Tata Communications ICICI Lombard PVR
Indian Hotels Reliance Industries
JSW Steel Supreme Industries
Lemon Tree Hotel Tata Consumer Products
LIC Housing Finance Yes Bank
MphasiS
TVS Motor Co.
25-Oct 26-Oct 27-Oct 28-Oct 29-Oct 30-Oct
Colgate-Palmolive (India) ABB Bajaj Auto Bajaj Finserv Atul IDFC Bank
HDFC AMC Ambuja Cements Cummins India Bajaj Holdings & Investment Bharat Electronics
Indus Towers Axis Bank Dalmia Bharat Coromandel International Castrol India
Kansai Nerolac Paints Bajaj Finance IIFL Wealth Marico Cholamandalam Investment
Orient Cement Canara Bank ITC MMFSL Dr Reddys Laboratories
Tech Mahindra Cipla Larsen & Toubro Schaeffler India Exide Industries
The Ramco Cements Nippon Life India Asset ManagementMaruti Suzuki Tata Power Co. GlaxoSmithkline Pharma
PI Industries Oracle Financial Indian Oil Corp.
Sanofi India SIS
Torrent Pharmaceuticals SKF India
Titan Co.
1-Nov 2-Nov 3-Nov 4-Nov 5-Nov 6-Nov
HDFC Dabur India
Gillette India
Godrej Properties
Procter & Gamble
Sun Pharmaceuticals
Trent
8-Nov 9-Nov 10-Nov 11-Nov 12-Nov 13-Nov
Bosch Pidilite Industries Endurance Technologies Amara Raja Batteries
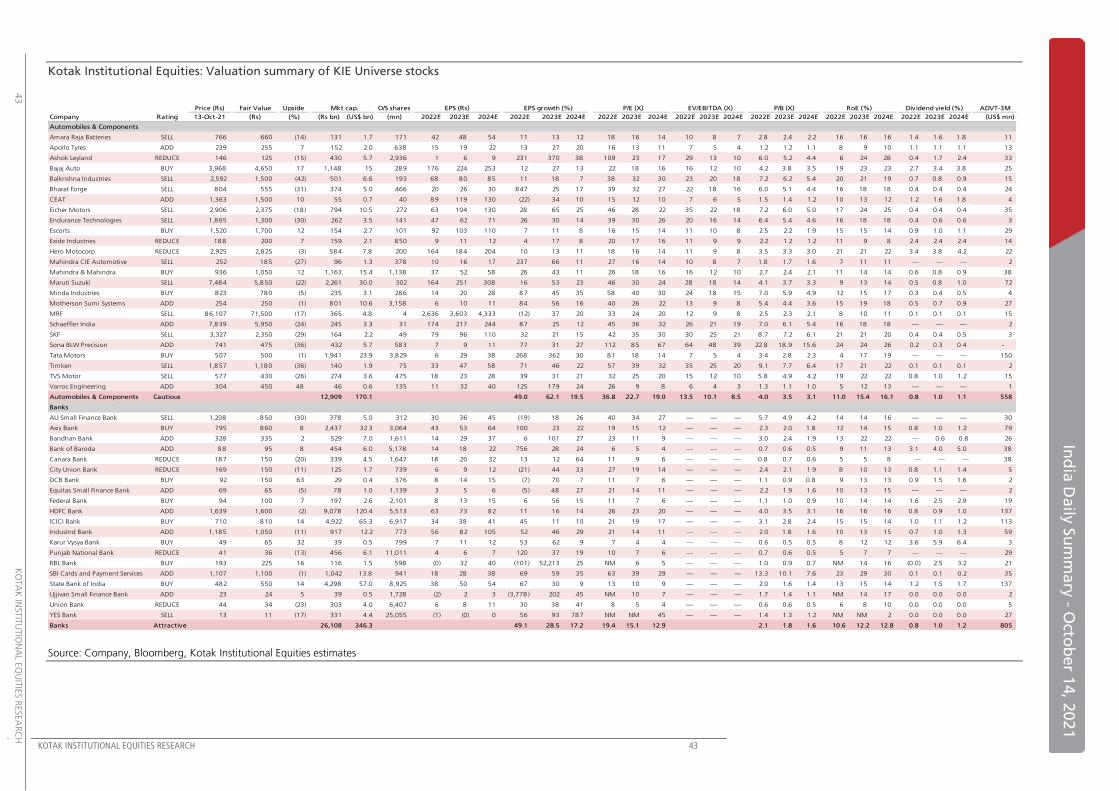
KOTAK INSTITUTIONAL EQUITIES RESEARCH 43
Ind
ia D
aily
Su
mm
ary
- Octo
be
r 14, 2
02
1
43
K
OTA
K IN
STIT
UTIO
NA
L EQ
UIT
IES R
ESEA
RC
H
Kotak Institutional Equities: Valuation summary of KIE Universe stocks
Source: Company, Bloomberg, Kotak Institutional Equities estimates
Price (Rs) Fair Value Upside Mkt cap. O/S shares EPS (Rs) EPS growth (%) P/E (X) EV/EBITDA (X) ADVT-3M
Company Rating 13-Oct-21 (Rs) (%) (Rs bn) (US$ bn) (mn) 2022E 2023E 2024E 2022E 2023E 2024E 2022E 2023E 2024E 2022E 2023E 2024E 2022E 2023E 2024E 2022E 2023E 2024E 2022E 2023E 2024E (US$ mn)
Automobiles & Components
Amara Raja Batteries SELL 766 660 (14) 131 1.7 171 42 48 54 11 13 12 18 16 14 10 8 7 2.8 2.4 2.2 16 16 16 1.4 1.6 1.8 11
Apollo Tyres ADD 239 255 7 152 2.0 638 15 19 22 13 27 20 16 13 11 7 5 4 1.2 1.2 1.1 8 9 10 1.1 1.1 1.1 13
Ashok Leyland REDUCE 146 125 (15) 430 5.7 2,936 1 6 9 231 370 38 109 23 17 29 13 10 6.0 5.2 4.4 6 24 28 0.4 1.7 2.4 33
Bajaj Auto BUY 3,968 4,650 17 1,148 15 289 176 224 253 12 27 13 22 18 16 16 12 10 4.2 3.8 3.5 19 23 23 2.7 3.4 3.8 25
Balkrishna Industries SELL 2,592 1,500 (42) 501 6.6 193 68 80 85 11 18 7 38 32 30 23 20 18 7.2 6.2 5.4 20 21 19 0.7 0.8 0.9 15
Bharat Forge SELL 804 555 (31) 374 5.0 466 20 26 30 847 25 17 39 32 27 22 18 16 6.0 5.1 4.4 16 18 18 0.4 0.4 0.4 24
CEAT ADD 1,363 1,500 10 55 0.7 40 89 119 130 (22) 34 10 15 12 10 7 6 5 1.5 1.4 1.2 10 13 12 1.2 1.6 1.8 4
Eicher Motors SELL 2,906 2,375 (18) 794 10.5 272 63 104 130 28 65 25 46 28 22 35 22 18 7.2 6.0 5.0 17 24 25 0.4 0.4 0.4 35
Endurance Technologies SELL 1,865 1,300 (30) 262 3.5 141 47 62 71 26 30 14 39 30 26 20 16 14 6.4 5.4 4.6 16 18 18 0.4 0.6 0.6 3
Escorts BUY 1,520 1,700 12 154 2.7 101 92 103 110 7 11 8 16 15 14 11 10 8 2.5 2.2 1.9 15 15 14 0.9 1.0 1.1 29
Exide Industries REDUCE 188 200 7 159 2.1 850 9 11 12 4 17 8 20 17 16 11 9 9 2.2 1.2 1.2 11 9 8 2.4 2.4 2.4 14
Hero Motocorp REDUCE 2,925 2,825 (3) 584 7.8 200 164 184 204 10 13 11 18 16 14 11 9 8 3.5 3.3 3.0 21 21 22 3.4 3.8 4.2 22
Mahindra CIE Automotive SELL 252 185 (27) 96 1.3 378 10 16 17 237 66 11 27 16 14 10 8 7 1.8 1.7 1.6 7 11 11 — — — 2
Mahindra & Mahindra BUY 936 1,050 12 1,163 15.4 1,138 37 52 58 26 43 11 26 18 16 16 12 10 2.7 2.4 2.1 11 14 14 0.6 0.8 0.9 38
Maruti Suzuki SELL 7,484 5,850 (22) 2,261 30.0 302 164 251 308 16 53 23 46 30 24 28 18 14 4.1 3.7 3.3 9 13 14 0.5 0.8 1.0 72
Minda Industries BUY 823 780 (5) 235 3.1 286 14 20 28 87 45 35 58 40 30 24 18 15 7.0 5.9 4.9 12 15 17 0.3 0.4 0.5 4
Motherson Sumi Systems ADD 254 250 (1) 801 10.6 3,158 6 10 11 84 56 16 40 26 22 13 9 8 5.4 4.4 3.6 15 19 18 0.5 0.7 0.9 27
MRF SELL 86,107 71,500 (17) 365 4.8 4 2,636 3,603 4,333 (12) 37 20 33 24 20 12 9 8 2.5 2.3 2.1 8 10 11 0.1 0.1 0.1 15
Schaeffler India ADD 7,839 5,950 (24) 245 3.3 31 174 217 244 87 25 12 45 36 32 26 21 19 7.0 6.1 5.4 16 18 18 — — — 2
SKF SELL 3,327 2,350 (29) 164 2.2 49 79 96 110 32 21 15 42 35 30 30 25 21 8 .7 7.2 6.1 21 21 20 0.4 0.4 0.5 3
Sona BLW Precision ADD 741 475 (36) 432 5.7 583 7 9 11 77 31 27 112 85 67 64 48 39 22.8 18.9 15.6 24 24 26 0.2 0.3 0.4 -
Tata Motors BUY 507 500 (1) 1,941 23.9 3,829 6 29 38 268 362 30 81 18 14 7 5 4 3.4 2.8 2.3 4 17 19 — — — 150
Timken SELL 1,857 1,180 (36) 140 1.9 75 33 47 58 71 46 22 57 39 32 35 25 20 9.1 7.7 6.4 17 21 22 0.1 0.1 0.1 2
TVS Motor SELL 577 430 (26) 274 3.6 475 18 23 28 39 31 21 32 25 20 15 12 10 5.8 4.9 4.2 19 22 22 0.8 1.0 1.2 15
Varroc Engineering ADD 304 450 48 46 0.6 135 11 32 40 125 179 24 26 9 8 6 4 3 1.3 1.1 1.0 5 12 13 — — — 1
Automobiles & Components Cautious 12,909 170.1 49.0 62.1 19.5 36.8 22.7 19.0 13.5 10.1 8.5 4.0 3.5 3.1 11.0 15.4 16.1 0.8 1.0 1.1 558
Banks
AU Small Finance Bank SELL 1,208 850 (30) 378 5.0 312 30 36 45 (19) 18 26 40 34 27 — — — 5.7 4.9 4.2 14 14 16 — — — 30
Axis Bank BUY 795 860 8 2,437 32.3 3,064 43 53 64 100 23 22 19 15 12 — — — 2.3 2.0 1.8 12 14 15 0.8 1.0 1.2 79
Bandhan Bank ADD 328 335 2 529 7.0 1,611 14 29 37 6 101 27 23 11 9 — — — 3.0 2.4 1.9 13 22 22 — 0.6 0.8 26
Bank of Baroda ADD 88 95 8 454 6.0 5,178 14 18 22 756 28 24 6 5 4 — — — 0.7 0.6 0.5 9 11 13 3.1 4.0 5.0 38
Canara Bank REDUCE 187 150 (20) 339 4.5 1,647 18 20 32 13 12 64 11 9 6 — — — 0.8 0.7 0.6 5 5 8 — — — 38
City Union Bank REDUCE 169 150 (11) 125 1.7 739 6 9 12 (21) 44 33 27 19 14 — — — 2.4 2.1 1.9 8 10 13 0.8 1.1 1.4 5
DCB Bank BUY 92 150 63 29 0.4 376 8 14 15 (7) 70 7 11 7 6 — — — 1.1 0.9 0.8 9 13 13 0.9 1.5 1.6 2
Equitas Small Finance Bank ADD 69 65 (5) 78 1.0 1,139 3 5 6 (5) 48 27 21 14 11 — — — 2.2 1.9 1.6 10 13 15 — — — 2
Federal Bank BUY 94 100 7 197 2.6 2,101 8 13 15 6 56 15 11 7 6 — — — 1.1 1.0 0.9 10 14 14 1.6 2.5 2.9 19
HDFC Bank ADD 1,639 1,600 (2) 9,078 120.4 5,513 63 73 82 11 16 14 26 23 20 — — — 4.0 3.5 3.1 16 16 16 0.8 0.9 1.0 137
ICICI Bank BUY 710 810 14 4,922 65.3 6,917 34 38 41 45 11 10 21 19 17 — — — 3.1 2.8 2.4 15 15 14 1.0 1.1 1.2 113
IndusInd Bank ADD 1,185 1,050 (11) 917 12.2 773 56 82 105 52 46 29 21 14 11 — — — 2.0 1.8 1.6 10 13 15 0.7 1.0 1.3 59
Karur Vysya Bank BUY 49 65 32 39 0.5 799 7 11 12 53 62 9 7 4 4 — — — 0.6 0.5 0.5 8 12 12 3.6 5.9 6.4 3
Punjab National Bank REDUCE 41 36 (13) 456 6.1 11,011 4 6 7 120 37 19 10 7 6 — — — 0.7 0.6 0.5 5 7 7 — — — 29
RBL Bank BUY 193 225 16 116 1.5 598 (0) 32 40 (101) 52,213 25 NM 6 5 — — — 1.0 0.9 0.7 NM 14 16 (0.0) 2.5 3.2 21
SBI Cards and Payment Services ADD 1,107 1,100 (1) 1,042 13.8 941 18 28 38 69 59 35 63 39 29 — — — 13.3 10.1 7.6 23 29 30 0.1 0.1 0.2 35
State Bank of India BUY 482 550 14 4,298 57.0 8,925 38 50 54 67 30 9 13 10 9 — — — 2.0 1.6 1.4 13 15 14 1.2 1.5 1.7 137
Ujjivan Small Finance Bank ADD 23 24 5 39 0.5 1,728 (2) 2 3 (3,778) 202 45 NM 10 7 — — — 1.7 1.4 1.1 NM 14 17 0.0 0.0 0.0 2
Union Bank REDUCE 44 34 (23) 303 4.0 6,407 6 8 11 30 38 41 8 5 4 — — — 0.6 0.6 0.5 6 8 10 0.0 0.0 0.0 5
YES Bank SELL 13 11 (17) 331 4.4 25,055 (1) (0) 0 56 93 787 NM NM 45 — — — 1.4 1.3 1.2 NM NM 2 0.0 0.0 0.0 27
Banks Attractive 26,108 346.3 49.1 28.5 17.2 19.4 15.1 12.9 2.1 1.8 1.6 10.6 12.2 12.8 0.8 1.0 1.2 805
P/B (X) RoE (%) Dividend yield (%)

44 KOTAK INSTITUTIONAL EQUITIES RESEARCH
K
OTA
K IN
STIT
UTIO
NA
L EQ
UIT
IES R
ESEA
RC
H
44
Ind
ia D
aily
Su
mm
ary
- Octo
be
r 14, 2
02
1
Kotak Institutional Equities: Valuation summary of KIE Universe stocks
Source: Company, Bloomberg, Kotak Institutional Equities estimates
Price (Rs) Fair Value Upside Mkt cap. O/S shares EPS (Rs) EPS growth (%) P/E (X) EV/EBITDA (X) ADVT-3M
Company Rating 13-Oct-21 (Rs) (%) (Rs bn) (US$ bn) (mn) 2022E 2023E 2024E 2022E 2023E 2024E 2022E 2023E 2024E 2022E 2023E 2024E 2022E 2023E 2024E 2022E 2023E 2024E 2022E 2023E 2024E (US$ mn)
Building Products
Astral SELL 2,318 1,250 (46) 466 6.2 201 26 30 33 28 17 12 90 77 69 57 49 44 20.0 16.7 14.3 24 24 22 0.2 0.3 0.4 12
Building Products Cautious 466 6.2 27.5 16.7 11.8 90.3 77.4 69.2 56.5 49.0 44.1 20.0 16.7 14.3 22 22 21 0.2 0.3 0.4 12
Capital goods
ABB BUY 1,809 2,030 12 383 5.1 212 19 27 36 135 44 32 95 66 50 66 46 35 9.9 9.0 8 .0 11 14 17 0.3 0.4 0.5 4
Ashoka Buildcon BUY 118 165 40 33 0.4 281 14 15 17 (4) 10 13 8 8 7 6 5 4 1.0 0.9 0.8 12 12 13 1.9 2.1 2.3 3
Bharat Electronics BUY 209 210 1 508 6.7 2,437 10 10 11 13 5 9 21 20 19 14 13 12 4.2 3.9 3.5 20 20 20 2.2 2.3 2.5 21
BHEL SELL 76 30 (61) 266 3.5 3,482 (4) 2 4 44 138 115 NM 46 22 (16) 19 11 1.1 1.0 1.0 NM 2 5 0.0 0.8 1.5 38
Carborundum Universal ADD 902 730 (19) 171 2.3 190 21 26 31 39 26 20 43 34 29 27 21 18 7.1 6.3 5.5 17 19 20 0.6 0.8 1.0 4
Cochin Shipyard BUY 374 510 36 49 0.7 132 41 42 36 (12) 3 (14) 9 9 10 4 4 4 1.1 1.1 1.0 13 12 10 3.4 3.6 3.9 1
Cummins India BUY 898 1,080 20 249 3.3 277 31 40 46 36 29 16 29 22 19 27 20 17 5.1 4.6 4.2 19 22 23 1.9 2.4 2.8 17
Dilip Buildcon BUY 725 670 (8 ) 106 1.4 146 32 52 64 49 61 23 22 14 11 8 7 6 2.2 1.9 1.6 11 14 15 0.1 0.1 0.2 4
IRB Infrastructure BUY 212 173 (18) 74 1.0 351 8 11 19 141 39 70 26 19 11 8 7 6 1.0 1.0 0.9 4 5 9 0.7 1.1 1.5 9
Kalpataru Power Transmission BUY 434 540 24 65 0.9 153 36 47 53 10 29 13 12 9 8 6 4 4 1.4 1.3 1.1 13 15 14 0.9 1.3 1.4 3
KEC International BUY 465 465 0 120 1.6 257 22 36 41 4 58 16 21 13 11 11 8 7 3.1 2.6 2.1 16 21 21 0.5 0.8 1.0 3
L&T BUY 1,752 2,050 17 2,460 32.6 1,405 61 82 95 25 36 15 29 21 19 18 16 15 3.7 3.5 3.3 13 17 18 1.4 1.9 2.2 54
Siemens SELL 2,249 1,880 (16) 801 10.6 356 39 47 68 24 20 43 57 47 33 39 33 23 7.2 6.5 5.8 13 14 18 0.5 0.6 0.8 12
Thermax SELL 1,395 1,240 (11) 166 2.2 113 31 40 50 36 29 24 45 34 28 33 25 21 33.0 25.5 20.5 11 13 15 1.1 1.4 1.7 1
Capital goods Attractive 5,452 72.3 39.5 45.5 20.0 34.9 24.0 20.0 19.4 15.3 13.5 3.5 3.2 3.0 9.9 13.5 14.9 1.2 1.5 1.8 174
Commercial & Professional Services
SIS BUY 504 550 9 75 1.0 147 20 25 31 (19) 24 24 25 20 16 15 13 11 3.8 3.3 2.9 16 17 19 1.0 1.2 1.5 2
TeamLease Services ADD 5,127 4,085 (20) 88 1.2 17 85 112 142 148 32 26 60 46 36 57 43 34 11.0 8 .9 7.1 20 21 22 — — — 2
Commercial & Professional Services Attractive 162 2.2 3.1 26.7 24.8 37.0 29.2 23.4 23.6 19.8 16.6 5.9 5.1 4.3 16.0 17.3 18.3 0.4 0.5 0.7 4
Commodity Chemicals
Asian Paints REDUCE 3,324 2,675 (20) 3,188 42.3 959 35 47 54 7 34 15 95 71 62 62 48 42 22.4 19.8 17.7 25 30 30 0.6 0.8 1.0 51
Berger Paints SELL 829 640 (23) 805 10.7 971 9 12 15 25 32 20 89 68 56 55 43 37 20.7 17.8 15.3 25 28 29 0.4 0.6 0.7 9
Kansai Nerolac REDUCE 598 650 9 322 4.3 539 11 15 18 13 30 19 52 40 34 35 27 23 7.3 6.8 6.2 15 17 19 1.0 1.4 1.6 3
Tata Chemicals SELL 1,107 640 (42) 282 3.7 255 32 39 43 222 21 10 34 28 25 12 11 10 2.0 2.0 2.0 6 7 8 2.9 3.5 3.9 39
Commodity Chemicals Neutral 4,597 61.0 22.5 31.3 15.4 80.6 61.4 53.2 46.9 37.6 33.0 12.5 11.6 10.7 15.5 18.9 20.2 0.7 1.0 1.2 102
Construction Materials
ACC ADD 2,260 2,300 2 424 5.6 188 113 126 143 50 11 13 20 18 16 11 9 8 3.0 2.6 2.4 16 16 16 1.3 1.4 1.6 19
Ambuja Cements REDUCE 404 375 (7) 802 10.6 1,986 15 18 21 15 18 16 26 22 19 10 8 7 3.2 2.8 2.5 13 14 14 0.7 0.9 1.0 25
Dalmia Bharat ADD 2,073 2,250 9 388 5.1 187 61 74 93 16 20 27 34 28 22 13 11 9 2.8 2.6 2.3 9 10 11 — — — 9
Grasim Industries ADD 1,676 1,675 (0) 1,103 14.6 657 89 112 127 30 26 13 19 15 13 8 7 6 1.5 1.4 1.3 8 10 10 0.6 0.4 0.5 29
J K Cement REDUCE 3,365 2,700 (20) 260 3.4 77 122 138 169 31 13 22 28 24 20 15 14 11 5.6 4.6 3.8 23 21 21 0.3 0.3 0.3 4
JK Lakshmi Cement REDUCE 632 630 (0) 74 1.0 118 43 46 47 14 8 2 15 14 13 8 7 7 2.9 2.5 2.1 22 20 17 1.0 1.1 1.1 6
Orient Cement ADD 159 190 20 32 0.4 205 14 15 17 36 7 12 11 10 9 6 6 5 2.1 1.8 1.5 20 18 18 1.3 1.3 1.3 2
Shree Cement SELL 27,816 21,550 (23) 1,004 13.3 36 830 984 1,156 30 19 18 34 28 24 20 17 14 5.6 4.7 4.0 18 18 18 0.2 0.2 0.2 20
The Ramco Cements SELL 983 840 (15) 232 3.1 236 33 43 52 3 28 21 29 23 19 15 12 10 3.6 3.2 2.7 13 15 15 0.3 0.4 0.5 6
UltraTech Cement REDUCE 7,350 6,950 (5) 2,122 28.1 289 264 302 349 36 15 15 28 24 21 15 13 11 4.2 3.7 3.2 16 16 16 0.3 0.3 0.3 36
Construction Materials Attractive 6,442 85.4 29.3 18.3 15.7 25.5 21.5 18.6 12.0 10.2 8.7 3.1 2.7 2.4 12.1 12.7 13.1 0.4 0.5 0.5 156
P/B (X) RoE (%) Dividend yield (%)

KOTAK INSTITUTIONAL EQUITIES RESEARCH 45
In
dia
Da
ily S
um
ma
ry - O
ctob
er 1
4, 2
02
1
45
K
OTA
K IN
STIT
UTIO
NA
L EQ
UIT
IES R
ESEA
RC
H
Kotak Institutional Equities: Valuation summary of KIE Universe stocks
Source: Company, Bloomberg, Kotak Institutional Equities estimates
Price (Rs) Fair Value Upside Mkt cap. O/S shares EPS (Rs) EPS growth (%) P/E (X) EV/EBITDA (X) ADVT-3M
Company Rating 13-Oct-21 (Rs) (%) (Rs bn) (US$ bn) (mn) 2022E 2023E 2024E 2022E 2023E 2024E 2022E 2023E 2024E 2022E 2023E 2024E 2022E 2023E 2024E 2022E 2023E 2024E 2022E 2023E 2024E (US$ mn)
Consumer Durables & Apparel
Crompton Greaves Consumer SELL 482 390 (19) 303 4.0 628 10 12 13 2 16 15 48 42 36 36 31 26 12.6 10.2 8 .3 29 27 25 0.5 0.5 0.5 9
Havells India REDUCE 1,410 1,050 (26) 883 11.7 626 20 23 28 23 14 21 69 60 50 48 42 34 15.6 13.6 11.7 24 24 25 0.5 0.6 0.7 35
Page Industries REDUCE 37,450 30,100 (20) 418 5.5 11 403 530 621 32 32 17 93 71 60 62 48 41 43.0 39.2 36.7 48 58 63 0.9 1.3 1.6 12
Polycab ADD 2,533 1,950 (23) 378 5.0 149 70 78 90 18 12 15 36 32 28 26 22 19 6.7 5.7 4.8 20 19 19 0.3 0.4 0.4 19
TCNS Clothing Co. SELL 657 455 (31) 40 0.5 68 0 15 18 104 3,425 18 1,515 43 37 35 16 13.5 6.7 5.5 4.6 0 14 14 — — — 1
Voltas SELL 1,311 800 (39) 434 5.8 331 18 23 29 13 30 23 73 56 46 57 46 40 8 .0 7.3 6.6 11 14 15 0.3 0.5 0.6 23
Whirlpool SELL 2,518 1,800 (29) 319 4.2 127 36 48 59 37 34 21 70 52 43 50 36 29 10.1 8 .8 7.6 15 18 19 0.3 0.4 0.5 4
Consumer Durables & Apparel Cautious 2,775 36.8 21.2 22.2 18.8 62.4 51.1 43.0 43.6 35.9 30.1 11.6 10.1 8.7 18.6 19.7 20.2 0.5 0.6 0.7 103
Consumer Staples
Bajaj Consumer Care ADD 259 325 25 38 0.5 148 16 17 19 4 11 9 17 15 14 13 11 10 4.6 4.1 3.7 29 29 29 4.2 4.2 4.6 3
Britannia Industries ADD 3,884 3,700 (5) 935 12.4 241 69 83 94 (11) 20 14 56 47 41 40 34 30 48.9 44.6 32.1 60 98 89 1.9 1.5 1.8 22
Colgate-Palmolive (India) ADD 1,695 1,775 5 461 6.1 272 39 44 50 3 12 13 43 39 34 28 26 23 39.7 36.8 34.0 92 99 103 2.2 2.5 2.8 12
Dabur India ADD 624 630 1 1,103 14.6 1,767 10 12 14 8 17 14 60 51 45 48 41 35 13.9 12.6 11.4 24 26 27 0.9 1.0 1.2 20
Godrej Consumer Products ADD 1,058 1,050 (1) 1,082 14.4 1,023 18 22 25 6 18 16 58 49 42 41 35 30 10.2 9.3 8 .4 19 20 21 0.9 1.1 1.3 18
Hindustan Unilever ADD 2,647 2,950 11 6,219 82.5 2,350 39 47 55 15 22 15 68 56 48 47 39 34 13.1 12.6 12.1 19 23 26 1.4 1.7 1.9 55
ITC BUY 249 275 10 3,068 40.7 12,330 12 13 14 9 13 8 22 19 18 16 14 13 5.1 4.9 4.7 23 25 27 4.2 4.5 4.8 74
Jyothy Laboratories ADD 163 190 16 60 0.8 367 6 7 9 (0) 22 18 28 23 19 20 16 14 4.0 3.8 3.6 15 17 19 2.8 3.1 3.4 1
Marico REDUCE 584 530 (9) 754 10.0 1,290 10 11 13 11 15 11 59 51 46 42 36 33 21.8 20.3 18.9 38 41 43 1.4 1.6 1.8 21
Nestle India ADD 19,321 18,600 (4) 1,863 24.7 96 244 295 344 13 21 17 79 66 56 51 43 38 69.4 53.6 42.6 100 92 84 0.9 1.1 1.3 18
Tata Consumer Products ADD 848 780 (8 ) 781 10.4 922 11 15 17 11 42 13 80 56 50 46 35 31 5.2 4.9 4.6 7 9 9 0.5 0.6 0.7 26
United Breweries ADD 1,723 1,500 (13) 456 6.0 264 14 31 36 212 119 17 121 55 47 62 32 28 11.6 9.9 8 .9 10 19 20 0.3 1.0 1.2 14
United Spirits ADD 901 680 (25) 655 8 .7 727 11 16 18 77 40 16 80 57 49 48 37 33 12.8 11.1 9.8 17 21 21 — 0.6 0.8 31
Varun Beverages BUY 897 850 (5) 388 5.2 433 16 24 29 76 50 20 56 37 31 24 19 16 9.4 7.7 6.3 18 23 22 0.2 0.2 0.3 7
Consumer Staples Attractive 17,863 236.9 11.7 19.8 12.5 48.6 40.6 36.1 34.3 28.6 25.4 10.7 10.1 9.4 22 25 26 1.7 1.9 2.1 322
Diversified Financials
Aavas Financiers ADD 2,854 2,600 (9) 225 3.0 79 45 57 70 22 28 22 64 50 41 — — — — — — 14 15 16 0.0 0.0 0.0 9
Aditya Birla Capital NR 108 — — 260 3.5 2,414 6 8 10 36 43 24 19 13 11 — — — — — — 10 12 14 57.6 65.3 74.7 6
Bajaj Finance REDUCE 7,929 5,600 (29) 4,786 63.5 602 113 171 209 54 51 23 70 46 38 — — — 11.1 9.1 7.5 17 22 22 0.1 0.2 0.3 125
Bajaj Finserv ADD 18,188 14,150 (22) 2,894 38.4 159 362 519 630 29 43 21 50 35 29 — — — 8.1 6.9 5.8 16 21 22 0.1 0.1 0.1 75
Cholamandalam BUY 595 650 9 488 6.5 820 29 34 40 55 19 18 21 17 15 — — — 4.7 3.8 3.1 22 22 21 0.5 0.6 0.7 21
Computer Age Management ServicesSELL 3,082 2,100 (32) 150 2.0 49 53 59 66 26 11 13 58 52 46 — — — 24.4 20.7 17.7 46 43 41 1.1 1.2 1.4 23
HDFC BUY 2,765 3,100 12 4,997 66.3 1,804 70 85 96 5 22 12 40 32 29 — — — 4.2 3.9 3.5 11 13 13 0.8 0.9 1.1 108
HDFC AMC SELL 2,900 2,350 (19) 618 8 .2 213 70 83 97 12 19 17 42 35 30 — — — 11.1 9.6 8 .3 29 29 30 1.3 1.6 1.8 30
IIFL Wealth ADD 1,649 1,700 3 146 1.9 89 54 63 72 30 18 14 31 26 23 — — — 5.4 5.1 4.8 17 20 22 4.2 2.9 3.3 3
L&T Finance Holdings ADD 92 115 24 228 3.0 2,469 7 9 11 84 23 24 13 11 9 — — — 1.1 1.0 0.9 9 10 11 0.7 0.7 0.7 10
LIC Housing Finance BUY 447 600 34 246 3.3 550 51 69 74 (6) 35 8 9 6 6 — — — 1.4 1.2 1.1 12 14 14 1.8 2.4 2.6 21
Mahindra & Mahindra Financial ADD 186 200 7 230 3.0 1,230 10 18 19 283 73 5 18 10 10 — — — 1.6 1.4 1.3 8 13 13 1.1 1.9 2.0 17
Muthoot Finance REDUCE 1,567 1,450 (7) 629 8 .3 401 111 127 143 20 14 12 14 12 11 — — — 3.4 2.8 2.3 26 25 23 1.4 1.6 1.8 18
Shriram City Union Finance ADD 2,171 2,250 4 143 1.9 66 145 196 225 (5) 35 15 15 11 10 — — — 1.7 1.5 1.3 11 14 14 1.0 1.4 1.6 3
Shriram Transport BUY 1,366 1,575 15 367 4.9 269 102 157 177 4 54 12 13 9 8 — — — 1.5 1.3 1.1 11 15 15 1.1 1.7 2.1 23
Diversified Financials Attractive 16,409 217.7 23.2 33.2 16.5 36.1 27.1 23.3 4.7 4.1 3.6 12.9 15.2 15.4 0.5 0.7 0.8 493
P/B (X) RoE (%) Dividend yield (%)

46 KOTAK INSTITUTIONAL EQUITIES RESEARCH
K
OTA
K IN
STIT
UTIO
NA
L EQ
UIT
IES R
ESEA
RC
H
46
Ind
ia D
aily
Su
mm
ary
- Octo
be
r 14, 2
02
1
Kotak Institutional Equities: Valuation summary of KIE Universe stocks
Source: Company, Bloomberg, Kotak Institutional Equities estimates
Price (Rs) Fair Value Upside Mkt cap. O/S shares EPS (Rs) EPS growth (%) P/E (X) EV/EBITDA (X) ADVT-3M
Company Rating 13-Oct-21 (Rs) (%) (Rs bn) (US$ bn) (mn) 2022E 2023E 2024E 2022E 2023E 2024E 2022E 2023E 2024E 2022E 2023E 2024E 2022E 2023E 2024E 2022E 2023E 2024E 2022E 2023E 2024E (US$ mn)
Electric Utilities
CESC BUY 91 82 (10) 121 1.6 1,326 11 13 15 14 10 16 8 7 6 5 5 4 0.9 0.8 0.7 12 12 12 1.5 1.8 1.9 8
JSW Energy SELL 399 100 (75) 655 8 .7 1,640 6 7 7 16 20 2 71 59 58 22 20 17 4.2 4.0 3.7 6 7 7 — — — 10
NHPC ADD 29 30 2 294 3.9 10,045 3 4 4 0 9 2 9 8 8 9 7 7 0.9 0.8 0.8 10 11 10 7.1 7.9 8.0 3
NTPC BUY 146 125 (15) 1,419 18.8 9,697 15 16 17 (4) 8 7 10 9 8 8 7 6 1.1 1.0 0.9 12 12 12 3.1 3.3 3.6 25
Power Grid BUY 199 205 3 1,391 18.5 6,975 20 22 23 8 8 5 10 9 9 7 6 6 1.8 1.7 1.5 19 18 18 5.8 7.1 7.5 30
Tata Power ADD 224 145 (35) 716 9.5 3,196 5 6 7 21 22 12 46 38 34 13 12 12 3.2 3.0 2.7 7 8 8 — — — 86
Electric Utilities Attractive 4,597 61.0 2.9 9.1 6.0 12.8 11.7 11.1 8.2 7.3 6.8 1.6 1.5 1.4 12.2 12.4 12.2 3.2 3.7 3.9 164
Fertilizers & Agricultural Chemicals
Bayer Cropscience SELL 5,199 4,700 (10) 234 3.1 45 148 172 198 14 16 15 35 30 26 25 21 18 7.6 6.3 5.3 24 23 22 0.6 0.7 0.8 2
Dhanuka Agritech SELL 831 795 (4) 39 0.5 48 43 48 57 (2) 11 19 19 17 14 14 12 10 4.2 3.6 3.2 24 23 23 1.6 2.0 2.8 1
Godrej Agrovet SELL 651 525 (19) 125 1.7 192 21 24 27 27 14 14 31 28 24 19 17 15 4.6 4.2 3.8 15 16 17 1.6 1.8 2.0 2
Rallis India REDUCE 315 300 (5) 61 0.8 195 14 17 19 27 15 12 22 19 17 18 16 14 3.4 3.0 2.6 17 17 16 1.0 1.2 1.3 3
UPL SELL 747 650 (13) 571 7.6 765 50 58 69 32 17 19 15 13 11 8 7 6 2.8 2.4 2.1 20 20 20 1.8 2.1 2.5 31
Fertilizers & Agricultural Chemicals Cautious 1,030 13.7 27.4 16.2 18.1 19.2 16.6 14.0 10.4 8.9 7.6 3.5 3.1 2.6 18.3 18.4 18.8 1.4 1.7 2.0 38
Gas Utilities
GAIL (India) BUY 159 190 19 706 9.4 4,440 15 15 16 40 (2) 6 10 11 10 8 8 7 1.4 1.3 1.2 14 13 12 3.8 4.1 4.4 31
GSPL SELL 319 200 (37) 180 2.4 564 13 9 9 (21) (31) 4 24 36 34 11 15 15 2.2 2.1 2.0 9 6 6 0.8 0.7 0.9 5
Indraprastha Gas ADD 516 585 13 361 4.8 700 21 26 29 26 24 11 24 20 18 18 14 13 5.2 4.5 3.9 23 25 24 0.9 1.4 1.8 18
Mahanagar Gas BUY 1,075 1,350 26 106 1.4 99 91 104 110 44 15 5 12 10 10 7 6 6 2.8 2.4 2.2 26 25 23 3.4 4.4 5.1 7
Petronet LNG BUY 233 275 18 350 4.6 1,500 20 22 25 2 12 11 12 10 9 6 6 5 2.7 2.4 2.2 25 25 25 5.0 5.6 6.2 12
Gas Utilities Attractive 1,703 22.6 22.7 3.7 8.1 13.2 12.8 11.8 8.7 8.2 7.5 2.1 1.9 1.8 15.6 14.9 14.8 3.1 3.5 3.9 73
Health Care Services
Apollo Hospitals ADD 4,378 4,400 1 629 8 .3 144 52 68 95 731 30 40 84 65 46 32 28 22 12.5 11.2 9.8 15 18 23 0.5 0.6 0.9 59
Aster DM Healthcare BUY 209 200 (4) 105 1.4 500 8 11 12 163 36 14 27 20 17 9 7 6 2.8 2.5 2.2 11 13 13 — — — 8
Dr Lal Pathlabs SELL 3,772 2,000 (47) 314 4.2 83 49 46 53 40 (5) 15 77 81 71 49 52 45 21.4 18.7 16.3 30 25 25 0.6 0.6 0.6 17
HCG BUY 255 175 (31) 32 0.4 125 (3) (2) (1) 63 18 61 NM NM NM 15 13 11 4.8 5.1 5.2 NM NM NM — — — 1
Metropolis Healthcare SELL 2,709 1,925 (29) 139 1.8 51 44 47 55 22 7 16 61 57 49 37 36 31 16.2 13.7 11.6 29 26 26 0.5 0.5 0.6 10
Narayana Hrudayalaya ADD 508 540 6 104 1.4 204 13 16 18 1,890 27 13 41 32 28 18 16 14 7.5 6.1 5.0 21 21 19 — — — 2
Health Care Services Attractive 1,323 17.5 232.6 21.9 25.6 66.5 54.6 43.4 25.9 22.8 19.4 10.1 8.9 7.8 15.1 16.3 17.9 0.4 0.5 0.6 98
Hotels & Restaurants
Burger King SELL 163 133 (18) 62 0.8 382 (1) 1 1 82 201 30 NM 203 156 37 23 18 9.6 9.3 8 .8 NM 5 6 0.0 0.0 0.0 7
Jubilant Foodworks BUY 4,527 3,550 (22) 597 7.9 132 35 51 64 98 47 26 131 89 71 52 39 33 33.0 25.6 20.2 28 32 32 0.2 0.4 0.5 38
Lemon Tree Hotels ADD 55 50 (8 ) 43 0.6 790 (0) 1 2 69 233 217 NM 82 26 33 14 10 4.9 5.0 4.5 NM 6 18 0.0 1.2 1.6 4
Westlife Development ADD 568 550 (3) 88 1.2 156 1 7 10 113 669 55 652 85 55 39 23 19 17.8 14.7 11.6 3 19 24 0.0 0.0 0.0 1
Hotels & Restaurants Attractive 791 10.5 333.7 115.1 41.0 197.6 91.8 65.1 46.6 31.2 24.9 20.7 17.7 14.7 10.5 19.2 23 0.2 0.3 0.5 50
P/B (X) RoE (%) Dividend yield (%)

KOTAK INSTITUTIONAL EQUITIES RESEARCH 47
In
dia
Da
ily S
um
ma
ry - O
ctob
er 1
4, 2
02
1
47
K
OTA
K IN
STIT
UTIO
NA
L EQ
UIT
IES R
ESEA
RC
H
Kotak Institutional Equities: Valuation summary of KIE Universe stocks
Source: Company, Bloomberg, Kotak Institutional Equities estimates
Price (Rs) Fair Value Upside Mkt cap. O/S shares EPS (Rs) EPS growth (%) P/E (X) EV/EBITDA (X) ADVT-3M
Company Rating 13-Oct-21 (Rs) (%) (Rs bn) (US$ bn) (mn) 2022E 2023E 2024E 2022E 2023E 2024E 2022E 2023E 2024E 2022E 2023E 2024E 2022E 2023E 2024E 2022E 2023E 2024E 2022E 2023E 2024E (US$ mn)
Insurance
HDFC Life Insurance ADD 701 785 12 1,418 18.8 2,020 17 20 23 25 18 16 41 35 30 — — — 7.7 7.0 6.3 39 42 44 0.6 0.7 0.8 33
ICICI Lombard SELL 1,521 1,225 (19) 692 9.2 490 32 40 46 (2) 27 14 48 38 33 — — — 7.9 6.7 5.7 18 19 19 0.4 0.5 0.5 24
ICICI Prudential Life BUY 657 750 14 944 12.5 1,436 6 9 10 (14) 55 16 114 74 63 — — — 9.6 8 .7 7.9 9 12 13 0.0 0.0 0.0 16
Max Financial Services BUY 994 1,225 23 343 4.5 345 10 10 11 237 7 8 103 96 89 — — — — — — 5 5 5 0.0 0.0 0.0 13
SBI Life Insurance BUY 1,193 1,425 19 1,193 15.8 1,002 13 18 21 (7) 34 17 89 66 57 — — — 10.6 9.4 8 .2 13 15 16 0.2 0.2 0.3 42
Insurance Attractive 4,590 60.9 11.4 26.6 15.4 61.4 48.5 42.0 8.2 7.4 6.6 13.4 15.2 15.7 0.2 0.3 0.3 129
Internet Software & Services
Info Edge SELL 6,806 4,400 (35) 876 11.6 128.5 41 51 64 94 24 24 165 132 107 153 119 95 17.7 16.2 14.7 11.2 12.8 14.4 0.2 0.2 0.2 41
Just Dial ADD 929 1,130 22 58 0.8 83.5 25 42 48 (27) 65 15 37 22 19 13 8 4 2.1 1.9 1.8 8 .6 9.2 9.6 — — — 24
Zomato BUY 135 175 29 1,063 14.1 7,981 (1) (0) 0 39 66 146 NM NM 827 (72) (98) (191) 6.7 7.2 7.1 NM NM 0.9 0.0 0.0 0.0 -
Internet Software & Services Cautious 1,997 26.5 67 751 92 NM 282 147 (305) #### 283 8.0 7.9 7.6 NM 2.8 5.1 0.1 0.1 0.1 65
IT Services
HCL Technologies ADD 1,266 1,400 11 3,435 45.6 2,714 51 58 66 5 15 13 25 22 19 15 13 12 4.9 4.2 3.7 21 21 20 1.6 1.6 1.6 84
Infosys BUY 1,709 2,000 17 7,283 96.6 4,221 51 60 68 13 17 14 33 28 25 23 20 17 9.6 8 .4 7.6 29 32 32 1.8 2.0 2.6 137
L&T Infotech REDUCE 5,951 4,550 (24) 1,043 13.8 176 127 150 175 16 18 17 47 40 34 34 28 24 11.9 9.9 8 .2 28 27 26 0.6 0.7 0.8 28
L&T Technology Services ADD 4,693 4,250 (9) 494 6.5 106 88 111 131 40 26 18 53 42 36 35 29 24 12.0 10.0 8 .4 24 26 25 0.5 0.6 0.7 28
Mindtree SELL 4,364 3,250 (26) 719 9.5 165 94 108 120 39 15 11 47 40 36 33 29 26 13.7 11.4 9.6 32 31 29 0.9 1.0 1.1 66
Mphasis ADD 3,130 2,800 (11) 586 7.8 187 75 90 111 16 19 24 41 35 28 27 23 19 8 .4 7.6 6.8 21 23 26 1.6 1.8 1.9 36
TCS ADD 3,655 4,100 12 13,521 179.4 3,699 102 118 133 14 15 13 36 31 28 25 21 19 13.0 12.0 11.1 39 40 42 1.7 2.6 2.9 128
Tech Mahindra BUY 1,403 1,580 13 1,222 16.2 880 65 73 83 27 12 14 22 19 17 14 12 10 4.4 3.9 3.4 21 21 21 1.7 1.8 1.9 67
Wipro REDUCE 673 625 (7) 3,686 48.9 5,477 23 25 27 18 9 11 30 27 25 20 17 15 5.7 4.9 4.3 21 19 19 0.7 0.7 1.3 66
IT Services Attractive 31,988 424.3 13.3 14.7 13.2 32.8 28.6 25.3 22.0 19.1 16.8 8.7 7.7 6.8 26.6 26.9 27.0 1.5 2.0 2.3 641
Media
PVR BUY 1,713 1,700 (1) 104 1.4 61 (33) 45 55 70 239 21 NM 38 31 162 14 12 4.1 3.7 3.4 NM 10 11 (0.2) 0.3 0.3 23
Sun TV Network REDUCE 542 490 (10) 214 2.8 394 43 46 48 11 8 3 13 12 11 8 8 7 2.7 2.4 2.3 23 22 20 3.7 4.6 5.5 15
Zee Entertainment Enterprises BUY 317 250 (21) 304 4.0 960 13 16 18 7 28 11 25 20 18 15 12 11 2.9 2.6 2.4 12 14 14 1.3 1.4 1.4 98
Media Cautious 622 8.3 36.1 34.7 7.7 23.1 17.1 15.9 14.2 10.5 9.6 3.0 2.7 2.5 12.8 15.7 15.5 1.9 2.3 2.6 136
Metals & Mining
Hindalco Industries BUY 508 565 11 1,142 15.1 2,220 51 56 58 99 10 4 10 9 9 6.0 5.2 4.8 1.5 1.3 1.1 16 15 14 0.6 0.8 0.8 74
Hindustan Zinc BUY 333 370 11 1,406 18.7 4,225 24 23 25 29 (4) 5 14 14 14 7.6 8 .1 7.7 4.4 4.4 4.4 32 31 32 7.3 7.0 7.4 5
Jindal Steel and Power BUY 433 540 25 441 5.9 1,020 98 64 70 56 (35) 10 4 7 6 3.1 4.3 3.7 1.2 1.0 0.9 33 17 16 — — — 56
JSW Steel REDUCE 681 665 (2) 1,647 21.8 2,417 79 56 58 139 (29) 4 9 12 12 5.9 7.4 7.0 2.6 2.2 1.9 35 20 17 1.6 1.1 1.1 65
National Aluminium Co. BUY 105 100 (5) 193 2.6 1,837 11 12 11 58 7 (8 ) 9 9 10 5.1 4.9 5.3 1.6 1.4 1.3 18 17 14 3.7 4.0 3.7 52
NMDC REDUCE 152 150 (1) 444 5.9 2,931 28 15 11 26 (46) (25) 5 10 13 3.7 6.9 9.0 1.3 1.2 1.2 26 13 9 9.3 5.0 3.7 36
SAIL BUY 122 170 40 503 6.7 4,130 43 20 21 338 (54) 8 3 6 6 2.3 3.6 3.3 0.8 0.7 0.7 33 13 12 2.8 2.8 2.8 86
Tata Steel BUY 1,354 1,750 29 1,629 21.6 1,219 333 175 166 368 (48) (5) 4 8 8 3.3 4.7 4.4 1.5 1.3 1.1 44 18 15 2.8 1.5 1.4 225
Vedanta REDUCE 319 285 (11) 1,187 15.8 3,717 43 36 36 32 (17) 0 7 9 9 3.7 4.0 3.9 1.7 1.5 1.4 24 18 16 5.7 5.4 5.7 64
Metals & Mining Attractive 8,594 114.0 123.1 (32.3) 0.5 6.3 9.4 9.3 4.2 5.3 5.0 1.7 1.5 1.4 27.3 16.3 14.7 3.6 3.0 3.0 662
P/B (X) RoE (%) Dividend yield (%)

48 KOTAK INSTITUTIONAL EQUITIES RESEARCH
K
OTA
K IN
STIT
UTIO
NA
L EQ
UIT
IES R
ESEA
RC
H
48
Ind
ia D
aily
Su
mm
ary
- Octo
be
r 14, 2
02
1
Kotak Institutional Equities: Valuation summary of KIE Universe stocks
Source: Company, Bloomberg, Kotak Institutional Equities estimates
Price (Rs) Fair Value Upside Mkt cap. O/S shares EPS (Rs) EPS growth (%) P/E (X) EV/EBITDA (X) ADVT-3mo
Company Rating 13-Oct-21 (Rs) (%) (Rs bn) (US$ bn) (mn) 2022E 2023E 2024E 2022E 2023E 2024E 2022E 2023E 2024E 2022E 2023E 2024E 2022E 2023E 2024E 2022E 2023E 2024E 2022E 2023E 2024E (US$ mn)
Oil, Gas & Consumable Fuels
BPCL BUY 459 550 20 995 13.2 2,093 34 40 43 (50) 18 8 14 11 11 8 .4 7.3 6.7 2.1 1.9 1.8 14 17 17 3.6 4.4 4.7 38
Coal India REDUCE 190 150 (21) 1,171 15.5 6,163 16 16 17 (20) (4) 8 12 12 11 10.3 10.2 8 .8 3.4 3.7 3.9 29 29 34 10.5 10.5 10.5 36
HPCL BUY 326 310 (5) 462 6.1 1,419 35 37 41 (56) 7 9 9 9 8 8 .8 8 .3 8 .0 1.2 1.1 1.0 13 13 13 4.3 4.6 5.0 16
IOCL BUY 131 125 (5) 1,236 16.4 9,181 18 17 19 (29) (8 ) 12 7 8 7 5.2 5.3 4.8 1.0 1.0 0.9 15 13 13 7.0 6.5 7.3 19
Oil India SELL 230 150 (35) 249 3.3 1,084 19 21 19 85 14 (11) 12 11 12 9.0 8 .1 8 .4 0.9 0.9 0.8 7 8 7 3.2 3.7 3.3 5
ONGC SELL 160 110 (31) 2,013 26.7 12,580 20 20 19 105 1 (7) 8 8 9 4.0 3.7 3.7 0.8 0.7 0.7 10 10 8 4.8 5.0 4.5 43
Reliance Industries ADD 2,695 2,800 4 17,111 227.0 6,349 85 105 122 17 24 16 32 26 22 16.5 12.5 10.5 2.3 2.1 1.9 7 9 9 0.3 0.3 0.3 199
Oil, Gas & Consumable Fuels Attractive 23,237 308.2 1.1 11.4 9.3 19.4 17.4 15.9 10.4 8.9 7.8 1.8 1.7 1.6 9.4 9.8 10.0 1.8 1.8 1.9 356
Pharmaceuticals
Aurobindo Pharma REDUCE 729 790 8 427 5.7 586 58 63 67 5 8 7 13 12 11 7 7 6 1.7 1.5 1.4 14 13 13 1.2 1.5 1.8 34
Biocon SELL 352 310 (12) 423 5.6 1,202 6 9 11 2 48 18 55 37 32 20 16 14 4.6 4.2 3.8 8 11 12 0.6 0.9 1.1 13
Cipla BUY 914 1,070 17 737 9.8 806 34 47 62 13 41 30 27 19 15 15 11 8 3.6 3.1 2.7 13 16 18 0.7 1.0 1.3 36
Divis Laboratories REDUCE 5,249 4,250 (19) 1,393 18.5 265 96 110 121 28 14 10 55 48 43 38 34 30 12.7 10.8 9.3 23 23 21 (0.6) (0.7) (0.8 ) 36
Dr Reddy's Laboratories SELL 4,928 4,650 (6) 820 10.9 166 171 246 308 9 44 25 29 20 16 17 12 9 4.2 3.6 3.0 15 18 19 0.7 0.6 0.6 44
Gland Pharma SELL 3,779 2,850 (25) 619 8 .2 163 80 96 108 31 20 12 47 39 35 36 29 26 8 .6 7.0 5.9 18 18 17 — — — 15
Laurus Labs SELL 634 445 (30) 340 4.5 536 21 25 28 14 18 11 30 26 23 20 16 14 9.1 6.7 5.2 30 26 23 — — — 26
Lupin BUY 963 1,220 27 437 5.8 450 36 51 66 33 42 28 27 19 15 13 9 7 2.8 2.5 2.2 11 13 15 0.6 0.8 1.0 25
Sun Pharmaceuticals ADD 843 830 (1) 2,022 26.8 2,406 27 32 37 10 17 17 31 27 23 19 17 14 3.9 3.5 3.1 13 13 14 0.6 0.8 0.9 50
Torrent Pharmaceuticals REDUCE 3,127 2,950 (6) 529 7.0 169 75 95 115 2 26 22 42 33 27 20 17 15 7.9 6.9 5.9 19 21 22 0.8 1.0 1.3 7
Pharmaceuticals Attractive 7,748 102.8 13.0 24.7 18.5 32.1 25.8 21.8 18.8 15.3 12.9 4.6 4.0 3.5 14.2 15.5 15.9 0.4 0.5 0.6 284
Real Estate
Brigade Enterprises BUY 462 350 (24) 106 1.4 230 (1) 13 16 32 1,002 18 NM 34 29 24 10 9 3.9 3.6 3.2 NM 11 12 0.5 0.5 0.5 5
DLF REDUCE 428 300 (30) 1,058 14.0 2,475 7 9 14 60 29 60 61 47 30 64 54 48 2.9 2.8 2.6 5 6 9 0.5 0.5 0.5 66
Embassy Office Parks REIT ADD 344 380 10 326 4.3 948 8 12 16 12 49 31 42 28 21 18 14 12 1.3 1.3 1.4 3 5 6 6.3 6.5 8 .1 9
Godrej Properties SELL 2,458 1,000 (59) 683 9.1 278 13 30 34 291 133 14 189 81 71 855 153 508 7.9 7.2 6.5 4 9 10 — — — 42
Macrotech Developers ADD 1,181 970 (18) 528 7.0 447 18 16 48 39 (11) 205 67 75 25 47 46 17 6.7 6.2 4.9 13 9 22 — — — 7
Mindspace REIT ADD 320 320 0 190 2.5 593 8 14 17 61 70 18 38 23 19 16 14 12 1.1 1.2 1.2 3 5 6 5.9 6.5 7.3 1
Oberoi Realty ADD 965 700 (27) 351 4.7 364 29 39 46 42 36 16 33 25 21 29 16 13 3.4 3.0 2.6 11 13 13 0.2 0.2 0.2 20
Phoenix Mills BUY 980 1,040 6 168 2.2 172 8 30 41 158 286 34 124 32 24 29 15 12 3.4 3.1 2.8 3 10 12 0.3 0.3 0.4 4
Prestige Estates Projects ADD 458 380 (17) 184 2.4 401 14 25 38 105 73 54 32 19 12 10 8 6 2.4 2.1 1.8 8 12 16 0.3 0.3 0.3 12
Sobha BUY 828 660 (20) 79 1.0 95 37 60 65 464 60 8 22 14 13 8 6 6 2.9 2.5 2.1 14 19 18 0.8 0.8 0.8 7
Sunteck Realty BUY 501 490 (2) 73 1.0 140 18 16 42 365 (11) 166 28 32 12 19 19 7 2.3 2.2 1.9 9 7 17 0.2 0.2 0.2 11
Real Estate Attractive 3,747 49.7 83.2 51.5 49.0 57.7 38.1 25.5 31.5 22.4 16.7 2.9 2.8 2.6 5.1 7.4 10.3 1.1 1.1 1.3 184
Retailing
Aditya Birla Fashion and Retail BUY 270 255 (6) 241 3.2 938 (4) 4 6 47 184 54 NM 76 49 34 15 12 10.2 9.0 7.6 NM 13 17 — — — 13
Avenue Supermarts SELL 5,117 2,000 (61) 3,315 44.0 648 21 39 51 22 90 29 247 130 101 158 88 68 24.5 20.6 17.1 10 17 19 — — — 19
Titan Company ADD 2,537 1,860 (27) 2,252 29.9 888 20 27 35 80 37 29 128 93 72 80 61 49 25.8 21.6 17.9 22 25 27 0.2 0.3 0.4 37
Retailing Attractive 5,808 77.0 102.1 96.3 30.9 215.4 #### 83.8 #### 63.9 50.8 23.5 19.8 16.5 10.9 18.1 19.6 0.1 0.1 0.2 69
P/B (X) RoE (%) Dividend yield (%)

KOTAK INSTITUTIONAL EQUITIES RESEARCH 49
In
dia
Da
ily S
um
ma
ry - O
ctob
er 1
4, 2
02
1
49
K
OTA
K IN
STIT
UTIO
NA
L EQ
UIT
IES R
ESEA
RC
H
Kotak Institutional Equities: Valuation summary of KIE Universe stocks
Source: Company, Bloomberg, Kotak Institutional Equities estimates
Price (Rs) Fair Value Upside Mkt cap. O/S shares EPS (Rs) EPS growth (%) P/E (X) EV/EBITDA (X) ADVT-3mo
Company Rating 13-Oct-21 (Rs) (%) (Rs bn) (US$ bn) (mn) 2022E 2023E 2024E 2022E 2023E 2024E 2022E 2023E 2024E 2022E 2023E 2024E 2022E 2023E 2024E 2022E 2023E 2024E 2022E 2023E 2024E (US$ mn)
Specialty Chemicals
Aarti Industries BUY 1,108 1,080 (3) 402 5.3 363 19 27 32 26 44 16 59 41 35 33 26 22 7.6 6.3 5.5 16 17 17 0.3 0.7 - 17
Atul ADD 10,729 10,000 (7) 317 4.2 30 241 286 339 9 19 19 45 38 32 33 28 23 7.3 6.4 5.6 17 18 19 0.6 0.8 0.9 4
Castrol India BUY 147 165 13 145 1.9 989 8 9 10 29 17 13 19 16 14 12 11 9 10.0 9.6 8 .9 54 61 65 5.1 5.8 6.1 2
Clean Science & Technology REDUCE 2,208 1,950 (12) 235 3.1 106 22 29 38 16 36 29 102 75 58 76 56 43 31.4 22.8 16.9 36 35 33 0.1 0.1 0.2 -
Navin Fluorine REDUCE 3,949 3,750 (5) 195 2.6 49 56 79 97 40 41 22 71 50 41 50 34 27 10.4 8 .7 7.3 16 19 19 0.1 0.2 0.2 15
Pidilite Industries REDUCE 2,474 1,850 (25) 1,257 16.7 508 25 34 40 13 33 19 98 73 61 66 51 43 19.8 16.9 14.4 22 25 25 0.4 0.5 0.6 15
PI Industries ADD 3,337 3,500 5 506 6.7 152 62 80 107 25 30 32 54 41 31 36 26 20 8 .2 7.0 5.9 16 18 21 0.2 0.4 0.6 19
S H Kelkar and Company BUY 156 180 15 22 0.3 141 9 11 13 (6) 22 14 17 14 12 10 9 7 2.1 1.9 1.7 13 14 15 1.6 2.1 2.7 1
SRF ADD 2,406 12,000 399 713 9.5 59 283 328 388 38 16 18 9 7 6 26 22 19 1.7 1.4 1.2 22 21 21 1.2 1.5 1.7 43
Vinati Organics BUY 2,017 2,200 9 207 2.7 103 35 49 62 32 41 27 58 41 33 42 29 23 11.3 9.1 7.6 21 24 25 0.3 0.6 0.9 3
Specialty Chemicals Attractive 3,999 53.0 25.1 27.1 20.7 56.6 44.5 36.9 36.7 29.4 24.3 10.7 9.0 7.7 18.9 20.2 20.8 0.5 0.7 0.8 119
Telecommunication Services
Indus Towers ADD 298 265 (11) 804 10.7 2,695 20 20 21 (3) 3 6 15 15 14 6 6 6 4.8 4.5 4.2 32 31 31 5.4 5.4 5.7 30
Vodafone Idea RS 11 — — 307 4.1 28,735 (9) (8 ) (7) NM NM NM NM NM NM 12 11 10 (0.5) (0.4) (0.3) 53 29 21 — — — 76
Tata Communications ADD 1,457 1,550 6 415 5.5 285 49 60 72 30 22 20 30 24 20 11 10 9 36.6 17.0 10.4 225 96 64 1.0 1.2 1.5 7
Telecommunication Services Attractive 5,397 71.6 21 77 225 NM NM 119.3 9.4 7.9 6.9 50 (173) (58) NM 116 NM 1.5 1.5 1.6 284
Transportation
Adani Ports and SEZ REDUCE 759 740 (3) 1,550 20.6 2,112 28 35 42 41 21 21 27 22 18 16 13 11 3.9 3.4 2.9 17 16 17 0.6 0.5 0.5 71
Container Corp. SELL 689 585 (15) 420 5.6 609 17 20 27 72 15 35 40 35 26 26 18 14 3.7 3.4 3.2 10 10 13 - 0.6 1.2 19
Gateway Distriparks BUY 275 310 13 34 0.5 125 12 16 21 63 28 31 22 17 13 11 9 7 2.2 2.0 1.8 10 12 14 1.1 1.1 1.1 1
GMR Infrastructure BUY 45 45 1 269 3.6 6,036 (2) (1) (1) 39 34 (8 ) NM NM NM 31 22 20 (10.3) (10.8) (9.6) 56 34 33 — — — 12
Gujarat Pipavav Port BUY 112 121 8 54 0.7 483 6 7 9 38 12 22 18 16 13 9 8 7 2.7 2.7 2.8 15 17 21 5.5 6.2 7.5 1
InterGlobe Aviation BUY 2,018 2,600 29 777 10.3 383 (183) 123 156 (27) 167 27 NM 16 13 NM 5 4 (11.7) (41.1) 4.1 216 NM 541 — — — 25
Mahindra Logistics REDUCE 751 560 (25) 54 0.7 71 11 17 23 123 48 40 67 45 32 23 18 14 8 .5 7.4 6.3 13 18 21 — — — 3
Transportation Attractive 3,157 41.9 72.6 2,201.8 25.9 NM 24.5 19.4 23.4 11.0 9.4 6.7 5.3 4.2 NM 22 22 0.4 0.4 0.6 132
KIE universe 203,511 2,698 34.2 17.4 14.7 27.2 23.2 20.2 13.9 12.4 11.0 3.6 3.3 3.0 13.3 14.1 14.6 1.2 1.4 1.5
Notes:
(a) We have used adjusted book values for banking companies.
(b) 2022 means calendar year 2021, similarly for 2023 and 2024 for these particular companies.
(c) Exchange rate (Rs/US$)= 75.39
P/B (X) RoE (%) Dividend yield (%)

Disclo
sure
s
Disclosures
Ratings and other definitions/identifiers
Definitions of ratings
BUY. We expect this stock to deliver more than 15% returns over the next 12 months.
ADD. We expect this stock to deliver 5-15% returns over the next 12 months.
REDUCE. We expect this stock to deliver -5-+5% returns over the next 12 months.
SELL. We expect this stock to deliver <-5% returns over the next 12 months.
Our Fair Value estimates are also on a 12-month horizon basis.
Our Ratings System does not take into account short-term volatility in stock prices related to movements in the market. Hence, a particular Rating may not
strictly be in accordance with the Rating System at all times.
Other definitions
Coverage view. The coverage view represents each analyst’s overall fundamental outlook on the Sector. The coverage view will consist of one of the following
designations: Attractive, Neutral, Cautious.
Other ratings/identifiers
NR = Not Rated. The investment rating and fair value, if any, have been suspended temporarily. Such suspension is in compliance with applicable regulation(s)
and/or Kotak Securities policies in circumstances when Kotak Securities or its affiliates is acting in an advisory capacity in a merger or strategic transaction
involving this company and in certain other circumstances.
CS = Coverage Suspended. Kotak Securities has suspended coverage of this company.
NC = Not Covered. Kotak Securities does not cover this company.
RS = Rating Suspended. Kotak Securities Research has suspended the investment rating and fair value, if any, for this stock, because there is not a sufficient
fundamental basis for determining an investment rating or fair value. The previous investment rating and fair value, if any, are no longer in effect for this stock
and should not be relied upon.
NA = Not Available or Not Applicable. The information is not available for display or is not applicable.
NM = Not Meaningful. The information is not meaningful and is therefore excluded.
Kotak Institutional Equities Research coverage universe
Distribution of ratings/investment banking relationships
Source: Kotak Institutional Equities As of September 30, 2021
Percentage of companies covered by Kotak Institutional
Equities, within the specified category.
* The above categories are defined as follows: Buy = We expect
this stock to deliver more than 15% returns over the next 12
months; Add = We expect this stock to deliver 5-15% returns
over the next 12 months; Reduce = We expect this stock to
deliver -5-+5% returns over the next 12 months; Sell = We
expect this stock to deliver less than -5% returns over the next
12 months. Our target prices are also on a 12-month horizon
basis. These ratings are used illustratively to comply with
applicable regulations. As of 30/09/2021 Kotak Institutional
Equities Investment Research had investment ratings on 220
equity securities.
Percentage of companies within each category for which Kotak
Institutional Equities and or its affiliates has provided
investment banking services within the previous 12 months.
32.3%30.0%
15.9%
21.8%
2.7% 2.3%0.0%
2.3%
0%
10%
20%
30%
40%
50%
60%
70%
BUY ADD REDUCE SELL

Corporate Office Overseas Affiliates
Kotak Securities Ltd.
27 BKC, Plot No. C-27, “G Block”
Bandra Kurla Complex, Bandra (E)
Mumbai 400 051, India
Tel: +91-22-43360000
Kotak Mahindra (UK) Ltd
8th Floor, Portsoken House
155-157 Minories
London EC3N 1LS
Tel: +44-20-7977-6900
Kotak Mahindra Inc
369 Lexington Avenue
28th Floor, New York
NY 10017, USA
Tel:+1 212 600 8856
Copyright 2021 Kotak Institutional Equities (Kotak Securities Limited). All rights reserved. 1. Note that the research analysts contributing to this report may not be registered/qualified as research analysts with FINRA; and
2. Such research analysts may not be associated persons of Kotak Mahindra Inc and therefore, may not be subject to NASD Rule 2711 restrictions on communications with a subject company, public appearances and trading securities held by a research analyst account.
3. Any U.S. recipients of the research who wish to effect transactions in any security covered by the report should do so with or through Kotak Mahindra Inc and (ii) any transactions in the securities covered by the research by U.S. recipients must be effected only through Kotak Mahindra Inc at [email protected].
This report is distributed in Singapore by Kotak Mahindra (UK) Limited (Singapore Branch) to institutional investors, accredited investors or expert investors only as defined under the Securities and Futures Act. Recipients of this analysis / report are to contact Kotak Mahindra (UK) Limited (Singapore Branch) (16 Raffles Quay, #35-02/03, Hong Leong Building, Singapore 048581) in respect of any matters arising from, or in connection with, this analysis / report. Kotak Mahindra (UK) Limited (Singapore Branch) is regulated by the Monetary Authority of Singapore. Kotak Securities Limited and its affiliates are a full-service, integrated investment banking, investment management, brokerage and financing group. We along with our affiliates are leading underwriter of securities and participants in virtually all securities trading markets in India. We and our affiliates have investment banking and other business relationships with a significant percentage of the companies covered by our Investment Research Department. Our research professionals provide important input into our investment banking and other business selection processes. Investors should assume that Kotak Securities Limited and/or its affiliates are seeking or will seek investment banking or other business from the company or companies that are the subject of this material and that the research professionals who were involved in preparing this material may participate in the solicitation of such business. Our research professionals are paid in part based on the profitability of Kotak Securities Limited, which include earnings from investment banking and other business. Kotak Securities Limited generally prohibits its analysts, persons reporting to analysts, and members of their households from maintaining a financial interest in the securities or derivatives of any companies that the analysts cover. Additionally, Kotak Securities Limited generally prohibits its analysts and persons reporting to analysts from serving as an officer, director, or advisory board member of any companies that the analysts cover. Our salespeople, traders, and other professionals may provide oral or written market commentary or trading strategies to our clients that reflect opinions that are contrary to the opinions expressed herein, and our proprietary trading and investing businesses may make investment decisions that are inconsistent with the recommendations expressed herein. In reviewing these materials, you should be aware that any or all of the foregoing, among other things, may give rise to real or potential conflicts of interest. Additionally, other important information regarding our relationships with the company or companies that are the subject of this material is provided herein. This material should not be construed as an offer to sell or the solicitation of an offer to buy any security in any jurisdiction where such an offer or solicitation would be illegal. We are not soliciting any action based on this material. It is for the general information of clients of Kotak Securities Limited. It does not constitute a personal recommendation or take into account the particular investment objectives, financial situations, or needs of individual clients. Before acting on any advice or recommendation in this material, clients should consider whether it is suitable for their particular circumstances and, if necessary, seek professional advice. The price and value of the investments referred to in this material and the income from them may go down as well as up, and investors may realize losses on any investments. Past performance is not a guide for future performance, future returns are not guaranteed and a loss of original capital may occur. Kotak Securities Limited does not provide tax advise to its clients, and all investors are strongly advised to consult with their tax advisers regarding any potential investment. Certain transactions -including those involving futures, options, and other derivatives as well as non-investment-grade securities - give rise to substantial risk and are not suitable for all investors. The material is based on information that we consider reliable, but we do not represent that it is accurate or complete, and it should not be relied on as such. Opinions expressed are our current opinions as of the date appearing on this material only. We endeavor to update on a reasonable basis the information discussed in this material, but regulatory, compliance, or other reasons may prevent us from doing so. We and our affiliates, officers, directors, and employees, including persons involved in the preparation or issuance of this material, may from time to time have "long" or "short" positions in, act as principal in, and buy or sell the securities or derivatives thereof of companies mentioned herein. Kotak Securities Limited and its non US affiliates may, to the extent permissible under applicable laws, have acted on or used this research to the extent that it relates to non US issuers, prior to or immediately following its publication. Foreign currency denominated securities are subject to fluctuations in exchange rates that could have an adverse effect on the value or price of or income derived from the investment. In addition, investors in securities such as ADRs, the value of which are influenced by foreign currencies affectively assume currency risk. In addition options involve risks and are not suitable for all investors. Please ensure that you have read and understood the current derivatives risk disclosure document before entering into any derivative transactions. Kotak Securities Limited established in 1994, is a subsidiary of Kotak Mahindra Bank Limited. Kotak Securities is one of India's largest brokerage and distribution house. Kotak Securities Limited is a corporate trading and clearing member of Bombay Stock Exchange Limited (BSE), National Stock Exchange of India Limited (NSE), Metropolitan Stock Exchange of India Limited (MSE), National Commodity and Derivatives Exchange (NCDEX) and Multi Commodity Exchange(MCX). Our businesses include stock broking, services rendered in connection with distribution of primary market issues and financial products like mutual funds and fixed deposits, depository services and Portfolio Management. Kotak Securities Limited is also a depository participant with National Securities Depository Limited (NSDL) and Central Depository Services (India) Limited (CDSL). Kotak Securities Limited is also registered with Insurance Regulatory and Development Authority as Corporate Agent for Kotak Mahindra Old Mutual Life Insurance Limited and is also a Mutual Fund Advisor registered with Association of Mutual Funds in India (AMFI). Kotak Securities Limited is registered as a Research Analyst under SEBI (Research Analyst) Regulations, 2014. We hereby declare that our activities were neither suspended nor we have defaulted with any stock exchange authority with whom we are registered in last five years. However SEBI, Exchanges and Depositories have conducted the routine inspection and based on their observations have issued advise letters or levied minor penalty on KSL for certain operational deviations. We have not been debarred from doing business by any Stock Exchange / SEBI or any other authorities; nor has our certificate of registration been cancelled by SEBI at any point of time. We offer our research services to primarily institutional investors and their employees, directors, fund managers, advisors who are registered with us Details of Associates are available on website i.e. www.kotak.com Research Analyst has served as an officer, director or employee of subject company(ies): No We or our associates may have received compensation from the subject company(ies) in the past 12 months. We or our associates have managed or co-managed public offering of securities for the subject company(ies) in the past 12 months. YES. Visit our website for more details We or our associates may have received compensation for investment banking or merchant banking or brokerage services from the subject company(ies) in the past 12 months. We or our associates may have received any compensation for products or services other than investment banking or merchant banking or brokerage services from the subject company(ies) in the past 12 months. We or our associates may have received compensation or other benefits from the subject company(ies) or third party in connection with the research report. Our associates may have financial interest in the subject company(ies). Research Analyst or his/her relative's financial interest in the subject company(ies): No Kotak Securities Limited has financial interest in the subject company(ies) at the end of the month immediately preceding the date of publication of Research Report: Mindtree, Wipro - YES Nature of Financial interest: Holding equity shares or derivatives of the subject company. Our associates may have actual/beneficial ownership of 1% or more securities of the subject company(ies) at the end of the month immediately preceding the date of publication of Research Report. Research Analyst or his/her relatives has actual/beneficial ownership of 1% or more securities of the subject company(ies) at the end of the month immediately preceding the date of publication of Research Report: No Kotak Securities Limited has actual/beneficial ownership of 1% or more securities of the subject company(ies) at the end of the month immediately preceding the date of publication of Research Report: No Subject company(ies) may have been client during twelve months preceding the date of distribution of the research report. A graph of daily closing prices of securities is available at https://www.moneycontrol.com/india/stockpricequote/ and http://economictimes.indiatimes.com/markets/stocks/stock-quotes. (Choose a company from the list on the browser and select the"three years" icon in the price chart).
Kotak Securities Limited. Registered Office: 27 BKC, C 27, G Block, Bandra Kurla Complex, Bandra (E), Mumbai 400051. CIN: U99999MH1994PLC134051, Telephone No.: +22 43360000, Fax No.: +22 67132430. Website: www.kotak.com / www.kotaksecurities.com. Correspondence Address: Infinity IT Park, Bldg. No 21, Opp. Film City Road, A K Vaidya Marg, Malad (East), Mumbai 400097. Telephone No: 42856825. SEBI Registration No. INZ000200137(Member of NSE, BSE, MSE, MCX & NCDEX). Member Id: NSE-08081; BSE-673; MSE-1024; MCX-56285; NCDEX-1262. AMFI ARN 0164, PMS INP000000258 and Research Analyst INH000000586. NSDL/CDSL: IN-DP-NSDL-23-97. Compliance Officer Details: Mr. Manoj Agarwal. Call: 022 - 4285 8484, or Email: [email protected]. Investments in securities market are subject to market risks, read all the related documents carefully before investing. In case you require any clarification or have any concern, kindly write to us at below email ids: Level 1: For Trading related queries, contact our customer service at ‘[email protected]’ and for demat account related queries contact us at [email protected] or call us on: Toll free numbers 18002099191 / 1860 266 9191 Level 2: If you do not receive a satisfactory response at Level 1 within 3 working days, you may write to us at [email protected] or call us on 022-42858445 and if you feel you are still unheard, write to our customer service HOD at [email protected] or call us on 022-42858208. Level 3: If you still have not received a satisfactory response at Level 2 within 3 working days, you may contact our Compliance Officer (Name: Mr. Manoj Agarwal) at [email protected] or call on 91- (022) 4285 8484. Level 4 : If you have not received a satisfactory response at Level 3 within 7 working days, you may also approach Managing Director / CEO (Mr. Jaideep Hansraj) at [email protected] or call on 91-(022) 4285 8301. First Cut notes published on this site are for information purposes only. They represent early notations and responses by analysts to recent events. Data in the notes may not have been verified by us and investors should not act upon any data or views in these notes. Most First Cut notes, but not necessarily all, will be followed by final research reports on the subject. There could be variance between the First cut note and the final research note on any subject, in which case the contents of the final research note would prevail. We accept no liability for the contents of the First Cut Notes.