$15 minimum wage and the potential impacts to seattle’s
TRANSCRIPT

$15 Minimum Wage and the Potential Impacts To Seattle’s Workforce
AUTHOR
Nicole JonesSeattle Jobs Initiative

INTRODUCTION
When Seattle Mayor Ed Murray took office in 2014, one of his first priorities was to create a citywide
minimum wage of $15 per hour. He created the Income Inequality Advisory Committee (IIAC) –
comprised of representatives from labor, businesses, and nonprofits – to develop a set of actionable
recommendations for completing this task.1
Legislation to raise Seattle’s minimum wage to $15 per hour was passed by City Council and signed into
law by Mayor Murray on June 3, 2014. The increase will be phased in over time, beginning April 2015.
The implementation of the $15 minimum wage will happen in schedules, dependent upon an employer’s
size. Smaller employers, those with less than 500 employees, will have to enact a $15 minimum wage in
seven years. Larger employers, those with more than 500 employees, will need to reach $15 per hour in
three years.2
There will be two different schedules for each employer type to reach the $15 minimum wage. Table 1,
on the following page, details the schedule for employers in Seattle to implement the $15 minimum
wage. By 2017, large employers will be paying their employees $15 per hour. Small employers will be
paying their employees $15 per hour by 2019. However, large employers offering healthcare benefits
have an additional year – until 2018 – to reach the $15 minimum wage. Likewise, small employers with
employees receiving tips and benefits have until 2021 to implement the increase. Once $15 per hour is
reached, hourly wages are calculated based on a 2.4 percent Consumer Price Index (CPI) estimation.
1

In order to better understand the effects of what will amount to a 61 percent increase in Seattle’s
minimum wage, this reports seeks to identify and review existing empirical research and conduct an
analysis of the potential impacts to various types of workers and industries. Seattle Jobs Initiative
(SJI) works to create opportunities for people to support themselves and their families through living-
wage careers. SJI does this by supporting education and training programs in partnership with local
colleges and community-based organizations. Our participants are largely comprised of low-income,
low-skill Seattle residents and therefore understanding the implications of a $15 minimum wage are
advantageous to the success of our education and training programs.
2
TABLE 1. Schedule of Seattle’s Wage Increases under IIAC Proposal
YEAR
Schedule 1 (>500 Employees) Schedule 2 (<500 Employees)Minimum Compensation
Minimum Wage Minimum Wage with Health Care Wage Only Including Tips & Benefits
2015 $11.00 $11.00 $11.00 $10.00
2016 $13.00 $12.50 $12.00 $10.50
2017 $15.00 $13.50 $13.00 $11.00
2018 $15.36 $15.00 $14.00 $11.50
2019 $15.73 $15.73 $15.00 $12.00
2020 $16.11 $16.11 $15.75 $13.50
2021 $16.49 $16.49 $16.49 $15.00
2022 $16.89 $16.89 $16.89 $15.75
2023 $17.29 $17.29 $17.29 $16.50
2024 $17.70 $17.70 $17.70 $17.25
2025 $18.13 $18.13 $18.13 $18.13
Estimates based on CPISOURCE: Quarterly Workforce Indicators - Employment by Age

PART I: EMPIRICAL RESEARCH
With the mayor’s legislation to raise Seattle’s minimum wage to $15 per hour, concerns have arisen
around the potential employment effects this new minimum wage will have on the labor force. Existing
empirical research around minimum-wage effects is extensive, and therefore this report concentrates on
the most relevant, influential studies over the last decade.
Prior to the 2000s, minimum-wage research focused mainly on the impacts of indexing the wage to
inflation and the possibility of introducing a lower minimum wage for younger workers. In 1977, the
Minimum Wage Study Commission (MWSC) released a vast report and six supplementary volumes
of related research papers on the topic. Their results indicated that the employment effects of the
minimum wage are small and almost exclusively restricted to younger workers.3 The MWSC’s conclusions
remained the dominant view for over a decade. In the 1990s, many researchers began to reexamine
the topic and “the new minimum-wage research” began to emerge. The use of cross-state variation
and natural experiments were characteristic traits of the new research.4 Alan Krueger and David
Card’s research on the impacts of increasing New Jersey’s minimum wage was considered the most
influential study to use these methods. Card and Krueger conducted surveys with fast-food restaurants
in New Jersey and neighboring Pennsylvania (where there was no increase) before and after the
increase occurred. Their study found no evidence indicating that the minimum-wage increase reduced
employment at fast-food restaurants in New Jersey.5
Card and Krueger’s research prompted many critiques and subsequent research on the new minimum
wage. By the turn of the century, the topic became highly polarized. Researchers either supported the
new minimum-wage research or were critics of it. As a result of this polarization, many meta-studies
emerged. Meta-studies are studies of studies that use a set of precise statistical techniques to combine
the results of a large number of separate analyses. Meta-studies increase the efficiency of any individual
study by increasing the amount of data available and thus providing more accurate results.6 There
are several meta-studies of minimum-wage research, and the majority of them corroborate Card and
Krueger’s claim that there are no statistically significant employment effects due to an increase in the
minimum wage.7
3

4
ADJUSTMENT CHANNELS
Conventional economics teaches that in a perfectly competitive market, the existence of a minimum
wage will price some low-wage workers out of the workforce and will lower levels of employment.
However, much of the research suggests that there is no discernible effect on employment due to
an increase in the minimum wage. In their 2011 research on the impacts of increases to the federal
minimum wage on fast-food restaurants in Georgia and Alabama, Barry Hirsch, Bruce Kaufman, and
Tatyana Zelenska argue that this phenomenon is due to the channels of adjustment approach that
employers enact in response to cost increases associated with the minimum-wage increase. Simply
stated, channels of adjustment are the workarounds employers utilize to offset the costs of a minimum
wage increase.8 The following section examines the possible channels of adjustment that could occur.
REDUCTIONS IN HOURS WORKED
A minimum-wage increase raises the cost of hiring an hour of work, and thus employers might reduce
workers’ hours rather than reducing the total number of workers on the payroll. Even if employers
responded using this channel of adjustment, a minimum-wage increase could still raise the living
standard for low-wage workers. In the extreme scenario that a reduction in hours worked was so large
that it exactly offset the minimum-wage increase, workers would still benefit from the increase simply
because they would be working fewer hours for the same pay. The evidence around this channel of
adjustment is not conclusive, but the indirect evidence suggests that the reduction in hours is not
likely to be large.9
REDUCTIONS IN NON-WAGE BENEFITS
Employers may try to offset the costs of a minimum-wage increase by reducing the value of non-wage
benefits, such as health insurance, retirement contributions, or paid time off. Empirical research on this
adjustment channel is limited, but the few studies that have analyzed the impacts of cutting non-wage
benefits suggests that the employment effects are small or nonexistent.10
REDUCTIONS IN TRAINING
A reduction in job training expenditures is another adjustment channel that employers may use
to account for the costs associated with a minimum-wage increase. Research on this channel of
adjustment is inconclusive. Most of the recent research available points to scant evidence of effects on
employment due to a higher minimum-wage floor. While some employers may reduce training to offset
the costs of a higher wage floor, others may increase training for low-wage workers in order to boost
their productivity.11
5
CHANGES IN EMPLOYMENT COMPOSITION
Employers may respond to an increased minimum wage by hiring more skilled workers rather than cutting
the amount of workers on their staff. Implementation of this channel of adjustment would affect the
employment prospects of low-skilled, less-educated workers. Because minority workers are, as a whole,
less educated than white workers, this adjustment would place a heavier burden on their job prospects.
However, a theoretical case can be made that a higher minimum wage might improve the employment
prospects of disadvantaged workers. Higher pay could help offset the existing barriers to employment
(transportation, childcare, uniforms) for minorities that are not based on skill or experience.12
HIGHER PRICES
Passing on the added costs of a higher minimum wage to consumers, as is consistent with economic
theory regarding perfectly competitive markets, is yet another adjustment channel that employers
may utilize. A review of 30 academic papers on the price effects of an increase in the minimum wage
revealed that the corresponding rise in prices was small. A 10 percent increase in the federal minimum
wage raised food prices about 4 percent and raised overall prices by approximately 0.4 percent.13
IMPROVEMENTS IN EFFICIENCY
Efforts to improve operational efficiency by imposing tighter human resource practices, increased
performance standards, and enhanced customer services may also be implemented by employers in
reaction to a higher minimum wage. This channel of adjustment may be preferable to some employers
as it does not hurt morale or risk retaliation of workers as might applying a reduction in hours worked.
In this sense, a minimum-wage increase can work as a catalyst for employers to innovate new cost
savings techniques.14
EFFICIENCY WAGE RESPONSES FROM WORKERS
An increase in the minimum wage may empower workers to work harder, regardless of the actions
of employers to increase productivity. Efficiency wage theory suggests that receiving higher wages
increases the cost to workers of losing their jobs, which in turn, could encourage greater effort from
workers. Empirical research on efficiency wages is thorough, but the link between the minimum wage
and efficiency wages is limited.15

6
WAGE COMPRESSION
To compensate for higher wage costs of low-wage workers, employers may instead cut earnings of
high-wage workers. The empirical research concerning this channel has found that many employers
would respond to a minimum-wage increase by limiting or delaying any pay raises or bonuses for their
more experienced employees. This evidence supports the possibility that employers may enact this
adjustment to compensate for higher wage costs of low-wage workers.16
REDUCTION IN PROFITS
Another channel of adjustment is for employers to absorb the extra costs by accepting lower profits.
Research analyzing the impacts of minimum wages on firm profitability are virtually non-existent and
thus no real conclusions can be drawn about its prevalence.17
INCREASES IN DEMAND
An increase in the minimum wage may also act as an economic stimulus, particularly during times of
recession or economic downturn. Because the minimum wage is a transfer of income from employers to
low-wage workers, a rise could create an increase in consumer spending. This increase could potentially
compensate employers for the direct increase in wage costs. For example, raising the current federal
minimum wage from $7.25 per hour to $9.80 per hour would increase the combined earnings of low-
wage workers in the U.S. by nearly $40 billion over a given period. This, in turn, would result in an
overall increase in economic activity of $25 billion and generate almost 100,000 new jobs.18
REDUCED TURNOVER
Because the majority of low-wage workers face barriers to employment (childcare, transportation,
limited access to information), employers paying the minimum wage often face significant recruitment
costs such as unfilled vacancies, rapid turnover, and related job training expenses. Thus, a higher
minimum wage eases the process of recruiting and retaining employees. The costs savings through this
channel may compensate for the increased wage costs, which would then allow employers to preserve
employment levels. Additionally, if a higher minimum wage reduces job vacancies, the employment
effects could be positive.19

7
PART II: AMERICAN COMMUNITY SURVEY ANALYSIS
DATA & METHODOLOGY
The U.S. Census Bureau’s American Community Survey (ACS), a sample of about 3.5 million housing
units and group quarters in the U.S., is the source for worker demographics, industry employment, and
wage distributions used in this analysis.20 Specifically for this analysis, the place of work, weekly hours
worked, and income variables allow for the calculation of hourly wages. Because we are concerned with
the hourly wages of individuals who work in Seattle, the ACS is the best available source for a thorough
analysis of minimum-wage impacts.
The ACS creates both summary files and Public Use Microdata Sample (PUMS) files for data users.
The summary files contain pretabulated data available by geographic location. The PUMS files contain
8
untabulated records about individual people or housing units also available by geographic location. The
PUMS files are a further subsample of the full ACS and represent one percent of all housing units and
group quarters.21 Because of the ability to create custom tabulations, this report utilized the PUMS files
to measure the impacts of a minimum-wage increase in Seattle.
Additionally, the Integrated Public Use Microdata Series (IPUMS) was created by the University of
Minnesota to harmonize and disseminate data from the ACS PUMS files. The ACS produces 1-year,
3-year, and 5-year estimates on an annual basis. Five-year estimates provide the most accurate data
while one-year estimates provide the most current data available.22 The 2007 1-year estimates (a
sample containing 12 months of collected data for areas with populations over 65,000) provided by
IPUMS was the primary dataset analyzed in this report because we were interested in analyzing the
most current data available.
The 1-year PUMS estimates for 2007 provide the variables of usual hours worked per week and annual
wage and salary income. Using this information, a simple calculation can be used to determine a
worker’s hourly wage. Additionally, because the estimates were calculated from the 2007 1-year ACS
estimates, Seattle’s Consumer Price Index (CPI) for all urban consumers was used to convert the hourly
wages into 2013 dollars in order to analyze the impacts beginning from the current minimum wage
of $9.32 per hour. Unfortunately, the ACS stopped collecting the weeks worked variable after 2007
and only reports the range of weeks worked for individuals. For example, a worker reports a range of
weeks, like 1-13 or 50-52, which he or she worked during the previous year. Further, the place of work
variable was recoded to reflect only county and larger geographies; therefore, quantifying the number of
workers in Seattle for recent years was not possible. The last available dataset that included all of these
variables was the 2007 PUMS files. While 2007 is not the desired timeframe, the economy was very
similar to today’s economy and therefore using these estimates is not entirely antiquated.
Once the hourly wages were calculated, they were filtered to reflect workers who earn less than $15
per hour as this is the proposed minimum-wage increase in Seattle. By filtering for those individuals,
estimates can be obtained to demonstrate the number of workers who would benefit from the increase.
The implementation of a $15 per hour minimum wage would be an over 60 percent increase from
Seattle’s current $9.32 per hour wage. Given the implications of such a dramatic increase, the mayor
will be implementing this change in waves, over time, depending on the size and type of the business.23
Therefore, this analysis divides hourly wages into four main categories: less than $9.32 per hour, $9.32
to $10.99 per hour, $11 to $12.99 per hour, $13 to $14.99, and more than $15 per hour. These wage
tiers were then placed upon gender, age, race and ethnicity, English ability, education, and industry
estimates to illustrate the potential impacts of a minimum-wage increase for each variable.

9
2007 vs 2014 ECONOMY IN SEATTLE
This report utilized data from 2007 to analyze hourly wages across many different variables. 2007 data
was used due to data limitations of more current Census datasets. While 2007 was seven years ago,
there are many similarities in today’s economy that allow the 2007 data to be used constructively.
Seattle has grown quite a bit since 2007, adding over 25,000 jobs.24 While Seattle’s workforce is larger
in 2014 than in 2007, its employment and unemployment levels are very similar, as evidenced by Chart
1. Roughly 97 percent and 96 percent of the labor force was employed in 2007 and 201425, respectively.
Seattle’s unemployment moved between 3 and 4 percent in 2007 and 4 and 5 percent in 2014. Overall,
employment and unemployment levels were slightly better in 2007 than in 2014, but they are close
enough to use for comparison purposes.
SOURCE: Bureau of Labor Statistics, Local Area Unemployment Statistics
CHART 1: Seattle’s Unemployment & Employment Rates
100%
90%
80%
70%
60%
50%
40%
30%
20%
10%
0%
2007 2008 2009 2010 2011
98%
97%
96%
95%
94%
93%
92%
91%
90%
89%
88%
20142012 2013
Unemployment Rate Employment Rate

10
According to the Census population estimates from July 2012 to July 2013, Seattle is the nation’s fastest
growing city among the 50 most populous cities.26 Because of this increase in population, there have
been a few changes in the demographics of Seattle’s population, as illustrated by Chart 2 and Chart 3.
From 2007 to 2014, individuals aged 25 to 34 and 55 years and over grew 10 percent and 25 percent
respectively over the seven-year span. However, the proportions of these age groups relative to the
total population for each year have remained the same, with slight variation. In 2007, 25 to 34 year olds
represented 29 percent of the population and in 2014 they comprised 30 percent of the population. The
55 and over population made up 32 percent of the population in 2007 and grew slightly to 37 percent.
SOURCE: EMSI 2014.2 Class of Worker, QCEW and Non-QCEW Employees
CHART 2: Seattle’s Population by Age Range
250,000
200,000
150,000
100,000
50,000
0
15-19 20-24 25-34 35-44 45-54
2007 Population 2014 Population
55+

11
Even though the population has increased, comparisons can be drawn between 2007 and 2014.
Seattle’s surge in population growth has also lead to a more diverse population. All racial and ethnic
groups experienced growth over the seven-year span; however, people of color experienced much more
population growth than the white population. As demonstrated by Chart 3, people of color experienced
population growth of just over 23 percent while the white population only grew 2 percent from 2007
to 2014. As a result, Seattle’s population has grown more diverse. Given this information, it can be
assumed that the minimum-wage analysis for racial and ethnic groups will impact an even greater
amount of people of color than is presented in this report.
SOURCE: EMSI 2014.2 Class of Worker, QCEW and Non-QCEW Employees
CHART 3: Seattle’s Population by Race & Ethnicity
450,000
400,000
150,000
100,000
50,000
0
2007 Population 2014 Population
Hispanic Asian and/or Pacific Islander
Black White
350,000
300,000
200,000
250,000

12
Seattle’s industry sectors fluctuated in employment levels during the recessionary years from 2008 to
2010. Specifically, manufacturing and construction experienced double-digit declines in employment.
But since the recession’s tapered end (2010 through 2014), many industry sectors have returned, or are
returning, to pre-recession employment levels.27 Because the Seattle economy has largely recovered,
the proportion of employment within industry sectors in 2007 and 2014 is very similar. As evidenced by
Chart 4, there has been little movement in the share of total employment by industry over the seven-
year span. Therefore, it can also be assumed that the minimum-wage analysis conducted in this report
by industry sector is telling of the 2014 industry composition.
CHART 4: Seattle’s Industry Sector Employment
2007 Percentage of Total Jobs 2014 Percentage of Total Jobs
Government19% 19%
Professional Services18% 18%
Education & Health Care13% 16%
Trade, Transportation & Logistics15% 15%
Leisure & Hospitality10% 11%
Financial Activities7% 6%
Other Services5% 4%
Manufacturing5% 4%
Information4% 4%
Construction5% 4%
SOURCE: EMSI 2014.2 Class of Worker, QCEW and Non-QCEW Employees

13
SEATTLE’S LOW-WAGE WORKFORCE DEMOGRAPHICS
To better understand the demographics of those who would be impacted by a minimum-wage increase
in Seattle, the 2012 American Community Survey Public Use Microdata Sample (PUMS) was analyzed.
Chart 5 displays the number of wage and salary workers in Seattle. In 2007, there were 435,694 wage
and salary workers in Seattle and 24 percent (103,312) of them worked for wages below $15 per hour.
Additionally, a large portion of those workers (38,543), earned less than the current minimum wage of
$9.32 per hour.
SOURCE: Integrated Public Use Microdata Series, University of Minnesota
2476
1
2
CHART 5: Wage & Salary Workers, 2007
Low Wage24%
Rest of Workforce
76%

14
Table 2 displays the intervalled weeks worked for Seattle workers in 2007, distributed by hourly
wage category. Among those workers earning less than $15 per hour, only 62 percent worked full-
time (between 50 and 52 weeks). By comparison, among workers earning more than $15 per hour, 78
percent worked full-time.
SOURCE: Integrated Public Use Microdata Series, University of Minnesota
TABLE 2. Range of Weeks Worked – Seattle Wage & Salary Workers
Weeks Worked < $9.32 $9.32-10.99 $11-$12.99 $13-$14.99 <$15 >$15 Total
1-13 10% 5% 4% 4% 6% 3% 4%
14-26 10% 7% 6% 4% 7% 3% 4%
27-39 10% 8% 7% 2% 7% 3% 4%
40-47 10% 9% 10% 12% 10% 7% 7%
48-49 7% 7% 5% 10% 7% 7% 7%
50-52 54% 64% 69% 67% 62% 78% 74%
Total 38,543 20,751 22,967 21,051 103,312 332,382 435,694
GENDER IMPACTS
Nationally, women disproportionately earn lower wages compared to their male counterparts; however,
the disparity is not as great for Seattle’s female low-wage workforce. Chart 6, on the following page,
displays the percentage and number of male and female workers that would be impacted by incremental
wage increases (currently earning less than $15 per hour). According to the 2007 IPUMS estimates,
about 27 percent of the more than 204,000 female workers in Seattle and 23 percent of male workers
earn less than $15 per hour. Initially, a minimum-wage increase to $11 per hour would impact more
female than male workers. Of all workers earning less than $11 per hour, 55 percent are women. Overall,
the female workforce would immediately benefit from the initial increase proposed by the mayor.
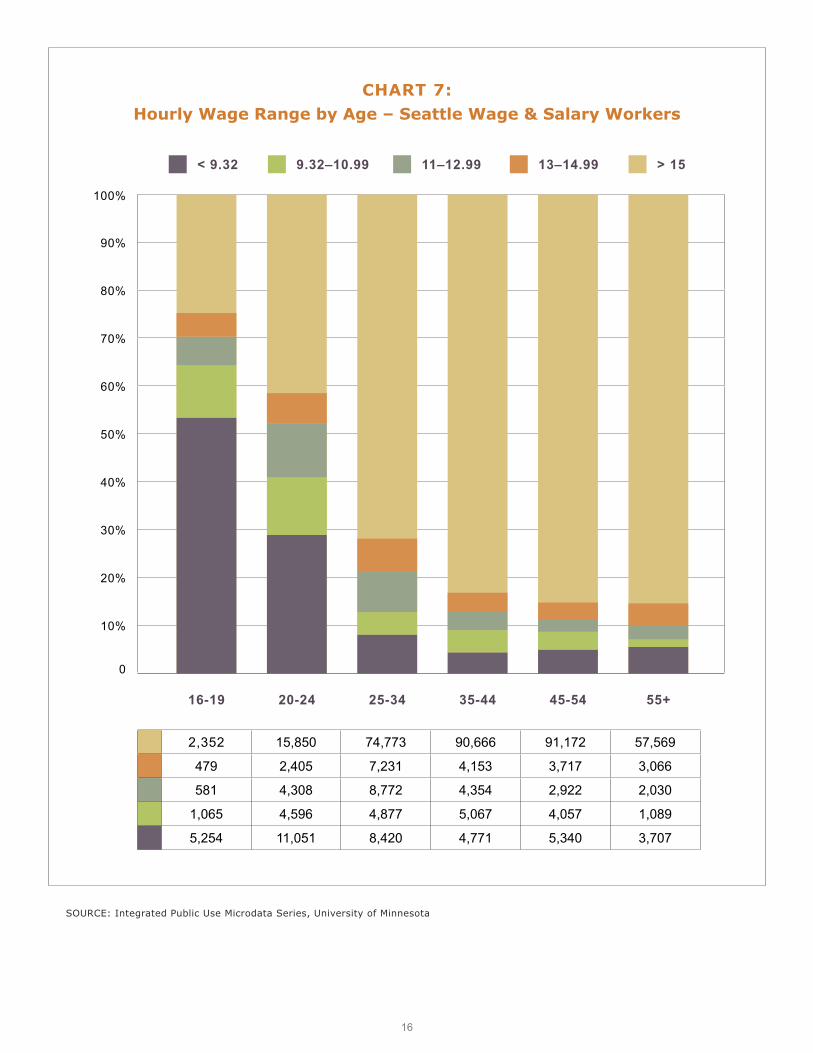
AGE IMPACTS
Increasing the minimum wage to $15 per hour would disproportionately impact Seattle’s youth. Chart 7
(page 16) displays the number of workers impacted by incremental wage increases by age range. Workers
aged 16 to 24 would overwhelmingly be impacted by this policy. A small increase to $11 per hour would
impact a significant share – 46 percent – of workers in this age range. And an even further increase to $15
per hour would impact over 60 percent of Seattle’s youth workforce. Seattle’s youth workforce comprises
the majority of low-wage jobs and would benefit immensely from an increase in the minimum wage.

15
CHART 6: Hourly Wage Range by Gender – Seattle Wage & Salary Workers
100%
80%
30%
20%
10%
0
< 9.32
Male
70%
60%
40%
50%
90%
Female
16,772
9,74011,8758,863
184,303
21,771
11,011
11,092
12,188
148,079
9.32–10.99 11–12.99 13–14.99 > 15
SOURCE: Integrated Public Use Microdata Series, University of Minnesota
SOURCE: Integrated Public Use Microdata Series, University of Minnesota
CHART 7: Hourly Wage Range by Age – Seattle Wage & Salary Workers
100%
80%
30%
20%
10%
0
< 9.32
70%
60%
40%
50%
90%
16-19
9.32–10.99 11–12.99 13–14.99 > 15
20-24 25-34 35-44 45-54 55+
2,352 15,850 74,773 90,666 91,172 57,569
479 2,405 7,231 4,153 3,717 3,066
581 4,308 8,772 4,354 2,922 2,030
1,065 4,596 4,877 5,067 4,057 1,089
5,254 11,051 8,420 4,771 5,340 3,707
16

17
RACE & ETHNICITY IMPACTS
More than 311,000 of Seattle’s workers are white. And of those, only 19 percent earn below $15 per
hour, as shown in Chart 8. In contrast, people of color comprise about 124,000 workers in Seattle, but
approximately 36 percent of them work for wages less than $15 per hour. Specifically, about 45 percent
of the Hispanic workforce earns below $15 per hour, and a large portion of those workers earn less than
minimum wage. Even a conservative increase to $11 per hour would help lift wages for over 20 percent
of people of color in Seattle. A minimum-wage increase of this magnitude would undoubtedly help to
bridge the gap between racial and ethnic inequalities among Seattle’s workforce.
CHART 8: Hourly Wage Range by Race & Ethnicity – Seattle Wage & Salary Workers
100%
80%
30%
20%
10%
0
< 9.32
70%
60%
40%
50%
90%
White
20,69511,77212,89113,448
253,092
9.32–10.99 11–12.99 13–14.99 > 15
Hispanic
4,619
2,546
3,913
2,310
16,226
Black
3,745
3,071
2,273
2,197
19,026
Asian and/or Pacific Islander
8,959
3,094
3,6152,726
42,688
SOURCE: Integrated Public Use Microdata Series, University of Minnesota

18
IMPACTS FOR ENGLISH LANGUAGE LEARNERS
There are just over 20,000 workers in Seattle who do not speak English or do not speak English well and,
as evidenced by Chart 9, over 65 percent of them work for wages below $15 per hour. Furthermore,
40 percent earn less than the current minimum wage of $9.32 per hour. English Language Learners
are disproportionately represented in Seattle’s low-wage workforce compared to their English speaking
counterparts. Only about 20 percent of Seattle’s over 415,000 English speaking workforce earns wages
less than $15 per hour. An increase in Seattle’s minimum wage would help lift wages for workers with
English difficulty, especially for those earning less than the current minimum wage of $9.32 per hour.
CHART 9: Hourly Wage Range by English Ability – Seattle Wage & Salary Workers
100%
80%
30%
20%
10%
0
< 9.32
Does not speak English
70%
60%
40%
50%
90%
Speaks English
8,216
2,221
2,053
1,106
6,693
30,327
18,53020,91419,945
325,689
9.32–10.99 11–12.99 13–14.99 > 15
SOURCE: Integrated Public Use Microdata Series, University of Minnesota

19
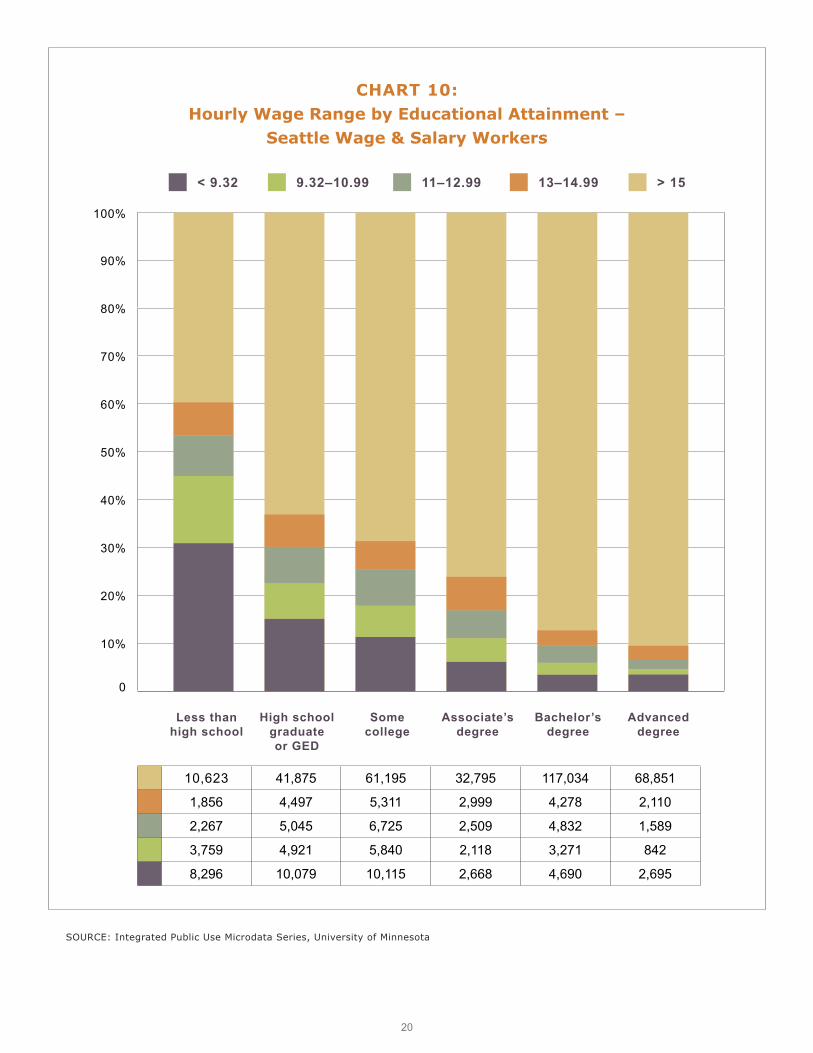
EDUCATION IMPACTS
According to the Bureau of Labor Statistics, the more education attained by an individual, the higher the
earnings potential and the lower the unemployment.28 Therefore, it is not surprising to see in Chart 10,
on the following page, that those workers with a high school diploma or less earn the lowest wages in
Seattle’s workforce. Forty-five percent of the 26,810 workers with less than a high school diploma earn
less than $11 per hour and 60 percent make less than $15 per hour. Conversely, there are just over
134,000 workers with a bachelor’s degree in Seattle, and only about 13 percent earn less than $15 per
hour. Given that Seattle’s population is highly educated (56.5 percent have a bachelor’s degree or higher),
it is not surprising that workers with lower education levels make up the bulk of the low-wage workforce.29
20
CHART 10: Hourly Wage Range by Educational Attainment –
Seattle Wage & Salary Workers
100%
80%
30%
20%
10%
0
< 9.32
70%
60%
40%
50%
90%
Less than high school
9.32–10.99 11–12.99 13–14.99 > 15
High school graduate or GED
Somecollege
Associate’s degree
Bachelor’s degree
Advanced degree
10,623 41,875 61,195 32,795 117,034 68,851
1,856 4,497 5,311 2,999 4,278 2,110
2,267 5,045 6,725 2,509 4,832 1,589
3,759 4,921 5,840 2,118 3,271 842
8,296 10,079 10,115 2,668 4,690 2,695
SOURCE: Integrated Public Use Microdata Series, University of Minnesota

21
INDUSTRIES
Due to restrictions of the data, industry sectors could not be delineated by hourly wage tiers. Instead,
the analysis of industries was extrapolated into two categories of either earning less than $15 per hour
or more than $15 per hour. Chart 11 displays the industry sectors in Seattle with the highest volume
of workers earning less than $15 per hour. Fifty-five percent of workers within the Accommodation
& Food Services industry earn less than $15 per hour, and therefore workers in this industry sector
would most benefit from an increase in the minimum wage. About 40 percent of Retail Trade workers
also earn less than $15 per hour and would be impacted by the increase. Other Services30, Health
Care, Transportation, Construction, Educational Services, and Manufacturing round out the rest of the
industries whose workers would be most impacted by increasing the minimum wage to $15 per hour.31
19,051
16,283
5,557
16,073
3,968
5,366
7,512
6,663
CHART 11: Hourly Wage Range by Selected Industry Sector –
Seattle Wage & Salary Workers
< 15 Rest of Workforce
Accommodation & Food Services 15,289
Retail Trade 24,470
Other Services 11,236
Health Care & Social Services 46,501
Transportation 15,162
Construction 21,288
Education Services 30,780
Manufacturing 28,032
80%30%20%10%0% 70%60%40% 50% 90% 100%
SOURCE: Integrated Public Use Microdata Series, University of Minnesota
22
CONCLUSION
Basic labor economic theory teaches that, in a perfectly competitive market, a mandated rise in the
minimum wage by the federal government will lead to a decrease in demand for labor combined with an
oversupply of workers, thus creating unemployment. If there was no minimum-wage mandate, the wage
would adjust to clear the market, equalizing labor supply and demand.32
In practice, however, minimum-wage increases mandated by the government have not contributed to a
dramatic increase in unemployment as economic theory suggests. Time and again, empirical research
has shown that a rise in the minimum wage contributes to no discernible effects on employment.
Rather than decreasing the number of workers hired, employers may instead turn to various channels
of adjustment to offset the costs of a higher minimum wage. Reductions in hours worked, non-wage
benefits, and job training are examples of the channels of adjustment employers could enact in response
to an increased minimum wage. Increased efficiency, reduced turnover, and increased demand may also
be cost-saving adjustments employers will benefit from.
In Seattle, the legislation to increase the city’s minimum wage from $9.32 to $15 per hour (a 61 percent
increase) would make the wage the highest of any state or locality. While the economic impacts remain
to be seen as employers implement certain channels of adjustment, the impacts on low-wage workers
are significant. Women, people of color, teenagers and young adults, English Language Learners,
and low-skill workers in Seattle would experience significant gains from a $15 minimum wage. The
Accommodation & Food Services, Retail, and Health Care industry sectors would see at least one-third of
its workforce benefiting from the increase. Ultimately, only time will tell if low-wage workers will move
closer to living wages through the $15 per hour mandate or if the mandate will negatively affect the
employment opportunities for low-wage workers.

NOTES
1. “$15 Minimum Wage,” City of Seattle, Office of the Mayor (blog), May 2014, http://murray.seattle.gov/minimumwage/#sthash.r60WA1Tx.dpbs.
2. “$15 Minimum Wage.”
3. John Schmitt, Why Does the Minimum Wage Have No Discernible Effect on Employment? (Washington DC: Center for Economic and Policy Research, 2013), p. 2, http://www.cepr.net/documents/publications/min-wage-2013-02.pdf.
4. Ibid.
5. Schmitt, Why Does the Minimum Wage, 3.
6. Ibid., 4.
7. Ibid., 5.
8. Ibid., 11.
9. Ibid., 15-16.
10. Ibid., 16.
11. Ibid., 16-17.
12. Ibid., 17.
13. Ibid., 18.
14. Ibid., 18-19.
15. Ibid., 19.
16. Ibid., 20.
17. Ibid.
18. Ibid.
19. Schmitt, Why Does the Minimum Wage, 21.
20. A Compass for Understanding and Using American Community Survey Data: What Data Users Need to Know (Washington DC: U.S. Government Printing Office, 2008), p. 3, http://www.census.gov/acs/www/Downloads/handbooks/ACSGeneralHandbook.pdf.
21. “When to Use 1-Year, 3-Year, or 5-Year Estimates,” U.S. Census Bureau, American Community Survey, last modified September 18, 2014, http://www.census.gov/acs/www/guidance_for_data_users/estimates/.
22. “What is IPUMS?,” Minnesota Population Center, University of Minnesota, https://usa.ipums.org/usa/intro.shtml.
23. “$15 Minimum Wage.”
24. Economic Modeling Specialists, International, Industry Tables: 2007-2014, Class of Worker 2014.2, Non-QCEW and QCEW Workers.
25. 2014 estimates include data through July.
23
26. Gene Balk, “Seattle is the fastest growing big city in the US,” The Seattle Times (blog), May 2014, http://blogs.seattletimes.com/fyi-guy/2014/05/22/census-seattle-is-the-fastest-growing-big-city-in-the-u-s/.
27. Economic Modeling Specialists, International, Industry Tables: 2007-2014, Class of Worker 2014.2, Non-QCEW and QCEW Workers
28. Bureau of Labor Statistics, U.S. Department of Labor, Employment Projections, 2014, http://www.bls.gov/emp/ep_chart_001.htm.
29. U.S. Census Bureau, 2008-2012 American Community Survey 5-Year Estimates, Educational Attainment Table, accessed through American Fact Finder on September 9, 2014, http://factfinder2.census.gov/faces/tableservices/jsf/pages/productview.xhtml?pid=ACS_12_5YR_S1501.
30. Examples of workers within the Other Services industry sector include hairdressers, housekeepers, personal care aides, and manicurists/pedicurists.
31. Industry sectors with low amounts of workers earning less than $15 per hour were excluded due to high margins of error associated with those samples.
32. Guillaume Rocheteau and Murat Tasci, “The Minimum Wage and the Labor Market,” The Federal Reserve Bank of Cleveland, May 2007, http://www.clevelandfed.org/research/commentary/2007/050107.cfm.
24