15 part iv further macroeconomics issues © 2009 pearson education, inc. publishing as prentice hall...
Post on 19-Dec-2015
218 views
TRANSCRIPT
15PART IV FURTHER MACROECONOMICS ISSUES
© 2009 Pearson Education, Inc. Publishing as Prentice Hall Principles of Macroeconomics 9e by Case, Fair and Oster
Policy Timing, Deficit
Targeting, and Stock
Market Effects
Fernando & Yvonn Quijano
Adapted from:
CHAPTER OUTLINE
Time Lags Regarding Monetary and Fiscal Policy
Fiscal Policy: Deficit Targeting
The Stock Market and the Economy

CH
AP
TE
R 1
5 P
olic
y T
imin
g, D
efic
it T
arge
ting,
and
Sto
ck M
arke
t Effe
cts
© 2009 Pearson Education, Inc. Publishing as Prentice Hall Principles of Macroeconomics 9e by Case, Fair and Oster 2 of 26
15.1 Policy Timing
The objectives of monetary and fiscal policy is to stabilize the economy (stabilization policy), i.e. to smooth out fluctuations in output and employment and to keep prices as stable as possible.
However, these stabilization goals are not easy to achieve because of the existence of time lags, i.e. delays in the response of the economy to macroeconomic policies.
We will discuss 3 types of delays: (1) recognition lag; (2) implementation lag; (3) response lag.

CH
AP
TE
R 1
5 P
olic
y T
imin
g, D
efic
it T
arge
ting,
and
Sto
ck M
arke
t Effe
cts
© 2009 Pearson Education, Inc. Publishing as Prentice Hall Principles of Macroeconomics 9e by Case, Fair and Oster 3 of 26
An expansionary policy that should have begun to take effect at point A does not actually begin to have an impact until point D, when the economy is already on an upswing. Hence, the policy pushes the economy to points E1, and F1, (instead of points E and F).
Time Lags
Attempts to stabilize the economy can prove destabilizing because of time lags.

CH
AP
TE
R 1
5 P
olic
y T
imin
g, D
efic
it T
arge
ting,
and
Sto
ck M
arke
t Effe
cts
© 2009 Pearson Education, Inc. Publishing as Prentice Hall Principles of Macroeconomics 9e by Case, Fair and Oster 4 of 26
(1) Recognition Lags
The time it takes for policy makers to recognize the existence of a boom or a slump.
This is because many important data, such as GDP, are available only quarterly.
If the economy goes into a slump on Jan 15, the downturn may not be detected until the data for the first quarter are available at the end of April.

CH
AP
TE
R 1
5 P
olic
y T
imin
g, D
efic
it T
arge
ting,
and
Sto
ck M
arke
t Effe
cts
© 2009 Pearson Education, Inc. Publishing as Prentice Hall Principles of Macroeconomics 9e by Case, Fair and Oster 5 of 26
(2) Implementation Lags
The time it takes to put the desired policy into effect once economists and policy makers recognize that the economy is in a boom or a slump.
Fiscal policy is subject to restrictions that slow down its implementation, for instance, it requires Congress or Parliament approval for additional spending or tax cuts.
In general, monetary policy can be implemented more rapidly than fiscal policy.

CH
AP
TE
R 1
5 P
olic
y T
imin
g, D
efic
it T
arge
ting,
and
Sto
ck M
arke
t Effe
cts
© 2009 Pearson Education, Inc. Publishing as Prentice Hall Principles of Macroeconomics 9e by Case, Fair and Oster 6 of 26
The time that it takes for the economy to adjust to the new conditions after a new policy is implemented; the lag that occurs because of the operation of the economy itself.
Fiscal policy. Neither individuals nor firms revise their spending plans instantaneously. Until they can make those revisions, extra government spending does not stimulate extra private spending.
Monetary policy. Monetary policy works by changing interest rates, which then change planned investment. The response of consumption and investment to interest rate changes takes time.
In general, fiscal policy has a shorter response lag than monetary policy.
(3) Response Lags

CH
AP
TE
R 1
5 P
olic
y T
imin
g, D
efic
it T
arge
ting,
and
Sto
ck M
arke
t Effe
cts
© 2009 Pearson Education, Inc. Publishing as Prentice Hall Principles of Macroeconomics 9e by Case, Fair and Oster 7 of 26
Stabilization is not easily achieved. It takes time for policy makers to recognize the existence of a problem, more time for them to implement a solution, and yet more time for firms and households to respond to the stabilization policies taken.
Summary

CH
AP
TE
R 1
5 P
olic
y T
imin
g, D
efic
it T
arge
ting,
and
Sto
ck M
arke
t Effe
cts
© 2009 Pearson Education, Inc. Publishing as Prentice Hall Principles of Macroeconomics 9e by Case, Fair and Oster 8 of 26
15.2 Fiscal Policy: Deficit Targeting
Some policy makers suggested the government focus on reducing the budget deficit as a central policy goal.
For instance, one of President Clinton’s goals when he took office in 1993 was to reduce the deficit.
After becoming prime minister of Malaysia in October 2003, Tun Abdullah Ahmad Badawi made reducing the budget deficit the cornerstone of its economic policy.

CH
AP
TE
R 1
5 P
olic
y T
imin
g, D
efic
it T
arge
ting,
and
Sto
ck M
arke
t Effe
cts
© 2009 Pearson Education, Inc. Publishing as Prentice Hall Principles of Macroeconomics 9e by Case, Fair and Oster 9 of 26
Gramm-Rudman-Hollings Act Passed by the U.S. Congress and signed by President Reagan in 1986, this law set out to reduce the federal deficit by $36 billion per year, with a deficit of zero slated for 1991.

CH
AP
TE
R 1
5 P
olic
y T
imin
g, D
efic
it T
arge
ting,
and
Sto
ck M
arke
t Effe
cts
© 2009 Pearson Education, Inc. Publishing as Prentice Hall Principles of Macroeconomics 9e by Case, Fair and Oster 10 of 26
The Effects of Spending Cuts on the Deficit
Suppose the government plans to reduce the budget deficit through spending cuts (G).
To determine the net effect of this action on deficit,
(1)We need to know the size of the government spending multiplier (Y/ G).
(2)The next important information is the deficit response index (DRI), which is the amount by which the deficit changes with a $1 change in GDP (or Y).
Deficit tends to increase when GDP falls, and vice versa.

CH
AP
TE
R 1
5 P
olic
y T
imin
g, D
efic
it T
arge
ting,
and
Sto
ck M
arke
t Effe
cts
© 2009 Pearson Education, Inc. Publishing as Prentice Hall Principles of Macroeconomics 9e by Case, Fair and Oster 11 of 26
Hypothetical Example
Given that Y/G = 1.4, and DRI = -0.22
Suppose the government cuts spending by 20 billion. What is the effect on budget deficit?
(1)Y = G x 1.4 = -20 x 1.4 = -28 billion
(2)DRI = Deficit/Y = -0.22 Deficit = -28 x -0.22 = 6.2 billion
Net effect of spending cut on deficit = -20 billion (through G) + 6.2 billion (through Y)= -13.8 billion (deficit reduced by 13.8 billion)
What if the target is to reduce deficit by 20 billion, how much should government cuts spending? [Hint: $30 billion]

CH
AP
TE
R 1
5 P
olic
y T
imin
g, D
efic
it T
arge
ting,
and
Sto
ck M
arke
t Effe
cts
© 2009 Pearson Education, Inc. Publishing as Prentice Hall Principles of Macroeconomics 9e by Case, Fair and Oster 12 of 26
Deficit targeting changes the way the economy responds to negative demand shocks (leftward shift of AD curve) because it does not allow the deficit to increase. The result is a smaller deficit but a larger decline in income than would have otherwise occurred.

CH
AP
TE
R 1
5 P
olic
y T
imin
g, D
efic
it T
arge
ting,
and
Sto
ck M
arke
t Effe
cts
© 2009 Pearson Education, Inc. Publishing as Prentice Hall Principles of Macroeconomics 9e by Case, Fair and Oster 13 of 26
Deficit targeting measures have some undesirable macroeconomic consequences.
Locking the economy into spending cuts during periods of negative demand shocks, as deficit-targeting measures do, is not a good way to manage the economy.

CH
AP
TE
R 1
5 P
olic
y T
imin
g, D
efic
it T
arge
ting,
and
Sto
ck M
arke
t Effe
cts
© 2009 Pearson Education, Inc. Publishing as Prentice Hall Principles of Macroeconomics 9e by Case, Fair and Oster 14 of 26
15.3 The Stock Market and the Economy
Things that are likely to affect the price of a stock include:
• What people expect its future dividends will be.
• When the dividends are expected to be paid.
• The amount of risk involved.
The price of a stock should equal the discounted value of its expected future dividends, where the discount factors depend on the interest rate and risk.

CH
AP
TE
R 1
5 P
olic
y T
imin
g, D
efic
it T
arge
ting,
and
Sto
ck M
arke
t Effe
cts
© 2009 Pearson Education, Inc. Publishing as Prentice Hall Principles of Macroeconomics 9e by Case, Fair and Oster 15 of 26
The effect of stock market on the economy is fairly straightforward.
An increase in stock prices causes an increase in wealth, and consequently an increase in consumer spending.
Investment is also affected by higher stock prices. With a higher stock price, a firm can raise more money per share to finance investment projects.
CH
AP
TE
R 1
5 P
olic
y T
imin
g, D
efic
it T
arge
ting,
and
Sto
ck M
arke
t Effe
cts
© 2009 Pearson Education, Inc. Publishing as Prentice Hall Principles of Macroeconomics 9e by Case, Fair and Oster 16 of 26
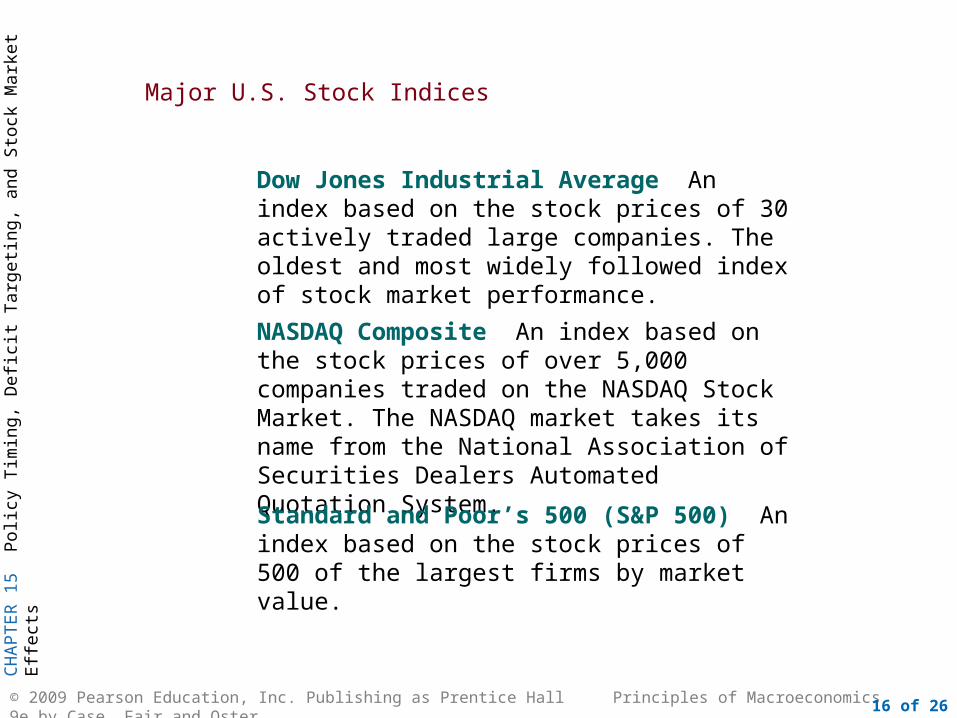
Major U.S. Stock Indices
Dow Jones Industrial Average An index based on the stock prices of 30 actively traded large companies. The oldest and most widely followed index of stock market performance.
NASDAQ Composite An index based on the stock prices of over 5,000 companies traded on the NASDAQ Stock Market. The NASDAQ market takes its name from the National Association of Securities Dealers Automated Quotation System.
Standard and Poor’s 500 (S&P 500) An index based on the stock prices of 500 of the largest firms by market value.

CH
AP
TE
R 1
5 P
olic
y T
imin
g, D
efic
it T
arge
ting,
and
Sto
ck M
arke
t Effe
cts
© 2009 Pearson Education, Inc. Publishing as Prentice Hall Principles of Macroeconomics 9e by Case, Fair and Oster 17 of 26
FIGURE 15.5 The S&P 500 Stock Price Index, 1948 I–2007 IV. What stands out most is the huge increase (about 226%) in the index between 1995 and 2000, an annual rate of increase of 25%.

CH
AP
TE
R 1
5 P
olic
y T
imin
g, D
efic
it T
arge
ting,
and
Sto
ck M
arke
t Effe
cts
© 2009 Pearson Education, Inc. Publishing as Prentice Hall Principles of Macroeconomics 9e by Case, Fair and Oster 18 of 26
What caused the stock market boom? Is it because profits rose substantially during this period, and this growth led to a large increase in expected future dividends? The following figure rules out this possibility because there is no apparent surge in profits.
FIGURE 15.6 Ratio of After-Tax Profits to GDP, 1948 I–2007 IV.

CH
AP
TE
R 1
5 P
olic
y T
imin
g, D
efic
it T
arge
ting,
and
Sto
ck M
arke
t Effe
cts
© 2009 Pearson Education, Inc. Publishing as Prentice Hall Principles of Macroeconomics 9e by Case, Fair and Oster 19 of 26
The Crash of October 1987
The value of stocks in the United States fell by about a trillion dollars between August 1987 and the end of October 1987.
If the multiplier is 1.4, the total decrease in GDP would be about 1.4 x $40 billion = $56 billion, or about 1.4 percent of GDP.
The stock market crash of 1987 did not result in a recession in 1988 because households and business firms did not lower their expectations drastically.

CH
AP
TE
R 1
5 P
olic
y T
imin
g, D
efic
it T
arge
ting,
and
Sto
ck M
arke
t Effe
cts
© 2009 Pearson Education, Inc. Publishing as Prentice Hall Principles of Macroeconomics 9e by Case, Fair and Oster 20 of 26
The Boom of 1995-2000
FIGURE 15.7 Personal Saving Rate, 1995 I–2002 III

CH
AP
TE
R 1
5 P
olic
y T
imin
g, D
efic
it T
arge
ting,
and
Sto
ck M
arke
t Effe
cts
© 2009 Pearson Education, Inc. Publishing as Prentice Hall Principles of Macroeconomics 9e by Case, Fair and Oster 21 of 26
FIGURE 15.8 Investment-Output Ratio, 1995 I–2002 III

CH
AP
TE
R 1
5 P
olic
y T
imin
g, D
efic
it T
arge
ting,
and
Sto
ck M
arke
t Effe
cts
© 2009 Pearson Education, Inc. Publishing as Prentice Hall Principles of Macroeconomics 9e by Case, Fair and Oster 22 of 26
FIGURE 15.9 Ratio of Federal Government Budget Surplus to GDP, 1995 I–2002 III

CH
AP
TE
R 1
5 P
olic
y T
imin
g, D
efic
it T
arge
ting,
and
Sto
ck M
arke
t Effe
cts
© 2009 Pearson Education, Inc. Publishing as Prentice Hall Principles of Macroeconomics 9e by Case, Fair and Oster 23 of 26
FIGURE 15.10 Growth Rate of Real GDP, 1995 I–2002 III

CH
AP
TE
R 1
5 P
olic
y T
imin
g, D
efic
it T
arge
ting,
and
Sto
ck M
arke
t Effe
cts
© 2009 Pearson Education, Inc. Publishing as Prentice Hall Principles of Macroeconomics 9e by Case, Fair and Oster 24 of 26
FIGURE 15.11 The Unemployment Rate, 1995 I–2002 III

CH
AP
TE
R 1
5 P
olic
y T
imin
g, D
efic
it T
arge
ting,
and
Sto
ck M
arke
t Effe
cts
© 2009 Pearson Education, Inc. Publishing as Prentice Hall Principles of Macroeconomics 9e by Case, Fair and Oster 25 of 26
FIGURE 15.12 Inflation Rate, 1995 I–2002 III

CH
AP
TE
R 1
5 P
olic
y T
imin
g, D
efic
it T
arge
ting,
and
Sto
ck M
arke
t Effe
cts
© 2009 Pearson Education, Inc. Publishing as Prentice Hall Principles of Macroeconomics 9e by Case, Fair and Oster 26 of 26
FIGURE 15.13 3-Month Treasury Bill Rate, 1995 I–2002 III