15 reliability 1 - student
TRANSCRIPT

8/8/2019 15 Reliability 1 - Student
http://slidepdf.com/reader/full/15-reliability-1-student 1/62
Reliability
Assoc. Prof. Ir. Dr. Cheong Kuan YewSchool of Materials & Mineral Resources Engineering
Engineering CampusUniversiti Sains Malaysia

8/8/2019 15 Reliability 1 - Student
http://slidepdf.com/reader/full/15-reliability-1-student 2/62

8/8/2019 15 Reliability 1 - Student
http://slidepdf.com/reader/full/15-reliability-1-student 3/62
Topic Outcome:
At the end of this topic, students will be able to:
Describe the term “reliability”.
Discuss how to improve the reliability of a product.Apply statistical aspect in reliability.
Explain a life-history curve of a product.
Construct and discuss OC curve related to reliability.
Use life & reliability testing plan.
Differentiate between availability & maintainability

8/8/2019 15 Reliability 1 - Student
http://slidepdf.com/reader/full/15-reliability-1-student 4/62
Topic Outline:
What is Reliability?Achieving Reliability.
Statistical Aspects of Reliability.Life-History Curve.Failure Analysis.Availability & Maintainability.

8/8/2019 15 Reliability 1 - Student
http://slidepdf.com/reader/full/15-reliability-1-student 5/62
(1) What is Reliability?
A reliable product or service meaning that it works for longer period of time before failure occurs.
Reliability is:Quality over a long run, or
A probability of success, or,
A probability (numerical value) that a product or aservice will perform its intended function satisfactorily for a prescribed life under certainstated environmental conditions .
4 factors associated with reliability.

8/8/2019 15 Reliability 1 - Student
http://slidepdf.com/reader/full/15-reliability-1-student 6/62
Can Reliability be measured ?
(numerical value)
Reliability, R, is usually measured on
a “0” to “1” scale,a percentage, or
parts per million (ppm).

8/8/2019 15 Reliability 1 - Student
http://slidepdf.com/reader/full/15-reliability-1-student 7/62
Examples:
R = 1 or 100% no failure of the product or service.
R = 0 or 0% certain failure.
R = 0.5 or 50% the product or service isexpected to fail on half the occasions when it isused.

8/8/2019 15 Reliability 1 - Student
http://slidepdf.com/reader/full/15-reliability-1-student 8/62
Common expressions of reliability also include:Failure rate per 1000 hours (2% failures per
1000 h).Failure rate per 1000 usage cycles.Mean Time Between Failure (MTBF) (MTBF =
3,500 h).Probability of an item or service failing (failure
= 2ppm).Reliability over a fixed period (99% reliability
after 5,000 h).
Failure
in time(FIT)
8/8/2019 15 Reliability 1 - Student
http://slidepdf.com/reader/full/15-reliability-1-student 9/62
What is the intended function of the
product/service?
Product/service
designed for particular applications.expected to perform it task.

8/8/2019 15 Reliability 1 - Student
http://slidepdf.com/reader/full/15-reliability-1-student 10/62
What is the intended life of the
product/service?How long is the product/service is expected to last.
Product lifeUsage
Time, or
Both.

8/8/2019 15 Reliability 1 - Student
http://slidepdf.com/reader/full/15-reliability-1-student 11/62
What is the environment conditions
of the product/service usage?
Storage, transportation, and usage conditions.
Would it be more severe than actual recommendedcondition?
8/8/2019 15 Reliability 1 - Student
http://slidepdf.com/reader/full/15-reliability-1-student 12/62
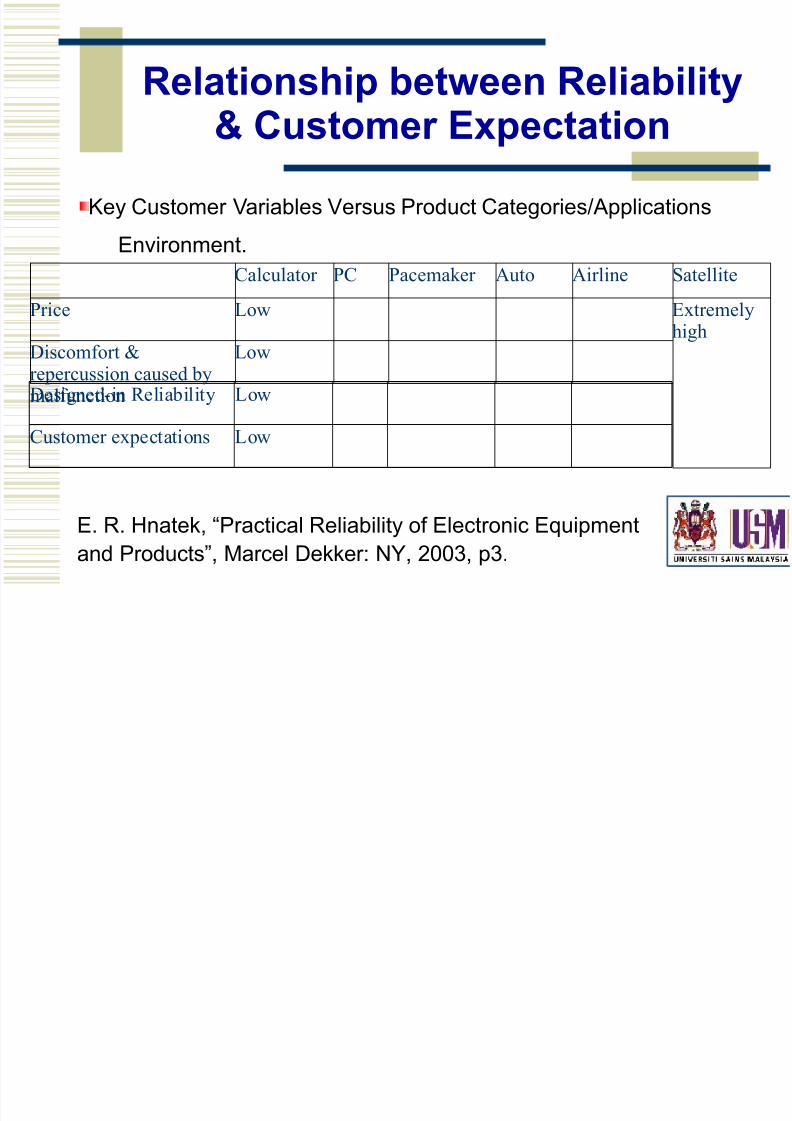
Relationship between Reliability
& Customer ExpectationKey Customer Variables Versus Product Categories/Applications
Environment.
E. R. Hnatek, “Practical Reliability of Electronic Equipment
and Products”, Marcel Dekker: NY, 2003, p3.
Calculator PC Pacemaker Auto Airline SatellitePrice Low Extremely
highDiscomfort &repercussion caused bymalfunction
Low
Designed-in Reliability Low
Customer expectations Low

8/8/2019 15 Reliability 1 - Student
http://slidepdf.com/reader/full/15-reliability-1-student 13/62
Reliability vs Durability vs
RobustnessDurability: The ability to endure with ongoing preventive
maintenance/servicing
Functional: continue to function correctly with no unscheduled
breakdown.
Robustness: Ability to continuously functioning correctly under
stressed conditions (high temp, altitude, shock..)

8/8/2019 15 Reliability 1 - Student
http://slidepdf.com/reader/full/15-reliability-1-student 14/62
(2) Achieving Reliability
Reliability must start from very beginning.
Fully understand customer’s needcustomer’s need , marketmarket
requirement, competitive analysis, comparisonrequirement, competitive analysis, comparisonwith previous productwith previous product , etc.
Then translate these to subsequence phases.
2 approaches: (1) top-down (2) bottom-up.
Top-downTop -down market demand & competitive analysis
Bottom-upBottom-up comparing current product to previousproduct in terms of complexity, technologycapability,and design/manufacturing process.

8/8/2019 15 Reliability 1 - Student
http://slidepdf.com/reader/full/15-reliability-1-student 15/62
By combining the two approaches, there are6 main factors that a reliable
product/service can be achieved:(1) Emphasis (Penegasan).
(2) System.
(3) Design.
(4) Production.
(5) Transportation.
(6) Maintenance.

8/8/2019 15 Reliability 1 - Student
http://slidepdf.com/reader/full/15-reliability-1-student 16/62
(1) Emphasis
Increase emphasis is needed because of:
Legal means,
More complicated product/service, or
Automation.

8/8/2019 15 Reliability 1 - Student
http://slidepdf.com/reader/full/15-reliability-1-student 17/62
(2) System Reliability
Complex product/service
many different components
a system
chances of components not working is increased.
Therefore, the method of arranging the componentsaffects the entire system reliability.
Series, parallel, or combination.

8/8/2019 15 Reliability 1 - Student
http://slidepdf.com/reader/full/15-reliability-1-student 18/62
(2) System Reliability(Components in Series arrangement)
Reliability of a system depends on individualcomponents.
Multiplicative theorem is applied.
System Reliability, R S =(R A)(R B)(R C)=0.7160.716
System reliability is always less than the lowestreliability value of the components.
One component fails, the whole systemOne component fails, the whole system
not working.not working.
R A=0.955 R B=0.750 R C=0.999
Component A Component B Component C
8/8/2019 15 Reliability 1 - Student
http://slidepdf.com/reader/full/15-reliability-1-student 19/62
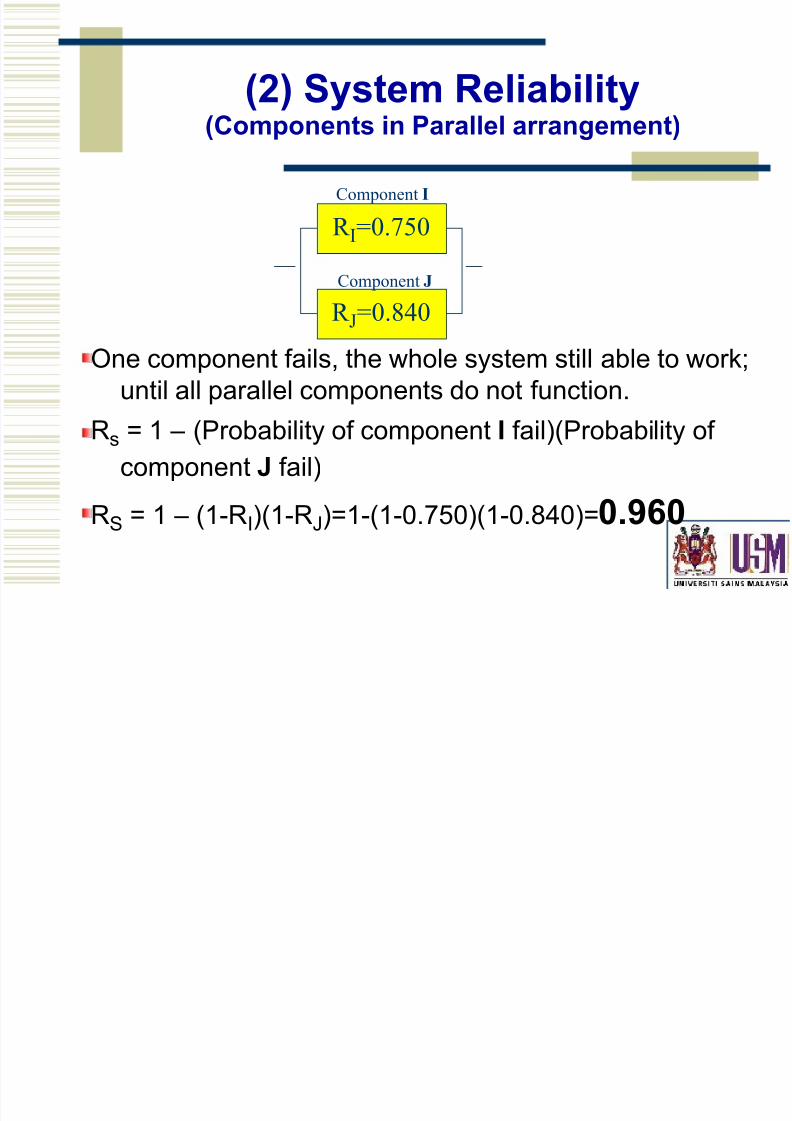
(2) System Reliability(Components in Parallel arrangement)
One component fails, the whole system still able to work;until all parallel components do not function.
R s = 1 – (Probability of component I fail)(Probability of component J fail)
RS = 1 – (1-R I)(1-R J )=1-(1-0.750)(1-0.840)= 0.960
R I=0.750
R J=0.840
Component I
Component J

8/8/2019 15 Reliability 1 - Student
http://slidepdf.com/reader/full/15-reliability-1-student 20/62
(2) System Reliability(Components in Parallel arrangement)
As the number of components in parallel increases, thereliability increases.
The reliability for a parallel arrangement of components isgreater than the reliability of the individual components.
8/8/2019 15 Reliability 1 - Student
http://slidepdf.com/reader/full/15-reliability-1-student 21/62
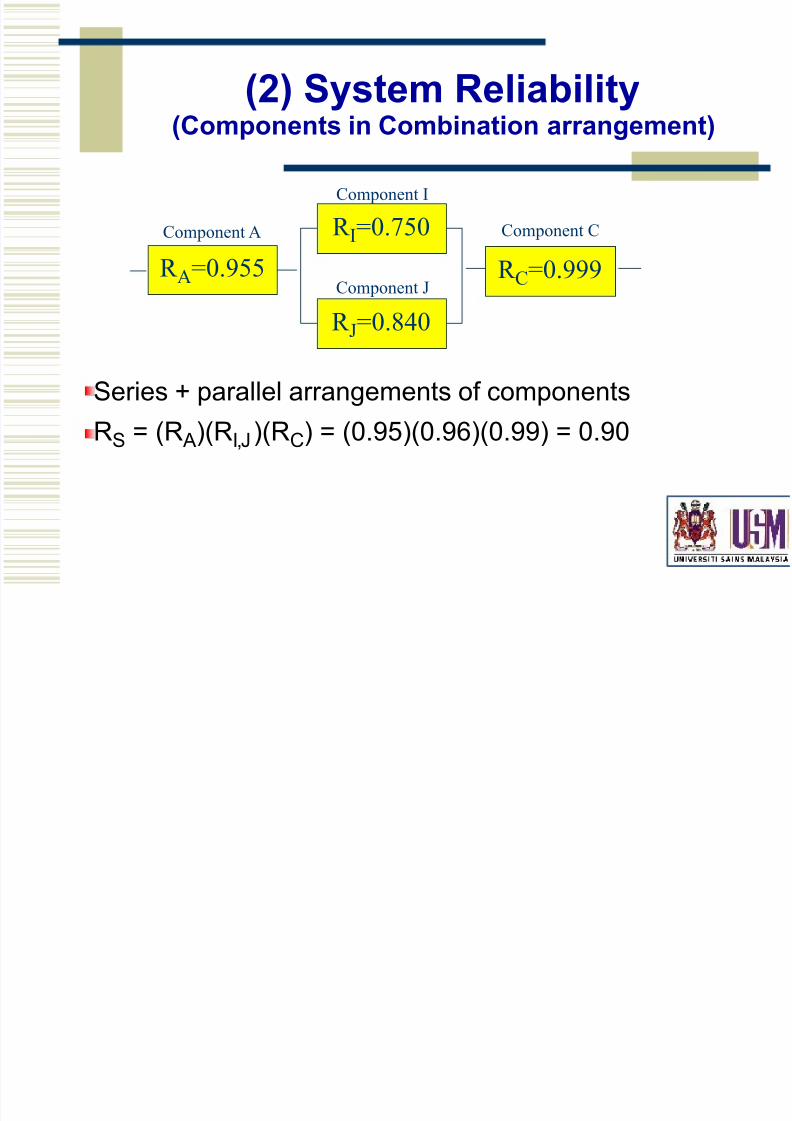
(2) System Reliability(Components in Combination arrangement)
Series + parallel arrangements of components
RS = (R A)(R I,J )(R C) = (0.95)(0.96)(0.99) = 0.90
R A=0.955
R I=0.750
R C=0.999
Component A
Component I
Component C
R J=0.840Component J

8/8/2019 15 Reliability 1 - Student
http://slidepdf.com/reader/full/15-reliability-1-student 22/62
Q & A
RS = (R A)(R I,J )(R C)(R K,L,M )
= (R A)[1-(1-R I)(1-R J )](RC)[1-(1-R K)(1-R L)(1-R M)
R A=0.955
R I=0.750
R C=0.999
Component A
Component I
Component C
R J=0.840Component J
R K =0.750Component K
R L=0.840Component L
R M=0.999
Component M

8/8/2019 15 Reliability 1 - Student
http://slidepdf.com/reader/full/15-reliability-1-student 23/62
(3) Design
Fewer number of components, greater the reliability
Approximate calculation (series) R s =R n,
where n is the number of components and R is thereliability of the component,assuming the reliabilityis the same for all the components.
8/8/2019 15 Reliability 1 - Student
http://slidepdf.com/reader/full/15-reliability-1-student 24/62
(3) Design
Other techniques:
Having a backup or redundant component (in parallelarrangement; cheaper redundant component)see next slide
Over-design.
Having a fail-safe type of device (safety concern)
Maintenance.Protection for certain environment.
Investment in reliability (RM) reliability
Up to certain level.

8/8/2019 15 Reliability 1 - Student
http://slidepdf.com/reader/full/15-reliability-1-student 25/62
(3) Design
(redundancyredundancy )Redundancy (Kelebihan) is the duplication of partsdup lication of parts or
features in such a way that the duplicate can take over the function of another part in the event of failure.
Eg: In a two-engine aircraft, the second aircraft enginewill propel the aircraft if one engine fails.
The addition of redundant parts to a product can
improve the reliability of a system enormouslyimp rove the reliability of a system enormously .It is important with safetysafety related products and services.
There are 2 types of redundancy2 ty pes of redundancy :

8/8/2019 15 Reliability 1 - Student
http://slidepdf.com/reader/full/15-reliability-1-student 26/62
(3) Design
(Active redundancy)Active redundancyActive redundancy occurs when all the redundant items
are in operation at the same timeoperation at the same time .
Examples:All 4 aircraft engines operating at the same time
when only 1 engine is enough at cruising altitude(one engine is not enough for take off).
Both hydraulic brake circuits in your car alwaysworking.Only one circuit is enough to stop the car innormal driving (but not enough for an emergencystop).

8/8/2019 15 Reliability 1 - Student
http://slidepdf.com/reader/full/15-reliability-1-student 27/62

8/8/2019 15 Reliability 1 - Student
http://slidepdf.com/reader/full/15-reliability-1-student 28/62
(4) Production
Basic quality techniquesBasic quality techniques will minimize the risk of product/service unreliability.
Emphasis should placed on those components which areleast reliable.

8/8/2019 15 Reliability 1 - Student
http://slidepdf.com/reader/full/15-reliability-1-student 29/62
(5) Transportation
Product transports to customer.
The actual performance of the product by the customer is
the final evaluation.Good packaging techniques and shipment evaluation are
essential.

8/8/2019 15 Reliability 1 - Student
http://slidepdf.com/reader/full/15-reliability-1-student 30/62
(6) Maintenance
Designers try to eliminate the need for customer maintenance.
Is it practical?Product should have ample warming when failure occurs.
(light or buzzer).
Maintenance should be simplesimp le and easyeasy to perform.

8/8/2019 15 Reliability 1 - Student
http://slidepdf.com/reader/full/15-reliability-1-student 31/62
Discipline & Tasks Involved with
Product ReliabilityA study of 72 nondefense corporations revealed that the
product reliability techniques they preferred and felt tobe important were the following:Supplier control 76%Parts control 72%
Failure analysis and correction action 65%
Environment stress screening 55%
Test, analyze, fix 50%
Reliability qualification tests 32%
Design reviews 24%
Failure modes, effects, and critically analysis 20%
N.H. Criscimagna, “Benchmarking Commercial Reliability Practices”, IITRI, 1997.

8/8/2019 15 Reliability 1 - Student
http://slidepdf.com/reader/full/15-reliability-1-student 32/62
Reliability Goals & Metrics
Typical reliability metrics for a high-reliability, high-availability,fault-tolerant product are shown below:
Metric Definition
Correctivemaintenance (CM)rate
What customers see CMs are maintenance activities done in a reactive mode andexclude proactive activity such as preventive maintenance.
Part replacement(PR) rate
What factory &logisticsorganization see
A part replacement is any part replaced during a CM activity.
Failure rate What engineers see A returned part that fails a manufacturing or engineering test.Any parts that pass all tests are called no trouble found (NTF). NTFs are important because they indicate a problem with outtest capabilities, diagnostics, or support process.

8/8/2019 15 Reliability 1 - Student
http://slidepdf.com/reader/full/15-reliability-1-student 33/62
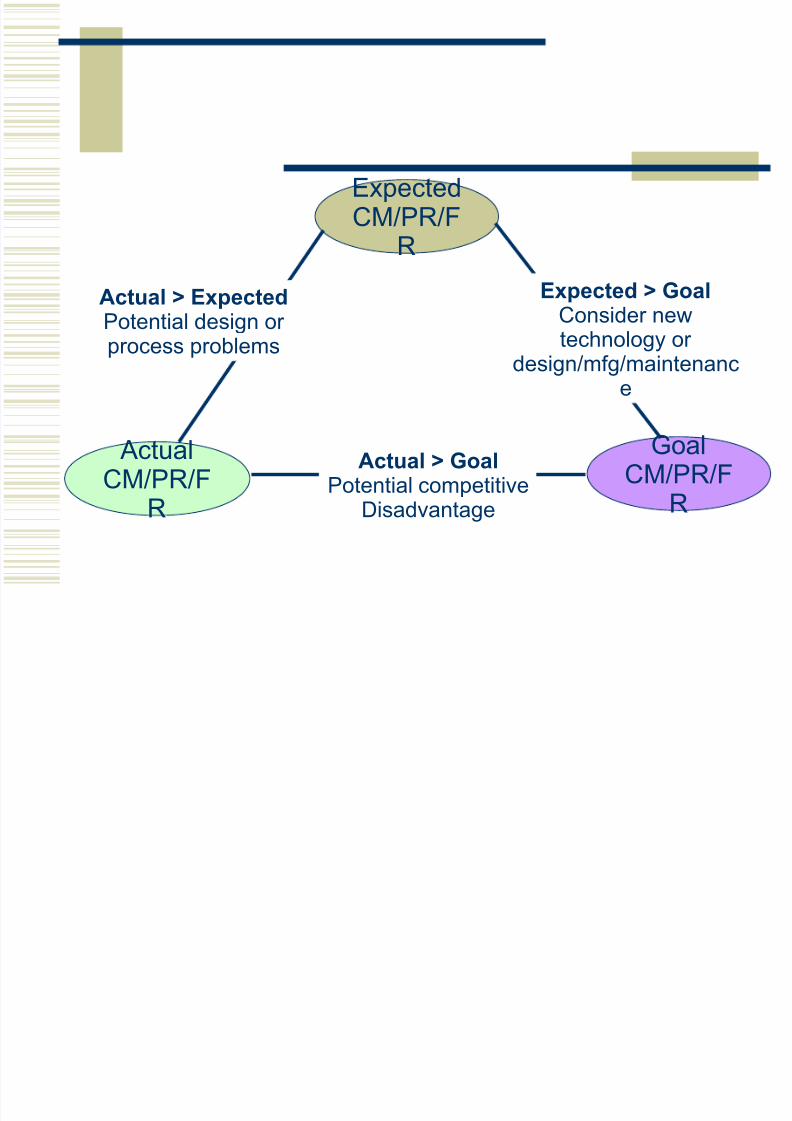
Each of the stated reliability metrics takes one of threeforms:
CM/PR/failure rate goal based on market demand.Expected CM/PR/failure rate based on predictions
(Technology/Process Capability)
Actual CM/PR/failure rate based on measurement.
The relationship among the various metrics
8/8/2019 15 Reliability 1 - Student
http://slidepdf.com/reader/full/15-reliability-1-student 34/62
ExpectedCM/PR/F
R
ActualCM/PR/F
R
GoalCM/PR/F
R
Actual > ExpectedPotential design or process problems
Expected > GoalConsider newtechnology or
design/mfg/maintenance
Actual > GoalPotential competitive
Disadvantage

8/8/2019 15 Reliability 1 - Student
http://slidepdf.com/reader/full/15-reliability-1-student 35/62
ReliabilityModel
-baselineunderstanding
of product’sreliability
Reliability Prediction
ExpectedCM/PR/F
R
ActualCM/PR/F
R
GoalCM/PR/F
R
8/8/2019 15 Reliability 1 - Student
http://slidepdf.com/reader/full/15-reliability-1-student 36/62
Reliability Prediction
Limitations of Reliability Prediction
Simple technique omit great deal of distinguishing
detail and the very prediction suffers inaccuracy.Detailed prediction techniques can become
bogged down in detail and become very costly. Theprediction will also lag far behind and may hinder
timely product development.

8/8/2019 15 Reliability 1 - Student
http://slidepdf.com/reader/full/15-reliability-1-student 37/62
Considerable effort is required to generate sufficient dataon a part class/level to report statistically validreliability figures for the class/level.
Other variants that can affect the stated failure rate of agiven system are uses,operator procedures,maintenance and rework practices,measurement techniques or definitions of failure,operating environments, and excess handling differingfrom those addressed by modeling techniquemodeling technique .

8/8/2019 15 Reliability 1 - Student
http://slidepdf.com/reader/full/15-reliability-1-student 38/62
(3) Statistical Aspects of Reliability
(Distribution Applicable to Reliability)
Types of probability distribution used in reliabilitystudies are:
continuous probability distributionExponentialNormalWeibull
Gammadiscrete probability distribution
GeometricNegative binomial

8/8/2019 15 Reliability 1 - Student
http://slidepdf.com/reader/full/15-reliability-1-student 39/62
(Frequency Distribution Curves)Only Exponential, Normal, and Weibull distributions are
widely used.
Their frequency distributions, f(t), as a function of timeare given below.

8/8/2019 15 Reliability 1 - Student
http://slidepdf.com/reader/full/15-reliability-1-student 40/62
(Reliability Curves)
Reliability curves for exponential,normal, and Weibulldistributions are given below:
Exponential Normal Weibull

8/8/2019 15 Reliability 1 - Student
http://slidepdf.com/reader/full/15-reliability-1-student 41/62
(Reliability Curves)
( )β
θ
θ
t t
t t
t t
e R
Weibull
dt t f R
Normal
e R
l Exponentia
−
−
=
∫ −=
=
:
)(0.1
:
:
0
Reliability as a function of time.
R t = reliability at time t
t = test time or cycleθ = mean life or Mean TimeBetween Failure (MTBF)
β = Weibull slope(or shape parameter)
Area under Normal Curve

8/8/2019 15 Reliability 1 - Student
http://slidepdf.com/reader/full/15-reliability-1-student 42/62
(Failure-Rate Curves)Failure-rate, , is important in describing the life-
history curve of a product.
Failure-rate probability of a failure during a statedperiod of time, cycle, or number of impacts.Failure rate can be estimated from test data by use of
the formulae:(1) time terminated without a replacement.

8/8/2019 15 Reliability 1 - Student
http://slidepdf.com/reader/full/15-reliability-1-student 43/62
(Failure-Rate Curves)
est = estimated failure rate
r = number of test failurest = test time for a failed itemn = number of items testedT = terminated time
( )∑ −+=
∑=
T r nt r
cycleor timetest
failurestest of number
est
est
λ
λ )(

8/8/2019 15 Reliability 1 - Student
http://slidepdf.com/reader/full/15-reliability-1-student 44/62
(Failure-Rate Curves)Q & A• Determine the failure rate for an item that has the test of
9 items terminated at the end of 22 hours. Four of theitems failed after 4, 12, 15, and 21 h, respectively. Fiveitems were still operating at the end of 22 h.
( )025.0
22)49()2115124(4 =−++++=
∑ −+=
est
est
T r nt
r
λ
λ

8/8/2019 15 Reliability 1 - Student
http://slidepdf.com/reader/full/15-reliability-1-student 45/62
(Failure-Rate Curves)
est = estimated failure rater = number of test failurest = test time for a failed item
∑=
t r
est λ
(2) Time terminated with replacement.

8/8/2019 15 Reliability 1 - Student
http://slidepdf.com/reader/full/15-reliability-1-student 46/62
(Failure-Rate Curves)Q & A• Determine the failure rate for 50 items that are tested for
15 h. When failure occurs, the item is replaced withanother unit. At the end of 15 h, 6 of the items hadfailed.
008.0)15(50
6 ==∑
=
est
est
t
r
λ
λ

8/8/2019 15 Reliability 1 - Student
http://slidepdf.com/reader/full/15-reliability-1-student 47/62
(Failure-Rate Curves)(3) Failure terminated
Q & ADetermine the failure rate for 6 items that are testedto failure. Test cycles are 1025, 1550, 2232, 3786,5608, and 7918.
00027.0791856083786223215501025
6=
+++++=
∑=
est
est t r
λ
λ

8/8/2019 15 Reliability 1 - Student
http://slidepdf.com/reader/full/15-reliability-1-student 48/62
(Failure-Rate Curves)
Constant failure rate:
Exponential distribution andWeibull distribution ( =1)
1
2
2
:2
1
:
1
:
2
−
∞
−−
=
∫
−−
=
=
β
σ θ
θ θ β
λ
σ
θ λ
θ λ
t
Weibull
x
e
Normal
l Exponentia
t
t

8/8/2019 15 Reliability 1 - Student
http://slidepdf.com/reader/full/15-reliability-1-student 49/62
(Failure-Rate Curves)Exponential Normal Weibull

8/8/2019 15 Reliability 1 - Student
http://slidepdf.com/reader/full/15-reliability-1-student 50/62
(Failure-Rate Curves)In the previous equations, is the mean life or
Mean Times Between Failure (MTBF).
MTBF:How much time has elapsed between failures.It is used when speaking of repairable
systems .Another parameter that can be used to describe
reliability as a function of time is Mean Times toFailure (MTTF).
MTTF:It is used for non-repairable systems .

8/8/2019 15 Reliability 1 - Student
http://slidepdf.com/reader/full/15-reliability-1-student 51/62
(Failure-Rate Curves)The amount of time that a system is actually
operating is of great concern.
Eg: without radar screen, air traffic controllers aresightless and therefore out of operation. To beconsider reliable, the radar must be functional for a significant amount of expected operating time.
Since many systems need preventive or Since many systems need preventive or corrective maintenance, a system’s reliabilitycorrective maintenance, a system’s reliabilitycan be judged in terms of the amount of timecan be judged in terms of the amount of timeit is available for use:it is available for use:

8/8/2019 15 Reliability 1 - Student
http://slidepdf.com/reader/full/15-reliability-1-student 52/62
(Failure-Rate Curves)
MTTF value can be replaced by MTBF.Mean time to repair = mean down time (MDT).
repair totimemeanMTTF
MTTF ty Availabili
+=

8/8/2019 15 Reliability 1 - Student
http://slidepdf.com/reader/full/15-reliability-1-student 53/62
Q & AQ & A
• Determine the failure rate and MTBF for 6 items
that are tested to failure. Test cycles are 1025,1550, 2232, 3786, 5608, and 7918.
cycle
t r
est
est
37041
00027.0791856083786223215501025
6
==
=+++++=
∑=
λ θ
λ
λ Time -1

8/8/2019 15 Reliability 1 - Student
http://slidepdf.com/reader/full/15-reliability-1-student 54/62
Q & AWindshield-wiper motors are readily available and easy
to install. Calculate the availability of the windshield
wipers on a bus driven eight hours a day, if the MTBFis 1250 hours. When the windshield-wiper motor mustbe replaced, the bus is out of service for a total of 24hours.
98.0241250
1250 =+
=ty Availabili
The bus is available 98 percent of the time.

8/8/2019 15 Reliability 1 - Student
http://slidepdf.com/reader/full/15-reliability-1-student 55/62

8/8/2019 15 Reliability 1 - Student
http://slidepdf.com/reader/full/15-reliability-1-student 56/62
Life-History Curve(Debugging Phase)
It is also called burn-in or infant-mortality or early failurephase.
A new machine or service, we often find it fails a fewtimes before it ‘settle down’ to a reliable state of performance.
Weibull distribution with < 1 is used to describe theoccurrence of failures in this phase.
Product is under warranty (usually).It is a significant quality costsig nificant quality cost.

8/8/2019 15 Reliability 1 - Student
http://slidepdf.com/reader/full/15-reliability-1-student 57/62
Life-History Curve(Chance Failure Phase)
Random or constant failure phase.Failure rate is constant.
The product or service has ‘settle down’ and is reliable.Any failures that do occur are randomExponential and Weibull ( =1 ) distributions are used to
describe this phase.Reliability studies and Sampling Plans are concerned
with this phase.The lower the failure rate, the better the product.

8/8/2019 15 Reliability 1 - Student
http://slidepdf.com/reader/full/15-reliability-1-student 58/62
Life-History Curve(Wear Out Phase)
The product is wearing out or the service supportsystems are beginning to fail.
Wear out failures tend to have a sharp rise in failure rate.Normal distribution is the best to describe this phase.Weibull distribution ( >1 ) can be used depending on the
type of wear-out distribution.

8/8/2019 15 Reliability 1 - Student
http://slidepdf.com/reader/full/15-reliability-1-student 59/62
(8) Availability and
MaintainabilityTime related factors of availability, reliability, and
maintainability are interrelated.
Eg: when a water line breaks (reliability) it is nolonger available to provide water to customersand must be repaired or maintained.
Availability, A:
A time-related factor.Measures the ability of a product or service toperform its designated function.
Product available operation +standby.

8/8/2019 15 Reliability 1 - Student
http://slidepdf.com/reader/full/15-reliability-1-student 60/62

8/8/2019 15 Reliability 1 - Student
http://slidepdf.com/reader/full/15-reliability-1-student 61/62
Availability and Maintainability
MDT MTBF MTBF
DowntimeUptimeUptime
A+=+=
MTBF
MTTF MDT
Time
MTTF
If MTBF is defined as mean time before failure, then MTBF = MTTF.
MTTF

8/8/2019 15 Reliability 1 - Student
http://slidepdf.com/reader/full/15-reliability-1-student 62/62
Availability and Maintainability
Maintainability:Maintainability:Preventive and corrective maintenance on a product
or service can be achieved.Mean time to repair,mean time to service,repair hoursper number of operating hours, preventivemaintenance cost, and down probability figure of merit for maintainability.
Keeping maintainability low more cost effectivemethod of keeping availability high thanconcentrating on reliability.