15 th dubrovnik economic conference hotel grand villa argentina dubrovnik, croatia june 24-26, 2009
TRANSCRIPT

15th Dubrovnik Economic ConferenceHotel Grand Villa Argentina
Dubrovnik, Croatia
June 24-26, 2009

William MegginsonUniversity of Oklahoma
Université Paris-Dauphine
SOVEREIGN WEALTH FUND INVESTMENT PATTERNS AND
PERFORMANCEBernardo Bortolotti
Università di TorinoFondazione Eni Enrico Mattei
Veljko FotakUniversity of Oklahoma
Fondazione Eni Enrico Mattei
William MirackyMonitor Group

• Term was coined only recently (Razanov, 2005).
• Can Be Defined Broadly, As In Truman (2008): “A separate pool of government-owned or -controlled
financial assets that includes international assets.”
• We Use Monitor Group Definition: Defines SWF as1. An investment fund, not an operating company,2. Wholly owned by a sovereign government, but
separated from central bank or finance ministry,3. That makes international and domestic
investments in a variety of risky assets,4. Is charged with seeking a commercial return, and 5. Which is wealth fund rather than a pension fund.
Sovereign Wealth Funds Defined

Major Sovereign Wealth Funds Listed by Monitor Group (2009)
CountryFund Name(Principal investment subsidiaries)
Assets US$Bn
LaunchYear
Source of Funds
UAE-Abu Dhabi Abu Dhabi Investment Authority $627 1976 OilNorway Government Pension Fund – Global 326 1990 OilSingapore Govt of Singapore Investment Corp 247.5 1981 Non-CommodityKuwait Kuwait Investment Authority 202.8 1953 OilChina China Investment Corporation 190 2007 OilRussia Reserve Fund 137.1 2004 OilSingapore Temasek Holdings 85 1974 Non-Commodity
Russia National Welfare Fund 83.6 2008 OilUAE-Dubai Investment Corp of Dubai (Istithmar) 82 2006 OilLibya Libyan Investment Authority 65 2006 OilQatar Qatar Investment Authority (Qatar Hlg) 62 2003 Oil
Australia Australian Future Fund 42.2 2006 Non-CommodityKazakhstan Kazakhstan National Fund 38 2000 OilBrunei Brunei Investment Agency 30 1983 OilSouth Korea Korea Investment Corporation 27 2005 Non-Commodity
Malaysia Khazanah Nasional 23.1 1993 Non-CommodityTotal Oil & Gas Related $1,912Total Other 451TOTAL $2,363

The EconomistJanuary 19-25, 2008

Reasons for Concern About SWFs, Responses By Governments & Funds
• Large (Estimated US$ 3.3 trillion, March 2008).• Growing Fast (Estimated US$ 12 trillion By 2015).• Biggest Funds Based In Non-Democratic Nations• Most Cited Concerns:
– Could be used for political purposes– Might induce volatility in financial markets– Could have a detrimental impact on governance
• Regulators, SWFs responded To Concerns– Santiago Principles signed October 2008
• Market Meltdown Hit SWFs Very Hard

Largest Listed-Firm Investments And Returns (Inception - 3/27/09)
Acquiror Name
Target NameInvestment
DateValue($mil)
Value3/27/09
Gain /loss ($mil)
GIC-Singapore UBS 2/8/2008 14400.00 4339.16 -10060.84GIC-Singapore UBS AG 12/10/2007 9760.42 2121.06 -7639.36ADIA Citigroup Inc. 11/27/2007 7500.00 684.87 -6815.13GIC-Singapore Citigroup Inc 1/15/2008 6880.00 707.07 -6172.93GIC-Singapore Citigroup Inc 1/15/2008 6880.00 707.07 -6172.93ADIA PrimeWest Energy 9/7/2007 5000.00 5371.40 371.40CIC (China) Morgan Stanley 12/19/2007 5000.00 2545.13 -2454.87Temasek Merrill Lynch 12/27/2007 4400.00 515.00 -3885.00KIA (Kuwait) Dow Chemical 7/10/2008 4019.08 1171.06 -2848.02Temasek Standard Chartered 3/27/2006 4000.00 2345.39 -1654.61Temasek Merrill Lynch 7/27/2008 3400.00 1,767.28 -1632.72DIFC (Dubai) OMX AB 2/29/2008 3396.80 3644.26 247.46QIA Credit Suisse 1/28/2008 3000.00 1680.90 -1319.10Istithmar Time Warner 11/27/2006 2000.00 2300.00 15.00CIC (China) Fortescue Metals 2/4/2008 2000.00 552.96 -1447.04KIC (Korea) Merrill Lynch 1/15/2008 2000.00 238.02 -1761.98KIA (Kuwait) Merrill Lynch 1/15/2008 2000.00 238.02 -1761.98Temasek Shin Corp 1/23/2006 1900.00 991.98 -908.02Total, 189 SWF listed investments $122,650.29 $58,242.71 -$55,820.05

Little Published Research On SWF Effects, Intentions, Behavior
• Most Available Work Non-Academic, Descriptive:– Monitor Group, Merrill Lynch, Deutsche Bank, SWF
Institute, Peterson Institute, McKinsey Group • Little Yet In Major Finance Or Economics Journals • JACF: Butt, Shivdasani, Stendevad, Wyman (2008)
– Descriptive paper, discusses implications for other investors, government, firms seeking financing.
• Several Competing Working Papers– Chhaochhria & Laeven (IMF, 2008); Dewenter,
Han, Malesta (2009); Fernandes (2009); Kotter & Lel (FRB, 2008); Knill, Lee, Mauck (2009)

Our Empirical Research• We Collect And Describe SWF Investment Data
– investment size, financing methods, etc.• How Do SWFs Pick Investment Targets?
– Regional choices, Industries, Asset mix (RE,PE)• Market Reaction To Investment Announcement?
– Test prior performance and initial return using raw returns, market-adjusted, and matched-firm returns
• Long-Run Returns On SWF Investments?– Stress matched-firm adjusted return, but use others
• Regression Analysis Of Short & Long-Run Returns– Do SWFs create or decrease target firm value?

The FEEM-Monitor SWF Database Compiled From Three Sources
• Most Important, Monitor Group Dataset of Publicly Announced Deals– 801 observations, worth $260.6 billion
• Bureau Van Dyck Zephyr Database of Global Mergers & Acquisitions
– 230 equity acquisitions, worth $71.8 bn• Thomson Reuters SDC Platinum Global New
Issues Database– 239 equity issues, worth $84.1 billion
• Net Out 71 Overlapping Observations and Verify Key Data Yields Final Sample

Overall And Average Investment Size And Stake Purchased
Summary Size ($US mn) % Acquired
# ofobs
Value, $US mn
Mean size
Median size
Mean stake
Median stake
All Investments 1,216 $357,133 $441
$55 42.3%
26.2%
Listed equity 379 $141,218 $383 $50 19.4% 9.0%
Unlisted equity 719 $170,659 $349 $36 52.5% 49.0%
Unlisted operating co 691 $154,202 $396 $33 53.3% 49.0%
Private equity funds 10 $9,526 $1,905 $1,200 59.2% 46.0%
Initial public offerings 7 $2,773 $396 $170 3.9% 2.7%
Joint ventures, other 8 $145 $120 $120 45.5% 45.5%
Real estate investments 118 $45,256 $546 $245 73.1% 100%

Industrial Distribution Of SWF Investments
IndustryTotal number of
observationsTotal value, $US
millions
# ofobs
% ofTotal
Totalvalue
% of total
Financials 376 30.9% $194,834 54.6%
Real estate 145 11.9% $54,572 15.3%Information technology 91 7.5% $27,467 7.7%Industrials 111 9.1% $18,907 5.3%Infrastructure 16 1.3% $14,369 4.0%Services 60 4.9% $10,273 2.9%Manufacturing 75 6.2% $9,965 2.8%Telecommunications 52 4.3% $8,247 2.3%Consumer products, services 79 6.5% $6,414 1.8%Transportation 50 4.1% $6,032 1.7%

Annual Value, Industrial Distribution of SWF Investments, 2000-2008 ($Mn)
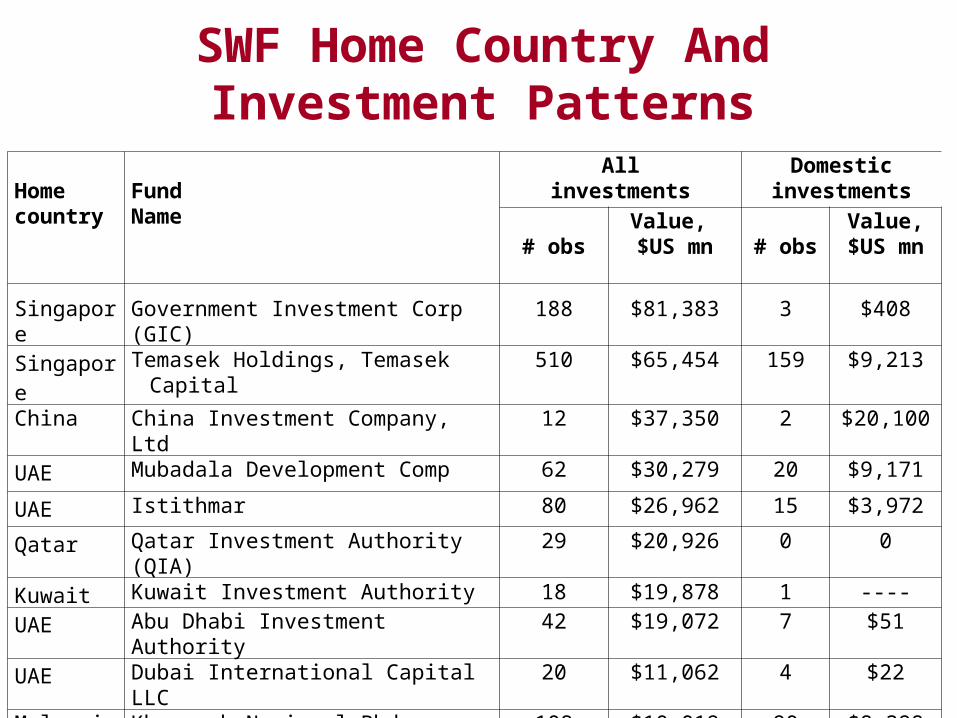
SWF Home Country And Investment Patterns
Home country
FundName
Allinvestments
Domestic investments
# obsValue, $US mn # obs
Value, $US mn
Singapore Government Investment Corp (GIC) 188 $81,383 3 $408Singapore Temasek Holdings, Temasek Capital 510 $65,454 159 $9,213China China Investment Company, Ltd 12 $37,350 2 $20,100UAE Mubadala Development Comp 62 $30,279 20 $9,171
UAE Istithmar 80 $26,962 15 $3,972
Qatar Qatar Investment Authority (QIA) 29 $20,926 0 0
Kuwait Kuwait Investment Authority 18 $19,878 1 ----
UAE Abu Dhabi Investment Authority 42 $19,072 7 $51
UAE Dubai International Capital LLC 20 $11,062 4 $22Malaysia Khazanah Nasional Bhd 108 $10,019 90 $8,398
Total 1,216 $357,133 326 $58,351

Percent Of Investments In Domestic Versus Foreign Deals, 2000-2008

Target Countries For SWF Investments
Target countryNumber of Investments Value of Investments
# ofobs
% oftotal
Total value$US mn
% oftotal
United States 132 10.9% $79,385 22.2%
China 79 6.5% $31,000 8.7%
United Kingdom 83 6.8% $15,356 4.3%
UAE 55 4.5% $14,877 4.2%
Singapore 177 14.6% $13,230 3.7%
Australia 41 3.4% $12,110 3.4%
Malaysia 117 9.6% $10,550 3.0%
Hong Kong 43 3.5% $7,915 2.2%
Other 486 40.0% $137,703 39.3%
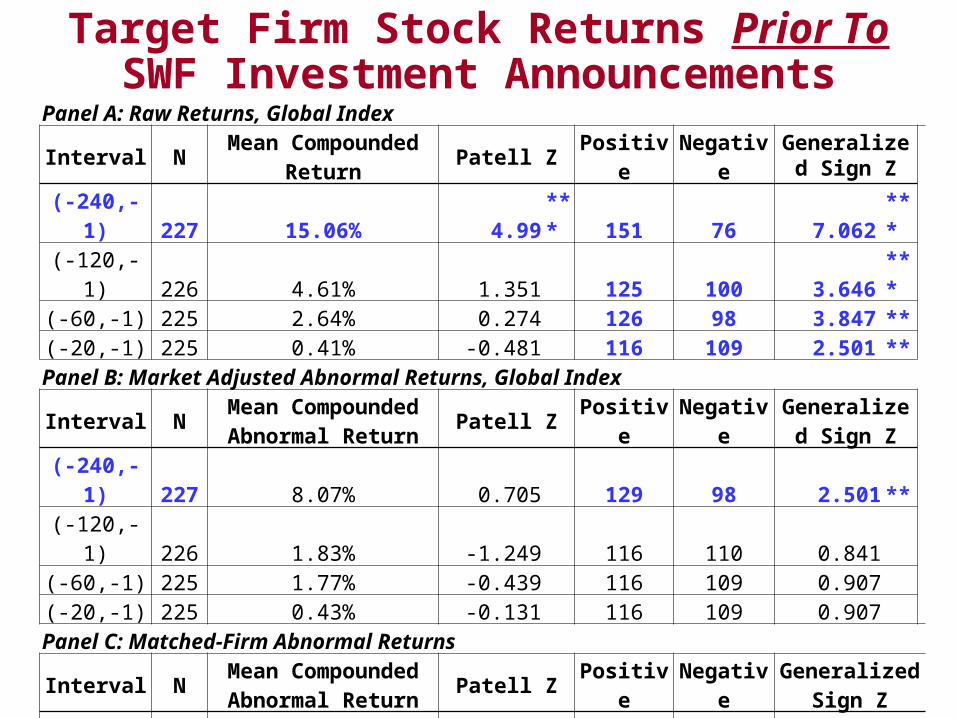
Target Firm Stock Returns Prior To SWF Investment Announcements
Panel A: Raw Returns, Global Index
Interval NMean Compounded
ReturnPatell Z Positive Negative
Generalized Sign Z
(-240,-1) 227 15.06% 4.99 *** 151 76 7.062 *** (-120,-1) 226 4.61% 1.351 125 100 3.646 *** (-60,-1) 225 2.64% 0.274 126 98 3.847 ** (-20,-1) 225 0.41% -0.481 116 109 2.501 **
Panel B: Market Adjusted Abnormal Returns, Global Index
Interval NMean Compounded Abnormal Return
Patell Z Positive NegativeGeneralized
Sign Z
(-240,-1) 227 8.07% 0.705 129 98 2.501 ** (-120,-1) 226 1.83% -1.249 116 110 0.841 (-60,-1) 225 1.77% -0.439 116 109 0.907 (-20,-1) 225 0.43% -0.131 116 109 0.907
Panel C: Matched-Firm Abnormal Returns
Interval NMean Compounded Abnormal Return
Patell Z Positive NegativeGeneralized
Sign Z(-240,-1) 212 -8.01% -2.527 ** 69 143 -4.395 **(-120,-1) 212 -3.28% -1.978 ** 90 122 -1.507 (-60,-1) 212 -1.43% -0.707 99 113 -0.269 (-20,-1) 212 -0.74% -0.075 104 108 0.419

Target Firm Stock Returns Around SWF Investment Announcements
Panel A: Raw Returns, Global Index
Interval NMean Cumulative Abnormal Return
Patell Z Positive NegativeGeneralized
Sign Z(-1,+1) 235 0.95% 3.27 *** 131 93 3.641 ***(0,0) 234 0.21% 1.655 * 113 95 1.355
(0,+1) 234 0.70% 3.473 *** 137 85 4.496 ***
Panel B: Market Adjusted Abnormal Returns, Global Index
Interval NMean Cumulative Abnormal Return
Patell Z Positive NegativeGeneralized
Sign Z(-1,+1) 235 0.93% 3.309 *** 132 103 2.451 *(0,0) 234 0.20% 1.915 * 119 115 0.818
(0,+1) 234 0.65% 3.432 *** 135 99 2.911 ***
Panel C: Matched-Firm Abnormal Returns
Interval NMean Cumulative Abnormal Return
Patell Z Positive NegativeGeneralized
Sign Z(-1,+1) 229 0.87% 1.853 * 129 98 2.853 ***(0,0) 229 0.08% 0.618 114 107 1.132
(0,+1) 229 0.35% 0.857 122 104 1.926 *

Target Firm Stock Returns After SWF Investment Announcements
Panel A: Raw Returns, Global Index
Interval NMean Cumulative Abnormal Return
Patell Z Positive NegativeGeneralized
Sign Z(+1,+120) 219 -0.95% -0.802 104 115 0.961 (+1,+240) 182 5.33% 1.856 * 95 85 2.420 **(+1,+480) 131 42.42% 6.892 *** 77 53 3.701 ***
Panel B: Market Adjusted Abnormal Returns, Global Index
Interval NMean Cumulative Abnormal Return
Patell Z Positive NegativeGeneralized
Sign Z(+1,+120) 219 -2.50% -2.397 * 94 126 -1.643 (+1,+240) 182 0.53% -0.651 82 100 -0.95 (+1,+480) 131 24.81% 1.661 * 62 69 -0.274
Panel C: Matched-Firm Abnormal Returns
Interval NMean Cumulative Abnormal Return
Patell Z Positive NegativeGeneralized
Sign Z(+1,+120) 217 -5.98% -2.348 ** 84 133 -2.417 ***(+1,+240) 217 -10.23% -2.347 ** 71 146 -4.186 ***(+1,+480) 208 -15.49% -2.006 ** 59 149 -5.354 ***

Regression Analysis of Announcement Period Matched-Firm Abnormal Returns
Variable Cumulative Abnormal Returns (-1,+1)Intercept 0.0558 -0.0121 0.0192 0.0931Financial Target 0.0305 * 0.0385 ** 0.0295 * 0.0301 *Real Estate Target -0.0177 -0.0215 -0.0272 -0.0293LM Transparency Index 0.0022 Truman -Total -0.0005 Pre-Existing Stake -0.0517 *** -0.0460 *** -0.04714 *** -0.0503 ***Percent Acquired 0.0003 0.0007 0.0009 0.0007Percent Acquired Squared 0.0000 0.0000 0.0000 0.0000Open Market Investment 0.0282 0.0134 0.0140 0.0175Domestic Investment 0.0080 0.0102 0.0072 -0.00551-Month Pre-Event BHAR 0.1375 *** 0.1433 *** 0.1316 *** 0.1391 ***Fixed Effects Yes No No NoN 155 142 148 148R-Sq (%) 22.5% 17.5% 16.5% 10.2%
Announcement period AR positively related to financial target and pre-event abnormal return,negatively related to pre-existing stake size. Regression explains 10-23% of C-S variation

Regression Analysis of Long-Run Matched-Firm Abnormal Returns
Variable 6-Month BHARs 1-Year BHARs 2-Year BHARsIntercept -0.0917 -0.1458 0.0360Financial Target -0.1114 * -0.1126 -0.2171 *Real Estate Target 0.1398 0.2934 0.4090Truman - Structure 0.0010 0.0018 -0.0044Truman - Governance 0.0077 * 0.0112 * 0.0187 **Truman –Accountabil & Transpar -0.0062 * -0.0089 * -0.0106Pre-Existing Stake 0.0157 -0.0236 -0.1037Percent Acquired -0.0013 -0.0115 ** -0.0185 **Percent Acquired Squared <0.0001 <0.0001 * 0.0001 *75% Acquisition 0.2698 0.1451 1.0799 **Open Market Investment 0.0513 0.1773 0.2392Domestic Investment 0.0285 0.1131 0.02381-Month Pre-Event BHAR 0.4100 ** 0.3211 -0.0235N 155 144 138R-Sq (%) 22.5% 12.6% 16.9%

Summary Of Findings And Conclusions
• Describe Patterns And Performance Of 1,216 Investments Made By 35 SWFs, Jan 86 To Sept 08.– Worth over $35 billion, mostly since 2005– Most investments in listed and unlisted equity– Small and declining fraction targeted domestically
• Almost One-Third (30.9%) Of The Number, Over Half the value (54.6%) Of SWF Investments In Finance. – 10 deals, worth $58 bn, in bank stocks 11/07 to 2/08
• Find A Significantly Positive Mean Abnormal Return Of About 0.9% Around The Announcement Date. – Positive return robust to different measures

Summary Of Findings And Conclusions
• But One-Year Matched-Firm AR Of -15.49%, So SWF Investments Followed By Declining Performance. – Becomes more negative the longer the investment
horizon (-10.2%, 1-year; -15.5%, 2-year)• Regressions Show Weak Evidence Of Monitoring
Role Of SWFs, Evidence Of Agency Costs.– Higher IR, lower LRR for finance stocks; lower IR for
existing stake; higher LRR for better SWF governance– Pre-event excess return raises both IR and LRR
• SWFs Have Suffered Large Losses In Listed Stocks– Will be somewhat less likely to re-invest in US, Europe

Thank YouThank You
William L. [email protected]
http://faculty-staff.ou.edu/M/William.L.Megginson-1/