152-2010: sas® enterprise guide®: it's for programmers too!
TRANSCRIPT
- 1 -
Paper 152-2010 SAS® Enterprise Guide®: It’s for Programmers Too
Marje Fecht, Prowerk Consulting LLC, Cape Coral, FL Rupinder Dhillon, Dhillon Consulting, Toronto, ON, Canada
ABSTRACT Have you been programming in SAS for a while and just aren’t sure how Enterprise Guide can help you? It isn’t just a pretty face! This presentation will demonstrate how SAS programmers can use SAS Enterprise Guide as their primary interface to the SAS system while maintaining the flexibility of writing their own customized code. We will look at • navigating the views and menus • using SAS Enterprise Guide to access your existing programs and enhance your processing • leveraging the more complex built-in capabilities available in SAS Enterprise Guide to further enhance the
information you deliver • using Report Builder (new to Version 4.2 of SAS Enterprise Guide) • adding Project Prompts and dynamic prompts, to generalize the usability of your programs and processes. We will also share best practices for working in a server environment. Version 4.2 of SAS Enterprise Guide will be used. This presentation is appropriate for SAS users who understand the basics of SAS programming and want to learn how to use SAS Enterprise Guide.
INTRODUCTION This presentation is designed as a Hands-On Workshop, where the participants follow along and step through the usage of SAS Enterprise Guide. This paper follows a similar format.
I KNOW HOW TO PROGRAM IN SAS – HOW DO I NAVIGATE SAS ENTERPRISE GUIDE? With all the windows and views and menus available in Enterprise Guide, it is hard to know where to start! For many “long –time” SAS programmers, the initial view can send them running right back to their programming environment. But, trust us, the benefits of Enterprise Guide are worth the time it takes to get used to all the windows.
Process Flow
Command Menu Task List
Server List Active Data menu
Task Status
Project View
Project TreeSAS Folders
Hands-on WorkshopsSAS Global Forum 2010
2
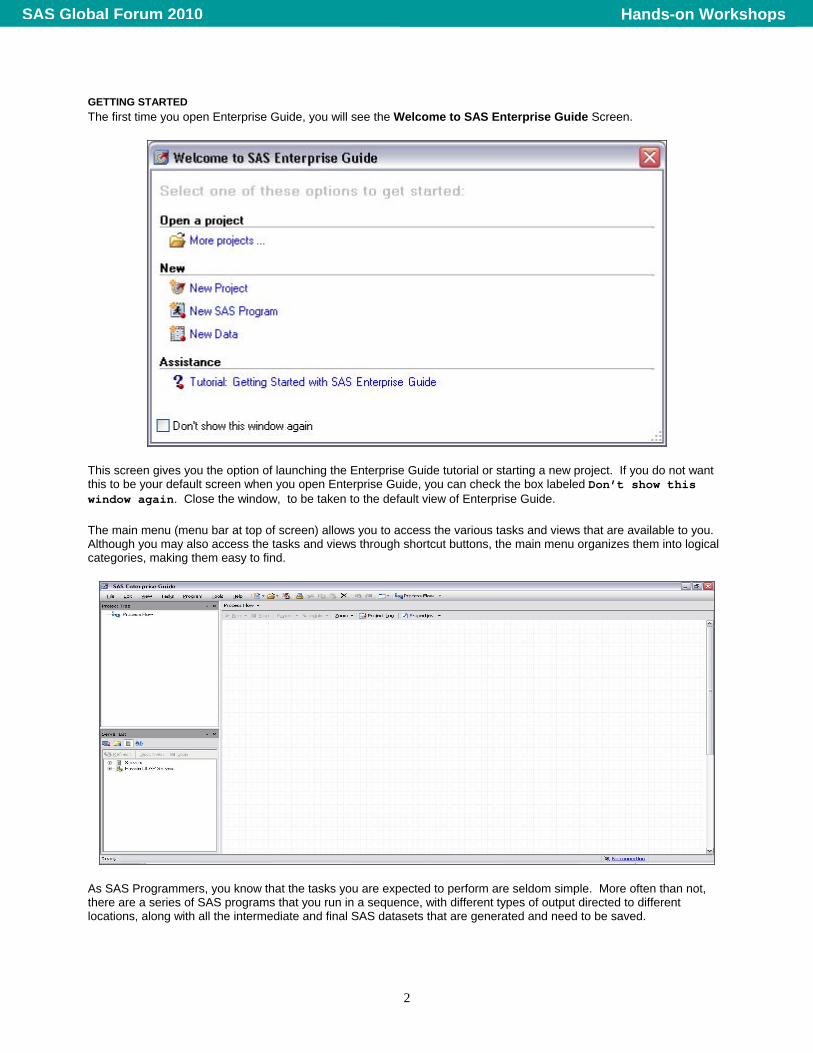
GETTING STARTED The first time you open Enterprise Guide, you will see the Welcome to SAS Enterprise Guide Screen.
This screen gives you the option of launching the Enterprise Guide tutorial or starting a new project. If you do not want this to be your default screen when you open Enterprise Guide, you can check the box labeled Don’t show this window again. Close the window, to be taken to the default view of Enterprise Guide. The main menu (menu bar at top of screen) allows you to access the various tasks and views that are available to you. Although you may also access the tasks and views through shortcut buttons, the main menu organizes them into logical categories, making them easy to find.
As SAS Programmers, you know that the tasks you are expected to perform are seldom simple. More often than not, there are a series of SAS programs that you run in a sequence, with different types of output directed to different locations, along with all the intermediate and final SAS datasets that are generated and need to be saved.
Hands-on WorkshopsSAS Global Forum 2010

3
Enterprise Guide provides a mechanism to organize your work by allowing you to group sequences of tasks, data items and results into Projects. All of the code and tasks that you run within an Enterprise Guide session are part of your active Project and are each displayed as separate nodes within the Process Flow view and Project Tree view (in the above windows). These nodes can then be linked and organized in a logical sequence to form a Process Flow. You can save your Process Flow as a part of a Project; and anytime the project is opened the same sequence of tasks can be easily executed. This helps you and your organization distribute and share information easily. The Process Flow view is used to display all of the task, data and code nodes that make up your Process Flow. There are a number of ways that you can access your Process Flow view. From the main menu, select View Process Flow. You can also select F4 or click the Process Flow tool in the menu bar. Once you begin building a flow, you will notice that the Process Flow view also displays the connections between your work components. Again, this allows you to see and visually inspect the organization of tasks, code and data associated with a Project. You may prefer the Project Tree view (in the upper left of the above screen), which provides a more traditional “Windows Explorer” hierarchical view of your projects. Select View Project Tree from the main menu to open the Project Tree view. Note that the Project Tree view does not display the flow (connection) within your projects.
BUT, I AM A PROGRAMMER – HOW DO I RUN MY FAVORITE PROGRAM IN ENTERPRISE GUIDE? Enterprise Guide enables you to easily run existing SAS programs, using similar steps to what you would follow using the SAS Display Manager windows. Let’s run a simple program and review the log and results using Enterprise Guide. Throughout this workshop, we will be using the Shoes dataset from the SASHELP library. To run an existing program using Enterprise Guide (See Appendix – Program_1.sas for example program), • from the Main Menu, select File Open Program Local Computer • navigate to the location of your program • select Program_1.sas. The program opens in a new window tab.
Hands-on WorkshopsSAS Global Forum 2010

4
To view the process flow and then run the program, • select the Process Flow shortcut on the menu bar. Notice that a code node, Program_1 is added to your Process
Flow and Project Tree views. Notice the shortcut symbol with the code node, reminding you that this is a pointer to the locally stored version of Program_1
• run the program by selecting Run On Local from the POP MENU in the code node, OR by selecting Run from the context menu in the Process Flow view.
In this instance, we are running our SAS program using the Local version of SAS. You can change your connection settings to switch from a local SAS instance to a server instance or to switch from one server to another in the Administration panel of your Options screen (Tools Options Administration). The remainder of the examples in this paper assume that we are running on the Local Server. When the program completes running, the Process Flow view shows the components created by program_1, as additional nodes.
Hands-on WorkshopsSAS Global Forum 2010
5
VIEWING LOGS AND RESULTS In the above window, you will notice that the only symbol attached to the code node is the shortcut symbol. However, if your program resulted in an error or warning, you would see an additional symbol such as an exclamation point. When you rest your mouse over the code node, in addition to providing basic information about your program, you may also be informed to check for warnings or errors. To review the log messages, select Program_1 in the Context Menu, and then select the Log tab. As always, carefully check your log for any messages that require attention.
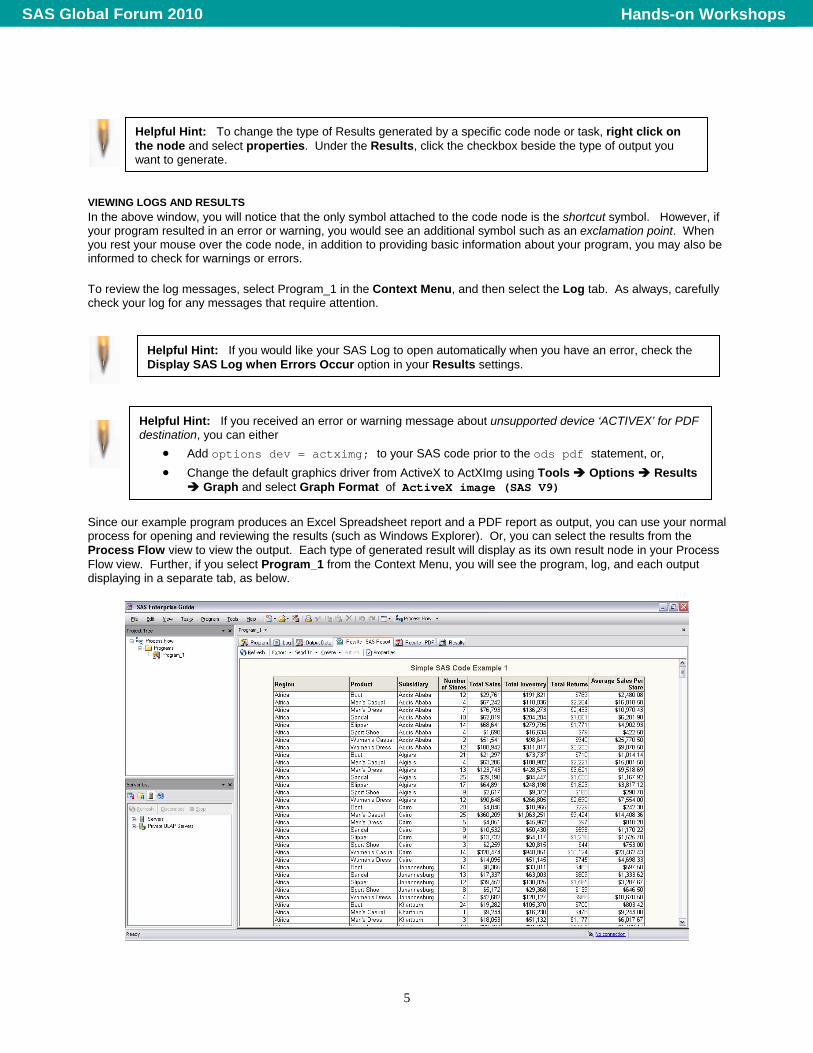
Since our example program produces an Excel Spreadsheet report and a PDF report as output, you can use your normal process for opening and reviewing the results (such as Windows Explorer). Or, you can select the results from the Process Flow view to view the output. Each type of generated result will display as its own result node in your Process Flow view. Further, if you select Program_1 from the Context Menu, you will see the program, log, and each output displaying in a separate tab, as below.
Helpful Hint: If you received an error or warning message about unsupported device ‘ACTIVEX’ for PDF destination, you can either
• Add options dev = actximg; to your SAS code prior to the ods pdf statement, or, • Change the default graphics driver from ActiveX to ActXImg using Tools Options Results
Graph and select Graph Format of ActiveX image (SAS V9)
Helpful Hint: To change the type of Results generated by a specific code node or task, right click on the node and select properties. Under the Results, click the checkbox beside the type of output you want to generate.
Helpful Hint: If you would like your SAS Log to open automatically when you have an error, check the Display SAS Log when Errors Occur option in your Results settings.
Hands-on WorkshopsSAS Global Forum 2010
6
CUSTOMIZING THE WINDOWING ENVIRONMENT Everyone has different preferences about how Enterprise Guide windows should work, and Enterprise Guide provides the flexibility for you to create a work space that works best for you. For example, Enterprise Guide windows can be • docked and undocked • resized to make best use of the real estate • hidden so that you only display what you need and use • opened as new horizontal or vertical tabs • easily reopened using the main menu or shortcut buttons.
THAT WAS PAINLESS, BUT I NEED TO BE ABLE TO CHANGE CODE? Suppose that you need to enhance existing code, rather than just run it. Navigate to the Program_1 code node and double click to open it if it isn’t already open; or select the tab if the code is already open. Once the code is open, you can make changes; you will find the editor commands are identical to the SAS Editor. Then simply rerun the code and review your results. You can save your changes from the main menu by selecting File Save. Remember, each time you save a code node, you are actually saving a .sas program file. If you have selected ‘Open the LOG when errors occur’ in your Options, then your log will now automatically appear if there are issues.
WOW – THAT’S EASY – ARE GRAPHICS EASY TOO? You have now submitted and modified existing code in Enterprise Guide, so let’s work on a task from scratch. A picture is worth a thousand words, so it is time to see how Enterprise Guide does with graphics. Using the same sales data created in the first example program (Program_1), you will produce a vertical bar chart of Sales by Region.
– Select Tasks Graph Bar Chart from the main menu. This opens the Bar Chart Wizard. – In the Bar Chart screen, double click on Simple Vertical Bar – In the Task Roles screen
o Drag Region to Column to Chart o Drag Sales to Sum of.
– In the Appearance Layout Screen, uncheck the 2D box and then change the Shape to Cylinder from the drop down list
– In the Titles screen o Click on Graph o Uncheck Use Default Text and enter your own title for your graph.
– To see what code was generated, click on Preview Code. – Close the Code Preview Window – Click on Run to create the Bar Chart – The bar chart opens automatically in a new Tab in your Enterprise Guide session.
Helpful Hint: Unhappy with your window changes? Select the Restore Window Layout button in the Options window.
Helpful Hint: If you would like to run just a section of the code, highlight and submit just like you do in the SAS Display Manager Editors.
Hands-on WorkshopsSAS Global Forum 2010

7
Notice that there are now tabs for the input data, code, log, and results. Additionally, the Context Menu allows you to easily Modify Task if you have changes to make.
LEVERAGING CODE THAT ENTERPRISE GUIDE BUILDS Behind the scenes, Enterprise Guide created “correct” code! Like most SAS programmers, you would probably like to re-use the code elsewhere. To access and then save the generated code,
– In the Context Menu Bar in the Process Flow window, click on the Code tab (see above window) – Select the AXIS, GOPTIONS, TITLE, and FOOTNOTE statements and the PROC GCHART statements – Right click anywhere on the highlighted code, and select Copy – Move to the Process Flow Window.
To insert the copied code into a new program, select File New Program. A blank code node will open in the Project window. Paste the copied code and change the dataset name on the PROC GCHART statement to Ex_Shoes_Data. Save the new code node, by selecting File Save Code As Local Computer, and provide the name Program_2. The new code can now be run in the usual fashion. You can make any additional updates and customizations to code that you’ve just pasted, such as changing the appearance of the Legend or adding a Where clause to subset the data being graphed.
Each of the built-in tasks will generate SAS code as you step through the Task Panes. This serves as a great way to learn how to code new SAS Procedures since the syntax is available to view and edit.
Helpful Hint: The Task Status Window shows you the status of the code or task you are running. If you are running large SAS programs, the Task Status will tell you which task or Procedure is currently running. You can open your Task status view from your Main menu. Select View Task Status.
Hands-on WorkshopsSAS Global Forum 2010
8
CUSTOMIZING THE GRAPH FORMAT By default, graphs are generated as interactive ActiveX graphs, which are cool but can use up a lot of system resources. You may prefer or require a more static format such as HTML or JPEG. You can easily change the default in the Graph Results settings of Options.
Select Tools Options Results Graphs and select a different format from the drop down list.
A NEW WAY TO ORGANIZE YOUR PROGRAMS During program development and testing, do you often work with just one set of steps at a time, confirming results before you move on? If you do, that same logic can easily be applied to your code in Enterprise Guide by defining your program as a series of code nodes. Code nodes can be linked together in the Process flow window, thus providing a clear picture of the steps and intermediate results. To link the new Program_2 code node to the first code node,
right click on the Program_1 code node in your Process Flow window select Link Program_1 to . . . select Program_2 and click OK. You now see the link between the two nodes and have the option of running either a single code node or running the
branch that starts with Program_1. To run both code nodes, right click on your Program_1 code node and select Run Branch from Program_1. Once the code in Program_1 has run, Enterprise Guide will automatically run Program_2, generating and displaying all intermediate results along the way.
You’ll notice that a separate log node is generated for each code node. By turning on Project Logging, you can easily tell Enterprise Guide that you’d like a single SAS log to be generated for all of the tasks and code nodes in your Project. This single Project Log will be created in addition to the individual logs created for each task or code node.
SAVING THE PROJECT At this point, save the Project so it is available for another day. • Select File Save Project As Local Computer • Navigate to the file path where you would like to save your project. • Enter a name for your Project, and Click ok. The next time you open your saved project; you will see the code nodes and links that you defined in this session. Note that any temporary work datasets that you may have created in your session will not be saved with your project. You can easily recreate the work datasets by re-running the project the next time you open it.
Helpful Hint: When working with several tasks and code nodes in a single project, you can export all of the generated SAS code as a single .sas file by selecting File Export Export All Code.. Enterprise Guide will scan through your project to find all executable code and save it to a single .sas file. You can select export all the code or select only parts of your project.
Helpful Hint: To remove a link between tasks or Code nodes, right click anywhere on the joining arrow and select Delete. This will only delete the linkage, not the code nodes.
Helpful Hint: If Project Logging is turned on, the log represents a running log of the entire project. To turn on the Project Logging, select Project Log in the Context Menu of the Process Flow, and then select Turn On.
Hands-on WorkshopsSAS Global Forum 2010
9
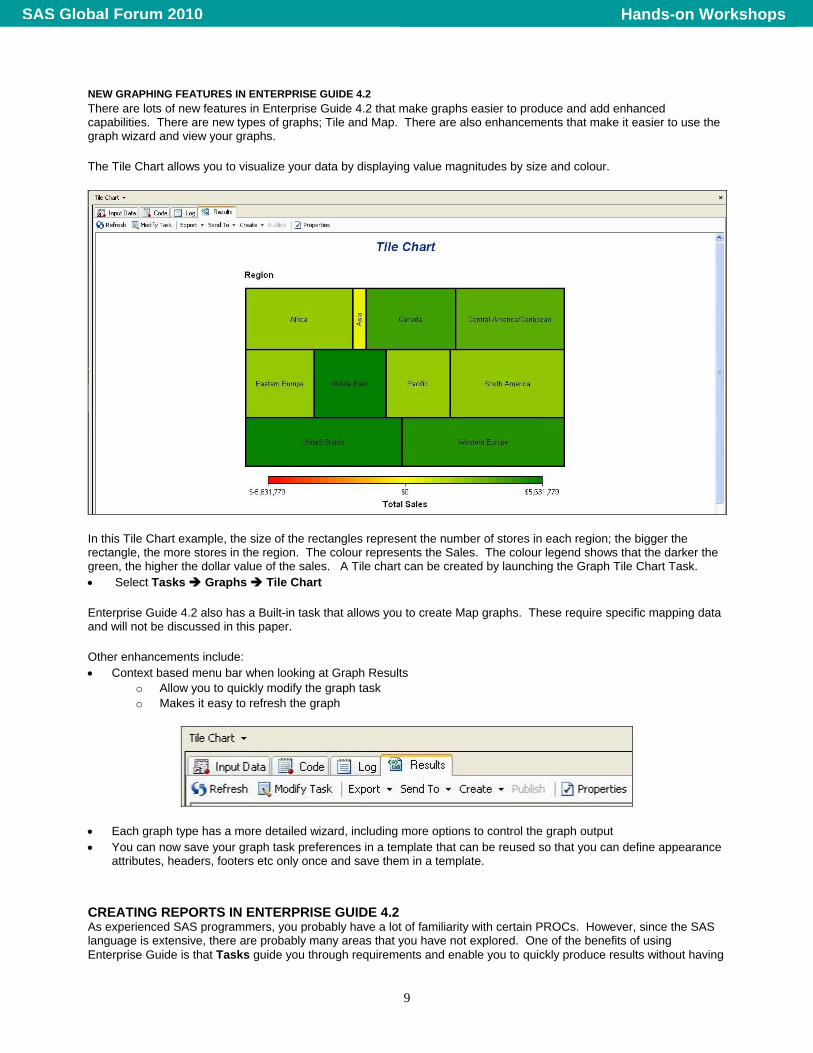
NEW GRAPHING FEATURES IN ENTERPRISE GUIDE 4.2 There are lots of new features in Enterprise Guide 4.2 that make graphs easier to produce and add enhanced capabilities. There are new types of graphs; Tile and Map. There are also enhancements that make it easier to use the graph wizard and view your graphs. The Tile Chart allows you to visualize your data by displaying value magnitudes by size and colour.
In this Tile Chart example, the size of the rectangles represent the number of stores in each region; the bigger the rectangle, the more stores in the region. The colour represents the Sales. The colour legend shows that the darker the green, the higher the dollar value of the sales. A Tile chart can be created by launching the Graph Tile Chart Task. • Select Tasks Graphs Tile Chart Enterprise Guide 4.2 also has a Built-in task that allows you to create Map graphs. These require specific mapping data and will not be discussed in this paper. Other enhancements include: • Context based menu bar when looking at Graph Results
o Allow you to quickly modify the graph task o Makes it easy to refresh the graph
• Each graph type has a more detailed wizard, including more options to control the graph output • You can now save your graph task preferences in a template that can be reused so that you can define appearance
attributes, headers, footers etc only once and save them in a template.
CREATING REPORTS IN ENTERPRISE GUIDE 4.2 As experienced SAS programmers, you probably have a lot of familiarity with certain PROCs. However, since the SAS language is extensive, there are probably many areas that you have not explored. One of the benefits of using Enterprise Guide is that Tasks guide you through requirements and enable you to quickly produce results without having
Hands-on WorkshopsSAS Global Forum 2010
10
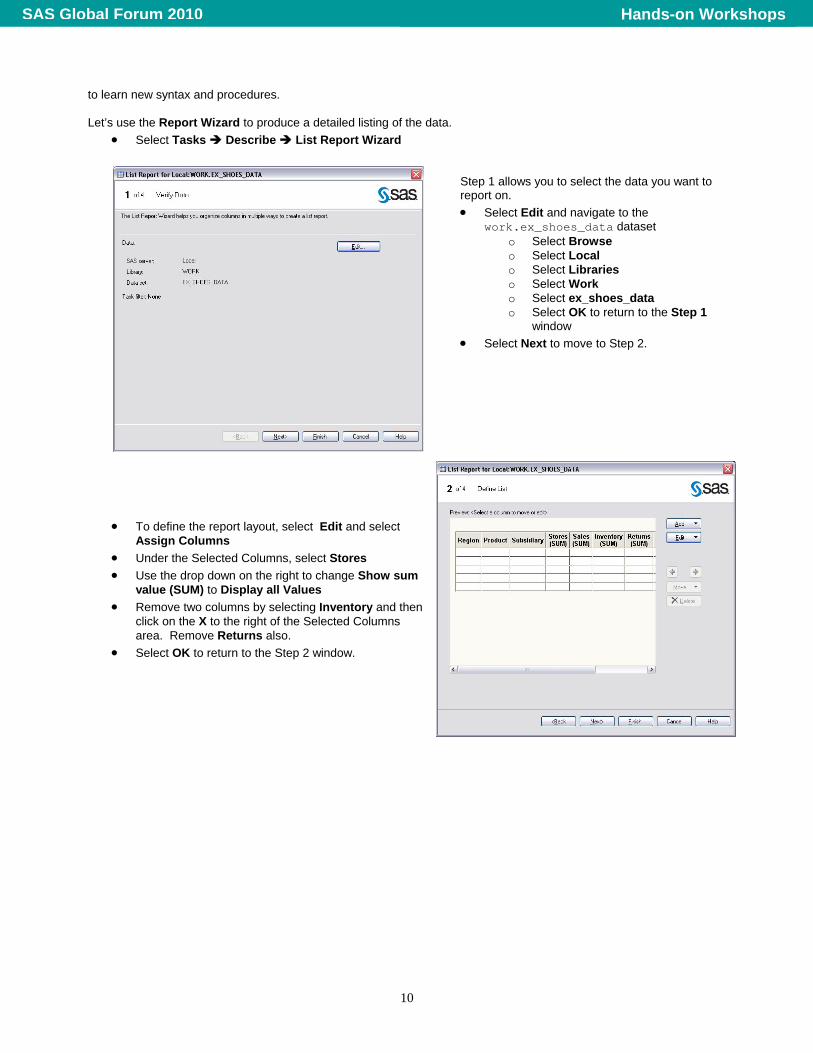
to learn new syntax and procedures. Let’s use the Report Wizard to produce a detailed listing of the data.
• Select Tasks Describe List Report Wizard
Step 1 allows you to select the data you want to report on. • Select Edit and navigate to the
work.ex_shoes_data dataset o Select Browse o Select Local o Select Libraries o Select Work o Select ex_shoes_data o Select OK to return to the Step 1
window • Select Next to move to Step 2.
• To define the report layout, select Edit and select
Assign Columns • Under the Selected Columns, select Stores • Use the drop down on the right to change Show sum
value (SUM) to Display all Values • Remove two columns by selecting Inventory and then
click on the X to the right of the Selected Columns area. Remove Returns also.
• Select OK to return to the Step 2 window.
Hands-on WorkshopsSAS Global Forum 2010
11
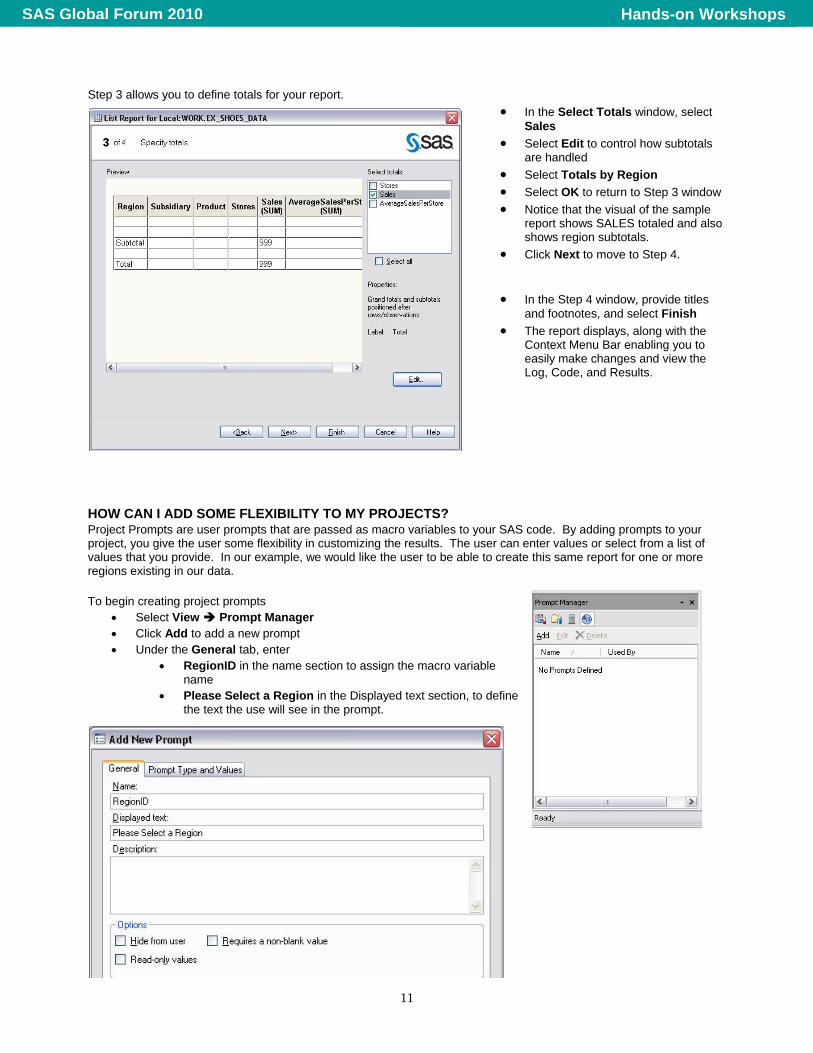
Step 3 allows you to define totals for your report. • In the Select Totals window, select
Sales • Select Edit to control how subtotals
are handled • Select Totals by Region • Select OK to return to Step 3 window • Notice that the visual of the sample
report shows SALES totaled and also shows region subtotals.
• Click Next to move to Step 4.
• In the Step 4 window, provide titles and footnotes, and select Finish
• The report displays, along with the Context Menu Bar enabling you to easily make changes and view the Log, Code, and Results.
HOW CAN I ADD SOME FLEXIBILITY TO MY PROJECTS? Project Prompts are user prompts that are passed as macro variables to your SAS code. By adding prompts to your project, you give the user some flexibility in customizing the results. The user can enter values or select from a list of values that you provide. In our example, we would like the user to be able to create this same report for one or more regions existing in our data. To begin creating project prompts
• Select View Prompt Manager • Click Add to add a new prompt • Under the General tab, enter
• RegionID in the name section to assign the macro variable name
• Please Select a Region in the Displayed text section, to define the text the use will see in the prompt.
Hands-on WorkshopsSAS Global Forum 2010
12
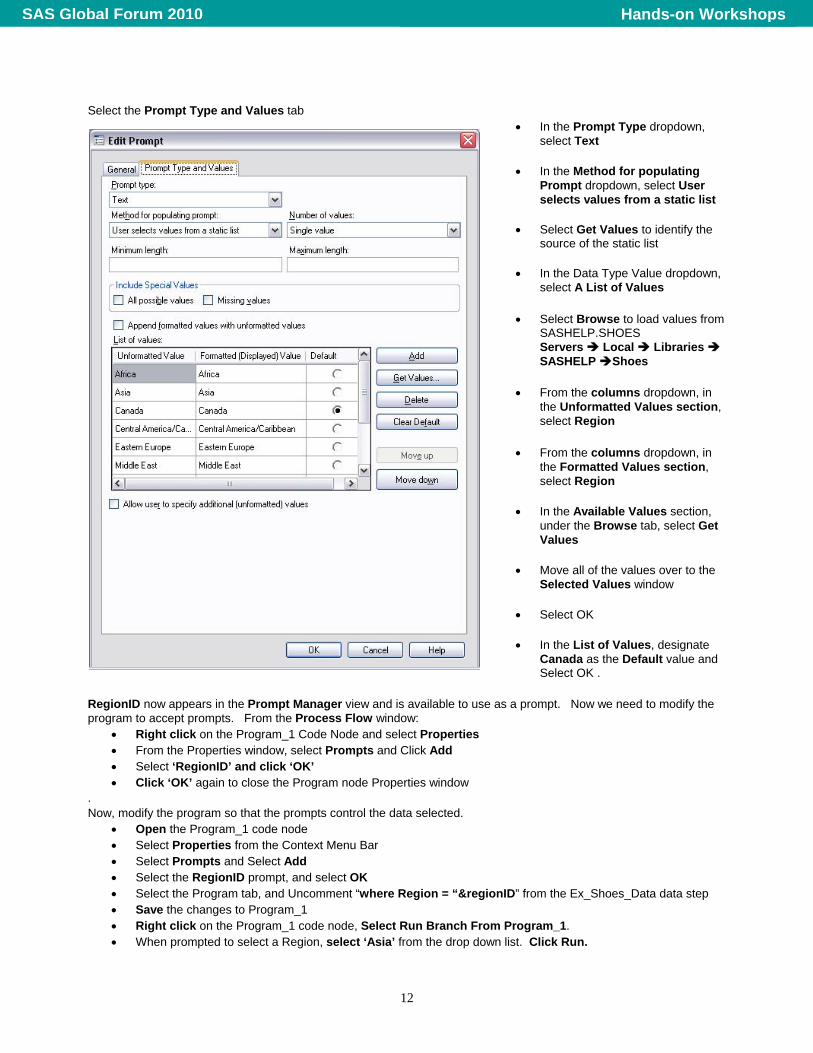
Select the Prompt Type and Values tab
• In the Prompt Type dropdown, select Text
• In the Method for populating Prompt dropdown, select User selects values from a static list
• Select Get Values to identify the source of the static list
• In the Data Type Value dropdown, select A List of Values
• Select Browse to load values from
SASHELP.SHOES Servers Local Libraries SASHELP Shoes
• From the columns dropdown, in
the Unformatted Values section, select Region
• From the columns dropdown, in
the Formatted Values section, select Region
• In the Available Values section, under the Browse tab, select Get Values
• Move all of the values over to the Selected Values window
• Select OK
• In the List of Values, designate Canada as the Default value and Select OK .
RegionID now appears in the Prompt Manager view and is available to use as a prompt. Now we need to modify the program to accept prompts. From the Process Flow window:
• Right click on the Program_1 Code Node and select Properties • From the Properties window, select Prompts and Click Add • Select ‘RegionID’ and click ‘OK’ • Click ‘OK’ again to close the Program node Properties window
. Now, modify the program so that the prompts control the data selected.
• Open the Program_1 code node • Select Properties from the Context Menu Bar • Select Prompts and Select Add • Select the RegionID prompt, and select OK • Select the Program tab, and Uncomment “where Region = “®ionID” from the Ex_Shoes_Data data step • Save the changes to Program_1 • Right click on the Program_1 code node, Select Run Branch From Program_1. • When prompted to select a Region, select ‘Asia’ from the drop down list. Click Run.
Hands-on WorkshopsSAS Global Forum 2010
13
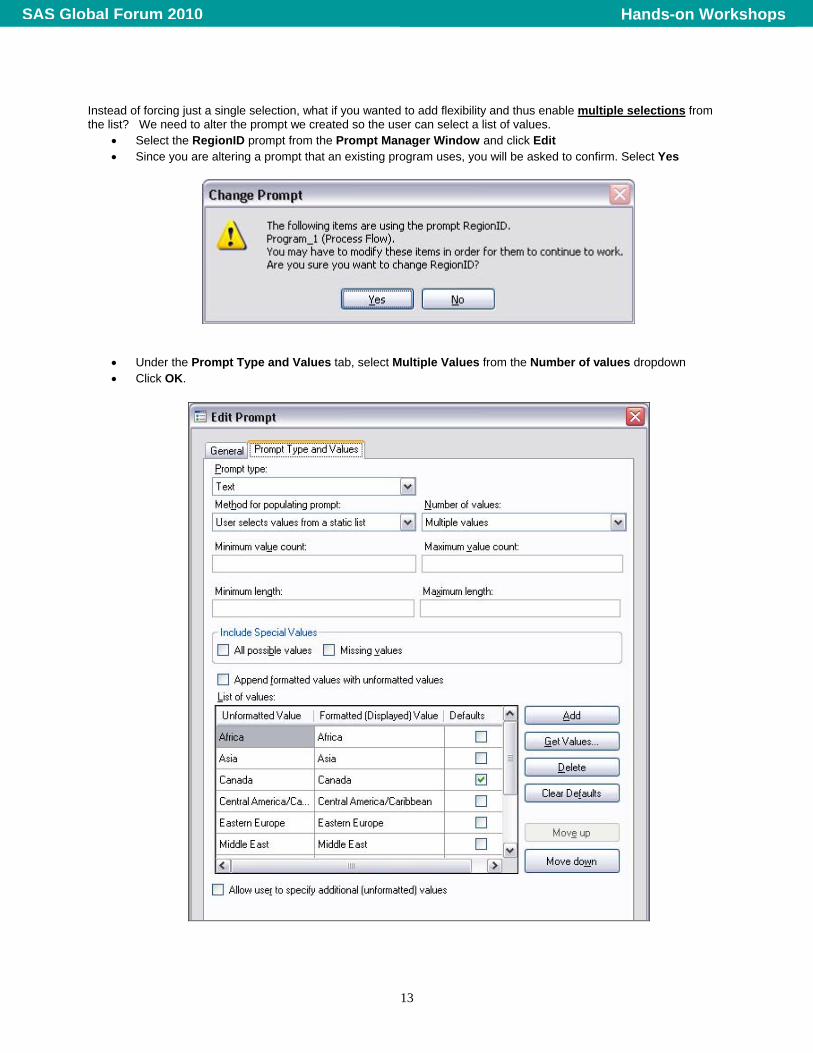
Instead of forcing just a single selection, what if you wanted to add flexibility and thus enable multiple selections from the list? We need to alter the prompt we created so the user can select a list of values.
• Select the RegionID prompt from the Prompt Manager Window and click Edit • Since you are altering a prompt that an existing program uses, you will be asked to confirm. Select Yes
• Under the Prompt Type and Values tab, select Multiple Values from the Number of values dropdown • Click OK.
Hands-on WorkshopsSAS Global Forum 2010
14
• Right Click on the Program_1 node to open the code • Change ‘where region = “®ionID” to “where Region IN ( ®ionID ); • Save the changes to your Program_1 code node. • Right click on the Program_1 code node, Select Run Branch From Program_1. • Move Africa, Canada and Eastern Europe over to the Selected window and then select Run.
ADDING FLEXIBILITY TO YOUR PROJECT WITH CONDITIONAL PROCESSING As we have seen with parameters, macro variables enable code flexibility since the user can provide selections and input. But, if you have processes that should only be run under certain conditions, perhaps regardless of a user preference, Enterprise Guide 4.2 enables you to run a branch conditionally. For example, you can
• Run different branches depending on system parameters such as time or date • Add error / exception handling logic • Let the user control which branch is run via project prompts.
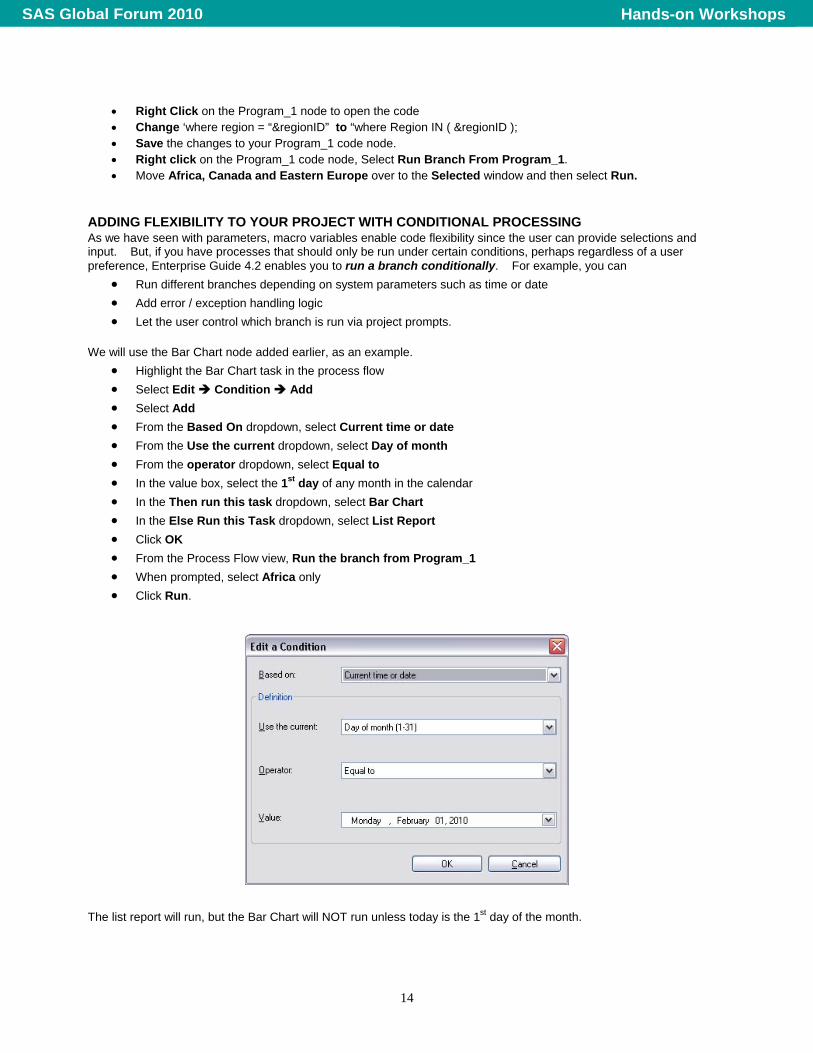
We will use the Bar Chart node added earlier, as an example.
• Highlight the Bar Chart task in the process flow • Select Edit Condition Add • Select Add • From the Based On dropdown, select Current time or date • From the Use the current dropdown, select Day of month • From the operator dropdown, select Equal to • In the value box, select the 1st day of any month in the calendar • In the Then run this task dropdown, select Bar Chart • In the Else Run this Task dropdown, select List Report • Click OK • From the Process Flow view, Run the branch from Program_1 • When prompted, select Africa only • Click Run.
The list report will run, but the Bar Chart will NOT run unless today is the 1st day of the month.
Hands-on WorkshopsSAS Global Forum 2010
15
OK – ENTERPRISE GUIDE REALLY WILL HANDLE MY NEEDS BUT HOW CAN I OFFLOAD SOME OF MY WORK (OR DO MORE WORK IN LESS TIME)? For most SAS programmers, it is a rare occurrence to write a program that is never used again. More typically, you write programs that either run in production, or that are rerun with different input (prompts) on a regular basis. Furthermore, YOU are not always the person that runs the job after it is written. Someone else may be responsible for providing input prompts (changes) and running your code when results are needed. With this in mind, we explore how you can easily set up your code so that others can access and get the results they need. You will do this by creating a Stored Process. A Stored Process is a SAS program that is typically located on a central server (ie: available to multiple users across multiple clients) so that users can run the SAS Code but can’t change the SAS code. Designed properly, the Stored Process enables user input to maximize the applicability of the code. For example, you • can embed business rules and logic so that everyone is creating consistent results • have change control around any coding updates • can make your code available to more people • can provide the users with input prompt choices to take care of minor tweaks in the requirements • can add cascading prompts to make User input easier and more flexible For more information on creating and using Stored Processes, refer to the SAS Online Documentation or to the many SAS Global Forum papers on the topic.
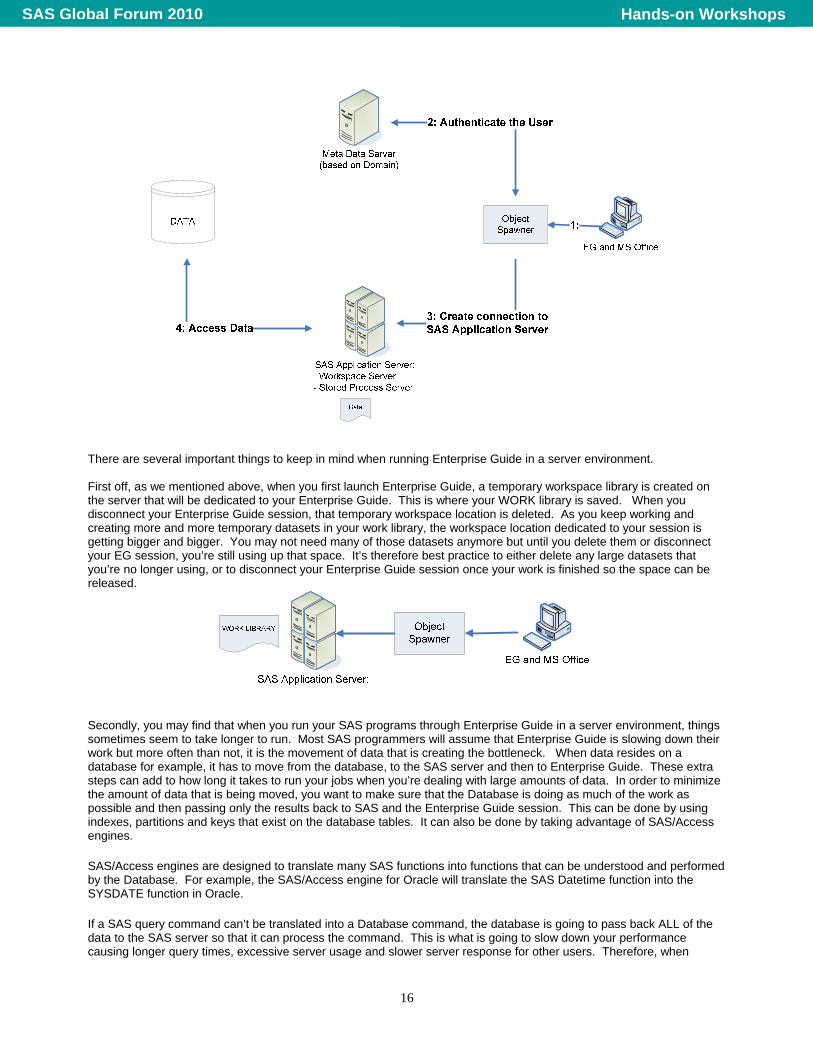
I’M TOLD I’M RUNNING ON A SERVER – WHAT DOES THAT MEAN? When you are running in a ‘Server environment’, SAS is installed on a central server somewhere and is not installed locally on your machine. There are some significant differences between running on a Server environment and running SAS locally but before we talk about what is happening behind the scenes, let’s take a look at the major components of a Server Environment: the metadata server; the Object Spawner; the SAS Application Server; and the Database where your data is.
• The Metadata server stores all of the central metadata about users, and the data and processes that they are allowed to access.
• The SAS Application Server is an execution server that allows for distributed processing through various clients - – in plain English, this is where SAS is actually installed. This allows you to run your SAS programs from different clients (ie.SAS Enterprise Guide, Excel, a web interface) without actually needing SAS on your local computer.
• The Object Spawner essentially acts as a gatekeeper and controls your links to the other servers. • Databases house our data. Often, the data that you are working with will not be in SAS datasets but rather in
Database tables such as Oracle or DB2. When you submit a task or a program from Enterprise Guide in a Server Environment, the following will occur:
1. Your Enterprise Guide session connects to an Object Spawner. 2. You connect to the metadata server through the Object Spawner. The metadata server verifies your credentials
(password and user ID). 3. Once credentials are verified, the Object Spawner starts up a dedicated SAS session for you on the SAS
Application Server. It also creates a temporary Work space library for you that persists as long as your Enterprise Guide session is connected.
4. If your program or SAS Task uses data that is on a Database (eg. Oracle, DB2, Netezza), the SAS Application Server will connect to the database server.
Hands-on WorkshopsSAS Global Forum 2010
16
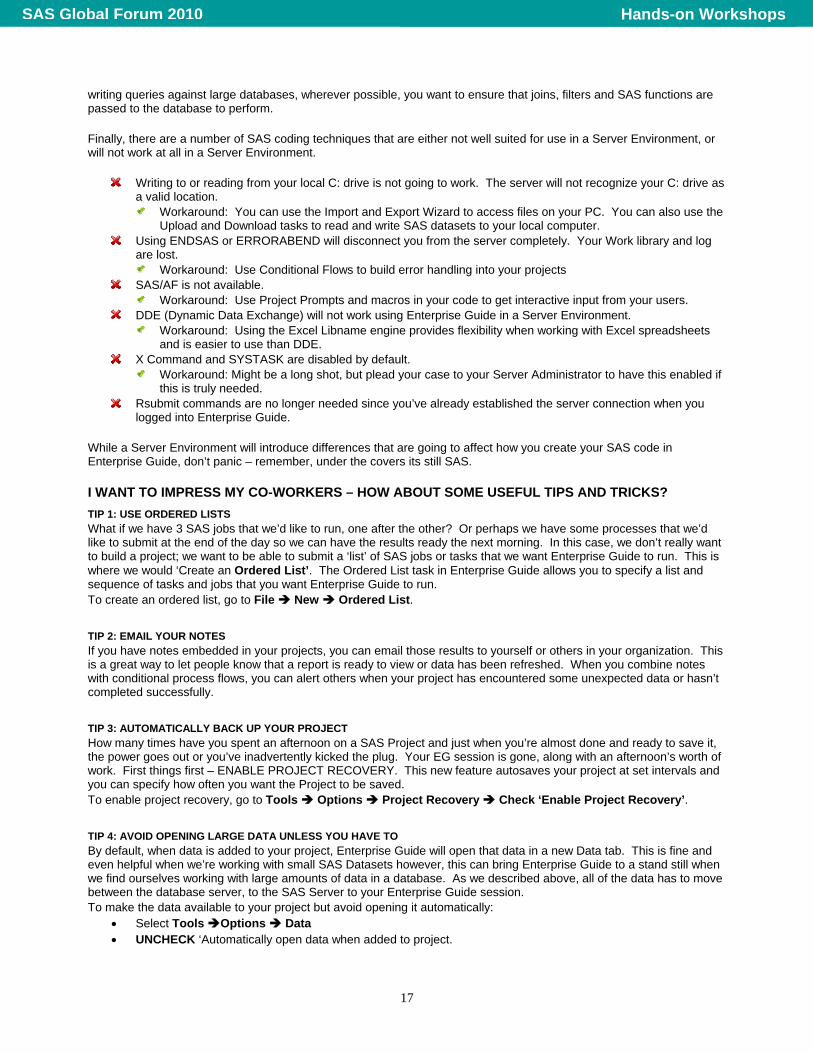
There are several important things to keep in mind when running Enterprise Guide in a server environment. First off, as we mentioned above, when you first launch Enterprise Guide, a temporary workspace library is created on the server that will be dedicated to your Enterprise Guide. This is where your WORK library is saved. When you disconnect your Enterprise Guide session, that temporary workspace location is deleted. As you keep working and creating more and more temporary datasets in your work library, the workspace location dedicated to your session is getting bigger and bigger. You may not need many of those datasets anymore but until you delete them or disconnect your EG session, you’re still using up that space. It’s therefore best practice to either delete any large datasets that you’re no longer using, or to disconnect your Enterprise Guide session once your work is finished so the space can be released.
Secondly, you may find that when you run your SAS programs through Enterprise Guide in a server environment, things sometimes seem to take longer to run. Most SAS programmers will assume that Enterprise Guide is slowing down their work but more often than not, it is the movement of data that is creating the bottleneck. When data resides on a database for example, it has to move from the database, to the SAS server and then to Enterprise Guide. These extra steps can add to how long it takes to run your jobs when you’re dealing with large amounts of data. In order to minimize the amount of data that is being moved, you want to make sure that the Database is doing as much of the work as possible and then passing only the results back to SAS and the Enterprise Guide session. This can be done by using indexes, partitions and keys that exist on the database tables. It can also be done by taking advantage of SAS/Access engines. SAS/Access engines are designed to translate many SAS functions into functions that can be understood and performed by the Database. For example, the SAS/Access engine for Oracle will translate the SAS Datetime function into the SYSDATE function in Oracle. If a SAS query command can’t be translated into a Database command, the database is going to pass back ALL of the data to the SAS server so that it can process the command. This is what is going to slow down your performance causing longer query times, excessive server usage and slower server response for other users. Therefore, when
Hands-on WorkshopsSAS Global Forum 2010
17
writing queries against large databases, wherever possible, you want to ensure that joins, filters and SAS functions are passed to the database to perform. Finally, there are a number of SAS coding techniques that are either not well suited for use in a Server Environment, or will not work at all in a Server Environment.
Writing to or reading from your local C: drive is not going to work. The server will not recognize your C: drive as a valid location.
Workaround: You can use the Import and Export Wizard to access files on your PC. You can also use the Upload and Download tasks to read and write SAS datasets to your local computer.
Using ENDSAS or ERRORABEND will disconnect you from the server completely. Your Work library and log are lost.
Workaround: Use Conditional Flows to build error handling into your projects SAS/AF is not available.
Workaround: Use Project Prompts and macros in your code to get interactive input from your users. DDE (Dynamic Data Exchange) will not work using Enterprise Guide in a Server Environment.
Workaround: Using the Excel Libname engine provides flexibility when working with Excel spreadsheets and is easier to use than DDE.
X Command and SYSTASK are disabled by default. Workaround: Might be a long shot, but plead your case to your Server Administrator to have this enabled if
this is truly needed. Rsubmit commands are no longer needed since you’ve already established the server connection when you
logged into Enterprise Guide. While a Server Environment will introduce differences that are going to affect how you create your SAS code in Enterprise Guide, don’t panic – remember, under the covers its still SAS.
I WANT TO IMPRESS MY CO-WORKERS – HOW ABOUT SOME USEFUL TIPS AND TRICKS? TIP 1: USE ORDERED LISTS What if we have 3 SAS jobs that we’d like to run, one after the other? Or perhaps we have some processes that we’d like to submit at the end of the day so we can have the results ready the next morning. In this case, we don’t really want to build a project; we want to be able to submit a ‘list’ of SAS jobs or tasks that we want Enterprise Guide to run. This is where we would ‘Create an Ordered List’. The Ordered List task in Enterprise Guide allows you to specify a list and sequence of tasks and jobs that you want Enterprise Guide to run. To create an ordered list, go to File New Ordered List.
TIP 2: EMAIL YOUR NOTES If you have notes embedded in your projects, you can email those results to yourself or others in your organization. This is a great way to let people know that a report is ready to view or data has been refreshed. When you combine notes with conditional process flows, you can alert others when your project has encountered some unexpected data or hasn’t completed successfully.
TIP 3: AUTOMATICALLY BACK UP YOUR PROJECT How many times have you spent an afternoon on a SAS Project and just when you’re almost done and ready to save it, the power goes out or you’ve inadvertently kicked the plug. Your EG session is gone, along with an afternoon’s worth of work. First things first – ENABLE PROJECT RECOVERY. This new feature autosaves your project at set intervals and you can specify how often you want the Project to be saved. To enable project recovery, go to Tools Options Project Recovery Check ‘Enable Project Recovery’.
TIP 4: AVOID OPENING LARGE DATA UNLESS YOU HAVE TO By default, when data is added to your project, Enterprise Guide will open that data in a new Data tab. This is fine and even helpful when we’re working with small SAS Datasets however, this can bring Enterprise Guide to a stand still when we find ourselves working with large amounts of data in a database. As we described above, all of the data has to move between the database server, to the SAS Server to your Enterprise Guide session. To make the data available to your project but avoid opening it automatically:
• Select Tools Options Data • UNCHECK ‘Automatically open data when added to project.
Hands-on WorkshopsSAS Global Forum 2010
18
TIP 5: EXPORT YOUR PROJECT TASKS AS SAS CODE Once you’ve completed all of your exploratory work, you may end up with a mix of tasks and custom program nodes. You can save all of them or a subset of them as a single SAS file which you may then want to run in Batch mode. When exporting the Code in your project, Enterprise Guide scans through your project and assembles all of the SAS code that was either generated by a task or was written in a custom program node. You can then select which parts of the project you want to include in the final SAS file and the order in which the SAS code should appear. To export all of parts of your project to a SAS File, select File Export Export all Code in Project
CONCLUSION Enterprise Guide 4.2 provides a powerful environment and toolset for end-to-end information delivery. As a SAS programmer, you can easily begin taking advantage of Enterprise Guide to provide a flexible reporting and analytics environment to meet your organization’s business needs.
RECOMMENDED READING To gain a more complete understanding of Enterprise Guide 4.2, the authors recommend the following
• Getting Started with SAS Enterprise Guide – free learning tutorial available at http://support.sas.com/documentation/onlinedoc/guide/tut42/en/menu.htm
• Little SAS Book for Enterprise Guide 4.2 – By Susan J. Slaughter, Lora D. Delwiche,
http://www.sas.com/apps/pubscat/bookdetails.jsp?catid=1&pc=61861
CONTACT INFORMATION Your comments and questions are valued and encouraged. Contact the authors at:
Marje Fecht Prowerk Consulting [email protected] www.prowerk.com Rupinder Dhillon Dhillon Consulting [email protected] www.dhillonconsulting.com
SAS and all other SAS Institute Inc. product or service names are registered trademarks or trademarks of SAS Institute Inc. in the USA and other countries. ® indicates USA registration. Other brand and product names are trademarks of their respective companies.
Hands-on WorkshopsSAS Global Forum 2010
19
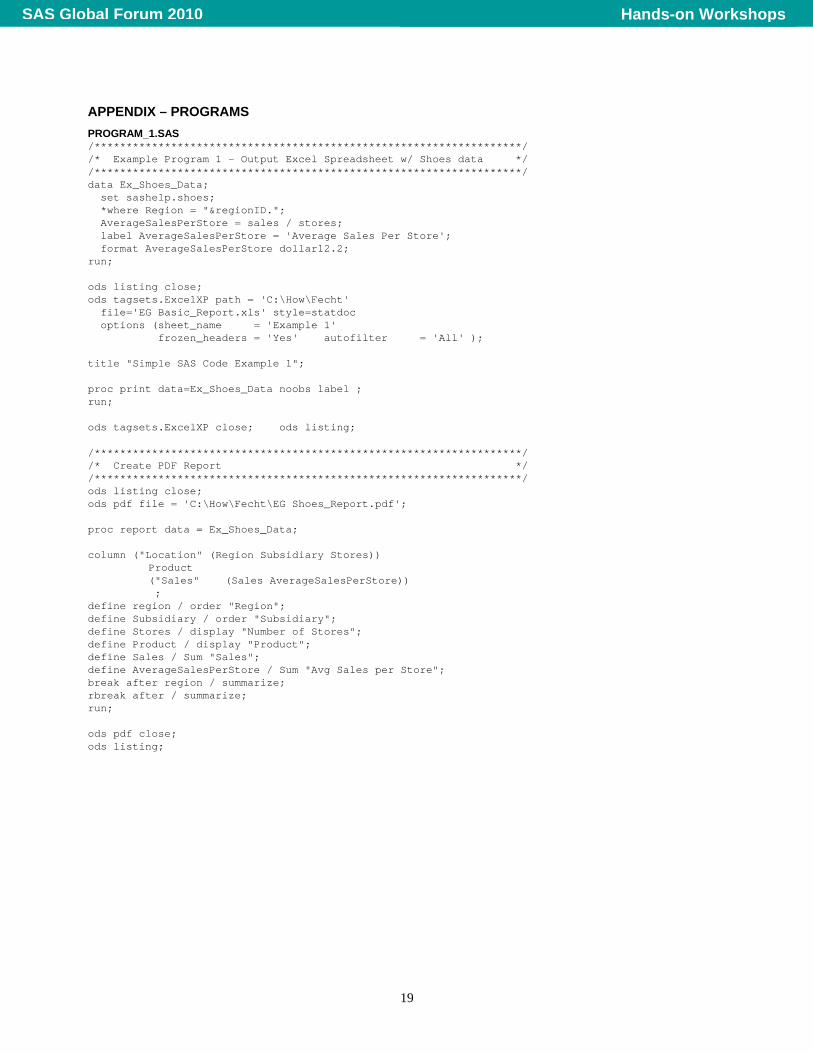
APPENDIX – PROGRAMS PROGRAM_1.SAS /*******************************************************************/ /* Example Program 1 - Output Excel Spreadsheet w/ Shoes data */ /*******************************************************************/ data Ex_Shoes_Data; set sashelp.shoes; *where Region = "®ionID."; AverageSalesPerStore = sales / stores; label AverageSalesPerStore = 'Average Sales Per Store'; format AverageSalesPerStore dollar12.2; run; ods listing close; ods tagsets.ExcelXP path = 'C:\How\Fecht' file='EG Basic_Report.xls' style=statdoc options (sheet_name = 'Example 1' frozen_headers = 'Yes' autofilter = 'All' ); title "Simple SAS Code Example 1"; proc print data=Ex_Shoes_Data noobs label ; run; ods tagsets.ExcelXP close; ods listing; /*******************************************************************/ /* Create PDF Report */ /*******************************************************************/ ods listing close; ods pdf file = 'C:\How\Fecht\EG Shoes_Report.pdf'; proc report data = Ex_Shoes_Data; column ("Location" (Region Subsidiary Stores)) Product ("Sales" (Sales AverageSalesPerStore)) ; define region / order "Region"; define Subsidiary / order "Subsidiary"; define Stores / display "Number of Stores"; define Product / display "Product"; define Sales / Sum "Sales"; define AverageSalesPerStore / Sum "Avg Sales per Store"; break after region / summarize; rbreak after / summarize; run; ods pdf close; ods listing;
Hands-on WorkshopsSAS Global Forum 2010