160808 h-1 final report - department of transportation · 2017-07-27 · final report: h-1 corridor...
TRANSCRIPT

H-1 Corridor Study Project No. CMAQ-0300 (129)
Kapolei to Wai'alae/Kāhala O'ahu, Hawai'i
Final Report
Produced for: State of Hawai'i Department of Transportation
Highways Division
August 2016

THIS PAGE INTENTIONALLY LEFT BLANK

Final Report: H-1 Corridor Study
H-1 Corridor Study Project – August 2016 Page i
Prepared by SSFM International, Inc.
Table of Contents INTRODUCTION AND PURPOSE ...................................................................................................1
PHASE ONE: IDENTIFY PROBLEMS, MEASURES OF EFFECTIVENESS, AND CANDIDATE LIST OF PROJECTS ....................................................................................................................................3
1.1 METHODOLOGIES USED ........................................................................................................... 3
1.2 PROBLEMS IDENTIFIED ............................................................................................................. 4
1.3 MEASURES OF EFFECTIVENESS ............................................................................................... 10
1.4 PRELIMINARY PROJECT IDENTIFICATION ................................................................................ 12
PHASE TWO: DATA COLLECTION, FORECASTS, AND ANALYSIS ............................................15
2.1 METHODOLOGIES USED ......................................................................................................... 15
2.2 RESULTS OF PHASE 2 ANALYSES ............................................................................................. 17
PHASE THREE: ASSESSMENT OF BENEFITS ANALYSIS FOR CANDIDATE PROJECTS ...............19
3.1 METHODOLOGY ..................................................................................................................... 19
3.2 PHASE 3 ANALYSIS RESULTS ................................................................................................... 19
PHASE FOUR: FEASIBILITY AND FINAL LIST OF PROJECTS ....................................................21
4.1 METHODOLOGIES .................................................................................................................. 21
4.2 PROJECTS ANALYZED .............................................................................................................. 21
4.3 FEASIBILITY ANALYSES ............................................................................................................ 24
4.4 PRIORITIZATION BY MEASURES OF EFFECTIVENESS (BENEFITS) .............................................. 27
4.5 COSTS .................................................................................................................................... 34
4.6 BENEFIT COST REVIEW ........................................................................................................... 34
4.7 ECONOMIC SIGNIFICANCE OF H-1 FREEWAY AND IMPACTS OF EXPENDITURES MADE ON IT .. 35
4.8 SURVEYS OF ACCEPTABILITY TO CHANGE ............................................................................... 38
PROGRAM FUNDING ..........................................................................................................41
REFERENCES TECHNICAL REPORTS PREPARED AS PART OF THE H-1 CORRIDOR STUDY..............45
APPENDIX 1 ...............................................................................................................................47

Final Report: H-1 Corridor Study
H-1 Corridor Study Project – August 2016 Page ii
Prepared by SSFM International, Inc.
List of Tables
Table 1: Problems and Issues by H-1 Segment ........................................................................................ 7 Table 2: Projects Included in Phase 4 (directly on H-1 Facility) .............................................................. 22 Table 3: Projects Not Considered in Phase 4 (not on H-1 Facility) .......................................................... 24 Table 4: Highest ranking projects for all measures of effectiveness ....................................................... 31 Table 5: Overall cost for all projects by type. ......................................................................................... 34 Table 6: Top five projects with the best Benefit/Cost ratios along the corridor...................................... 35 Table 7: Economic activity supported by H-1......................................................................................... 36 Table 8: Federal Funds available for Oahu projects. .............................................................................. 41 Table 9: H-1 Proposed Projects by Tier and Category ............................................................................ 41
List of Figures
Figure 1: H-1 is a critical facility in the regional network.......................................................................... 1 Figure 2: The morning zipper lane from Waikele to Nimitz has been in use for 20 years. ......................... 4 Figure 3 Bumper to bumper congestion on H-1 can occur every day in peak periods, as well as on weekends, prior to special events, and when there are construction projects.......................................... 5 Figure 4: The study found over 20 recent incidences in the last 10 years of multi-hour all lane closures due to accidents, spills, or suicides. ......................................................................................................... 6 Figure 5: As the regional system backbone, H-1 intersects with many other major freeways and arterials............................................................................................................................................................... 11 Figure 6: H-1 freeway utilizes an HOV system during peak times. .......................................................... 12 Figure 7: H-1 in town has closely spaced on and off ramps. ................................................................... 13 Figure 8: H-1 in town has 3-4 lanes each direction. ............................................................................... 14 Figure 9: H-1 outside of town has 5-6 lanes each direction. .................................................................. 14 Figure 10: Congested travel conditions cause weaving problems for cars trying to enter the freeway. .. 16 Figure 11: H-1 directly serves harbors, airports and industrial areas and thus it's an important facility for freight and goods movements. .............................................................................................................. 18 Figure 12: Halawa is the most complex interchange and is where H-1 connects to H-3. ........................ 20 Figure 13 and Figure 14: The rail project currently in construction crosses H-1 twice; it will add people carrying capacity to the corridor. ........................................................................................................... 26 Figure 15: Congestion and capacity issues occur in all sections of H-1. .................................................. 28 Figure 16: The H-1 median barrier was heightened to reduce glare, which can contribute to accidents. 29 Figure 17: Freight traffic loses valuable time sitting in traffic................................................................. 37 Figure 18 and Figure 19: Joint Base Pearl Harbor and Hickam are accessed from H-1. ........................... 38 Figure 20: H-1 Embraces Oahu's people and needs round the clock, year after year. ............................ 43

Final Report: H-1 Corridor Study
H-1 Corridor Study Project – August 2016 Page 1
INTRODUCTION AND PURPOSE The H-1 Corridor Study seeks to identify potential projects for the H-1 Corridor that will serve current and future mobility, reduce congestion, improve safety, and ensure efficient movement of people and goods. The study was undertaken by the Hawai‘i Department of Transportation in order to create a long term investment strategy and program that protects the existing infrastructure.
This study is meant as a guide for HDOT Highways in setting its direction for their program for H-1 freeway, which is the most critical roadway in its system. The 27-mile freeway experiences varying levels of congestion throughout the day and week according to the section location and nearby land uses. While dozens of individual projects are identified, they would each be subjected to the division project justification process. This study can be used as a starting point to compare projects that may straddle multiple segments or that may address different objectives such as congestion relief, traffic safety, pavement preservation, bridge protection, or assisting with freight movements.
The study is also meant to help HDOT conform to federal policy guidance as expressed in the legislation known as Moving Ahead for Progress in the 21st Century (MAP-21) and the Fixing America’s Surface Transportation (FAST) Act. The study was organized to address the Seven National Goals which include: Safety (Reduction of traffic fatalities and serious injuries); Infrastructure Condition (state of “good repair”); Congestion reduction; System Reliability; Freight Movement and Economic vitality; Environmental Sustainability; and Reduced delays for project delivery. Performance assessments and measures of effectiveness were developed for each goal.
Figure 1: H-1 is a critical facility in the regional network.

Final Report: H-1 Corridor Study
H-1 Corridor Study Project – August 2016 Page 2
H-1 is part of the nationwide interstate system of highways that includes nearly 47,000 miles built to uniform design standards. The other two parts of the system in Hawaii include H-2 and H-3; and H-1 connects with both of these important roadways. Construction of H-1 began in 1959 and ended with completion of the airport viaduct in 1986. It is used daily by over 200,000 trips in its busiest sections. The corridor is 27 miles long from the western end at Farrington Highway in Kapolei to the eastern end at Wai‘alae/Kāhala where it meets Kalaniana‘ole Highway. There are 33 major ramps and interchanges that provide access to the H-1 Freeway. These were also studied and project recommendations made.
Candidate Improvement projects include those that would provide System Preservation, such as Pavement Rehabilitation; Capacity/congestion relief, such as widenings; Safety; and Corridor-Wide improvements such as improved signage or lighting.
The study included four phases of work:
• Review of previous studies, identification of problems, and development of a preliminary list of candidate projects
• Data collection, forecasting and analysis to determine how each candidate project performs to improve traffic or safety, and elimination of those with little or no benefit
• Quantification of the transportation benefits of each remaining candidate project, including operational analysis and simulation
• Determination of the feasibility of each project, its environmental impacts, costs, and length of time to implement. During this phase, travelers and commercial drivers were surveyed to receive feedback on the urgency as reflected by users. A study was made of the socio-economic value of the H-1 freeway to O‘ahu.
Technical Reports summarizing results from each of the phases were completed to document the work and results. Separate methodologies were used as appropriate for each phase of work. A Work Flow Diagram depicting the Study Phases and Tasks can be found in Appendix I.
Work on the H-1 Corridor Study was assisted by two advisory groups who assisted in reviewing work in each phase. The first, the Coordination and Resource Group (CORG) was made up of representatives from each section of the HDOT Highway Division as well as Airports and Harbors Division. These internal experts were able to identify sources of information, and to review the reports from their own specialty such as bridges, right of way, or traffic. The second advisory group, the Corridor Advisory Group (CAG) was made up of technical experts from public agencies such as FHWA, OahuMPO, the City & County of Honolulu, and HART. The CAG provided a wide perspective of input that was regional in nature.

Final Report: H-1 Corridor Study
H-1 Corridor Study Project – August 2016 Page 3
PHASE ONE: IDENTIFY PROBLEMS, MEASURES OF EFFECTIVENESS, AND CANDIDATE LIST OF PROJECTS
Phase 1 had three major Tasks:
1) Problems were identified along each roadway segment. 2) Evaluation criteria and Measures of Effectiveness (MOE) were researched and selected. 3) A preliminary set of candidate improvements was prepared which addressed the problems and needs. The associated technical reports for Phase 1 are:
Key Transportation Problems Identification, Task 1.3 (October 2013) Measures of Effectiveness (MOEs), Task 1.5 (October 2013) Preliminary Candidate Improvement Projects, Task 1.6 (January 2014) 1.1 METHODOLOGIES USED
Phase 1 comprised an extensive gathering of documents and data. National standards were studied for their application. The sources of data used as part of the problem identification task included:
• Review of 27 previous studies • Screenline counts (2007 base year and 2035 forecasted) for ten locations along the
freeway came from the OahuMPO Travel Demand Model. Four hour volumes for AM and PM peaks and full day (ADT) counts were assessed.
• Traffic volumes and Vehicle Mix variations (trucks, buses, cars, motorcycles) from the HDOT historic annual data base
• Collision data (2006-2010) from the HDOT data base • Pavement Condition from HDOT condition surveys in (2009-10) • HDOT bridge ratings for “functionally obsolete” and “structurally deficient” bridges • Inventory of H-1 Access Ramps from HDOT • Land use changes, especially in the ‘Ewa sections and the effects of the rail system were
documented from City Development Plans and numerous EIS documents
The O‘ahuMPO Travel Demand Model was capable of forecasting and evaluating performance changes for the major projects and new connections. Smaller scale improvements such as ramp widenings and interchange modifications were evaluated using a Synchro Model. Policy improvements such as signage and rehabilitation were assessed qualitatively.
Consultation sessions to identify problem areas were held with major trade associations for goods and freight movement (Hawai‘i Transportation Association; Hawai‘i Harbors Users Group, Air Cargo Association of Hawai‘i). Also, the team reached out to major destination and user groups

Final Report: H-1 Corridor Study
H-1 Corridor Study Project – August 2016 Page 4
such as University of Hawai‘i, Aloha Stadium and military bases and facilities. In addition, the television and radio traffic reporters were consulted for their ideas and input.
1.2 PROBLEMS IDENTIFIED
Corridor Wide issues were reviewed. Some are amenable to driver education, some to construction practices, while others rely upon geometric and design resolutions. The team did a review of how the (AM) Zipper Lane was working and access issues for entering the zipper lane. Another issue was narrow side and median shoulders and the lack of continuity throughout the system. Shoulders are needed for use by first responders and for faster removal of incidents from the flow of traffic. Incidents become exacerbated by rubber necking. Another corridor wide issue is the pronounced effects between when schools are in session, and when they are not. This phenomenon raised possibilities for greater coordination and traffic demand management with schools. Another corridor wide issue is construction disruptions, including but not limited to the Rail project. The dearth of alternate routes means that there is no place for traffic to move when one or more lanes are taken for construction or maintenance. Finally, there is a corridor wide issue of security, in particular theft of copper wire, which can put lighting infrastructure out for months at a time.
Figure 2: The morning zipper lane from Waikele to Nimitz has been in use for 20 years.

Final Report: H-1 Corridor Study
H-1 Corridor Study Project – August 2016 Page 5
Capacity is among the most severe problems. This is measured by the number of vehicles that pass a section of roadway (“throughput”) and by the amount of “friction” caused when vehicles enter or exit at ramps and interchanges. Capacity is a function of speed, how closely vehicles are spaced, sight distance, driver comfort with lane and shoulder widths, and other factors. Friction is a function of speed differential, acceleration and deceleration, lane changes, and merging/diverging distance.
The majority of the freeway has insufficient mainline capacity in one or both directions during peak commute times for the entire length. The corridor lacks sufficient parallel facilities to alleviate the demand. This results in degraded operations. Segments that consistently operate at the lowest levels of service in the AM peak include
• Westbound H-1 between the H-1/H-2 merge and Paiwa Street • Westbound H-1 between Fifth Avenue and Middle Street • Eastbound H-1 between Kapolei Interchange at Kalaeloa Boulevard to Hālawa Interchange • Eastbound H-1 from Middle Street merge to Punahou Street
Afternoon peak periods also have severe congestion that can start as early as 2:00 PM. Weekends also experience congestion levels, especially when there are special events or construction projects. A unique mix of traffic sources (employment, school, military, tourism, commercial, etc.) makes travel times more unpredictable and can lead to multiple peak hours.
Figure 3 Bumper to bumper congestion on H-1 can occur every day in peak periods, as well as on weekends, prior to special events, and when there are construction projects

Final Report: H-1 Corridor Study
H-1 Corridor Study Project – August 2016 Page 6
Congestion at ramps causes friction for both the mainline traffic and entering traffic. Major bottleneck locations include: Fort Weaver/Kunia Road to and from the east; Eastbound merge of H-1 with makai-bound H-2; Middle Street merge; Eastbound off-ramp to Punchbowl Street; Eastbound Punahou Street off ramp; Westbound off-ramp to Pali Highway; and University Avenue Interchange, all ramps.
Safety issues included reduced or sub-standard lane width, narrow shoulder or no usable shoulder, reduced vertical and horizontal curve radii, insufficient stopping sight distance, inadequate merge area, improper lane utilization (such as left side ramps), and low bridge clearance.
Figure 4: The study found over 20 recent incidences in the last 10 years of multi-hour all lane closures due to accidents, spills, or suicides.
The types of congestion and safety issues varies according to which segment of the highway is being examined. The study delineated ten highway segments.
Table 1 shows the problems and issues by segment of H-1. Categories of issues include: rising volumes in comparison to available lanes (V/C), congestion, geometric design, collision rates, functionally or structurally obsolete bridges, pavement below satisfactory ratings, and major events causing closures lasting more than two hours.
Asset Preservation bridge repairs and upgrades are listed when these are structurally or functionally obsolete and need to be improved or replaced. Pavement needs are based on ratings which could require rehabilitation or reconstruction. Intelligent Transportation Systems (ITS) such as dynamic traveler information are included in the Corridor Wide project listings of this study.

Final Report: H-1 Corridor Study
H-1 Corridor Study Project – August 2016 Page 7
Table 1: Problems and Issues by H-1 Segment
Segment 2007 ADT
2035 ADT
Capacity Concerns
Safety Concerns Bridge/ Pavement Concerns
Major Closures
1 Kalaeloa Boulevard to Kualaka‘i Parkway 3.2 miles (12% of total length)
98,996 132,065 No mainline issues. Access issues at Pālailai IC Possible new lane for EB on-ramp at Kualaka‘i Possible new connections for Makakilo Drive extension.
Low collision rate; half occur during peaks Major type is rear-end. No geometric design issues.
Palehua Separation Underpass (EB and WB) is functionally obsolete. 3.2 miles rated “unsatisfactory” PCI below 55.
Nov 28, 20108:00 PM. Motorcycle hits police car near Makakilo median. WB closure for 3.5 hours. Traffic detoured to Makakilo ramps.
2 Kualaka‘i Parkway to Kunia Road 2.17 miles (8% of total length)
98,996 149,652 No mainline issues. Proposed Ho‘opili developer will widen H-1 with a new lane each direction.
Low collision rate, 36% during peak period. No predominant type of accident. No geometric design issues.
None. Apr 7, 2012 6:20 AMSingle vehicle crash/fatality near Kualaka‘i Parkway. WB freeway closed for 3.5 hours.
3 Kunia Road to H-2 (Waiawa IC) 3.13 miles (11% of total length)
141,138 179,728 Demand exceeds capacity in EB direction in AM peak. Vehicles queue to use zipper lane in AM. Severe problems on all facilities in 2035. Proposed Ho‘opili developer will widen H-1 with a new lane each direction.
Low collision rate, 41% during peak periods. Major type is rear-end collisions Geometric issues include design speed, shoulder and median widths and left side off-ramp to H-2.
3 bridges have functionally obsolete raties: Hoaeae Road (EB and WB) and Cane Haul Rd underpass.
July 6, 201210:45 PM Fatal accident with motorcycle near Lumiaina closed 3 WB lanes; and a second accident near Paiwa closed all lanes for four hours. Traffic diverted through Waipahu.
4 H-2 (Waiawa) to Moanalua Road (Waiau) 2.03 miles (7% of total length)
228,290 259,096 EB congestion exceeds 1.2 v/c for extended time in AM. WB congestion in PM peak caused by the sun. Volumes will increase with several development projects.
Comparatively high collision rate, 51% during peak periods.Major type is rear-end collision. Geometric issues include substandard median, shoulder, and lane widths and left side on-ramp to H-1.
One bridge is functionally obsolete (Farrington overpass).
Feb 13, 2004 Two WB racing vehicles result in multiple fatalities. Freeway closed for six hours. Jan 31, 2013 10:10 PM Man jumps out of moving vehicle and is killed. WB closed for 3.5 hours.

Final Report: H-1 Corridor Study
H-1 Corridor Study Project – August 2016 Page 8
Segment 2007 ADT
2035 ADT
Capacity Concerns
Safety Concerns Bridge/ Pavement Concerns
Major Closures
5 Moanalua Road to H-3 (Hālawa IC). 2.81 miles (10% of total length)
228,250 252,037 EB congestion in AM peak and WB in PM peak. Geometric design to current standards. Curve at Ka’amilo Street causes sight distance problems. Future demand increases congestion. Some shoulder width problems. EB visibility issues caused by the sun in the AM.
Comparatively high collision rate, 51% during peak periods.Major type is rear end collisions. Geometric issues include substandard design speed, median, shoulder and lane widths.
Pavement condition very poor with PCI 28.
Jan - Mar 2006 Construction closures. Sep 5, 2006, 1:30 PM Army semi-trailer hits ‘Aiea Ped Overpass. WB closed for 24 hours and zipper lane not opened for morning commute. Traffic diverted to Kamehameha Hwy. Mar 30, 2011, 9:23 PM Multi-vehicle accident fatality with motorcycle. WB closed four hours. Jan 21, 2012, 8:19 PM Pickup truck kills police officer who had stopped another vehicle. EB closed several hours; WB closed briefly. Oct 31, 2012, 1:30 PM Empty garbage truck hits zipper lane median near Kaonohi overpass. Both directions closed for several hours.
6 H-3 (Hālawa) to Middle Street. 5.52 miles (20% of total length)
115,933 121,561 Adequate capacity except at both ends and where meets Nimitz. Problems caused by downstream congestion. Median shoulder used as travel lane in AM peak. Possible future PM zipper lane.
Comparatively low collision rate. Half occur during peaks. No predominant type. Lack of shoulder near Middle Street.
Five bridges functionally obsolete 5.52 miles of pavement are rated unsatisfactory. 2.37 miles are poor (PCI 42) and 3.15 are poor at (IRI 180).
None noted.

Final Report: H-1 Corridor Study
H-1 Corridor Study Project – August 2016 Page 9
Segment 2007 ADT
2035 ADT
Capacity Concerns
Safety Concerns Bridge/ Pavement Concerns
Major Closures
7 Middle Street Merge to Likelike Hwy/ Kalihi St. 0.74 miles (3% of total length)
212,398 234,016 Substantial EB congestion in AM and on parallel facilities. Congested in both directions in PM peak. Will worsen in future. No full access at Kalihi IC (EB/WB H-1 to Kalihi St Makai of the IC).
Very low collision rate, less than a third during peaks. No predominant type. Geometric issues at Middle Street due to narrow lanes, short merges.
Four bridges functionally obsolete. Low bridge clearance at Gulick; need to widen Ola Lane and Kalihi St. overpasses. Recently paved: no issues.
None noted.
8 Likelike to Vineyard Blvd 2.36 miles (9% of total length)
188,345 201,454 Highest v/c ratio of all segments (1.68). Congested in both directions at multiple times. Likelike EB merge and weave a problem area. Other areas have short weave distances. Widen at Nu‘uanu Avenue overpass would require demolition. No full access at Pali IC (makai-bound Pali Hwy to WB H-1).
Comparatively high collision rate, 36% during peak periods. Major type is rear-end.
Eight bridges are functionally obsolete. 2.36 miles of pavement are unsatisfactory. But portions were due for paving in 2013. 1.96 miles are failed (PCI 9) and .40 miles are poor (PCI 43).
Six notedJan 17, 2008-- 3 hour closure due to baby thrown from overpass. June 3, 2011—police confrontation with shooting suspect November 22, 2011 – Motorcycle accident Dec 13, 2011 Heavy rain closes WB January 31, 2012 – closure of WB for six hours to replace sign Feb 19, 2012 Fatal Motorcycle accident.
9 Vineyard to University 2.12 miles (8% of total length)
194,126 200,862 AM demand exceeded in both directions. v/c 1.23 EB and 1.11 WB. Conditions worse in future.
Comparatively high collision rate, 47% during peak periods. Major type is rear-end collision. Geometric issues with lane width, shoulder and median widths and merge lengths.
One bridge structurally and functionally obsolete (Punahou St. overpass). 2.12 miles pavement rated as unsatisfactory. 1.22 miles are in poor condition (PCI 43) and .90 miles are (PCI 51), but 0.2 miles was scheduled for repavement in 2013.
Periodic evening closures for paving in June-July 2000. Dec 13, 2011 heavy rain closed two WB lanes. July 23, 2012 man jumps to death from McCully Str. Overpass. Freeway closed for four hours. November 7, 2012. Truck fire near Bingham St. closes fwy for two hours.

Final Report: H-1 Corridor Study
H-1 Corridor Study Project – August 2016 Page 10
Segment 2007 ADT
2035 ADT
Capacity Concerns
Safety Concerns Bridge/ Pavement Concerns
Major Closures
10 University to ‘Āinakoa Avenue 3.08 miles (12% of total length)
78,800 82,648 AM demand exceeds capacity WB, congestion starts at Kapi‘olani off-ramp.
Comparatively low collision rate. Most occur during peaks. Major type is rear end collision. Lack of shoulder and medians; short merge lengths WB. Non-standard interchanges.
Eight bridges are functionally obsolete. Entire section requires paving to correct smoothness of condition. Some pavement markings cause confusion.
Feb 27, 2011 two lanes closed for inspection of pedestrian overpass. Mar 6, 2011 All EB lanes closed for concrete patching. Aug 6, 2011 Cement truck overturns near King St. Freeway closes EB lanes for three hours.
The airport, harbors, and freeway are part of an inter-connected system of facilities that allow the movement of freight and goods. This system is critical to the economics of Oahu and the State of Hawai‘i. H-1 is the primary roadway leading to both harbors on O‘ahu. Kalaeloa Barbers Point Harbor is located at the west end of the corridor and Honolulu Harbor is located south of H-1 at the east end.
1.3 MEASURES OF EFFECTIVENESS
Measures of effectiveness were reviewed to ensure they were consistent with federal planning goals, the National Highway Performance Program and the goals of the OahuMPO. Best practices from other areas and professional judgement were applied.
Five categories of measures were identified. This yielded twenty-eight separate measures.
• Traffic measures (11 measures) • Geometric/Safety measures (5 measures) • Intermodal measures (5 measures) • Regional Planning measures (2 measures) • Sustainability measures (5 measures)
Traffic measures of effectiveness include: Person and Vehicle Miles of Travel; Vehicle Fuel Consumption; Vehicle Emissions; Person and Vehicle Hours of Delay; Average Vehicle Occupancy; Person and Vehicle Trip Demand Served by Location/Screenline; Lane Miles/Percentage of Roadway Links with Volume/Capacity Ratios Greater than 0.90; Lane Miles/Percentage of Roadway Links with Congested Speed Less Than 20 mph; Travel Time Savings from Select Origin and Destination Points; Ramp Spacing/Access Distribution; and Impacts on Local Streets.
Geometric and Safety measures of effectiveness include: Total Length of Lanes Conforming to Geometric Standards; Lane-Miles with Anticipated Reductions in Accident Rates; Consistency with Planning for Evacuation, Accesses, Redundancy/Resilience from Man-Made Threats and Natural

Final Report: H-1 Corridor Study
H-1 Corridor Study Project – August 2016 Page 11
Disasters; Sufficiency of Critical Highway Infrastructure; and Protection of Critical Highway Infrastructure.
Intermodal measures of effectiveness include: Transit Station Accessibility; Transit Travel Time; Ability to Improve Goods and Passenger Movement to and from Harbors and Airports; Support for Bicycles and Pedestrians; and Support for Taxis and Tour Buses.
Regional Planning measures of effectiveness include: Inclusion in Existing System Planning Documents; and Consistency with Regional Development Plans.
Sustainability measures of effectiveness include: Equity and Equal Mobility; Prosperity; Economic Viability; Natural Environment; and Waste Generation and Resource Consumption.
Whenever possible, MOE were assigned a numerical measurement. Where there was no numerical measure, a qualitative measure was created with a scale or range for the degree to which the MOE is met. These are all described in a technical memorandum.
As the study progressed, the various MOE were used to assess the degree to which individual projects met that MOE.
Figure 5: As the regional system backbone, H-1 intersects with many other major freeways and arterials.

Final Report: H-1 Corridor Study
H-1 Corridor Study Project – August 2016 Page 12
1.4 PRELIMINARY PROJECT IDENTIFICATION
At this stage three types of improvements were identified to create a preliminary list of projects. The three types were: Corridor-wide improvements; Multi-segment improvements; and Improvements within segments. Each preliminary project was assessed for consistency with the federal planning goals.
The project study team used their professional knowledge supplemented by the review of previous studies and input by the advisory groups to create the preliminary list of candidate projects. A total of 115 candidate projects were identified. Seventeen were corridor-wide improvements. Fifteen were multi-segment projects. Eighty-three were individual projects. Upon review by the advisory group, 12 projects were added for a total of 127 in the first phase.
Corridor-wide projects included: Transportation Demand Management; Ramp Metering; Partial-day Access Restrictions; ITS Real Time Traveler Information; Wayfinding Signage; Express Buses; Dynamic Speed Limits; Truck/Terminal Facilities; Extension of the Freeway Service Patrol; Construction Management Program; Driver and Truck Education and Enforcement; Median Screens; Lighting; and Toll Facilities.
Multi segment projects covered a greater length than any of the ten segments being used in the analysis. Seventeen multi-segment projects were identified, mostly for various lengths of widenings, shoulder lane conversion, contraflow lanes and traffic signal optimization. At this Phase 1 stage the list also included projects not directly on the H-1 alignment but that would have beneficial traffic impacts on H-1 by providing an alternate route (examples included a new tunnel across Pearl Harbor, Nimitz Viaduct, Dillingham Viaduct, and Farrington Highway Widening).
Figure 6: H-1 freeway utilizes an HOV system during peak times.

Final Report: H-1 Corridor Study
H-1 Corridor Study Project – August 2016 Page 13
The individual projects were listed for each of the ten segments.
• Segment 1 from Kalaeloa Boulevard to Kualaka’i Parkway, ten projects including one multi segment project were identified
• Segment 2 from Kualaka‘i Parkway to Kunia Road, six projects including four multi segment projects were identified
• Segment 3 from Kunia Road to H-2 (Waiawa) Interchange, twelve projects including six multi segment projects were identified
• Segment 4 from H-2 (Waiawa) Interchange to Moanalua Road (Waiau) seventeen projects including nine multi-segment projects were identified
• Segment 5 from Moanalua Road to H-3 (Hālawa) Interchange, fourteen projects including nine multi-segment projects were identified
• Segment 6 from H-3 (Hālawa Interchange) to Middle Street Merge, fifteen projects including six multi-segment projects were identified
• Segment 7 from Middle Street Merge to Likelike Highway/Kalihi Street, ten projects including five multi-segment projects were identified
• Segment 8 from Likelike Highway/Kalihi Street to Vineyard Boulevard South, twenty projects including four multi-segment projects were identified
• Segment 9 Vineyard Boulevard South to University Avenue, sixteen projects, including two multi-segment, were identified
• Segment 10 University Avenue to ‘Āinakoa Avenue, nine projects, none multi-segment, were identified
Figure 7: H-1 in town has closely spaced on and off ramps.

Final Report: H-1 Corridor Study
H-1 Corridor Study Project – August 2016 Page 14
Figure 8: H-1 in town has 3-4 lanes each direction.
Figure 9: H-1 outside of town has 5-6 lanes each direction.

Final Report: H-1 Corridor Study
H-1 Corridor Study Project – August 2016 Page 15
PHASE TWO: DATA COLLECTION, FORECASTS, AND ANALYSIS Phase 2 looked at current and future areas of congestion. Tasks include:
1) Data collection including counts, and time-speed studies. 2) This data helped identify for the candidate projects what would be the impact with the
improvement compared to a base case without the improvement. 3) This led to a refined list of projects for further consideration.
The associated technical reports for Phase 2 are:
Phase 2 Data Plan (July 2016) Travel Demand Model Review, Task 2.4 (February 2014) Traffic Data Collection, Task 2.3 (February 2014) Traffic Performance Assessment of Candidate Improvement Projects, Task 2.6 (July 2014) 2.1 METHODOLOGIES USED
Measures of transportation performance that had been developed in Phase 1 were applied to the preliminary candidate projects. To do this, a data assembly and new data collection effort was undertaken. An assessment was made of which MOE and what data to support that MOE were needed for every preliminary project from Phase 1.
Historic HDOT counts from 2011 were used for total traffic count and vehicle classification data. These were supplemented by 2013 traffic counts on both H-1 and feeder facilities throughout the day over a 48 hour period. In addition data was derived from INRIX, which is an excellent way to identify bottleneck rating data. Speed/congestion data was obtained from cell phone and navigation systems using global positioning systems (GPS). This data was purchased from Airsage, a company that specializes in collecting travel data. The study team also made its on field observations of traffic conditions.
Generally speaking, future travel demand increases along all segments of H-1, but in particular in those segments of the ‘Ewa Plains where major new developments are proposed or approved. The effects of rail are taken into account with the OahuMPO model, which explains why some of the demand numbers being lower than what might otherwise be expected. Modal transfers between H-1 and the rail system are important, including but not limited to the H-1/H-2 merge at Leeward Community College, Pearl Highlands Park and Ride, Stadium Area park-and-ride, and Middle Street parking. The OahuMPO model uses 762 traffic analysis zones (TAZ) in its analysis; the H-1 corridor directly includes 66 of the TAZ.
Origin-destination patterns and future daily traffic levels were forecast using the regional model developed by the OahuMPO. The forecast year was 2035. The study team conducted static validation procedures (following guidelines and procedures used in the State of California) to ensure the regional model was working as needed for the intended purpose and would yield accurate forecasts. The team tested the future land use assumptions, roadway assumptions and

Final Report: H-1 Corridor Study
H-1 Corridor Study Project – August 2016 Page 16
over 200 origin-destination pairs (with emphasis on the top fifteen pairs). The model met three of four validation metrics (correct amount of traffic; low root mean squared error; and high correlation coefficient). The conclusion reached was that the model could be used for forecasting volumes on a specific link but that more rigorous analysis may be required at a later date in project development.
The final source of data explored were the Traffic Impacts Analysis Reports from major developments including Ho‘opili (2009); UH Pacific Health Research Laboratory (2011); HDOT Harbors Kapālama Container Terminal (2012); and Kunia Agricultural Park (2012).
Figure 10: Congested travel conditions cause weaving problems for cars trying to enter the freeway.

Final Report: H-1 Corridor Study
H-1 Corridor Study Project – August 2016 Page 17
2.2 RESULTS OF PHASE 2 ANALYSES
The data inputs, travel demands, and operation studies helped to confirm the need for each of the preliminary projects identified. Traffic performance measures of effectiveness (MOE) were used to screen improvements projects and were a subset of the MOEs identified in Phase 1. The subset of performance measures of effectiveness for capacity were: Congested Lane Miles, Congested Vehicle Miles Traveled, and Vehicle Hours of Delay. The subset of performance measures of effectiveness in local operational improvements were: Freeway Density, Intersection Delay, Vehicle Queue Reduction, and Traffic Safety. The subset of MOEs for Policy and Program projects were: H-1 Freeway Operations, Local Circulation, Traveler Experience, Traffic Safety, Facility Maintenance, and Goods Movement.
Traffic Performance was assessed by combining AM and PM peak periods. This allowed an equal comparison between Major Capacity Projects and illustrate their temporal benefits. The peak hour performance analysis included Freeway Density and Level of Service or Intersection Analysis and Level of Service. Local Operational Improvement Projects performance was analyzed taking the average AM and PM peak hour results. The Performance Measures for Vehicle Queuing Reduction and for Traffic Safety were evaluated qualitatively. For Policy and Program projects, the six qualitative performance measures were used.
Peak period speed maps were made for the entire length showing how speeds are in the 10-20 mph range for parts and 20-30 mph in other parts. Bottlenecks were identified according to whether they occurred over the entire week, or with lower frequency and the severity of their impact. Top seven highest durations of bottlenecks were eastbound at Pi‘ikoi Street; H-1 eastbound at Moanalua Freeway; H-1 eastbound at Punahou Street; H-1 westbound at Farrington Highway; H-1 westbound at Pi‘ikoi Street; H-1 eastbound at Pali Highway; and H-1 westbound at Pālama Street.
Each project was assessed against the previously established performance measures of effectiveness. Results were shown both for the regional model area and for the H-1 corridor study area. Results differed between regional and localized benefits. The results of the Phase 2 analysis and review led to several projects that proved ineffective being dropped from further consideration, leaving 80 projects for continued analysis. Of these, seven were corridor-wide, thirteen were multi-segment and 60 were individual projects.
Eight National Planning Factors
• Support economic vitality, global competition, tourism, improved productivity
• Increase safety for both motorized and non-motorized users
• Increase security • Increase accessibility and mobility for
individuals and for freight • Protect and enhance the environment,
energy conservation, and quality of life impacts
• Enhance modal integration and connectivity for persons and freight
• Promote efficiency of system management and operations
• Helps to preserve the existing system

Final Report: H-1 Corridor Study
H-1 Corridor Study Project – August 2016 Page 18
Project screening occurred in three levels. During Phase 1, twenty-eight Measures of Effectiveness (MOE) had been identified and crossed with the eight federal planning factors (see text box), with either a Yes/No determination. Most projects addressed some of the factors, but not all.
Transportation benefits of each project was the second level of screening. These were determined during Phase 2. Segments of H-1 were analyzed to see: 1) how many lanes were congested (as measured by V/C ratio greater than 1.0); 2) Total vehicle miles travelled (VMT) under congested conditions (measured by V/C greater than 1.0); and Vehicle Hours of Delay (VHD).
Figure 11: H-1 directly serves harbors, airports and industrial areas and thus it's an important facility for freight and goods movements.
Final Report: H-1 Corridor Study
H-1 Corridor Study Project – August 2016 Page 19
PHASE THREE: ASSESSMENT OF BENEFITS ANALYSIS FOR CANDIDATE PROJECTS
Phase 3 concentrated on determining the transportation effectiveness of the potential projects either alone or in combination. Projects were packaged and geometric and traffic operation studies were conducted.
The associated technical report for Phase 3 is: Assessment of Transportation Benefits and Preferred Improvement Projects, Task 3.0 (December 2014). 3.1 METHODOLOGY
In Phase 3, multiple steps were used to determine benefits for a meaningful comparison of performance. Performance Assessment was performed by applying seven of the original 28 MOEs from Task 1.5. The geometry, constructability, and operational benefits were considered. Operations analysis was conducted to determine the preferred design. For example, the Waiawa Interchange considered multiple alternatives for ramp connections and were assessed using the simulation model VISSIM software. The objective was to ensure that adequate capacity were provided on key approaches and weaving areas. Projects were placed into twelve multi-segment packages to see how they would perform if constructed in conjunction with one another. This accomplished two things: 1) enhanced operations when adjacent projects were done together, and 2) more efficient construction and an associated reduction of cost. This led to the adjustment of packages and project elements. The future operations analysis was conducted in general using the OahuMPO model and compared against 2035 baseline conditions. The results compared to the baseline were presented as percentage improvement for island-wide effects (“Model Wide”), for the Study Area (H-1 plus parallel facilities), and for the H-1 Corridor only. Results were reviewed for AM peak, PM peak and for the combined AM + PM peak. Also during this phase, order of magnitude costs were developed for each of the packages. The projected cost of all packages was estimated at $3.5 billion. Note that this dollar value is lower than Phase 4 estimates for two reasons. First, a larger contingency factor was used in Phase 4. Second, there were cost savings by combining projects into packages. But this made the package costs extremely high, and Phase 4 reverted to project by project cost estimation. 3.2 PHASE 3 ANALYSIS RESULTS
Phase 3 recommended twelve packages (each with multiple projects) and sixteen stand-alone projects along the 27 mile corridor. Conceptual drawings were made for each project. An early assessment of probable costs showed these would exceed $3.5 billion. Because most of the packages exceeded available dollars for any given year by many factors, a decision was made for the Phase 4 work to break them down into more financeable sections.
Final Report: H-1 Corridor Study
H-1 Corridor Study Project – August 2016 Page 20
Phase 3 included several regional projects that were not on the H-1 facility, but which if constructed, would have beneficial impacts to H-1 by either providing alternate capacity or improving the access locations. These regional projects can be considered in the OahuMPO Long Range Plan include: Makakilo Road Improvements, Kapolei Parkway Extension, Kunia Road Widening, Farrington Highway Widening, Salt Lake Boulevard Widening, and Nimitz Highway Viaduct.
In Phase 3, the analysis of transportation benefits was conducted both for the H-1 Freeway facility, and for a larger Study Area, which includes both the H-1 facility and any major parallel facilities (such as Farrington Highway, Nimitz Highway, etc.).
The results of the effectiveness analysis showed many benefits were substantial, especially when projects were implemented in groups or packages. Some projects, especially the widenings, provide a substantial amount of additional freeway capacity, which led to reduced peak period congestion, improved travel times, and fewer miles spent in congested conditions. Further, derivative impacts from reduced congestion on energy/fuel savings, and improved air quality were calculated. Some of the projects had a more localized benefit such as providing safety or access which improved circulation in the area, but had less of a regional impact. Some projects would improve H-1 travel (such as ramp metering), but come at the expense of greater queueing on local streets and thus were not favored. Widening projects were considered as either additional lanes or as express lane facilities with tolls, although there is an added requirement for how vehicles enter the express lane that is a consideration.
Appendix 1 of the Task 3.0 Report provides the Basis of Estimate information used to develop cost estimates.
Appendix 2 of the Task 3.0 Report provides preliminary conceptual drawings of each package and project as line drawings on aerials.
The final level of screening looked at feasibility and it will be discussed next as part of Phase 4 work.
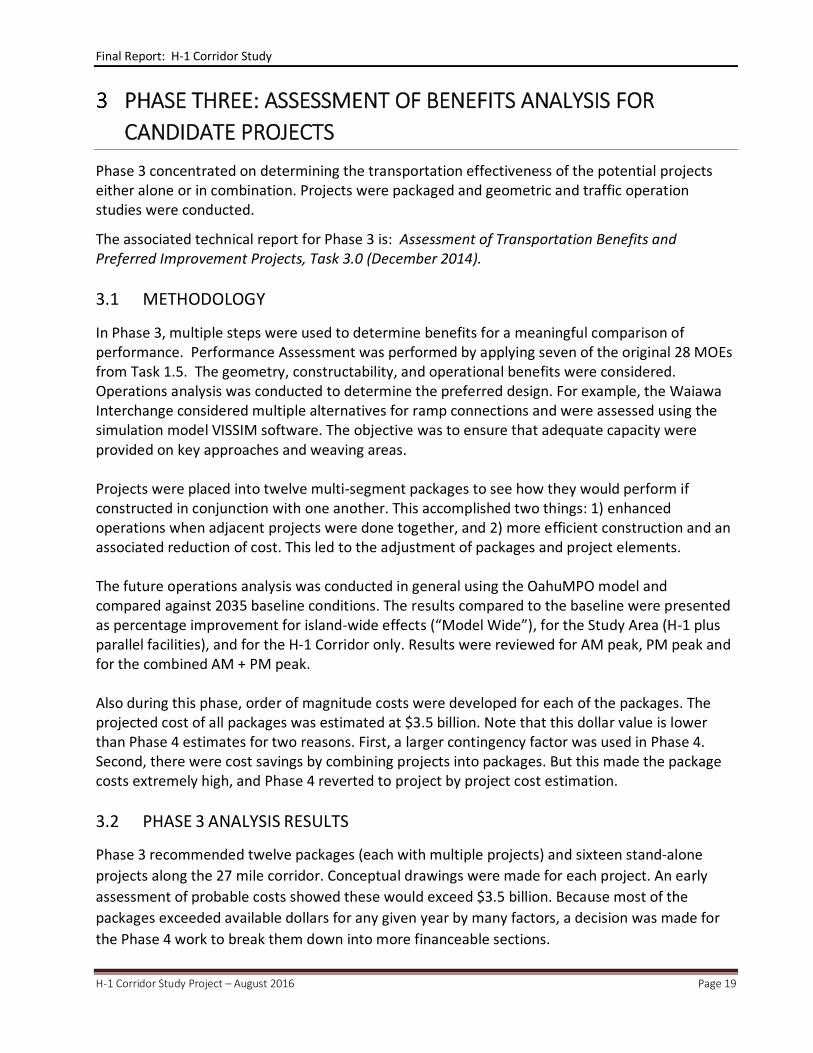
Figure 12: Halawa is the most complex interchange and is where H-1 connects to H-3.

Final Report: H-1 Corridor Study
H-1 Corridor Study Project – August 2016 Page 21
PHASE FOUR: FEASIBILITY AND FINAL LIST OF PROJECTS Phase 4 only looked at those projects which are physically located on H-1 facility or one of its ramps and interchanges. The objective of this phase of work was to develop a feasible program of improvements, with emphasis on understanding their benefits and challenges, and to identify possible approaches to phasing. This set of studies will assist with better informed decision making and prioritization of efforts.
The associated technical reports for Phase 4 include:
Special Task 4 Report on Projects Considered by Phase and Reference Chart (May 2016) Feasibility of Projects, Task 4.1 (September 2015) Assessment of Environmental Issues, Task 4.2 (September 2015) Project Prioritization, Task 4.3 (December 2015) Costs and Benefits of H-1 Improvements, Task 4.4A (May 2016) Program Funding Review, Task 4.4B (July 2016) Economic Analysis Review, Task 4.5A (March 2016) Input Output Analysis of Projects, Task 4.5B (January 2016) Results of Residential Survey, Task 4.6A (October 2015) Results of Driver Survey, Task 4.6B (October 2015) 4.1 METHODOLOGIES
Phase 4 had the most varied methodologies for evaluation. Among them were Feasibility, Environmental Issues, and Cost and Benefits. In addition, Phase 4 looked at societal benefits including the socio-economic value of the H-1 facility, reactions from resident and commercial driver surveys, and applied the State of Hawai‘i Input-Output Model to determine the economic value of construction. The Phase 4 work identifies program funding and recommends various approaches to prioritization of available funding in the short, mid, and long term.
4.2 PROJECTS ANALYZED
The H-1 Corridor study analysis started with a total of 127 projects in Phase 2. As analysis proceeded in subsequent phases, projects were deleted or added or combined. What was different about Phase 4 was that it only looked at those projects which are physically located on H-1 facility or one of its ramps and interchanges. The reason for this was to isolate projects on the interstate, which are eligible for special categories of federal funding and which have specific design and performance standards they must meet or exceed. A special report was prepared to track all proposals considered since the study inception and to show during with phase of work they had been added, deleted, or combined.
In Phase 4 a total of 63 projects, all directly on H-1 facility were analyzed. This included seven corridor-wide projects, twelve multi-segment projects and 44 individual projects.
Final Report: H-1 Corridor Study
H-1 Corridor Study Project – August 2016 Page 22
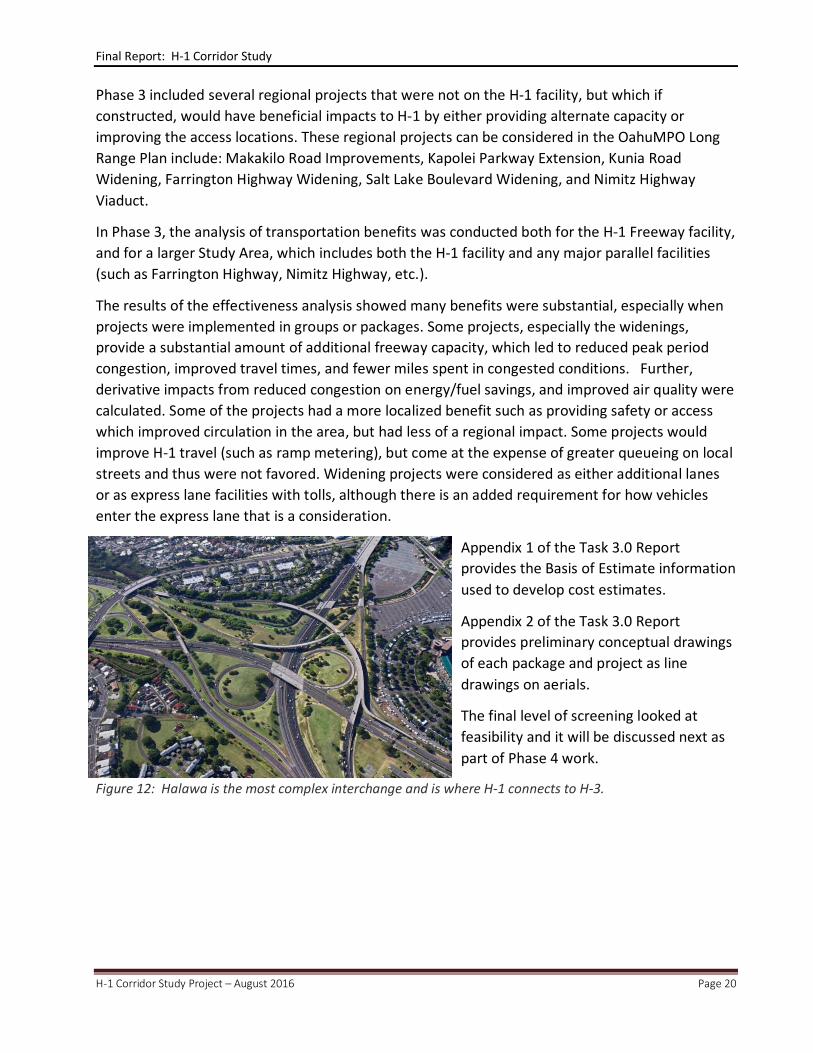
Table 2: Projects Included in Phase 4 (directly on H-1 Facility)
I. H-1 Corridor Projects Corridor-WidePackage Project Name of Package or Project
CW C-2 Ramp Metering (Selected interchanges corridor-wide), locations TBD
CW C-3 Ramp Metering (Outside urban core), locations TBD
CW C-4 Ramp Metering (Freeway to Freeway Ramps), locations TBD
CW C-6 ITS Real-Time Traveler Feedback: Install dynamic message signs with traveler information: time to destination, alternative routes, downstream congestion, transit station information, etc. Locations TBD
CW C-9 Dynamic Speed Limits (Corridor-Wide): Install variable speed limit signs at selected locations indicating slower speeds due to downstream congestion, weather, or other factors.
CW C-16 Lighting Infrastructure Security: Improve security of lighting infrastructure corridor-wide to prevent theft of copper. Locations TBD
CW C-17 Express Lane Facilities: Convert existing HOV facilities and construct new Express Lanes, add variable (dynamic) tolls with options for free travel for HOV vehicles.
II. H-1 Corridor Projects – Multi-Segment Improvements
Package Project Name of Package or ProjectD-1 MS-1
(partial) EB Widening: Kualaka'i Parkway to Waiawa Interchange
D-2 MS-1 (partial) EB Widening: Waiawa Interchange to Hālawa Interchange
D-1 MS-2 (partial) WB Widening: Kualaka'i Parkway to Waiawa Interchange
D-2 MS-2 (partial) WB Widening: Waiawa Interchange to Hālawa Interchange
H MS-3A (partial)
H-1 Widening WB (Vineyard Boulevard South to Middle Street) (can include an HOV option)
I MS-3A (partial)
H-1 Widening WB (University Avenue to Vineyard Boulevard South) (can include an HOV option)
H MS-4A (partial) H-1 Widening EB (Ola Lane to Vineyard Boulevard South) (can include HOV option)
I MS-4A (partial)
H-1 Widening EB (Vineyard Boulevard South to University Avenue) (can include HOV option)
D-1 MS-7 (partial) Zipper Lane Widening: Paiwa Street to Waiawa Interchange
D-2 MS-7 (partial) Zipper Lane Widening: Waiawa Interchange to Pearl Harbor Interchange
MS-11 Kamehameha Highway Traffic Signal Optimization J MS-18 Traffic Signal Optimization on Various Locations (Segments 7-10)

Final Report: H-1 Corridor Study
H-1 Corridor Study Project – August 2016 Page 23
III. H-1 Corridor Individual Projects
Package Project Name of Package or Project
1-8 Segment 1 Bridge RehabilitationL 1-9 Segment 1 Pavement Rehabilitation (Kalaeloa Boulevard to Kualaka'i Parkway
C 2-1 Fort Weaver / Kunia Road Ramp Modifications
E 3-3 New Makai-Bound Kamehameha Highway On-Ramp to Westbound H-1
E 3-4 Paiwa Street Off-Ramp Widening
3-6 Segment 3 Bridge Rehabilitation
E 3-7A Waiawa Interchange - Direct Connect
E 3-7B Waiawa Interchange Ramp Braid
D-2 4-1 Waiawa Interchange Improvements - additional transition lanes from H-1 to H-2D-1 4-2 Pearl Highlands Auxiliary Lane from Waihona Street to H-1 - extension of WB H-1 on-
ramp from Kamehameha Highway (Pearl Highlands area) to the merge area with WB traffic from H-2 Freeway (past Waipahu Street)
B 4-3 Widening of Waipahu Off-Ramp (H-1 to Farrington/Kamehameha Highway)D-1 4-4 WB H-1 Curve Modifications in Waiawa Interchange from H-2 Off-Ramp to H-2 On-
Ramp B 4-6 Widen Ramp from SB Kamehameha Highway to Eastbound Farrington Highway/H-1
4-7 Segment 4 Bridge RehabilitationL 4-8 Segment 4 Pavement Rehabilitation (H-2 to Moanalua Road) E 5-1 Moanalua Road Ramp Improvements
D-2 5-4 H-1 Geometric Improvements (Moanalua Road to Kaimakani Street) 5-4A H-1 Curve (at Ka'amilo Street)L 5-5 Segment 5 Pavement Rehabilitation (Moanalua Road to Halawa Hālawa Interchange) 5-6 New Kaonohi Interchange
D-2 6-1 WB H-1 Hālawa Interchange ImprovementsF 6-5 Nimitz/Sand Island Access Road Grade Separation/Interchange F 6-6 Airport Viaduct to Sand Island Access Road Direct Ramp 6-8 Segment 6 Bridge RehabilitationL 6-9A EB Segment 6 Pavement Rehabilitation (Hālawa Interchange to Middle Street Merge)L 6-9B WB Segment 6 Pavement Rehabilitation (Hālawa Interchange to Middle Street
Merge) 7-1 Gulick Avenue Bridge Replacement
H 7-2 Kalihi Interchange Modification
7-4 Segment 7 Bridge Rehabilitation
H 8-4 Auxiliary Lane from Punchbowl Street to School Street Off-Ramp 8-5A Improve weave between Pali Highway and Kīna’u Street
H 8-6 Kīna’u Street Off-Ramp WideningH 8-8 Kalihi Street / Likelike Highway Interchange Improvements H 8-9 Punchbowl Street Off-Ramp Improvements
H 8-11 Improve Congestion at North Vineyard Boulevard Off-Ramp: Incorporated intoMS-4A (H)

Final Report: H-1 Corridor Study
H-1 Corridor Study Project – August 2016 Page 24
III. H-1 Corridor Individual Projects (cont’d) Project Package Description
8-15 Segment 8 Rehabilitation of eight bridges: (1) Liliha Access Road, MP 20.78; (2) Nu'uanu Avenue, MP 21.28; (3-7) Five Pali Hwy structures MP 21.41 to 21.45; (8) Queen Emma Street, MP 21.62
L 8-16 Segment 8 Pavement Rehabilitation: Kalihi Street to Vineyard Boulevard SouthI 9-5 New Keeaumoku Interchange (formerly called "Pi'ikoi-Pensacola Couplet Reversal") 9-13 Segment 9 Rehabilitation of Punahou Street Overpass Bridge - MP 23.20L 9-14 Segment 9 Pavement Rehabilitation: Vineyard Boulevard South to University AvenueK 10-1 H-1 Geometric Improvements (University Avenue to ‘Āinakoa Avenue)K 10-2 University Avenue Interchange ReconstructionK 10-3 Auxiliary Lane (Wai'alae Avenue On-Ramp to University Avenue Off-Ramp) 10-8 Segment 10 Bridge RehabilitationL 10-9 Segment 10 Pavement Rehabilitation: University Avenue to Kapi'olani Boulevard
Projects that had been analyzed during Phases 1-3 which would benefit regional travel, but were not directly on H-1 are shown in Table 3.
Table 3: Projects Not Considered in Phase 4 (not on H-1 Facility)
Project Package Description1-1 Stand-alone Makakilo Road Improvements1-5 A Kapolei Parkway Extension1-6 A Kapolei Parkway Widening2-2 C Kunia Road Widening3-1 B Farrington Highway Widening (Fort Weaver Road to H-2 Interchange)
6-4 Stand-alone Salt Lake Boulevard WideningMS-13 Stand-alone Nimitz Highway ViaductMS-15 B Farrington Highway Widening (Kapolei Golf Course Drive to Fort
Weaver Road)
4.3 FEASIBILITY ANALYSES
Feasibility is relative but it is an important concept for understanding whether a project will be able to be built given social, environmental, and fiscal constraints. Feasibility looks into how reasonable are the disruptions or impacts of undertaking such a project both in the short term construction period and the permanent impacts. While theoretically, anything is possible, the resources required for project delivery (both human and financial resources) are limited and prudency calls for selecting those that can be progressed with the least amount of friction or difficulty. Certain challenges, such as the level of environmental review require, can shift a project from short term to mid or long term feasibility.
H-1 Corridor Study projects were examined for their likely environmental impacts, takings (ROW and/or structures), and ease of implementation. These are the most common reasons for a project

Final Report: H-1 Corridor Study
H-1 Corridor Study Project – August 2016 Page 25
to take additional time. The feasibility information was presented in summary or tabular form according to the degree of difficulty and the analysis for each project was presented in Report 4.1.
Environmental issues were assessed and described in Task 4.2 Report. Environmental compliance is an important part of any undertaking that uses Federal or State resources. Of the 63 projects, twenty-eight H-1 Corridor Projects were determined to likely be a categorical exemption under NEPA. Twenty-three of these are also likely eligible for an exemption under Hawai‘i State Chapter 343. These projects include Pavement Rehabilitation, Bridge Rehabilitation, small off ramp improvements, transition lanes, traffic signal optimization and ITS projects. Thirty-five H-1 Corridor Projects were determined to require either an EA or an EIS under NEPA. Forty would require an EA under Chapter 343. If the initial environmental review results in a Finding of No Significant Impact, then an EA would suffice. If there are impacts, then the project proceeds to the more detailed EIS level documentation. If significant impacts are anticipated, the project can head straight into the EIS process. An EA can take up to 2 years to prepare and circulate for review before a Finding of No Significant Impact (FONSI) can be issued. An EIS can take longer.
Among the issues that can require added time in the environmental review process are Section 7 of the Endangered Species Act, Section 106 Historic Preservation review, cultural impact analysis, consistency determination with the Coastal Zone Management Act, and review of the impact on Sole Source Aquifer (drinking water impacts). The 4.2 Report provides examples for how other projects have met these requirements. It also provides as appendices, a valuable reference table of federal statutes affecting transportation projects and excerpts of key legislation regarding projects and the environment.
Land takings are required by some projects, especially widenings where additional land would need to be acquired beyond the current right of way. Thirty-five of the projects would require taking some amount of land, however most of these would require less than one acre. The projects which require larger takings are mostly in the in-town sections: improving the weave from Waiawa to Hālawa; Pali Highway to Kīna‘u Street; Improvements to Sand Island Access Road; University Avenue to ‘Āinakoa Avenue; Middle Street to Vineyard Boulevard South; and Vineyard Boulevard South to University Avenue. The same projects (except Improvements to Sand Island Access Road) could also require taking some single family residences and multi-family residences. Care would be taken in design to avoid or minimize such disruptions, but some would be inevitable. Where residential or commercial uses are required, relocation assistance would be provided following federal requirements.

Final Report: H-1 Corridor Study
H-1 Corridor Study Project – August 2016 Page 26
Figure 13 and Figure 14: The rail project currently in construction crosses H-1 twice; it will add people carrying capacity to the corridor.
Construction challenges include the difficulty in creating a safe work zone, places to store equipment near the construction zone, and requirements to keep traffic moving through a construction area. Unavoidable construction impacts such as noise, dust, impacts to traffic, and impacts to nearby businesses and residents all enter into the complexity of planning for construction. For the H-1 Corridor projects, the most complex projects are those in town and these require phasing to reduce impacts from work occurring simultaneously.
The net result of the feasibility studies was to categorize projects according to short term, mid-term and long term. Short term projects can be cleared environmentally in a short time, have minimal or no land takings and little or no construction impacts. Eighteen projects were identified for the short term, but most were at the lower end of the congestion relief spectrum. Mid-term projects require an EA, are in a current long range plan, and are on the lower end of the cost spectrum, but provide high levels of benefits, either congestion relief or asset management. There are eighteen mid-term projects; half of these are for bridge rehabilitation.
Long term projects have long environmental lead times, would have ROW takings, and are generally of a higher cost (over $50 million), which indicates they may require alternate sources of funding than is available currently. There are twenty-seven long-term projects identified for H-1 Corridor.

Final Report: H-1 Corridor Study
H-1 Corridor Study Project – August 2016 Page 27
4.4 PRIORITIZATION BY MEASURES OF EFFECTIVENESS (BENEFITS)
Prioritization was first addressed in the Task 4.3 Report and later continued in the Task 4.4B Report. The Task 4.3 report looks at how potential projects rank according to their congestion relief value, traffic safety benefit, contribution to asset management, whether they contribute positively to goods movement, permanent impacts, and constructability. Inputs in this evaluation are both quantitative and qualitative.
Congestion relief is one of the more desired benefits sought and this was measured using reduced travel time, reduced vehicles hour travelled, reduced vehicle miles traveled, and improved volume to capacity ratio. Ancillary benefit to congestion relief is reduced greenhouse gas emissions (CO2) and reduced fuel consumption. From this analysis, a Congestion Relief Benefit Score was developed for each project and a table is presented with the top ten congestion relief projects for the Study Area and for the Freeway only. Vehicle hours in delay reduced was also used in the benefit/cost calculations.
The projects with the greatest benefits for reducing travel times and reducing peak hour congestion are:
• MS-1 (D-2): Eastbound Widening from Waiawa IC to Hālawa Interchange • MS-2 (D-2): Westbound Widening from Hālawa IC to Waiawa IC • MS-2 (D-1): Westbound Widening from Kualaka‘i Parkway to Waiawa IC • MS-11 & MS-18: Kamehameha Highway Traffic Signal Optimization and various other
locations • MS-4A (H): Eastbound Widening Ola Lane to Vineyard Boulevard (South) (could be an HOV
lane) • MS-3A (H): Westbound Widening Vineyard Boulevard (South) to Middle Street (could be an
HOV lane) • MS-1 (D-1): Eastbound Widening Kualaka‘i Parkway to Waiawa IC • 9-5: New Keeaumoku IC • MS-3A (I): Westbound Widening from University Avenue to Vineyard Boulevard (South)
(could be an HOV lane) • 5-6: New Kaonohi Street Interchange

Final Report: H-1 Corridor Study
H-1 Corridor Study Project – August 2016 Page 28
Because congestion relief projects will be implemented over time, overall congestion will be slow to be realized, as can be seen in the graphic below. This is an illustrative graph showing that congestion levels decrease as investments are made. The actual shape of the lines would depend on which projects are undertaken and what timeframe.
Figure 15: Congestion and capacity issues occur in all sections of H-1.

Final Report: H-1 Corridor Study
H-1 Corridor Study Project – August 2016 Page 29
Figure 16: The H-1 median barrier was heightened to reduce glare, which can contribute to accidents.
Traffic safety was measured by valuing reduced congestion (fewer rear-end and sideswipe collisions), longer merge areas and weaving lanes to reduce the speed differential, and increase lane and shoulder widths to provide more maneuvering space for disabled vehicles. Collision data collected during Phase 1 and geocoded to the location of the highway, allowed a cross analysis of proposed improvements and Index Scoring developed. The top ten safety projects were shown in a table.
The projects with the highest benefits for safety are:
• 8-5A: Braid ramps between Pali Highway and Kīna‘u Street • 5-1: Moanalua Road Ramp Improvements (EB on ramp) • 8-6: Kīna‘u Street Off-Ramp Widening • 4-6: Widen ramp from Southbound Kamehameha Highway to EB Farrington at H-1 • 4-3: Widen Waipahu Off ramp from H-1 to Farrington/Kamehameha • 8-4: Auxiliary lane from Punchbowl Street to School Street • MS-1 (D-2): Eastbound widening from Waiawa IC to Hālawa Interchange • MS-4A (H): Eastbound widening Ola Lane to Vineyard Boulevard (South) • 4-1: Waiawa IC Improvements

Final Report: H-1 Corridor Study
H-1 Corridor Study Project – August 2016 Page 30
• MS-3A(I): Westbound widening from University Avenue to Vineyard Boulevard (South) • MS-4A(I): Eastbound widening from Vineyard Boulevard (South) to University Avenue
Asset management assessment was done and a score developed. The top ten pavement rehabilitation projects and the top bridge rehabilitation projects were shown in tables.
Top projects for protecting the existing asset are:
• 1-9, 4-8, 5-5, 6-9, 8-16, 9-14, and 10-9: Roadway pavement conditioning: Seven of ten segments
• 1-8, 3-6, 4-7, 6-8, 7-4, 8-15, 9-13, and 10-8: Rehabilitation of thirty bridges and overpasses • 7-1: Replacement of Gulick Bridge
Projects that provide or improve access to the airport or one of the two harbors were given a ranking score and top goods movement projects were presented in a table. Top projects that would benefit freight and goods movement are:
• 6-5: Grade separation and new interchange from Nimitz Highway to Sand Island Access Road
• 6-6: Direct Ramp Airport Viaduct to Sand Island Access Road • MS-2 (D2) and MS-1 (D2): Widen H-1 Waiawa Interchange to Hālawa Interchange in both
eastbound and westbound directions • MS-3A (H): Widen H-1 westbound from Vineyard Boulevard (South) to Middle Street • MS-4A (H): Widen H-1 eastbound from Ola Lane to Vineyard Boulevard (South) • MS-2 (D1) and MS-1 (D1): Widen H-1 eastbound and westbound Kualaka‘i Parkway to
Waiawa IC
Projects were ranked on a scale of 1 to 5 based on their ease of constructability (a combination of least construction impacts and disruptions to traffic during construction. The highest ranked projects all with 5 or 4 (least impacts) were:
• MS-11: Kamehameha Highway Signal Optimization • C-16: Lighting Infrastructure Security • MS-18: Traffic Signal Optimization, Various Locations • C-4: Ramp Metering (Freeway to Freeway) • C-3: Ramp Metering (Outside Core Area) • C-2: Ramp Metering (Selected Intersections) • 3-3: New Kamehameha Highway WB On Ramp at Waiawa IC • C-6: ITS Real Time • C-9: Dynamic Speed Limits
Projects were ranked on a scale of 1 to 5 according to ROW takings which is a permanent impact. The best ranking projects all had a 5 (lease impact) were:
• C-2: Ramp Metering (Selected Interchanges)

Final Report: H-1 Corridor Study
H-1 Corridor Study Project – August 2016 Page 31
• MS-11: Kamehameha Highway Signal Optimization • MS-18: Traffic Signal Optimization on Various Locations • C-4: Ramp Metering (Freeway to Freeway) • 10-9: Segment 10 Pavement Rehabilitation • C-3: Ramp Metering (Outside the Urban Core) • C-6: ITS Real Time • C-9: Dynamic Speed Limits • 9-14: Segment 9 Pavement Rehabilitation • 8-16: Segment 8 Pavement Rehabilitation • 4-8: Segment 4 Pavement Rehabilitation • 1-9: Segment 1 Pavement Rehabilitation • 5-5: Segment 5 Pavement Rehabilitation • 6-9: Segment 6 Pavement Rehabilitation • C-16: Lighting Infrastructure Security
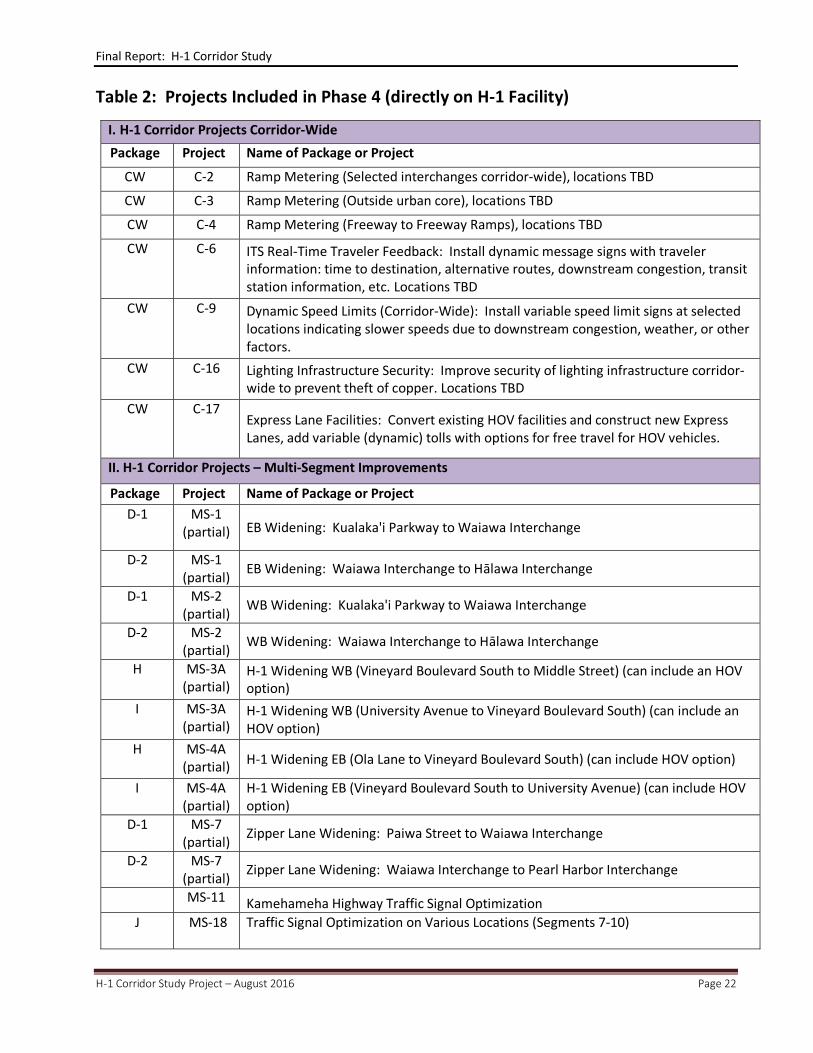
The Task 4.3 Report presents a composite Scoring Matrix for all the measures just described. Results are presented for both the Study Area and the H-1 Corridor only. The highest scoring projects are shown below.
Table 4: Highest ranking projects for all measures of effectiveness
Project Description
Project Score
H-1 Freeway
Only
Study Area
MS-1 (D2) EB Widening: Waiawa Interchange to Hālawa Interchange 1 1
MS-11 Kamehameha Hwy Signal Optimization 2 3
MS-2 (D2) WB Widening: Waiawa Interchange to Hālawa Interchange
3 1
MS-4A (H) EB Widening EB from Ola Lane to Vineyard (w/ HOV Option)
4 6
MS-2 (D1) WB Widening: Kualaka`i Pkwy to Waiawa Interchange 5 3
MS-1 (D1) EB Widening: Kualaka`i Pkwy to Waiawa Interchange 5 8
MS-18 Traffic Signal Optimization on Various Locations (Segments 7-10)
5 3
MS-3A (H) H-1 Widening WB from Vineyard (South) to Middle (can include HOV Option)
8 6
MS-3A (I) H-1 Widening WB from University to Vineyard (South) (can include HOV Option)
9 10
Final Report: H-1 Corridor Study
H-1 Corridor Study Project – August 2016 Page 32
Project Description
Project Score
H-1 Freeway
Only
Study Area
4-6 Widen ramp from SB Kamehameha Hwy to EB Farrington Hwy/H-1
10 11
8-4 Aux. Lane Punchbowl St. to School St. Off 11 12
C-4 Ramp Metering (Freeway-Freeway) 12 54
MS-4A (I) EB Widening from Vineyard (South) to University (w/ HOV Option)
13 16
10-3 Auxiliary Lane Wai’alae Ave On Ramp to University Off 13 16
5-1 Moanalua Rd. Ramp Improvements 13 16
C-9 Dynamic Speed Limits 13 16
4-2 Pearl Highlands Aux. lane from Waihona Street to H-1 17 20
4-3 Widen Waipahu Off-Ramp from H-1 to Farrington/Kamehameha
17 9
C-3 Ramp Metering (Outside Core) 19 21
6-5 Nimitz/Sand Island Access Rd. Grade Separation Interchange
20 23
8-6 Kīna’u Street Off-Ramp Widening 20 23
A review of the top projects for the seven categories of rankings reveals interesting information. Three projects are in the Top Ten for both Congestion Relief and for Traffic Safety and these also scored well for Goods Movement. This would imply they are top projects overall. These are:
• MS-4A (H): Widen EB Ola Lane to Vineyard; (B/C I) • MS 3A (I): Widen WB University Avenue to Vineyard Boulevard South; (B/C II) • MS-1 (D-2): EB Widening Waiawa IC to Hālawa IC; (B/C I)
Of the seven remaining Top Ten Congestion Relief Projects (in addition to the three above), most also scored well in other categories and most were in B/C groupings I and II.
• MS-11: Kamehameha Highway Traffic Signal Optimization Also scored well for Least Construction Impacts and Least ROW Takings; B/C I
• MS-18: Traffic Signal Optimization Various Locations Also scored well for Least Construction Impacts and Least ROW Takings; B/C I
• MS-2 (D-1): WB Widening Kualaka‘i to Waiawa IC Also scored well for Goods Movement; B/C I
• MS-3A (H): Widen WB Vineyard Boulevard South to Middle Street; (B/C II)

Final Report: H-1 Corridor Study
H-1 Corridor Study Project – August 2016 Page 33
• MS-1 (D-1): EB Widening Kualaka‘i to Waiawa IC Also scored well for Goods Movement; B/C I
• MS-2 (D-2): WB Widening Waiawa IC to Hālawa IC Also scored well in Goods Movement; B/C II
• 5-6 New Kaonohi Street IC; B/C I
The remaining top Traffic Safety Projects (in addition to the three above) generally did not score well in other categories and were in the B/C II to VII groupings.
• MS – 4A (I) Eastbound Widening from Vineyard Boulevard (South); B/C II • 5-1: Moanalua Road Ramp; B/C III
Did not score in other categories; B/C III • 8-6: Kīna‘u Street Off-Ramp Widening; B/C VII • 8-5A: Weave Pali Highway to Kīna‘u Street
Did not score in other categories; B/C IV • 4-6: Widen Ramp from SB Kamehameha Highway to EB Farrington Highway/H-1, B/C III • 4-3: Widen Waipahu Off-Ramp, B/C VII • 8-4: Auxiliary Lanes from Punchbowl Street to School Street Off-Ramp, B/C II • 4-1: Waiawa IC Improvements
Did not score in other categories; B/C III
The top projects with the Least Construction Impacts and the Least ROW takings (permanent impacts) were all Corridor Wide Projects, but only C-3 Ramp Metering (Outside Core) and C-4 Ramp Metering (Freeway to Freeway) had a B/C in group I. MS-11 and MS-18 were also in the list with least construction impacts and least ROW. The top projects for Asset Management were the Rehabilitation of Bridges and Pavement Rehabilitation. All had low B/C Scores. The top Goods Movement Projects in addition to MS-1 (D-2) and MS-4A (H) from the top three, are shown below. In general, they had good B/C ratings. Harbors Division noted ITS interest in projects along the airport viaduct, Sand Island Access Road, Kalihi Interchange, and Kalihi/Likelike On-Ramps as they all have high truck volumes. Airport Division also expressed its interest in the Airport Viaduct to Sand Island Direct Ramp due to its proximity to the airport facility.
• 6-5: Nimitz/Sand Island Grade Separation and IC; (B/C II) • 6-6: Airport Viaduct to Sand Island Road Direct Ramp; (B/C VII) • MS-1 (D-1): EB Widening Kualaka‘i Parkway to Waiawa IC; (B/C I) • MS-2 (D-2): WB Widening Waiawa IC to Hālawa IC ; (B/C II) • MS-3A (H): WB Widening Vineyard Boulevard to Middle Street; (B/C II) • MS-2 (D-1): WB Widening from Kualaka‘i Parkway to Waiawa IC; (B/C I)
Final Report: H-1 Corridor Study
H-1 Corridor Study Project – August 2016 Page 34
4.5 COSTS
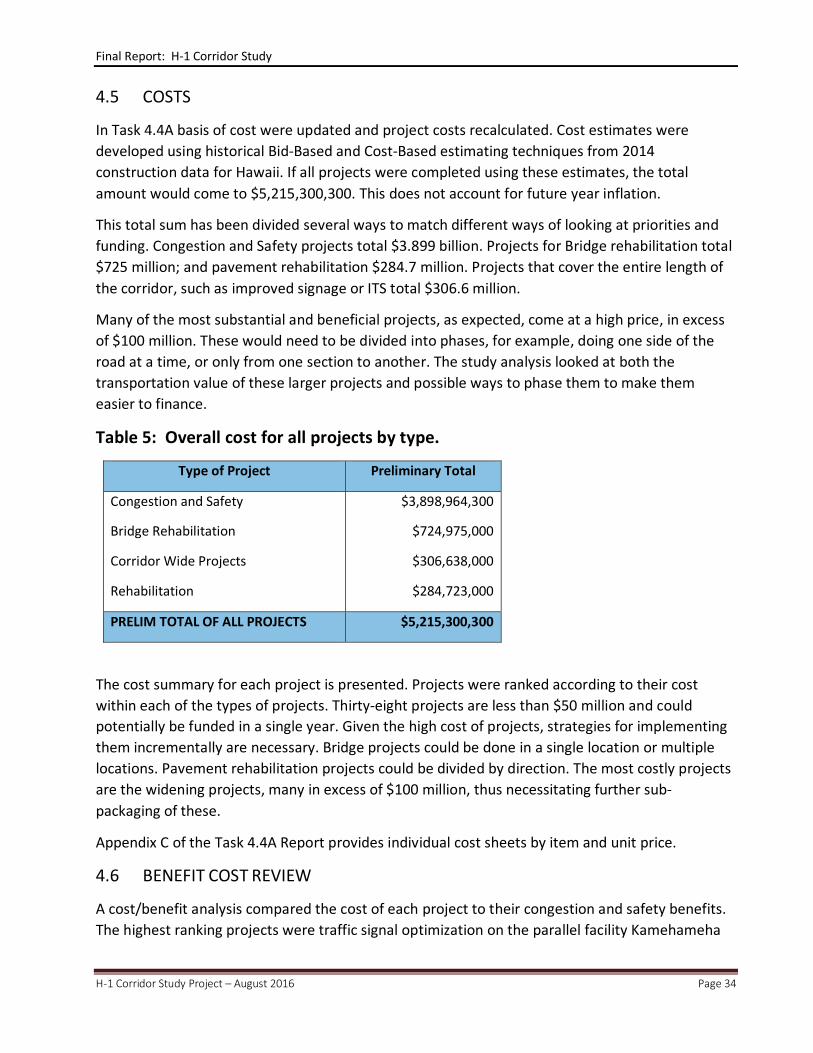
In Task 4.4A basis of cost were updated and project costs recalculated. Cost estimates were developed using historical Bid-Based and Cost-Based estimating techniques from 2014 construction data for Hawaii. If all projects were completed using these estimates, the total amount would come to $5,215,300,300. This does not account for future year inflation.
This total sum has been divided several ways to match different ways of looking at priorities and funding. Congestion and Safety projects total $3.899 billion. Projects for Bridge rehabilitation total $725 million; and pavement rehabilitation $284.7 million. Projects that cover the entire length of the corridor, such as improved signage or ITS total $306.6 million.
Many of the most substantial and beneficial projects, as expected, come at a high price, in excess of $100 million. These would need to be divided into phases, for example, doing one side of the road at a time, or only from one section to another. The study analysis looked at both the transportation value of these larger projects and possible ways to phase them to make them easier to finance.
Table 5: Overall cost for all projects by type.
Type of Project Preliminary Total
Congestion and Safety
Bridge Rehabilitation
Corridor Wide Projects
Rehabilitation
$3,898,964,300
$724,975,000
$306,638,000
$284,723,000
PRELIM TOTAL OF ALL PROJECTS $5,215,300,300
The cost summary for each project is presented. Projects were ranked according to their cost within each of the types of projects. Thirty-eight projects are less than $50 million and could potentially be funded in a single year. Given the high cost of projects, strategies for implementing them incrementally are necessary. Bridge projects could be done in a single location or multiple locations. Pavement rehabilitation projects could be divided by direction. The most costly projects are the widening projects, many in excess of $100 million, thus necessitating further sub-packaging of these.
Appendix C of the Task 4.4A Report provides individual cost sheets by item and unit price.
4.6 BENEFIT COST REVIEW
A cost/benefit analysis compared the cost of each project to their congestion and safety benefits. The highest ranking projects were traffic signal optimization on the parallel facility Kamehameha

Final Report: H-1 Corridor Study
H-1 Corridor Study Project – August 2016 Page 35
Highway and other parallel facilities, ramp metering, and the westbound widening of H-1 from Kualaka‘i to Waiawa Interchange.
Benefit Cost Analysis can be used as a framework for considering a range of benefits and costs in monetary terms. Some benefits are difficult to monetize so B/C is rarely used as the sole tool in decision-making, but it is helpful for making comparisons among many projects.
For this analysis a model was developed using sketch planning and post-processing methods described in an online tool developed by Federal Highways Administration. Results are either positive or negative; positive results indicate greater effectiveness. Negative results indicate decreased effectiveness.
Table 6: Top five projects with the best Benefit/Cost ratios along the corridor.
Project # Project Name B/C Ratio Rank
MS-11 Kamehameha Highway Traffic Signal Optimization 96.4855 2
MS-18 Traffic Signal Optimization on Various Locations Segment 7-10 3.6410 5
C-4 Ramp Metering Freeway to Freeway 1.1347 14
MS-2 (D.1) Westbound Widening of H-1 ( Kualaka‘i Parkway to Waiawa Interchange)
0.18295
C-3 Ramp Metering Outside Core 0.1664 23
The results were different for the Study Area. The top two projects were the same. But they were followed by three individual projects in places three to five: 3-4 Paiwa Street Off-Ramp Widening; 6-1 Westbound H-1 Halawa Interchange Improvements; and 3-3 New Kamehameha Highway WB On-Ramp at Waiawa Interchange.
4.7 ECONOMIC SIGNIFICANCE OF H-1 FREEWAY AND IMPACTS OF EXPENDITURES
MADE ON IT
The economic benefits of the H-1 Freeway was examined using two different methods and study reports were prepared. The first study looked at the social and economic value of the freeway to Honolulu’s economy. The second study applied the State of Hawai‘i Input-Output Model to see the value of construction expenditures in creating jobs and tax revenues.
With a program cost of over $5 billion decisions require careful thought. Put in perspective, according to the Task 4.5 Report on Economic Analysis, the H-1 corridor is an invaluable asset to Oahu. Geographic concentration means that approximately 62% of the O‘ahu population lives along the corridor and 85% of all jobs are located there. Commuters rely on H-1 directly as do the tourism and goods movement sectors of the economy. It is estimated that 90% of all visitor activity is supported by H-1 in whole or in part. Further, the goods movement industry is dependent on H-1 to reach the harbors, ports, and warehouse/distribution facilities.

Final Report: H-1 Corridor Study
H-1 Corridor Study Project – August 2016 Page 36
Benefits of the H-1 Freeway touch all aspects of life: residents, commuters, military, tourists, and freight. The evolution and growth of O‘ahu has been inextricably linked to H-1. Metrics for each of these economic categories were developed from IMPAN (Impact Analysis for Planning) software and other publicly available sources. Economic activity support by H-1 is shown in the table below.
Table 7: Economic activity supported by H-1.
H-1 contributes mightily to the work force. Commuters comprise 42% of the work-related trips in the study area. In addition, H-1 supports over 100,000 visitor related jobs in the Study area. Finally, H-1 supports almost 47,000 job in sectors dependent on or providing goods movement services.
Based on the location of transportation facilities (airports and cruise terminal), and the distribution of accommodation facilities, it is estimated that 90% of all visitor related spending is supported in some capacity by the H-1 facility.
CategoryAmount % of
StudyArea
Amount % of Oahu
TotalGRP $48,000,000,000 100% $58,000,000,000 100% 83%Jobs 422,839 100% 497,741 100% 85%Population 607,305 100% 983,429 100% 62%Trips 2,875,722 100% 3,783,845 100% 76%
GRP $12,200,000,000 25% $13,600,000,000 23% 90%Jobs 178,409 42% 200,197 40% 89%
GRP $19,209,096,689 40% $21,729,439,162 37% 88%Jobs 101,868 24% 146,460 29% 70%
GRP $8,800,000,000 18% $10,500,000,000 18% 84%Jobs 46,821 11% 56,785 11% 82%
Study Area Oahu Study Area as a
% ofOahu
Commuters Supported by H-1
Visitor Economy Supported by H-1
Goods Movement Supported by H-1

Final Report: H-1 Corridor Study
H-1 Corridor Study Project – August 2016 Page 37
Figure 17: Freight traffic loses valuable time sitting in traffic.
H-1 plays a significant role in the movement of goods in the Study area, a role that is critical to the functioning of the economy. This was of particular interest because it is one of the eight national planning factors, and the importance has been further enhanced by MAP-21 federal legislation and reinforced by the recent FAST Act and the national freight goals.
Finally, the H-1 corridor supports operations of the US military on O‘ahu. Five of eleven military bases (Joint Base Pearl Harbor/Hickam, Tripler Medical Center, Fort Shafter, US Coast Guard and Fort DeRussy) are located inside the Study Area. These bases serve a combined personnel force of 48,805 on O‘ahu.
The second economic report (Task 4.5B Report) estimated the economic value of the construction projects. It used the Input-Output (I-O) model developed by the State Department of Business, Economic Development, and Tourism (2007 version). Construction costs were assigned to the “Heavy and Civil Engineering Construction” category; soft costs were allocated to “Architecture/Engineering”, “Professional Services” or “Insurance” category.
National Freight Goals
Improve the contribution of the freight transportation system to economic efficiency, productivity, and competitiveness
• Reduce congestion on the freight transportation system
• Improve the safety, security, and resilience of the freight transportation system
• Improve the state of good repair of the freight transportation system
• Using advance technology, performance management, innovation, competition, and accountability in operating and maintaining the freight transportation system
• Reduce adverse environmental and community impacts of the freight transportation system.

Final Report: H-1 Corridor Study
H-1 Corridor Study Project – August 2016 Page 38
Figure 18 and Figure 19: Joint Base Pearl Harbor and Hickam are accessed from H-1.
A table of results is presented in 2014 dollars. After taking each project cost and putting it into the model, the results are shown as Total Output, Percent on O‘ahu (mostly over 95%), Total Earnings, Total State Taxes, Total Job Years, and Annualized Job Account. Each number is shown as a total and percent on O‘ahu (mostly over 95%). The totals for all projects combined are impressive, although it is unlikely that all would ever be built, it would be a very important stimulus for O‘ahu and the State.
Total Output $ 10,646,300 Total Earnings $ 3,424,000 Total State Taxes $ 464,900 Total Job Years $ 96,108 Annualized Job Count $ 19,222
As a comparison, the EIS for Honolulu Area Rapid Transit (HART) construction projected 91,000 job years, which is slightly lower than the 96,000 projected for the full H-1 construction program. It is most likely that the H-1 projects would be constructed over many years which would alter the labor productivity values in these estimates. But, the big picture conclusion is that in total the proposed projects would represent a major initiative that would provide significant construction benefits to the Hawai‘i economy.
4.8 SURVEYS OF ACCEPTABILITY TO CHANGE
Two surveys were undertaken to determine the importance of H-1 and the desirability of projects under consideration. The first survey was a mail out sent to residents and the second survey was sent to drivers of large vehicles such as buses and trucks. The surveys and the results are presented in the Task 4.6A & B Reports.
The resident survey had 21 questions, including several that were open-ended. People responded enthusiastically, this was clearly a topic of great interest to them. Over 6,500 surveys were sent to

Final Report: H-1 Corridor Study
H-1 Corridor Study Project – August 2016 Page 39
a random sample (1,300 in each of five districts). There were 1,719 usable responses with district response rates of 14.6% to 29.8%. These were tested to make sure they were representative of the characteristics of the populace and demographics such as age and ethnicity were found representative.
The first series of questions asked about the importance of H-1 to the respondent. On an island wide basis, 95% said it was “Somewhat Important”, “Important”, or “Critically Important”; with 58% saying it was “Critical”. Similar responses were found for importance to transport of goods, tourist travel, expansion of the community and importance for commuting. While responses were high across all districts, it was notable that those in the ‘Ewa-Wai‘anae district (64%) said it was critically important. The open-ended questions further reinforced respondents’ belief in the importance of H-1. In open ended responses to the value of H-1, respondents used words like critical, essential, beneficial, crucial, integral, and lifeline.
One hundred percent of respondents live in a household in which at least one person commutes to work or school on H-1 on a daily basis. Seventy percent say they personally commute using H-1. Most make an average of 9.89 trips per week on H-1. Typically this is done in a personal vehicle (93%) with 4% using a bus on H-1. Long commute times are the norm.
People’s perceptions of H-1 are generally favorable. On a seven point scale, 55% give a rating of “Somewhat good”, “Good” or “Very Good” for road lighting condition with some negative ratings due to condition of road surface.
But 75% rate traffic flow as a negative. West side travelers (‘Ewa-Wai‘anae and Waipahu -Aiea) were more likely to negatively rate traffic flow, road surface, road safety, clarity of markings and lighting than other districts. Anecdotally they use words like nightmare, frustrating, bad and getting worse.
Heavy use of the freeway means there is a continuous need for maintenance. Respondents rated repair and maintenance of the road surface, adding lanes and building new interchanges as their top three priorities. Given this, a set of questions was posed to gauge the acceptability of additional disruption due to roadwork. The results are somewhat surprising. Island-wide 81% felt repairing road surface is worth the disruption; 58% felt that adding lanes was worth disruption; 49% felt repairing bridges was worth it; 40% felt building new interchanges was worth the disruption; and 24% felt improving signage was worth disruption. There were variations in responses by districts, but the patterns were similar.
The Driver Survey was completed by 503 drivers and 40 supervisors/dispatchers from 74 companies that agreed to participate (215 companies were asked). There were 13 questions which focused on driver behavior, quality of driving experience, importance of H-1, and priorities for improvements. The supervisors (89%) said that H-1 was critical to the success of their business; 43% strongly agreed with that statement; 89% said H-1 is a major economic asset to O‘ahu; 91% called it a safety artery in case of disaster; and 90% said it was a major asset to O‘ahu residents. Drivers agreed with the same assessments, although with slight lower percentages (high sixties).

Final Report: H-1 Corridor Study
H-1 Corridor Study Project – August 2016 Page 40
Most respondents said H-1 was the most efficient route to the most destinations. Most called it the major thoroughfare for their travel. This sample of respondents use H-1 at all times of day and all days of the week. The heaviest segments of roadway used are from Pearl City to Middle Street and from Middle Street to Downtown. Over half say they use H-1 regardless of traffic or construction conditions; but the other half schedule driver use to avoid congestion (especially during peak hours) or construction disruptions.
Regarding road conditions, just under half gave a good or better rating to ten different road condition attributes. Road signage gets the highest ratings. Accessibility to on and off ramps is favorable as is the turning radius required for trucks. Notification of road work and sight distances are generally acceptable and rated well. Drivers and supervisors felt the most important projects for H-1 are to repair the road surface and widen lanes. After that, adding lanes, constructing new interchanges, and repairing bridges were of importance.

Final Report: H-1 Corridor Study
H-1 Corridor Study Project – August 2016 Page 41
Program Funding The Task 4.4B Report tackles the challenging issue of how to address the broad and costly needs that have been identified during the course of this 3 year study. The study begins with a review of the funding environment at both the federal and state levels. While all the projects are available for federal formula funds as well as for state CIP, there is competition for these dollars with other state and county projects. Working with HDOT managers of the Statewide Transportation Improvement Program (STIP) a working estimate was made of the funds that might reasonably be assumed to be available for Oahu projects as shown in the table below.
Table 8: Federal Funds available for Oahu projects.
Federal State Cumulative TotalSingle Year $67-76 M $20-22 M State CIP
$36 M SMP $123-134 M
Short Term (Five year) 2016-2020
$335-380 M $100-110M State CIP$180 M SMP
$615-670 M
Mid Term (Ten Year) 2021-2026
$670-760 M $200-220 M State CIP$360 M SMP
$1.23-1.34 B
Long Term (Twenty years) 2027-2036)
$1.34-1.52 B $400-440 M State CIP$720 M SMP
$2.46-2.68 B
These dollar totals are shown for a single year, for the short term (five year period from 2016-2020), the mid-term (ten year period 2021-2026) and the long term (twenty year period from 2016-2036). Note that these are shown as cumulative, and not additive.
If there is no change in funding available for H-1 projects, then the most that can be expected is to undertake projects for Safety and System Preservation (also called Tier I projects). The projects for addressing congestion and capacity increase (Tier II projects) will require new sources of revenue.
Table 9: H-1 Proposed Projects by Tier and Category
Category CostTier I - Mandated, Safety, and System Preservation ProjectsThis Category includes Bridge Replacement and Pavement Rehabilitation Projects.
$1,617,060,000
Tier II Congestion Relief, Modernization and Capacity Increase Projects $3,598,240,300
Total Cost $5,215,300,300
Given this funding picture, the heart of the Task 4.4B report seeks to offer alternate methods for prioritizing projects. The top projects are listed in order of the types of benefits they provide:

Final Report: H-1 Corridor Study
H-1 Corridor Study Project – August 2016 Page 42
• Congestion Relief • Traffic Safety • Asset Management • Goods Movement • Constructability and Maintenance of Traffic • Right of Way Takings
All projects are shown according to their Benefit/Cost ratio, which is a method that allows for comparison of measurable benefits against cost and it provides different choices than the benefits rankings alone. The top grouping of projects with the highest B/C ratio includes nine projects which total $1,337,565,300. These are in order of B/C ratio:
• MS-11: Kamehameha Highway Traffic Signal Optimization • MS-18: Traffic Signal Optimization on surface streets at four areas • C-4: Ramp metering freeway to freeway • MS-2 (D-1): Westbound widening from Kualaka‘i Parkway to Waiawa IC (divided into four
sections) • C-3: Ramp metering outside the core area • 5-6: New Kaonohi Street Interchange • MS-1 (D-1): Eastbound Widening from Kualaka‘i Parkway to Waiawa IC (divided into four
sections) • MS-4A (H): Eastbound Widening from Ola Lane to Vineyard Boulevard South (four
sections) • MS-1 (D-2): Eastbound widening Waiawa IC to Hālawa IC (divided into seven sections)
Thirty-two other projects had positive B/C ratios. Twenty-one had a break even B/C. Ten had a negative B/C ratio. One had various B/C ratios.
The final method used to help categorize projects was to classify them as Short Term, Mid-Term, or Long Term. This has been done previously and was updated in the Task 4.4B Report.
• Short term List (those which can be undertaken within the next 2-3 years subject to availability of funding and prioritization) contains 24 projects whose cost totals $432,621,300
• Mid-term List (those which may require an EA or EIS and are either in the RTP or could be amended into the RTP; provide high benefits) contains 19 projects, nine of these bridge projects whose cost totals $3,172,644,000.
• Long Term List (those with more complex environmental issues, may require rights of way and often have high cost) contains 19 projects whose cost totals $1,610,035,000.
The value of sorting the projects according to their benefits and their ability to be undertaken in the short, mid or long term is that it can set a direction for HDOT action. Once priorities have been agreed upon, the top short term projects can begin to be programmed. This could include the asset protection/pavement management and bridge rehabilitation projects.

Final Report: H-1 Corridor Study
H-1 Corridor Study Project – August 2016 Page 43
The top mid-term and long term projects can begin their environmental studies, and then where required, land acquisition can be started (following completion of environmental clearance). These will often be the capacity improvement projects. This will take 3-7 years, so these projects should be started as early as possible.
In any case, H-1 will take major investments for both asset management and capacity improvement. The combined federal and state funds currently available on O‘ahu annually is $123 – 134 million. This will be sufficient for only asset management, but not for congestion and safety projects identified in this study. New sources of revenue will be necessary to improve this essential facility. As the department and state administration continue their quest for increasing the state highway fund revenues, it is hoped that this report will provide valuable data driven analysis and information for making hard choices.
Figure 20: H-1 Embraces Oahu's people and needs round the clock, year after year.

Final Report: H-1 Corridor Study
H-1 Corridor Study Project – August 2016 Page 44
THIS PAGE INTENTIONALLY LEFT BLANK

Final Report: H-1 Corridor Study
H-1 Corridor Study Project – August 2016 Page 45
REFERENCES Technical Reports Prepared as Part of the H-1 Corridor Study
Key Transportation Problems Identification, Task 1.3 (October 2013)
Measures of Effectiveness (MOEs), Task 1.6 (October 2013)
Preliminary Candidate Improvement Projects, Task 1.6 (January 2014)
Phase 2 Data Plan, Task 2.3 (July 2016)
Travel Demand Model Review, Task 2.4 (February 2014)
Traffic Data Collection, Task 2.3 (February 2014)
Traffic Performance Assessment of Candidate Improvement Projects, Task 2.6 (July 2014)
Assessment of Transportation Benefits and Preferred Improvement Projects, Task 3.0, (December 2014)
Special Task 4 Report on Projects Considered by Phase and Reference Chart (May 2016)
Feasibility of Projects, Task 4.1 (September 2015)
Assessment of Environmental Issues, Task 4.2 (September 2015)
Project Prioritization, Task 4.3 (December 2015)
Costs and Benefits of H-1 Improvements, Task 4.4A (May 2016)
Program Funding Review, Task 4.4B (July 2016)
Economic Analysis, Task 4.5 (March 2016)
Input Output Analysis of Projects, Task 4.5B (January 2016)
Results of Residential Survey, Task 4.6A (October 2015)
Results of Driver Survey, Task 4.6B (October 2015)

Final Report: H-1 Corridor Study
H-1 Corridor Study Project – August 2016 Page 46
THIS PAGE INTENTIONALLY LEFT BLANK

Final Report: H-1 Corridor Study
H-1 Corridor Study Project – August 2016 Page 47
Appendix 1

Final Report: H-1 Corridor Study
H-1 Corridor Study Project – August 2016 Page 48

Final Report: H-1 Corridor Study
H-1 Corridor Study Project – August 2016 Page 49
THIS PAGE INTENTIONALLY LEFT BLANK