1.6_bzpc4e
TRANSCRIPT

8/3/2019 1.6_bzpc4e
http://slidepdf.com/reader/full/16bzpc4e 1/43
Section 1.6Transformation of Functions

8/3/2019 1.6_bzpc4e
http://slidepdf.com/reader/full/16bzpc4e 2/43
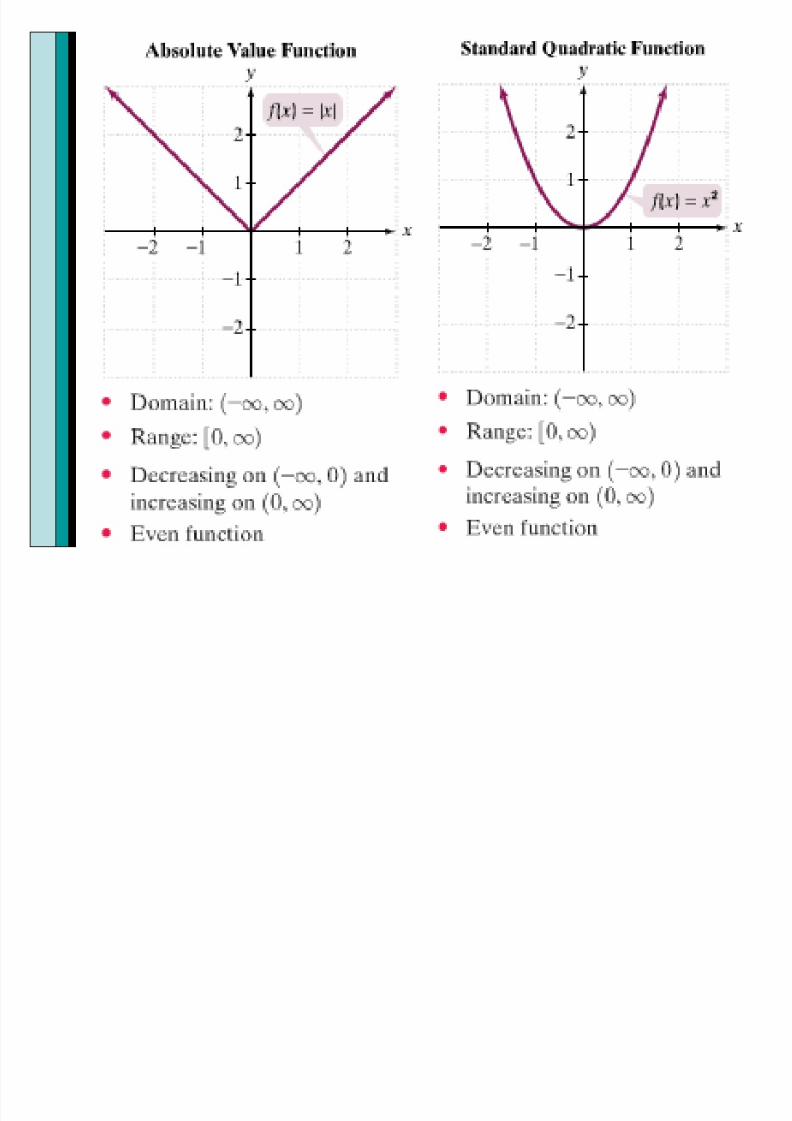
Graphs of Common Functions

8/3/2019 1.6_bzpc4e
http://slidepdf.com/reader/full/16bzpc4e 3/43
8/3/2019 1.6_bzpc4e
http://slidepdf.com/reader/full/16bzpc4e 4/43

8/3/2019 1.6_bzpc4e
http://slidepdf.com/reader/full/16bzpc4e 5/43

8/3/2019 1.6_bzpc4e
http://slidepdf.com/reader/full/16bzpc4e 6/43
−4 −3 −2 −1 1 2 3 4 5
−4
−3
−2
−1
1
2
3
4
x
y
Reciprocal Function
( ) ( )( ) ( )
( ) ( )
Domain: - ,0 0,Range: - ,0 0,
Decreasing on - ,0 0,
Odd function
and
∞ ∪ ∞
∞ ∪ ∞
∞ ∞
1( ) f x
x=

8/3/2019 1.6_bzpc4e
http://slidepdf.com/reader/full/16bzpc4e 7/43
Vertical Shifts

8/3/2019 1.6_bzpc4e
http://slidepdf.com/reader/full/16bzpc4e 8/43
( ) ( )
( ) ( )
Vertical Shifts
Let be a function and be a positive real number.
The graph of is the graph of shifted units
vertically upward.
The graph of is the graph of shifted
f c
y f x c y f x c
y f x c y f x c
• = + =
• = − = units
vertically downward.

8/3/2019 1.6_bzpc4e
http://slidepdf.com/reader/full/16bzpc4e 9/43
Vertical Shifts

8/3/2019 1.6_bzpc4e
http://slidepdf.com/reader/full/16bzpc4e 10/43

8/3/2019 1.6_bzpc4e
http://slidepdf.com/reader/full/16bzpc4e 11/43
Example
Use the graph of f(x)=|x| to obtain g(x)=|x|-2
−4 −3 −2 −1 1 2 3 4 5
−4
−3
−2
−1
1
2
3
4
x
y

8/3/2019 1.6_bzpc4e
http://slidepdf.com/reader/full/16bzpc4e 12/43
Horizontal Shifts
8/3/2019 1.6_bzpc4e
http://slidepdf.com/reader/full/16bzpc4e 13/43
( ) ( )
( ) ( )
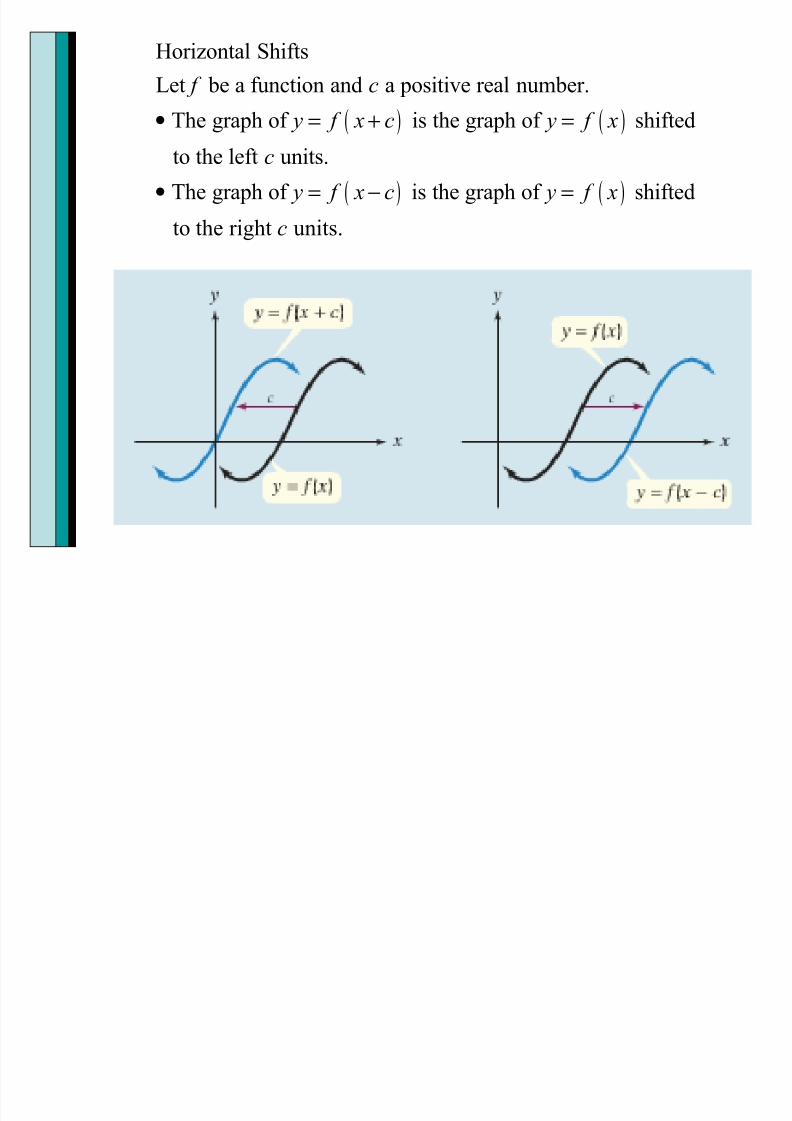
Horizontal Shifts
Let be a function and a positive real number.
The graph of is the graph of shifted
to the left units.
The graph of is the graph of shifted
to the
f c
y f x c y f x
c
y f x c y f x
• = + =
• = − =
right units.c

8/3/2019 1.6_bzpc4e
http://slidepdf.com/reader/full/16bzpc4e 14/43
Horizontal Shifts

8/3/2019 1.6_bzpc4e
http://slidepdf.com/reader/full/16bzpc4e 15/43
Example
Use the graph of f(x)=x2
to obtain g(x)=(x+1)2
−4 −3 −2 −1 1 2 3 4 5
−4
−3
−2
−1
1
2
3
4
x
y

8/3/2019 1.6_bzpc4e
http://slidepdf.com/reader/full/16bzpc4e 16/43
Combining Horizontal and Vertical Shifts

8/3/2019 1.6_bzpc4e
http://slidepdf.com/reader/full/16bzpc4e 17/43
Example
Use the graph of f(x)=x2
to obtain g(x)=(x+1)2
+2
−4 −3 −2 −1 1 2 3 4 5
−4
−3
−2
−1
1
2
3
4
x
y

8/3/2019 1.6_bzpc4e
http://slidepdf.com/reader/full/16bzpc4e 18/43
Reflections of Graphs

8/3/2019 1.6_bzpc4e
http://slidepdf.com/reader/full/16bzpc4e 19/43
( ) ( )
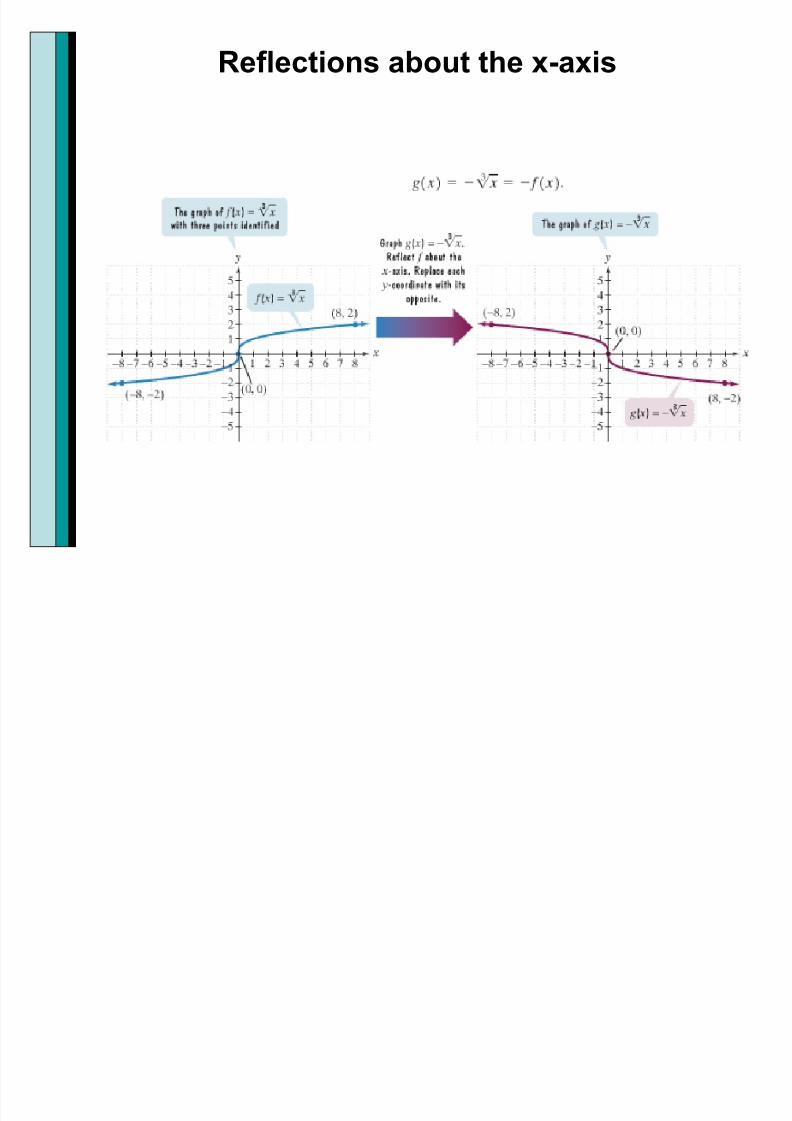
Refection about the -Axis
The graph of is the graph of reflectedabout the -axis.
x
y f x y f x x
= − =
8/3/2019 1.6_bzpc4e
http://slidepdf.com/reader/full/16bzpc4e 20/43
Reflections about the x-axis

8/3/2019 1.6_bzpc4e
http://slidepdf.com/reader/full/16bzpc4e 21/43
( ) ( )
Reflection about the y-Axis
The graph of is the graph of reflected
about - axis.
y f x y f x
y
= − =

8/3/2019 1.6_bzpc4e
http://slidepdf.com/reader/full/16bzpc4e 22/43
Example
Use the graph of f(x)=x3
to obtain the graphof g(x)= (-x)3.
−4 −3 −2 −1 1 2 3 4 5
−4
−3
−2
−1
1
2
3
4
x
y

8/3/2019 1.6_bzpc4e
http://slidepdf.com/reader/full/16bzpc4e 23/43
Example
−4 −3 −2 −1 1 2 3 4 5
−4
−3
−2
−1
1
2
3
4
x
y
Use the graph of f(x)= x to graph g(x)=- x

8/3/2019 1.6_bzpc4e
http://slidepdf.com/reader/full/16bzpc4e 24/43
Vertical Stretching and Shrinking

8/3/2019 1.6_bzpc4e
http://slidepdf.com/reader/full/16bzpc4e 25/43

8/3/2019 1.6_bzpc4e
http://slidepdf.com/reader/full/16bzpc4e 26/43
Vertically Shrinking

8/3/2019 1.6_bzpc4e
http://slidepdf.com/reader/full/16bzpc4e 27/43
Vertically Stretching
−4 −3 −2 −1 1 2 3 4
−4
−3
−2
−1
1
2
3
4
x
y
−4 −3 −2 −1 1 2 3 4 5
−4
−3
−2
−1
1
2
3
4
x
y
Graph of f(x)=x3 Graph of
g(x)=3x3
This is vertical stretching – each y coordinate is multiplied by 3 to
stretch the graph.

8/3/2019 1.6_bzpc4e
http://slidepdf.com/reader/full/16bzpc4e 28/43
Example
Use the graph of f(x)=|x| to graph g(x)= 2|x|
−4 −3 −2 −1 1 2 3 4 5
−4
−3
−2
−1
1
2
3
4
x
y

8/3/2019 1.6_bzpc4e
http://slidepdf.com/reader/full/16bzpc4e 29/43
Horizontal Stretching and Shrinking

8/3/2019 1.6_bzpc4e
http://slidepdf.com/reader/full/16bzpc4e 30/43

8/3/2019 1.6_bzpc4e
http://slidepdf.com/reader/full/16bzpc4e 31/43
Horizontal Shrinking

8/3/2019 1.6_bzpc4e
http://slidepdf.com/reader/full/16bzpc4e 32/43
Horizontal Stretching

8/3/2019 1.6_bzpc4e
http://slidepdf.com/reader/full/16bzpc4e 33/43
Example
−4 −3 −2 −1 1 2 3 4 5
−4
−3
−2
−1
1
2
3
4
x
y
Use the graph of f(x)= to obtain the
1graph of g(x)= 3
x
x

8/3/2019 1.6_bzpc4e
http://slidepdf.com/reader/full/16bzpc4e 34/43
Sequences of Transformations
8/3/2019 1.6_bzpc4e
http://slidepdf.com/reader/full/16bzpc4e 35/43
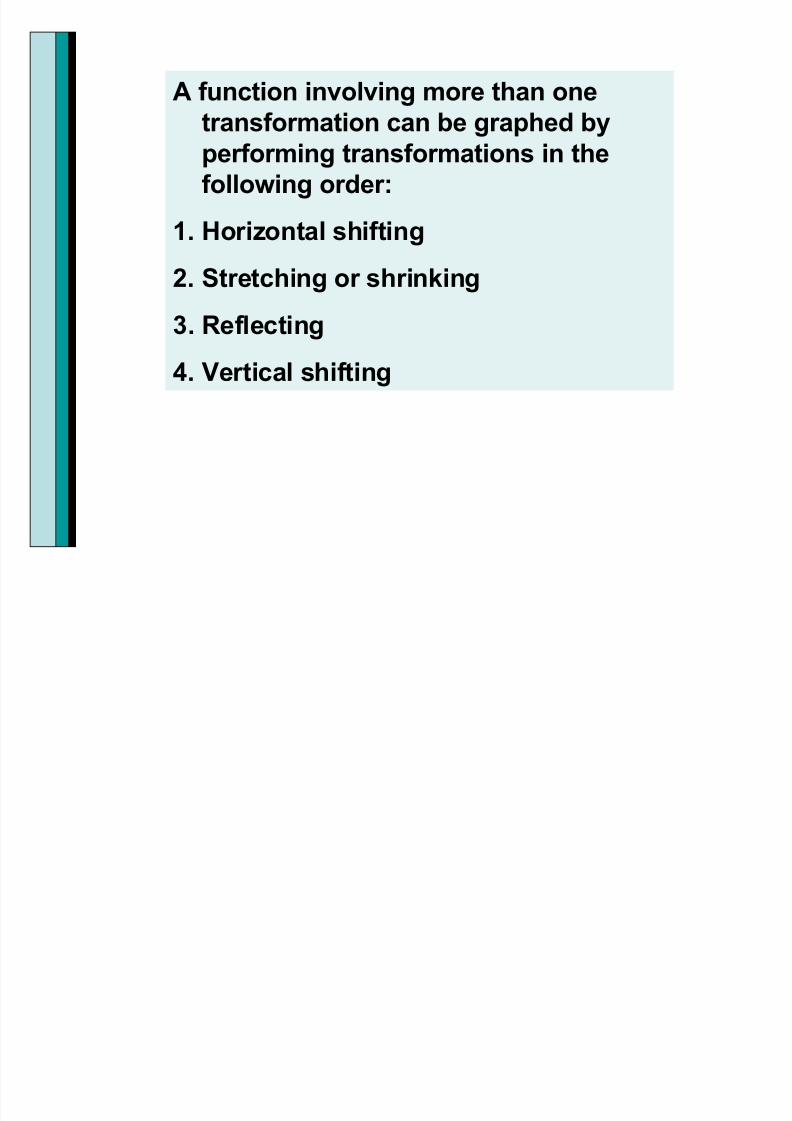
A function involving more than one
transformation can be graphed by
performing transformations in the
following order:
1. Horizontal shifting
2. Stretching or shrinking
3. Reflecting
4. Vertical shifting

8/3/2019 1.6_bzpc4e
http://slidepdf.com/reader/full/16bzpc4e 36/43
Summary of Transformations

8/3/2019 1.6_bzpc4e
http://slidepdf.com/reader/full/16bzpc4e 37/43
A Sequence of Transformations
Move the graph
to the left 3 units
Starting graph.
Stretch the graphvertically by 2.
Shift down 1 unit.

8/3/2019 1.6_bzpc4e
http://slidepdf.com/reader/full/16bzpc4e 38/43
Example
−4 −3 −2 −1 1 2 3 4
−2
−1
1
2
3
4
x
y
1
Given the graph of f(x) below, graph ( 1).2 f x−
8/3/2019 1.6_bzpc4e
http://slidepdf.com/reader/full/16bzpc4e 39/43
Example
−4 −3 −2 −1 1 2 3 4
−2
−1
1
2
3
4
x
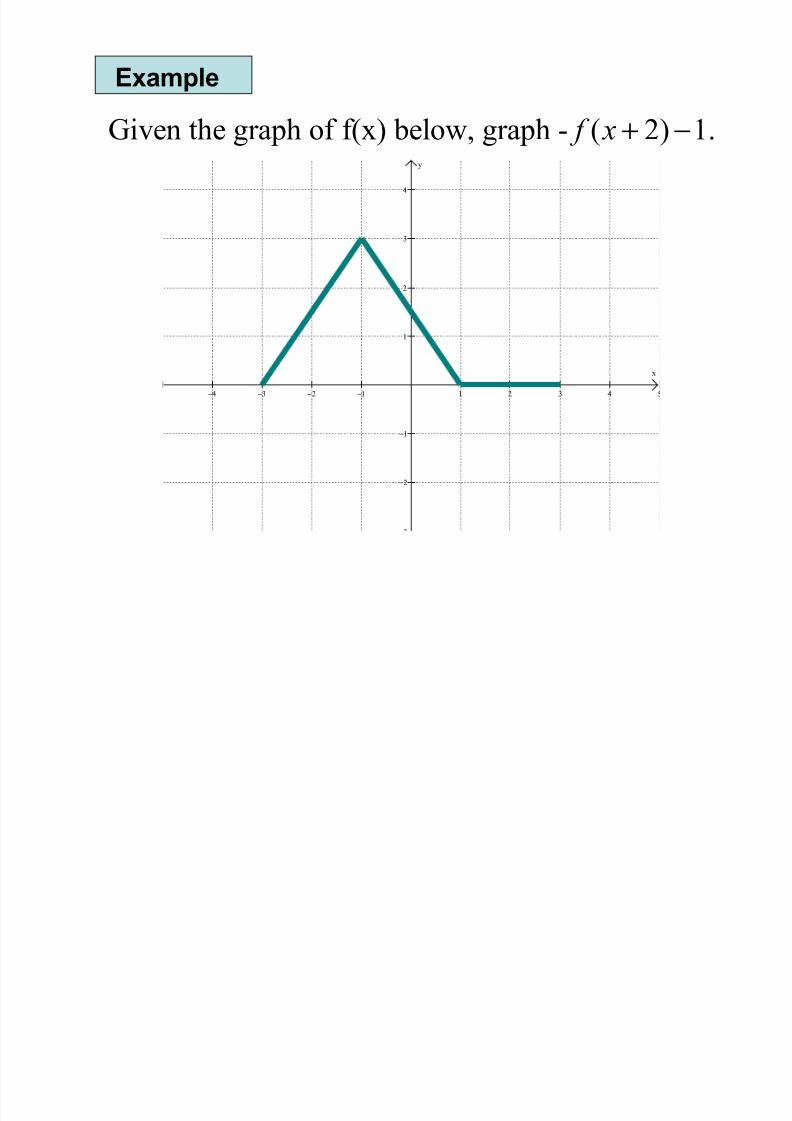
yGiven the graph of f(x) below, graph - ( 2) 1. f x
+ −

8/3/2019 1.6_bzpc4e
http://slidepdf.com/reader/full/16bzpc4e 40/43
Example
Given the graph of f(x) below, graph 2 ( ) 1. f x− −
5

8/3/2019 1.6_bzpc4e
http://slidepdf.com/reader/full/16bzpc4e 41/43
(a)
(b)(c)
(d)
4 −3 −2 −1 1 2 3 4 5 6 7 8 9 1
−3
−2
−1
1
2
3
4
x
Use the graph of f(x)= x to graph g(x)= -x.The graph of g(x) will appear in which quadrant?
Quadrant I
Quadrant IIQuadrant III
Quadrant IV
( ) f x x=
5

8/3/2019 1.6_bzpc4e
http://slidepdf.com/reader/full/16bzpc4e 42/43
(a)(b)
(c)
(d)
−1 1 2 3 4 5 6 7 8
−5
−4
−3
−2
−1
1
2
3
4
Write the equation of the given graph g(x).
The original function was f(x) =x2
g(x)
2
2
2
2
( ) ( 4) 3( ) ( 4) 3
( ) ( 4) 3
( ) ( 4) 3
g x x g x x
g x x
g x x
= + −
= − −
= + +
= − +

8/3/2019 1.6_bzpc4e
http://slidepdf.com/reader/full/16bzpc4e 43/43
(a)(b)
(c)
Write the equation of the given graph g(x).
The original function was f(x) =|x|
g(x)
( ) 4( ) 4
( ) 4
g x x g x x
g x x
= − −
= − −
= − +
5 −4 −3 −2 −1 1 2 3 4 5 6 7 8 9 1
−7
−6
−5
−4
−3
−2
−1
1
2
x