16.clinical biochemistry and metabolism
TRANSCRIPT
427
16 Biochemical investigations 428
Integrated water and electrolyte balance 429Water and electrolyte distribution 429Investigation of water and electrolytes 429
Disorders of sodium balance 430Functional anatomy and physiology of renal
sodium handling 430Presenting problems in disorders of sodium
balance 432Sodium depletion 432Sodium excess 434
Diuretic therapy 434
Disorders of water balance 436Functional anatomy and physiology of renal
water handling 436Presenting problems in disorders of water
balance 437Hyponatraemia 437Hypernatraemia 439
Disorders of potassium balance 439Functional anatomy and physiology of renal
potassium handling 440Presenting problems in disorders of potassium
balance 440Hypokalaemia 440Hyperkalaemia 442
Clinical biochemistry and metabolism
Disorders of amino acid metabolism 449
Disorders of carbohydrate metabolism 449
Disorders of complex lipid metabolism 450
Disorders of blood lipids and lipoproteins 450Functional anatomy, physiology and
investigation of lipid metabolism 450Presenting problems in disorders of lipids 453
Disorders of haem synthesis – the porphyrias 458
M.J. FieldL. Burnett
D.R. SullivanP. Stewart
Disorders of acid–base balance 443Functional anatomy and physiology of
acid–base homeostasis 443Presenting problems in disorders of acid–base
balance 444Metabolic acidosis 445Metabolic alkalosis 446Respiratory acidosis 447Respiratory alkalosis 447Mixed acid-base disorders 447
Disorders of divalent ion metabolism 447Functional anatomy and physiology of
magnesium metabolism 447Presenting problems in disorders of
magnesium metabolism 448Hypomagnesaemia 448Hypermagnesaemia 448
Functional anatomy and physiology of phosphate metabolism 448
Presenting problems in disorders of phosphate metabolism 448Hypophosphataemia 448Hyperphosphataemia 449
CliniCal bioChemistry and metabolism
16
428
There is a worldwide trend towards increased use of laboratory-based diagnostic investigations, and biochem-ical investigations in particular. In the health-care sys-tems of developed countries, it has been estimated that 60–70% of all critical decisions taken in regard to patients, and over 90% of data stored in electronic medical records systems, involve a laboratory service or result.
This chapter covers a diverse group of disorders affecting adults not considered elsewhere in this book, whose primary manifestation is in abnormalities of biochemistry laboratory results, or whose underlying pathophysiology involves disturbance in specific bio-chemical pathways.
BIOCHEMICAL INVESTIGATIONS
There are three broad reasons why a clinician may request a biochemical laboratory investigation:• to screen an asymptomatic subject for the presence
of disease• to assist in diagnosis of a patient’s presenting
complaint• to monitor changes in test results, as a marker of
disease progression or response to treatment.Contemporary medical practice has become increas-
ingly reliant on laboratory investigation, and in par-ticular, on biochemical investigation. This has been associated with extraordinary improvements in the
analytical capacity and speed of laboratory instrumenta-tion and the following operational trends:• Large central biochemistry laboratories feature
extensive use of automation and information technology. Specimens are transported from clinical areas to the laboratory using high-speed transport systems (such as pneumatic tubes) and identified with machine-readable labels (such as bar codes). Laboratory instruments have been miniaturised and integrated with robot transport systems to enable multiple rapid analyses of a single sample. Statistical process control techniques are used to assure the quality of analytical results, and increasingly to monitor other aspects of the laboratory, such as the time taken to complete the analysis (‘turn-around time’).
• Point-of-care testing (POCT) brings selected laboratory analytical systems into clinical areas, to the patient’s bedside or even connected to an individual patient. These systems allow the clinician to receive results almost instantaneously for immediate treatment of the patient, although often with less precision or at greater cost than using a central laboratory.
• The diversity of analyses has widened considerably with the introduction of many techniques borrowed from the chemical or other industries (Box 16.1).Good medical practice involves the appropriate
ordering of laboratory investigations and correct
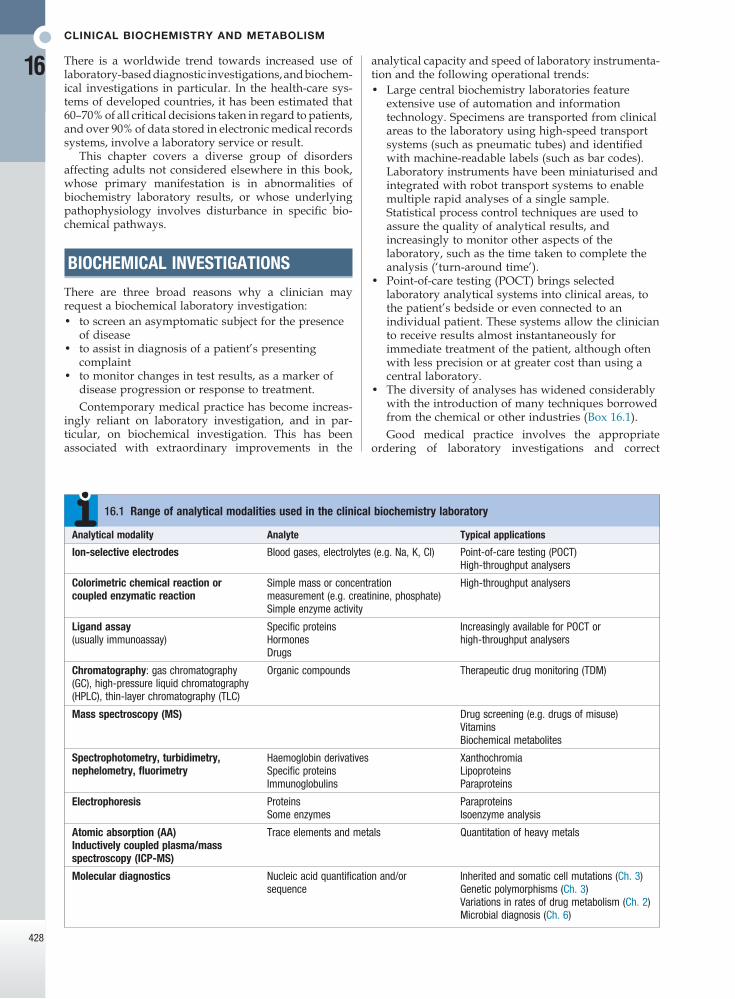
Analytical modality Analyte Typical applications
Ion-selective electrodes Blood gases, electrolytes (e.g. Na, K, Cl) Point-of-care testing (POCT)High-throughput analysers
Colorimetric chemical reaction or coupled enzymatic reaction
Simple mass or concentration measurement (e.g. creatinine, phosphate)Simple enzyme activity
High-throughput analysers
Ligand assay(usually immunoassay)
Specific proteinsHormonesDrugs
Increasingly available for POCT or high-throughput analysers
Chromatography: gas chromatography (GC), high-pressure liquid chromatography (HPLC), thin-layer chromatography (TLC)
Organic compounds Therapeutic drug monitoring (TDM)
Mass spectroscopy (MS) Drug screening (e.g. drugs of misuse)VitaminsBiochemical metabolites
Spectrophotometry, turbidimetry, nephelometry, fluorimetry
Haemoglobin derivativesSpecific proteinsImmunoglobulins
XanthochromiaLipoproteinsParaproteins
Electrophoresis ProteinsSome enzymes
ParaproteinsIsoenzyme analysis
Atomic absorption (AA)Inductively coupled plasma/mass spectroscopy (ICP-MS)
Trace elements and metals Quantitation of heavy metals
Molecular diagnostics Nucleic acid quantification and/or sequence
Inherited and somatic cell mutations (Ch. 3)Genetic polymorphisms (Ch. 3)Variations in rates of drug metabolism (Ch. 2)Microbial diagnosis (Ch. 6)
16.1 Range of analytical modalities used in the clinical biochemistry laboratory
Integrated water and electrolyte balance
16
429
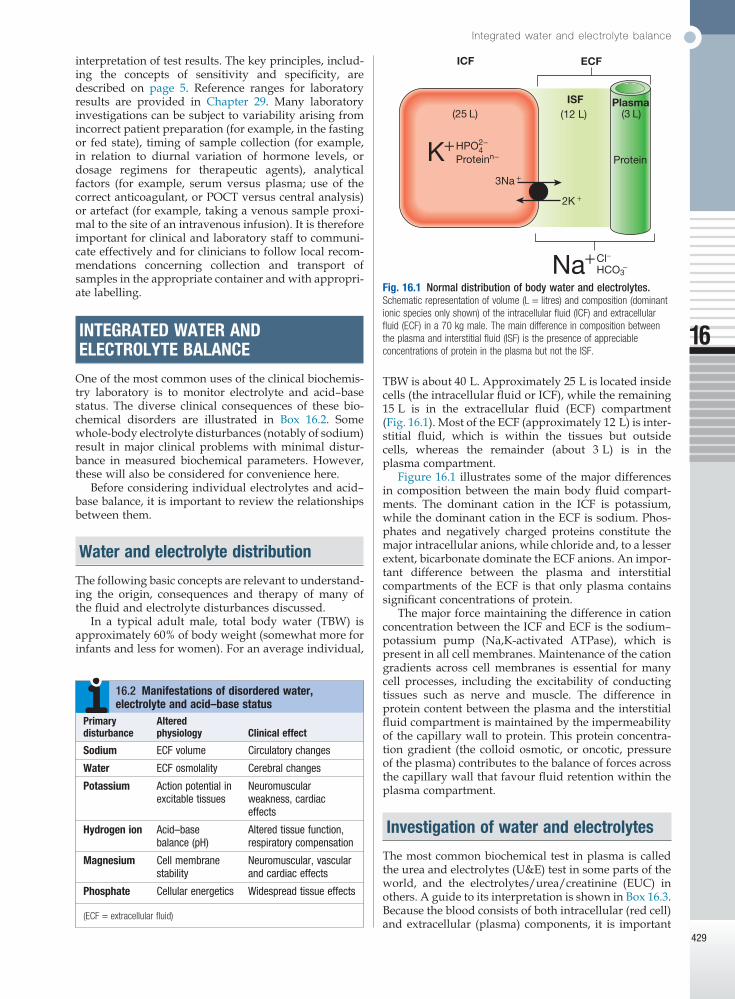
TBW is about 40 L. Approximately 25 L is located inside cells (the intracellular fluid or ICF), while the remaining 15 L is in the extracellular fluid (ECF) compartment (Fig. 16.1). Most of the ECF (approximately 12 L) is inter-stitial fluid, which is within the tissues but outside cells, whereas the remainder (about 3 L) is in the plasma compartment.
Figure 16.1 illustrates some of the major differences in composition between the main body fluid compart-ments. The dominant cation in the ICF is potassium, while the dominant cation in the ECF is sodium. Phos-phates and negatively charged proteins constitute the major intracellular anions, while chloride and, to a lesser extent, bicarbonate dominate the ECF anions. An impor-tant difference between the plasma and interstitial compartments of the ECF is that only plasma contains significant concentrations of protein.
The major force maintaining the difference in cation concentration between the ICF and ECF is the sodium–potassium pump (Na,K-activated ATPase), which is present in all cell membranes. Maintenance of the cation gradients across cell membranes is essential for many cell processes, including the excitability of conducting tissues such as nerve and muscle. The difference in protein content between the plasma and the interstitial fluid compartment is maintained by the impermeability of the capillary wall to protein. This protein concentra-tion gradient (the colloid osmotic, or oncotic, pressure of the plasma) contributes to the balance of forces across the capillary wall that favour fluid retention within the plasma compartment.
Investigation of water and electrolytes
The most common biochemical test in plasma is called the urea and electrolytes (U&E) test in some parts of the world, and the electrolytes/urea/creatinine (EUC) in others. A guide to its interpretation is shown in Box 16.3. Because the blood consists of both intracellular (red cell) and extracellular (plasma) components, it is important
interpretation of test results. The key principles, includ-ing the concepts of sensitivity and specificity, are described on page 5. Reference ranges for laboratory results are provided in Chapter 29. Many laboratory investigations can be subject to variability arising from incorrect patient preparation (for example, in the fasting or fed state), timing of sample collection (for example, in relation to diurnal variation of hormone levels, or dosage regimens for therapeutic agents), analytical factors (for example, serum versus plasma; use of the correct anticoagulant, or POCT versus central analysis) or artefact (for example, taking a venous sample proxi-mal to the site of an intravenous infusion). It is therefore important for clinical and laboratory staff to communi-cate effectively and for clinicians to follow local recom-mendations concerning collection and transport of samples in the appropriate container and with appropri-ate labelling.
INTEGRATED WATER AND ELECTROLYTE BALANCE
One of the most common uses of the clinical biochemis-try laboratory is to monitor electrolyte and acid–base status. The diverse clinical consequences of these bio-chemical disorders are illustrated in Box 16.2. Some whole-body electrolyte disturbances (notably of sodium) result in major clinical problems with minimal distur-bance in measured biochemical parameters. However, these will also be considered for convenience here.
Before considering individual electrolytes and acid–base balance, it is important to review the relationships between them.
Water and electrolyte distribution
The following basic concepts are relevant to understand-ing the origin, consequences and therapy of many of the fluid and electrolyte disturbances discussed.
In a typical adult male, total body water (TBW) is approximately 60% of body weight (somewhat more for infants and less for women). For an average individual,
Fig. 16.1 Normal distribution of body water and electrolytes. Schematic representation of volume (L = litres) and composition (dominant ionic species only shown) of the intracellular fluid (ICF) and extracellular fluid (ECF) in a 70 kg male. The main difference in composition between the plasma and interstitial fluid (ISF) is the presence of appreciable concentrations of protein in the plasma but not the ISF.
ICF
ISF Plasma
Protein
ECF
Cl−HCO3
−
HPO42 −
Proteinn −
2K +
3Na +
Na+
K+
(12 L) (3 L)(25 L)
Primary disturbance
Altered physiology Clinical effect
Sodium ECF volume Circulatory changes
Water ECF osmolality Cerebral changes
Potassium Action potential in excitable tissues
Neuromuscular weakness, cardiac effects
Hydrogen ion Acid–base balance (pH)
Altered tissue function, respiratory compensation
Magnesium Cell membrane stability
Neuromuscular, vascular and cardiac effects
Phosphate Cellular energetics Widespread tissue effects
(ECF = extracellular fluid)
16.2 Manifestations of disordered water, electrolyte and acid–base status
CliniCal bioChemistry and metabolism
16
430
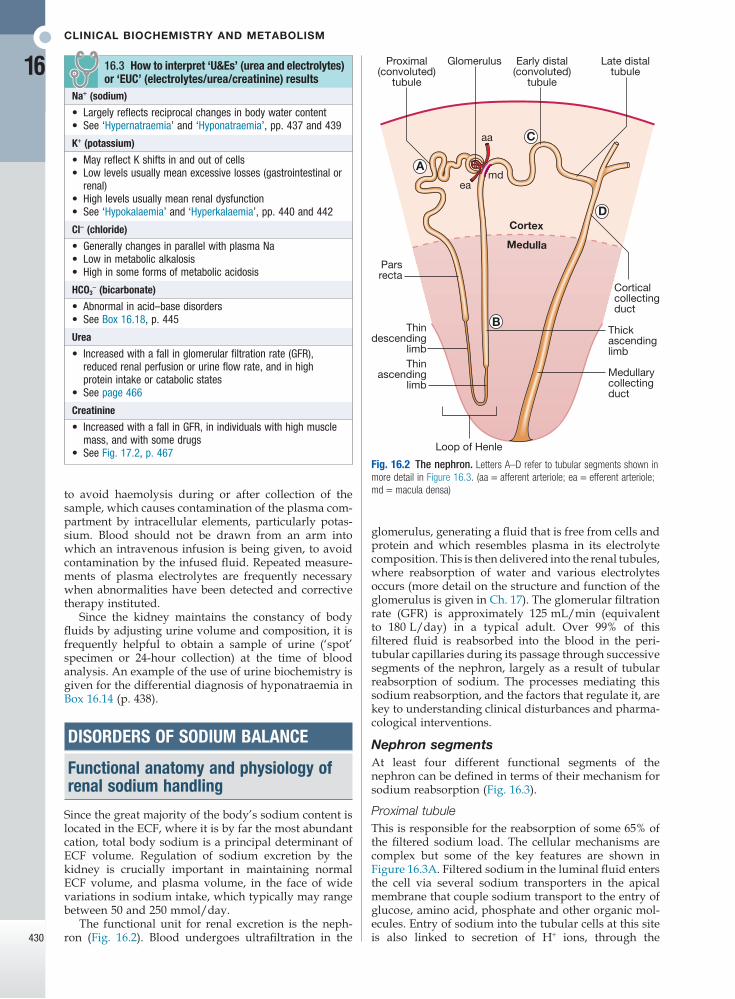
glomerulus, generating a fluid that is free from cells and protein and which resembles plasma in its electrolyte composition. This is then delivered into the renal tubules, where reabsorption of water and various electrolytes occurs (more detail on the structure and function of the glomerulus is given in Ch. 17). The glomerular filtration rate (GFR) is approximately 125 mL/min (equivalent to 180 L/day) in a typical adult. Over 99% of this filtered fluid is reabsorbed into the blood in the peri-tubular capillaries during its passage through successive segments of the nephron, largely as a result of tubular reabsorption of sodium. The processes mediating this sodium reabsorption, and the factors that regulate it, are key to understanding clinical disturbances and pharma-cological interventions.
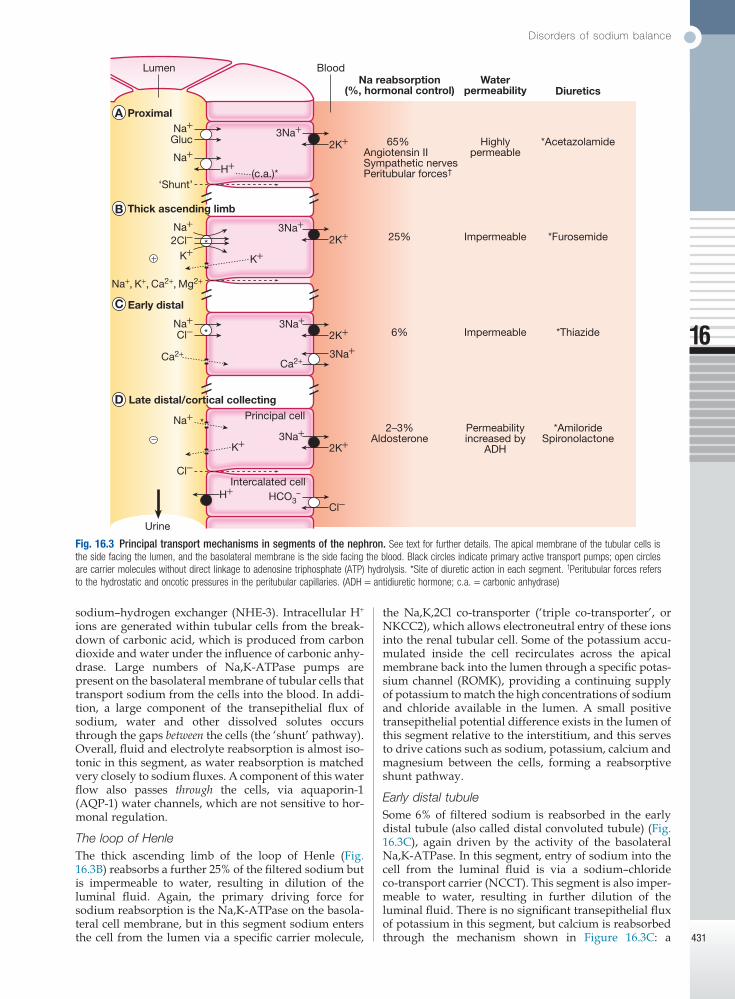
Nephron segmentsAt least four different functional segments of the nephron can be defined in terms of their mechanism for sodium reabsorption (Fig. 16.3).
Proximal tubuleThis is responsible for the reabsorption of some 65% of the filtered sodium load. The cellular mechanisms are complex but some of the key features are shown in Figure 16.3A. Filtered sodium in the luminal fluid enters the cell via several sodium transporters in the apical membrane that couple sodium transport to the entry of glucose, amino acid, phosphate and other organic mol-ecules. Entry of sodium into the tubular cells at this site is also linked to secretion of H+ ions, through the
to avoid haemolysis during or after collection of the sample, which causes contamination of the plasma com-partment by intracellular elements, particularly potas-sium. Blood should not be drawn from an arm into which an intravenous infusion is being given, to avoid contamination by the infused fluid. Repeated measure-ments of plasma electrolytes are frequently necessary when abnormalities have been detected and corrective therapy instituted.
Since the kidney maintains the constancy of body fluids by adjusting urine volume and composition, it is frequently helpful to obtain a sample of urine (‘spot’ specimen or 24-hour collection) at the time of blood analysis. An example of the use of urine biochemistry is given for the differential diagnosis of hyponatraemia in Box 16.14 (p. 438).
DISORDERS OF SODIUM BALANCE
Functional anatomy and physiology of renal sodium handling
Since the great majority of the body’s sodium content is located in the ECF, where it is by far the most abundant cation, total body sodium is a principal determinant of ECF volume. Regulation of sodium excretion by the kidney is crucially important in maintaining normal ECF volume, and plasma volume, in the face of wide variations in sodium intake, which typically may range between 50 and 250 mmol/day.
The functional unit for renal excretion is the neph-ron (Fig. 16.2). Blood undergoes ultrafiltration in the
Fig. 16.2 The nephron. Letters A–D refer to tubular segments shown in more detail in Figure 16.3. (aa = afferent arteriole; ea = efferent arteriole; md = macula densa)
aa
eamd
Cortex
Medulla
A
BThindescending
limb
Loop of Henle
Thinascending
limbMedullarycollectingduct
Parsrecta
Proximal(convoluted)
tubule
Glomerulus
C
Early distal(convoluted)
tubule
Late distaltubule
Corticalcollectingduct
D
Thickascendinglimb
Na+ (sodium)
• Largely reflects reciprocal changes in body water content• See ‘Hypernatraemia’ and ‘Hyponatraemia’, pp. 437 and 439
K+ (potassium)
• May reflect K shifts in and out of cells• Low levels usually mean excessive losses (gastrointestinal or
renal)• High levels usually mean renal dysfunction• See ‘Hypokalaemia’ and ‘Hyperkalaemia’, pp. 440 and 442
Cl− (chloride)
• Generally changes in parallel with plasma Na• Low in metabolic alkalosis• High in some forms of metabolic acidosis
HCO3− (bicarbonate)
• Abnormal in acid–base disorders• See Box 16.18, p. 445
Urea
• Increased with a fall in glomerular filtration rate (GFR), reduced renal perfusion or urine flow rate, and in high protein intake or catabolic states
• See page 466
Creatinine
• Increased with a fall in GFR, in individuals with high muscle mass, and with some drugs
• See Fig. 17.2, p. 467
16.3 How to interpret ‘U&Es’ (urea and electrolytes) or ‘EUC’ (electrolytes/urea/creatinine) results
Disorders of sodium balance
16
431
the Na,K,2Cl co-transporter (‘triple co-transporter’, or NKCC2), which allows electroneutral entry of these ions into the renal tubular cell. Some of the potassium accu-mulated inside the cell recirculates across the apical membrane back into the lumen through a specific potas-sium channel (ROMK), providing a continuing supply of potassium to match the high concentrations of sodium and chloride available in the lumen. A small positive transepithelial potential difference exists in the lumen of this segment relative to the interstitium, and this serves to drive cations such as sodium, potassium, calcium and magnesium between the cells, forming a reabsorptive shunt pathway.
Early distal tubuleSome 6% of filtered sodium is reabsorbed in the early distal tubule (also called distal convoluted tubule) (Fig. 16.3C), again driven by the activity of the basolateral Na,K-ATPase. In this segment, entry of sodium into the cell from the luminal fluid is via a sodium–chloride co-transport carrier (NCCT). This segment is also imper-meable to water, resulting in further dilution of the luminal fluid. There is no significant transepithelial flux of potassium in this segment, but calcium is reabsorbed through the mechanism shown in Figure 16.3C: a
sodium–hydrogen exchanger (NHE-3). Intracellular H+ ions are generated within tubular cells from the break-down of carbonic acid, which is produced from carbon dioxide and water under the influence of carbonic anhy-drase. Large numbers of Na,K-ATPase pumps are present on the basolateral membrane of tubular cells that transport sodium from the cells into the blood. In addi-tion, a large component of the transepithelial flux of sodium, water and other dissolved solutes occurs through the gaps between the cells (the ‘shunt’ pathway). Overall, fluid and electrolyte reabsorption is almost iso-tonic in this segment, as water reabsorption is matched very closely to sodium fluxes. A component of this water flow also passes through the cells, via aquaporin-1 (AQP-1) water channels, which are not sensitive to hor-monal regulation.
The loop of HenleThe thick ascending limb of the loop of Henle (Fig. 16.3B) reabsorbs a further 25% of the filtered sodium but is impermeable to water, resulting in dilution of the luminal fluid. Again, the primary driving force for sodium reabsorption is the Na,K-ATPase on the basola-teral cell membrane, but in this segment sodium enters the cell from the lumen via a specific carrier molecule,
Fig. 16.3 Principal transport mechanisms in segments of the nephron. See text for further details. The apical membrane of the tubular cells is the side facing the lumen, and the basolateral membrane is the side facing the blood. Black circles indicate primary active transport pumps; open circles are carrier molecules without direct linkage to adenosine triphosphate (ATP) hydrolysis. *Site of diuretic action in each segment. †Peritubular forces refers to the hydrostatic and oncotic pressures in the peritubular capillaries. (ADH = antidiuretic hormone; c.a. = carbonic anhydrase)
Na+Gluc
Na+
‘Shunt’
3Na+2K+
H+(c.a.)*
A Proximal
Na+, K+, Ca2+, Mg2+
Na+ 3Na+2K+
*
B Thick ascending limb
Na+ 3Na+2K+
C Early distal
Na+
3Na+2K+
D Late distal/cortical collecting
2Cl−
K+K+
Cl−
Ca2+Ca2+
3Na+*
H+ HCO3 –
Cl−
K+
Cl−
*Principal cell
Intercalated cell
Lumen Blood
Urine
Na reabsorption(%, hormonal control)
Waterpermeability Diuretics
Highlypermeable
*Acetazolamide
25% Impermeable *Furosemide
6% Impermeable *Thiazide
2–3%Aldosterone
Permeabilityincreased by
ADH
*AmilorideSpironolactone
65%Angiotensin IISympathetic nervesPeritubular forces†
CliniCal bioChemistry and metabolism
16
432
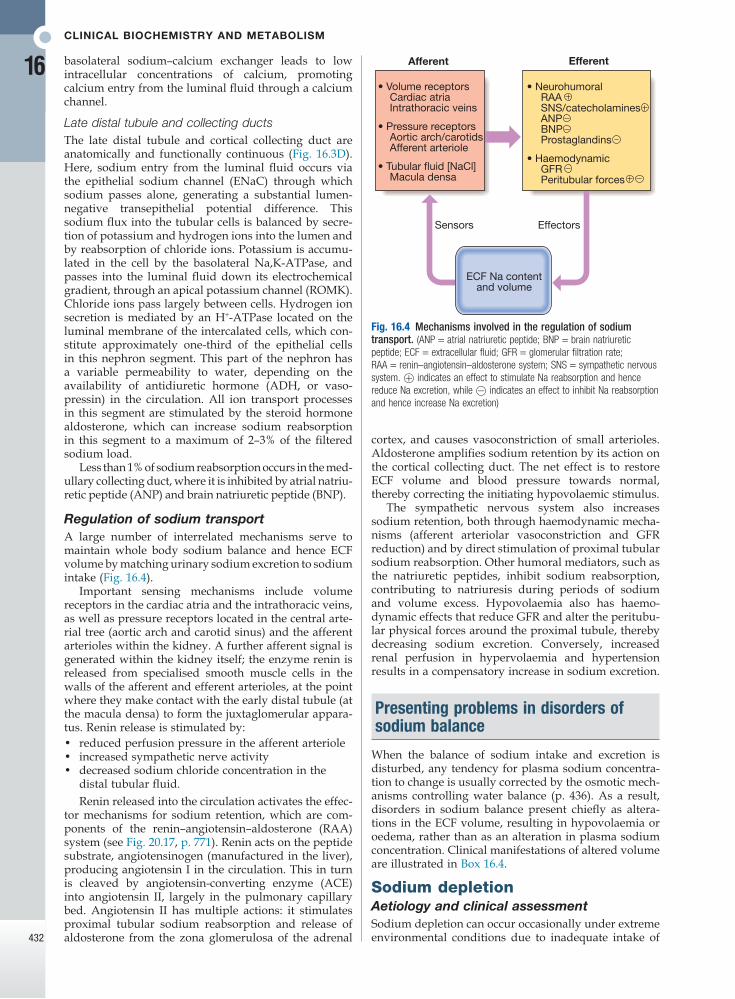
cortex, and causes vasoconstriction of small arterioles. Aldosterone amplifies sodium retention by its action on the cortical collecting duct. The net effect is to restore ECF volume and blood pressure towards normal, thereby correcting the initiating hypovolaemic stimulus.
The sympathetic nervous system also increases sodium retention, both through haemodynamic mecha-nisms (afferent arteriolar vasoconstriction and GFR reduction) and by direct stimulation of proximal tubular sodium reabsorption. Other humoral mediators, such as the natriuretic peptides, inhibit sodium reabsorption, contributing to natriuresis during periods of sodium and volume excess. Hypovolaemia also has haemo-dynamic effects that reduce GFR and alter the peritubu-lar physical forces around the proximal tubule, thereby decreasing sodium excretion. Conversely, increased renal perfusion in hypervolaemia and hypertension results in a compensatory increase in sodium excretion.
Presenting problems in disorders of sodium balance
When the balance of sodium intake and excretion is disturbed, any tendency for plasma sodium concentra-tion to change is usually corrected by the osmotic mech-anisms controlling water balance (p. 436). As a result, disorders in sodium balance present chiefly as altera-tions in the ECF volume, resulting in hypovolaemia or oedema, rather than as an alteration in plasma sodium concentration. Clinical manifestations of altered volume are illustrated in Box 16.4.
Sodium depletionAetiology and clinical assessmentSodium depletion can occur occasionally under extreme environmental conditions due to inadequate intake of
basolateral sodium–calcium exchanger leads to low intracellular concentrations of calcium, promoting calcium entry from the luminal fluid through a calcium channel.
Late distal tubule and collecting ductsThe late distal tubule and cortical collecting duct are anatomically and functionally continuous (Fig. 16.3D). Here, sodium entry from the luminal fluid occurs via the epithelial sodium channel (ENaC) through which sodium passes alone, generating a substantial lumen-negative transepithelial potential difference. This sodium flux into the tubular cells is balanced by secre-tion of potassium and hydrogen ions into the lumen and by reabsorption of chloride ions. Potassium is accumu-lated in the cell by the basolateral Na,K-ATPase, and passes into the luminal fluid down its electrochemical gradient, through an apical potassium channel (ROMK). Chloride ions pass largely between cells. Hydrogen ion secretion is mediated by an H+-ATPase located on the luminal membrane of the intercalated cells, which con-stitute approximately one-third of the epithelial cells in this nephron segment. This part of the nephron has a variable permeability to water, depending on the availability of antidiuretic hormone (ADH, or vaso-pressin) in the circulation. All ion transport processes in this segment are stimulated by the steroid hormone aldosterone, which can increase sodium reabsorption in this segment to a maximum of 2–3% of the filtered sodium load.
Less than 1% of sodium reabsorption occurs in the med-ullary collecting duct, where it is inhibited by atrial natriu-retic peptide (ANP) and brain natriuretic peptide (BNP).
Regulation of sodium transportA large number of interrelated mechanisms serve to maintain whole body sodium balance and hence ECF volume by matching urinary sodium excretion to sodium intake (Fig. 16.4).
Important sensing mechanisms include volume receptors in the cardiac atria and the intrathoracic veins, as well as pressure receptors located in the central arte-rial tree (aortic arch and carotid sinus) and the afferent arterioles within the kidney. A further afferent signal is generated within the kidney itself; the enzyme renin is released from specialised smooth muscle cells in the walls of the afferent and efferent arterioles, at the point where they make contact with the early distal tubule (at the macula densa) to form the juxtaglomerular appara-tus. Renin release is stimulated by:• reduced perfusion pressure in the afferent arteriole• increased sympathetic nerve activity• decreased sodium chloride concentration in the
distal tubular fluid.Renin released into the circulation activates the effec-
tor mechanisms for sodium retention, which are com-ponents of the renin–angiotensin–aldosterone (RAA) system (see Fig. 20.17, p. 771). Renin acts on the peptide substrate, angiotensinogen (manufactured in the liver), producing angiotensin I in the circulation. This in turn is cleaved by angiotensin-converting enzyme (ACE) into angiotensin II, largely in the pulmonary capillary bed. Angiotensin II has multiple actions: it stimulates proximal tubular sodium reabsorption and release of aldosterone from the zona glomerulosa of the adrenal
Fig. 16.4 Mechanisms involved in the regulation of sodium transport. (ANP = atrial natriuretic peptide; BNP = brain natriuretic peptide; ECF = extracellular fluid; GFR = glomerular filtration rate; RAA = renin–angiotensin–aldosterone system; SNS = sympathetic nervous system. indicates an effect to stimulate Na reabsorption and hence reduce Na excretion, while indicates an effect to inhibit Na reabsorption and hence increase Na excretion)
• Volume receptors Cardiac atria Intrathoracic veins
• Pressure receptors Aortic arch/carotids Afferent arteriole
• Tubular fluid [NaCl] Macula densa
• Neurohumoral RAA SNS/catecholamines ANP BNP Prostaglandins
• Haemodynamic GFR Peritubular forces
ECF Na contentand volume
Afferent Efferent
Sensors Effectors
Disorders of sodium balance
16
433
ManagementManagement of sodium and water depletion has two main components:• treat the cause where possible, to stop ongoing salt
and water losses• replace the salt and water deficits, and provide
ongoing maintenance requirements, usually by intravenous fluid replacement when depletion is severe.
Intravenous fluid therapyBox 16.6 shows the daily maintenance requirements for water and electrolytes in a typical adult, and Box 16.7 summarises the composition of some widely available intravenous fluids. The choice of fluid and the rate of administration depend on the clinical circumstances, as assessed at the bedside and from laboratory data, and as described in Box 16.8.
In the absence of normal oral intake (as in a fasting or post-operative patient in hospital), maintenance quanti-ties of fluid, sodium and potassium should be provided. If any deficits or continuing pathological losses are iden-tified, additional fluid and electrolytes will be required. In prolonged periods of fasting (more than a few days), attention also needs to be given to providing sufficient caloric and nutritional intake to prevent excessive catabolism of body energy stores (p. 120).
The choice of intravenous fluid therapy in the treat-ment of significant hypovolaemia relates to the concepts in Figure 16.1 (p. 429). If fluid containing neither sodium nor protein is given, it will distribute in the body fluid compartments in proportion to the normal distribution of total body water. Thus, giving 1 L of 5% dextrose will contribute relatively little (approximately 3/40 of the infused volume) towards expansion of the plasma volume. This makes 5% dextrose ineffective at restoring the circulation and perfusion of vital organs. Intra-venous infusion of an isotonic (normal) saline solution, on the other hand, results in more effective expansion of the extracellular fluid, although a minority of the infused volume (some 3/15) will contribute to plasma volume.
salt, but it is much more commonly due to pathological losses of sodium-containing fluids (Box 16.5). Loss of whole blood, as in acute haemorrhage, is also an obvious cause of hypovolaemia, and elicits the same mechanisms for the conservation of sodium and water.
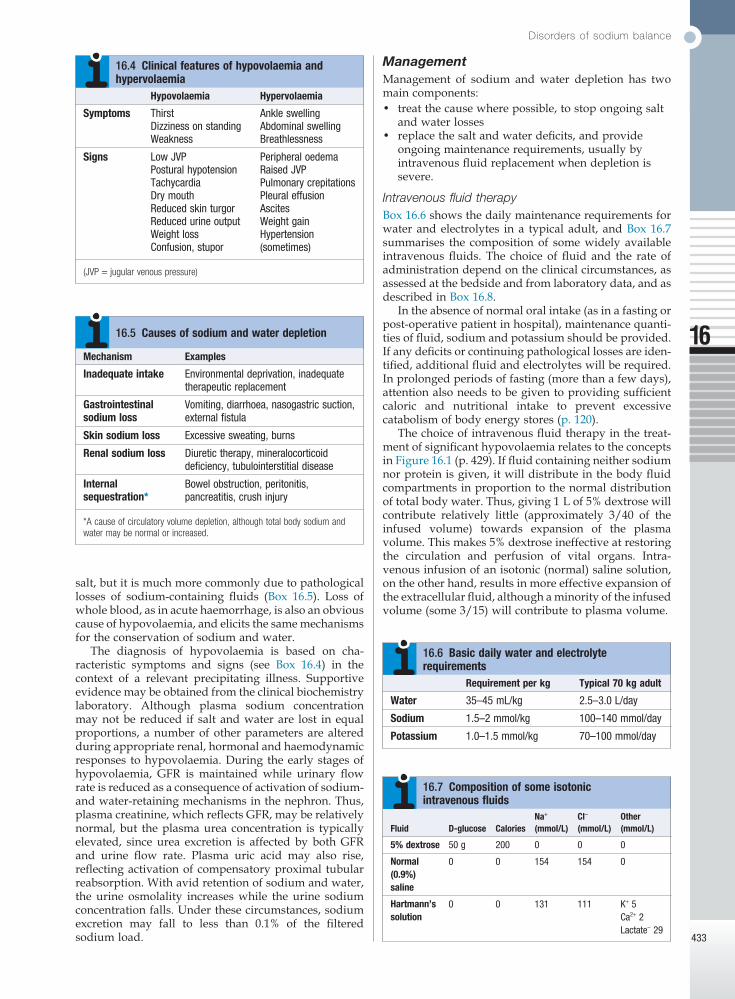
The diagnosis of hypovolaemia is based on cha-racteristic symptoms and signs (see Box 16.4) in the context of a relevant precipitating illness. Supportive evidence may be obtained from the clinical biochemistry laboratory. Although plasma sodium concentration may not be reduced if salt and water are lost in equal proportions, a number of other parameters are altered during appropriate renal, hormonal and haemodynamic responses to hypovolaemia. During the early stages of hypovolaemia, GFR is maintained while urinary flow rate is reduced as a consequence of activation of sodium- and water-retaining mechanisms in the nephron. Thus, plasma creatinine, which reflects GFR, may be relatively normal, but the plasma urea concentration is typically elevated, since urea excretion is affected by both GFR and urine flow rate. Plasma uric acid may also rise, reflecting activation of compensatory proximal tubular reabsorption. With avid retention of sodium and water, the urine osmolality increases while the urine sodium concentration falls. Under these circumstances, sodium excretion may fall to less than 0.1% of the filtered sodium load.
Hypovolaemia Hypervolaemia
Symptoms Thirst Ankle swellingDizziness on standing Abdominal swellingWeakness Breathlessness
Signs Low JVP Peripheral oedemaPostural hypotension Raised JVPTachycardia Pulmonary crepitationsDry mouth Pleural effusionReduced skin turgor AscitesReduced urine output Weight gainWeight loss Hypertension
(sometimes)Confusion, stupor
(JVP = jugular venous pressure)
16.4 Clinical features of hypovolaemia and hypervolaemia
Mechanism Examples
Inadequate intake Environmental deprivation, inadequate therapeutic replacement
Gastrointestinal sodium loss
Vomiting, diarrhoea, nasogastric suction, external fistula
Skin sodium loss Excessive sweating, burns
Renal sodium loss Diuretic therapy, mineralocorticoid deficiency, tubulointerstitial disease
Internal sequestration*
Bowel obstruction, peritonitis, pancreatitis, crush injury
*A cause of circulatory volume depletion, although total body sodium and water may be normal or increased.
16.5 Causes of sodium and water depletion
Requirement per kg Typical 70 kg adult
Water 35–45 mL/kg 2.5–3.0 L/day
Sodium 1.5–2 mmol/kg 100–140 mmol/day
Potassium 1.0–1.5 mmol/kg 70–100 mmol/day
16.6 Basic daily water and electrolyte requirements
Fluid D-glucose CaloriesNa+ (mmol/L)
Cl− (mmol/L)
Other (mmol/L)
5% dextrose 50 g 200 0 0 0
Normal (0.9%) saline
0 0 154 154 0
Hartmann’s solution
0 0 131 111 K+ 5Ca2+ 2Lactate− 29
16.7 Composition of some isotonic intravenous fluids
CliniCal bioChemistry and metabolism
16
434
Carrying this reasoning further, it might be expected that a solution containing plasma proteins would be largely retained within the plasma, thus maximally expanding the circulating fluid volume and improving tissue perfusion. However, recent clinical studies have not shown any overall advantage of infusions contain-ing albumin in the treatment of acute hypovolaemia (Box 16.9). Resuscitation fluids containing synthetic colloids such as carbohydrate polymers should not be used in the acute resuscitation of volume-depleted patients since they offer no benefit over crystalloids and are associated with increased mortality (see Box 17.21, p. 482).
Sodium excessAetiology and clinical assessmentIn patients with normal cardiac and renal function, excessive intakes of salt and water are compensated for by increased excretion and do not lead to clinically obvious features of sodium and water overload. However, patients with cardiac, renal or hepatic disease
frequently present with signs and symptoms of sodium excess (Fig. 16.5). This does not always involve an increase in circulating blood volume, since the excess fluid often leaks out of the capillaries to expand the interstitial compartment of the ECF, especially in dis-eases like nephrotic syndrome and chronic liver disease that cause hypoalbuminaemia. Important causes of sodium excess are shown in Box 16.10.
Peripheral oedema is the most common physical sign of ECF volume expansion (p. 478). The three most common systemic disorders associated with sodium and fluid overload are cardiac failure, cirrhosis and neph-rotic syndrome. In each of these, sodium retention is largely a secondary response to circulatory insufficiency caused by the primary disorder, as illustrated in Figure 16.5. The pathophysiology is different in renal failure, when the primary cause of volume expansion is the profound reduction in GFR impairing sodium and water excretion, and secondary tubular mechanisms are of lesser importance. Further detail on each of these condi-tions is given in other chapters of this book.
ManagementThe management of ECF volume overload involves a number of components:• specific treatment directed at the underlying cause,
such as ACE inhibitors in heart failure and corticosteroids in minimal change nephropathy
• restriction of dietary sodium (to 50–80 mmol/day) to match the diminished excretory capacity
• treatment with diuretics.
Diuretic therapy
Diuretics are important in the treatment of conditions of ECF expansion due to salt and water retention and in hypertension (p. 606). They act by inhibiting sodium reabsorption at various locations along the nephron (see Fig. 16.3, p. 431). Their potency and adverse effects relate to their mechanism and site of action.
Mechanisms of actionIn the proximal tubule, carbonic anhydrase inhibitors such as acetazolamide inhibit the intracellular produc-tion of H+ ions, thereby reducing the fraction of sodium reabsorption that is exchanged for H+ by the apical
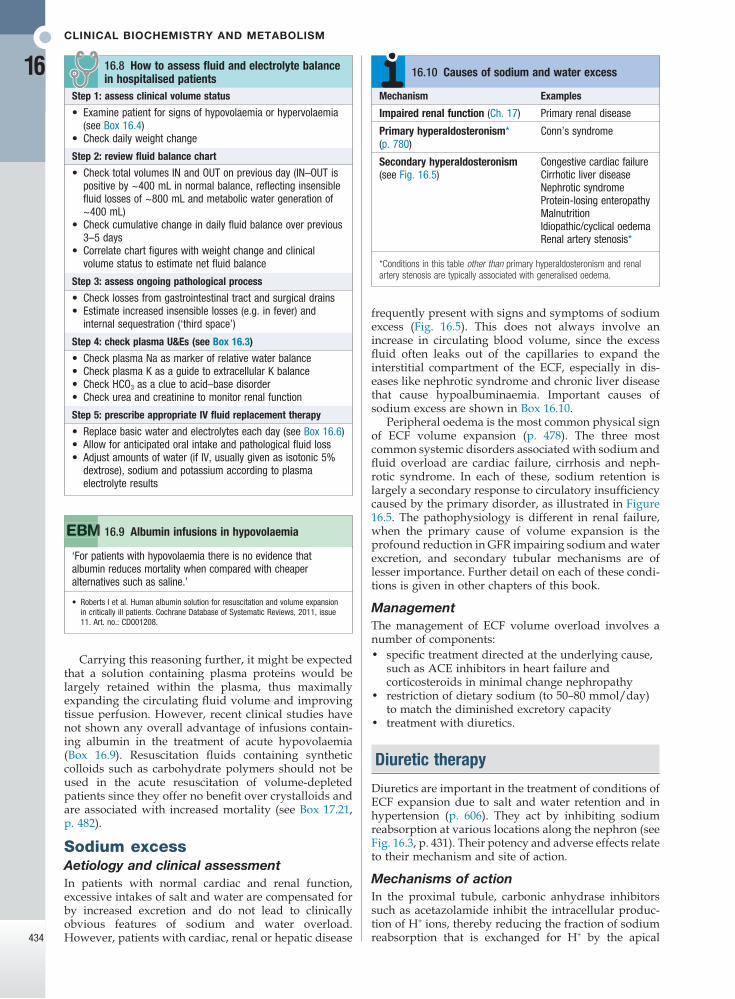
Step 1: assess clinical volume status
• Examine patient for signs of hypovolaemia or hypervolaemia (see Box 16.4)
• Check daily weight change
Step 2: review fluid balance chart
• Check total volumes IN and OUT on previous day (IN–OUT is positive by ~400 mL in normal balance, reflecting insensible fluid losses of ~800 mL and metabolic water generation of ~400 mL)
• Check cumulative change in daily fluid balance over previous 3–5 days
• Correlate chart figures with weight change and clinical volume status to estimate net fluid balance
Step 3: assess ongoing pathological process
• Check losses from gastrointestinal tract and surgical drains• Estimate increased insensible losses (e.g. in fever) and
internal sequestration (‘third space’)
Step 4: check plasma U&Es (see Box 16.3)
• Check plasma Na as marker of relative water balance• Check plasma K as a guide to extracellular K balance• Check HCO3 as a clue to acid–base disorder• Check urea and creatinine to monitor renal function
Step 5: prescribe appropriate IV fluid replacement therapy
• Replace basic water and electrolytes each day (see Box 16.6)• Allow for anticipated oral intake and pathological fluid loss• Adjust amounts of water (if IV, usually given as isotonic 5%
dextrose), sodium and potassium according to plasma electrolyte results
16.8 How to assess fluid and electrolyte balance in hospitalised patients
‘For patients with hypovolaemia there is no evidence that albumin reduces mortality when compared with cheaper alternatives such as saline.’
• Roberts I et al. Human albumin solution for resuscitation and volume expansion in critically ill patients. Cochrane Database of Systematic Reviews, 2011, issue 11. Art. no.: CD001208.
16.9 Albumin infusions in hypovolaemia
Mechanism Examples
Impaired renal function (Ch. 17) Primary renal disease
Primary hyperaldosteronism* (p. 780)
Conn’s syndrome
Secondary hyperaldosteronism(see Fig. 16.5)
Congestive cardiac failureCirrhotic liver diseaseNephrotic syndromeProtein-losing enteropathyMalnutritionIdiopathic/cyclical oedemaRenal artery stenosis*
*Conditions in this table other than primary hyperaldosteronism and renal artery stenosis are typically associated with generalised oedema.
16.10 Causes of sodium and water excess

Disorders of sodium balance
16
435
Another is the mineralocorticoid receptor, to which binding of aldosterone is blocked by spironolactone and eplerenone.
An important feature of the most commonly used diuretic drugs (furosemide, thiazides and amiloride) is that they act on their target transport molecules from the luminal side of the tubular epithelium. Since they are highly protein-bound in the plasma, very little reaches the urinary fluid by glomerular filtration, but there are active transport mechanisms for secreting organic acids and bases, including these drugs, across the proximal tubular wall into the lumen, resulting in adequate drug concentrations being delivered to later tubular seg-ments. This secretory process may be impaired by certain other drugs, and also by accumulated organic anions as occurs in chronic renal failure and chronic liver failure, leading to resistance to diuretics.
Osmotic diuretics act independently of specific trans-port mechanism. They are freely filtered at the glomeru-lus but are not reabsorbed by any part of the tubular system. They retain fluid osmotically within the tubular lumen and limit the extent of sodium reabsorption in multiple segments. Mannitol is the most commonly used osmotic diuretic. It is given by intravenous infusion to achieve short-term diuresis in conditions such as cere-bral oedema.
Clinical use of diureticsIn the selection of a diuretic drug for hypertension or oedema disorders, the following principles should be observed:• Use the minimum effective dose.• Use for as short a period of time as necessary.• Monitor regularly for adverse effects.
Fig. 16.5 Secondary mechanisms causing sodium excess and oedema in cardiac failure, cirrhosis and nephrotic syndrome. Primary renal retention of Na and water may also contribute to oedema formation when GFR is significantly reduced (see Box 16.10 and p. 478).
Cirrhotic liver disease Nephrotic renal diseaseHeart failure
Peripheralvasodilatation/
splanchnicpooling
Impairedalbumin
synthesis
Heavyproteinuria
↓ Cardiacoutput
↓ Plasmaalbumin
↓ Arterialfilling
• ↑ Renin – angiotensin – aldosterone• ↑ Renal sympathetic drive• Altered renal haemodynamics
↑ Venouspressure
Na+ + H2Oretention
↑ Capillary hydrostaticpressure
↓ Capillary oncoticpressure
Oedema
2°
1° 1°
membrane sodium–hydrogen exchanger. These drugs have limited usefulness, however, since only a small fraction of proximal sodium reabsorption uses this mechanism, and much of the sodium that is not reabsorbed can be reabsorbed by downstream segments of the nephron.
In the thick ascending limb of the loop of Henle, loop diuretics such as furosemide inhibit sodium reabsorption by blocking the action of the apical membrane Na,K,2Cl co-transporter. Because this segment reabsorbs a large fraction of the filtered sodium, these drugs are potent diuretics, and are commonly used in diseases associated with significant oedema.
In the early distal tubule, thiazides inhibit sodium reabsorption by blocking the sodium–chloride co- transporter in the apical membrane. Since this segment reabsorbs a much smaller fraction of the filtered sodium, these are less potent than loop diuretics, but are widely used in the treatment of hypertension and less severe oedema.
All diuretic drugs acting in the proximal, loop and early distal segments cause excretion not only of sodium (and with it water), but also of potassium. This occurs largely as a result of delivery of increased amounts of sodium to the late distal/cortical collecting ducts, where sodium reabsorption is associated with excretion of potassium, and is amplified if circulating aldosterone levels are high. By contrast, drugs acting to inhibit sodium reabsorption in the late distal/cortical collecting duct segment are associated with reduced potassium secretion, and are described as ‘potassium-sparing’. One target of drug action in this segment is the apical sodium channel in the principal cells (see Fig. 16.3), which is blocked by drugs such as amiloride and triamterene.
CliniCal bioChemistry and metabolism
16
436
Functional anatomy and physiology of renal water handling
While regulation of total ECF volume is largely achieved through renal control of sodium excretion, mechanisms also exist to allow for the excretion of a ‘pure’ water load when water intake is high, and for retention of water when access is restricted.
These functions are largely achieved by the loop of Henle and the collecting ducts. The counter-current con-figuration of flow in adjacent limbs of the loop (see Fig. 16.2, p. 430), involves osmotic movement of water from the descending limbs and reabsorption of solute from neighbouring ascending limbs, to set up a gradient of osmolality from isotonic (like plasma) in the renal cortex to hypertonic (around 1200 mmol/kg) in the inner part of the medulla. At the same time, the fluid emerging from the thick ascending limb is hypotonic compared to plasma, because it has been diluted by the reabsorption of sodium, but not water, from the thick ascending limb and early distal tubule. As this dilute fluid passes from the cortex through the collecting duct system to the renal pelvis, it traverses the medullary interstitial gradient of osmolality set up by the operation of the loop of Henle, and water is reabsorbed.
Further changes in the urine osmolality on passage through the collecting ducts depend on the circulating level of antidiuretic hormone (ADH), which is released by the posterior pituitary gland under conditions of increased plasma osmolality or hypovolaemia (Ch. 20).• When water intake is high and plasma osmolality is
normal or low-normal, ADH levels are suppressed and the collecting ducts remain impermeable to water. The luminal fluid osmolality remains low, resulting in the excretion of a dilute urine (minimum osmolality approximately 50 mmol/kg in a healthy young person).
• When water intake is restricted and plasma osmolality is high, or in the presence of plasma volume depletion, ADH levels rise. This causes water permeability of the collecting ducts to increase through binding of ADH to the V2 receptor, which enhances collecting duct water permeability through the insertion of aquaporin (AQP-2) channels into the luminal cell membrane. This results in osmotic reabsorption of water along the entire length of the collecting duct, with maximum urine osmolality approaching that in the medullary tip (up to 1200 mmol/kg).Parallel to these changes in ADH release are changes
in water-seeking behaviour triggered by the sensation of thirst, which also becomes activated as plasma osmolal-ity rises.
In summary, for adequate dilution of the urine there must be:• adequate solute delivery to the loop of Henle and
early distal tubule• normal function of the loop of Henle and early
distal tubule• absence of ADH in the circulation.
If any of these processes is faulty, water retention and hyponatraemia may result.
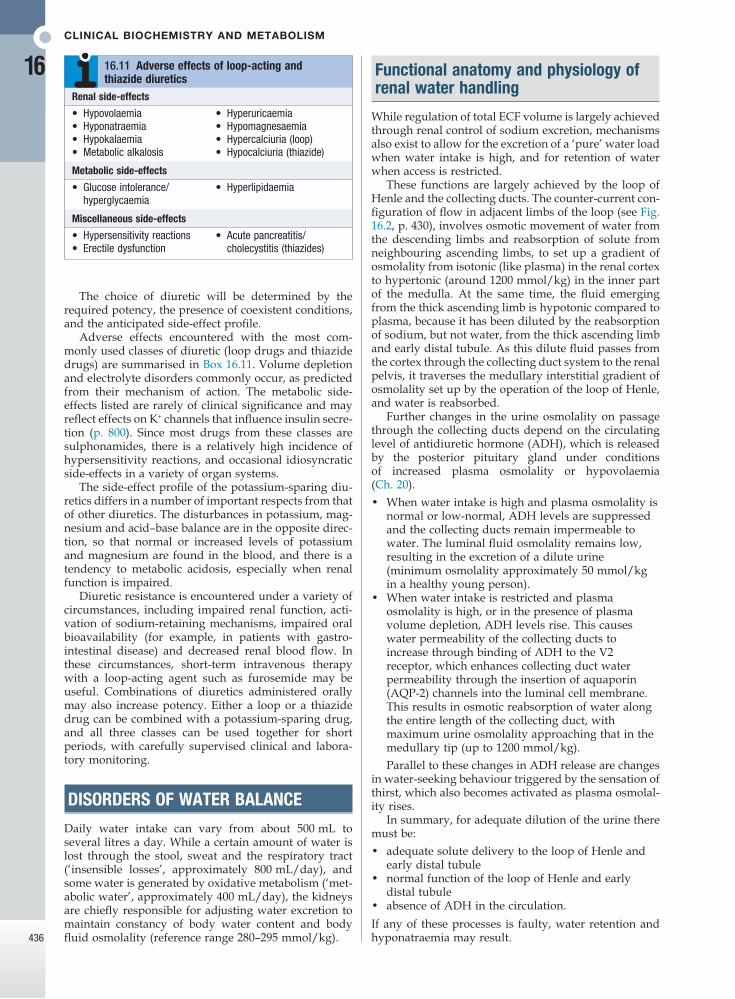
The choice of diuretic will be determined by the required potency, the presence of coexistent conditions, and the anticipated side-effect profile.
Adverse effects encountered with the most com-monly used classes of diuretic (loop drugs and thiazide drugs) are summarised in Box 16.11. Volume depletion and electrolyte disorders commonly occur, as predicted from their mechanism of action. The metabolic side-effects listed are rarely of clinical significance and may reflect effects on K+ channels that influence insulin secre-tion (p. 800). Since most drugs from these classes are sulphonamides, there is a relatively high incidence of hypersensitivity reactions, and occasional idiosyncratic side-effects in a variety of organ systems.
The side-effect profile of the potassium-sparing diu-retics differs in a number of important respects from that of other diuretics. The disturbances in potassium, mag-nesium and acid–base balance are in the opposite direc-tion, so that normal or increased levels of potassium and magnesium are found in the blood, and there is a tendency to metabolic acidosis, especially when renal function is impaired.
Diuretic resistance is encountered under a variety of circumstances, including impaired renal function, acti-vation of sodium-retaining mechanisms, impaired oral bioavailability (for example, in patients with gastro-intestinal disease) and decreased renal blood flow. In these circumstances, short-term intravenous therapy with a loop-acting agent such as furosemide may be useful. Combinations of diuretics administered orally may also increase potency. Either a loop or a thiazide drug can be combined with a potassium-sparing drug, and all three classes can be used together for short periods, with carefully supervised clinical and labora-tory monitoring.
DISORDERS OF WATER BALANCE
Daily water intake can vary from about 500 mL to several litres a day. While a certain amount of water is lost through the stool, sweat and the respiratory tract (‘insensible losses’, approximately 800 mL/day), and some water is generated by oxidative metabolism (‘met-abolic water’, approximately 400 mL/day), the kidneys are chiefly responsible for adjusting water excretion to maintain constancy of body water content and body fluid osmolality (reference range 280–295 mmol/kg).
Renal side-effects
• Hypovolaemia• Hyponatraemia• Hypokalaemia• Metabolic alkalosis
• Hyperuricaemia• Hypomagnesaemia• Hypercalciuria (loop)• Hypocalciuria (thiazide)
Metabolic side-effects
• Glucose intolerance/hyperglycaemia
• Hyperlipidaemia
Miscellaneous side-effects
• Hypersensitivity reactions• Erectile dysfunction
• Acute pancreatitis/cholecystitis (thiazides)
16.11 Adverse effects of loop-acting and thiazide diuretics
Disorders of water balance
16
437
Conversely, to achieve concentration of the urine there must be:• adequate solute delivery to the loop of Henle• normal function of the loop of Henle• ADH release into the circulation• ADH action on the collecting ducts.Failure of any of these steps may result in inappropriate water loss and hypernatraemia.
Presenting problems in disorders of water balance
Disturbances in body water balance, in the absence of changes in sodium balance, alter plasma sodium con-centration and hence plasma osmolality. When extracel-lular osmolality changes abruptly, water flows rapidly across cell membranes with resultant cell swelling (during hypo-osmolality) or shrinkage (during hyper-osmolality). Cerebral function is very sensitive to such volume changes, particularly brain swelling during hypo-osmolality, which can lead to an increase in intrac-erebral pressure and reduced cerebral perfusion.
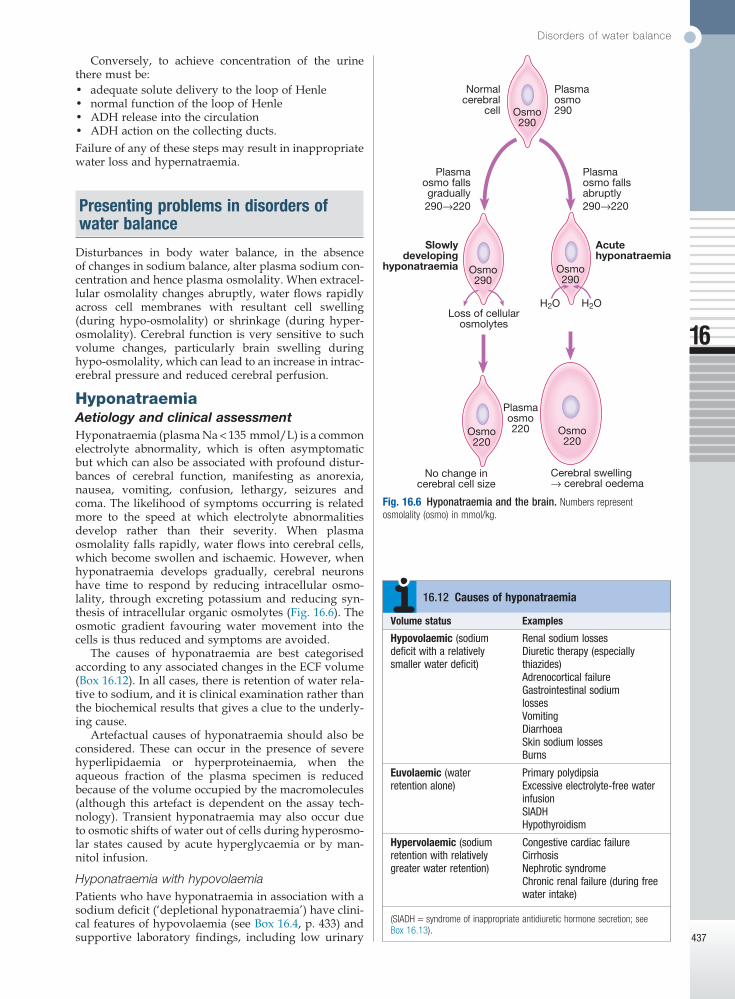
HyponatraemiaAetiology and clinical assessmentHyponatraemia (plasma Na < 135 mmol/L) is a common electrolyte abnormality, which is often asymptomatic but which can also be associated with profound distur-bances of cerebral function, manifesting as anorexia, nausea, vomiting, confusion, lethargy, seizures and coma. The likelihood of symptoms occurring is related more to the speed at which electrolyte abnor malities develop rather than their severity. When plasma osmo lality falls rapidly, water flows into cerebral cells, which become swollen and ischaemic. However, when hyponatraemia develops gradually, cerebral neurons have time to respond by reducing intracellular osmo-lality, through excreting potassium and reducing syn-thesis of intracellular organic osmolytes (Fig. 16.6). The osmotic gradient favouring water movement into the cells is thus reduced and symptoms are avoided.
The causes of hyponatraemia are best categorised according to any associated changes in the ECF volume (Box 16.12). In all cases, there is retention of water rela-tive to sodium, and it is clinical examination rather than the biochemical results that gives a clue to the underly-ing cause.
Artefactual causes of hyponatraemia should also be considered. These can occur in the presence of severe hyperlipidaemia or hyperproteinaemia, when the aqueous fraction of the plasma specimen is reduced because of the volume occupied by the macromolecules (although this artefact is dependent on the assay tech-nology). Transient hyponatraemia may also occur due to osmotic shifts of water out of cells during hyperosmo-lar states caused by acute hyperglycaemia or by man-nitol infusion.
Hyponatraemia with hypovolaemiaPatients who have hyponatraemia in association with a sodium deficit (‘depletional hyponatraemia’) have clini-cal features of hypovolaemia (see Box 16.4, p. 433) and supportive laboratory findings, including low urinary
Fig. 16.6 Hyponatraemia and the brain. Numbers represent osmolality (osmo) in mmol/kg.
Acutehyponatraemia
Slowlydeveloping
hyponatraemia
Normalcerebral
cell
Plasmaosmo290Osmo
290
Osmo290
Osmo290
H2O H2OLoss of cellular
osmolytes
Osmo220
Cerebral swelling→ cerebral oedema
Osmo220
Plasmaosmo220
No change incerebral cell size
Plasmaosmo falls abruptly290→220
Plasmaosmo fallsgradually290→220
Volume status Examples
Hypovolaemic (sodium deficit with a relatively smaller water deficit)
Renal sodium lossesDiuretic therapy (especially thiazides)Adrenocortical failureGastrointestinal sodium lossesVomitingDiarrhoeaSkin sodium lossesBurns
Euvolaemic (water retention alone)
Primary polydipsiaExcessive electrolyte-free water infusionSIADHHypothyroidism
Hypervolaemic (sodium retention with relatively greater water retention)
Congestive cardiac failureCirrhosisNephrotic syndromeChronic renal failure (during free water intake)
(SIADH = syndrome of inappropriate antidiuretic hormone secretion; see Box 16.13).
16.12 Causes of hyponatraemia
CliniCal bioChemistry and metabolism
16
438
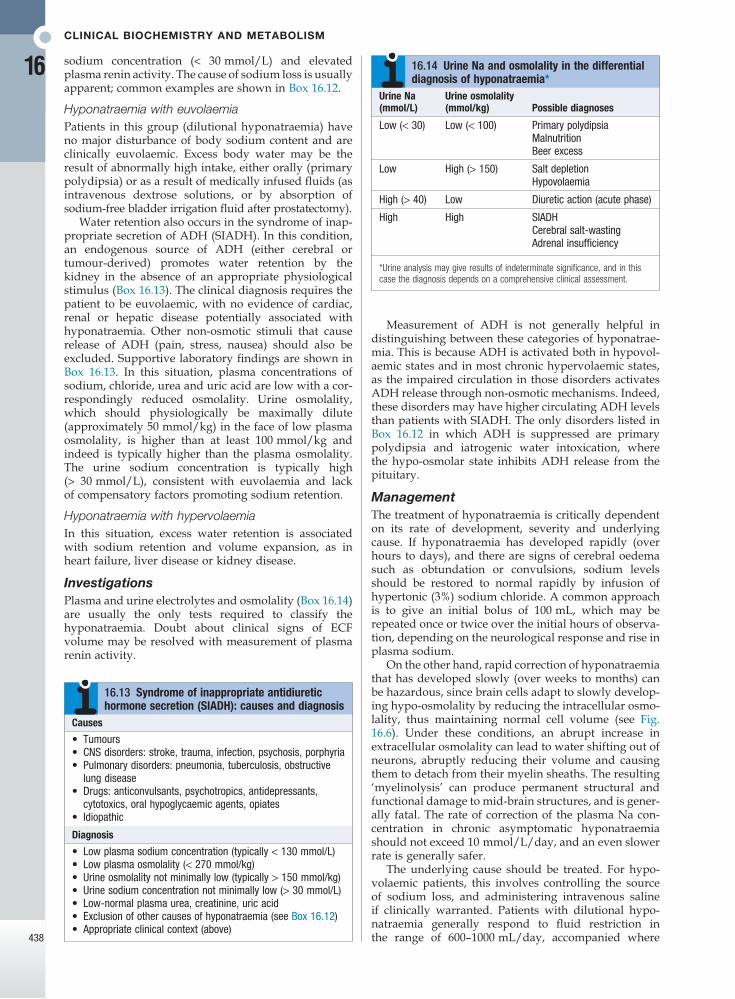
sodium concentration (< 30 mmol/L) and elevated plasma renin activity. The cause of sodium loss is usually apparent; common examples are shown in Box 16.12.
Hyponatraemia with euvolaemiaPatients in this group (dilutional hyponatraemia) have no major disturbance of body sodium content and are clinically euvolaemic. Excess body water may be the result of abnormally high intake, either orally (primary polydipsia) or as a result of medically infused fluids (as intravenous dextrose solutions, or by absorption of sodium-free bladder irrigation fluid after prostatectomy).
Water retention also occurs in the syndrome of inap-propriate secretion of ADH (SIADH). In this condition, an endogenous source of ADH (either cerebral or tumour-derived) promotes water retention by the kidney in the absence of an appropriate physiological stimulus (Box 16.13). The clinical diagnosis requires the patient to be euvolaemic, with no evidence of cardiac, renal or hepatic disease potentially associated with hyponatraemia. Other non-osmotic stimuli that cause release of ADH (pain, stress, nausea) should also be excluded. Supportive laboratory findings are shown in Box 16.13. In this situation, plasma concentrations of sodium, chloride, urea and uric acid are low with a cor-respondingly reduced osmolality. Urine osmolality, which should physiologically be maximally dilute (approximately 50 mmol/kg) in the face of low plasma osmolality, is higher than at least 100 mmol/kg and indeed is typically higher than the plasma osmolality. The urine sodium concentration is typically high (> 30 mmol/L), consistent with euvolaemia and lack of compensatory factors promoting sodium retention.
Hyponatraemia with hypervolaemiaIn this situation, excess water retention is associated with sodium retention and volume expansion, as in heart failure, liver disease or kidney disease.
InvestigationsPlasma and urine electrolytes and osmolality (Box 16.14) are usually the only tests required to classify the hyponatraemia. Doubt about clinical signs of ECF volume may be resolved with measurement of plasma renin activity.
Measurement of ADH is not generally helpful in distinguishing between these categories of hyponatrae-mia. This is because ADH is activated both in hypovol-aemic states and in most chronic hypervolaemic states, as the impaired circulation in those disorders activates ADH release through non-osmotic mechanisms. Indeed, these disorders may have higher circulating ADH levels than patients with SIADH. The only disorders listed in Box 16.12 in which ADH is suppressed are primary polydipsia and iatrogenic water intoxication, where the hypo-osmolar state inhibits ADH release from the pituitary.
ManagementThe treatment of hyponatraemia is critically dependent on its rate of development, severity and underlying cause. If hyponatraemia has developed rapidly (over hours to days), and there are signs of cerebral oedema such as obtundation or convulsions, sodium levels should be restored to normal rapidly by infusion of hypertonic (3%) sodium chloride. A common approach is to give an initial bolus of 100 mL, which may be repeated once or twice over the initial hours of observa-tion, depending on the neurological response and rise in plasma sodium.
On the other hand, rapid correction of hyponatraemia that has developed slowly (over weeks to months) can be hazardous, since brain cells adapt to slowly develop-ing hypo-osmolality by reducing the intracellular osmo-lality, thus maintaining normal cell volume (see Fig. 16.6). Under these conditions, an abrupt increase in extracellular osmolality can lead to water shifting out of neurons, abruptly reducing their volume and causing them to detach from their myelin sheaths. The resulting ‘myelinolysis’ can produce permanent structural and functional damage to mid-brain structures, and is gener-ally fatal. The rate of correction of the plasma Na con-centration in chronic asymptomatic hyponatraemia should not exceed 10 mmol/L/day, and an even slower rate is generally safer.
The underlying cause should be treated. For hypo-volaemic patients, this involves controlling the source of sodium loss, and administering intravenous saline if clinically warranted. Patients with dilutional hypo-natraemia generally respond to fluid restriction in the range of 600–1000 mL/day, accompanied where
Causes
• Tumours• CNS disorders: stroke, trauma, infection, psychosis, porphyria• Pulmonary disorders: pneumonia, tuberculosis, obstructive
lung disease• Drugs: anticonvulsants, psychotropics, antidepressants,
cytotoxics, oral hypoglycaemic agents, opiates• Idiopathic
Diagnosis
• Low plasma sodium concentration (typically < 130 mmol/L)• Low plasma osmolality (< 270 mmol/kg)• Urine osmolality not minimally low (typically > 150 mmol/kg)• Urine sodium concentration not minimally low (> 30 mmol/L)• Low-normal plasma urea, creatinine, uric acid• Exclusion of other causes of hyponatraemia (see Box 16.12)• Appropriate clinical context (above)
16.13 Syndrome of inappropriate antidiuretic hormone secretion (SIADH): causes and diagnosis
Urine Na (mmol/L)
Urine osmolality (mmol/kg) Possible diagnoses
Low (< 30) Low (< 100) Primary polydipsiaMalnutritionBeer excess
Low High (> 150) Salt depletionHypovolaemia
High (> 40) Low Diuretic action (acute phase)
High High SIADHCerebral salt-wastingAdrenal insufficiency
*Urine analysis may give results of indeterminate significance, and in this case the diagnosis depends on a comprehensive clinical assessment.
16.14 Urine Na and osmolality in the differential diagnosis of hyponatraemia*
Disorders of potassium balance
16
439
Elderly patients are predisposed, in different circum-stances, to both hyponatraemia and hypernatraemia, and a high index of suspicion of these electrolyte distur-bances is appropriate in elderly patients with recent alterations in behaviour (Box 16.16).
DISORDERS OF POTASSIUM BALANCE
Potassium is the major intracellular cation (see Fig. 16.1, p. 429), and the steep concentration gradient for potas-sium across the cell membrane of excitable cells plays an important part in generating the resting membrane potential and allowing the propagation of the action potential that is crucial to normal functioning of nerve, muscle and cardiac tissues. Control of body potassium balance is described below.
Changes in the distribution of potassium between the ICF and ECF compartments can alter plasma potassium concentration, without any overall change in total body potassium content. Potassium is driven into the cells by
possible by withdrawal of the precipitating stimulus (such as drugs causing SIADH). If the response of plasma sodium is inadequate, treatment with demeclo-cycline (600–900 mg/day) may be of value by enhancing water excretion, through its inhibitory effect on respon-siveness to ADH in the collecting duct. An effective alternative for subjects with persistent hyponatraemia due to prolonged SIADH is oral urea therapy (30–45 g/day), which provides a solute load to promote water excretion. Where available, oral vasopressin receptor antagonists such as tolvaptan may be used to block the ADH-mediated component of water retention in a range of hyponatraemic conditions. Hypervolaemic patients with hyponatraemia need treatment of the underlying condition, accompanied by cautious use of diuretics in conjunction with strict fluid restriction. Potassium-sparing diuretics may be particularly useful in this context where there is significant secondary hyperaldosteronism.
HypernatraemiaAetiology and clinical assessmentJust as hyponatraemia represents a failure of the mecha-nisms for diluting the urine during free access to water, so hypernatraemia (plasma Na > 148 mmol/L) reflects inadequate concentration of the urine in the face of restricted water intake. This can be due to failure to generate an adequate medullary concentration gradient (low GFR states, loop diuretic therapy), but more com-monly it is due to failure of the ADH system, either because of pituitary damage (central or ‘cranial’ diabetes insipidus, p. 794) or because the collecting duct cells are unable to respond to circulating ADH (nephrogenic dia-betes insipidus).
Patients with hypernatraemia generally have reduced cerebral function, either as a primary problem or as a consequence of the hypernatraemia itself, which results in dehydration of neurons and brain shrinkage. In the presence of an intact thirst mechanism and preserved capacity to obtain and ingest water, hypernatraemia may not progress very far. If adequate water is not obtained, dizziness, confusion, weakness and ultimately coma and death can result.
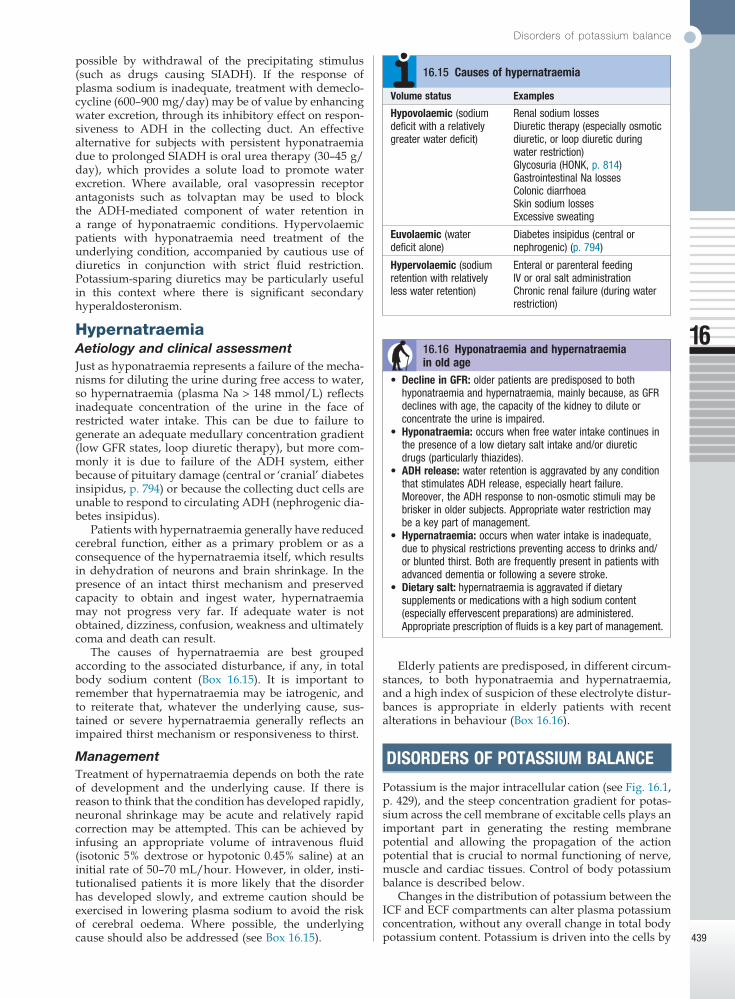
The causes of hypernatraemia are best grouped according to the associated disturbance, if any, in total body sodium content (Box 16.15). It is important to remember that hypernatraemia may be iatrogenic, and to reiterate that, whatever the underlying cause, sus-tained or severe hypernatraemia generally reflects an impaired thirst mechanism or responsiveness to thirst.
ManagementTreatment of hypernatraemia depends on both the rate of development and the underlying cause. If there is reason to think that the condition has developed rapidly, neuronal shrinkage may be acute and relatively rapid correction may be attempted. This can be achieved by infusing an appropriate volume of intravenous fluid (isotonic 5% dextrose or hypotonic 0.45% saline) at an initial rate of 50–70 mL/hour. However, in older, insti-tutionalised patients it is more likely that the disorder has developed slowly, and extreme caution should be exercised in lowering plasma sodium to avoid the risk of cerebral oedema. Where possible, the underlying cause should also be addressed (see Box 16.15).
Volume status Examples
Hypovolaemic (sodium deficit with a relatively greater water deficit)
Renal sodium lossesDiuretic therapy (especially osmotic diuretic, or loop diuretic during water restriction)Glycosuria (HONK, p. 814)Gastrointestinal Na lossesColonic diarrhoeaSkin sodium lossesExcessive sweating
Euvolaemic (water deficit alone)
Diabetes insipidus (central or nephrogenic) (p. 794)
Hypervolaemic (sodium retention with relatively less water retention)
Enteral or parenteral feedingIV or oral salt administrationChronic renal failure (during water restriction)
16.15 Causes of hypernatraemia
• Decline in GFR: older patients are predisposed to both hyponatraemia and hypernatraemia, mainly because, as GFR declines with age, the capacity of the kidney to dilute or concentrate the urine is impaired.
• Hyponatraemia: occurs when free water intake continues in the presence of a low dietary salt intake and/or diuretic drugs (particularly thiazides).
• ADH release: water retention is aggravated by any condition that stimulates ADH release, especially heart failure. Moreover, the ADH response to non-osmotic stimuli may be brisker in older subjects. Appropriate water restriction may be a key part of management.
• Hypernatraemia: occurs when water intake is inadequate, due to physical restrictions preventing access to drinks and/or blunted thirst. Both are frequently present in patients with advanced dementia or following a severe stroke.
• Dietary salt: hypernatraemia is aggravated if dietary supplements or medications with a high sodium content (especially effervescent preparations) are administered. Appropriate prescription of fluids is a key part of management.
16.16 Hyponatraemia and hypernatraemia in old age
CliniCal bioChemistry and metabolism
16
440
extracellular alkalosis and by a number of hormones, including insulin, catecholamines (through the β2 recep-tor) and aldosterone. Any of these factors can produce hypokalaemia, whereas extracellular acidosis, lack of insulin, and insufficiency or blockade of catecholamines or aldosterone can cause hyperkalaemia due to efflux of potassium from the intracellular compartment.
Functional anatomy and physiology of renal potassium handling
In the steady state, the kidneys excrete some 90% of the daily intake of potassium, typically 80–100 mmol/day. Potassium is freely filtered at the glomerulus; around 65% is reabsorbed in the proximal tubule and a further 25% in the thick ascending limb of the loop of Henle. Little potassium is transported in the early distal tubule but a significant secretory flux of potassium into the urine occurs in the late distal tubule and cortical collect-ing duct to ensure that the amount removed from the blood is proportional to the ingested load.
The mechanism for potassium secretion in the distal parts of the nephron is shown in Figure 16.3D (p. 431). Movement of potassium from blood to lumen is depend-ent on active uptake across the basal cell membrane by the Na,K-ATPase, followed by diffusion of potassium through a luminal membrane potassium channel (ROMK) into the tubular fluid. The electrochemical gra-dient for potassium movement into the lumen is con-tributed to both by the high intracellular potassium concentration and by the negative luminal potential dif-ference relative to the blood.
A number of factors influence the rate of potassium secretion. Luminal influences include the rate of sodium delivery and fluid flow through the late distal tubule and cortical collecting ducts. This is a major factor responsible for the increased potassium loss that accom-panies diuretic treatment. Agents interfering with the generation of the negative luminal potential also impair potassium secretion, and this is the basis of reduced potassium secretion associated with potassium-sparing diuretics such as amiloride. Factors acting on the blood side of this tubular segment include plasma potassium and pH, such that hyperkalaemia and alkalosis both enhance potassium secretion directly. However, the most important factor in the acute and chronic adjustment of potassium secretion to match metabolic potassium load is aldosterone.
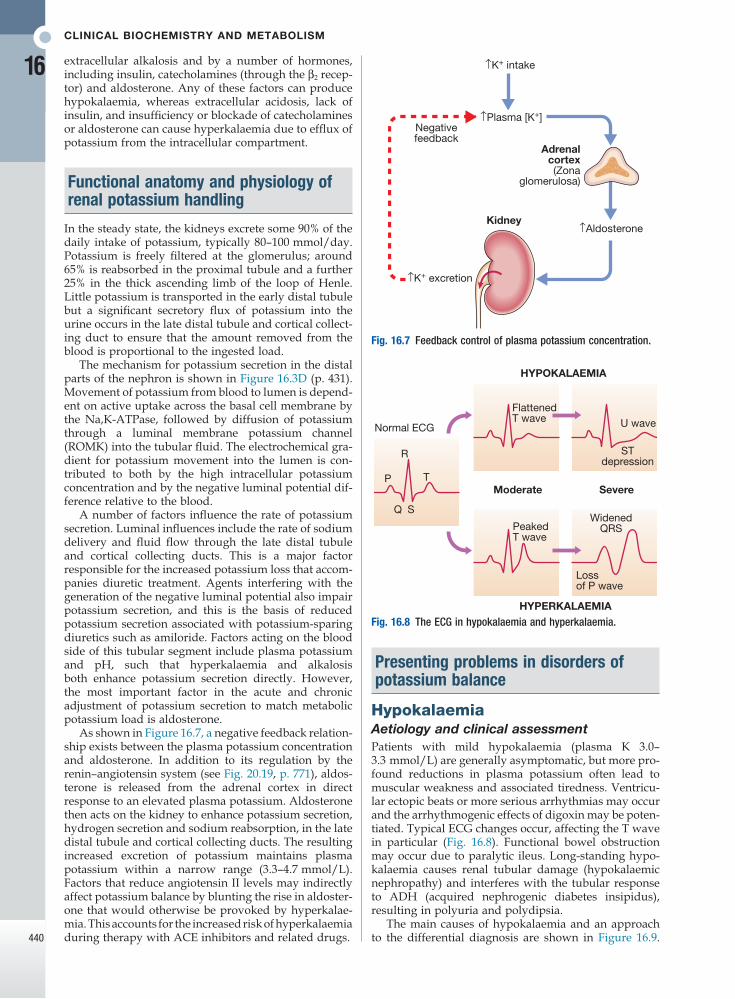
As shown in Figure 16.7, a negative feedback relation-ship exists between the plasma potassium concentration and aldosterone. In addition to its regulation by the renin–angiotensin system (see Fig. 20.19, p. 771), aldos-terone is released from the adrenal cortex in direct response to an elevated plasma potassium. Aldosterone then acts on the kidney to enhance potassium secretion, hydrogen secretion and sodium reabsorption, in the late distal tubule and cortical collecting ducts. The resulting increased excretion of potassium maintains plasma potassium within a narrow range (3.3–4.7 mmol/L). Factors that reduce angiotensin II levels may indirectly affect potassium balance by blunting the rise in aldoster-one that would otherwise be provoked by hyperkalae-mia. This accounts for the increased risk of hyperkalaemia during therapy with ACE inhibitors and related drugs.
Fig. 16.7 Feedback control of plasma potassium concentration.
Kidney
↑K+ excretion
Adrenalcortex(Zona
glomerulosa)
↑Plasma [K+]
↑K+ intake
Negativefeedback
↑Aldosterone
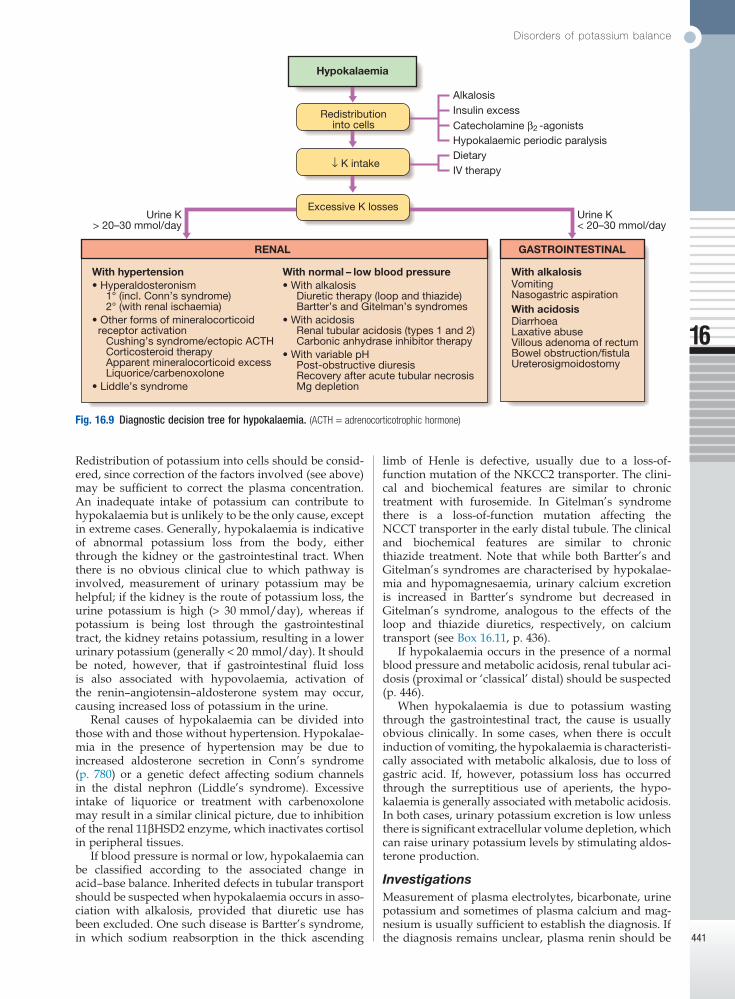
Fig. 16.8 The ECG in hypokalaemia and hyperkalaemia.
R
P T
Q S
Normal ECG
FlattenedT wave
HYPOKALAEMIA
PeakedT wave
Moderate
U wave
STdepression
Severe
HYPERKALAEMIA
WidenedQRS
Lossof P wave
Presenting problems in disorders of potassium balance
HypokalaemiaAetiology and clinical assessmentPatients with mild hypokalaemia (plasma K 3.0–3.3 mmol/L) are generally asymptomatic, but more pro-found reductions in plasma potassium often lead to muscular weakness and associated tiredness. Ventricu-lar ectopic beats or more serious arrhythmias may occur and the arrhythmogenic effects of digoxin may be poten-tiated. Typical ECG changes occur, affecting the T wave in particular (Fig. 16.8). Functional bowel obstruction may occur due to paralytic ileus. Long-standing hypo-kalaemia causes renal tubular damage (hypokalaemic nephropathy) and interferes with the tubular response to ADH (acquired nephrogenic diabetes insipidus), resulting in polyuria and polydipsia.
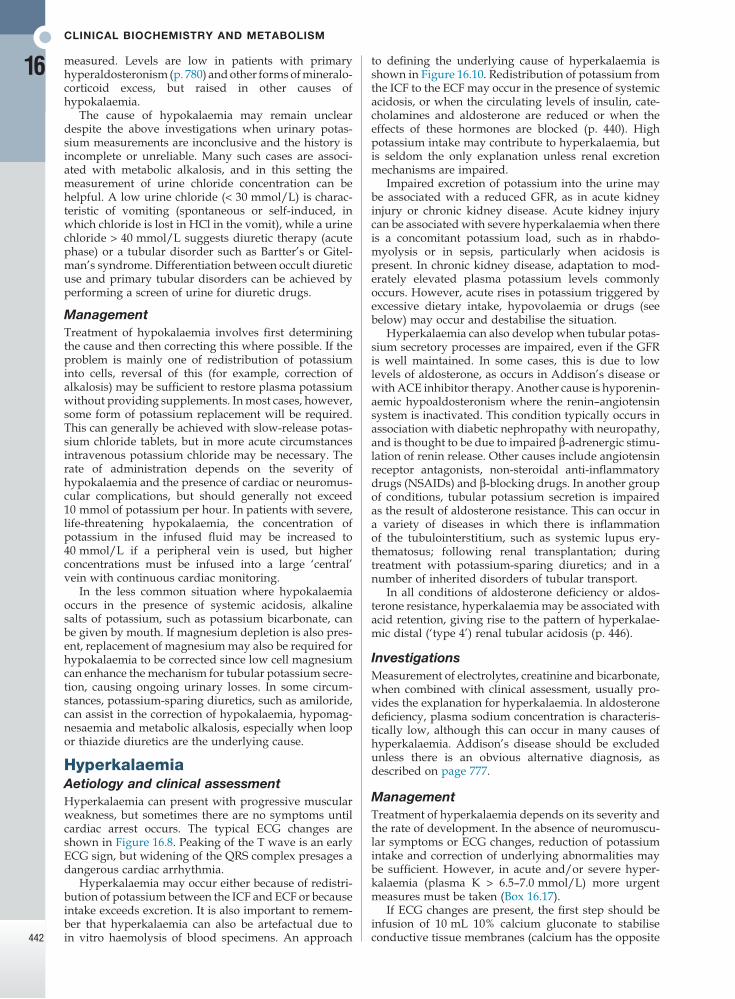
The main causes of hypokalaemia and an approach to the differential diagnosis are shown in Figure 16.9.
Disorders of potassium balance
16
441
limb of Henle is defective, usually due to a loss-of- function mutation of the NKCC2 transporter. The clini-cal and biochemical features are similar to chronic treatment with furosemide. In Gitelman’s syndrome there is a loss-of-function mutation affecting the NCCT transporter in the early distal tubule. The clinical and biochemical features are similar to chronic thiazide treatment. Note that while both Bartter’s and Gitelman’s syndromes are characterised by hypokalae-mia and hypomagnesaemia, urinary calcium excretion is increased in Bartter’s syndrome but decreased in Gitelman’s syndrome, analogous to the effects of the loop and thiazide diuretics, respectively, on calcium transport (see Box 16.11, p. 436).
If hypokalaemia occurs in the presence of a normal blood pressure and metabolic acidosis, renal tubular aci-dosis (proximal or ‘classical’ distal) should be suspected (p. 446).
When hypokalaemia is due to potassium wasting through the gastrointestinal tract, the cause is usually obvious clinically. In some cases, when there is occult induction of vomiting, the hypokalaemia is characteristi-cally associated with metabolic alkalosis, due to loss of gastric acid. If, however, potassium loss has occurred through the surreptitious use of aperients, the hypo-kalaemia is generally associated with metabolic acidosis. In both cases, urinary potassium excretion is low unless there is significant extracellular volume depletion, which can raise urinary potassium levels by stimulating aldos-terone production.
InvestigationsMeasurement of plasma electrolytes, bicarbonate, urine potassium and sometimes of plasma calcium and mag-nesium is usually sufficient to establish the diagnosis. If the diagnosis remains unclear, plasma renin should be
Redistribution of potassium into cells should be consid-ered, since correction of the factors involved (see above) may be sufficient to correct the plasma concentration. An inadequate intake of potassium can contribute to hypokalaemia but is unlikely to be the only cause, except in extreme cases. Generally, hypokalaemia is indicative of abnormal potassium loss from the body, either through the kidney or the gastrointestinal tract. When there is no obvious clinical clue to which pathway is involved, measurement of urinary potassium may be helpful; if the kidney is the route of potassium loss, the urine potassium is high (> 30 mmol/day), whereas if potassium is being lost through the gastrointestinal tract, the kidney retains potassium, resulting in a lower urinary potassium (generally < 20 mmol/day). It should be noted, however, that if gastrointestinal fluid loss is also associated with hypovolaemia, activation of the renin–angiotensin–aldosterone system may occur, causing increased loss of potassium in the urine.
Renal causes of hypokalaemia can be divided into those with and those without hypertension. Hypokalae-mia in the presence of hypertension may be due to increased aldosterone secretion in Conn’s syndrome (p. 780) or a genetic defect affecting sodium channels in the distal nephron (Liddle’s syndrome). Excessive intake of liquorice or treatment with carbenoxolone may result in a similar clinical picture, due to inhibition of the renal 11βHSD2 enzyme, which inactivates cortisol in peripheral tissues.
If blood pressure is normal or low, hypokalaemia can be classified according to the associated change in acid–base balance. Inherited defects in tubular transport should be suspected when hypokalaemia occurs in asso-ciation with alkalosis, provided that diuretic use has been excluded. One such disease is Bartter’s syndrome, in which sodium reabsorption in the thick ascending
Fig. 16.9 Diagnostic decision tree for hypokalaemia. (ACTH = adrenocorticotrophic hormone)
Hypokalaemia
Redistributioninto cells
↓ K intake
Excessive K losses
Insulin excessCatecholamine β2 -agonists
Alkalosis
Hypokalaemic periodic paralysisDietaryIV therapy
Urine K> 20–30 mmol/day
RENAL
With hypertension• Hyperaldosteronism 1° (incl. Conn’s syndrome) 2° (with renal ischaemia)• Other forms of mineralocorticoid receptor activation Cushing’s syndrome/ectopic ACTH Corticosteroid therapy Apparent mineralocorticoid excess Liquorice/carbenoxolone• Liddle’s syndrome
Urine K< 20–30 mmol/day
GASTROINTESTINAL
With alkalosisVomitingNasogastric aspirationWith acidosisDiarrhoeaLaxative abuseVillous adenoma of rectumBowel obstruction/fistulaUreterosigmoidostomy
With normal – low blood pressure• With alkalosis Diuretic therapy (loop and thiazide) Bartter’s and Gitelman’s syndromes• With acidosis Renal tubular acidosis (types 1 and 2) Carbonic anhydrase inhibitor therapy• With variable pH Post-obstructive diuresis Recovery after acute tubular necrosis Mg depletion
CliniCal bioChemistry and metabolism
16
442
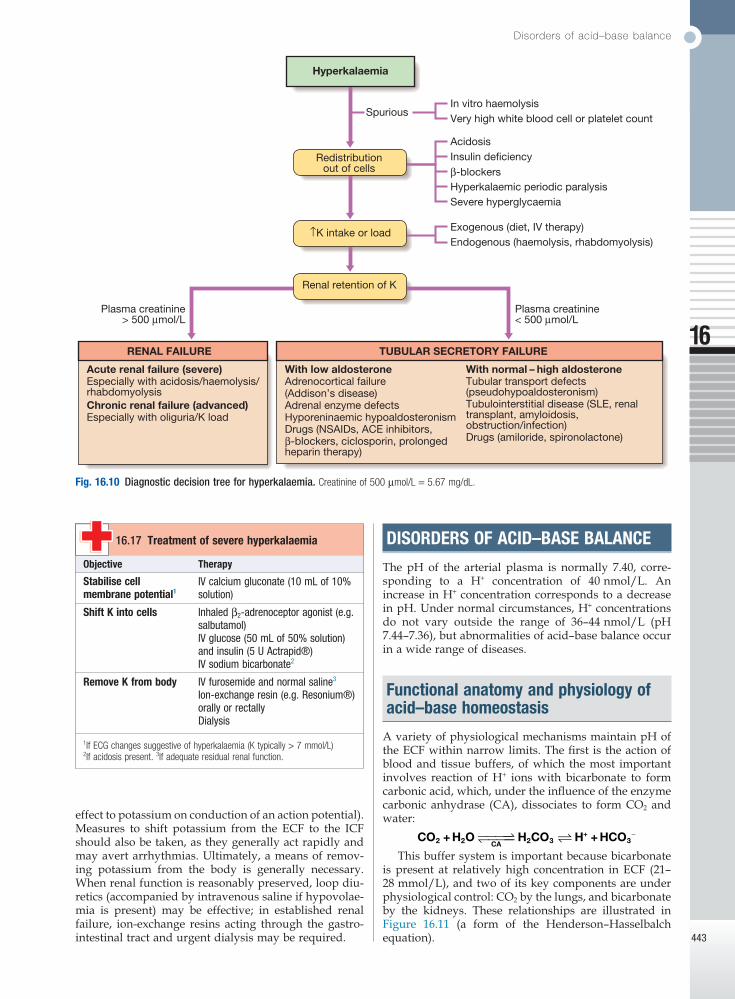
to defining the underlying cause of hyperkalaemia is shown in Figure 16.10. Redistribution of potassium from the ICF to the ECF may occur in the presence of systemic acidosis, or when the circulating levels of insulin, cate-cholamines and aldosterone are reduced or when the effects of these hormones are blocked (p. 440). High potassium intake may contribute to hyperkalaemia, but is seldom the only explanation unless renal excretion mechanisms are impaired.
Impaired excretion of potassium into the urine may be associated with a reduced GFR, as in acute kidney injury or chronic kidney disease. Acute kidney injury can be associated with severe hyperkalaemia when there is a concomitant potassium load, such as in rhabdo-myolysis or in sepsis, particularly when acidosis is present. In chronic kidney disease, adaptation to mod-erately elevated plasma potassium levels commonly occurs. However, acute rises in potassium triggered by excessive dietary intake, hypovolaemia or drugs (see below) may occur and destabilise the situation.
Hyperkalaemia can also develop when tubular potas-sium secretory processes are impaired, even if the GFR is well maintained. In some cases, this is due to low levels of aldosterone, as occurs in Addison’s disease or with ACE inhibitor therapy. Another cause is hyporenin-aemic hypoaldosteronism where the renin–angiotensin system is inactivated. This condition typically occurs in association with diabetic nephropathy with neuropathy, and is thought to be due to impaired β-adrenergic stimu-lation of renin release. Other causes include angiotensin receptor antagonists, non-steroidal anti-inflammatory drugs (NSAIDs) and β-blocking drugs. In another group of conditions, tubular potassium secretion is impaired as the result of aldosterone resistance. This can occur in a variety of diseases in which there is inflammation of the tubulointerstitium, such as systemic lupus ery-thematosus; following renal transplantation; during treatment with potassium-sparing diuretics; and in a number of inherited disorders of tubular transport.
In all conditions of aldosterone deficiency or aldos-terone resistance, hyperkalaemia may be associated with acid retention, giving rise to the pattern of hyperkalae-mic distal (‘type 4’) renal tubular acidosis (p. 446).
InvestigationsMeasurement of electrolytes, creatinine and bicarbonate, when combined with clinical assessment, usually pro-vides the explanation for hyperkalaemia. In aldosterone deficiency, plasma sodium concentration is characteris-tically low, although this can occur in many causes of hyperkalaemia. Addison’s disease should be excluded unless there is an obvious alternative diagnosis, as described on page 777.
ManagementTreatment of hyperkalaemia depends on its severity and the rate of development. In the absence of neuromuscu-lar symptoms or ECG changes, reduction of potassium intake and correction of underlying abnormalities may be sufficient. However, in acute and/or severe hyper-kalaemia (plasma K > 6.5–7.0 mmol/L) more urgent measures must be taken (Box 16.17).
If ECG changes are present, the first step should be infusion of 10 mL 10% calcium gluconate to stabilise conductive tissue membranes (calcium has the opposite
measured. Levels are low in patients with primary hyperaldosteronism (p. 780) and other forms of mineralo-corticoid excess, but raised in other causes of hypokalaemia.
The cause of hypokalaemia may remain unclear despite the above investigations when urinary potas-sium measurements are inconclusive and the history is incomplete or unreliable. Many such cases are associ-ated with metabolic alkalosis, and in this setting the measurement of urine chloride concentration can be helpful. A low urine chloride (< 30 mmol/L) is charac-teristic of vomiting (spontaneous or self-induced, in which chloride is lost in HCl in the vomit), while a urine chloride > 40 mmol/L suggests diuretic therapy (acute phase) or a tubular disorder such as Bartter’s or Gitel-man’s syndrome. Differentiation between occult diuretic use and primary tubular disorders can be achieved by performing a screen of urine for diuretic drugs.
ManagementTreatment of hypokalaemia involves first determining the cause and then correcting this where possible. If the problem is mainly one of redistribution of potassium into cells, reversal of this (for example, correction of alkalosis) may be sufficient to restore plasma potassium without providing supplements. In most cases, however, some form of potassium replacement will be required. This can generally be achieved with slow-release potas-sium chloride tablets, but in more acute circumstances intravenous potassium chloride may be necessary. The rate of administration depends on the severity of hypokalaemia and the presence of cardiac or neuromus-cular complications, but should generally not exceed 10 mmol of potassium per hour. In patients with severe, life-threatening hypokalaemia, the concentration of potassium in the infused fluid may be increased to 40 mmol/L if a peripheral vein is used, but higher concentrations must be infused into a large ‘central’ vein with continuous cardiac monitoring.
In the less common situation where hypokalaemia occurs in the presence of systemic acidosis, alkaline salts of potassium, such as potassium bicarbonate, can be given by mouth. If magnesium depletion is also pres-ent, replacement of magnesium may also be required for hypokalaemia to be corrected since low cell magnesium can enhance the mechanism for tubular potassium secre-tion, causing ongoing urinary losses. In some circum-stances, potassium-sparing diuretics, such as amiloride, can assist in the correction of hypokalaemia, hypomag-nesaemia and metabolic alkalosis, especially when loop or thiazide diuretics are the underlying cause.
HyperkalaemiaAetiology and clinical assessmentHyperkalaemia can present with progressive muscular weakness, but sometimes there are no symptoms until cardiac arrest occurs. The typical ECG changes are shown in Figure 16.8. Peaking of the T wave is an early ECG sign, but widening of the QRS complex presages a dangerous cardiac arrhythmia.
Hyperkalaemia may occur either because of redistri-bution of potassium between the ICF and ECF or because intake exceeds excretion. It is also important to remem-ber that hyperkalaemia can also be artefactual due to in vitro haemolysis of blood specimens. An approach
Disorders of acid–base balance
16
443
DISORDERS OF ACID–BASE BALANCE
The pH of the arterial plasma is normally 7.40, corre-sponding to a H+ concentration of 40 nmol/L. An increase in H+ concentration corresponds to a decrease in pH. Under normal circumstances, H+ concentrations do not vary outside the range of 36–44 nmol/L (pH 7.44–7.36), but abnormalities of acid–base balance occur in a wide range of diseases.
Functional anatomy and physiology of acid–base homeostasis
A variety of physiological mechanisms maintain pH of the ECF within narrow limits. The first is the action of blood and tissue buffers, of which the most important involves reaction of H+ ions with bicarbonate to form carbonic acid, which, under the influence of the enzyme carbonic anhydrase (CA), dissociates to form CO2 and water:
CO H O H CO H HCOCA2 2 2 3 3+ ++� ⇀���↽ ���� � −
This buffer system is important because bicarbonate is present at relatively high concentration in ECF (21–28 mmol/L), and two of its key components are under physiological control: CO2 by the lungs, and bicarbonate by the kidneys. These relationships are illustrated in Figure 16.11 (a form of the Henderson–Hasselbalch equation).
effect to potassium on conduction of an action potential). Measures to shift potassium from the ECF to the ICF should also be taken, as they generally act rapidly and may avert arrhythmias. Ultimately, a means of remov-ing potassium from the body is generally necessary. When renal function is reasonably preserved, loop diu-retics (accompanied by intravenous saline if hypovolae-mia is present) may be effective; in established renal failure, ion-exchange resins acting through the gastro-intestinal tract and urgent dialysis may be required.
Fig. 16.10 Diagnostic decision tree for hyperkalaemia. Creatinine of 500 µmol/L = 5.67 mg/dL.
Hyperkalaemia
Redistributionout of cells
↑K intake or load
Renal retention of K
Insulin deficiencyβ-blockers
Acidosis
Hyperkalaemic periodic paralysis
Exogenous (diet, IV therapy)Endogenous (haemolysis, rhabdomyolysis)
RENAL FAILURE
Acute renal failure (severe)Especially with acidosis/haemolysis/rhabdomyolysisChronic renal failure (advanced)Especially with oliguria/K load
Plasma creatinine< 500 µmol/L
TUBULAR SECRETORY FAILURE
With low aldosteroneAdrenocortical failure(Addison’s disease)Adrenal enzyme defectsHyporeninaemic hypoaldosteronismDrugs (NSAIDs, ACE inhibitors,β-blockers, ciclosporin, prolongedheparin therapy)
Severe hyperglycaemia
In vitro haemolysisVery high white blood cell or platelet count
Spurious
Plasma creatinine> 500 µmol/L
With normal – high aldosteroneTubular transport defects(pseudohypoaldosteronism)Tubulointerstitial disease (SLE, renaltransplant, amyloidosis,obstruction/infection)Drugs (amiloride, spironolactone)
Objective Therapy
Stabilise cell membrane potential1
IV calcium gluconate (10 mL of 10% solution)
Shift K into cells Inhaled β2-adrenoceptor agonist (e.g. salbutamol)IV glucose (50 mL of 50% solution) and insulin (5 U Actrapid®)IV sodium bicarbonate2
Remove K from body IV furosemide and normal saline3
Ion-exchange resin (e.g. Resonium®) orally or rectallyDialysis
1If ECG changes suggestive of hyperkalaemia (K typically > 7 mmol/L)2If acidosis present. 3If adequate residual renal function.
16.17 Treatment of severe hyperkalaemia
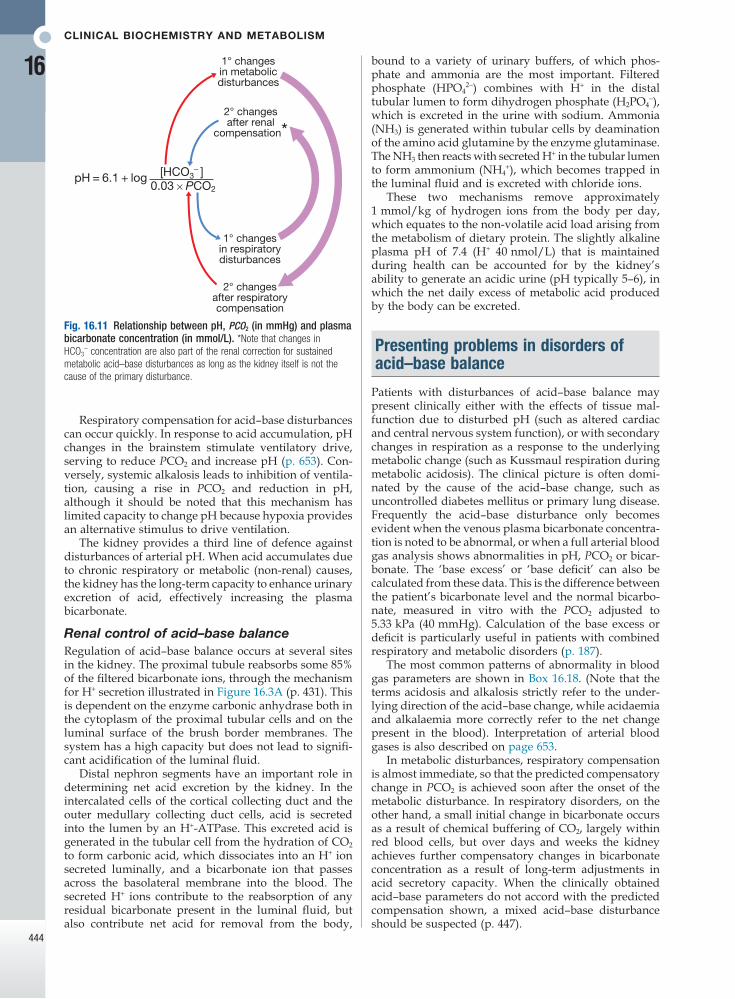
CliniCal bioChemistry and metabolism
16
444
bound to a variety of urinary buffers, of which phos-phate and ammonia are the most important. Filtered phosphate (HPO4
2−) combines with H+ in the distal tubular lumen to form dihydrogen phosphate (H2PO4
−), which is excreted in the urine with sodium. Ammonia (NH3) is generated within tubular cells by deamination of the amino acid glutamine by the enzyme glutaminase. The NH3 then reacts with secreted H+ in the tubular lumen to form ammonium (NH4
+), which becomes trapped in the luminal fluid and is excreted with chloride ions.
These two mechanisms remove approximately 1 mmol/kg of hydrogen ions from the body per day, which equates to the non-volatile acid load arising from the metabolism of dietary protein. The slightly alkaline plasma pH of 7.4 (H+ 40 nmol/L) that is maintained during health can be accounted for by the kidney’s ability to generate an acidic urine (pH typically 5–6), in which the net daily excess of metabolic acid produced by the body can be excreted.
Presenting problems in disorders of acid–base balance
Patients with disturbances of acid–base balance may present clinically either with the effects of tissue mal-function due to disturbed pH (such as altered cardiac and central nervous system function), or with secondary changes in respiration as a response to the underlying metabolic change (such as Kussmaul respiration during metabolic acidosis). The clinical picture is often domi-nated by the cause of the acid–base change, such as uncontrolled diabetes mellitus or primary lung disease. Frequently the acid–base disturbance only becomes evident when the venous plasma bicarbonate concentra-tion is noted to be abnormal, or when a full arterial blood gas analysis shows abnormalities in pH, PCO2 or bicar-bonate. The ‘base excess’ or ‘base deficit’ can also be calculated from these data. This is the difference between the patient’s bicarbonate level and the normal bicarbo-nate, measured in vitro with the PCO2 adjusted to 5.33 kPa (40 mmHg). Calculation of the base excess or deficit is particularly useful in patients with combined respiratory and metabolic disorders (p. 187).
The most common patterns of abnormality in blood gas parameters are shown in Box 16.18. (Note that the terms acidosis and alkalosis strictly refer to the under-lying direction of the acid–base change, while acidaemia and alkalaemia more correctly refer to the net change present in the blood). Interpretation of arterial blood gases is also described on page 653.
In metabolic disturbances, respiratory compensation is almost immediate, so that the predicted compensatory change in PCO2 is achieved soon after the onset of the metabolic disturbance. In respiratory disorders, on the other hand, a small initial change in bicarbonate occurs as a result of chemical buffering of CO2, largely within red blood cells, but over days and weeks the kidney achieves further compensatory changes in bicarbonate concentration as a result of long-term adjustments in acid secretory capacity. When the clinically obtained acid–base parameters do not accord with the predicted compensation shown, a mixed acid–base disturbance should be suspected (p. 447).
Respiratory compensation for acid–base disturbances can occur quickly. In response to acid accumulation, pH changes in the brainstem stimulate ventilatory drive, serving to reduce PCO2 and increase pH (p. 653). Con-versely, systemic alkalosis leads to inhibition of ventila-tion, causing a rise in PCO2 and reduction in pH, although it should be noted that this mechanism has limited capacity to change pH because hypoxia provides an alternative stimulus to drive ventilation.
The kidney provides a third line of defence against disturbances of arterial pH. When acid accumulates due to chronic respiratory or metabolic (non-renal) causes, the kidney has the long-term capacity to enhance urinary excretion of acid, effectively increasing the plasma bicarbonate.
Renal control of acid–base balanceRegulation of acid–base balance occurs at several sites in the kidney. The proximal tubule reabsorbs some 85% of the filtered bicarbonate ions, through the mechanism for H+ secretion illustrated in Figure 16.3A (p. 431). This is dependent on the enzyme carbonic anhydrase both in the cytoplasm of the proximal tubular cells and on the luminal surface of the brush border membranes. The system has a high capacity but does not lead to signifi-cant acidification of the luminal fluid.
Distal nephron segments have an important role in determining net acid excretion by the kidney. In the intercalated cells of the cortical collecting duct and the outer medullary collecting duct cells, acid is secreted into the lumen by an H+-ATPase. This excreted acid is generated in the tubular cell from the hydration of CO2 to form carbonic acid, which dissociates into an H+ ion secreted luminally, and a bicarbonate ion that passes across the basolateral membrane into the blood. The secreted H+ ions contribute to the reabsorption of any residual bicarbonate present in the luminal fluid, but also contribute net acid for removal from the body,
Fig. 16.11 Relationship between pH, PCO2 (in mmHg) and plasma bicarbonate concentration (in mmol/L). *Note that changes in HCO3
− concentration are also part of the renal correction for sustained metabolic acid–base disturbances as long as the kidney itself is not the cause of the primary disturbance.
pH = 6.1 + log [HCO3− ]
0.03 × PCO2
1° changesin metabolicdisturbances
2° changesafter renal
compensation*
2° changesafter respiratorycompensation
1° changesin respiratorydisturbances
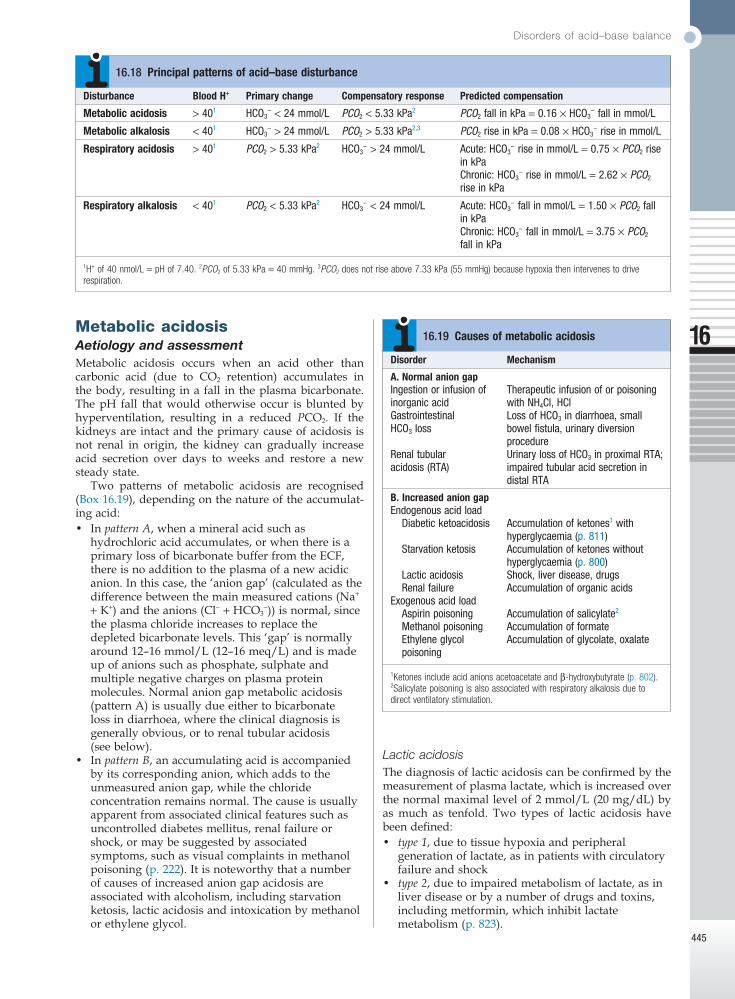
Disorders of acid–base balance
16
445
Metabolic acidosisAetiology and assessmentMetabolic acidosis occurs when an acid other than carbonic acid (due to CO2 retention) accumulates in the body, resulting in a fall in the plasma bicarbonate. The pH fall that would otherwise occur is blunted by hyperventilation, resulting in a reduced PCO2. If the kidneys are intact and the primary cause of acidosis is not renal in origin, the kidney can gradually increase acid secretion over days to weeks and restore a new steady state.
Two patterns of metabolic acidosis are recognised (Box 16.19), depending on the nature of the accumulat-ing acid:• In pattern A, when a mineral acid such as
hydrochloric acid accumulates, or when there is a primary loss of bicarbonate buffer from the ECF, there is no addition to the plasma of a new acidic anion. In this case, the ‘anion gap’ (calculated as the difference between the main measured cations (Na+ + K+) and the anions (Cl− + HCO3
−)) is normal, since the plasma chloride increases to replace the depleted bicarbonate levels. This ‘gap’ is normally around 12–16 mmol/L (12–16 meq/L) and is made up of anions such as phosphate, sulphate and multiple negative charges on plasma protein molecules. Normal anion gap metabolic acidosis (pattern A) is usually due either to bicarbonate loss in diarrhoea, where the clinical diagnosis is generally obvious, or to renal tubular acidosis (see below).
• In pattern B, an accumulating acid is accompanied by its corresponding anion, which adds to the unmeasured anion gap, while the chloride concentration remains normal. The cause is usually apparent from associated clinical features such as uncontrolled diabetes mellitus, renal failure or shock, or may be suggested by associated symptoms, such as visual complaints in methanol poisoning (p. 222). It is noteworthy that a number of causes of increased anion gap acidosis are associated with alcoholism, including starvation ketosis, lactic acidosis and intoxication by methanol or ethylene glycol.
Lactic acidosisThe diagnosis of lactic acidosis can be confirmed by the measurement of plasma lactate, which is increased over the normal maximal level of 2 mmol/L (20 mg/dL) by as much as tenfold. Two types of lactic acidosis have been defined:• type 1, due to tissue hypoxia and peripheral
generation of lactate, as in patients with circulatory failure and shock
• type 2, due to impaired metabolism of lactate, as in liver disease or by a number of drugs and toxins, including metformin, which inhibit lactate metabolism (p. 823).
Disturbance Blood H+ Primary change Compensatory response Predicted compensation
Metabolic acidosis > 401 HCO3− < 24 mmol/L PCO2 < 5.33 kPa2 PCO2 fall in kPa = 0.16 × HCO3
− fall in mmol/L
Metabolic alkalosis < 401 HCO3− > 24 mmol/L PCO2 > 5.33 kPa2,3 PCO2 rise in kPa = 0.08 × HCO3
− rise in mmol/L
Respiratory acidosis > 401 PCO2 > 5.33 kPa2 HCO3− > 24 mmol/L Acute: HCO3
− rise in mmol/L = 0.75 × PCO2 rise in kPaChronic: HCO3
− rise in mmol/L = 2.62 × PCO2 rise in kPa
Respiratory alkalosis < 401 PCO2 < 5.33 kPa2 HCO3− < 24 mmol/L Acute: HCO3
− fall in mmol/L = 1.50 × PCO2 fall in kPaChronic: HCO3
− fall in mmol/L = 3.75 × PCO2 fall in kPa
1H+ of 40 nmol/L = pH of 7.40. 2PCO2 of 5.33 kPa = 40 mmHg. 3PCO2 does not rise above 7.33 kPa (55 mmHg) because hypoxia then intervenes to drive respiration.
16.18 Principal patterns of acid–base disturbance
Disorder Mechanism
A. Normal anion gapIngestion or infusion of inorganic acid
Therapeutic infusion of or poisoning with NH4Cl, HCl
Gastrointestinal HCO3 loss
Loss of HCO3 in diarrhoea, small bowel fistula, urinary diversion procedure
Renal tubular acidosis (RTA)
Urinary loss of HCO3 in proximal RTA; impaired tubular acid secretion in distal RTA
B. Increased anion gapEndogenous acid load Diabetic ketoacidosis Accumulation of ketones1 with
hyperglycaemia (p. 811) Starvation ketosis Accumulation of ketones without
hyperglycaemia (p. 800) Lactic acidosis Shock, liver disease, drugs Renal failure Accumulation of organic acidsExogenous acid load Aspirin poisoning Accumulation of salicylate2
Methanol poisoning Accumulation of formate Ethylene glycol
poisoningAccumulation of glycolate, oxalate
1Ketones include acid anions acetoacetate and β-hydroxybutyrate (p. 802).2Salicylate poisoning is also associated with respiratory alkalosis due to direct ventilatory stimulation.
16.19 Causes of metabolic acidosis

CliniCal bioChemistry and metabolism
16
446
renal stone formation and nephrocalcinosis. Potassium is also lost in classical distal RTA, while it is retained in hyperkalaemic distal RTA.
ManagementThe first step in management of metabolic acidosis is to identify and correct the underlying cause when possible (see Box 16.19). This may involve controlling diarrhoea, treating diabetes mellitus, correcting shock, stopping drugs that might cause the condition, or using dialysis to remove toxins. Since metabolic acidosis is frequently associated with sodium and water depletion, resuscita-tion with intravenous fluids is often needed. Use of intravenous bicarbonate in this setting is controversial. Because rapid correction of acidosis can induce hypo-kalaemia or a fall in plasma ionised calcium, the use of bicarbonate infusions is best reserved for situations where the underlying disorder cannot be readily cor-rected and acidosis is severe (H+ > 100 nmol/L, pH < 7.00) or associated with evidence of tissue dysfunction.
The acidosis in RTA can sometimes be controlled by treating the underlying cause (see Box 16.20), but sup-plements of sodium and potassium bicarbonate are usually also necessary in types 1 and 2 RTA to achieve a target plasma bicarbonate level of above 18 mmol/L and normokalaemia. In type 4 RTA, loop diuretics, thi-azides or fludrocortisone (as appropriate to the under-lying diagnosis) may be effective in correcting the acidosis and the hyperkalaemia.
Metabolic alkalosisAetiology and clinical assessmentMetabolic alkalosis is characterised by an increase in the plasma bicarbonate concentration and the plasma pH (see Box 16.18). There is a compensatory rise in PCO2 due to hypoventilation but this is limited by the need to avoid hypoxia. The causes are best classified by the accompanying changes in ECF volume.
Hypovolaemic metabolic alkalosis is the most common pattern. This can be caused by sustained vomit-ing, in which acid-rich fluid is lost directly from the body, or by treatment with loop diuretics or thiazides. In the case of sustained vomiting, loss of gastric acid is the immediate cause of the alkalosis, but several factors act to sustain or amplify this in the context of volume depletion (Fig. 16.12). Loss of sodium and fluid leads to hypovolaemia and secondary hyperaldosteronism, trig-gering proximal sodium bicarbonate reabsorption and additional acid secretion by the distal tubule. Hypo-kalaemia occurs due to potassium loss in the vomitus and by the kidney as the result of secondary hyperaldos-teronism, and itself is a stimulus to acid secretion. Additionally, the compensatory rise in PCO2 further enhances tubular acid secretion. The net result is sus-tained metabolic alkalosis with an inappropriately acid urine, which cannot be corrected until the deficit in circulating volume has been replaced.
Normovolaemic (or hypervolaemic) metabolic alka-losis occurs when bicarbonate retention and volume expansion occur simultaneously. Classical causes include primary hyperaldosteronism (Conn’s syn-drome, p. 780), Cushing’s syndrome (p. 773) and cortico-steroid therapy (p. 776). Occasionally, overuse of antacid salts for treatment of dyspepsia produces a similar pattern.
Renal tubular acidosisRenal tubular acidosis (RTA) should be suspected when there is a hyperchloraemic acidosis with a normal anion gap and no evidence of gastrointestinal disturbance. The urine pH is inappropriately high (> 5.5) in the presence of systemic acidosis. RTA can be caused by a defect in one of three processes: impaired bicarbonate reabsorption in the proximal tubule (proximal RTA); impaired acid secretion in the late distal tubule or cortical collecting duct intercalated cells (classical distal RTA); or impaired sodium reabsorption in the late distal tubule or cortical collecting duct, which is associated with reduced secretion of both potassium and H+ ions (hyperkalaemic distal RTA).
Various subtypes of RTA are recognised and the most common causes are shown in Box 16.20. The inherited forms of RTA are due to mutations in the genes that regulate acid or bicarbonate transport in the renal tubules (see Fig. 16.3, p. 431). However, RTA is often an acquired disorder and in these circumstances the meta-bolic acidosis may serve as an early clue to the under-lying diagnosis.
Sometimes distal RTA is ‘incomplete’ and the plasma bicarbonate concentration is normal under resting con-ditions. However, in incomplete distal RTA the urine pH fails to fall below 5.3 after an acid challenge test, involv-ing the ingestion of ammonium chloride sufficient to lower the plasma bicarbonate.
A number of features allow differentiation of types of RTA. Proximal RTA is frequently associated with urinary wasting of amino acids, phosphate and glucose (Fanconi’s syndrome), as well as bicarbonate and potas-sium. Patients with this disorder can lower the urine pH when the acidosis is severe and plasma bicarbonate levels have fallen below 16 mmol/L since distal H+ secretion mechanisms are intact. In the classical form of distal RTA, however, acid accumulation is relentless and progressive, resulting in mobilisation of calcium from bone and consequent osteomalacia with hypercalciuria,
Proximal renal tubular acidosis
• InheritedFanconi’s syndromeCystinosisWilson’s disease
• ParaproteinaemiaMyeloma
• Amyloidosis• Hyperparathyroidism
• Heavy metal toxicityLead, cadmium and mercury poisoning
• DrugsCarbonic anhydrase inhibitorsIfosfamide
Classical distal renal tubular acidosis
• Inherited• Autoimmune diseases
Systemic lupus erythematosusSjögren’s syndrome
• Hyperglobulinaemia• Toxins and drugs
TolueneLithiumAmphotericin
Hyperkalaemic distal renal tubular acidosis
• Hypoaldosteronism (primary or secondary)
• Obstructive nephropathy• Renal transplant rejection
• DrugsAmilorideSpironolactone
16.20 Causes of renal tubular acidosis
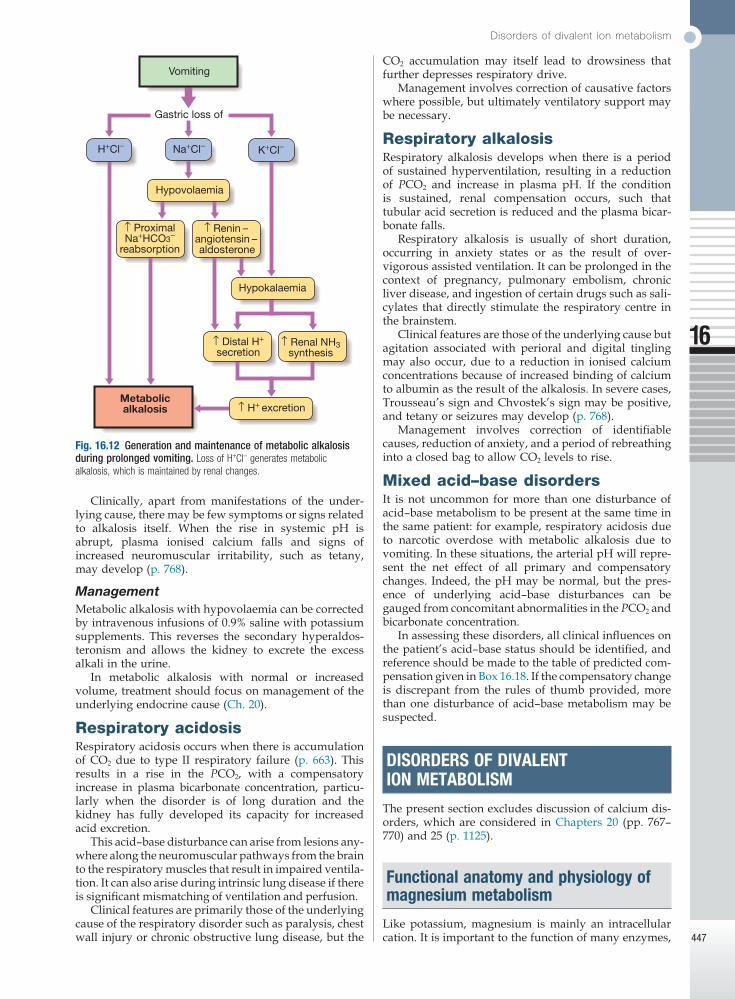
Disorders of divalent ion metabolism
16
447
CO2 accumulation may itself lead to drowsiness that further depresses respiratory drive.
Management involves correction of causative factors where possible, but ultimately ventilatory support may be necessary.
Respiratory alkalosisRespiratory alkalosis develops when there is a period of sustained hyperventilation, resulting in a reduction of PCO2 and increase in plasma pH. If the condition is sustained, renal compensation occurs, such that tubular acid secretion is reduced and the plasma bicar-bonate falls.
Respiratory alkalosis is usually of short duration, occurring in anxiety states or as the result of over-vigorous assisted ventilation. It can be prolonged in the context of pregnancy, pulmonary embolism, chronic liver disease, and ingestion of certain drugs such as sali-cylates that directly stimulate the respiratory centre in the brainstem.
Clinical features are those of the underlying cause but agitation associated with perioral and digital tingling may also occur, due to a reduction in ionised calcium concentrations because of increased binding of calcium to albumin as the result of the alkalosis. In severe cases, Trousseau’s sign and Chvostek’s sign may be positive, and tetany or seizures may develop (p. 768).
Management involves correction of identifiable causes, reduction of anxiety, and a period of rebreathing into a closed bag to allow CO2 levels to rise.
Mixed acid–base disordersIt is not uncommon for more than one disturbance of acid–base metabolism to be present at the same time in the same patient: for example, respiratory acidosis due to narcotic overdose with metabolic alkalosis due to vomiting. In these situations, the arterial pH will repre-sent the net effect of all primary and compensatory changes. Indeed, the pH may be normal, but the pres-ence of underlying acid–base disturbances can be gauged from concomitant abnormalities in the PCO2 and bicarbonate concentration.
In assessing these disorders, all clinical influences on the patient’s acid–base status should be identified, and reference should be made to the table of predicted com-pensation given in Box 16.18. If the compensatory change is discrepant from the rules of thumb provided, more than one disturbance of acid–base metabolism may be suspected.
DISORDERS OF DIVALENT ION METABOLISM
The present section excludes discussion of calcium dis-orders, which are considered in Chapters 20 (pp. 767–770) and 25 (p. 1125).
Functional anatomy and physiology of magnesium metabolism
Like potassium, magnesium is mainly an intracellular cation. It is important to the function of many enzymes,
Clinically, apart from manifestations of the under-lying cause, there may be few symptoms or signs related to alkalosis itself. When the rise in systemic pH is abrupt, plasma ionised calcium falls and signs of increased neuromuscular irritability, such as tetany, may develop (p. 768).
ManagementMetabolic alkalosis with hypovolaemia can be corrected by intravenous infusions of 0.9% saline with potassium supplements. This reverses the secondary hyperaldos-teronism and allows the kidney to excrete the excess alkali in the urine.
In metabolic alkalosis with normal or increased volume, treatment should focus on management of the underlying endocrine cause (Ch. 20).
Respiratory acidosisRespiratory acidosis occurs when there is accumulation of CO2 due to type II respiratory failure (p. 663). This results in a rise in the PCO2, with a compensatory increase in plasma bicarbonate concentration, particu-larly when the disorder is of long duration and the kidney has fully developed its capacity for increased acid excretion.
This acid–base disturbance can arise from lesions any-where along the neuromuscular pathways from the brain to the respiratory muscles that result in impaired ventila-tion. It can also arise during intrinsic lung disease if there is significant mismatching of ventilation and perfusion.
Clinical features are primarily those of the underlying cause of the respiratory disorder such as paralysis, chest wall injury or chronic obstructive lung disease, but the
Fig. 16.12 Generation and maintenance of metabolic alkalosis during prolonged vomiting. Loss of H+Cl− generates metabolic alkalosis, which is maintained by renal changes.
Vomiting
Na+Cl−
Metabolicalkalosis
Gastric loss of
H+Cl− K+Cl−
Hypovolaemia
↑ ProximalNa+HCO3−
reabsorption
↑ Renin – angiotensin – aldosterone
Hypokalaemia
↑ Distal H+
secretion↑ Renal NH3
synthesis
↑ H+ excretion
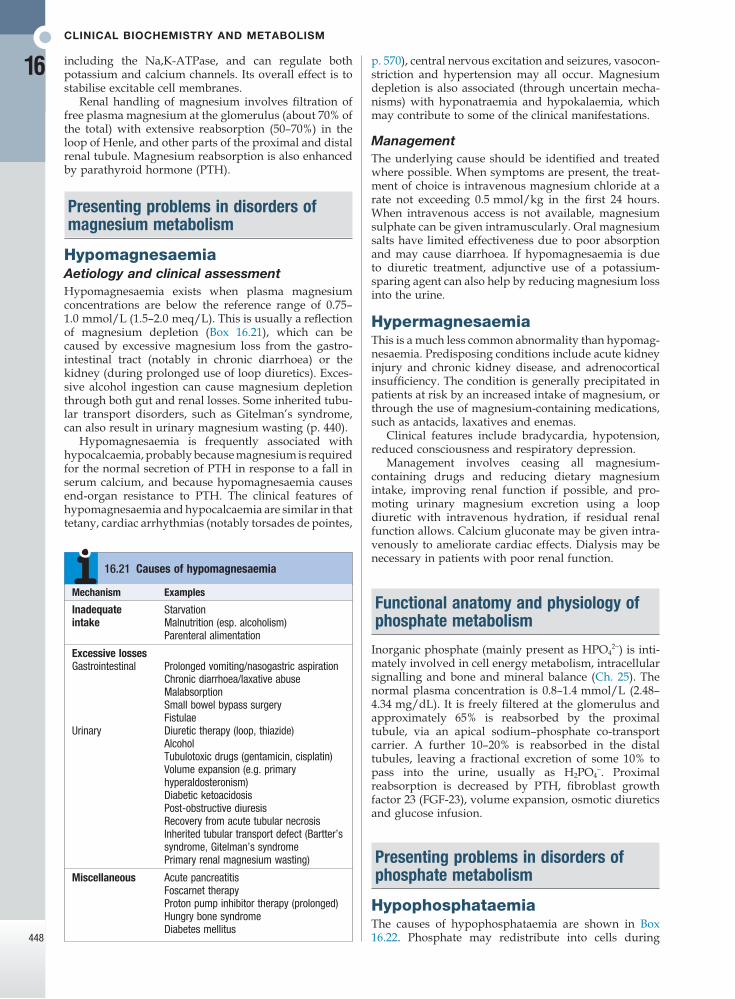
CliniCal bioChemistry and metabolism
16
448
p. 570), central nervous excitation and seizures, vasocon-striction and hypertension may all occur. Magnesium depletion is also associated (through uncertain mecha-nisms) with hyponatraemia and hypokalaemia, which may contribute to some of the clinical manifestations.
ManagementThe underlying cause should be identified and treated where possible. When symptoms are present, the treat-ment of choice is intravenous magnesium chloride at a rate not exceeding 0.5 mmol/kg in the first 24 hours. When intravenous access is not available, magnesium sulphate can be given intramuscularly. Oral magnesium salts have limited effectiveness due to poor absorption and may cause diarrhoea. If hypomagnesaemia is due to diuretic treatment, adjunctive use of a potassium-sparing agent can also help by reducing magnesium loss into the urine.
HypermagnesaemiaThis is a much less common abnormality than hypomag-nesaemia. Predisposing conditions include acute kidney injury and chronic kidney disease, and adrenocortical insufficiency. The condition is generally precipitated in patients at risk by an increased intake of magnesium, or through the use of magnesium-containing medications, such as antacids, laxatives and enemas.
Clinical features include bradycardia, hypotension, reduced consciousness and respiratory depression.
Management involves ceasing all magnesium-containing drugs and reducing dietary magnesium intake, improving renal function if possible, and pro-moting urinary magnesium excretion using a loop diuretic with intravenous hydration, if residual renal function allows. Calcium gluconate may be given intra-venously to ameliorate cardiac effects. Dialysis may be necessary in patients with poor renal function.
Functional anatomy and physiology of phosphate metabolism
Inorganic phosphate (mainly present as HPO42−) is inti-
mately involved in cell energy metabolism, intracellular signalling and bone and mineral balance (Ch. 25). The normal plasma concentration is 0.8–1.4 mmol/L (2.48–4.34 mg/dL). It is freely filtered at the glomerulus and approximately 65% is reabsorbed by the proximal tubule, via an apical sodium–phosphate co-transport carrier. A further 10–20% is reabsorbed in the distal tubules, leaving a fractional excretion of some 10% to pass into the urine, usually as H2PO4
−. Proximal reabsorption is decreased by PTH, fibroblast growth factor 23 (FGF-23), volume expansion, osmotic diuretics and glucose infusion.
Presenting problems in disorders of phosphate metabolism
HypophosphataemiaThe causes of hypophosphataemia are shown in Box 16.22. Phosphate may redistribute into cells during
including the Na,K-ATPase, and can regulate both potassium and calcium channels. Its overall effect is to stabilise excitable cell membranes.
Renal handling of magnesium involves filtration of free plasma magnesium at the glomerulus (about 70% of the total) with extensive reabsorption (50–70%) in the loop of Henle, and other parts of the proximal and distal renal tubule. Magnesium reabsorption is also enhanced by parathyroid hormone (PTH).
Presenting problems in disorders of magnesium metabolism
HypomagnesaemiaAetiology and clinical assessmentHypomagnesaemia exists when plasma magnesium concentrations are below the reference range of 0.75–1.0 mmol/L (1.5–2.0 meq/L). This is usually a reflection of magnesium depletion (Box 16.21), which can be caused by excessive magnesium loss from the gastro-intestinal tract (notably in chronic diarrhoea) or the kidney (during prolonged use of loop diuretics). Exces-sive alcohol ingestion can cause magnesium depletion through both gut and renal losses. Some inherited tubu-lar transport disorders, such as Gitelman’s syndrome, can also result in urinary magnesium wasting (p. 440).
Hypomagnesaemia is frequently associated with hypocalcaemia, probably because magnesium is required for the normal secretion of PTH in response to a fall in serum calcium, and because hypomagnesaemia causes end-organ resistance to PTH. The clinical features of hypomagnesaemia and hypocalcaemia are similar in that tetany, cardiac arrhythmias (notably torsades de pointes,
Mechanism Examples
Inadequate intake
StarvationMalnutrition (esp. alcoholism)Parenteral alimentation
Excessive lossesGastrointestinal Prolonged vomiting/nasogastric aspiration
Chronic diarrhoea/laxative abuseMalabsorptionSmall bowel bypass surgeryFistulae
Urinary Diuretic therapy (loop, thiazide)AlcoholTubulotoxic drugs (gentamicin, cisplatin)Volume expansion (e.g. primary hyperaldosteronism)Diabetic ketoacidosisPost-obstructive diuresisRecovery from acute tubular necrosisInherited tubular transport defect (Bartter’s syndrome, Gitelman’s syndromePrimary renal magnesium wasting)
Miscellaneous Acute pancreatitisFoscarnet therapyProton pump inhibitor therapy (prolonged)Hungry bone syndromeDiabetes mellitus
16.21 Causes of hypomagnesaemia

Disorders of carbohydrate metabolism
16
449
If renal function is normal, intravenous normal saline should be given to promote phosphate excretion. Hyperphosphataemia in patients with renal failure should be treated with dietary phosphate restriction and the use of oral phosphate binders (p. 486).
DISORDERS OF AMINO ACID METABOLISM
Congenital disorders of amino acid metabolism usually present in the neonatal period and may involve life-long treatment regimens. However, some disorders, particu-larly those involved in amino acid transport, may not present until later in life.
PhenylketonuriaPhenylketonuria (PKU) is inherited as an autosomal recessive disorder caused by loss-of-function mutations in the PAH gene, which encodes phenylalanine hydroxy-lase, an enzyme required for degradation of phenyl-alanine. As a result, phenylalanine accumulates at high levels in the neonate’s blood, causing mental retardation.
The diagnosis of PKU is almost always made by routine neonatal screening (p. 64). Treatment involves life-long adherence to a low-phenylalanine diet. Early and adequate dietary treatment prevents major mental retardation, although there may still be a slight reduc-tion in IQ.
HomocystinuriaHomocystinuria is an autosomal recessive disorder caused by loss-of-function mutations in the CBS gene, which encodes cystathionine beta–synthase. The enzyme deficiency causes accumulation of homocysteine and methionine in the blood. Many cases of homocystinuria are diagnosed through newborn screening programmes.
Clinical manifestations are wide-ranging and involve the eyes (ectopia lentis – displacement of the lens), central nervous system (mental retardation, delayed developmental milestones, seizures, psychiatric distur-bances), skeleton (resembling Marfan’s syndrome, and also with generalised osteoporosis), vascular system (thrombotic lesions of arteries and veins) and skin (hypopigmentation).
Treatment is dietary, involving a methionine-restricted, cystine-supplemented diet, as well as large doses of pyridoxine.
DISORDERS OF CARBOHYDRATE METABOLISM
The most common disorder of carbohydrate metabolism is diabetes mellitus, which is discussed in Chapter 21. There are also some rare inherited defects.
GalactosaemiaGalactosaemia is caused by loss-of-function mutations in the GALT gene, which encodes galactose-1-phosphate uridyl transferase. It is usually inherited as an autosomal recessive disorder. The neonate is unable to metabolise galactose, one of the hexose sugars contained in lactose.
periods of increased energy utilisation (such as refeed-ing after a period of starvation) and during systemic alkalosis. However, severe hypophosphataemia usually represents an overall body deficit due to either inade-quate intake or absorption through the gut, or excessive renal losses, most notably in primary hyperpara-thyroidism (p. 769) or as the result of acute plasma volume expansion, osmotic diuresis and diuretics acting on the proximal renal tubule. Less common causes include inherited defects of proximal sodium–phosphate co-transport and tumour-induced osteomalacia due to ectopic production of the hormone FGF-23 (p. 1125).
The clinical manifestations of phosphate depletion are wide-ranging, reflecting the involvement of phos-phate in many aspects of metabolism. Defects appear in the blood (impaired function and survival of all cell lines), skeletal muscle (weakness, respiratory failure), cardiac muscle (congestive cardiac failure), smooth muscle (ileus), central nervous system (decreased con-sciousness, seizures and coma) and bone (osteomalacia in severe prolonged hypophosphataemia, p. 1125).
Management involves administering oral phosphate supplements and high-protein/high-dairy dietary sup-plements that are rich in naturally occurring phosphate. Intravenous treatment with sodium or potassium phos-phate salts can be used in critical situations, but there is a risk of precipitating hypocalcaemia and metastatic calcification.
HyperphosphataemiaPhosphate accumulation is usually the result of acute kidney injury or chronic kidney disease (pp. 768 and 483, and p. 768). Phosphate excretion is also reduced in hypoparathyroidism and pseudohypoparathyroidism (p. 770). Redistribution of phosphate from cells into the plasma can also be a contributing factor in the ‘tumour lysis’ syndrome and in catabolic states. Phosphate accu-mulation is aggravated in any of these conditions if the patient takes phosphate-containing preparations or inappropriate vitamin D therapy.
The clinical features relate to hypocalcaemia and metastatic calcification, particularly in chronic renal failure with tertiary hyperparathyroidism (when a high calcium–phosphate product occurs).
Mechanism Examples
Redistribution into cells
Refeeding after starvationRespiratory alkalosisTreatment for diabetic ketoacidosis
Inadequate intake or absorption
MalnutritionMalabsorptionChronic diarrhoeaPhosphate binders (antacids)Vitamin D deficiency or resistance
Increased renal excretion
HyperparathyroidismECF volume expansion with diuresisOsmotic diureticsFanconi’s syndromeFamilial hypophosphataemic ricketsTumour-induced hypophosphataemic rickets
16.22 Causes of hypophosphataemia
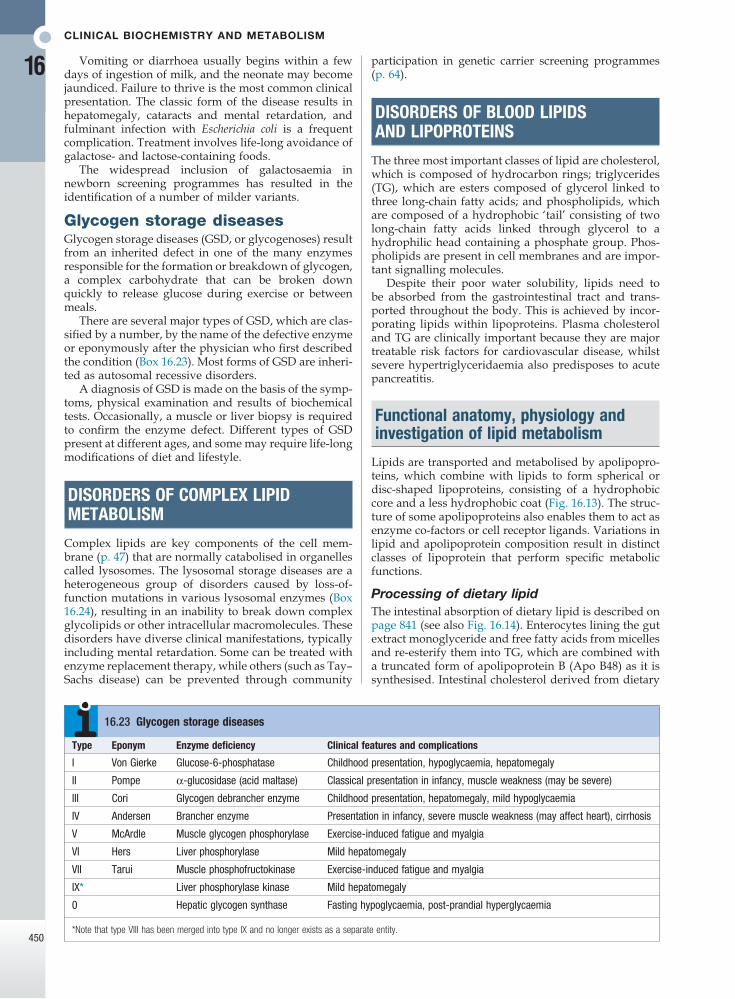
CliniCal bioChemistry and metabolism
16
450
participation in genetic carrier screening programmes (p. 64).
DISORDERS OF BLOOD LIPIDS AND LIPOPROTEINS
The three most important classes of lipid are cholesterol, which is composed of hydrocarbon rings; triglycerides (TG), which are esters composed of glycerol linked to three long-chain fatty acids; and phospholipids, which are composed of a hydrophobic ‘tail’ consisting of two long-chain fatty acids linked through glycerol to a hydrophilic head containing a phosphate group. Phos-pholipids are present in cell membranes and are impor-tant signalling molecules.
Despite their poor water solubility, lipids need to be absorbed from the gastrointestinal tract and trans-ported throughout the body. This is achieved by incor-porating lipids within lipoproteins. Plasma cholesterol and TG are clinically important because they are major treatable risk factors for cardiovascular disease, whilst severe hypertriglyceridaemia also predisposes to acute pancreatitis.
Functional anatomy, physiology and investigation of lipid metabolism
Lipids are transported and metabolised by apolipopro-teins, which combine with lipids to form spherical or disc-shaped lipoproteins, consisting of a hydrophobic core and a less hydrophobic coat (Fig. 16.13). The struc-ture of some apolipoproteins also enables them to act as enzyme co-factors or cell receptor ligands. Variations in lipid and apolipoprotein composition result in distinct classes of lipoprotein that perform specific metabolic functions.
Processing of dietary lipidThe intestinal absorption of dietary lipid is described on page 841 (see also Fig. 16.14). Enterocytes lining the gut extract monoglyceride and free fatty acids from micelles and re-esterify them into TG, which are combined with a truncated form of apolipoprotein B (Apo B48) as it is synthesised. Intestinal cholesterol derived from dietary
Vomiting or diarrhoea usually begins within a few days of ingestion of milk, and the neonate may become jaundiced. Failure to thrive is the most common clinical presentation. The classic form of the disease results in hepatomegaly, cataracts and mental retardation, and fulminant infection with Escherichia coli is a frequent complication. Treatment involves life-long avoidance of galactose- and lactose-containing foods.
The widespread inclusion of galactosaemia in newborn screening programmes has resulted in the identification of a number of milder variants.
Glycogen storage diseasesGlycogen storage diseases (GSD, or glycogenoses) result from an inherited defect in one of the many enzymes responsible for the formation or breakdown of glycogen, a complex carbohydrate that can be broken down quickly to release glucose during exercise or between meals.
There are several major types of GSD, which are clas-sified by a number, by the name of the defective enzyme or eponymously after the physician who first described the condition (Box 16.23). Most forms of GSD are inheri-ted as autosomal recessive disorders.
A diagnosis of GSD is made on the basis of the symp-toms, physical examination and results of biochemical tests. Occasionally, a muscle or liver biopsy is required to confirm the enzyme defect. Different types of GSD present at different ages, and some may require life-long modifications of diet and lifestyle.
DISORDERS OF COMPLEX LIPID METABOLISM
Complex lipids are key components of the cell mem-brane (p. 47) that are normally catabolised in organelles called lysosomes. The lysosomal storage diseases are a heterogeneous group of disorders caused by loss-of-function mutations in various lysosomal enzymes (Box 16.24), resulting in an inability to break down complex glycolipids or other intracellular macromolecules. These disorders have diverse clinical manifestations, typically including mental retardation. Some can be treated with enzyme replacement therapy, while others (such as Tay–Sachs disease) can be prevented through community
Type Eponym Enzyme deficiency Clinical features and complications
I Von Gierke Glucose-6-phosphatase Childhood presentation, hypoglycaemia, hepatomegaly
II Pompe α-glucosidase (acid maltase) Classical presentation in infancy, muscle weakness (may be severe)
III Cori Glycogen debrancher enzyme Childhood presentation, hepatomegaly, mild hypoglycaemia
IV Andersen Brancher enzyme Presentation in infancy, severe muscle weakness (may affect heart), cirrhosis
V McArdle Muscle glycogen phosphorylase Exercise-induced fatigue and myalgia
VI Hers Liver phosphorylase Mild hepatomegaly
VII Tarui Muscle phosphofructokinase Exercise-induced fatigue and myalgia
IX* Liver phosphorylase kinase Mild hepatomegaly
0 Hepatic glycogen synthase Fasting hypoglycaemia, post-prandial hyperglycaemia
*Note that type VIII has been merged into type IX and no longer exists as a separate entity.
16.23 Glycogen storage diseases

Disorders of blood lipids and lipoproteins
16
451
The main dietary determinants of plasma cholesterol concentrations are the intake of saturated and trans-unsaturated fatty acids, which reduce LDL-receptor activity (see below). Dietary cholesterol has surprisingly little effect on fasting cholesterol levels. Plant sterols and drugs that inhibit cholesterol absorption are effec-tive because they also reduce the re-utilisation of biliary cholesterol. The dietary determinants of plasma TG con-centrations are complex since excessive intake of carbo-hydrate, fat or alcohol may all contribute to increased plasma TG by different mechanisms.
Endogenous lipid synthesisIn the fasting state, the liver is the major source of plasma lipids (see Fig. 16.14). The liver may acquire lipids by uptake, synthesis or conversion from other macronutri-ents. These lipids are transported to other tissues by secretion of very low-density lipoproteins (VLDL), which are rich in TG but differ from chylomicrons in that they contain full-length Apo B100. Following secretion into the circulation, VLDL undergo metabolic process-ing similar to that of chylomicrons. Hydrolysis of VLDL TG releases fatty acids to tissues and converts VLDL into ‘remnant’ particles, referred to as intermediate-density lipoproteins (IDL). Most IDL are rapidly cleared by LDL receptors in the liver, but some are processed by hepatic lipase, which converts the particle to an LDL by remov-ing TG and most materials other than Apo B100, and free and esterified cholesterol.
The LDL particles act as a source of cholesterol for cells and tissues (see Fig. 16.14). LDL cholesterol is internalised by receptor-mediated endocytosis via the LDL receptor. Delivery of cholesterol via this pathway down-regulates further expression of the LDL receptor gene and reduces the synthesis and activity of
and biliary sources is also absorbed via a specific intes-tinal membrane transporter termed NPC1L1. This pro-duces chylomicrons containing TG and cholesterol ester that are secreted basolaterally into lymphatic lacteals and carried to the circulation through the thoracic duct. Upon entering the blood stream, nascent chylomicrons are modified by further addition of apolipoproteins. Chylomicron TG are hydrolysed by lipoprotein lipase located on the endothelium of tissue capillary beds. This releases fatty acids that are used locally for energy pro-duction or stored as TG in muscle or fat. The residual ‘remnant’ chylomicron particle is avidly cleared by low-density lipoprotein (LDL)-receptors in the liver, which recognise Apo E on the remnant lipoproteins. Complete absorption of dietary lipids takes about 6–10 hours, so chylomicrons are usually undetectable in the plasma after a 12-hour fast.
Lysosomal storage disease Clinical features Enzyme deficiencyHuman enzyme replacement therapy
Fabry disease Variable age of onsetNeurological (pain in extremities)Dermatological (hypohidrosis, angiokeratomas)Cerebrovascular (renal, cardiac, central nervous system)
α-galactosidase A In clinical practice
Gaucher disease (various types) Splenic and liver enlargement, with variable severity of diseaseSome types also have neurological involvement
Glucocerebrosidase In clinical practice for some types
Mucopolysaccharidosis (MPS) (various types, including Hurler’s, Hunter’s, Sanfilippo’s and Morquio’s syndromes)
Vary with syndrome. Can cause mental retardation, skeletal and joint abnormalities, abnormal facies, obstructive respiratory diseases and recurrent respiratory infections
Each MPS type has a different enzyme deficiency
In clinical practice for some types; clinical trials under way for other types
Niemann–Pick disease Most common presentation is as a progressive neurological disorder, accompanied by organomegaly Some variants do not have neurological symptoms
Acid sphingomyelinase Clinical trials planned for some types
GM2-gangliosidosis (various types, including Tay–Sachs and Sandhoff diseases)
Severe progressive neurological disorder. Sandhoff disease also characterised by organomegaly
Hexosaminidase A, B
16.24 Lysosomal storage diseases
Fig. 16.13 Structure of lipoproteins.
Apolipoprotein
Free cholesterol
Phospholipid
Triglyceride
Cholesterylester
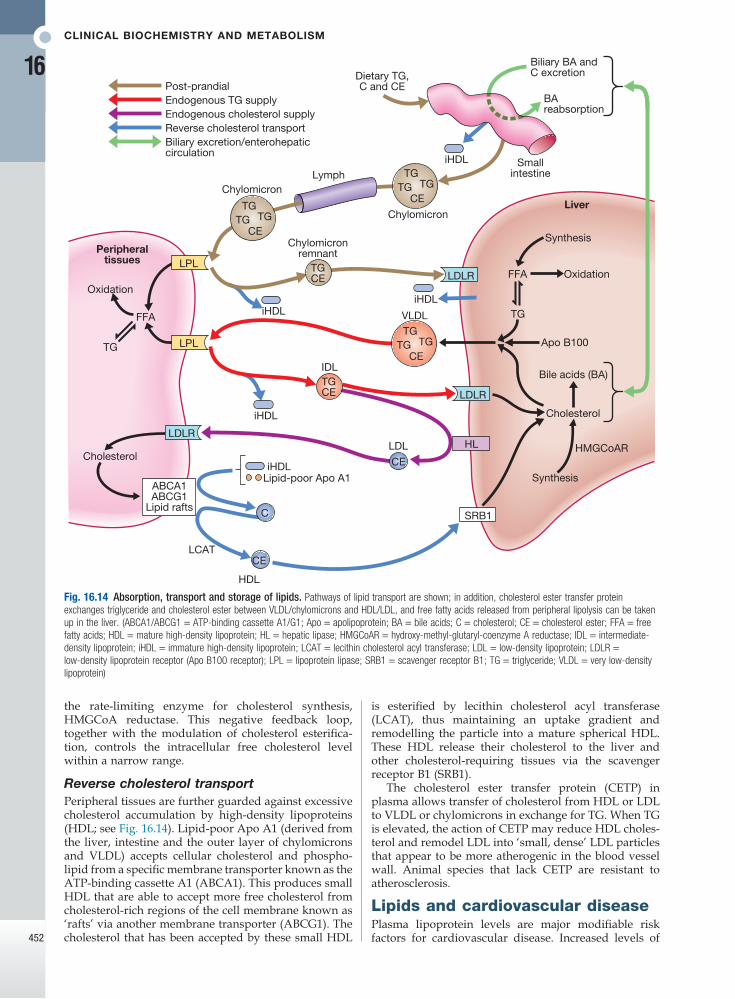
CliniCal bioChemistry and metabolism
16
452
is esterified by lecithin cholesterol acyl transferase (LCAT), thus maintaining an uptake gradient and remodelling the particle into a mature spherical HDL. These HDL release their cholesterol to the liver and other cholesterol-requiring tissues via the scavenger receptor B1 (SRB1).
The cholesterol ester transfer protein (CETP) in plasma allows transfer of cholesterol from HDL or LDL to VLDL or chylomicrons in exchange for TG. When TG is elevated, the action of CETP may reduce HDL choles-terol and remodel LDL into ‘small, dense’ LDL particles that appear to be more atherogenic in the blood vessel wall. Animal species that lack CETP are resistant to atherosclerosis.
Lipids and cardiovascular diseasePlasma lipoprotein levels are major modifiable risk factors for cardiovascular disease. Increased levels of
the rate-limiting enzyme for cholesterol synthesis, HMGCoA reductase. This negative feedback loop, together with the modulation of cholesterol esterifica-tion, controls the intracellular free cholesterol level within a narrow range.
Reverse cholesterol transportPeripheral tissues are further guarded against excessive cholesterol accumulation by high-density lipoproteins (HDL; see Fig. 16.14). Lipid-poor Apo A1 (derived from the liver, intestine and the outer layer of chylomicrons and VLDL) accepts cellular cholesterol and phospho-lipid from a specific membrane transporter known as the ATP-binding cassette A1 (ABCA1). This produces small HDL that are able to accept more free cholesterol from cholesterol-rich regions of the cell membrane known as ‘rafts’ via another membrane transporter (ABCG1). The cholesterol that has been accepted by these small HDL
Fig. 16.14 Absorption, transport and storage of lipids. Pathways of lipid transport are shown; in addition, cholesterol ester transfer protein exchanges triglyceride and cholesterol ester between VLDL/chylomicrons and HDL/LDL, and free fatty acids released from peripheral lipolysis can be taken up in the liver. (ABCA1/ABCG1 = ATP-binding cassette A1/G1; Apo = apolipoprotein; BA = bile acids; C = cholesterol; CE = cholesterol ester; FFA = free fatty acids; HDL = mature high-density lipoprotein; HL = hepatic lipase; HMGCoAR = hydroxy-methyl-glutaryl-coenzyme A reductase; IDL = intermediate-density lipoprotein; iHDL = immature high-density lipoprotein; LCAT = lecithin cholesterol acyl transferase; LDL = low-density lipoprotein; LDLR = low-density lipoprotein receptor (Apo B100 receptor); LPL = lipoprotein lipase; SRB1 = scavenger receptor B1; TG = triglyceride; VLDL = very low-density lipoprotein)
Synthesis
OxidationFFA
TG
Bile acids (BA)
Apo B100
Cholesterol
HMGCoAR
Synthesis
Liver
LDLR
LDLR
HL
SRB1
FFA
LPL
LPL
LDLR
ABCA1ABCG1
Lipid rafts
Cholesterol
Oxidation
Peripheraltissues
TG
LCAT
HDL
iHDLLipid-poor Apo A1
C
CE
TGCE
CE
TGTGTG
CE
iHDL
IDL
TGCE
Chylomicronremnant
iHDL
iHDLTG
TGTGCE
Chylomicron
VLDL
LDL
Dietary TG,C and CE
Biliary BA andC excretion
BAreabsorption
Post-prandialEndogenous TG supplyEndogenous cholesterol supplyReverse cholesterol transportBiliary excretion/enterohepaticcirculation
Lymph
TGTGTG
CE
Chylomicron
Smallintestine
iHDL
Disorders of blood lipids and lipoproteins
16
453
atherogenic lipoproteins (especially LDL, but also IDL, lipoprotein(a) and possibly chylomicron remnants) con-tribute to the development of atherosclerosis (p. 579). Increased plasma concentration and reduced diameter favour subendothelial accumulation of these lipopro-teins. Following chemical modifications such as oxida-tion, Apo B-containing lipoproteins are no longer cleared by normal mechanisms. They trigger a self-perpetuating inflammatory response during which they are taken up by macrophages to form foam cells, a hallmark of athero-sclerotic lesions. These processes also have an adverse effect on endothelial function.
Conversely, HDL removes cholesterol from the tissues to the liver, where it is metabolised and excreted in bile. HDL may also counteract some components of the inflammatory response, such as the expression of vascular adhesion molecules by the endothelium. Con-sequently, low HDL cholesterol levels, which are often associated with TG elevation, also predispose to atherosclerosis.
Lipid measurementAbnormalities of lipid metabolism most commonly come to light following routine blood testing. Measure-ment of plasma cholesterol alone is not sufficient for comprehensive assessment. Levels of total cholesterol (TC), triglyceride (TG) and HDL cholesterol (HDL-C) need to be obtained after a 12-hour fast to permit accu-rate calculation of LDL cholesterol (LDL-C) according to the Friedewald formula (LDL-C = TC − HDL-C − (TG/2.2) mmol/L; or LDL-C = TC − HDL-C − (TG/5) mg/dL). The formula becomes unreliable when TG levels exceed 4 mmol/L (350 mg/dL). Other risk markers, such as NHDL-C (non-HDL-C, calculated as the difference between TC and HDL-C levels) or Apo B, may assess risk of cardiovascular disease more accu-rately than LDL-C when TG levels are increased. Fur-thermore, non-fasting samples are often used to guide therapeutic decisions since they are unaffected in terms of TC and measured LDL-C, albeit that they differ from fasting samples in terms of TG, HDL-C and, to some extent, calculated LDL-C. Consideration must be given to confounding factors, such as recent illness, after which cholesterol, LDL and HDL levels temporarily decrease in proportion to severity. Results that will affect major decisions, such as initiation of drug therapy, should be confirmed with a repeat measurement.
Elevated levels of TG are common in obesity, diabetes and insulin resistance (Chs 5 and 21), and are frequently associated with low HDL and increased ‘small, dense’ LDL. Under these circumstances, LDL-C may under-estimate risk. This is one situation in which measure-ment of Apo B may provide additional useful information.
Presenting problems in disorders of lipids
Lipid measurements are usually performed for the fol-lowing reasons:• screening for primary or secondary prevention of
cardiovascular disease• investigation of patients with clinical features of
lipid disorders (Fig. 16.15) and their relatives
• monitoring of response to diet, weight control and medication.
Aetiology and clinical assessmentThe first step is to consider the effect of other diseases and drugs (Box 16.25). Overt or subclinical hypo-thyroidism (p. 743) may cause hypercholesterolaemia, and so measurement of thyroid function is warranted in most cases, even in the absence of typical symptoms and signs.
Once secondary causes are excluded, primary lipid abnormalities may be diagnosed. Primary lipid abnor-malities can be classified according to the predominant lipid problem: hypercholesterolaemia, hypertriglyceri-daemia or mixed hyperlipidaemia (Box 16.26). Although single-gene disorders are encountered in all three cate-gories, most cases are due to multiple-gene (polygenic) loci interacting with environmental factors. Clinical con-sequences of dyslipidaemia vary somewhat between these causes (see Fig. 16.15).
Secondary hypercholesterolaemia
Moderately common• Hypothyroidism• Pregnancy• Cholestatic liver disease
• Drugs (diuretics, ciclosporin, corticosteroids, androgens, antiretroviral agents)
Less common• Nephrotic syndrome• Anorexia nervosa
• Porphyria• Hyperparathyroidism
Secondary hypertriglyceridaemia
Common• Diabetes mellitus (type 2)• Chronic renal disease• Abdominal obesity• Excess alcohol
• Hepatocellular disease• Drugs (β-blockers,
retinoids, corticosteroids, anti-retroviral agents)
16.25 Causes of secondary hyperlipidaemia
Predominant hypercholesterolaemiaPolygenic hypercholesterolaemia is the most common cause of a mild to moderate increase in LDL-C (see Box 16.26). Physical signs, such as corneal arcus and xanthe-lasma, may be found in this as well as other forms of lipid disturbance (see Fig. 16.15). The risk of cardiovas-cular disease is proportional to the degree of LDL-C (or Apo B) elevation, but is modified by other major risk factors, particularly low HDL-C.
Familial hypercholesterolaemia (FH) causes moder-ate to severe hypercholesterolaemia and has a preva-lence of at least 0.2% in most populations. It is usually caused by a loss-of-function mutation in the LDL recep-tor gene, which results in an autosomal dominant pattern of inheritance. A similar syndrome can arise with loss-of-function mutations in the ligand-binding domain of Apo B100 or gain-of-function mutations in the PCSK9 gene. The latter increases the activity of the PCSK9 protein, which is a sterol-sensitive protease that targets the LDL receptor for degradation. Causative mutations can be detected in one of these three genes by genetic testing in about 70% of patients with FH. Most patients with these types of FH have LDL levels that are approximately twice as high as in normal
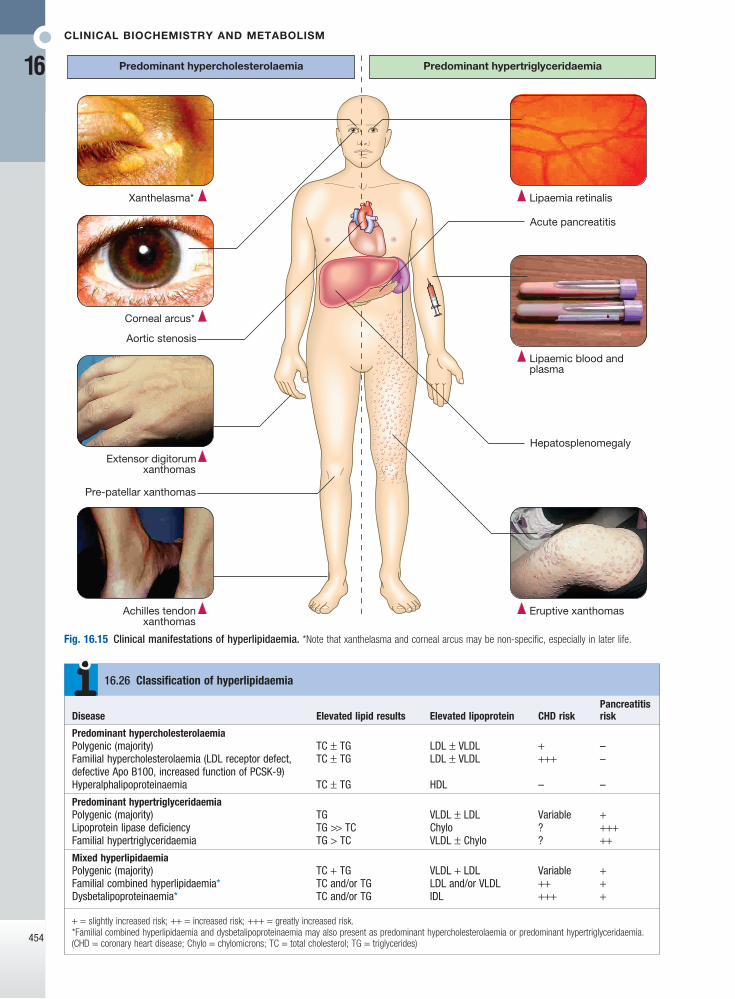
CliniCal bioChemistry and metabolism
16
454
Fig. 16.15 Clinical manifestations of hyperlipidaemia. *Note that xanthelasma and corneal arcus may be non-specific, especially in later life.
Xanthelasma*
Corneal arcus*
Achilles tendonxanthomas
Predominant hypercholesterolaemia Predominant hypertriglyceridaemia
Lipaemia retinalis
Lipaemic blood andplasma
Eruptive xanthomas
Extensor digitorumxanthomas
Pre-patellar xanthomas
Aortic stenosis
Hepatosplenomegaly
Acute pancreatitis
Disease Elevated lipid results Elevated lipoprotein CHD riskPancreatitis risk
Predominant hypercholesterolaemiaPolygenic (majority) TC ± TG LDL ± VLDL + –Familial hypercholesterolaemia (LDL receptor defect, defective Apo B100, increased function of PCSK-9)
TC ± TG LDL ± VLDL +++ –
Hyperalphalipoproteinaemia TC ± TG HDL – –
Predominant hypertriglyceridaemiaPolygenic (majority) TG VLDL ± LDL Variable +Lipoprotein lipase deficiency TG >> TC Chylo ? +++Familial hypertriglyceridaemia TG > TC VLDL ± Chylo ? ++Mixed hyperlipidaemiaPolygenic (majority) TC + TG VLDL + LDL Variable +Familial combined hyperlipidaemia* TC and/or TG LDL and/or VLDL ++ +Dysbetalipoproteinaemia* TC and/or TG IDL +++ +
+ = slightly increased risk; ++ = increased risk; +++ = greatly increased risk.*Familial combined hyperlipidaemia and dysbetalipoproteinaemia may also present as predominant hypercholesterolaemia or predominant hypertriglyceridaemia.
16.26 Classification of hyperlipidaemia
(CHD = coronary heart disease; Chylo = chylomicrons; TC = total cholesterol; TG = triglycerides)
Disorders of blood lipids and lipoproteins
16
455
Familial combined hyperlipidaemia, and dysbeta-lipoproteinaemia, may present with the pattern of predominant hypertriglyceridaemia (see ‘Mixed hyper-lipidaemia’, below).
Mixed hyperlipidaemiaIt is difficult to define quantitatively the distinction between predominant hyperlipidaemias and mixed hyperlipidaemia. The term ‘mixed’ usually implies the presence of hypertriglyceridaemia, as well as an increase in LDL or IDL. Treatment of massive hypertriglycerid-aemia may improve TG faster than cholesterol, thus temporarily mimicking mixed hyperlipidaemia.
Primary mixed hyperlipidaemia is usually polygenic and, like predominant hypertriglyceridaemia, often occurs in association with type 2 diabetes, impaired glucose tolerance, central obesity or other manifesta-tions of insulin resistance (p. 805). Both components of mixed hyperlipidaemia may contribute to the risk of cardiovascular disease.
Familial combined hyperlipidaemia is a term used to identify an inherited tendency towards the over-production of atherogenic Apo B-containing lipopro-teins. It results in elevation of cholesterol, TG or both in different family members at different times. It is associ-ated with an increased risk of cardiovascular disease but it does not produce any pathognomonic physical signs. In practice, this relatively common condition is substan-tially modified by factors such as age and weight. It may not be a monogenic condition, but rather one end of a heterogeneous spectrum that overlaps insulin resistance (p. 805).
Dysbetalipoproteinaemia (also referred to as type 3 hyperlipidaemia, broad-beta dyslipoproteinaemia or remnant hyperlipidaemia) involves accumulation of roughly equimolar levels of cholesterol and TG. It is caused by homozygous inheritance of the Apo E2 allele, which is the isoform least avidly recognised by the LDL receptor. In conjunction with other exacerbating factors, such as obesity and diabetes, it leads to accumulation of atherogenic IDL and chylomicron remnants. Premature cardiovascular disease is common and it may also result in the formation of palmar xanthomas, tuberous xantho-mas or tendon xanthomas.
Rare dyslipidaemiasSeveral rare disturbances of lipid metabolism have been described (Box 16.28). They provide important insights into lipid metabolism and its impact on risk of cardio-vascular disease.
Fish eye disease, Apo A1 Milano and LCAT defi-ciency demonstrate that very low HDL levels do not necessarily cause cardiovascular disease, but Apo A1 deficiency, and possibly Tangier disease, demonstrate that low HDL-C can be atherogenic under some circum-stances. Autosomal recessive FH and PCSK9 gain-of-function mutations reveal the importance of proteins that chaperone the LDL receptor. Sitosterolaemia and cerebrotendinous xanthomatosis demonstrate that sterols other than cholesterol can cause xanthomas and cardiovascular disease, while PCSK9 loss-of-function mutations, abetalipoproteinaemia and hypobetalipopro-teinaemia suggest that low levels of Apo B-containing lipoproteins reduce the risk of cardiovascular disease. The only adverse health outcomes associated with
subjects of the same age and gender. Affected subjects suffer from severe hypercholesterolaemia and prema-ture cardiovascular disease. FH may be accompanied by xanthomas of the Achilles or extensor digitorum tendons (see Fig. 16.15), which are strongly suggestive of FH. The onset of corneal arcus before age 40 is also suggestive of this condition. Identification of an index case of FH (the first case of FH in a family) should trigger genetic and biochemical screening of other family members, which is a cost-effective method for case detection. Affected individuals should be managed from childhood (Box 16.27).
Homozygous FH may occur in populations in which there is a ‘founder’ effect or consanguineous marriage, resulting in more extensive xanthomas and precocious cardiovascular disease in childhood. Hyperalphalipo-proteinaemia refers to increased levels of HDL-C. In the absence of an increase in LDL-C, this condition does not cause cardiovascular disease, so it should not be regarded as pathological.
Familial combined hyperlipidaemia, and dysbeta-lipoproteinaemia, may present with the pattern of predominant hypercholesterolaemia (see ‘Mixed hyper-lipidaemia’ below).
Predominant hypertriglyceridaemiaPolygenic hypertriglyceridaemia is the most common cause of a raised TG level (see Box 16.26). Other common causes include excess alcohol intake, medications (such as β-blockers and retinoids), type 2 diabetes, impaired glucose tolerance, central obesity or other manifestations of insulin resistance (p. 805) and impaired absorption of bile acids. It is often accompanied by post-prandial hyperlipidaemia and reduced HDL-C, both of which may contribute to cardiovascular risk. Excessive intake of alcohol or dietary fat, or other exacerbating factors may precipitate a massive increase in TG levels, which, if they exceed 10 mmol/L (880 mg/dL), may pose a risk of acute pancreatitis.
Inherited forms of hypertriglyceridaemia also occur. Loss-of-function mutations in the LPL gene, which encodes lipoprotein lipase, or the APOC2 gene, which encodes the Apo C2 protein that acts as a co-factor for lipoprotein lipase, may cause recessively inherited forms of hypertriglyceridaemia. These mutations cause massive hypertriglyceridaemia that is not readily amen-able to drug treatment. It often presents in childhood and is associated with episodes of acute abdominal pain and pancreatitis. In common with other causes of severe hypertriglyceridaemia, it may result in hepatospleno-megaly, lipaemia retinalis and eruptive xanthomas (see Fig. 16.15).
Familial hypertriglyceridaemia may also be inherited in a dominant manner due to mutations in the APOA5 gene, which encodes Apo A5 – a co-factor that is essen-tial for lipoprotein lipase activity. This disorder may be associated with high levels of TG that predispose to cardiovascular disease and pancreatitis.
• Statin treatment: may be required from the age of about 10. It does not compromise normal growth and maturation.
• Tobacco: patients should be strongly advised to avoid this.
16.27 Familial hypercholesterolaemia in adolescence
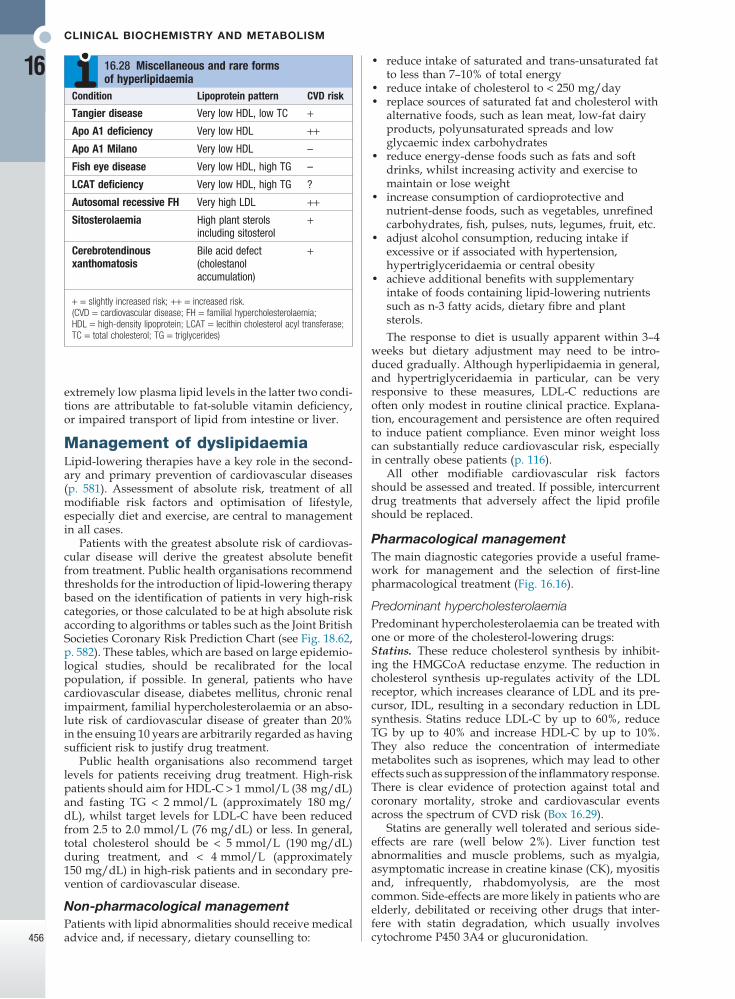
CliniCal bioChemistry and metabolism
16
456
extremely low plasma lipid levels in the latter two condi-tions are attributable to fat-soluble vitamin deficiency, or impaired transport of lipid from intestine or liver.
Management of dyslipidaemiaLipid-lowering therapies have a key role in the second-ary and primary prevention of cardiovascular diseases (p. 581). Assessment of absolute risk, treatment of all modifiable risk factors and optimisation of lifestyle, especially diet and exercise, are central to management in all cases.
Patients with the greatest absolute risk of cardiovas-cular disease will derive the greatest absolute benefit from treatment. Public health organisations recommend thresholds for the introduction of lipid-lowering therapy based on the identification of patients in very high-risk categories, or those calculated to be at high absolute risk according to algorithms or tables such as the Joint British Societies Coronary Risk Prediction Chart (see Fig. 18.62, p. 582). These tables, which are based on large epidemio-logical studies, should be recalibrated for the local population, if possible. In general, patients who have cardiovascular disease, diabetes mellitus, chronic renal impairment, familial hypercholesterolaemia or an abso-lute risk of cardiovascular disease of greater than 20% in the ensuing 10 years are arbitrarily regarded as having sufficient risk to justify drug treatment.
Public health organisations also recommend target levels for patients receiving drug treatment. High-risk patients should aim for HDL-C > 1 mmol/L (38 mg/dL) and fasting TG < 2 mmol/L (approximately 180 mg/dL), whilst target levels for LDL-C have been reduced from 2.5 to 2.0 mmol/L (76 mg/dL) or less. In general, total cholesterol should be < 5 mmol/L (190 mg/dL) during treatment, and < 4 mmol/L (approximately 150 mg/dL) in high-risk patients and in secondary pre-vention of cardiovascular disease.
Non-pharmacological managementPatients with lipid abnormalities should receive medical advice and, if necessary, dietary counselling to:
• reduce intake of saturated and trans-unsaturated fat to less than 7–10% of total energy
• reduce intake of cholesterol to < 250 mg/day• replace sources of saturated fat and cholesterol with
alternative foods, such as lean meat, low-fat dairy products, polyunsaturated spreads and low glycaemic index carbohydrates
• reduce energy-dense foods such as fats and soft drinks, whilst increasing activity and exercise to maintain or lose weight
• increase consumption of cardioprotective and nutrient-dense foods, such as vegetables, unrefined carbohydrates, fish, pulses, nuts, legumes, fruit, etc.
• adjust alcohol consumption, reducing intake if excessive or if associated with hypertension, hypertriglyceridaemia or central obesity
• achieve additional benefits with supplementary intake of foods containing lipid-lowering nutrients such as n-3 fatty acids, dietary fibre and plant sterols.The response to diet is usually apparent within 3–4
weeks but dietary adjustment may need to be intro-duced gradually. Although hyperlipidaemia in general, and hypertriglyceridaemia in particular, can be very responsive to these measures, LDL-C reductions are often only modest in routine clinical practice. Explana-tion, encouragement and persistence are often required to induce patient compliance. Even minor weight loss can substantially reduce cardiovascular risk, especially in centrally obese patients (p. 116).
All other modifiable cardiovascular risk factors should be assessed and treated. If possible, intercurrent drug treatments that adversely affect the lipid profile should be replaced.
Pharmacological managementThe main diagnostic categories provide a useful frame-work for management and the selection of first-line pharmacological treatment (Fig. 16.16).
Predominant hypercholesterolaemiaPredominant hypercholesterolaemia can be treated with one or more of the cholesterol-lowering drugs:Statins. These reduce cholesterol synthesis by inhibit-ing the HMGCoA reductase enzyme. The reduction in cholesterol synthesis up-regulates activity of the LDL receptor, which increases clearance of LDL and its pre-cursor, IDL, resulting in a secondary reduction in LDL synthesis. Statins reduce LDL-C by up to 60%, reduce TG by up to 40% and increase HDL-C by up to 10%. They also reduce the concentration of intermediate metabolites such as isoprenes, which may lead to other effects such as suppression of the inflammatory response. There is clear evidence of protection against total and coronary mortality, stroke and cardiovascular events across the spectrum of CVD risk (Box 16.29).
Statins are generally well tolerated and serious side-effects are rare (well below 2%). Liver function test abnormalities and muscle problems, such as myalgia, asymptomatic increase in creatine kinase (CK), myositis and, infrequently, rhabdomyolysis, are the most common. Side-effects are more likely in patients who are elderly, debilitated or receiving other drugs that inter-fere with statin degradation, which usually involves cytochrome P450 3A4 or glucuronidation.
Condition Lipoprotein pattern CVD risk
Tangier disease Very low HDL, low TC +Apo A1 deficiency Very low HDL ++Apo A1 Milano Very low HDL –
Fish eye disease Very low HDL, high TG –
LCAT deficiency Very low HDL, high TG ?
Autosomal recessive FH Very high LDL ++Sitosterolaemia High plant sterols
including sitosterol+
Cerebrotendinous xanthomatosis
Bile acid defect (cholestanol accumulation)
+
+ = slightly increased risk; ++ = increased risk.(CVD = cardiovascular disease; FH = familial hypercholesterolaemia; HDL = high-density lipoprotein; LCAT = lecithin cholesterol acyl transferase; TC = total cholesterol; TG = triglycerides)
16.28 Miscellaneous and rare forms of hyperlipidaemia
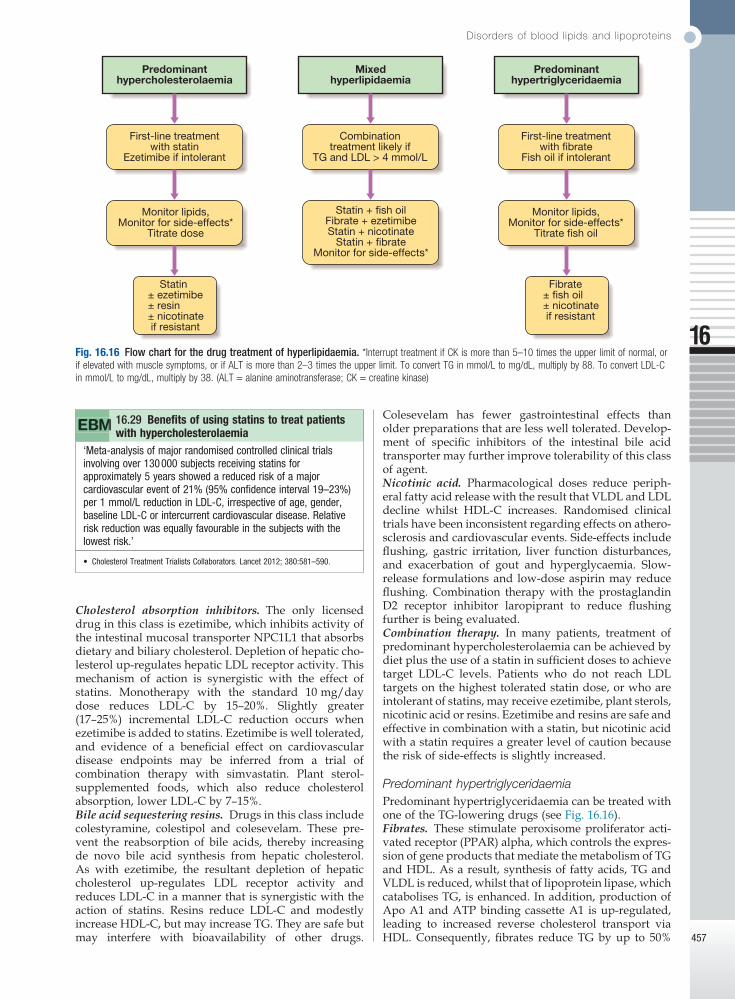
Disorders of blood lipids and lipoproteins
16
457
Colesevelam has fewer gastrointestinal effects than older preparations that are less well tolerated. Develop-ment of specific inhibitors of the intestinal bile acid transporter may further improve tolerability of this class of agent.Nicotinic acid. Pharmacological doses reduce periph-eral fatty acid release with the result that VLDL and LDL decline whilst HDL-C increases. Randomised clinical trials have been inconsistent regarding effects on athero-sclerosis and cardiovascular events. Side-effects include flushing, gastric irritation, liver function disturbances, and exacerbation of gout and hyperglycaemia. Slow-release formulations and low-dose aspirin may reduce flushing. Combination therapy with the prostaglandin D2 receptor inhibitor laropiprant to reduce flushing further is being evaluated.Combination therapy. In many patients, treatment of predominant hypercholesterolaemia can be achieved by diet plus the use of a statin in sufficient doses to achieve target LDL-C levels. Patients who do not reach LDL targets on the highest tolerated statin dose, or who are intolerant of statins, may receive ezetimibe, plant sterols, nicotinic acid or resins. Ezetimibe and resins are safe and effective in combination with a statin, but nicotinic acid with a statin requires a greater level of caution because the risk of side-effects is slightly increased.
Predominant hypertriglyceridaemiaPredominant hypertriglyceridaemia can be treated with one of the TG-lowering drugs (see Fig. 16.16).Fibrates. These stimulate peroxisome proliferator acti-vated receptor (PPAR) alpha, which controls the expres-sion of gene products that mediate the metabolism of TG and HDL. As a result, synthesis of fatty acids, TG and VLDL is reduced, whilst that of lipoprotein lipase, which catabolises TG, is enhanced. In addition, production of Apo A1 and ATP binding cassette A1 is up-regulated, leading to increased reverse cholesterol transport via HDL. Consequently, fibrates reduce TG by up to 50%
Cholesterol absorption inhibitors. The only licensed drug in this class is ezetimibe, which inhibits activity of the intestinal mucosal transporter NPC1L1 that absorbs dietary and biliary cholesterol. Depletion of hepatic cho-lesterol up-regulates hepatic LDL receptor activity. This mechanism of action is synergistic with the effect of statins. Monotherapy with the standard 10 mg/day dose reduces LDL-C by 15–20%. Slightly greater (17–25%) incremental LDL-C reduction occurs when ezetimibe is added to statins. Ezetimibe is well tolerated, and evidence of a beneficial effect on cardiovascular disease endpoints may be inferred from a trial of combination therapy with simvastatin. Plant sterol-supplemented foods, which also reduce cholesterol absorption, lower LDL-C by 7–15%.Bile acid sequestering resins. Drugs in this class include colestyramine, colestipol and colesevelam. These pre-vent the reabsorption of bile acids, thereby increasing de novo bile acid synthesis from hepatic cholesterol. As with ezetimibe, the resultant depletion of hepatic cholesterol up-regulates LDL receptor activity and reduces LDL-C in a manner that is synergistic with the action of statins. Resins reduce LDL-C and modestly increase HDL-C, but may increase TG. They are safe but may interfere with bioavailability of other drugs.
Fig. 16.16 Flow chart for the drug treatment of hyperlipidaemia. *Interrupt treatment if CK is more than 5–10 times the upper limit of normal, or if elevated with muscle symptoms, or if ALT is more than 2–3 times the upper limit. To convert TG in mmol/L to mg/dL, multiply by 88. To convert LDL-C in mmol/L to mg/dL, multiply by 38. (ALT = alanine aminotransferase; CK = creatine kinase)
Predominanthypercholesterolaemia
Mixedhyperlipidaemia
Predominanthypertriglyceridaemia
First-line treatmentwith statin
Ezetimibe if intolerant
Monitor lipids,Monitor for side-effects*
Titrate dose
Statin± ezetimibe± resin± nicotinate if resistant
Combinationtreatment likely if
TG and LDL > 4 mmol/L
Statin + fish oilFibrate + ezetimibeStatin + nicotinate
Statin + fibrateMonitor for side-effects*
First-line treatmentwith fibrate
Fish oil if intolerant
Monitor lipids,Monitor for side-effects*
Titrate fish oil
Fibrate± fish oil± nicotinate if resistant
‘Meta-analysis of major randomised controlled clinical trials involving over 130 000 subjects receiving statins for approximately 5 years showed a reduced risk of a major cardiovascular event of 21% (95% confidence interval 19–23%) per 1 mmol/L reduction in LDL-C, irrespective of age, gender, baseline LDL-C or intercurrent cardiovascular disease. Relative risk reduction was equally favourable in the subjects with the lowest risk.’
• Cholesterol Treatment Trialists Collaborators. Lancet 2012; 380:581–590.
16.29 Benefits of using statins to treat patients with hypercholesterolaemia

CliniCal bioChemistry and metabolism
16
458
absolute cardiovascular risk assessed periodically. It is not necessary to perform routine checks of CK and liver function unless symptoms occur, or if statins are used in combination with fibrates, nicotinic acid or other drugs that may interfere with their clearance. If myalgia or weakness occurs in association with CK elevation over 5–10 times the upper limit of normal, or if sustained alanine aminotransferase (ALT) elevation more than 2–3 times the upper limit of normal occurs that is not accounted for by fatty liver (p. 959), treatment should be discontinued and alternative therapy sought.
The principles of the management of dyslipidaemia can be applied broadly, but the objectives of treatment in the elderly (Box 16.30) and the safety of pharmaco-logical therapy in pregnancy (Box 16.31) warrant special consideration.
DISORDERS OF HAEM SYNTHESIS – THE PORPHYRIAS
The porphyrias are a group of disorders caused by inherited abnormalities in the haem biosynthetic pathway (Fig. 16.17). Most of the described forms are due to partial enzyme deficiencies with a dominant mode of inheritance. They are commonly classified as either hepatic or erythropoietic, depending on whether the major site of excess porphyrin production is in the liver or in the red cell.
and increase HDL-C by up to 20%, but LDL-C changes are variable.
Fewer large-scale trials have been conducted with fibrates than with statins and the results are less con-clusive, but reduced rates of cardiovascular disease have been reported with fibrate therapy in the subgroup of patients with low HDL-C levels and elevated TG (e.g. TG > 2.3 mmol/L (200 mg/dL)). Fibrates are usually well tolerated but share a similar side-effect profile to statins. In addition, they may increase the risk of cholelithiasis and prolong the action of anticoagu-lants. Accumulating evidence suggests that they may also have a protective effect against diabetic microvas-cular complications.Highly polyunsaturated long-chain n-3 fatty acids. These include eicosapentaenoic acid (EPA) and docosa-hexaenoic acid (DHA), which comprise approximately 30% of the fatty acids in fish oil. EPA and DHA are potent inhibitors of VLDL TG formation. Intakes of greater than 2 g n-3 fatty acid (equivalent to 6 g of most forms of fish oil) per day lower TG in a dose-dependent fashion. Up to 50% reduction in TG may be achieved with 15 g fish oil per day. Changes in LDL-C and HDL-C are variable. Fish oil fatty acids have also been shown to inhibit platelet aggregation and improve cardiac arrhyth-mia in animal models. Dietary and pharmacological trials suggest that n-3 fatty acids may reduce mortality from coronary heart disease. Fish oils appear to be safe and well tolerated.
Patients with predominant hypertriglyceridaemia who do not respond to lifestyle intervention can be treated with fibrates, fish oil or nicotinic acid, depending on individual response and tolerance. If target levels are not achieved, the fibrates and fish oil or nicotinic acid can be combined. Massive hypertriglyceridaemia may require more aggressive limitation of dietary fat intake (< 10–20% energy as fat). Any degree of insulin defi-ciency should be corrected because insulin is required for optimal activity of lipoprotein lipase. The initial target for patients with massive hypertriglyceridaemia is TG < 10 mmol/L (880 mg/dL), to reduce the risk of acute pancreatitis.
Mixed hyperlipidaemiaMixed hyperlipidaemia can be difficult to treat. Statins alone are less effective first-line therapy once fasting TG exceeds around 4 mmol/L (350 mg/dL). Fibrates are first-line therapy for dysbetalipoproteinaemia, but they may not control the cholesterol component in other forms of mixed hyperlipidaemia. Combination therapy is often required. Effective combinations include: statin plus fish oil when TG is not too high; fibrate plus ezetimibe; statin plus nicotinic acid; or statin plus fibrate. The risk of myopathy is increased with gemfibrozil, but fenofibrate is relatively safe in this regard.
Monitoring of therapyThe effect of drug therapy should be assessed after 6 weeks (12 weeks for fibrates). At this point, it is prudent to review side-effects, lipid response (see target levels above), CK and liver function tests. During longer-term follow-up, compliance with drug treatment, diet and exercise should be assessed, with monitoring of weight, blood pressure and lipid levels. The presence of cardio-vascular symptoms or signs should be noted and
• Prevalence of atherosclerotic cardiovascular disease: greatest in old age.
• Associated cardiovascular risk: lipid levels become less predictive, as do other risk factors apart from age itself.
• Benefit of statin therapy: maintained up to the age of 80 years but evidence is lacking beyond this.
• Life expectancy and statin therapy: lives saved by intervention are associated with shorter life expectancy than in younger patients, and so the impact of statins on quality-adjusted life years is smaller in old age.
16.30 Management of hyperlipidaemia in old age
• Lipid metabolism: lipid and lipoprotein levels increase during pregnancy. This includes an increase in LDL-C, which resolves post-partum. Remnant dyslipidaemia and hypertriglyceridaemia may be exacerbated during pregnancy.
• Treatment: dyslipidaemia is rarely thought to warrant urgent treatment so pharmacological therapy is usually contraindicated when conception or pregnancy is anticipated. Teratogenicity has been reported with systemically absorbed agents, and non-absorbed agents may interfere with nutrient bioavailability.
• Monitoring: cardiovascular disease is very unlikely amongst women of child-bearing age, but is possible in women with severe risk factor profiles or familial hypercholesterolaemia, when pre-conception cardiovascular review can be considered to ensure that the patient will be able to withstand the demands of pregnancy and labour.
16.31 Dyslipidaemia in pregnancy

Disorders of haem synthesis – the porphyrias
16
459
The other pattern of presentation is with an acute neurological syndrome. This presents with acute abdom-inal pain together with features of autonomic dysfunc-tion such as tachycardia, hypertension and constipation. Neuropsychiatric manifestations, hyponatraemia due to inappropriate ADH release (p. 438), and an acute neu-ropathy may also occur (p. 1223). The neuropathy is usually motor and may, in severe cases, progress to res-piratory failure.
There is no proven explanation for the episodic nature of the attacks in porphyria, which can relapse and remit or follow a prolonged and unremitting course. Sometimes, specific triggers can be identified, such as alcohol, fasting, or drugs such as anticonvulsants, sul-phonamides, oestrogen and progesterone. The oral con-traceptive pill is a common precipitating factor. In a significant number, no precipitant can be identified.
DiagnosisThe diagnosis of porphyria and classification into the various forms have traditionally relied on the pattern of
The porphyrias show a low penetrance in the order of 25%. Environmental factors are important in disease expression in some forms. In the most common of these conditions, porphyria cutanea tarda (PCT), these include alcohol, iron accumulation, exogenous oestrogens and exposure to various chemicals. Many cases are associ-ated with hepatitis C infection and this should always be screened for on presentation.
Clinical featuresThe clinical features of porphyria fall into two broad categories, photosensitivity and acute neurovisceral syn-drome. The enzyme defects responsible for the diseases are shown in Figure 16.17.
Photosensitive skin manifestations, attributable to excess production and accumulation of porphyrins in the skin, cause pain, erythema, bullae, skin erosions, hirsutism and hyperpigmentation, and occur predomi-nantly on areas of the skin that are exposed to sunlight (p. 1260). The skin also becomes sensitive to damage from minimal trauma.
Fig. 16.17 Haem biosynthetic pathway and enzyme defects responsible for the porphyrias. (N = neurovisceral; P = photosensitive)
δ-aminolaevulinic acid (ALA)
Porphobilinogen (PBG)
Hydroxymethylbilane
Uroporphyrinogen III
Coproporphyrinogen III
Protoporphyrinogen IX
Protoporphyrin IX (proto IX)
Haem
ALA dehydratase
Coproporphyrin I (Copro I)Uroporphyrin I (Uro I)
Isocoproporphyrin(Isocopro)
Coproporphyrin III(Copro III)
Plumboporphyria
PBG deaminase Acute intermittentporphyria
Uroporphyrinogensynthetase
Congenitalerythropoietic porphyria
Uroporphyrinogendecarboxylase
Porphyriacutanea tarda
Coproporphyrinogenoxidase
Hereditarycoproporphyria
Protoporphyrinogenoxidase Variegate porphyria
Ferrochelatase Erythropoieticprotoporphyria
+Fe2+
N
N
P
P
N + P
P
N + P
PathwayMetabolites Enzyme Deficiencydisease
Symptom-atology
Glycine + succinyl CoA
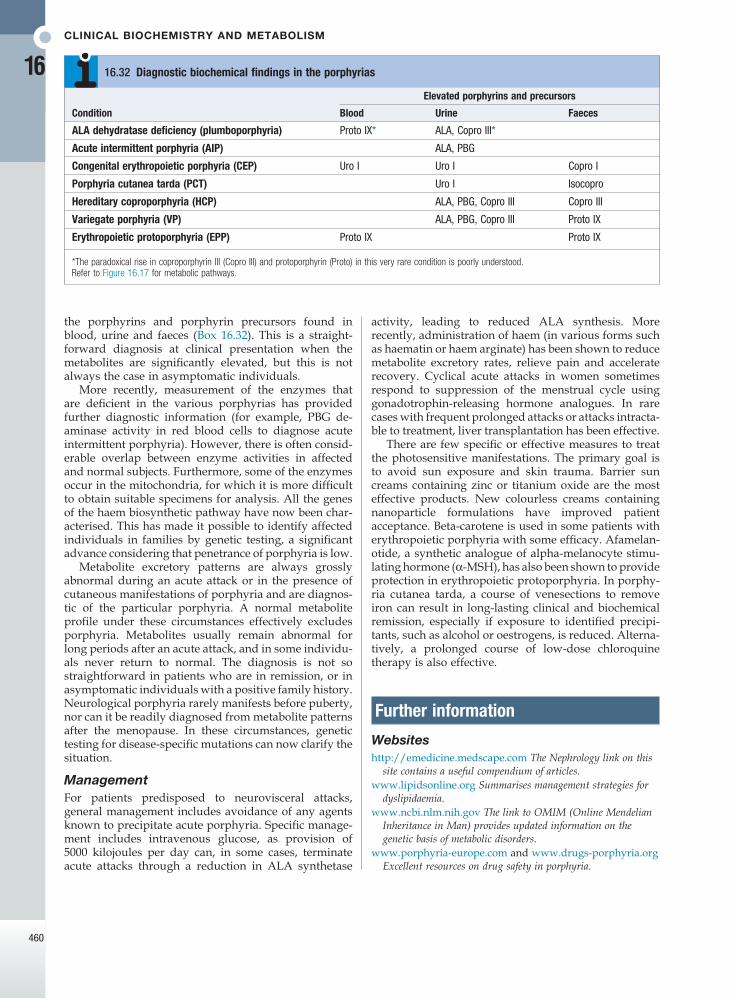
CliniCal bioChemistry and metabolism
16
460
the porphyrins and porphyrin precursors found in blood, urine and faeces (Box 16.32). This is a straight-forward diagnosis at clinical presentation when the metabolites are significantly elevated, but this is not always the case in asymptomatic individuals.
More recently, measurement of the enzymes that are deficient in the various porphyrias has provided further diagnostic information (for example, PBG de-aminase activity in red blood cells to diagnose acute intermittent porphyria). However, there is often consid-erable overlap between enzyme activities in affected and normal subjects. Furthermore, some of the enzymes occur in the mitochondria, for which it is more difficult to obtain suitable specimens for analysis. All the genes of the haem biosynthetic pathway have now been char-acterised. This has made it possible to identify affected individuals in families by genetic testing, a significant advance considering that penetrance of porphyria is low.
Metabolite excretory patterns are always grossly abnormal during an acute attack or in the presence of cutaneous manifestations of porphyria and are diagnos-tic of the particular porphyria. A normal metabolite profile under these circumstances effectively excludes porphyria. Metabolites usually remain abnormal for long periods after an acute attack, and in some individu-als never return to normal. The diagnosis is not so straightforward in patients who are in remission, or in asymptomatic individuals with a positive family history. Neurological porphyria rarely manifests before puberty, nor can it be readily diagnosed from metabolite patterns after the menopause. In these circumstances, genetic testing for disease-specific mutations can now clarify the situation.
ManagementFor patients predisposed to neurovisceral attacks, general management includes avoidance of any agents known to precipitate acute porphyria. Specific manage-ment includes intravenous glucose, as provision of 5000 kilojoules per day can, in some cases, terminate acute attacks through a reduction in ALA synthetase
activity, leading to reduced ALA synthesis. More recently, administration of haem (in various forms such as haematin or haem arginate) has been shown to reduce metabolite excretory rates, relieve pain and accelerate recovery. Cyclical acute attacks in women sometimes respond to suppression of the menstrual cycle using gonadotrophin-releasing hormone analogues. In rare cases with frequent prolonged attacks or attacks intracta-ble to treatment, liver transplantation has been effective.
There are few specific or effective measures to treat the photosensitive manifestations. The primary goal is to avoid sun exposure and skin trauma. Barrier sun creams containing zinc or titanium oxide are the most effective products. New colourless creams containing nanoparticle formulations have improved patient acceptance. Beta-carotene is used in some patients with erythropoietic porphyria with some efficacy. Afamelan-otide, a synthetic analogue of alpha-melanocyte stimu-lating hormone (α-MSH), has also been shown to provide protection in erythropoietic protoporphyria. In porphy-ria cutanea tarda, a course of venesections to remove iron can result in long-lasting clinical and biochemical remission, especially if exposure to identified precipi-tants, such as alcohol or oestrogens, is reduced. Alterna-tively, a prolonged course of low-dose chloroquine therapy is also effective.
Further information
Websiteshttp://emedicine.medscape.com The Nephrology link on this
site contains a useful compendium of articles.www.lipidsonline.org Summarises management strategies for
dyslipidaemia.www.ncbi.nlm.nih.gov The link to OMIM (Online Mendelian
Inheritance in Man) provides updated information on the genetic basis of metabolic disorders.
www.porphyria-europe.com and www.drugs-porphyria.org Excellent resources on drug safety in porphyria.
Elevated porphyrins and precursors
Condition Blood Urine Faeces
ALA dehydratase deficiency (plumboporphyria) Proto IX* ALA, Copro III*
Acute intermittent porphyria (AIP) ALA, PBG
Congenital erythropoietic porphyria (CEP) Uro I Uro I Copro I
Porphyria cutanea tarda (PCT) Uro I Isocopro
Hereditary coproporphyria (HCP) ALA, PBG, Copro III Copro III
Variegate porphyria (VP) ALA, PBG, Copro III Proto IX
Erythropoietic protoporphyria (EPP) Proto IX Proto IX
*The paradoxical rise in coproporphyrin III (Copro III) and protoporphyrin (Proto) in this very rare condition is poorly understood.
16.32 Diagnostic biochemical findings in the porphyrias
Refer to Figure 16.17 for metabolic pathways.