18-1 prepared by coby harmon university of california, santa barbara westmont college
TRANSCRIPT

18-1
Prepared byCoby Harmon
University of California, Santa BarbaraWestmont College
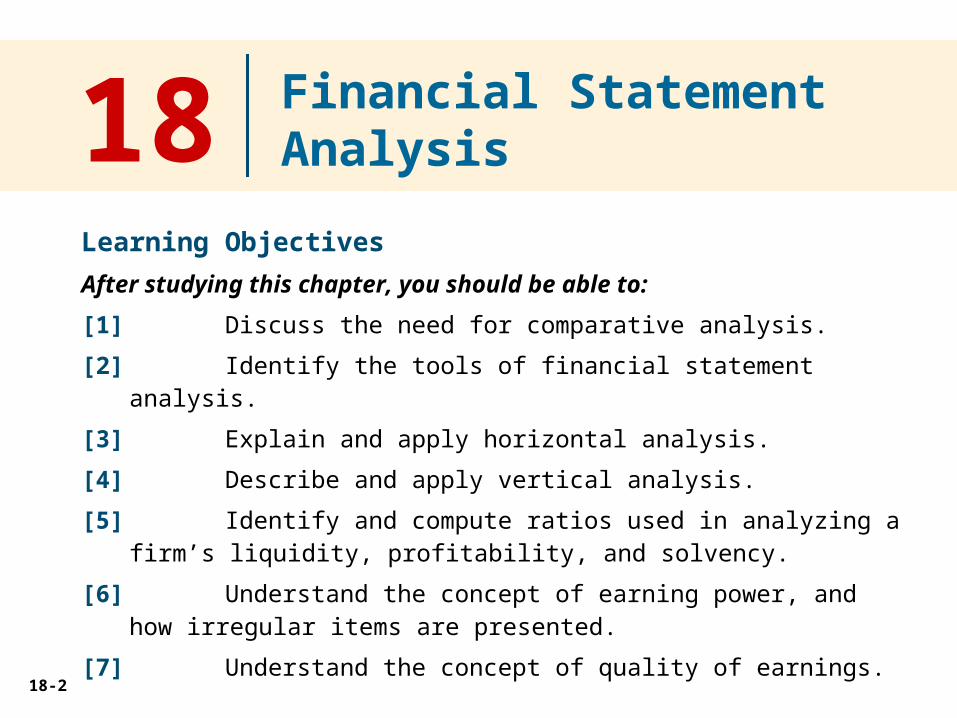
18-2
Learning Objectives
After studying this chapter, you should be able to:
[1] Discuss the need for comparative analysis.
[2] Identify the tools of financial statement analysis.
[3] Explain and apply horizontal analysis.
[4] Describe and apply vertical analysis.
[5] Identify and compute ratios used in analyzing a firm’s liquidity, profitability, and solvency.
[6] Understand the concept of earning power, and how irregular items are presented.
[7] Understand the concept of quality of earnings.
18 Financial Statement Analysis
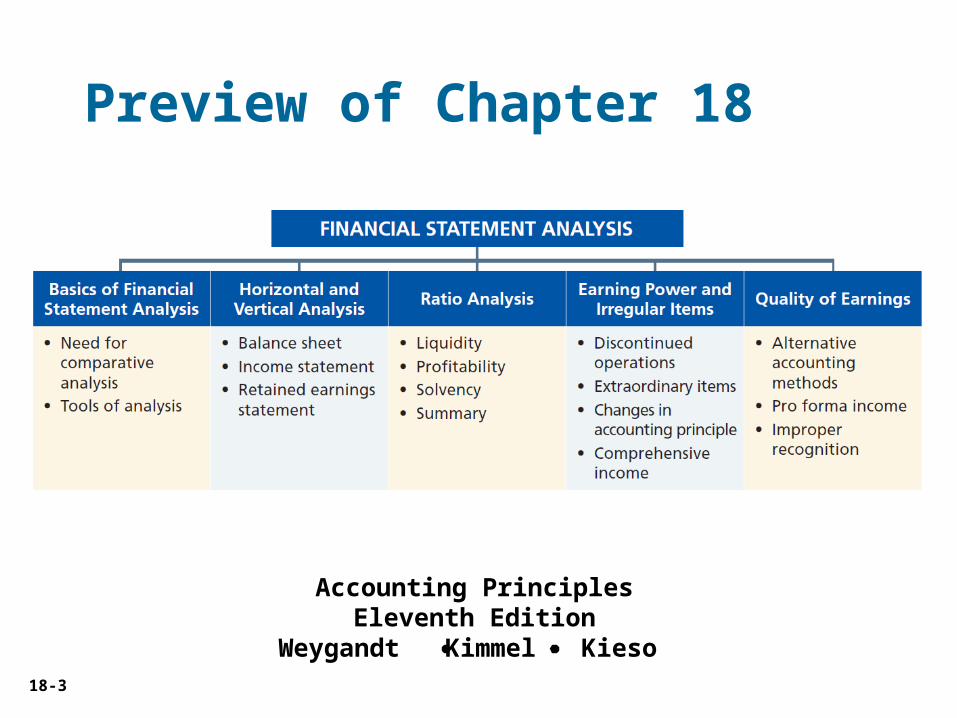
18-3
Preview of Chapter 18
Accounting PrinciplesEleventh Edition
Weygandt Kimmel Kieso

18-4
Analyzing financial statements involves:
CharacteristicsComparison
BasesTools of Analysis
Liquidity
Profitability
Solvency
Intracompany
Industry averages
Intercompany
Horizontal
Vertical
Ratio
LO 1 Discuss the need for comparative analysis.LO 2 Identify the tools of financial statement analysis.
Basics of Financial Statement Analysis

18-5 LO 3 Explain and apply horizontal analysis.
Horizontal Analysis
Horizontal analysis, also called trend analysis, is a
technique for evaluating a series of financial statement data
over a period of time.
Purpose is to determine the increase or decrease that has
taken place.
Commonly applied to the balance sheet, income
statement, and statement of retained earnings.

18-6 LO 3 Explain and apply horizontal analysis.
Changes suggest
that the company
expanded its asset
base during 2011
and financed this
expansion primarily
by retaining income
rather than assuming
additional long-term
debt.
Illustration 18-5Horizontal analysis ofbalance sheets
Horizontal Analysis

18-7 LO 3 Explain and apply horizontal analysis.
Overall, gross profit and
net income were up
substantially. Gross
profit increased
17.1%, and net income,
26.5%. Quality’s profit
trend appears
favorable.
Illustration 18-6Horizontal analysis ofIncome statements
Horizontal Analysis

18-8 LO 3 Explain and apply horizontal analysis.
In the horizontal analysis of the balance sheet the ending
retained earnings increased 38.6%. As indicated earlier, the
company retained a significant portion of net income to
finance additional plant facilities.
Illustration 18-7Horizontal analysis ofretained earnings statements
Horizontal Analysis
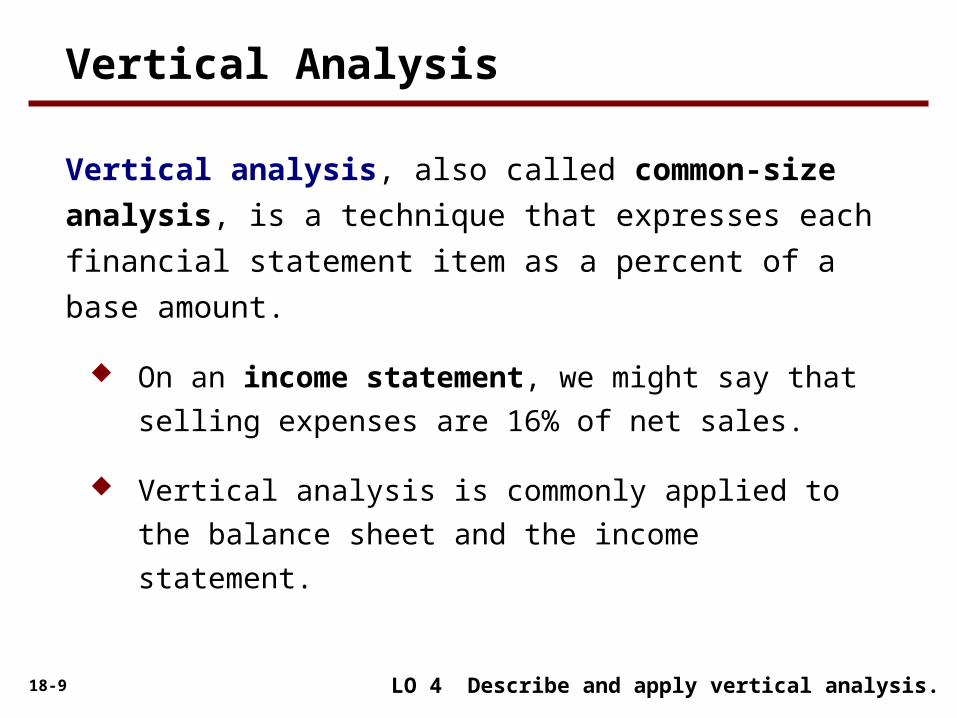
18-9 LO 4 Describe and apply vertical analysis.
Vertical analysis, also called common-size analysis, is a
technique that expresses each financial statement item as
a percent of a base amount.
On an income statement, we might say that selling
expenses are 16% of net sales.
Vertical analysis is commonly applied to the balance
sheet and the income statement.
Vertical Analysis
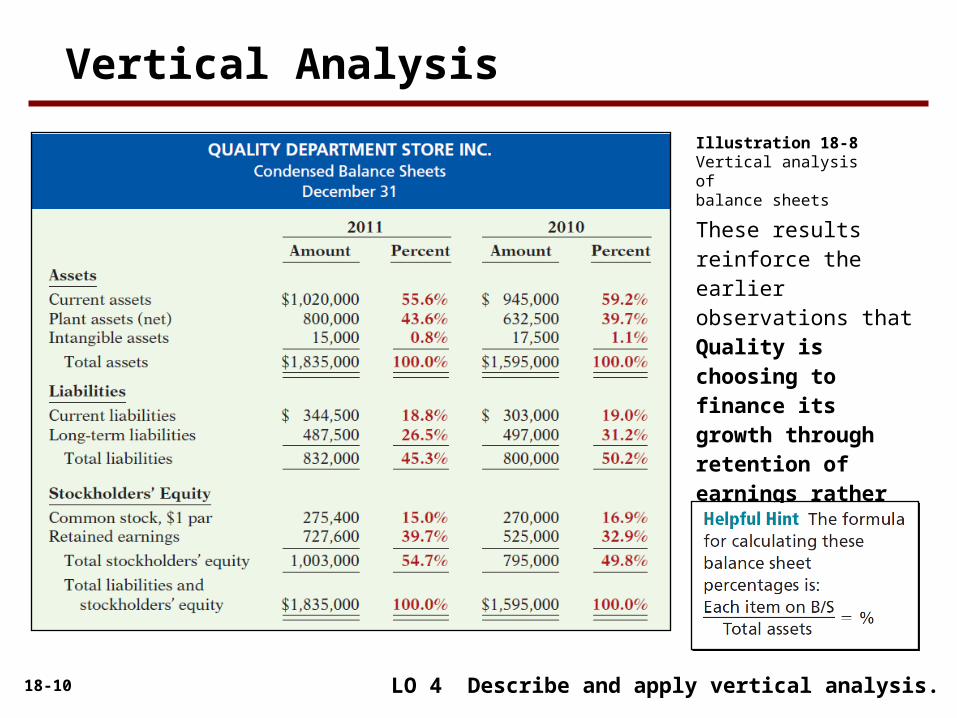
18-10
These results reinforce the earlier observations that Quality is choosing to finance its growth through retention of earnings rather than through issuing additional debt.
Illustration 18-8Vertical analysis ofbalance sheets
LO 4 Describe and apply vertical analysis.
Vertical Analysis
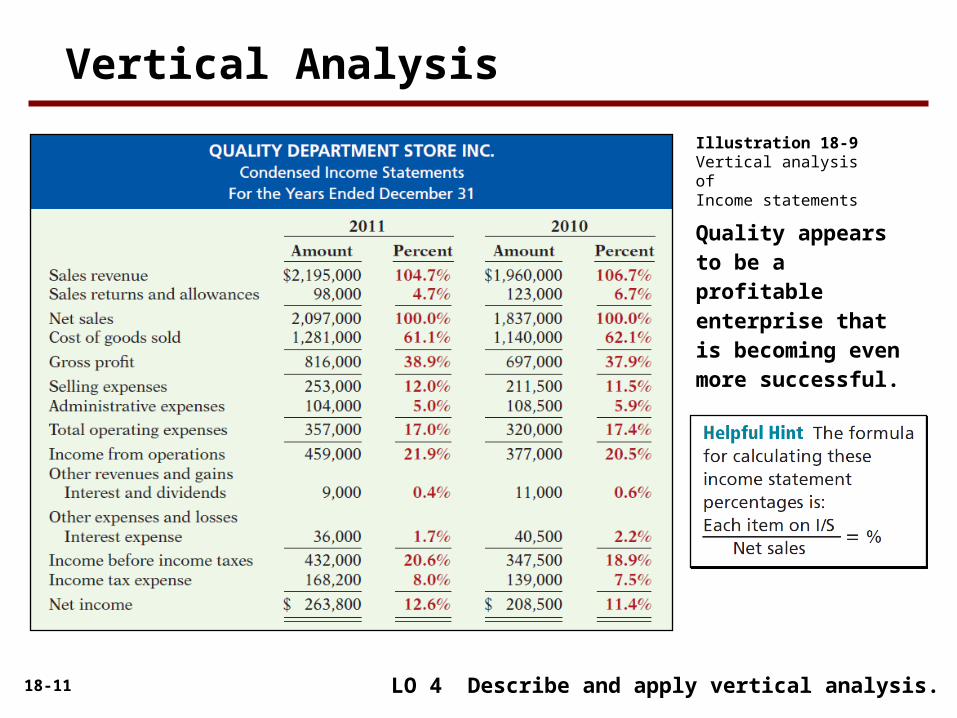
18-11
Quality appearsto be a profitable enterprise that is becoming even more successful.
Illustration 18-9Vertical analysis ofIncome statements
LO 4 Describe and apply vertical analysis.
Vertical Analysis

18-12
Enables a comparison of companies of different sizes.
Illustration 18-10Intercompany income statement comparison
LO 4 Describe and apply vertical analysis.
Vertical Analysis
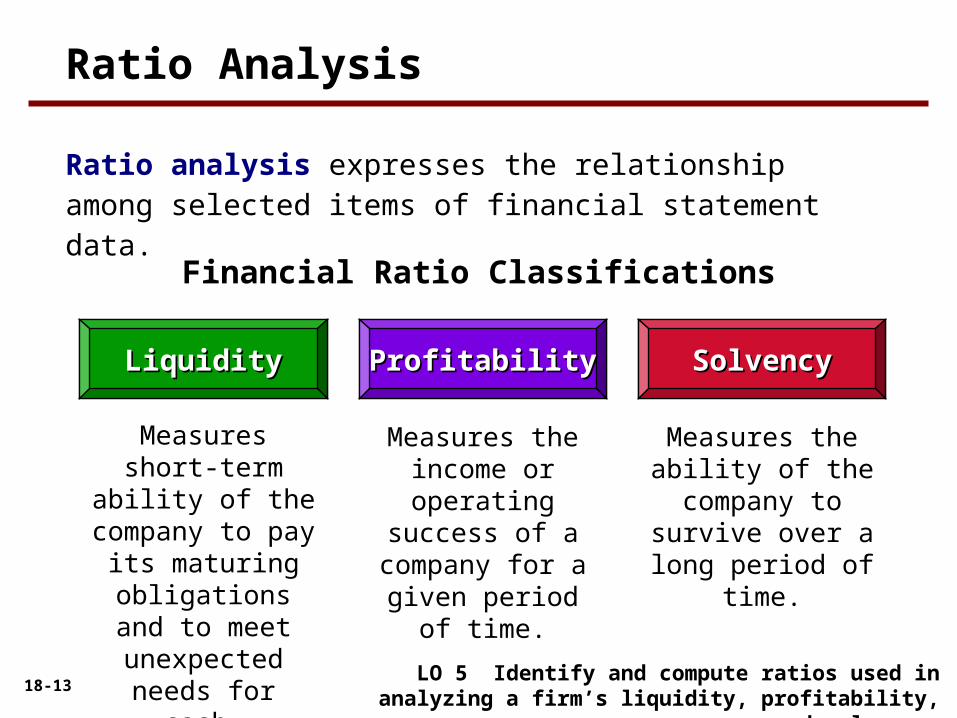
18-13LO 5 Identify and compute ratios used in analyzing a
firm’s liquidity, profitability, and solvency.
Ratio analysis expresses the relationship among selected items of financial statement data.
LiquidityLiquidity ProfitabilityProfitability SolvencySolvency
Measures short-term ability of the
company to pay its maturing
obligations and to meet unexpected needs for cash.
Financial Ratio Classifications
Measures the income or
operating success of a company for a
given period of time.
Measures the ability of the company to
survive over a long period of time.
Ratio Analysis
18-14LO 5 Identify and compute ratios used in analyzing a
firm’s liquidity, profitability, and solvency.
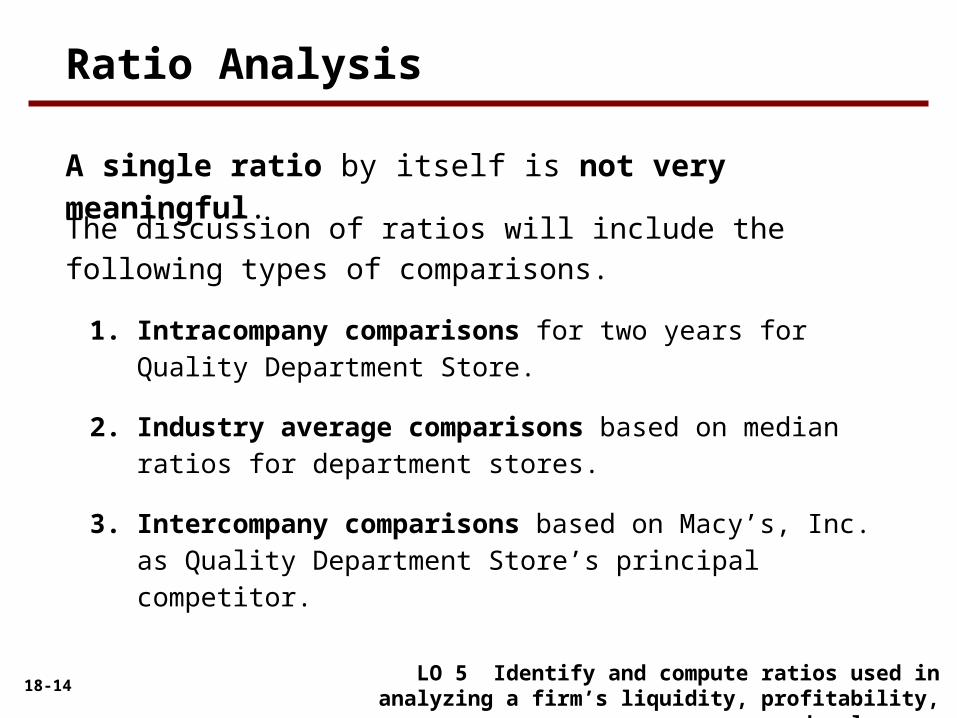
The discussion of ratios will include the following types of comparisons.
1. Intracompany comparisons for two years for Quality Department Store.
2. Industry average comparisons based on median ratios for department stores.
3. Intercompany comparisons based on Macy’s, Inc. as Quality Department Store’s principal competitor.
A single ratio by itself is not very meaningful.
Ratio Analysis
18-15
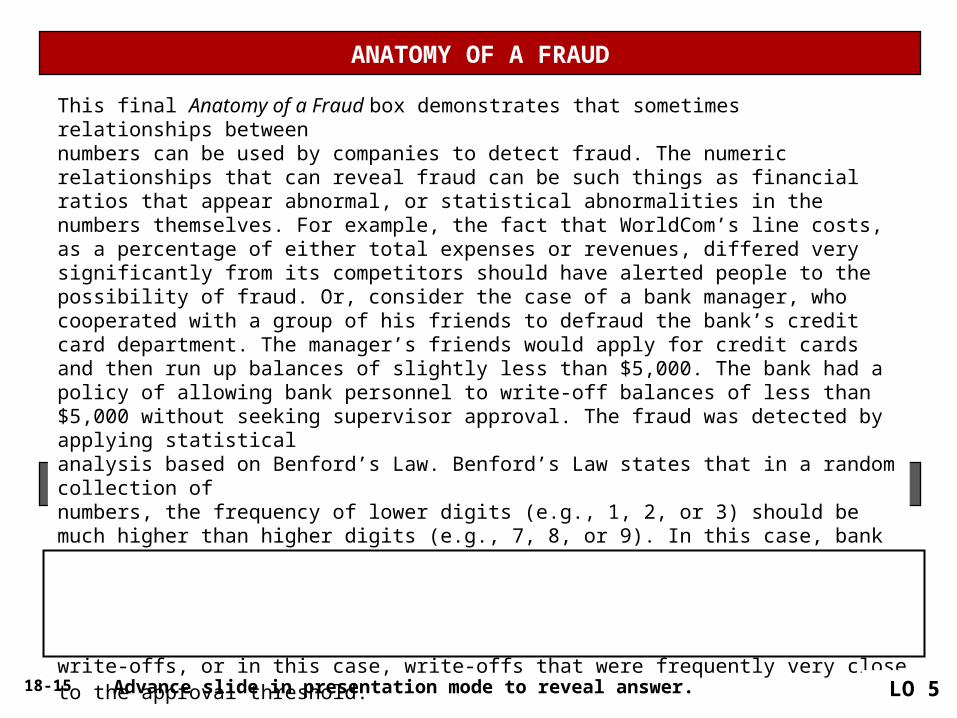
THE MISSING CONTROLSIndependent internal verification. While it might be efficient to allow employees to write off accounts below a certain level, it is important that these write-offs be reviewed and verified periodically. Such a review would likely call attention to an employee with large amounts of write-offs, or in this case, write-offs that were frequently very close to the approval threshold.
Total take: Thousands of dollars
ANATOMY OF A FRAUD
This final Anatomy of a Fraud box demonstrates that sometimes relationships betweennumbers can be used by companies to detect fraud. The numeric relationships that can reveal fraud can be such things as financial ratios that appear abnormal, or statistical abnormalities in the numbers themselves. For example, the fact that WorldCom’s line costs, as a percentage of either total expenses or revenues, differed very significantly from its competitors should have alerted people to the possibility of fraud. Or, consider the case of a bank manager, who cooperated with a group of his friends to defraud the bank’s credit card department. The manager’s friends would apply for credit cards and then run up balances of slightly less than $5,000. The bank had a policy of allowing bank personnel to write-off balances of less than $5,000 without seeking supervisor approval. The fraud was detected by applying statisticalanalysis based on Benford’s Law. Benford’s Law states that in a random collection ofnumbers, the frequency of lower digits (e.g., 1, 2, or 3) should be much higher than higher digits (e.g., 7, 8, or 9). In this case, bank auditors analyzed the first two digits of amounts written off. There was a spike at 48 and 49, which was not consistent with what would be expected if the numbers were random.
Advance slide in presentation mode to reveal answer. LO 5
18-16LO 5 Identify and compute ratios used in analyzing a
firm’s liquidity, profitability, and solvency.
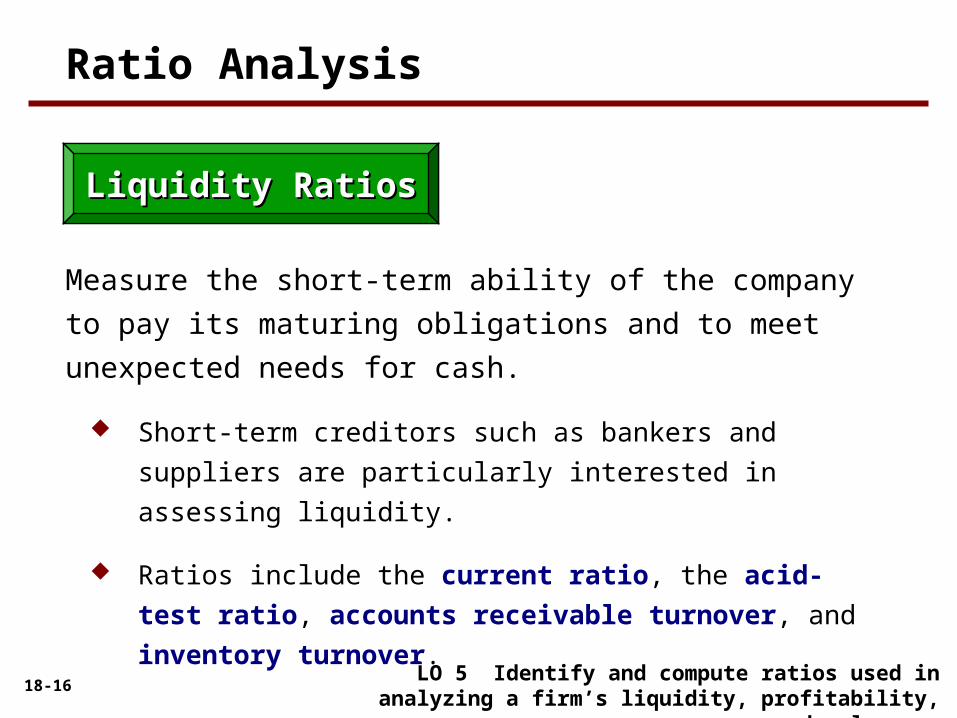
Liquidity RatiosLiquidity Ratios
Measure the short-term ability of the company to pay its
maturing obligations and to meet unexpected needs for cash.
Short-term creditors such as bankers and suppliers are
particularly interested in assessing liquidity.
Ratios include the current ratio, the acid-test ratio,
accounts receivable turnover, and inventory turnover.
Ratio Analysis
18-17
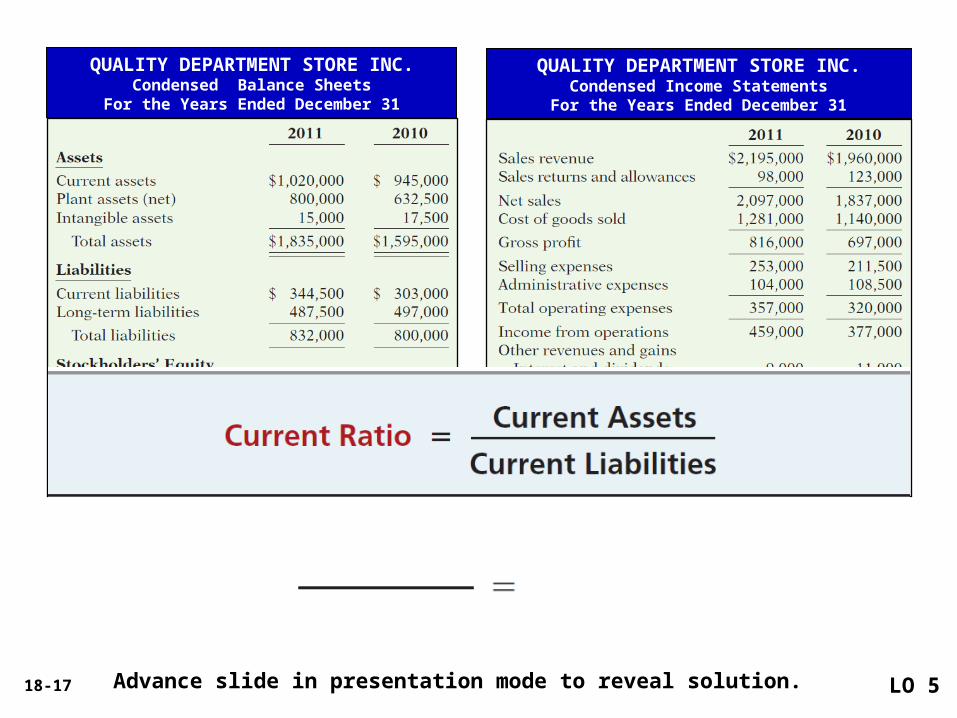
QUALITY DEPARTMENT STORE INC.Condensed Balance Sheets
For the Years Ended December 31
Illustration 18-12
QUALITY DEPARTMENT STORE INC.Condensed Income Statements
For the Years Ended December 31
LO 5Advance slide in presentation mode to reveal solution.
18-18LO 5 Identify and compute ratios used in analyzing a
firm’s liquidity, profitability, and solvency.
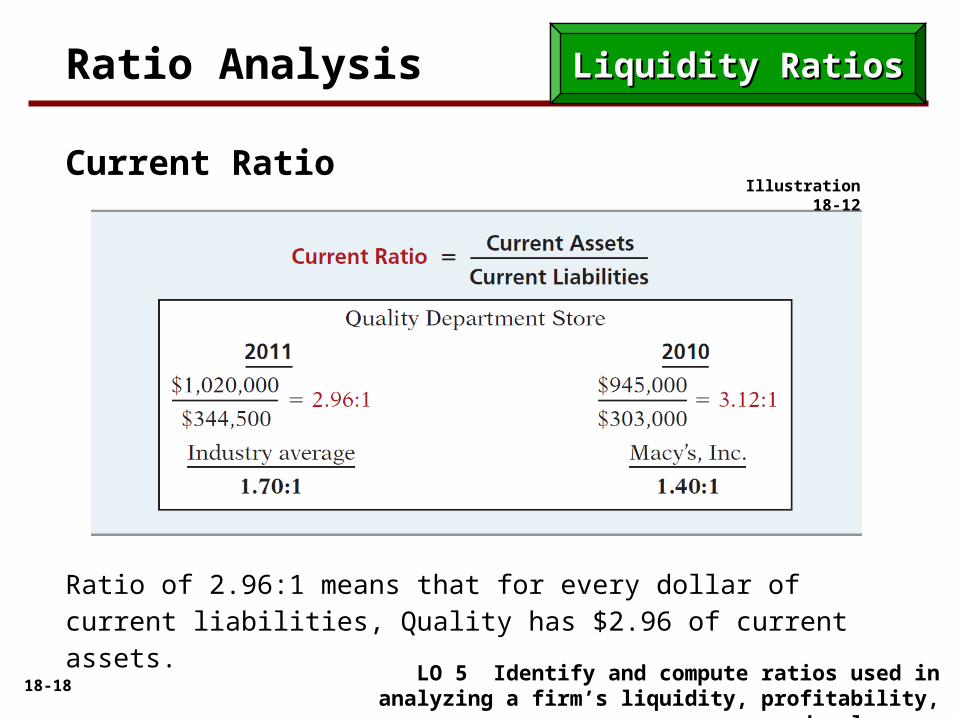
Ratio of 2.96:1 means that for every dollar of current liabilities, Quality has $2.96 of current assets.
Ratio Analysis Liquidity RatiosLiquidity Ratios
Current RatioIllustration 18-12

18-19LO 5 Identify and compute ratios used in analyzing a
firm’s liquidity, profitability, and solvency.
Illustration 18-13
Ratio Analysis
Acid-Test Ratio
Liquidity RatiosLiquidity Ratios
18-20
Illustration 18-12
LO 5
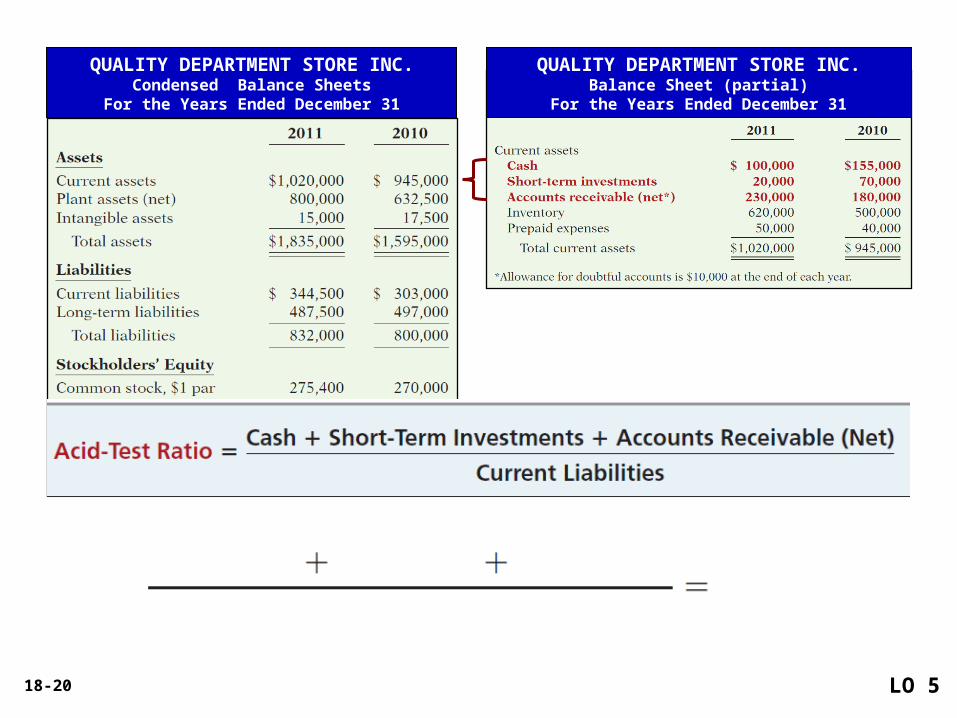
QUALITY DEPARTMENT STORE INC.Balance Sheet (partial)
For the Years Ended December 31
QUALITY DEPARTMENT STORE INC.Condensed Balance Sheets
For the Years Ended December 31
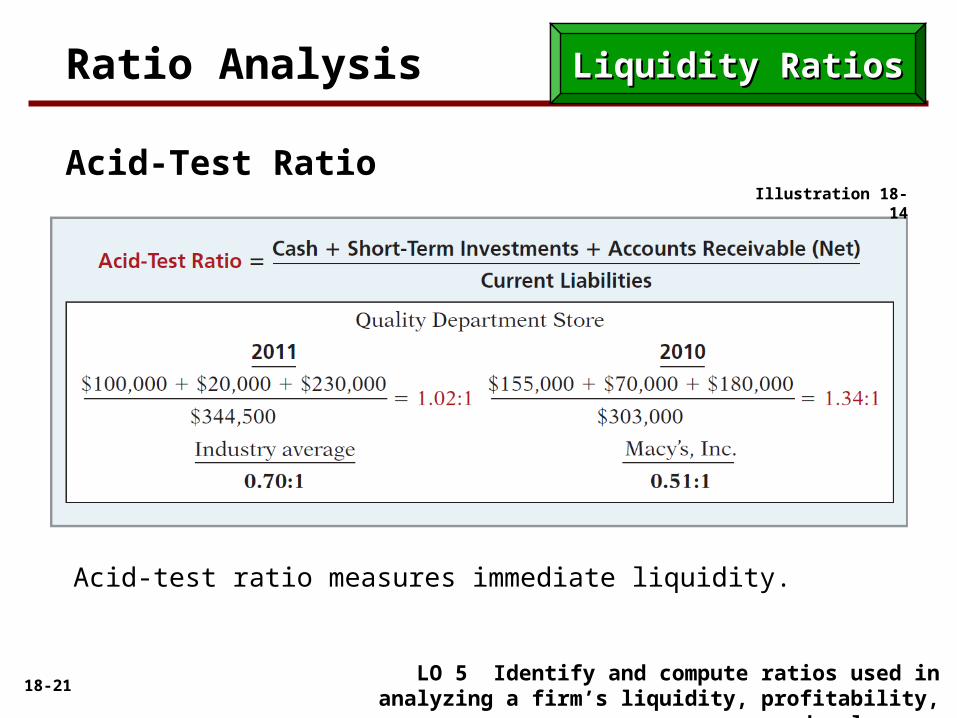
18-21LO 5 Identify and compute ratios used in analyzing a
firm’s liquidity, profitability, and solvency.
Illustration 18-14
Ratio Analysis
Acid-Test Ratio
Liquidity RatiosLiquidity Ratios
Acid-test ratio measures immediate liquidity.
18-22
18-23 LO 5
QUALITY DEPARTMENT STORE INC.Balance Sheet (partial)
For the Years Ended December 31
QUALITY DEPARTMENT STORE INC.Condensed Income Statements
For the Years Ended December 31
18-24 LO 5
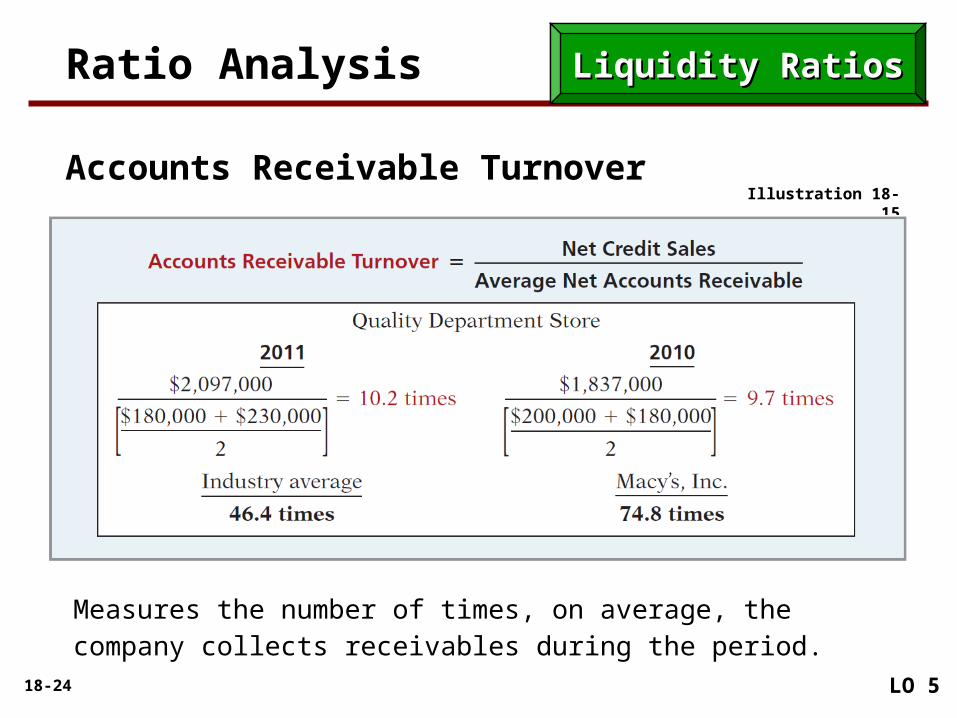
Illustration 18-15
Ratio Analysis
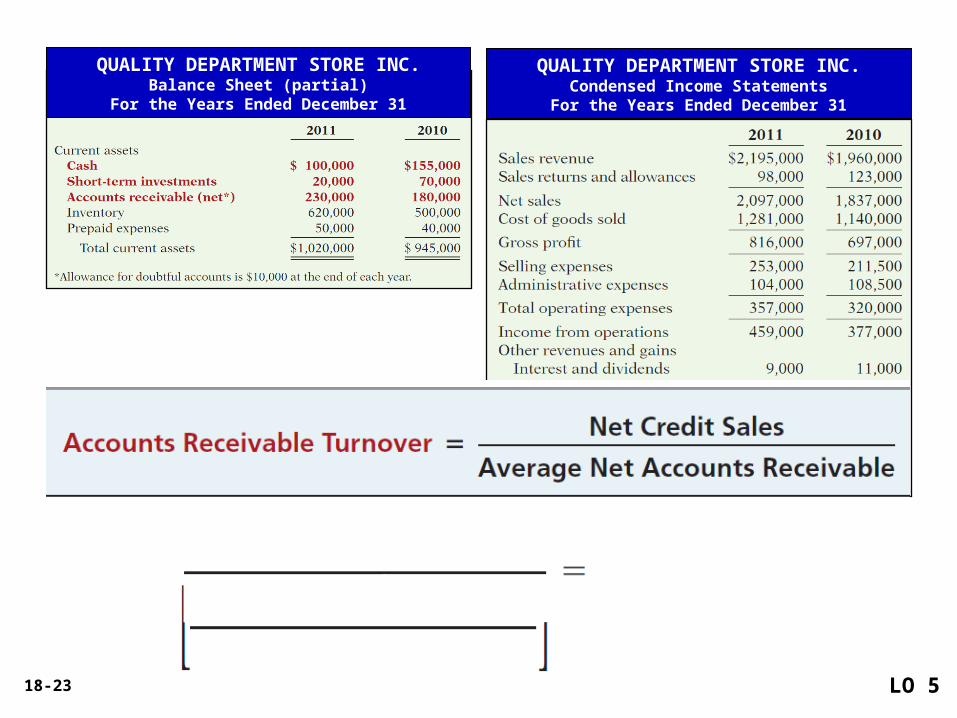
Accounts Receivable Turnover
Liquidity RatiosLiquidity Ratios
Measures the number of times, on average, the company collects receivables during the period.
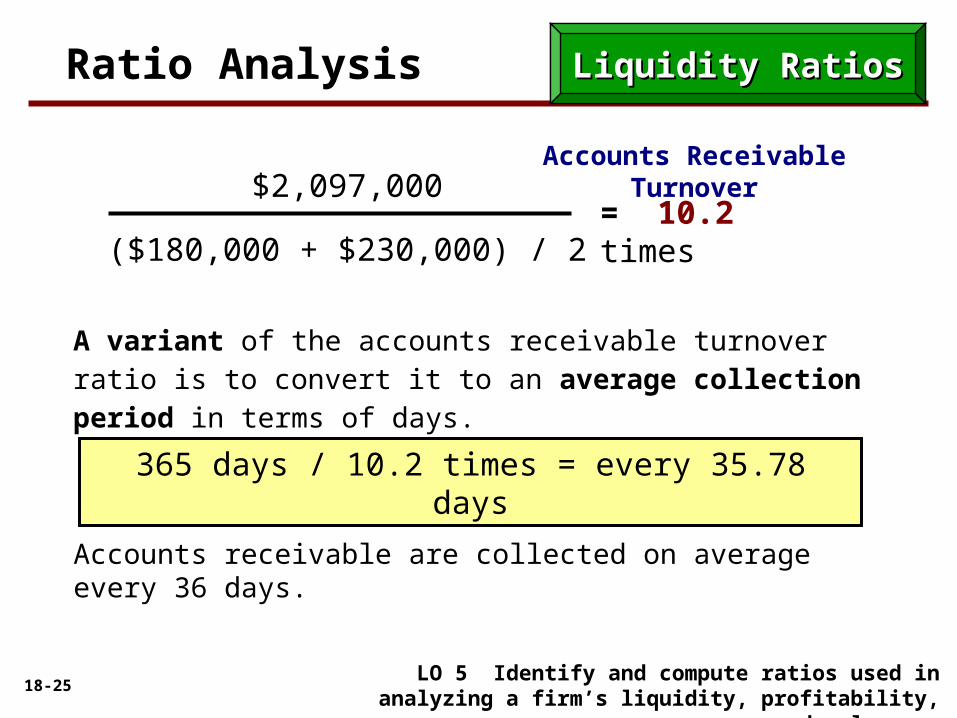
18-25LO 5 Identify and compute ratios used in analyzing a
firm’s liquidity, profitability, and solvency.
A variant of the accounts receivable turnover ratio is to convert it to an average collection period in terms of days.
Accounts receivable are collected on average every 36 days.
$2,097,000
($180,000 + $230,000) / 2= 10.2 times
365 days / 10.2 times = every 35.78 days
Accounts Receivable Turnover
Ratio Analysis Liquidity RatiosLiquidity Ratios
18-26
Illustration 18-12
QUALITY DEPARTMENT STORE INC.Condensed Income Statements
For the Years Ended December 31
LO 5
QUALITY DEPARTMENT STORE INC.Balance Sheet (partial)
For the Years Ended December 31
18-27 LO 5
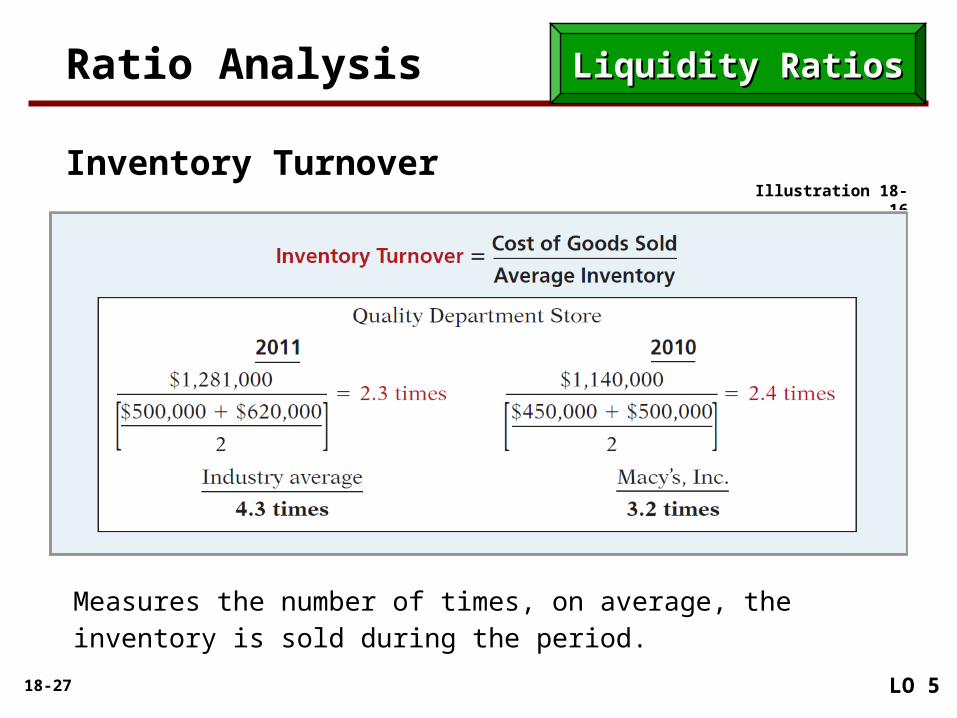
Illustration 18-16
Ratio Analysis
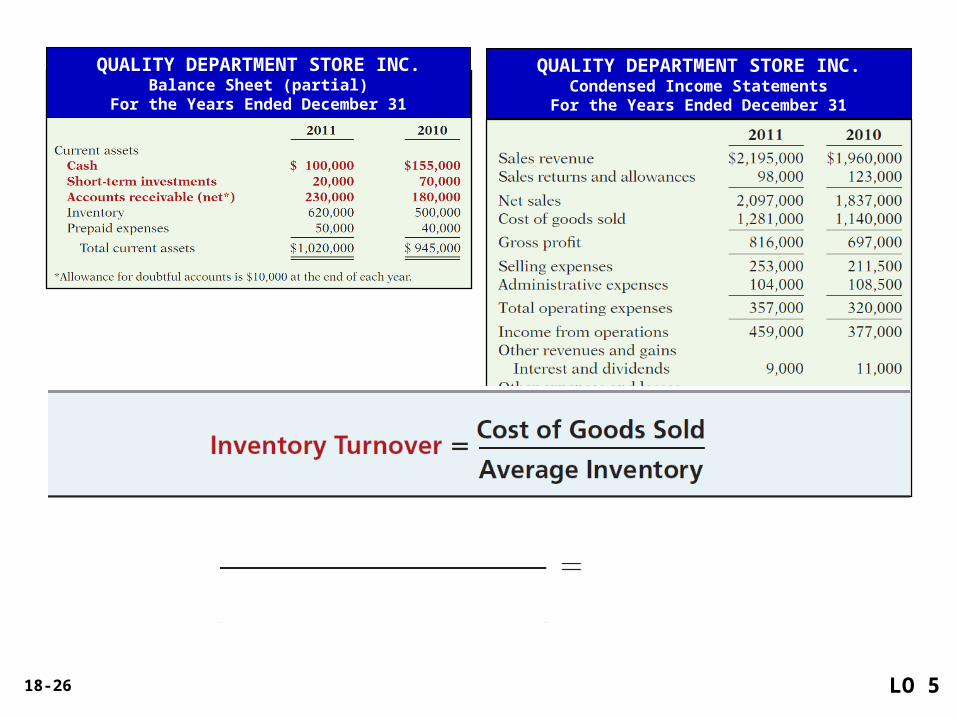
Inventory Turnover
Liquidity RatiosLiquidity Ratios
Measures the number of times, on average, the inventory is sold during the period.

18-28LO 5 Identify and compute ratios used in analyzing a
firm’s liquidity, profitability, and solvency.
A variant of inventory turnover is the days in inventory.
Inventory turnover ratios vary considerably among industries.
365 days / 2.3 times = every 159 days
$1,281,000
($500,000 + $620,000) / 2 = 2.3 times
Inventory Turnover
Ratio Analysis Liquidity RatiosLiquidity Ratios

18-29LO 5 Identify and compute ratios used in analyzing a
firm’s liquidity, profitability, and solvency.
Profitability RatiosProfitability Ratios
Measure the income or operating success of a company for a
given period of time.
Income, or the lack of it, affects the company’s ability to obtain
debt and equity financing, liquidity position, and the ability to
grow.
Ratios include the profit margin, asset turnover, return on
assets, return on common stockholders’ equity, earnings
per share, price-earnings, and payout ratio.
Ratio Analysis
18-30
QUALITY DEPARTMENT STORE INC.Condensed Balance Sheets
For the Years Ended December 31
QUALITY DEPARTMENT STORE INC.Condensed Income Statements
For the Years Ended December 31
LO 5

18-31
Illustration 18-17
Ratio Analysis
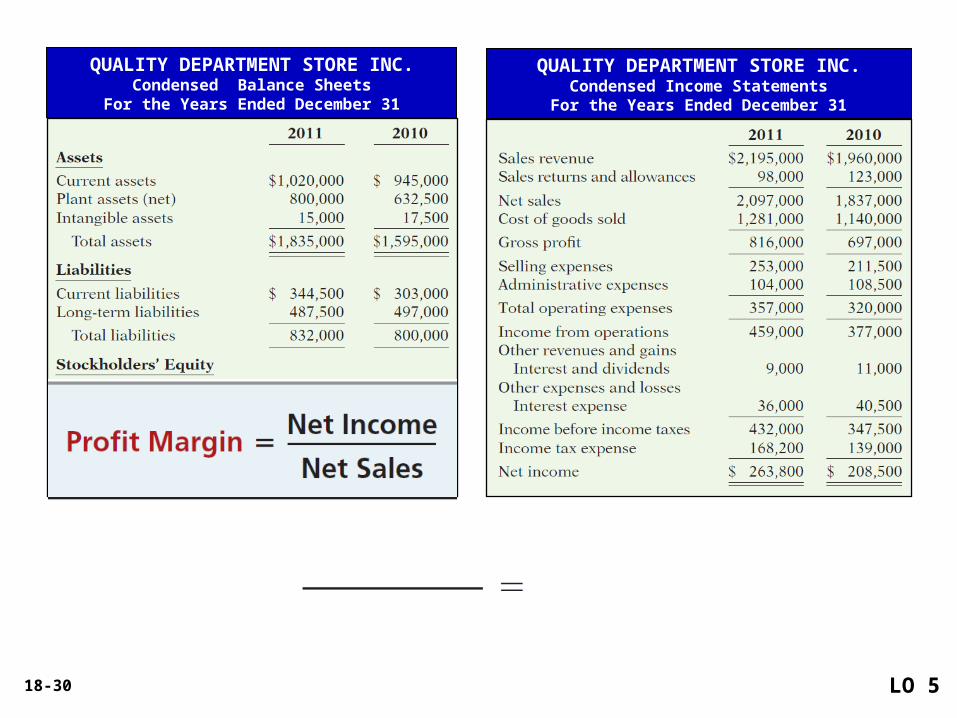
Profit Margin
Measures the percentage of each dollar of sales that results in net income.
LO 5 Identify and compute ratios used in analyzing a firm’s liquidity, profitability, and solvency.
Profitability RatiosProfitability Ratios
18-32
QUALITY DEPARTMENT STORE INC.Condensed Balance Sheets
For the Years Ended December 31
Illustration 18-12
QUALITY DEPARTMENT STORE INC.Condensed Income Statements
For the Years Ended December 31
LO 5

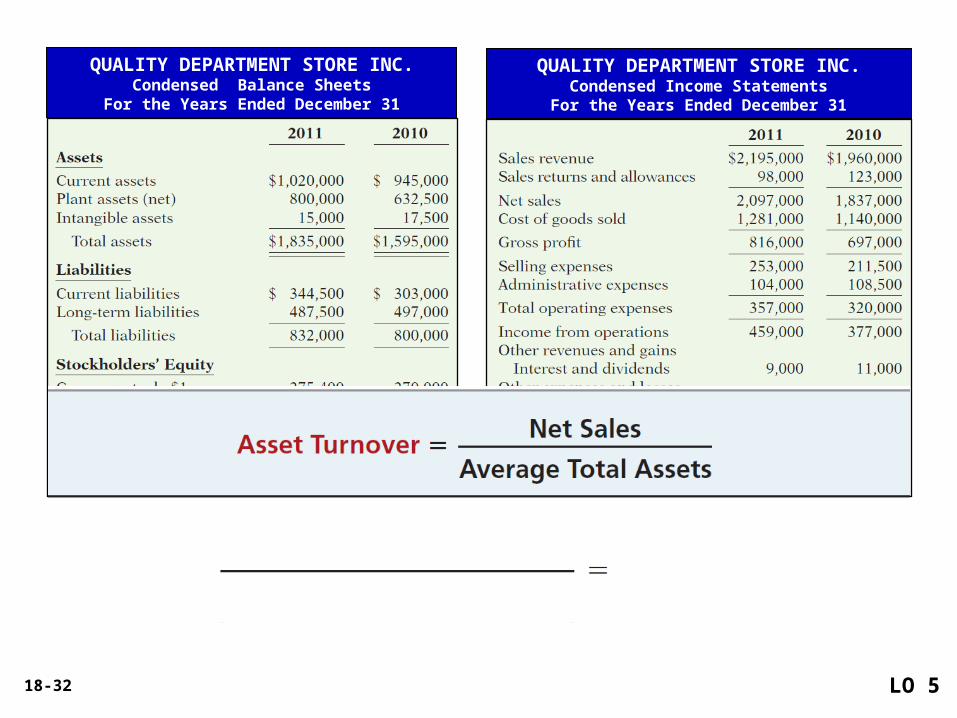
18-33
Illustration 18-18
Ratio Analysis
Asset Turnover
Measures how efficiently a company uses its assets to generate sales.
LO 5 Identify and compute ratios used in analyzing a firm’s liquidity, profitability, and solvency.
Profitability RatiosProfitability Ratios

18-34
QUALITY DEPARTMENT STORE INC.Condensed Balance Sheets
For the Years Ended December 31
Illustration 18-12
QUALITY DEPARTMENT STORE INC.Condensed Income Statements
For the Years Ended December 31
LO 5

18-35
Ratio Analysis
Return on Asset
An overall measure of profitability.
LO 5 Identify and compute ratios used in analyzing a firm’s liquidity, profitability, and solvency.
Profitability RatiosProfitability Ratios
Illustration 18-19
18-36
QUALITY DEPARTMENT STORE INC.Condensed Balance Sheets
For the Years Ended December 31
Illustration 18-12
QUALITY DEPARTMENT STORE INC.Condensed Income Statements
For the Years Ended December 31
LO 5

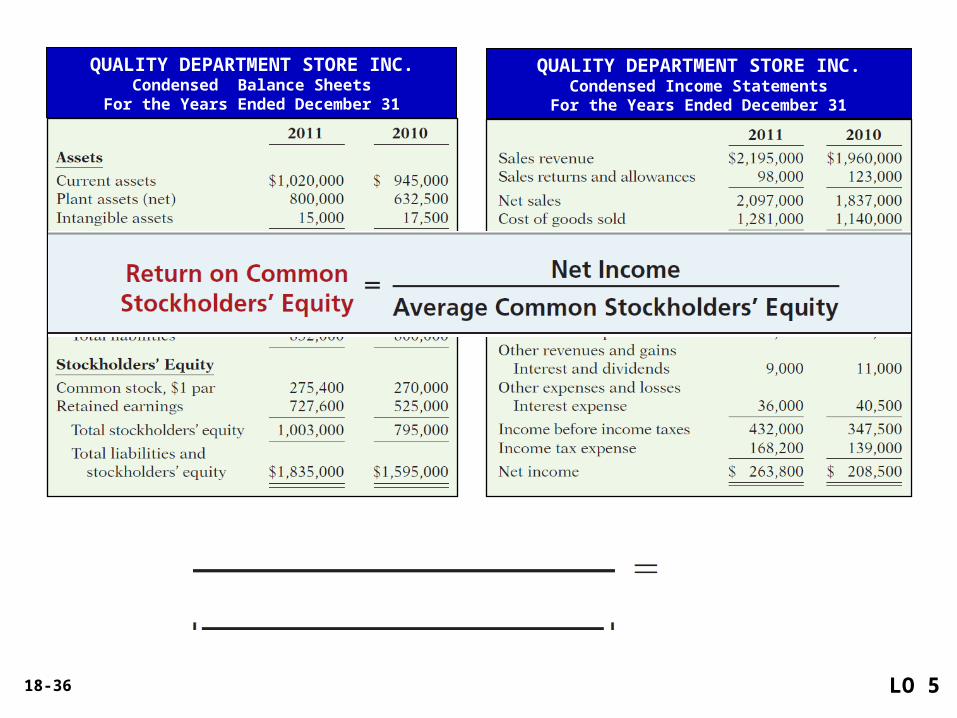
18-37
Ratio Analysis
Return on Common Stockholders’ Equity
Shows how many dollars of net income the company earned for each dollar invested by the owners.
Profitability RatiosProfitability Ratios
LO 5
Illustration 18-20

18-38
QUALITY DEPARTMENT STORE INC.Condensed Balance Sheets
For the Years Ended December 31
Illustration 18-12
QUALITY DEPARTMENT STORE INC.Condensed Income Statements
For the Years Ended December 31
LO 5

18-39
Ratio Analysis
Earnings Per Share (EPS)
A measure of the net income earned on each share of common stock.
Profitability RatiosProfitability Ratios
LO 5
Illustration 18-22
18-40
QUALITY DEPARTMENT STORE INC.Condensed Balance Sheets
For the Years Ended December 31
Illustration 18-12
QUALITY DEPARTMENT STORE INC.Condensed Income Statements
For the Years Ended December 31
LO 5
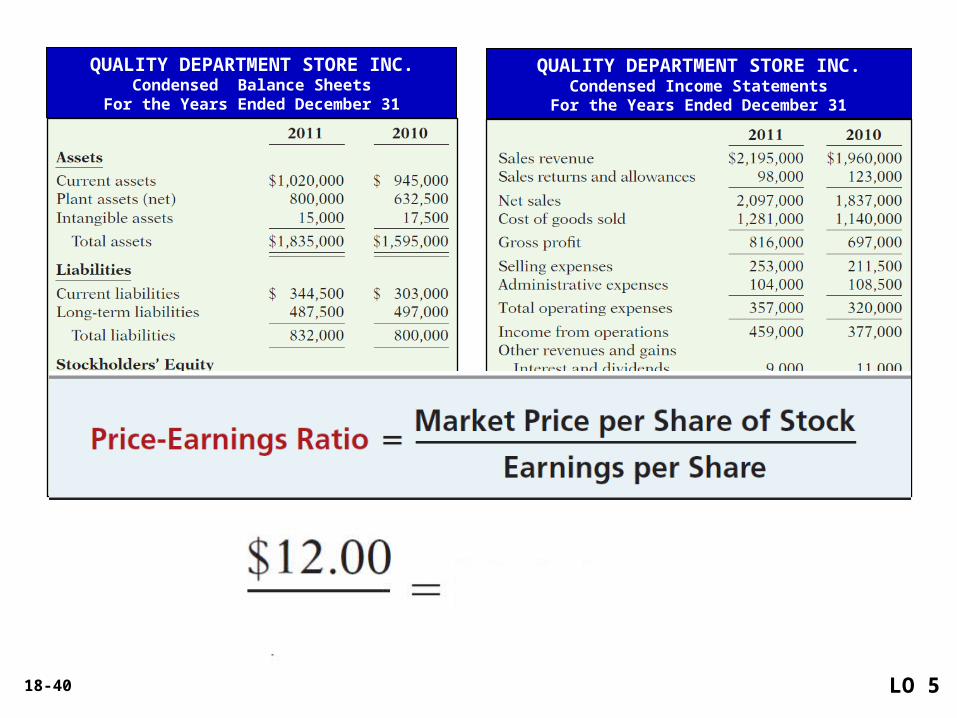
18-41
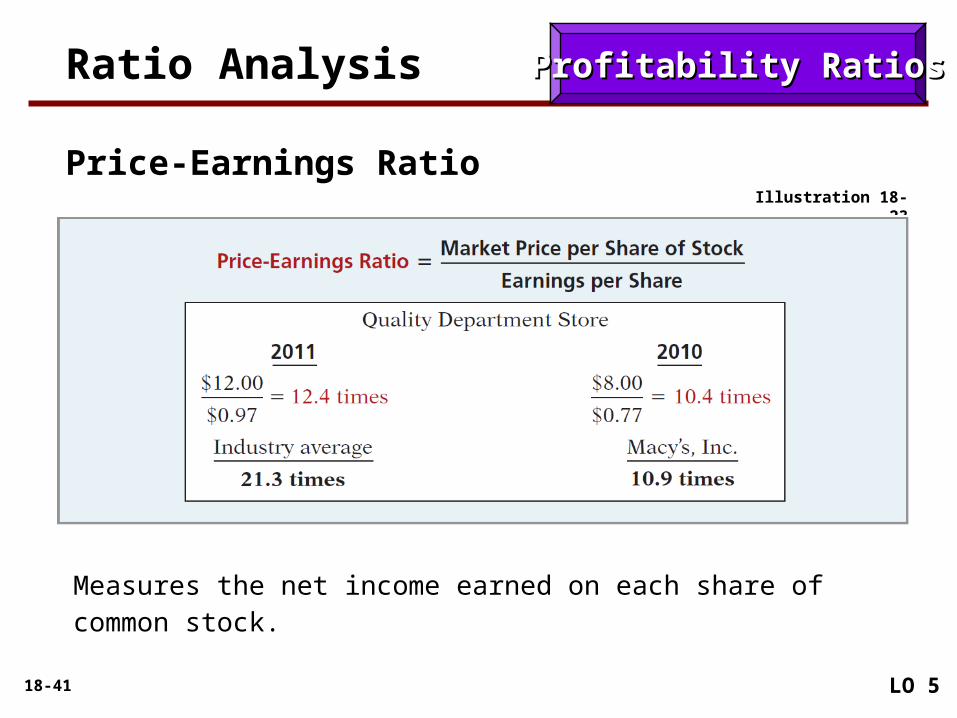
Ratio Analysis
Price-Earnings Ratio
Measures the net income earned on each share of common stock.
Profitability RatiosProfitability Ratios
LO 5
Illustration 18-23
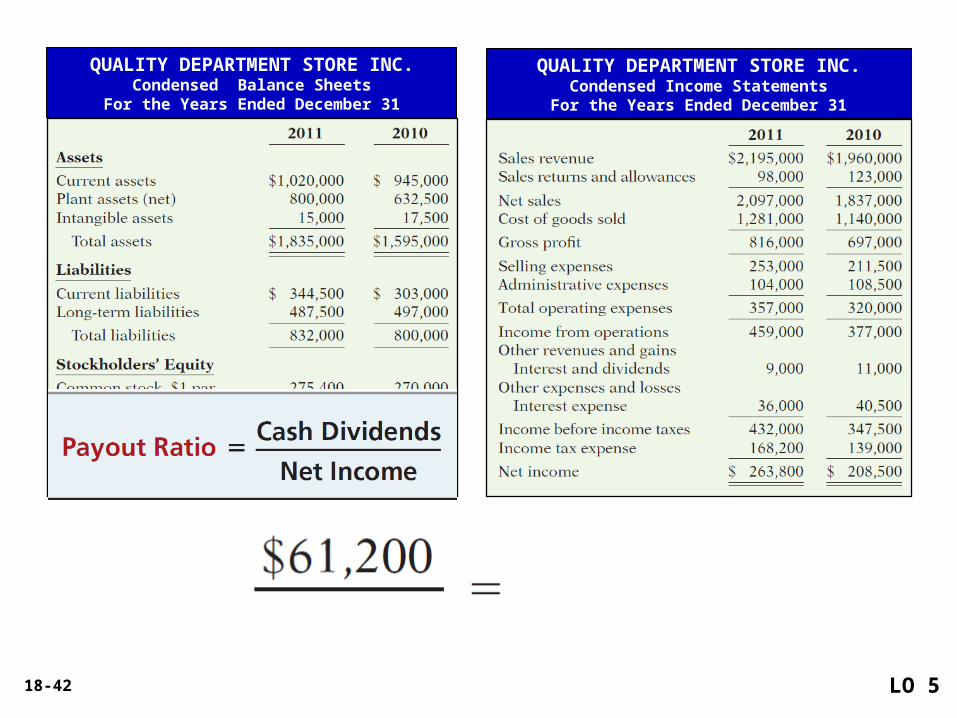
18-42
QUALITY DEPARTMENT STORE INC.Condensed Balance Sheets
For the Years Ended December 31
Illustration 18-12
QUALITY DEPARTMENT STORE INC.Condensed Income Statements
For the Years Ended December 31
LO 5
18-43
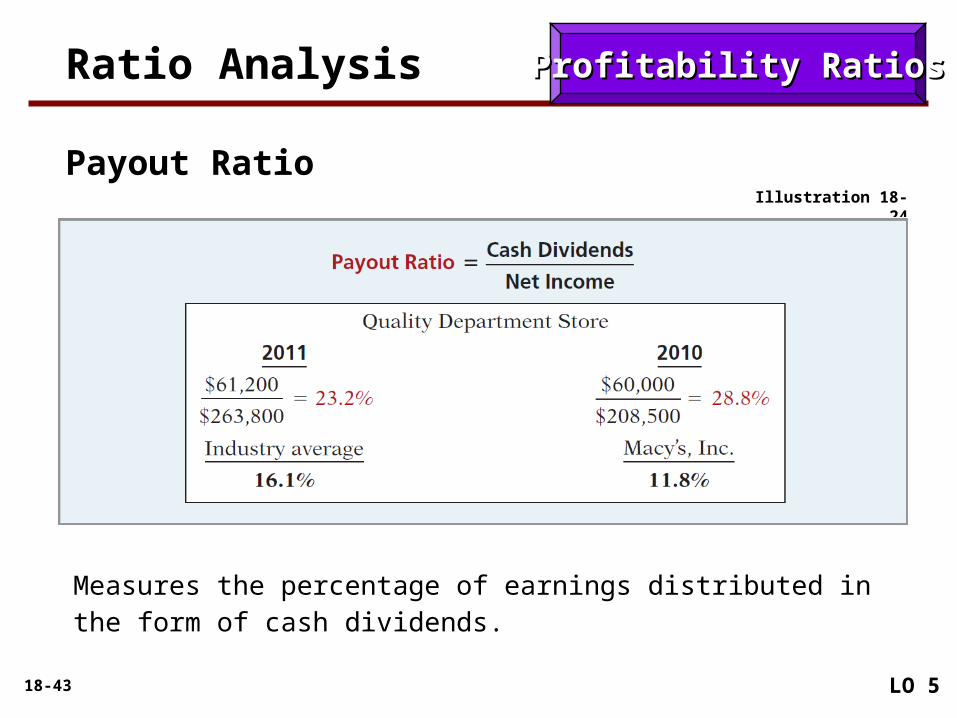
Ratio Analysis
Payout Ratio
Measures the percentage of earnings distributed in the form of cash dividends.
Profitability RatiosProfitability Ratios
LO 5
Illustration 18-24
18-44LO 5 Identify and compute ratios used in analyzing a
firm’s liquidity, profitability, and solvency.
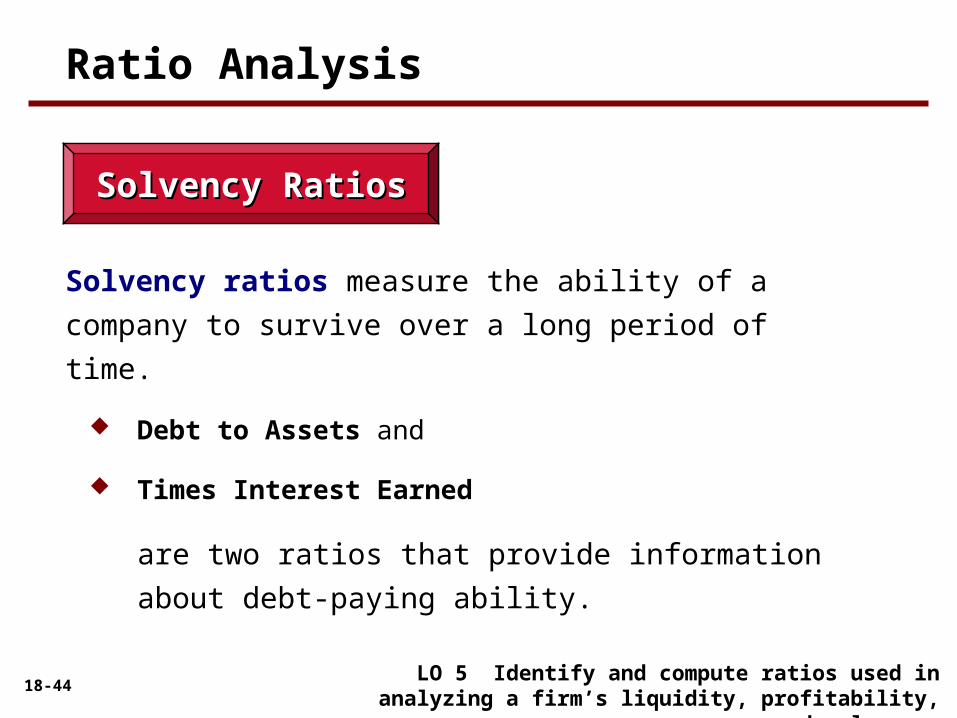
Solvency RatiosSolvency Ratios
Solvency ratios measure the ability of a company to survive
over a long period of time.
Debt to Assets and
Times Interest Earned
are two ratios that provide information about debt-
paying ability.
Ratio Analysis

18-45
QUALITY DEPARTMENT STORE INC.Condensed Balance Sheets
For the Years Ended December 31
Illustration 18-12
QUALITY DEPARTMENT STORE INC.Condensed Income Statements
For the Years Ended December 31
LO 5

18-46
Ratio Analysis
Debt to Total Assets Ratio
Measures the percentage of the total assets that creditors provide.
LO 5
Solvency RatiosSolvency Ratios
Illustration 18-25
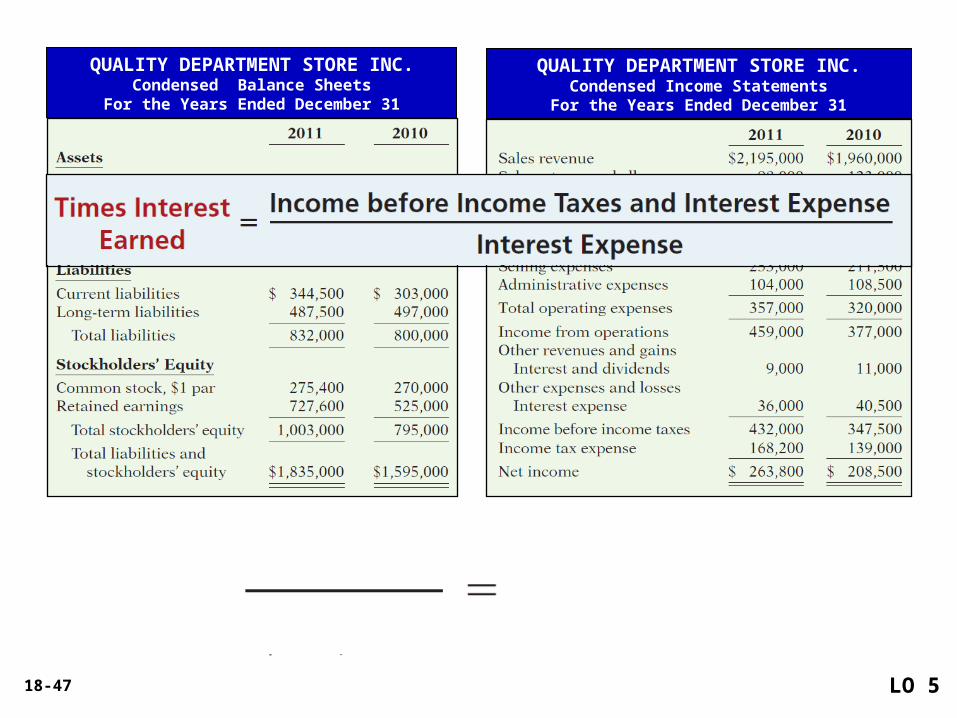
18-47
QUALITY DEPARTMENT STORE INC.Condensed Balance Sheets
For the Years Ended December 31
Illustration 18-12
QUALITY DEPARTMENT STORE INC.Condensed Income Statements
For the Years Ended December 31
LO 5
18-48
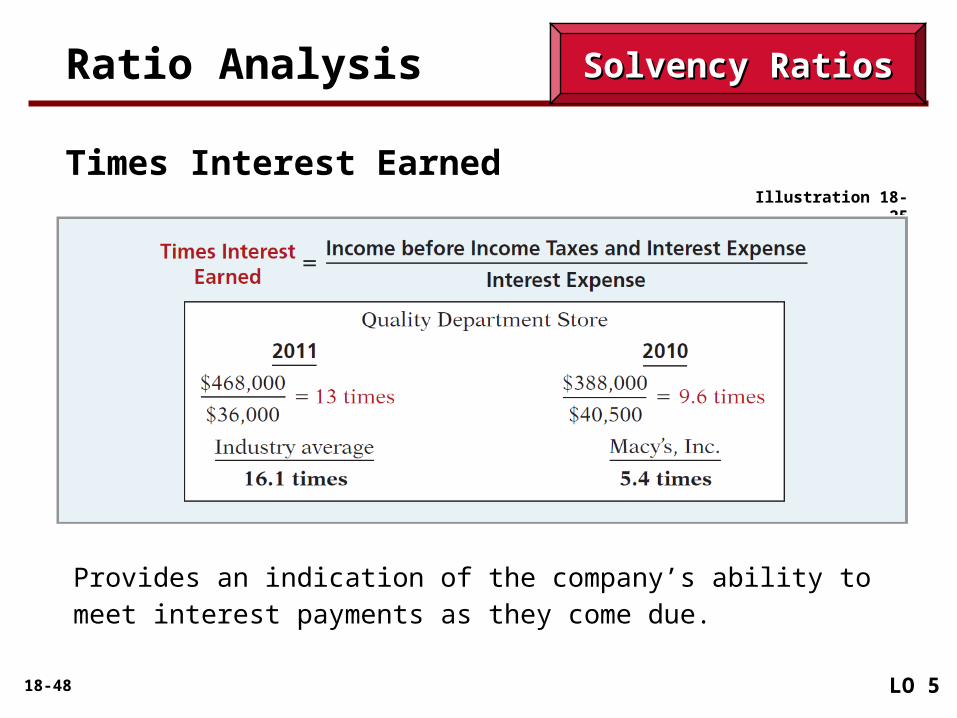
Ratio Analysis
Times Interest Earned
Provides an indication of the company’s ability to meet interest payments as they come due.
LO 5
Solvency RatiosSolvency Ratios
Illustration 18-25
18-49
Illustration 18-27
Ratio Analysis
LO 5
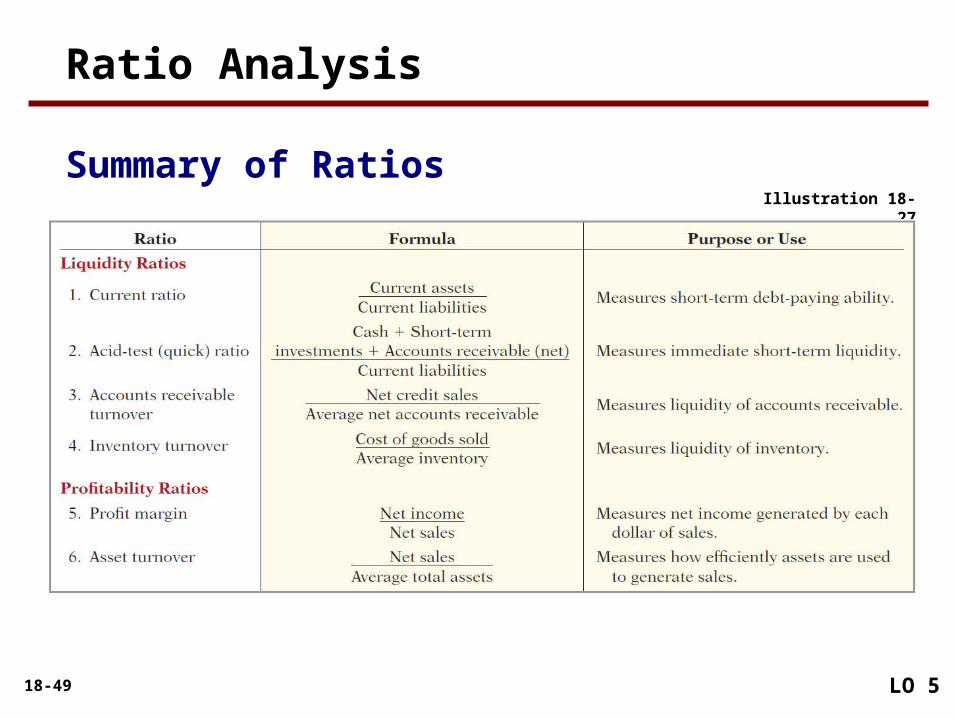
Summary of Ratios
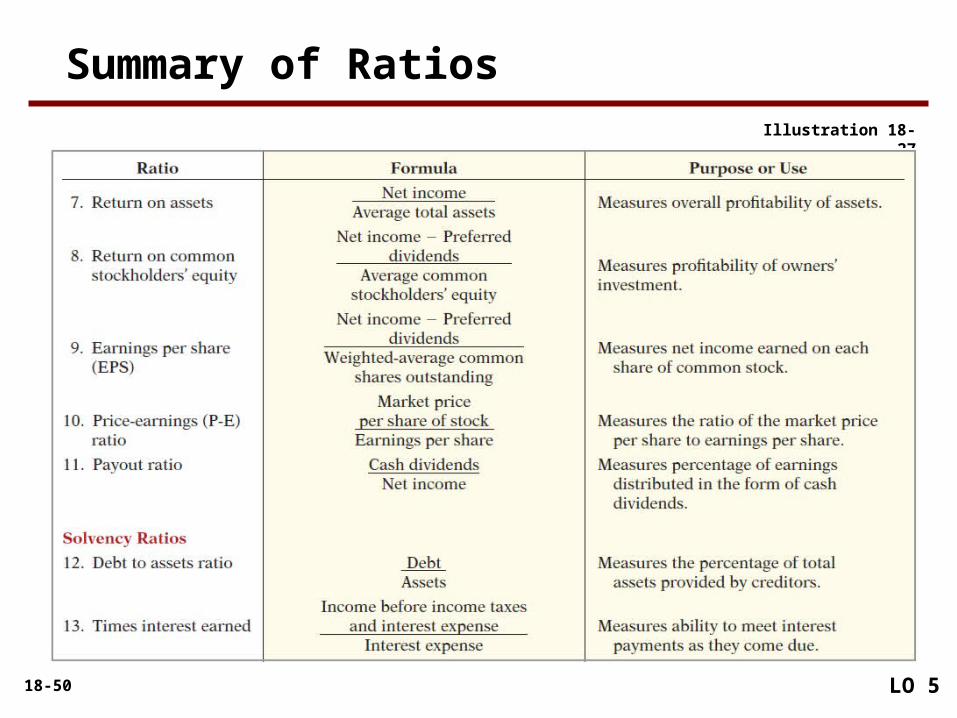
18-50
Illustration 18-27
Summary of Ratios
LO 5
18-51LO 6 Understand the concept of earning power,
and how irregular items are presented.
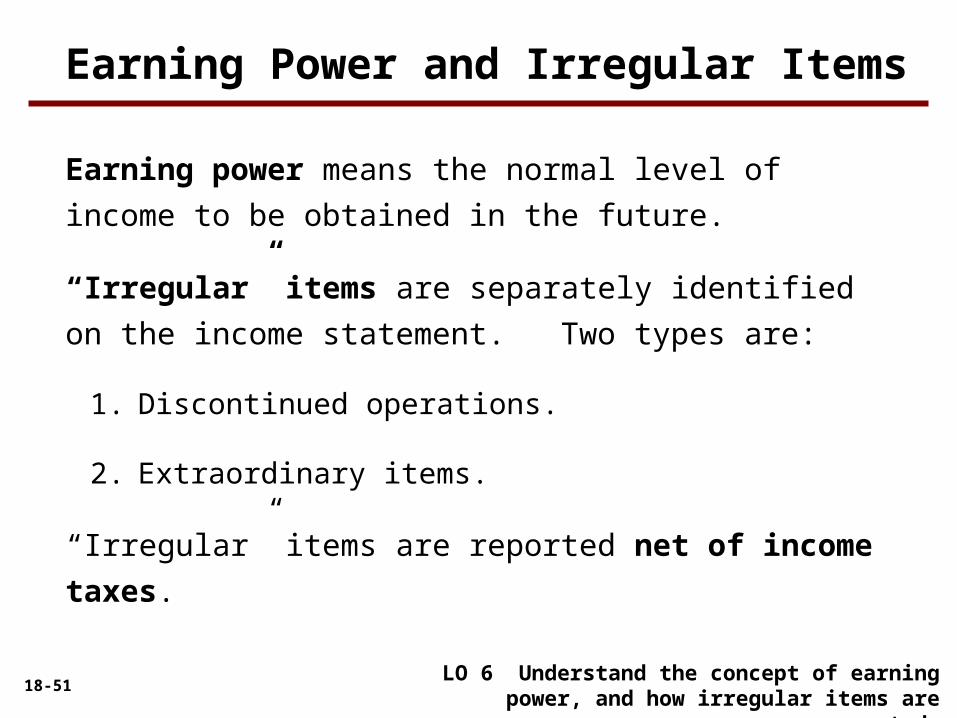
Earning power means the normal level of income to be
obtained in the future.
“Irregular” items are separately identified on the income
statement. Two types are:
1. Discontinued operations.
2. Extraordinary items.
“Irregular” items are reported net of income taxes.
Earning Power and Irregular Items
18-52
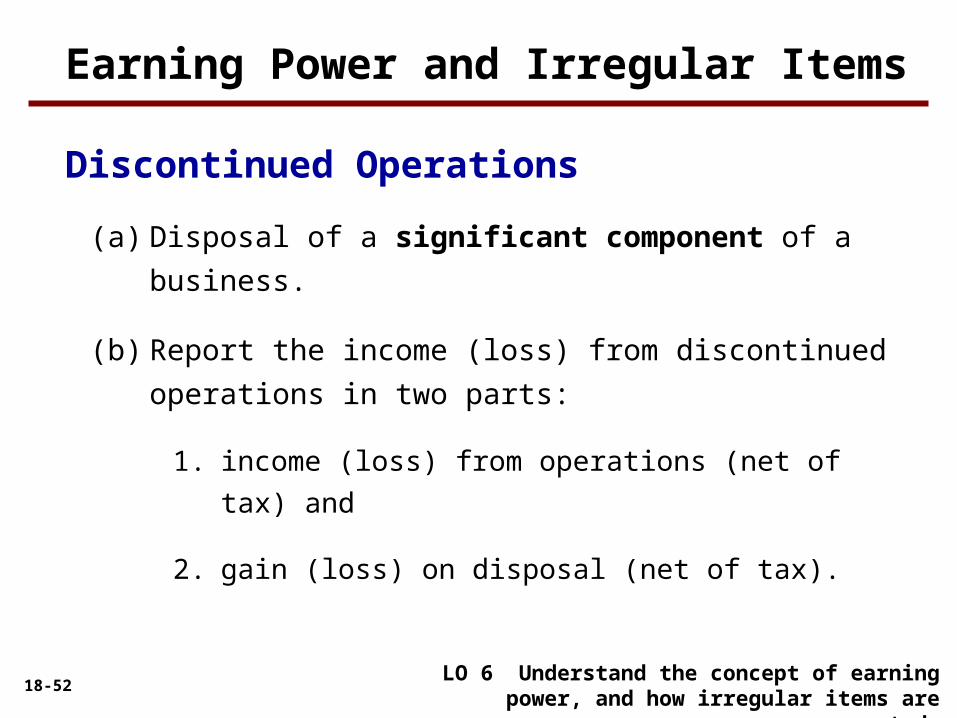
(a) Disposal of a significant component of a business.
(b) Report the income (loss) from discontinued operations in
two parts:
1. income (loss) from operations (net of tax) and
2. gain (loss) on disposal (net of tax).
LO 6 Understand the concept of earning power, and how irregular items are presented.
Earning Power and Irregular Items
Discontinued Operations

18-53
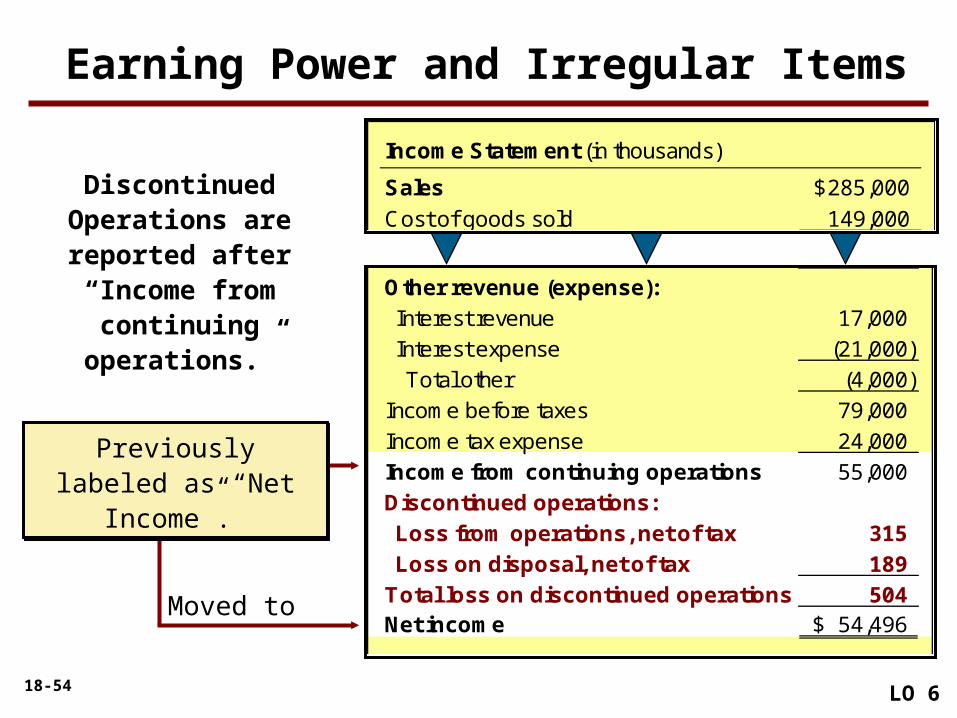
Illustration: During 2014 BD Inc. has income before income
taxes of $79,000,000. During 2014, BD discontinued and sold
its unprofitable chemical division. The loss in 2014 from
chemical operations (net of $135,000 taxes) was $315,000. The
loss on disposal of the chemical division (net of $81,000 taxes)
was $189,000. Assuming a 30% tax rate on income.
LO 6
Earning Power and Irregular Items
18-54
Other revenue (expense):
Interest revenue 17,000
Interest expense (21,000)
Total other (4,000)
Income before taxes 79,000
Income tax expense 24,000
Income from continuing operations 55,000
Discontinued operations:
Loss from operations, net of tax 315
Loss on disposal, net of tax 189
Total loss on discontinued operations 504 Net income 54,496$
Income Statement (in thousands)
Sales 285,000$
Cost of goods sold 149,000 Discontinued
Operations are reported after “Income from
continuing operations.”
Previously labeled as “Net Income”.
Previously labeled as “Net Income”.
Moved to
LO 6
Earning Power and Irregular Items
18-55
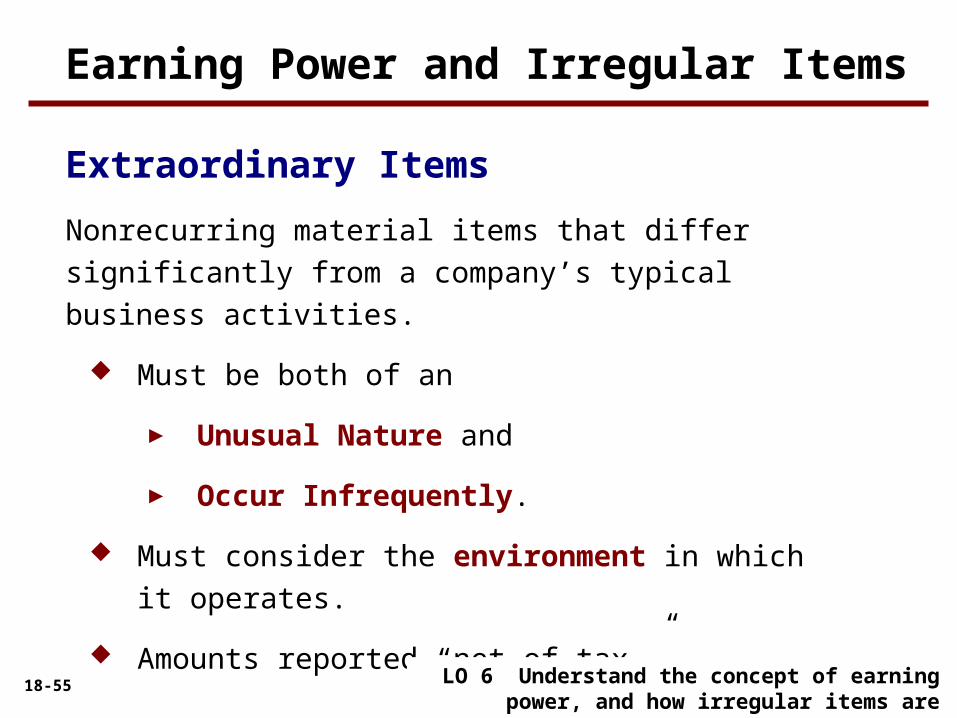
Nonrecurring material items that differ significantly from a
company’s typical business activities.
Must be both of an
► Unusual Nature and
► Occur Infrequently.
Must consider the environment in which it operates.
Amounts reported “net of tax.”
LO 6 Understand the concept of earning power, and how irregular items are presented.
Earning Power and Irregular Items
Extraordinary Items
18-56
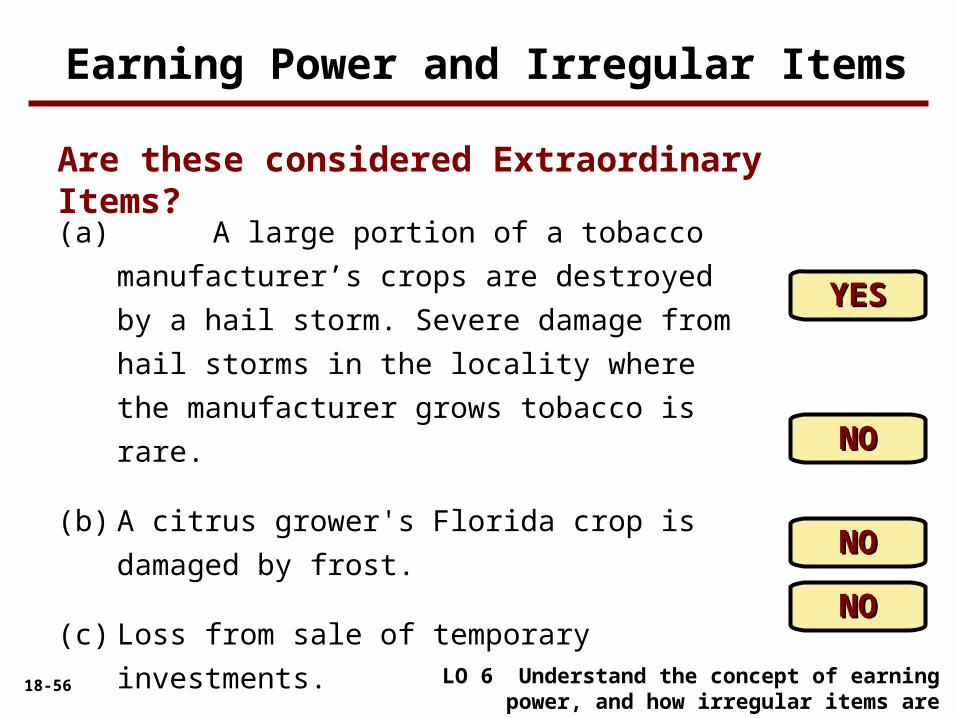
Are these considered Extraordinary Items?
(a) A large portion of a tobacco manufacturer’s crops
are destroyed by a hail storm. Severe damage
from hail storms in the locality where the
manufacturer grows tobacco is rare.
(b) A citrus grower's Florida crop is damaged by
frost.
(c) Loss from sale of temporary investments.
(d) Loss attributable to a labor strike.
YESYES
NONO
NONO
LO 6 Understand the concept of earning power, and how irregular items are presented.
NONO
Earning Power and Irregular Items

18-57
(e) Loss from flood damage. (The nearby Black River
floods every 2 to 3 years.)
(f) An earthquake destroys one of the oil refineries
owned by a large multi-national oil company.
Earthquakes are rare in this geographical location.
(g) Write-down of obsolete inventory.
(h) Expropriation of a factory by a foreign
government.
NONO
YESYES
YESYES
LO 6 Understand the concept of earning power, and how irregular items are presented.
NONO
Are these considered Extraordinary Items?
Earning Power and Irregular Items
18-58
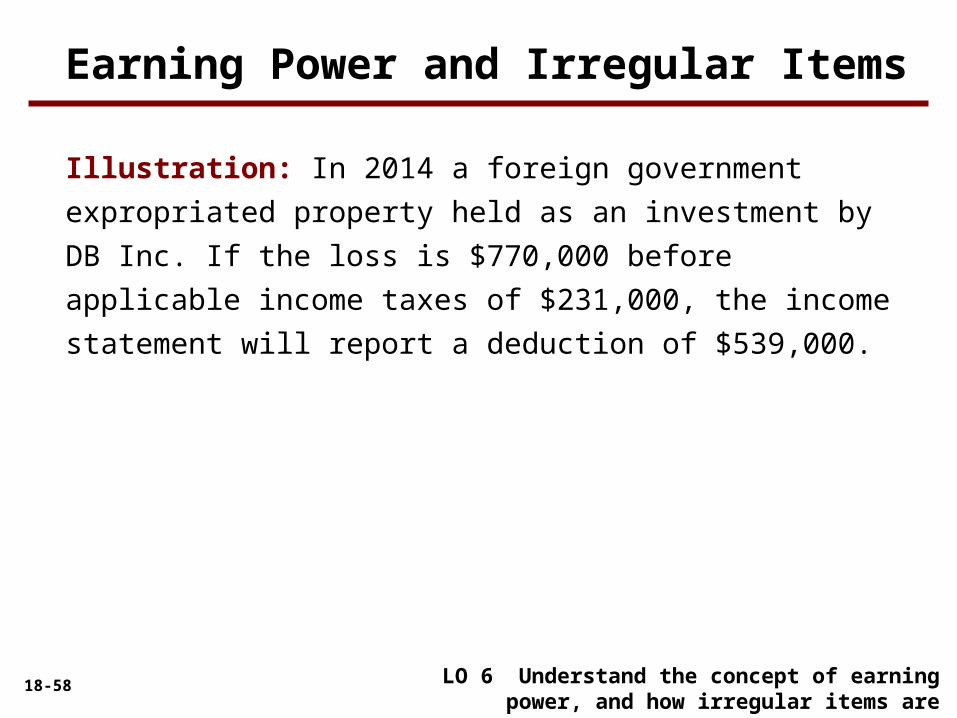
Illustration: In 2014 a foreign government expropriated property
held as an investment by DB Inc. If the loss is $770,000 before
applicable income taxes of $231,000, the income statement will
report a deduction of $539,000.
Earning Power and Irregular Items
LO 6 Understand the concept of earning power, and how irregular items are presented.

18-59
Other revenue (expense):
Interest revenue 17,000
Interest expense (21,000)
Total other (4,000)
Income before taxes 79,000
Income tax expense 24,000
Income from continuing operations 55,000
Extraordinary loss, net of tax 539 Net income 54,461$
Extraordinary Items are reported after “Income
from continuing operations.”
Previously labeled as “Net Income”.
Previously labeled as “Net Income”.
Moved to
LO 6 Understand the concept of earning power, and how irregular items are presented.
Earning Power and Irregular Items
Income Statement (in thousands)
Sales 285,000$
Cost of goods sold 149,000

18-60
Interest expense (21,000)
Total other (4,000)
Income before taxes 79,000
Income tax expense 24,000
Income from continuing operations 55,000
Discontinued operations:
Loss from operations, net of tax 315
Loss on disposal, net of tax 189
Total loss on discontinued operations 504
Income before extraordinary item 54,496
Extraordinary loss, net of tax 539 Net income 53,957$
Reporting when both
Discontinued
Operations and
Extraordinary Items
are present.
Discontinued Operations
Discontinued Operations
Extraordinary ItemExtraordinary Item
LO 6 Understand the concept of earning power, and how irregular items are presented.
Earning Power and Irregular Items
Income Statement (in thousands)
Sales 285,000$
Cost of goods sold 149,000
18-61
18-62
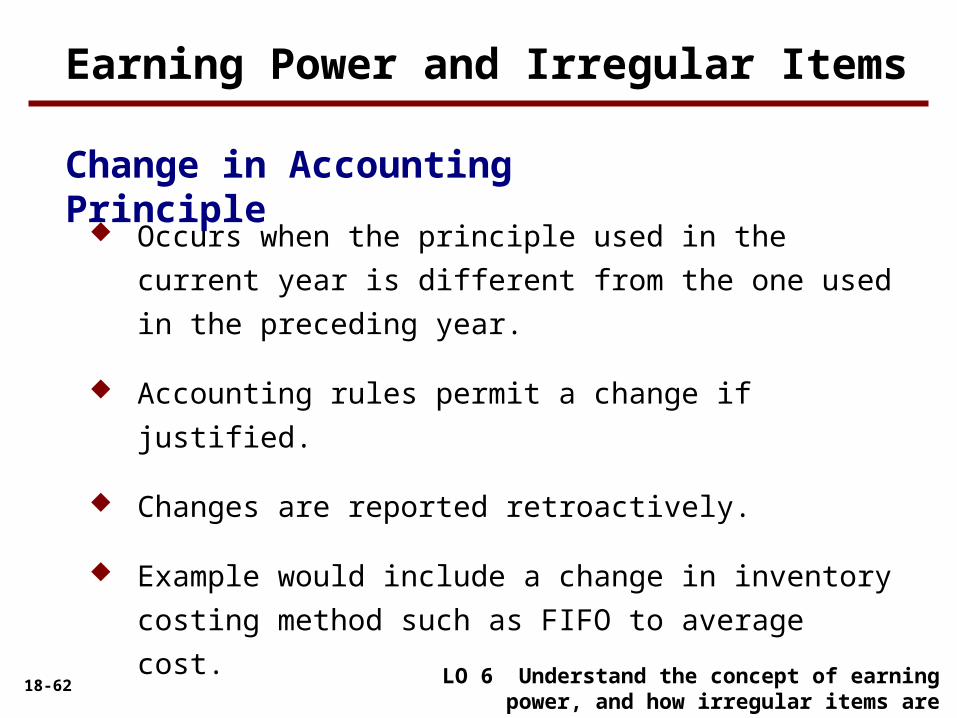
Occurs when the principle used in the current year is
different from the one used in the preceding year.
Accounting rules permit a change if justified.
Changes are reported retroactively.
Example would include a change in inventory costing
method such as FIFO to average cost.
LO 6 Understand the concept of earning power, and how irregular items are presented.
Earning Power and Irregular Items
Change in Accounting Principle
18-63
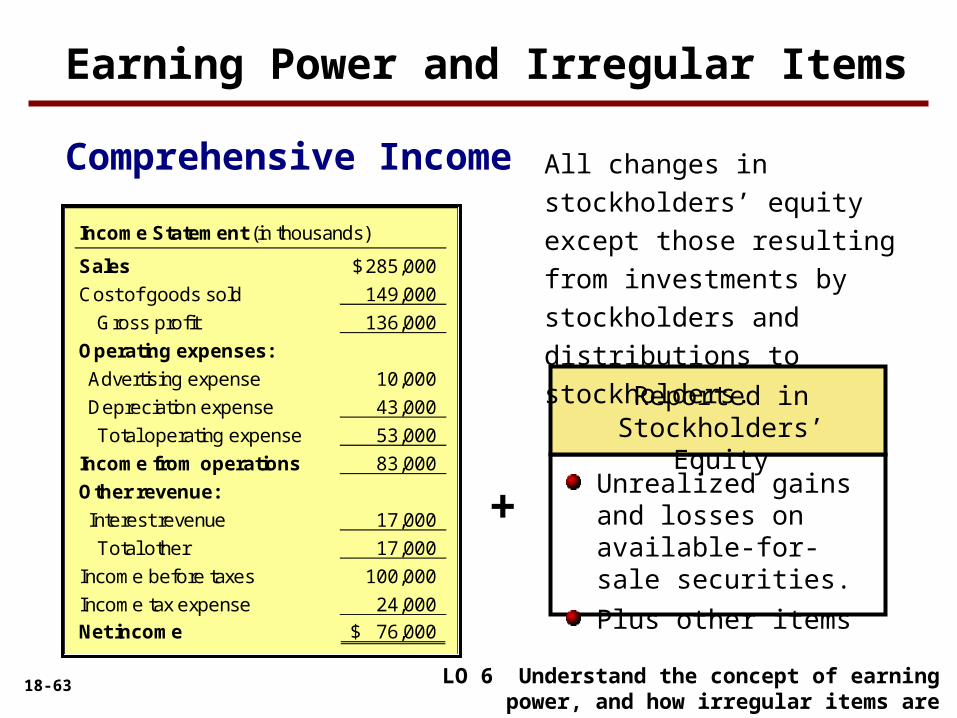
Unrealized gains and losses on available-for-sale securities.
Plus other items
+
Reported in Stockholders’ Equity
Comprehensive Income
LO 6 Understand the concept of earning power, and how irregular items are presented.
All changes in stockholders’
equity except those resulting
from investments by
stockholders and distributions
to stockholders.
Earning Power and Irregular Items
Income Statement (in thousands)
Sales 285,000$
Cost of goods sold 149,000
Gross profit 136,000
Operating expenses:
Advertising expense 10,000
Depreciation expense 43,000
Total operating expense 53,000
Income from operations 83,000
Other revenue:
Interest revenue 17,000
Total other 17,000
Income before taxes 100,000
Income tax expense 24,000
Net income 76,000$
18-64
Why are gains and losses on available-for-sale securities
excluded from net income?
Because disclosing them separately
1) reduces the volatility of net income due to fluctuations in fair
value,
2) yet informs the financial statement user of the gain or loss
that would be incurred if the securities were sold at fair
value.
LO 6 Understand the concept of earning power, and how irregular items are presented.
Earning Power and Irregular Items
Comprehensive Income

18-65
A company that has a high quality of earnings provides full
and transparent information that will not confuse or mislead
users of the financial statements.
The issue of quality of earnings has taken on increasing
importance because recent accounting scandals suggest that
some companies are spending too much time managing their
income and not enough time managing their business.
LO 7 Understand the concept of quality of earnings.
Quality of Earnings

18-66
Variations among companies in the application of GAAP
may hamper comparability and reduce quality of earnings.
LO 7 Understand the concept of quality of earnings.
Pro forma income usually excludes items that the company
thinks are unusual or nonrecurring.
Some companies have abused the flexibility that pro forma
numbers allow.
Quality of Earnings
Alternative Accounting Methods
Pro Forma Income
18-67
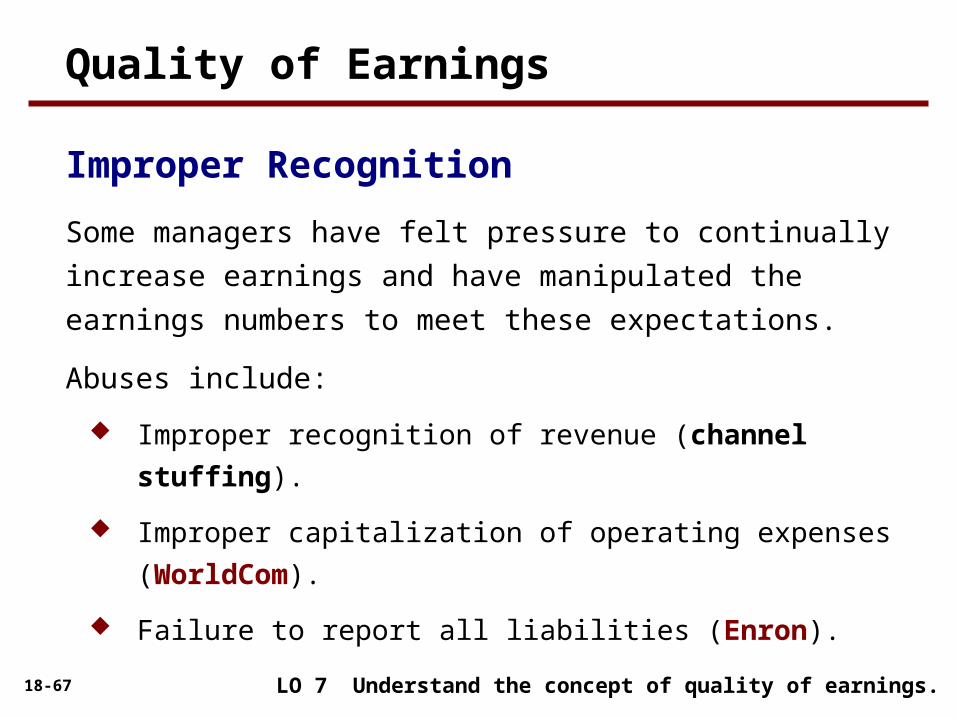
Some managers have felt pressure to continually increase
earnings and have manipulated the earnings numbers to meet
these expectations.
Abuses include:
Improper recognition of revenue (channel stuffing).
Improper capitalization of operating expenses (WorldCom).
Failure to report all liabilities (Enron).
LO 7 Understand the concept of quality of earnings.
Quality of Earnings
Improper Recognition

18-68
The tools of financial statement analysis covered in this chapter are universal and therefore no significant differences exist in the analysis methods used.
The basic objectives of the income statement are the same under both GAAP and IFRS. Thus, both the IASB and the FASB are interested in distinguishing normal levels of income from irregular items in order to better predict a company’s future profitability.
The basic accounting for discontinued operations is the same under IFRS and GAAP.
LO 8 Compare financial statement analysis and income statement presentation under GAAP and IFRS..
A Look at IFRS
Key Points

18-69
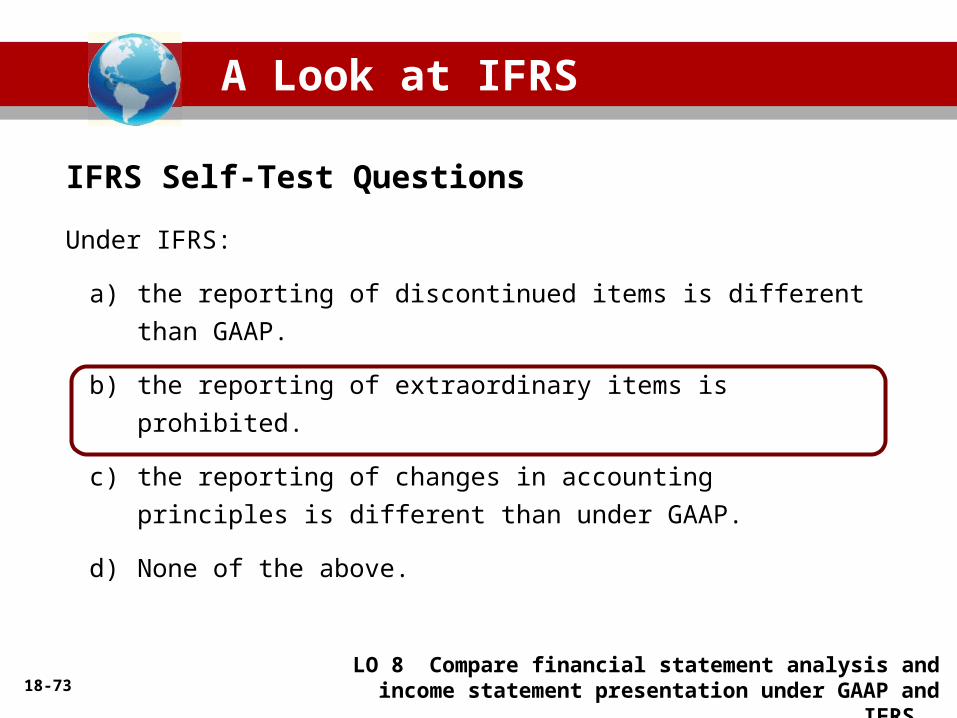
Under IFRS, there is no classification for extraordinary items. In other words, extraordinary item treatment is prohibited under IFRS. All revenue and expense items are considered ordinary in nature.
The accounting for changes in accounting principles and changes in accounting estimates are the same for both GAAP and IFRS.
Both GAAP and IFRS follow the same approach in reporting comprehensive income. The statement of comprehensive income can be prepared under the one-statement approach or the two-statement approach.
LO 8 Compare financial statement analysis and income statement presentation under GAAP and IFRS..
A Look at IFRS
Key Points
18-70
The issues related to quality of earnings are the same under both GAAP and IFRS. It is hoped that by adopting a more principles-based approach, as found in IFRS, many of the earnings’ quality issues will disappear.
LO 8 Compare financial statement analysis and income statement presentation under GAAP and IFRS..
A Look at IFRS
Key Points
18-71
The FASB and the IASB are working on a project that would rework the
structure of financial statements. Recently, the IASB decided to require a
statement of comprehensive income, similar to what was required under
GAAP. In addition, another part of this project addresses the issue of how to
classify various items in the income statement. A main goal of this new
approach is to provide information that better represents how businesses
are run. In addition, the approach draws attention away from one number—
net income.
LO 8 Compare financial statement analysis and income statement presentation under GAAP and IFRS..
A Look at IFRS
Looking to the Future

18-72
The basic tools of financial analysis are the same under both GAAP and
IFRS except that:
a) horizontal analysis cannot be done because the format of the
statements is sometimes different.
b) analysis is different because vertical analysis cannot be done
under IFRS.
c) the current ratio cannot be computed because current liabilities
are often reported before current assets in IFRS statements of
position.
d) None of the above.
LO 8 Compare financial statement analysis and income statement presentation under GAAP and IFRS..
A Look at IFRS
IFRS Self-Test Questions
18-73
Under IFRS:
a) the reporting of discontinued items is different than GAAP.
b) the reporting of extraordinary items is prohibited.
c) the reporting of changes in accounting principles is different than
under GAAP.
d) None of the above.
LO 8 Compare financial statement analysis and income statement presentation under GAAP and IFRS..
A Look at IFRS
IFRS Self-Test Questions

18-74
Presentation of comprehensive income must be reported under IFRS in:
a) the statement of stockholders’ equity.
b) the income statement ending with net income.
c) the notes to the financial statements.
d) a statement of comprehensive income.
LO 8 Compare financial statement analysis and income statement presentation under GAAP and IFRS..
A Look at IFRS
IFRS Self-Test Questions
18-75
“Copyright © 2013 John Wiley & Sons, Inc. All rights reserved.
Reproduction or translation of this work beyond that permitted in
Section 117 of the 1976 United States Copyright Act without the
express written permission of the copyright owner is unlawful.
Request for further information should be addressed to the
Permissions Department, John Wiley & Sons, Inc. The purchaser
may make back-up copies for his/her own use only and not for
distribution or resale. The Publisher assumes no responsibility for
errors, omissions, or damages, caused by the use of these
programs or from the use of the information contained herein.”
Copyright