1.80 1,800 1.60 1,600 best world international (best sp
TRANSCRIPT

August 21, 2017
Consu
mer
Dis
cre
tionary
Sin
gapore
THIS REPORT HAS BEEN PREPARED BY MAYBANK KIM ENG RESEARCH
SEE PAGE 10 FOR IMPORTANT DISCLOSURES AND ANALYST CERTIFICATIONS
Co. Reg No: 198700034E MICA (P) : 099/03/2012
John Cheong, CFA [email protected] (65) 6231 5845
Best World International (BEST SP)
Trust in BEST’s track record
Minimal impact from China’s crackdown Since Bloomberg published an article on 15 Aug 2016 relating to China’s
crackdown on pyramid schemes, BEST’s share price has fallen by c.20%.
We spoke to management and it clarified that the event has no or
minimal impact on its business as it is not a pyramid scheme. We trust
management based on its consistent track record. We have conducted a
scenario analysis for investors who are worried about the China
operations, which indicates that a China sales decline of 10-50% could
reduce our FY18E EPS by 4-21% and our TP by 14-38% (SGD1.17-1.61).
Maintain BUY and TP of SGD1.88, pegged to an unchanged 19x FY18E EPS
(PEG of 0.7x using FY16-19E EPS CAGR of 27%). We ascribed a c.30%
discount to the PEG of 1.0x for regulatory risks. BUY on weakness.
Scenario analysis indicates minimal downside risk To understand the potential downside risks of BEST’s China operations on
the earnings and share price, we performed a scenario analysis. We find
that the worst-case scenario assuming a 50% decline in China sales from
our FY18 forecast will reduce our earnings by 21% and our TP by 38% to
SGD1.17. The steeper decline in TP is from pegging to a lower valuation
multiple of 15x from 19x FY18E EPS to account for a potentially lower
growth profile. Our worst-case scenario TP of SGD1.17 indicates only 3%
downside from BEST’s last closing price of SGD1.20.
Export vs direct selling business model BEST currently operates under the export business model in China and
aims to convert into a direct selling model starting at end-2017. We note
that any delay in conversion will not impact the operations as it is only a
change in accounting policy with limited earnings impact. The benefits of
BEST’s China direct selling licence are mainly: 1) better profile to attract
more customers; and 2) to prevent issues with the local authorities.
BEST’s share price has underperformed peers Since the Bloomberg news article on 15 Aug 2016, the share prices of all
three US-listed direct selling companies featured in the article have
declined notably: Herbalife (-6%), Nu Skin (-8%) and Usana (-4%).
However, BEST’s share price decline of 19% is higher. This could be due to
higher dependency of BEST on China where c.50% of sales are from China
vs Herbalife (19%), Nu Skin (36%) and Usana (4%).
Share Price SGD 1.20
12m Price Target SGD 1.88 (+57%)
Previous Price Target SGD 1.88
BUY
Company Description
Statistics
52w high/low (SGD)
3m avg turnover (USDm)
Free float (%)
Issued shares (m)
Market capitalisation
Major shareholders:
34.9%
5.6%
5.6%
554
5.0
Best World is a direct selling company which sells
premium skincare, health supplement & wellness
products. It has >400k members in 12 countries.
D2 Investment Pte Ltd
Dora Hoan Beng Mui
Doreen Tan Nee Moi
1.60/0.60
48.7
SGD662.5M
USD486M
Price Performance
0
200
400
600
800
1,000
1,200
1,400
1,600
1,800
0.00
0.20
0.40
0.60
0.80
1.00
1.20
1.40
1.60
1.80
Aug-15 Nov-15 Feb-16 May-16 Aug-16 Nov-16 Feb-17 May-17
Best World Int'l - (LHS, SGD) Best World Int'l / Straits Times Index - (RHS, %)
-1M -3M -12M
Absolute (%) (11) (15) 82
Relative to index (%) (10) (16) 59
Source: FactSet
FYE Dec (SGD m) FY15A FY16A FY17E FY18E FY19E
Revenue 102 201 255 303 354
EBITDA 20 53 68 84 96
Core net profit 10 30 44 54 62
Core EPS (cts) 1.8 5.4 8.1 9.9 11.3
Core EPS growth (%) 149.3 195.8 48.3 22.8 14.6
Net DPS (cts) 1.6 4.6 3.0 4.0 4.5
Core P/E (x) 65.1 22.0 14.8 12.1 10.5
P/BV (x) 10.3 7.3 5.2 3.9 3.0
Net dividend yield (%) 1.3 3.8 2.5 3.3 3.8
ROAE (%) 16.8 44.8 40.8 36.7 31.9
ROAA (%) 11.3 23.5 24.4 24.3 22.9
EV/EBITDA (x) 1.3 6.0 8.5 6.6 5.3
Net gearing (%) (incl perps) net cash net cash net cash net cash net cash
Consensus net profit - - 43 52 62
MKE vs. Consensus (%) - - 3.7 3.7 (0.1)

August 21, 2017 2
Best World International
Fig 1: Scenario analysis of TP impact from a decline in China sales Worst-case scenario assuming a 50% decline in China sales could reduce our EPS and TP by 21% and 38%, respectively.
Current assumption Mild impact Moderate impact Major impact
-10% in China
sales -30% in China
sales -50% in China
sales
FY17E FY18E FY18E FY18E FY18E
Total sales (SGD m) 255 303 288 259 229
China's sales (SGD m) 110 148 133 104 74
Earnings (SGD m) 44.3 54.4 52.1 47.5 42.8
Earnings impact
-4% -13% -21%
P/E (x) 14 11 12 13 14
Valuation multiple (x)
19 17 16 15
TP (SGD)
1.88 1.61 1.38 1.17
TP impact
-14% -26% -38% Source: Maybank Kim Eng
Fig 2: Share price performance of major direct sellers since the Bloomberg article on 15 Aug 2017
Source: Bloomberg, Maybank Kim Eng
Fig 3: Peer comparisons* BEST is trading at a lower PEG to the peer group average
Share Mkt P/E 3Y EPS
EV/ EBITDA
EBITDA P/BV ROE Div yield
price cap (x) CAGR PEG (x) margin (x) (%) (%)
Curr (LC) (USD m) FY17E FY18E FY19E (%) (x) FY17E (%) FY17E FY17E FY18E FY17E
BEST SGD 1.20 485 15 12 10 27 0.4 9 27 5.2 41 37 2.5
Herbalife USD 61.95 5,821 13 11 n/a 7 1.5 9 15 n/a n/a n/a -
Tupperware USD 57.05 2,903 12 11 10 8 1.5 8 19 9.7 98 90 4.8
Nu Skin USD 55.48 2,937 17 16 n/a 11 1.5 9 15 4.7 26 27 2.6
Avon Products USD 2.62 1,153 22 9 7 n/a n/a 6 8 (1.6) 2 (71) -
Usana Health USD 56.55 1,382 15 13 n/a 4 3.5 7 15 n/a n/a 33 -
Grape King Bio TWD 181.50 810 17 13 12 16 1.0 8 31 4.0 n/a n/a 4.6
Amway Malaysia MYR 7.08 271 22 20 17 8 2.7 14 6 5.2 28 29 4.2
Average excluding BEST 17 13 12 9 2.0 9 16 4.4 38 22 2.3
*Share prices as of 18 Aug 2017. All stocks mentioned other than BEST are Not Rated. Source: Bloomberg, Maybank Kim Eng
(6)
(8)
(19)
(4)
(35)
(30)
(25)
(20)
(15)
(10)
(5)
-
5
10
13-Aug-17 14-Aug-17 15-Aug-17 16-Aug-17 17-Aug-17 18-Aug-17
(% change) Herbalife Nu Skin BEST USANA

August 21, 2017 3
Best World International
Q&A with management 1. What is the impact from the Chinese government’s crackdown on
pyramid schemes on your China operations?
We do not expect any impact as our business is not a pyramid
scheme. We highlighted in our response to the Bloomberg article the
distinctions between a pyramid scheme and direct selling. Moreover,
we are still operating under an export model and have notified the
local authorities of all of our activities. More importantly, the
crackdown should not impact licensed direct sellers who are running
their business in a proper manner. The campaign aims to crack down
on the illegal investment-related schemes and recruitment websites.
2. Will you consider delaying the conversion of your current export
business model into direct selling model? What are the key
differences between both models?
We will not delay the conversion process. The key difference
between the two models is accounting recognition of revenue and
commissions. However, there will be minimal earnings impact. For
the business operations, there will also be minimal impact. The
reason why we spent so much time and resources to secure the
direct selling licence in China is to raise our profile and to prevent
regulatory issues as we are a direct-selling company outside of
China. Our key success factor in China is our product strength.
3. What are your plans to regain investors’ confidence, after the
major correction in your share price?
For starters, the company, founders and directors have bought back
shares in the open market since the share price correction. Also, we
will be writing to the World Federation of Direct Selling Association
to request it to issue a clarification that China’s crackdown is aimed
at pyramid schemes, and not the licensed direct sellers. More
importantly, we will continue to deliver a consistent set of results,
particularly for our China operations.

August 21, 2017 4
Best World International
BEST’s response to Bloomberg Article (15 Aug 2017, ‘Herbalife, Nu Skin Shares Plunge Over Fears of Chinese Crackdown’)
The Board of Directors (the “Board”) of Best World International Limited (“the Company” and together with
its subsidiaries, the “Group”) refers to the news article published by Bloomberg on 15 August 2017,
“Herbalife, Nu Skin Shares Plunge Over Fears of Chinese Crackdown” and wishes to state the following:
The article reported on market concerns of a crackdown by regulators on the market practices of certain
direct selling companies due to a statement posted on China’s State Administration for Industry & Commerce
(hereinafter “SAIC”) website on 14th August 2017.
The statement by SAIC is widely anticipated in light of the recent news reports on the drowning of a
university student who allegedly fell victim to a certain pyramid selling scheme’s advertisement posted on a
popular recruitment website. The case is still under investigation.
In summary, key points of the SAIC statement include, but are not limited to the following:
1. The clear objective to crackdown on pyramid selling schemes disguised as investment opportunities, job
offers, job referrals and recruitment activities, especially those targeted at new graduates;
2. Investigate major recruitment websites and establish clearer legal responsibilities of businesses,
organizations and individuals that operate such websites;
3. Businesses, organizations and individuals involved in the dissemination of such false information shall be
severely dealt with; and
4. Increase the awareness of pyramid selling schemes amongst students.
For the purpose of clarification, hallmarks of a pyramid scheme are as follows:
1. Companies which profit from act of recruitment and not sale of products or services;
2. Low quality products sold at a high price;
3. Products purchased are not for consumption but as a requirement to participate in the scheme;
4. Products are sold without a reasonable product return guarantee; and
5. High startup/entry fee to participate in the scheme.
In response, the Company would like to highlight that although we hold a direct selling licence, we have not
converted our business in China to direct selling yet. Presently all DRs’ Secret, Avance and Optrimax products
are available for purchase by customers through DRs’ Secret outlets and workshops. As such, the above SAIC
statement has little or no impact to our China business.
The Company also wishes to highlight that all current preparations for conversion to direct selling are in line
with the above SAIC statement. All service outlets set up are subject to verification by local authorities
beforehand and are not within or near to any school compound. Our membership criteria, upon conversion
to direct selling, shall also not accept students, civil servants, police and military personnel etc.
The Company would like to reiterate that it adheres to strong principles of legal business, transparency and
corporate governance and is fully compliant with the rules and regulations of business operations under
China’s laws.
August 21, 2017 5
Best World International
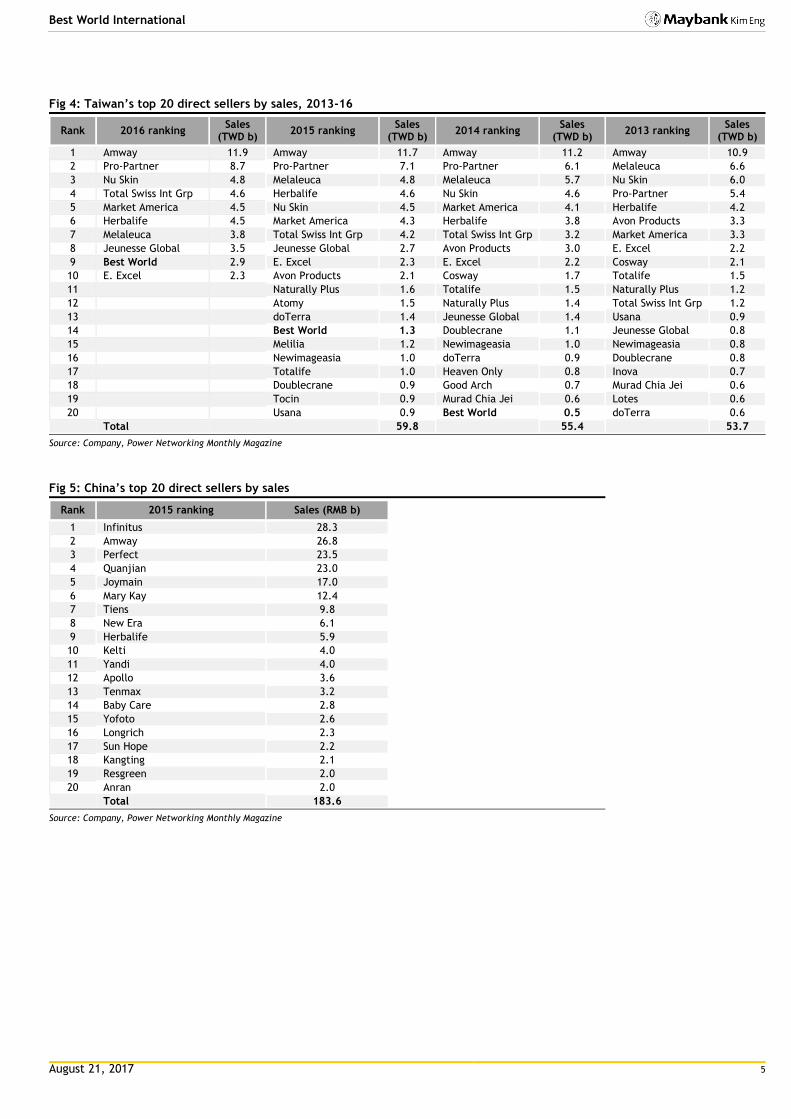
Fig 4: Taiwan’s top 20 direct sellers by sales, 2013-16
Rank 2016 ranking Sales
(TWD b) 2015 ranking
Sales (TWD b)
2014 ranking Sales
(TWD b) 2013 ranking
Sales (TWD b)
1 Amway 11.9 Amway 11.7 Amway 11.2 Amway 10.9
2 Pro-Partner 8.7 Pro-Partner 7.1 Pro-Partner 6.1 Melaleuca 6.6
3 Nu Skin 4.8 Melaleuca 4.8 Melaleuca 5.7 Nu Skin 6.0
4 Total Swiss Int Grp 4.6 Herbalife 4.6 Nu Skin 4.6 Pro-Partner 5.4
5 Market America 4.5 Nu Skin 4.5 Market America 4.1 Herbalife 4.2
6 Herbalife 4.5 Market America 4.3 Herbalife 3.8 Avon Products 3.3
7 Melaleuca 3.8 Total Swiss Int Grp 4.2 Total Swiss Int Grp 3.2 Market America 3.3
8 Jeunesse Global 3.5 Jeunesse Global 2.7 Avon Products 3.0 E. Excel 2.2
9 Best World 2.9 E. Excel 2.3 E. Excel 2.2 Cosway 2.1
10 E. Excel 2.3 Avon Products 2.1 Cosway 1.7 Totalife 1.5
11 Naturally Plus 1.6 Totalife 1.5 Naturally Plus 1.2
12 Atomy 1.5 Naturally Plus 1.4 Total Swiss Int Grp 1.2
13 doTerra 1.4 Jeunesse Global 1.4 Usana 0.9
14 Best World 1.3 Doublecrane 1.1 Jeunesse Global 0.8
15 Melilia 1.2 Newimageasia 1.0 Newimageasia 0.8
16 Newimageasia 1.0 doTerra 0.9 Doublecrane 0.8
17 Totalife 1.0 Heaven Only 0.8 Inova 0.7
18 Doublecrane 0.9 Good Arch 0.7 Murad Chia Jei 0.6
19 Tocin 0.9 Murad Chia Jei 0.6 Lotes 0.6
20 Usana 0.9 Best World 0.5 doTerra 0.6
Total 59.8
55.4
53.7
Source: Company, Power Networking Monthly Magazine
Fig 5: China’s top 20 direct sellers by sales
Rank 2015 ranking Sales (RMB b)
1 Infinitus 28.3
2 Amway 26.8
3 Perfect 23.5
4 Quanjian 23.0
5 Joymain 17.0
6 Mary Kay 12.4
7 Tiens 9.8
8 New Era 6.1
9 Herbalife 5.9
10 Kelti 4.0
11 Yandi 4.0
12 Apollo 3.6
13 Tenmax 3.2
14 Baby Care 2.8
15 Yofoto 2.6
16 Longrich 2.3
17 Sun Hope 2.2
18 Kangting 2.1
19 Resgreen 2.0
20 Anran 2.0
Total 183.6
Source: Company, Power Networking Monthly Magazine

August 21, 2017 6
Best World International
Value Proposition
Multi-channel distributor of healthcare/wellness products,
with a top 15 market position in Taiwan based on revenue.
Revenue split in FY16: Taiwan 61%, China 29%, Singapore
4%, Indo 3%, and others 3%.
Direct-selling model highly scalable with low upfront
expansion costs. Commissions only paid on successful
sales.
Recovering from earnings trough in 2011 caused by
regulatory changes in Indonesia. Regaining strength by
penetrating new markets.
Aims to turn China into its largest market; secured a
direct marketing licence there in Nov 2016.
ROIC at 16% > WACC of 9%. Continued earnings growth via
asset-light-model should lead to ROIC expansion.
Traditional retail sales vs direct selling channel
Source: Adult-Stemcell-Tech
Price Drivers
Historical share price trend
Source: Bloomberg, Maybank Kim Eng
1. Generated earnings in 4Q13, a turnaround from losses of
SGD0.5m in 3Q13.
2. 3Q15 earnings jumped 259% YoY and 92% QoQ.
3. FY15 earnings up 149% YoY.
4. 1Q16 earnings up 2,300% YoY and 61% QoQ.
5. 9 Jun 2016: Share price plunged by c.40% from a high of
SGD1.45 to a low of SGD0.90 after BEST answered a long
query from SGX regarding the share price spike.
6. 1 Jul 2016: Share price spiked after BEST was awarded
China direct selling license.
Financial Metrics
EPS and operating cash flow have the largest impact on
BEST’s share price. Expect strong earnings momentum to
continue.
Revenue and earnings move in tandem with market
penetration, team structure and brand strength.
ROE closely tied to earnings growth due to its asset-light
and high-variable-costs business. ROE improved to 45% in
FY16 on earnings growth of 196%.
Net cash of SGD48m at FY16. Dividend payout ratio of at
least 40%.
Direct correlation between EPS, cash flow & share price
Source: Company, Maybank Kim Eng
Swing Factors
Upside
Robust growth in China after the approval of direct
selling licence.
Successful expansion in Taiwan, Indonesia and
Philippines.
Expansion into new markets, such as the Middle East.
Downside
Regulatory changes detrimental to direct selling in its
markets, similar to Indonesia’s restriction on healthcare
imports in 2009.
Reputational risks caused by fraud or fake-product
scandals for other direct-selling players or BEST’s
members.
Failure to scale up in China would result in up to 10%
downside to the share price valuation.
0
200
400
600
800
1,000
1,200
1,400
1,600
1,800
0.00
0.20
0.40
0.60
0.80
1.00
1.20
1.40
1.60
1.80
Nov-11 Nov-12 Nov-13 Nov-14 Nov-15
Best World Int'l - (LHS, SGD)
Best World Int'l / MSCI AC Asia ex JP - (RHS, %)
7.2 6.5
1.8
5.4
8.1
0.00
0.50
1.00
1.50
2.00
2.50
0
5
10
15
2005 2007 2009 2011 2013 2015 2017E
(SGD) (SGD cts) EPS (cts) (LHS)
Operating cash flow/share (cts)
1
1 2
3
4
5
6
August 21, 2017 7
Best World International
FYE 31 Dec FY15A FY16A FY17E FY18E FY19E
Key Metrics
P/E (reported) (x) 5.2 7.5 14.8 12.1 10.5
Core P/E (x) 65.1 22.0 14.8 12.1 10.5
P/BV (x) 10.3 7.3 5.2 3.9 3.0
P/NTA (x) 11.6 7.8 5.5 4.0 3.1
Net dividend yield (%) 1.3 3.8 2.5 3.3 3.8
FCF yield (%) 2.2 1.3 5.5 6.7 8.4
EV/EBITDA (x) 1.3 6.0 8.5 6.6 5.3
EV/EBIT (x) 1.5 6.3 8.8 6.7 5.4
INCOME STATEMENT (SGD m)
Revenue 101.7 200.8 255.0 303.0 354.2
Gross profit 76.9 147.0 181.1 212.1 244.4
EBITDA 19.5 53.4 68.3 83.5 95.5
Depreciation (1.7) (1.8) (1.7) (1.9) (2.0)
Amortisation (1.0) (1.0) (0.2) (0.2) (0.2)
EBIT 16.7 50.7 66.4 81.5 93.4
Net interest income /(exp) 0.3 0.3 0.5 0.6 0.7
Associates & JV 0.0 0.0 0.0 0.0 0.0
Exceptionals 0.0 0.0 0.0 0.0 0.0
Other pretax income 0.0 0.0 0.0 0.0 0.0
Pretax profit 17.0 50.9 66.9 82.1 94.1
Income tax (7.7) (16.5) (22.7) (27.9) (32.0)
Minorities 0.8 0.2 0.2 0.2 0.3
Perpetual securities 0.0 0.0 0.0 0.0 0.0
Discontinued operations 0.0 0.0 0.0 0.0 0.0
Reported net profit 10.1 34.6 44.3 54.4 62.4
Core net profit 10.1 29.9 44.3 54.4 62.4
Preferred Dividends 0.0 0.0 0.0 0.0 0.0
BALANCE SHEET (SGD m)
Cash & Short Term Investments 47.2 54.9 82.2 115.4 157.9
Accounts receivable 10.6 23.4 29.3 34.9 40.8
Inventory 11.5 43.0 45.9 48.5 53.1
Reinsurance assets 0.0 0.0 0.0 0.0 0.0
Property, Plant & Equip (net) 6.8 16.8 23.3 24.5 25.4
Intangible assets 7.0 6.2 6.2 6.2 6.2
Investment in Associates & JVs 0.0 0.0 0.0 0.0 0.0
Other assets 11.2 15.9 15.9 15.9 15.9
Total assets 94.4 160.2 202.9 245.4 299.3
ST interest bearing debt 0.0 2.6 2.6 2.6 2.6
Accounts payable 24.5 43.9 50.7 49.8 54.1
Insurance contract liabilities 0.0 0.0 0.0 0.0 0.0
LT interest bearing debt 0.0 4.7 4.7 4.7 4.7
Other liabilities 8.0 20.0 20.0 20.0 20.0
Total Liabilities 32.4 71.5 78.3 77.4 81.8
Shareholders Equity 63.7 90.6 126.7 170.3 220.2
Minority Interest (1.7) (1.9) (2.1) (2.4) (2.6)
Total shareholder equity 62.0 88.7 124.6 167.9 217.5
Perpetual securities 0.0 0.0 0.0 0.0 0.0
Total liabilities and equity 94.4 160.2 202.9 245.4 299.3
CASH FLOW (SGD m)
Pretax profit 17.0 50.9 66.9 82.1 94.1
Depreciation & amortisation 2.8 2.7 1.9 2.0 2.2
Adj net interest (income)/exp (0.3) (0.3) (0.4) (0.6) (0.8)
Change in working capital 0.3 (29.7) (2.1) (8.9) (6.2)
Cash taxes paid (1.4) (4.2) (22.7) (27.9) (32.0)
Other operating cash flow (1.3) 0.6 0.0 0.0 0.0
Cash flow from operations 17.1 20.1 43.5 46.7 57.3
Capex (2.9) (11.8) (8.0) (3.0) (3.0)
Free cash flow 14.6 8.7 35.9 44.3 55.1
Dividends paid (2.2) (7.7) (8.2) (10.9) (12.5)
Equity raised / (purchased) 0.0 (0.0) 0.0 0.0 0.0
Perpetual securities 0.0 0.0 0.0 0.0 0.0
Change in Debt (5.8) (3.2) 0.0 0.0 0.0
Perpetual securities distribution 0.0 0.0 0.0 0.0 0.0
Other invest/financing cash flow (7.5) (0.7) (7.6) (2.4) (2.2)
Effect of exch rate changes 0.0 0.0 0.0 0.0 0.0
Net cash flow 1.6 8.4 27.7 33.4 42.6
August 21, 2017 8
Best World International
FYE 31 Dec FY15A FY16A FY17E FY18E FY19E
Key Ratios
Growth ratios (%)
Revenue growth 35.1 97.5 27.0 18.8 16.9
EBITDA growth 139.7 173.8 27.9 22.4 14.4
EBIT growth 200.7 202.7 31.0 22.8 14.6
Pretax growth 200.6 199.7 31.3 22.8 14.6
Reported net profit growth 149.2 242.1 28.3 22.8 14.6
Core net profit growth 149.2 195.9 48.3 22.8 14.6
Profitability ratios (%)
EBITDA margin 19.2 26.6 26.8 27.6 27.0
EBIT margin 16.5 25.2 26.0 26.9 26.4
Pretax profit margin 16.7 25.4 26.2 27.1 26.6
Payout ratio 87.2 73.2 37.0 40.0 40.0
DuPont analysis
Net profit margin (%) 9.9 17.2 17.4 18.0 17.6
Revenue/Assets (x) 1.1 1.3 1.3 1.2 1.2
Assets/Equity (x) 1.5 1.8 1.6 1.4 1.4
ROAE (%) 16.8 44.8 40.8 36.7 31.9
ROAA (%) 11.3 23.5 24.4 24.3 22.9
Liquidity & Efficiency
Cash conversion cycle (140.6) (16.1) 23.4 26.1 34.6
Days receivable outstanding 35.3 30.5 37.3 38.1 38.4
Days inventory outstanding 139.8 182.2 216.3 186.9 166.6
Days payables outstanding 315.7 228.8 230.1 198.9 170.4
Dividend cover (x) 1.1 1.4 2.7 2.5 2.5
Current ratio (x) 2.5 2.1 2.4 3.0 3.6
Leverage & Expense Analysis
Asset/Liability (x) 2.9 2.2 2.6 3.2 3.7
Net gearing (%) (incl perps) net cash net cash net cash net cash net cash
Net gearing (%) (excl. perps) net cash net cash net cash net cash net cash
Net interest cover (x) na na na na na
Debt/EBITDA (x) 0.0 0.1 0.1 0.1 0.1
Capex/revenue (%) 2.8 5.9 3.1 1.0 0.8
Net debt/ (net cash) (47.2) (47.6) (74.8) (108.1) (150.5)
Source: Company; Maybank
August 21, 2017 9
Best World International
Research Offices
REGIONAL
Sadiq CURRIMBHOY
Regional Head, Research & Economics
(65) 6231 5836 [email protected]
WONG Chew Hann, CA
Regional Head of Institutional Research
(603) 2297 8686 [email protected]
ONG Seng Yeow
Regional Head of Retail Research
(65) 6231 5839 [email protected]
TAN Sin Mui
Director of Research
(65) 6231 5849 [email protected]
ECONOMICS
Suhaimi ILIAS Chief Economist Malaysia | Philippines (603) 2297 8682 [email protected]
CHUA Hak Bin Regional Thematic Macroeconomist
(65) 6231 5830 [email protected]
LEE Ju Ye Singapore (65) 6231 5844 [email protected]
Saktiandi SUPAAT Head, FX Research (65) 6320 1379 [email protected]
STRATEGY
Sadiq CURRIMBHOY
Global Strategist
(65) 6231 5836 [email protected]
Willie CHAN
Hong Kong / Regional
(852) 2268 0631 [email protected]
MALAYSIA
WONG Chew Hann, CA Head of Research (603) 2297 8686 [email protected] • Strategy
Desmond CH’NG, ACA (603) 2297 8680 [email protected] • Banking & Finance
LIAW Thong Jung (603) 2297 8688 [email protected] • Oil & Gas Services- Regional
ONG Chee Ting, CA (603) 2297 8678 [email protected] • Plantations - Regional
Mohshin AZIZ (603) 2297 8692 [email protected] • Aviation - Regional • Petrochem
YIN Shao Yang, CPA (603) 2297 8916 [email protected] • Gaming – Regional • Media
TAN Chi Wei, CFA (603) 2297 8690 [email protected] • Power • Telcos
WONG Wei Sum, CFA (603) 2297 8679 [email protected] • Property
LEE Yen Ling (603) 2297 8691 [email protected] • Building Materials • Glove • Ports • Shipping
Ivan YAP (603) 2297 8612 [email protected] • Automotive • Semiconductor • Technology
Kevin WONG (603) 2082 6824 [email protected] • REITs • Consumer Discretionary
LIEW Wei Han
(603) 2297 8676 [email protected] • Consumer Staples
Adrian WONG
(603) 2297 8675 [email protected] • Constructions • Healthcare
Jade TAM
(603) 2297 8687 [email protected] • Media • Building Materials
TEE Sze Chiah Head of Retail Research (603) 2082 6858 [email protected]
Nik Ihsan Raja Abdullah, MSTA, CFTe (603) 2297 8694 [email protected]
HONG KONG / CHINA
Benjamin HO (852) 2268 0632 [email protected] • Consumer & Auto
Christopher WONG (852)2268 0652 [email protected] • HK & China Properties
Jacqueline KO, CFA (852) 2268 0633 [email protected] • Consumer Staples & Durables
Ka Leong LO, CFA (852) 2268 0630 [email protected] • Consumer Discretionary & Auto
Mitchell KIM (852) 2268 0634 [email protected] • Internet & Telcos
Ning MA, CFA (852) 2268 0672 [email protected] • Insurance
Ricky NG, CFA (852) 2268 0689 [email protected] • Regional Renewables • HK & China Properties
Sonija LI, CFA, FRM (852) 2268 0641 [email protected] • Gaming
Stefan CHANG, CFA (852) 2268 0675 [email protected] • Technology – Regional
Tony Ren, MBA, CFA (852) 2268 0640 [email protected] • Healthcare & Pharmaceutical
INDIA
Jigar SHAH Head of Research
(91) 22 6623 2632 [email protected]
• Strategy • Oil & Gas • Automobile • Cement
Vishal MODI
(91) 22 6623 2607 [email protected]
• Banking & Financials
Neerav DALAL
(91) 22 6623 2606 [email protected]
• Software Technology • Telcos
Vishal PERIWAL
(91) 22 6623 2605 [email protected]
• Infrastructure
SINGAPORE
Neel SINHA Head of Research (65) 6231 5838 [email protected] • Strategy • SMID Caps – Regional
CHUA Su Tye (65) 6231 5842 [email protected] • REITs
Derrick HENG, CFA (65) 6231 5843 [email protected] • Transport • Property • REITs (Office)
John CHEONG, CFA (65) 6231 5845 [email protected] • Small & Mid Caps • Healthcare
NG Li Hiang (65) 6231 5840 [email protected] • Banks
INDONESIA
Isnaputra ISKANDAR Head of Research (62) 21 8066 8680 [email protected] • Strategy • Metals & Mining • Cement
Rahmi MARINA (62) 21 8066 8689 [email protected] • Banking & Finance
Aurellia SETIABUDI (62) 21 8066 8691 [email protected] • Property
Janni ASMAN (62) 21 8066 8687 [email protected] • Cigarette • Healthcare • Retail
Adhi TASMIN (62) 21 8066 8694 [email protected] • Plantations
PHILIPPINES
Minda OLONAN Head of Research (63) 2 849 8840 [email protected] • Strategy
Lovell SARREAL (63) 2 849 8841 [email protected] • Consumer • Media • Cement
Rommel RODRIGO (63) 2 849 8839 [email protected] • Conglomerates • Property • Gaming • Ports/ Logistics
Katherine TAN (63) 2 849 8843 [email protected] • Banks • Construction
THAILAND
Maria LAPIZ Head of Institutional Research Dir (66) 2257 0250 | (66) 2658 6300 ext 1399 [email protected] • Strategy • Consumer • Materials • Ind. Estates • Oil & Gas • Telcos
Sittichai DUANGRATTANACHAYA (66) 2658 6300 ext 1393 [email protected] • Services Sector • Transport • Property • Telcos
Tanawat RUENBANTERNG (66) 2658 6300 ext 1394 [email protected] • Banks & Diversified Financials
Sukit UDOMSIRIKUL Head of Retail Research (66) 2658 6300 ext 5090 [email protected]
Surachai PRAMUALCHAROENKIT (66) 2658 6300 ext 1470 [email protected] • Auto • Conmat • Contractor • Steel
Suttatip PEERASUB (66) 2658 6300 ext 1430 [email protected] • Media • Commerce
Sutthichai KUMWORACHAI (66) 2658 6300 ext 1400 [email protected] • Energy • Petrochem
Termporn TANTIVIVAT (66) 2658 6300 ext 1520 [email protected] • Property
Jaroonpan WATTANAWONG (66) 2658 6300 ext 1404 [email protected] • Transportation • Small cap
VIETNAM
LE Hong Lien, ACCA Head of Institutional Research (84) 8 44 555 888 x 8181 [email protected] • Strategy • Consumer • Diversified
THAI Quang Trung, CFA, Deputy Head, Institutional Research (84) 8 44 555 888 x 8180 [email protected] • Real Estate • Construction • Materials
LE Nguyen Nhat Chuyen (84) 8 44 555 888 x 8082 [email protected] • Oil & Gas
NGUYEN Thach Lam (84) 8 44 555 888 x 8085 [email protected] • Utilities
NGUYEN Thi Ngan Tuyen, Head of Retail Research (84) 8 44 555 888 x 8081 [email protected] • Food & Beverage • Oil&Gas • Banking
TRUONG Quang Binh, Deputy Head, Retail Research (84) 4 44 555 888 x 8087 [email protected] • Rubber Plantation • Tyres and Tubes • Oil&Gas
TRINH Thi Ngoc Diep (84) 4 44 555 888 x 8208 [email protected] • Technology • Utilities • Construction
NGUYEN Thi Sony Tra Mi (84) 8 44 555 888 x 8084 [email protected] • Port Operation • Pharmaceutical • Food & Beverage
NGUYEN Thanh Lam (84) 4 44 555 888 x 8086 [email protected] • Technical Analysis

August 21, 2017 10
Best World International
APPENDIX I: TERMS FOR PROVISION OF REPORT, DISCLAIMERS AND DISCLOSURES
DISCLAIMERS This research report is prepared for general circulation and for information purposes only and under no circumstances should it be considered or intended as an offer to sell or a solicitation of an offer to buy the securities referred to herein. Investors should note that values of such securities, if any, may fluctuate and that each security’s price or value may rise or fall. Opinions or recommendations contained herein are in form of technical ratings and fundamental ratings. Technical ratings may differ from fundamental ratings as technical valuations apply different methodologies and are purely based on price and volume-related information extracted from the relevant jurisdiction’s stock exchange in the equity analysis. Accordingly, investors’ returns may be less than the original sum invested. Past performance is not necessarily a guide to future performance. This report is not intended to provide personal investment advice and does not take into account the specific investment objectives, the financial situation and the particular needs of persons who may receive or read this report. Investors should therefore seek financial, legal and other advice regarding the appropriateness of investing in any securities or the investment strategies discussed or recommended in this report.
The information contained herein has been obtained from sources believed to be reliable but such sources have not been independently verified by Maybank Investment Bank Berhad, its subsidiary and affiliates (collectively, “MKE”) and consequently no representation is made as to the accuracy or completeness of this report by MKE and it should not be relied upon as such. Accordingly, MKE and its officers, directors, associates, connected parties and/or employees (collectively, “Representatives”) shall not be liable for any direct, indirect or consequential losses or damages that may arise from the use or reliance of this report. Any information, opinions or recommendations contained herein are subject to change at any time, without prior notice.
This report may contain forward looking statements which are often but not always identified by the use of words such as “anticipate”, “believe”, “estimate”, “intend”, “plan”, “expect”, “forecast”, “predict” and “project” and statements that an event or result “may”, “will”, “can”, “should”, “could” or “might” occur or be achieved and other similar expressions. Such forward looking statements are based on assumptions made and information currently available to us and are subject to certain risks and uncertainties that could cause the actual results to differ materially from those expressed in any forward looking statements. Readers are cautioned not to place undue relevance on these forward-looking statements. MKE expressly disclaims any obligation to update or revise any such forward looking statements to reflect new information, events or circumstances after the date of this publication or to reflect the occurrence of unanticipated events.
MKE and its officers, directors and employees, including persons involved in the preparation or issuance of this report, may, to the extent permitted by law, from time to time participate or invest in financing transactions with the issuer(s) of the securities mentioned in this report, perform services for or solicit business from such issuers, and/or have a position or holding, or other material interest, or effect transactions, in such securities or options thereon, or other investments related thereto. In addition, it may make markets in the securities mentioned in the material presented in this report. One or more directors, officers and/or employees of MKE may be a director of the issuers of the securities mentioned in this report to the extent permitted by law.
This report is prepared for the use of MKE’s clients and may not be reproduced, altered in any way, transmitted to, copied or distributed to any other party in whole or in part in any form or manner without the prior express written consent of MKE and MKE and its Representatives accepts no liability whatsoever for the actions of third parties in this respect.
This report is not directed to or intended for distribution to or use by any person or entity who is a citizen or resident of or located in any locality, state, country or other jurisdiction where such distribution, publication, availability or use would be contrary to law or regulation. This report is for distribution only under such circumstances as may be permitted by applicable law. The securities described herein may not be eligible for sale in all jurisdictions or to certain categories of investors. Without prejudice to the foregoing, the reader is to note that additional disclaimers, warnings or qualifications may apply based on geographical location of the person or entity receiving this report.
Malaysia Opinions or recommendations contained herein are in the form of technical ratings and fundamental ratings. Technical ratings may differ from fundamental ratings as technical valuations apply different methodologies and are purely based on price and volume-related information extracted from Bursa Malaysia Securities Berhad in the equity analysis.
Singapore This report has been produced as of the date hereof and the information herein may be subject to change. Maybank Kim Eng Research Pte. Ltd. (“Maybank KERPL”) in Singapore has no obligation to update such information for any recipient. For distribution in Singapore, recipients of this report are to contact Maybank KERPL in Singapore in respect of any matters arising from, or in connection with, this report. If the recipient of this report is not an accredited investor, expert investor or institutional investor (as defined under Section 4A of the Singapore Securities and Futures Act), Maybank KERPL shall be legally liable for the contents of this report, with such liability being limited to the extent (if any) as permitted by law.
Thailand Except as specifically permitted, no part of this presentation may be reproduced or distributed in any manner without the prior written permission of Maybank Kim Eng Securities (Thailand) Public Company Limited. Maybank Kim Eng Securities (Thailand) Public Company Limited (“MBKET”) accepts no liability whatsoever for the actions of third parties in this respect.
Due to different characteristics, objectives and strategies of institutional and retail investors, the research reports of MBKET Institutional and Retail Research Department may differ in either recommendation or target price, or both. MBKET Retail Research is intended for retail investors (http://kelive.maybank-ke.co.th) while Maybank Kim Eng Institutional Research is intended only for institutional investors based outside Thailand only.
The disclosure of the survey result of the Thai Institute of Directors Association (“IOD”) regarding corporate governance is made pursuant to the policy of the Office of the Securities and Exchange Commission. The survey of the IOD is based on the information of a company listed on the Stock Exchange of Thailand and the market for Alternative Investment disclosed to the public and able to be accessed by a general public investor. The result, therefore, is from the perspective of a third party. It is not an evaluation of operation and is not based on inside information. The survey result is as of the date appearing in the Corporate Governance Report of Thai Listed Companies. As a result, the survey may be changed after that date. MBKET does not confirm nor certify the accuracy of such survey result.
The disclosure of the Anti-Corruption Progress Indicators of a listed company on the Stock Exchange of Thailand, which is assessed by Thaipat Institute, is made in order to comply with the policy and sustainable development plan for the listed companies of the Office of the Securities and Exchange Commission. Thaipat Institute made this assessment based on the information received from the listed company, as stipulated in the form for the assessment of Anti-corruption which refers to the Annual Registration Statement (Form 56-1), Annual Report (Form 56-2), or other relevant documents or reports of such listed company. The assessment result is therefore made from the perspective of Thaipat Institute that is a third party. It is not an assessment of operation and is not based on any inside information. Since this assessment is only the assessment result as of the date appearing in the assessment result, it may be changed after that date or when there is any change to the relevant information. Nevertheless, MBKET does not confirm, verify, or certify the accuracy and completeness of the assessment result.
US This third-party research report is distributed in the United States (“US”) to Major US Institutional Investors (as defined in Rule 15a-6 under the Securities Exchange Act of 1934, as amended) only by Maybank Kim Eng Securities USA Inc (“Maybank KESUSA”), a broker-dealer registered in the US (registered under Section 15 of the Securities Exchange Act of 1934, as amended). All responsibility for the distribution of this report by Maybank KESUSA in the US shall be borne by Maybank KESUSA. This report is not directed at you if MKE is prohibited or restricted by any legislation or regulation in any jurisdiction from making it available to you. You should satisfy yourself before reading it that Maybank KESUSA is permitted to provide research material concerning investments to you under relevant legislation and regulations. All U.S. persons receiving and/or accessing this report and wishing to effect transactions in any security mentioned within must do so with: Maybank Kim Eng Securities USA Inc. 777 Third Avenue 21st Floor New York, New York 1- (212) 688-8886 and not with, the issuer of this report.
August 21, 2017 11
Best World International
Disclosure of Interest
Malaysia: MKE and its Representatives may from time to time have positions or be materially interested in the securities referred to herein and may further act as market maker or may have assumed an underwriting commitment or deal with such securities and may also perform or seek to perform investment banking services, advisory and other services for or relating to those companies.
Singapore: As of 21 August 2017, Maybank KERPL and the covering analyst do not have any interest in any companies recommended in this research report.
Thailand: MBKET may have a business relationship with or may possibly be an issuer of derivative warrants on the securities /companies mentioned in the research report. Therefore, Investors should exercise their own judgment before making any investment decisions. MBKET, its associates, directors, connected parties and/or employees may from time to time have interests and/or underwriting commitments in the securities mentioned in this report.
Hong Kong: As of 21 August 2017, KESHK and the authoring analyst do not have any interest in any companies recommended in this research report.
India: As of 21 August 2017, and at the end of the month immediately preceding the date of publication of the research report, KESI, authoring analyst or their associate / relative does not hold any financial interest or any actual or beneficial ownership in any shares or having any conflict of interest in the subject companies except as otherwise disclosed in the research report. In the past twelve months KESI and authoring analyst or their associate did not receive any compensation or other benefits from the subject companies or third party in connection with the research report on any account what so ever except as otherwise disclosed in the research report.
MKE may have, within the last three years, served as manager or co-manager of a public offering of securities for, or currently may make a primary market in issues of, any or all of the entities mentioned in this report or may be providing, or have provided within the previous 12 months, significant advice or investment services in relation to the investment concerned or a related investment and may receive compensation for the services provided from the companies covered in this report.
OTHERS
Analyst Certification of Independence
The views expressed in this research report accurately reflect the analyst’s personal views about any and all of the subject securities or issuers; and no part of the research analyst’s compensation was, is or will be, directly or indirectly, related to the specific recommendations or views expressed in the report.
Reminder
Structured securities are complex instruments, typically involve a high degree of risk and are intended for sale only to sophisticated investors who are capable of understanding and assuming the risks involved. The market value of any structured security may be affected by changes in economic, financial and political factors (including, but not limited to, spot and forward interest and exchange rates), time to maturity, market conditions and volatility and the credit quality of any issuer or reference issuer. Any investor interested in purchasing a structured product should conduct its own analysis of the product and consult with its own professional advisers as to the risks involved in making such a purchase.
No part of this material may be copied, photocopied or duplicated in any form by any means or redistributed without the prior consent of MKE.
UK This document is being distributed by Maybank Kim Eng Securities (London) Ltd (“Maybank KESL”) which is authorized and regulated, by the Financial Conduct Authority and is for Informational Purposes only. This document is not intended for distribution to anyone defined as a Retail Client under the Financial Services and Markets Act 2000 within the UK. Any inclusion of a third party link is for the recipients convenience only, and that the firm does not take any responsibility for its comments or accuracy, and that access to such links is at the individuals own risk. Nothing in this report should be considered as constituting legal, accounting or tax advice, and that for accurate guidance recipients should consult with their own independent tax advisers.
DISCLOSURES Legal Entities Disclosures Malaysia: This report is issued and distributed in Malaysia by Maybank Investment Bank Berhad (15938- H) which is a Participating Organization of Bursa Malaysia Berhad and a holder of Capital Markets and Services License issued by the Securities Commission in Malaysia. Singapore: This report is distributed in Singapore by Maybank KERPL (Co. Reg No 198700034E) which is regulated by the Monetary Authority of Singapore. Indonesia: PT Maybank Kim Eng Securities (“PTMKES”) (Reg. No. KEP-251/PM/1992) is a member of the Indonesia Stock Exchange and is regulated by the Financial Services Authority (Indonesia). Thailand: MBKET (Reg. No.0107545000314) is a member of the Stock Exchange of Thailand and is regulated by the Ministry of Finance and the Securities and Exchange Commission. Philippines: Maybank ATRKES (Reg. No.01-2004-00019) is a member of the Philippines Stock Exchange and is regulated by the Securities and Exchange Commission. Vietnam: Maybank Kim Eng Securities Limited (License Number: 117/GP-UBCK) is licensed under the State Securities Commission of Vietnam. Hong Kong: KESHK (Central Entity No AAD284) is regulated by the Securities and Futures Commission. India: Kim Eng Securities India Private Limited (“KESI”) is a participant of the National Stock Exchange of India Limited and the Bombay Stock Exchange and is regulated by Securities and Exchange Board of India (“SEBI”) (Reg. No. INZ000010538). KESI is also registered with SEBI as Category 1 Merchant Banker (Reg. No. INM 000011708) and as Research Analyst (Reg No: INH000000057) US: Maybank KESUSA is a member of/ and is authorized and regulated by the FINRA – Broker ID 27861. UK: Maybank KESL (Reg No 2377538) is authorized and regulated by the Financial Services Authority.

August 21, 2017 12
Best World International
Historical recommendations and target price: Best World International (BEST SP)
Definition of Ratings
Maybank Kim Eng Research uses the following rating system
BUY Return is expected to be above 10% in the next 12 months (excluding dividends)
HOLD Return is expected to be between - 10% to +10% in the next 12 months (excluding dividends)
SELL Return is expected to be below -10% in the next 12 months (excluding dividends)
Applicability of Ratings
The respective analyst maintains a coverage universe of stocks, the list of which may be adjusted according to needs. Investment ratings are only applicable to the stocks which form part of the coverage universe. Reports on companies which are not part of the coverage do not carry investment ratings as we do not actively follow developments in these companies.
0.0
0.3
0.6
0.9
1.2
1.5
1.8
Feb-16 May-16 Aug-16 Nov-16 Feb-17 May-17 Aug-17
Best World International
22 Feb NR
24 Aug Buy : SGD1.1
7 Nov Buy : SGD1.1
23 Feb Buy : SGD1.2
11 May Buy : SGD1.8
8 Aug Buy : SGD1.9

August 21, 2017 13
Best World International
Malaysia Maybank Investment Bank Berhad
(A Participating Organisation of
Bursa Malaysia Securities Berhad)
33rd Floor, Menara Maybank,
100 Jalan Tun Perak,
50050 Kuala Lumpur
Tel: (603) 2059 1888;
Fax: (603) 2078 4194
Singapore Maybank Kim Eng Securities Pte Ltd
Maybank Kim Eng Research Pte Ltd
50 North Canal Road
Singapore 059304
Tel: (65) 6336 9090
London Maybank Kim Eng Securities
(London) Ltd
PNB House
77 Queen Victoria Street
London EC4V 4AY, UK
Tel: (44) 20 7332 0221
Fax: (44) 20 7332 0302
New York Maybank Kim Eng Securities USA
Inc
777 Third Avenue, 21st Floor
New York, NY 10017, U.S.A.
Tel: (212) 688 8886
Fax: (212) 688 3500
Stockbroking Business:
Level 8, Tower C, Dataran Maybank,
No.1, Jalan Maarof
59000 Kuala Lumpur
Tel: (603) 2297 8888
Fax: (603) 2282 5136
Hong Kong Kim Eng Securities (HK) Ltd
Level 30,
Three Pacific Place,
1 Queen’s Road East,
Hong Kong
Tel: (852) 2268 0800
Fax: (852) 2877 0104
Indonesia PT Maybank Kim Eng Securities
Sentral Senayan III, 22nd Floor
Jl. Asia Afrika No. 8
Gelora Bung Karno, Senayan
Jakarta 10270, Indonesia
Tel: (62) 21 8066 8500
Fax: (62) 21 8066 8501
India Kim Eng Securities India Pvt Ltd
2nd Floor, The International,
16, Maharishi Karve Road,
Churchgate Station,
Mumbai City - 400 020, India
Tel: (91) 22 6623 2600
Fax: (91) 22 6623 2604
Philippines Maybank ATR Kim Eng Securities Inc.
17/F, Tower One & Exchange Plaza
Ayala Triangle, Ayala Avenue
Makati City, Philippines 1200
Tel: (63) 2 849 8888
Fax: (63) 2 848 5738
Thailand Maybank Kim Eng Securities
(Thailand) Public Company Limited
999/9 The Offices at Central World,
20th - 21st Floor,
Rama 1 Road Pathumwan,
Bangkok 10330, Thailand
Tel: (66) 2 658 6817 (sales)
Tel: (66) 2 658 6801 (research)
Vietnam Maybank Kim Eng Securities Limited
4A-15+16 Floor Vincom Center Dong
Khoi, 72 Le Thanh Ton St. District 1
Ho Chi Minh City, Vietnam
Tel : (84) 844 555 888
Fax : (84) 8 38 271 030
Saudi Arabia In association with
Anfaal Capital
Villa 47, Tujjar Jeddah
Prince Mohammed bin Abdulaziz
Street P.O. Box 126575
Jeddah 21352
Tel: (966) 2 6068686
Fax: (966) 26068787
South Asia Sales Trading Kevin Foy
Regional Head Sales Trading
Tel: (65) 6636-3620
US Toll Free: 1-866-406-7447
North Asia Sales Trading Andrew Lee
Tel: (852) 2268 0283
US Toll Free: 1 877 837 7635
Malaysia Joann Lim [email protected] Tel: (603) 2717 5166
Thailand Tanasak Krishnasreni [email protected] Tel: (66)2 658 6820
Indonesia Harianto Liong [email protected] Tel: (62) 21 2557 1177
London Scott Kinnear-Nock [email protected] Tel: (44) 207-332-0221
New York Andrew Dacey [email protected] Tel: (212) 688 2956
India Manish Modi [email protected] Tel: (91)-22-6623-2601
Vietnam Patrick Mitchell
Tel: (84)-8-44-555-888 x8080
Philippines Keith Roy [email protected] Tel: (63) 2 848-5288
www.maybank-ke.com | www.maybank-keresearch.com