18.5 silk performance explorer - micro focus · performance explorer 18.5 welcome to performance...
TRANSCRIPT

Silk Performance Explorer18.5
Help

Micro FocusThe Lawn22-30 Old Bath RoadNewbury, Berkshire RG14 1QNUKhttp://www.microfocus.com
Copyright © Micro Focus 2017. All rights reserved.
MICRO FOCUS, the Micro Focus logo and Silk Performer are trademarks or registeredtrademarks of Micro Focus IP Development Limited or its subsidiaries or affiliatedcompanies in the United States, United Kingdom and other countries.
All other marks are the property of their respective owners.
2017-10-17
ii

Contents
Performance Explorer 18.5 ............................................................................... 4Getting Started ....................................................................................................................4
Performance Explorer Overview ...............................................................................4Terminology ..............................................................................................................4Time Series Data Files .............................................................................................5Starting Performance Explorer ................................................................................ 7Tour of the UI ............................................................................................................8
Results Analysis ..................................................................................................................9Adding Results ......................................................................................................... 9Visualizing Results ................................................................................................. 10Analyzing Results ...................................................................................................11Processing Results .................................................................................................13Viewing Results ......................................................................................................16
Reporting .......................................................................................................................... 18Word Overview Reports ......................................................................................... 18HTML Overview Reports ........................................................................................18Comparison Reports .............................................................................................. 19
Real-Time Monitoring ........................................................................................................21Monitoring Technologies .........................................................................................22Monitoring Data Sources ........................................................................................47Monitoring Load Tests ............................................................................................ 76Monitor Charts and Monitor Writers ....................................................................... 76Host Data ............................................................................................................... 77Converting Data from CSV to TSD ........................................................................78
Built-In Measures .............................................................................................................. 80Summary Measures ............................................................................................... 80Transaction Measures ............................................................................................ 84Web Form Measures ..............................................................................................85Web Page Measures .............................................................................................. 86Browser-Driven Measures ......................................................................................86CORBA-Specific Measures .................................................................................... 87SQL Database-Specific Measures ......................................................................... 87Middleware-Specific Measures ...............................................................................88Citrix-Specific Measures .........................................................................................88Custom Timer Measures ........................................................................................ 88Custom Counter Measures .................................................................................... 89Streaming Measures .............................................................................................. 89
Command Line Parameters .............................................................................................. 89Available Commands ..............................................................................................89Command File ........................................................................................................ 92
Customizing Visualization ................................................................................................. 93Default Options .......................................................................................................93Customizing Chart Display ..................................................................................... 95Customizing Graph Display ....................................................................................96Displaying Measure Bounds ...................................................................................97Displaying Performance Level Conditions .............................................................. 97
Contents | 3

Performance Explorer 18.5Welcome to Performance Explorer 18.5.
Performance Explorer allows you to view measures obtained through real-time monitoring and to analyzeresults of completed load tests. A variety of tools and features enables exhaustive analysis, reporting, andprocessing of all captured data.
Getting Started
Performance Explorer OverviewPerformance Explorer offers two main capabilities:
• Results Analysis• Real-Time Monitoring
Results Analysis
With the Results Analysis functionality of Performance Explorer, you can analyze the results of acompleted load test by creating charts, tables, and reports. With charts, you can visualize the data that wascollected during the load test, and reports as well as tables help you to summarize important data andfindings. The basis for all charts, tables, and reports is the data in the .tsd files. During each load test, SilkPerformer captures a big amount of data and stores it in several time-series data (.tsd) files. When a loadtest is completed, you can load the data (the .tsd files) in Performance Explorer and visualize and edit themaccording to your requirements. All charts are fully customizable, and they can contain as many measuresas required. You can open multiple charts using measures from one or multiple tests to show similaritiesand differences. Performance Explorer provides a variety of templates for charts, tables, and reports.Furthermore, you can place information on client and server performance in a single chart, so that you candirectly view the effect of server performance on client behavior. By saving your changes as a template,you can reuse your individual settings.
Real-Time Monitoring
With the Real-Time Monitoring functionality of Performance Explorer, you can monitor a broad range ofsystems by creating and configuring charts that show the system performance in real-time. It is possible toopen multiple charts at the same time, which allows you to watch the performance of two or more systemssimultaneously, for example the web server performance and the operating system performance. Addingmeasures to a chart is easy and intuitive in Performance Explorer: You can drag a single measure or a setof measures from the tree onto the chart.
TerminologyThe following terms are used in Performance Explorer and throughout the Performance Explorer Help. Toavoid misconceptions and to keep explanations clear and straightforward, these terms are declared here.
Term Description
Chart A chart is the drawing area, where measures are visuallyrepresented as graphs. A chart can also be described asthe sum of all displayed graphs
4 | Performance Explorer 18.5

Term Description
Graph A graph is a graphical representation of a measure. Whenyou drag a measure onto a chart, it appears as a graphwith a particular color, style, and width.
Series A series is a sequence of values of a certain measure.For example: The measure Active users has thevalues 2, 4, 6, 8. This sequence of values is aseries.
Measure A measure is the smallest grouping entity for the valuesthat are collected during a load test or during amonitoring session for a particular measuring point. Ameasure has a name and type. A set of measured valuesthat are related to the measure is stored as a series in atime series data (.tsd) file. For example: Requestssent or Trans. (busy) ok[s] are measures.
Report In a report, you can summarize particular results andimportant findings of a load test. A report consists oftables and charts with descriptive text. In PerformanceExplorer you can create these kinds of reports: htmloverview reports, word overview reports, and comparisonreports (region, user type, and custom comparisonreports).
Table A table shows the data that was collected during a loadtest or during a monitoring session in a tabular form.
Monitor Chart A monitor chart displays graphs that are updated in real-time. The dynamic monitor charts are used for monitoringsessions, while static charts are used for the resultsanalysis of a completed load test.
Monitor Writer A monitor writer is a graphical and textual summary of amonitoring session.
System A system is a machine, technology, or application thatcan be monitored. Performance Explorer supports abroad range of systems for monitoring.
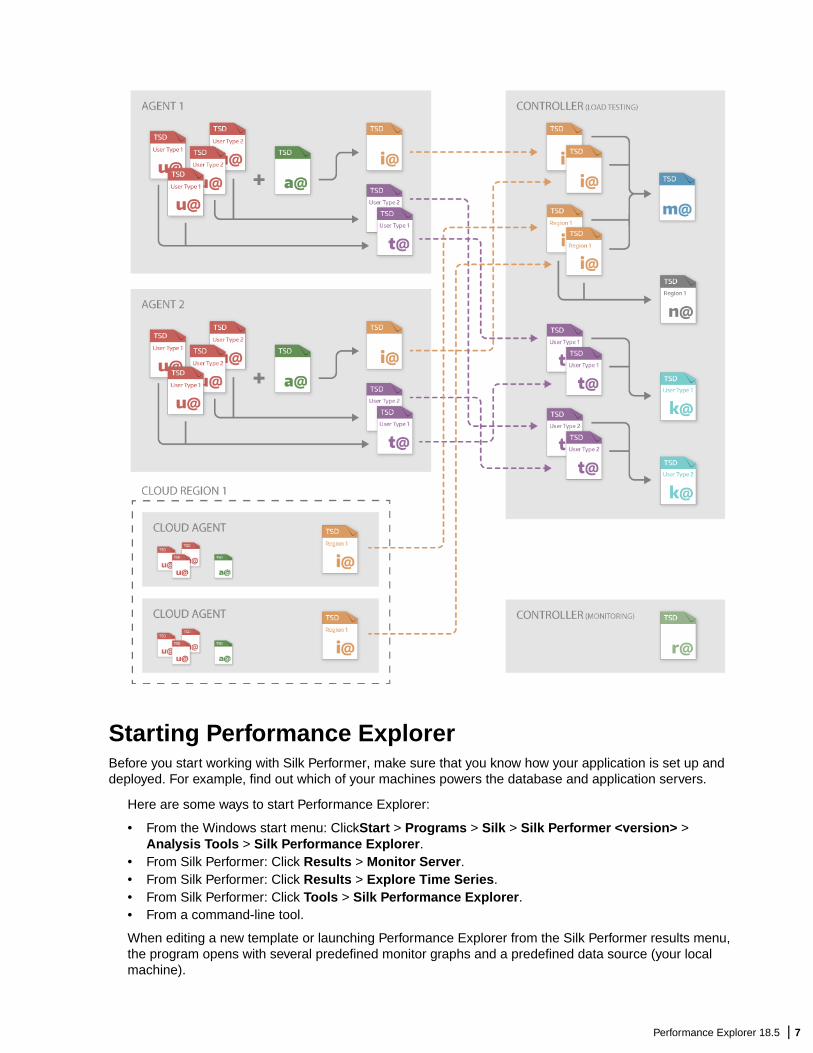
Time Series Data FilesTSD File Naming Description
User File u@<...>.tsd A user file contains the time series data from one virtual user. During a loadtest, user files are generated on the agents.
Agent File a@<...>.tsd An agent file contains the time series data from one agent. During a load test,agent files are generated on the agents.
IntermediateFile
i@<...>.tsd An intermediate file contains all time series data from one agent including thetime series data from all virtual users running on that agent. When the loadtest is complete, intermediate files are generated on the agents by merging theuser files and the agent files together. When merged, the intermediate files aretransferred to the controller.
Performance Explorer 18.5 | 5

TSD File Naming Description
Merged File m@<...>.tsd A merged file contains the time series data from all agents. It is generated onthe controller by merging the intermediate files together. The merged file can bedescribed as the master file, which holds all the time series data of a load test.
Agent File perUser Type
t@<...>.tsd An agent file per user type contains the time series data from one user typeof one agent. Do not confuse it with a user file. Several virtual users can beassigned to one user type. Therefore, the agent file per user type usually holdsthe time series data from several user files. When the load test is complete, theagent files per user type are generated on the agents by merging user files withthe same user type together. When merged, the agent files per user type aretransferred to the controller.
Merged File perUser Type
k@<...>.tsd A merged file per user type contains the time series data from one user typeof all agents. It is generated on the controller by merging the agent files withthe same user type together.
Region File n@<...>.tsd A region file contains the time series data from one cloud region. It isgenerated on the controller by merging the intermediate files of cloud agents ofthe same region together.
Real-Time File r@<...>.tsd A real-time file contains the time series data that is collected and calculatedduring server-side monitoring.
6 | Performance Explorer 18.5
Starting Performance ExplorerBefore you start working with Silk Performer, make sure that you know how your application is set up anddeployed. For example, find out which of your machines powers the database and application servers.
Here are some ways to start Performance Explorer:
• From the Windows start menu: ClickStart > Programs > Silk > Silk Performer <version> >Analysis Tools > Silk Performance Explorer.
• From Silk Performer: Click Results > Monitor Server.• From Silk Performer: Click Results > Explore Time Series.• From Silk Performer: Click Tools > Silk Performance Explorer.• From a command-line tool.
When editing a new template or launching Performance Explorer from the Silk Performer results menu,the program opens with several predefined monitor graphs and a predefined data source (your localmachine).
Performance Explorer 18.5 | 7

Tour of the UIThese are the main sections of the Performance Explorer user interface:
(1) Ribbon
The ribbon in Performance Explorer contains 4 permanent tabs and 2 contextual tabs. While thepermanent tabs are always visible, the contextual tabs are only visible if a chart or a report is open andactive. These are the permanent tabs:
• Results: This tab contains all commands around displaying and analyzing results.• Reports: This tab contains all commands around creating and working with reports.• Real-Time Monitoring: This tab contains all commands around the real-time monitoring functionality of
Performance Explorer.• Window: This tab contains several window commands, like tiling or cascading windows, resetting the
layout, and so on.
These are the contextual tabs:
• Chart: This tab is visible when a chart is active. It contains all commands that control the appearance ofcharts and graphs.
• Series: This tab is visible when a chart is active. It contains all commands that control the appearanceof series.
(2) Chart/Report
In this area the charts and reports are displayed. You can easily drag measures from the tree onto a chart.By using the commands in the contextual tabs, you can adjust the appearance of charts, graphs, and
8 | Performance Explorer 18.5

reports. For example: In a chart, you can change colors, line width, line styles, enable scaling, displaymarkers, null values, measure bounds, and so on.
(3) Tree
The tree area consists of the following four trees (the tree tabs display on the bottom of the tree area): TheExplore tree shows the measures of a load test or single .tsd file. The Monitor tree shows the measuresof the system that is to be monitored. The Silk Central tree shows the measures of a load test that ismanaged and invoked through Silk Central. The Client-Side-Measures tree shows client-side measures.
You can drag measures from the tree onto a chart. You can double-click the white-space in the tree to adda load test or a system.
(4) Measure List
The measure list is visible when a chart is open and active. It lists all measure that display in the chart. Youcan click the check boxes to turn the measures in the chart on and off. The list also supports multi-selectfunctionality, so switching on and off several or all measures concurrently is possible.
(5) Log Window
The log window lists all events that occur during performance monitoring, including errors and query states.You can switch the log window on and off in the Window tab and you can right-click in the log window andcopy or clear the log.
Results AnalysisWith the Results Analysis functionality of Performance Explorer, you can analyze the results of acompleted load test by creating charts, tables, and reports. With charts, you can visualize the data that wascollected during the load test, and reports as well as tables help you to summarize important data andfindings. The basis for all charts, tables, and reports is the data in the .tsd files. During each load test, SilkPerformer captures a big amount of data and stores it in several time-series data (.tsd) files. When a loadtest is completed, you can load the data (the .tsd files) in Performance Explorer and visualize and edit themaccording to your requirements. All charts are fully customizable, and they can contain as many measuresas required. You can open multiple charts using measures from one or multiple tests to show similaritiesand differences. Performance Explorer provides a variety of templates for charts, tables, and reports.Furthermore, you can place information on client and server performance in a single chart, so that you candirectly view the effect of server performance on client behavior. By saving your changes as a template,you can reuse your individual settings.
Although there is no particular workflow in Performance Explorer, users usually follow this progression ofsteps:
• Adding: Add results to the Performance Explorer workspace.• Visualizing: Create charts, tables, and reports based on the loaded results.• Analyzing: Analyze the results (by analyzing errors, comparing graphs, finding root causes).• Processing: Resample or merge the results and export the data.
Adding ResultsBefore you can start visualizing, analyzing, and processing results, you have to add them to PerformanceExplorer. A typical way is to directly open the results from Silk Performer, by clicking the charts or buttonson the Load Test Summary page.
However, you can also start with a blank Performance Explorer workspace and ...
Performance Explorer 18.5 | 9

• add all results of a specified load test• import results from Silk Central• add single .tsd files
Adding Load Test ResultsIf you want to add the results of a load test, specify a results folder and all .tsd files are added to thePerformance Explorer workspace.
1. Open Performance Explorer.
2. In the Results tab, in the Add group, click Load Test Results.
3. Specify a project directory and a load test and click Add.
The added results appear in the Explore tree.
Tip: You can also double-click the white space in the tree to add results, or you right-click in the treeand use the commands in the context-menu.
Adding Results from Silk CentralYou can import results from Silk Central (as described below) or you can start Performance Explorerdirectly from Silk Central.
1. Open Performance Explorer.
2. In the Results tab, in the Add group, click From Silk Central.
3. Follow the wizard to add result files to the workspace.
The added results appear in the Silk Central tree.
Tip: You can also double-click the white space in the tree to add results, or you right-click in the treeand use the commands in the context-menu.
Adding Single Result FilesYou can choose single .tsd files (even from different load tests) and add them to the Performance Explorerworkspace.
1. Open Performance Explorer.
2. In the Results tab, in the Add group, click Result Files.
3. Follow the wizard to add result files to the workspace.
The added results appear in the Explore tree.
Tip: You can also double-click the white space in the tree to add results, or you right-click in the treeand use the commands in the context-menu.
Visualizing ResultsWhen you have added results to the Performance Explorer workspace, you can visualize them with thehelp of charts, tables, and reports.
Creating Charts
1. Open Performance Explorer.
2. In the Results tab, in the New group, click Chart to create an empty chart.
3. Select a .tsd file in the dialog.
This dialog only appears if you have not yet added results to the workspace.
10 | Performance Explorer 18.5

4. Drag measures from the tree onto the chart.
Tip: You can also click the Chart drop-down arrow and click Predefined Chart to create a chart froma template or click Empty VUser-based Chart to create an empty chart, which shows the number ofvirtual users on the x-axis.
Creating Tables
1. Open Performance Explorer.
2. In the Results tab, in the New group, click Table to create an empty table.
3. Select a .tsd file in the dialog.
This dialog only appears if you have not yet added results to the workspace.
4. Drag measures from the tree onto the table.
Tip: You can also click the Table drop-down arrow and click Predefined Table to create a table froma template.
Creating Reports
1. Open Performance Explorer and add results to the workspace.
2. In the Reports tab, in the Overview Report and Comparison Report groups, click one of the followingbuttons:
• Word• HTML• Region• User Type• Custom
For more information on the various reports, see the respective topics in the Reporting section.
Analyzing ResultsPerformance Explorer provides a number of features that allow you to analyze the results of a load test.You can perform a comprehensive error analysis with the Analyze Errors feature, you can comparemeasures from various load tests with the feature Compare Graphs, and you can use the Find RootCause capability.
Analyzing ErrorsPerformance Explorer includes a feature that assists you in analyzing the errors that occur during loadtests. While the overview report displays some error information, the Analyze Errors feature displays allerrors in a comprehensive error chart and lists detailed information.
Before you follow the steps below, configure and execute a load test in Silk Performer.
1. When your load test is completed, the Load Test Summary page displays. Click Analyze errors in theNext Steps area. Performance Explorer opens and displays the error chart.
2. You can also click the Load Test Results chart or you click Analyze Load Test in the Next Steps area.Performance Explorer opens. Then, on the Results tab, in the Analyze group, click Analyze Errors. Anerror chart opens. You can zoom into the chart to drill down to the specific information you need.
Tip: You can also start with a blank Performance Explorer workspace. On the Results tab, in theAnalyze group, click Analyze Errors and specify a .tsd file.
Performance Explorer 18.5 | 11

Error Analysis GraphThe Error Analysis graph contains the following information:
View Description
Error Groups The Error Groups pane displays group information for allthe errors that occurred during the analyzed load test.Use the zoom and shift features to view information forspecific time frames.
Error Details The Error Details pane list all occurrences of errors inthe selected time span. Double-click an error or right-clickan error and select Show TrueLog to invoke TrueLogExplorer with the respective TrueLog file that containsvisualized information for the error occurrence to help youfind the root cause of the selected error.
Legend The Legend pane lists the displayed curves of the chart,which by default is only the error summary of the erroranalysis. It also displays more detailed information aboutoccurrences, minimum and maximum values, and so on.Hold your cursor over the graph to see the number oferror occurrences for a specific time frame. The Valuecolumn updates as you move your cursor over the graph.
Analyzing Root CausesBefore you perform this task, specify the time-series data (TSD) file that is to be used as the data sourcefor the graph.
Performance Explorer’s automatic result-correlation feature facilitates root-cause analysis of network andserver bottlenecks by correlating client-side issues with corresponding server-side measurements.Automatic result correlation identifies the server-side measurements that are most closely associated withspecific client-side errors, thereby enabling you to better identify server-side problems and expeditedebugging efforts. Result correlation also works in the reverse: Server-side issues can be correlated withclient-side measures.
Automatic result correlation statistically correlates key measures with dependent measures. For example, ifa significant increase in server response time is detected by a client-side measure at 18:20 (6:20 p.m.),automatic result correlation can identify the server-side measures that contributed to this drop in client-sideperformance.
1. Click within the measurement graph that you want to analyze and drag your cursor to the right to selectthe time frame to analyze.
Note: To slide the time line forward or backward in time, right-click the time line and drag yourmouse right or left. The time line can also be moved vertically along its Y axis.
Note: To select a shorter period of time for analysis, drag the time line to the right. To select alonger period of time for analysis, drag the time line to the left.
2. Click Find Root Cause on the workflow bar.Alternative: Right-click in the graph and choose Root Cause Analysis.The Find Root Cause - Correlation Settings dialog box opens. The base measure appears in theBase Measure box.
3. From the Correlate with list box, select the type of measurement you want to correlate with the basemeasurement.
4. Adjust the date- and time-selection settings by selecting a new start date, start time, end date, or endtime from the appropriate list box.Date and time selection settings are defined automatically based on the time frame selected in the timeline.
12 | Performance Explorer 18.5

5. In the Results area, specify how to filter measure results based on how well they match.
Choose one of the following options:
• Click the Best [x] correlation numbers option button and specify the number of measures to bereturned in the text box.
• Click the Minimum correlation of [x]% option button and specify a minimum correlation relevanceby typing a value in the text box.
6. Click Next.
Note: If you are correlating against client and server measures, client measures, or servermeasures, advance to step 10.
The Correlation Measures Properties page opens.
7. When correlating against a custom measure, you must define which measure groups are to becorrelated. Select the groups you want to correlate against by checking the Measures check boxes.
8. Optional: Add other measures by clicking Add File and browsing to and selecting a time-series data file.
You can also remove measures by selecting them and clicking Remove File.
9. Click Next to run the correlation. The Correlation Results page opens.
By default, returned measures are listed in order of degree of correlation, and all correlations areselected.
10.Click the Correlation Group and Name column headers to sort returned measures.
11.Uncheck the check boxes for the measures that you do not want to include in the correlation graph.
12.Click Finish to generate the correlation graph.
Comparing GraphsWhen you have created and customized a chart with measures of interest, you might want to comparethese measures with measures from a different user type, from different agents, different regions, or from adifferent load test. Performance Explorer provides the Compare Graph feature for this purpose. When youclick Compare Graph, Performance Explorer creates a new chart with the selected measure andautomatically adds the ones you want them to compare with.
1. Create a new chart: On the Results tab, in the New group, click Chart.
2. If you have not already loaded result files into Performance Explorer, select a .tsd file in the dialog.
3. Drag the measures of your interest from the tree onto the graph.
4. On the Results tab, in the Analyze group, click the drop-down arrow below Compare Graph and selectone of the following options:
• With other User Types: Creates a new chart with the selected measures from the active chart andadds the same measures from all user types.
• With other Agents: Creates a new chart with the selected measures from the active chart and addsthe same measures from all agents.
• With other Regions: Creates a new chart with the selected measures from the active chart andadds the same measures from all regions.
• With other TSD File: Creates a new chart with the selected measures from the active chart andadds the same measures from a different .tsd file.
5. If you chose to compare graphs with another .tsd file, Performance Explorer prompts you to selectthe .tsd file.
Processing ResultsWith Performance Explorer, you can process results in various ways:
• You can resample results by changing the interval and redefining the time frame.
Performance Explorer 18.5 | 13

• You can merge the results of two or more load tests.• You can export results to process them in third-party tools like spreadsheet programs.
Resampling Load Test ResultsSpecify a load test results folder and resample the data of the containing .tsd files by changing the intervaland redefining the time frame.
1. On the Results tab, in the Data Processing group, click Resample Load Test Results.
2. Specify the Source directory of the load test that contains the .tsd files that are to be resampled.Specify the name of the Target folder and click Next.
3. Specify an Output interval. For longer running load tests, an increased output interval is usefulbecause it results in a smaller target file.
4. Choose one of the following merge types:
• Click Relative to specify that all series start at the same time.• Click Absolute to consider the individual start time of each series.
If you merge files from different load tests, the start times of those files are different, so use theRelative merge type.
If you click Absolute, you can specify a time frame. Only data within this time frame is merged intothe target file.
5. Adjust the date and time settings by selecting a new start date/time and end date/time.
Date and time settings are defined automatically based on the time frame selected in the time line.
6. Click Next or Finish to start the resampling process.
Resampling Single Result FilesSpecify a result file and resample the containing data by changing the interval and redefining the timeframe. Increasing the output interval is useful to make result files smaller in size and to smoothen thecorresponding graphs.
1. On the Results tab, in the Data Processing group, click Resample Single Result File.
2. Specify the Source file. This is the .tsd file that is to be resampled. Specify the name of theDestination file and click Next.
The format of the destination file will be m@@<sourcefilename>_r.tsd
3. Specify an Output interval. For longer running load tests, an increased output interval is usefulbecause it results in a smaller target file.
4. Choose one of the following merge types:
• Click Relative to specify that all series start at the same time.• Click Absolute to consider the individual start time of each series.
If you merge files from different load tests, the start times of those files are different, so use theRelative merge type.
If you click Absolute, you can specify a time frame. Only data within this time frame is merged intothe target file.
5. Adjust the date and time settings by selecting a new start date/time and end date/time.
Date and time settings are defined automatically based on the time frame selected in the time line.
6. Click Next or Finish to start the resampling process.
Merging Load Test ResultsTo run a big load test, it can be necessary to start the load test from multiple controllers. Consequently, SilkPerformer will generate multiple result folders - one folder per controller. Use the Merge Results feature to
14 | Performance Explorer 18.5

merge the results into one result folder. This allows you to view all metrics in a single comprehensivereport.
Note: Results from different projects cannot be merged.
1. On the Results tab, in the Data Processing group, click Merge Results.
2. Drag two or more load test result folders from a file explorer onto the table or click Add to browse forresult folders.
3. Specify a master load test in the Master column. Some values from the result files cannot be merged(like the project description). In such a case, Performance Explorer will use the value of the master loadtest.
4. Select a Merge type:
• absolute: In a report, the results will display with their actual start time on the time line. For example:If you started a load test on Controller B 10 seconds after you started the load test on Controller A,the results will display on the time line accordingly.
• relative: In a report, all results will display with the same start time on the time line, regardless of theactual start times of the load tests.
5. Specify an Interval for the merged .tsd files. The minimum interval (shown in the Interval list) is thelowest common multiple of the intervals from all .tsd files that are located in the specified results folders.
6. Specify a Target folder. The merged results will be stored in this folder.
7. Click Merge.
When the results are merged successfully, Performance Explorer displays an overview report. This newlycreated report has the workload type Merged Workload, which contains all executed usergroups.
Merging Single Result FilesMerging single result files is useful in the following situations:
• You want to create a custom .tsd file based on selected source .tsd files.• You want to recreate the merged .tsd file ([email protected]) to include results from agents that have lost
connection during a load test. If the controller-agent connection fails, agent files reside on the agent inthe local results directory. Depending on when the connection is lost, you might find either user-only ormerged agent files. If you want these results included in the intermediate file of your load-test controller,you must manually merge the files.
1. If necessary, copy all files you want to merge into a single directory.
2. Choose Wizard > Custom Merge Wizard . The Custom Merge Wizard opens.
3. Select the directory where all the files are stored and select all the files to merge.
4. Click Finish.
A new, merged file containing all the data is generated.
Note: Make sure to not select .tsd files with the same or dependent data. For example: Merging UserType .tsd files and merged User Type .tsd files results in multiple aggregation of the same series,which usually is not a reasonable scenario.
Exporting TSD Files As CSV FilesWith the TSD to CSV feature, you can export the content of a .tsd (time series data) file to a .csv (commaseparated values) file. You can then analyze and edit the data in an external spreadsheet program.
You can also use the TSD File Export Tool, a command-line tool that allows you to automate theexport process.
1. On the Results tab, in the Data Processing group, click TSD to CSV.
Performance Explorer 18.5 | 15

2. Select a Source file, specify a name and location for your Export file, and click Next.
3. Select the measures you want to export and click Next.
4. Select an Export type:
• Click Standard and specify the data source elements of the result file that must be included inthe .csv file.
• Click Dump to include all meta data in the .csv file.
5. You can Include header information in the .csv file. Select the comma or the semicolon as yourseparator and select how a decimal point is to be displayed in the .csv file.
6. Click Finish to export the data and generate the .csv file.
7. To view the output file, click Yes on the subsequent dialog.
Using the TSD File Export ToolThe TSD File Export Tool is a command-line tool that allows you to automate exporting the content of .tsdfiles to .csv files. You can also use the TSD to CSV feature in Performance Explorer, which provides a userinterface for the export settings.
1. Open the tool from the Microsoft Windows start menu: Start > Programs > Silk > Silk Performer<version> > Analysis Tools > TSD File Export Tool.
2. At the command prompt, enter specifications for the file export based on the following syntax:
Tsd2Csv tsdFile [csvFile] [-Delimiter char] [-DecimalPoint char] [-dump]
Command Description
tsdFiles Enter the path and name of the .tsd file that is to beexported.
[csvFile] Enter the path and name of the .csv file that is to becreated.
[-Delimiter char] Define the delimiter character.
[-DecimalPoint char] Define the character that signifies decimal points in theoutput file.
[-dump] Ignores -DecimalPoint parameter.
3. Press Enter to generate the .csv file.
Example
Tsd2Csv "input.tsd" "output.csv" -Delimiter "," -DecimalPoint "."
Viewing ResultsPerformance Explorer can convert charts, reports, and tables into HTML documents and display these in aweb browser. This enables you to include charts, reports, and tables in any kind of documents, publishthem online, or print them in useful formats.
Viewing Charts in a Web BrowserCreate or open the graph that you want to view in a Web browser.
1. Create or open the chart that you want to view in a web browser.
2. On the Chart tab, in the Data group, click View in Browser.
16 | Performance Explorer 18.5

3. Enter a Caption and a Description for the chart and click OK. The caption and description display inthe browser above the chart.
Viewing Reports and Tables in a Web BrowserCreate or open the report that you want to view in a Web browser.
1. Create or open the HTML overview report or table that you want to view in a web browser.
2. On the Reports tab, in the Tasks group, click Open in Browser.
3. Enter a Caption and a Description for the report or table and click OK. The caption and descriptiondisplay in the browser above the chart.
Exporting ChartsYou can export charts in various formats to present them to an audience that has not access toPerformance Explorer.
1. Create or open the chart that you want to export.
2. On the Chart tab, in the Chart group, click the drop-down arrow below Export.
• Click CSV File to export the chart data to a .csv file. On the subsequent dialog, you can select froma range of file formats, like .htm, .mht, or .jpg. The .csv format is the default value.
• Click Excel Document to export the chart data to a Microsoft Excel document. A chart isautomatically created in Excel.
Tip: The .mht format allows you to easily send charts through email. The .html format allows you topublish charts on the web. The .csv format allows you to further process data in external spreadsheetprograms. The picture formats allow you to insert charts as pictures in other documents.
Exporting Reports and TablesYou can export reports and tables in various formats to present them to an audience that has not access toPerformance Explorer.
1. Create or open the report or table that you want to export.
2. On the Reports tab, in the Tasks group, click Save as.
3. On the subsequent dialog, select a directory, enter a file name, select a file format, and click Save.
Tip: The .mht format allows you to easily send reports or tables through email. The .html formatallows you to publish reports or tables on the web. The .csv format allows you to further process datain external spreadsheet programs.
Tip: You can also export reports through the command line interface. This allows you to automate theexport process.
Exporting Reports Through the Command-Line InterfaceHTML reports can also be exported as Web archives (MHT files) through the command-line interface. Toexport reports, use the command-line parameter /EXPORTOVR:<target file>.
This parameter saves the active OVR as HTML or as an MHT file, depending on the file extension of thetarget file specification.
Note: The last loaded TSD file, or the last TSD file specified through the command line (/TSD:<tsdfile>) is used for exporting.
The command-line parameter /ACTION:OVERVIEWREPORT[:<template>] allows you to specify atemplate file for the report.
The following example illustrates exporting a Web archive file through the command line:
Performance Explorer 18.5 | 17

/TSD:<tsdFile> /ACTION:OVERVIEWREPORT /EXPORTOVR:c:\test.mht
ReportingCreating reports is one possibility to summarize and analyze the data that was collected during a load test.Learn about the report types Performance Explorer provides and how to create and work with reports.
Word Overview ReportsPerformance Explorer allows you to view your load test results in a Microsoft Word document. This isespecially useful if you want to further process your results for presentation and add custom formatting.
Creating Word Overview Reports1. Add load test results to the Performance Explorer workspace
2. In the Reports tab, in the Overview Report group, click one of the following buttons:
• Click Word or Word Overview Report to show the results in a Word document.• Click Word Overview Report from Template, select a .docx file and click Create.• Click Custom Word Overview Report, select the information that the Word overview report shall
contain, and click Create.
Note: You can enable Use template for all future reports to always create Word overview reportsbased on a template. To disable this option, click the Performance Explorer application button (on thetop left) and click Options. Click the Reporting tab and disable Use template (.docx) when creatinga new Word Overview Report.
Creating a Template for Word Overview ReportsBefore you can save and use a template, create a Word overview report with all the information you want tohave in the report.
1. On the Reports tab, in the Overview Report group, click Custom Word Overview Report.2. Select the information that the template shall contain and click Create. Microsoft Word opens and the
specified information displays.
3. Adapt the content and the appearance of the Word document to your needs. You can add informationand comments, rearrange fields, change element styles, change the header, footer, or logo, removeunwanted content, and so on.
4. Save the Word document as .docx file and close it. Your template is created.
5. Switch back to Performance Explorer. On the Reports tab, in the Overview Report group, click WordOverview Report from Template.
6. Browse for the .docx file you have just defined and click Create.
Note: You can enable Use template for all future reports to always create Word overview reportsbased on a template. To disable this option, click the Performance Explorer application button (on thetop left) and click Options. Click the Reporting tab and disable Use template (.docx) when creatinga new Word Overview Report.
HTML Overview ReportsWhen a load test completes, the Load Test Summary page displays in Silk Performer and an overviewreport is generated automatically. In Silk Performer, you can find the overview report in the Results tree. Toopen the overview report in Performance Explorer, double-click the report in the tree or click Analyze loadtest on the Load Test Summary page. You can also open a blank Performance Explorer workspace andclick HTML in the Overview Report group on the Reports tab.
18 | Performance Explorer 18.5
Creating HTML Overview ReportsBefore you follow the steps below, configure a load test in Silk Performer and execute it. When your loadtest is completed, the Load Test Summary page displays. Perform one of the following steps:
• Click Analyze load test in the Next Steps area.• Click Results on the bottom of the tree, expand a load test node, and double-click Overview Report.
Performance Explorer opens and the overview report displays.
To open an HTML overview report out of Performance Explorer, perform the following steps:
1. Add load test results to the Performance Explorer workspace
2. In the Reports tab, in the Overview Report group, click one of the following buttons:
• Click HTML or HTML Overview Report to show the results in an HTML overview report.• Click HTML Overview Report from Template, select an .ovt file (overview report template) and
click Create.• Click Custom HTML Overview Report, select the information that the HTML overview report shall
contain, and click Create.
Note: You can enable Use template for all future reports to always create HTML overview reportsbased on a template. To disable this option, click the Performance Explorer application button (on thetop left) and click Options. Click the Reporting tab and disable Use template (.ovt) when creating anew HTML Overview Report.
Note: By default, overview reports are generated automatically. To disable the automatic generation,click the Performance Explorer application button (on the top left), click Options, click the Reportingtab and disable Generate Overview Reports automatically.
Assigning Overview Report Templates to Projects
You can specify an overview report template for each Silk Performer project. All automatically generatedHTML overview reports will use this template and the template will be preselected when you create HTMLoverview reports manually.
1. In Silk Performer, expand the Profiles node in the menu tree.
2. Right-click the profile that you want to configure and choose Edit Profile.
Alternative: Choose Settings > Active Profile.
The Profile - [<profile name>] dialog box opens.
3. In the shortcut list on the left, click the Results icon.
4. Click the Time Series tab.
5. Browse for a template in the Overview report template section and click Open.
6. Click OK.
Note: Performance Explorer’s command line interface also offers the /OVT:<template> commandfor assigning overview report templates to Silk Performer projects.
Comparison ReportsPerformance Explorer provides three types of comparison reports:
• region comparison reports• user type comparison reports• custom comparison reports
A comparison report allows you to compare the results of up to eight test executions side by side. Itsstructure resembles the structure of a standard baseline report: Comparison reports contain summaries
Performance Explorer 18.5 | 19
and statistics regarding transactions, errors, page and action timers, web forms, rankings, and many othermeasures.
At the bottom of a comparison report, the Baseline Pane displays. This pane includes a column with eitherthe name of a specific region or user type, or a column named Overall if the row contains all test results.The Agents column displays the number of agents that were used for the test in each specified region.
Any test result can be defined as the baseline. All other results will use this baseline as reference and theywill be compared to the baseline. In report rankings, the baseline result is always listed first. A b icon orbaseline tag identifies the baseline result. All measures that are evaluated against the baseline areidentified with heat fields (colored bars in the report). Move your cursor over any heat field to view detailedinformation. To set a result as the baseline, right-click it and click Set as baseline.
Region Comparison ReportsRegion comparison reports allow you to compare the results of cloud-based load tests. These are loadtests that use cloud agents to generate load. You can compare the results from different regions side byside. The report shows one region per column. A maximum of eight regions can be included in a singleregion comparison report.
Both overall results and region-specific results can be compared. To add measures, drag them from thetree onto the report. To add the overall results, drag the Overall node onto the report.
User Type Comparison ReportsUser type comparison reports allow you to compare user types side by side. The report shows one usertype per column. A maximum of eight user types can be included in a single user type comparison report.
Both overall results and user-type-specific results can be compared. To add measures, drag them from thetree onto the report. To add the overall results of a test, drag the Overall node onto the report. The data setis marked with Overall in the User Type column of the Baseline Pane.
Custom Comparison ReportsCustom comparison reports allow you to compare the results of up to eight test executions side by side.Additionally, you can compare load test executions with user types or regions if this makes sense in yourscenario.
Creating Region Comparison ReportsBefore you follow the steps below, configure a cloud-based load test in Silk Performer with cloud agentsfrom different regions and execute the load test.
1. When your cloud-based load test is completed, the Load Test Summary page displays. Click the LoadTest Results chart to open it in Performance Explorer.
The results are loaded into Performance Explorer and display in the tree.
2. Expand the nodes in the tree until you see the Regions node. Results data (time series data) isavailable for each cloud region that was included in the load test.
Note: The data is available for the cloud regions, not for the single cloud agents.
3. Select a region and click Region in the Comparison Report group on the Reports tab. The reportdisplays, showing the selected region. You can now drag further regions from the tree onto the report.
• To show all regions in the report at once, select the Regions node and click Region.• To show all regions and an Overall column in the report, select the Client Measures node and
click Region.
20 | Performance Explorer 18.5

Tip: You can also right-click a node in the tree and use the commands in the context menu.
Note: Only regions from the same load test can be added to a region comparison report.
4. To define the results of a certain region as the baseline, right-click the region in the baseline pane at thebottom of the report and click Set as baseline.
Creating User Type Comparison Reports
1. Open Performance Explorer and add results. The results are loaded into Performance Explorer anddisplay in the tree.
2. Expand the nodes in the tree until you see the User Types node.
3. Select a user type and click User Type in the Comparison Report group on the Reports tab. Thereport displays, showing the selected user type. You can now drag further user types from the tree ontothe report.
• To show all user types in the report at once, select the User Types node and click User Type.• To show all user types and an Overall column for the workload, select the Client Measures node
and click User Type.
Tip: You can also right-click a node in the tree and use the commands in the context-menu.
Note: Only user types from the same load test can be added to a user type comparison report.
4. To define the results of a certain user type as the baseline, right-click the user type in the baseline paneat the bottom of the report and click Set as baseline.
Creating Custom Comparison Reports
1. Open Performance Explorer and add results. The results are loaded into Performance Explorer anddisplay in the tree.
2. Select a project node in the tree and click Custom in the Comparison Report group on the Reportstab. The report is created with all load tests that are loaded in Performance Explorer. These are the loadtests that appear under the project node in the tree.
3. You can add further load test results and drag them from the tree onto the report. You can even addload tests as well as user type or region results from various projects to one custom comparison report.A maximum of eight data sets can be included in a single custom comparison report.
Tip: You can also right-click a node in the tree and use the commands in the context menu.
4. To define the results of a certain load test as the baseline, right-click the load test in the baseline paneat the bottom of the report and click Set as baseline.
Real-Time MonitoringWith the Real-Time Monitoring functionality of Performance Explorer, you can monitor a broad range ofsystems by creating and configuring charts that show the system performance in real-time. It is possible toopen multiple charts at the same time, which allows you to watch the performance of two or more systemssimultaneously, for example the web server performance and the operating system performance. Addingmeasures to a chart is easy and intuitive in Performance Explorer: You can drag a single measure or a setof measures from the tree onto the chart.
Performance Explorer 18.5 | 21

Monitoring TechnologiesPerformance Explorer supports a broad range of monitoring technologies, which are described in thissection.
Monitoring Windows MachinesThis section describes the requirements and setup of Windows machines and provides troubleshootingtips.
Requirements for Monitoring Windows Machines
Make sure that the following preconditions are met to be able to monitor the respective remote systems:
Target machines with Windows Vista and newer client operating systems
The Remote Registry service must be running on the machine that you want to monitor. This service doesnot run by default on Windows Vista and Windows 7 machines.
Target machines with Windows 2003 and newer server operating systems
• User is in Administrators group• User is in the Network Configuration Operators and Performance Monitor Users groups• User is in Users group, and the path Software\Microsoft\Windows NT\CurrentVersion
\Windows is added to one of the following Network access settings:
• Remotely accessible registry paths setting• Remotely accessible registry paths and sub paths under Local Policies/Security Options
setting
This approach works well for tests with machines in different trusted domains and with users from thosedomains.
Target machines with Windows XP operating systems
• Simple File Sharing is disabled• READ access to the following files on the remote computer:
• %SystemRoot%\System32\Perfc009.dat• %SystemRoot%\System32\Perfh009.dat
• READ access to the following registry keys on the remote computer:
• HKEY_LOCAL_MACHINE\SYSTEM\CurrentControlSet\Control\SecurePipeServers\winreg• HKEY_LOCAL_MACHINE\SOFTWARE\Microsoft\Windows NT\CurrentVersion\Perflib
Troubleshooting Windows Performance Monitoring
The following error messages can occur when monitoring Windows-based machines:
Error Message Possible Cause Resolution
Computer Name Not Found You might receive this error messagewhen trying to monitor a remotecomputer from a non-administratoraccount.
Enable remote monitoring on aWindows NT computer.
22 | Performance Explorer 18.5

Error Message Possible Cause Resolution
Unable to Connect toWindows XP Machine
This error can occur when monitoringcomputers that are running theWindows XP operating system.
Enable remote monitoring.
Error=AGENT_ERROR_TCP_SEND_REQUEST_FAILED
This problem can occur if yourorganization uses proxy auto-configuration files to direct requests toa proxy server, and you specify theautomatic configuration script addressrather than the registered name of theproxy server.
If your organization uses a non-passive proxy, in most cases youmust also specify the port number.
Verify the following proxy settings:
• Correct entry of the proxy servername, user name, and password
• Ability to ping the proxy serverfrom the RSM computer
• Ability of the RSM computer toconnect to the portal computer
System 5 - Access denied When monitoring a machine withWindows 2008 or newer usingCUSTOM / PERFMON option,logging in with credentials of a useradded to the Administrators groupgenerates a System 5 -access denied error.
The user with which you runPerformance Explorer needs to beadded to the Administrators group onthe remote computer that you want tomonitor. If you specify different usercredentials in Performance Explorer’sData Source Wizard, that user alsoneeds to be added to theAdministrators group on the remotecomputer. To monitor remotemachines successfully, you need tolaunch Performance Explorer(PerfExp.exe) under the sameuser account that is being used toconnect to the remote machine(s).
Tip: To launchPerfExp.exe under aspecific user account, pressshift + right-clickand select Run as differentuser.
JMX MonitoringThe Silk Performer support for Java Management Extensions (JMX) monitoring enables you to monitorMBean attributes that are exposed by Java application servers. MBean attributes that return numeric dataare added to Performance Explorer monitors as data sources.
Prerequisites for JMX Monitoring
The prerequisites for JMX monitoring include the following items:
• Java Runtime (JVM) 1.5 or later• The JVM application that you want to monitor must have an open port for monitoring
Connecting to a JMX Data Source
Establish a connection to a Java application server to monitor MBean attributes.
1. On the Real-Time Monitoring tab, in the Monitor group, click System.
Performance Explorer 18.5 | 23

2. Click Select from predefined Data Sources and then click Next.
3. Perform one of the following steps:
• To explore all available MBean attributes on an application server, expand the Application Serverfolder and select a JMX application profile from a vendor-specific folder. Profile names end with theextension .jmx.
• To explore a selection of MBeans that contain typical attributes for monitoring, expand theApplication Server folder and select a JMX application profile from a vendor-specific folder. Profilenames end with the extension .ejmx.
• To create a generic JMX monitoring data source, expand the Custom Data folder and select JMXData.
4. In the Hostname text box, specify the JMX server.
5. Optional: In the Alias text box, specify the alias name.
The alias must be a highly descriptive synonym for the monitored server. It is recommended that yougroup measures on a particular machine.
For example, both WebLogic and IIS might be installed on the same computer. Both servers requiremonitoring, but the two performance measures must appear in separate menu trees.
6. Specify the port, username, and password that are appropriate for the username.
7. If you opted to create a generic JMX monitoring data source, select a supported applicationconfiguration from the Application list box.
8. Click Server Configuration. The JMX Connection Configuration dialog box opens.
9. Specify the application server installation directory where the application server's communicationlibraries are located.
The relative classpath entries of the application configuration file, together with the specified applicationserver install directory, form the classpath under which the JMX client runs. The resulting classpath isviewed in the Resulting classpath text box.
Note: It is recommended that you use a UNC path or copy the application library directory of theserver to your local machine and specify your local copy as the application server installationdirectory. To complete this task, click [...] next to the App. server install directory text box.
Note: JMX monitoring of WebSphere requires that you specify an IBM JDK. If your WebSphereserver has disabled administrative security or enabled administrative security and the inboundCSIv2 transport layer is TCP/IP, you can specify a SUN JDK.
10.In the Java home directory text box, specify the installation directory where the client's communicationlibraries are located.
Alternative: Click [...] to navigate to the appropriate directory.
11.Specify additional libraries in the Additional classpath text box.
12.Specify additional virtual machine parameters in the Additional JVM parameters text box.
The parameters on the Connection and Visualization pages are preconfigured for each server.
13.Click OK. The Connection Parameters page opens.
14.Click Next and then click Finish. Performance Explorer connects to the JMX server.
15.Examine the exposed beans in the JMX Data Source Browser.
16.Click Finish.
Specifying MBeans for Monitoring
Application configuration profiles are stored as XML files at C:\Program Files\Silk\SilkPerformer18.5\include\jmx-config\. Make any changes to the default configurations in the XMLfile directory, and create additional profiles in this directory as well. Newly created application configurationprofiles are available for use as data sources.
24 | Performance Explorer 18.5
1. Open the JMX Data Source browser.
The Type Tree page shows all the available categories of MBeans in a tree structure. The Type Listtab, shows all available categories in a list format. All available MBeans of the selected category arevisible in the Beans text box. Each MBean is identified by an object name, which consists of a domainname and one or more pairs of property types and values.
2. Select an MBean of interest and expand the MBean node to view the available attributes.
3. Optional: Click Numeric Attributes to filter non-numeric attributes.
Non-numeric attributes are not supported for JMX monitoring.
4. Optional: Right-click an attribute and choose Get Value to query the value of any attribute.
5. Optional: Right-click an attribute that represents an object name and choose Follow Reference tonavigate to the referenced MBean.
Add the appropriate attributes to the bean-attribute pool.
Adding Attributes to the Bean-Attribute Pool
Before you begin this procedure, perform one of the following steps:
• Specify the appropriate MBeans for monitoring.• Run an Easy JMX or custom query to identify MBeans of interest.
1. Open the JMX Data Source Browser.
2. Choose the attributes to monitor in the Beans text box.
Note: Select multiple beans by pressing Shift or Ctrl.
Note: Certain MBeans like those based on JSR-77 might contain complex attributes that consist ofseveral submeasures or statistics. To a certain depth of recursiveness, you can selectsubmeasures to be monitored.
3. Right-click the selected attributes and choose Add As. A submenu opens.
4. Choose one of the following options for monitoring the attribute values:
• Average – Useful for count values. By default, this option is selected.• Sum – Same as Average, but shows a different label in the monitor GUI.• Incremental – Useful for rising values. Instead of the attribute value, the change of the value within a
monitor interval is calculated.
5. Click Close. The Select displayed measures page opens.
6. Optional: Select an MBean and click Add. Performance Explorer adds all visible attributes of an MBeanas a data source.
7. Check the check boxes for those measures that you want to include in the initial monitor view and thenclick Finish.
A connection to the specified host is established, and an initial view that contains the measures youselected is displayed.
Easy JMX QueriesEasy JMX queries enable access to the most important attribute values of MBeans that are hosted on JMXMBeanServers. Easy JMX queries are preconfigured, advanced queries that are executed automaticallywhen a connection to an application server's MBeanServer is established. All MBeans that match EasyJMX query criteria are automatically displayed in the Beans text box of the JMX Data Source browser.Easy JMX profiles are identifiable in the System menu tree on the System Selection dialog box by theEJMX tags that follow them.
Performance Explorer 18.5 | 25

Filtering Beans Using JMX Query Language
Display only the MBeans that match specific filter criteria to narrow the JMX query.
1. Open the JMX Data Source Browser. All available MBeans on the selected JMX MBeanServer arevisible in the Beans text box.
2. Click the Simple Query tab.
3. Select a domain from the Domain list box.
Leave this field set to <All> to search all domains.
4. Optional: Select a property from the Property field list box.
This list displays all the properties that are included in the loaded beans.
5. Optional: Select a value for the selected property from the rightmost Property field list box.
The Query text box shows the resulting object name that is used for JMX queries, which are based onthe JMX 1.2 (JSR-003) standard.
6. Optional: Type an attribute name in the Attribute filter text box to filter the list based on a specificattribute. Only MBeans containing the specified attributes are displayed.
7. Click Run to execute the query. The Beans text box displays only those MBeans that match the filtercriteria.
Running Advanced JMX Queries
Create a sophisticated combination of simple queries to monitor data for your environment.
1. Open the JMX Data Source Browser.
2. Click the Advanced Query tab.
Available query types are listed in the upper window.
For example, you might see Object Name Query.
3. Select one of the available operators for the query from the list box of the query.For example, you might select the OR operator.
4. Select a value for the operator from the subsequent list box.For example, you might select True.[...] appears, enabling you to open the JMX Object Name Query dialog box and browse through adomain list.
5. Click [...] and select the appropriate domain name from the domain list. For example, you might selectjboss.cache.
6. Continue adding elements until your query is complete.For example, you might add *:J2EEServer =local.
7. Click OK.
8. Click the root element of the Query menu tree.
9. Type a description of the query in the lower pane of the Advanced Query page.
10.Click Run.
All MBeans that meet the query's criteria are displayed.
11.Click Save.
This step allows you to specify a target destination and name for the query. The file extension for JMXData Queries is .jdq.
Note: Queries that are saved to the C:\Program Files\Silk\SilkPerformer18.5\include\jmx-config directory are also listed on the Easy JMX page andcan be run directly from there.
26 | Performance Explorer 18.5
Running Saved Queries
Execute an existing JMX query to access the most important attribute values of MBeans that are hosted onJMX MBeanServers.
1. Open the JMX Data Source Browser.
2. Click the Advanced Query tab.
3. Choose Load > Load From File > Load.
4. Browse through the list of pre-installed queries and any custom queries that you might have saved.
Pre-installed query types are available for a number of server types. These types are the same querytypes that are available with the Easy JMX profiles.
5. Click Run.
Note: Queries that are saved to C:\Program Files\Silk\Silk Performer18.5\include\jmx-config are also listed on the Easy JMX page and can be run directly from there.
Performance Explorer executes the query.
REXEC and UNIX Data SourcesDescribes how to query Unix-based systems using the Remote Execution protocol.
REXEC and UNIX Data Sources Overview
Data sources on UNIX-based systems can often be queried by using the Remote Execution protocol.Identified data sources appear in the predefined data sources list. For example, you might want to monitorContext switches/sec on a Solaris system. By selecting this entry in the predefined list, you do not needto specify remote execution details. When data sources are not found in the list, create a custom datasource.
Remote Execution
Remote execution means that you execute commands on the remote host by using the command-lineinterface. You can also execute shell scripts. To verify shell scripts, use a telnet client, connect to your UNIXsystem, and run some commands or scripts.
Single Execution
With single execution, the primary domain controller emulator (PDCE) connects to the remote machine andexecutes the command each time a new data point is requested. With short intervals this setting mightplace some load on the remote machine. However, the PDCE does not start a new command on theremote machine until the command of the last interval has finished.
Without single execution, the PDCE connects to the remote machine at the beginning of the monitoringsession, starts the command, and forwards the output of the command to the parser. The parser isactivated at the given monitoring interval and parses available data. The command is executed only once,and the connection to the remote machine remains active during the entire monitoring session. If theconnection is lost because, for instance, the command on the remote machine exits, the PDCE attempts toreconnect after a fixed interval.
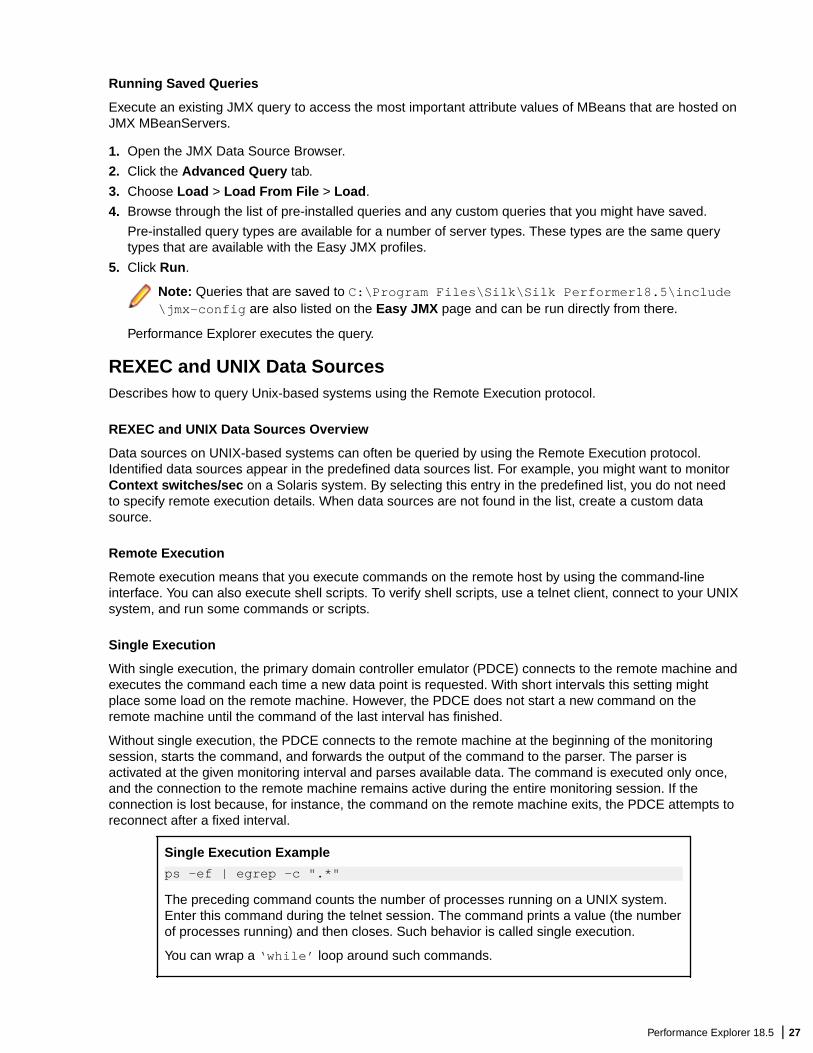
Single Execution Example
ps -ef | egrep -c ".*"
The preceding command counts the number of processes running on a UNIX system.Enter this command during the telnet session. The command prints a value (the numberof processes running) and then closes. Such behavior is called single execution.
You can wrap a ‘while’ loop around such commands.
Performance Explorer 18.5 | 27

Multiple Execution Example
while [ true ]; do // Mind the spaces ps -ef | egrep -c ".*"; sleep 5;done
The preceding example continuously prints the number of processes at five-secondintervals. Such behavior is defined as multiple executions.
Using REXEC to Query UNIX
Establish a connection to a UNIX-based system that uses the Remote Execution Protocol and add themeasures that you want to monitor.
1. On the Real-Time Monitoring tab, in the Monitor group, click System.
2. Click Select from predefined Data Sources and then click Next.
3. Expand the Custom Data folder, click Rexec Data, and then click Next.
4. In the Hostname text box, specify the machine to be monitored.
5. Optional: In the Alias text box, specify the alias name.
The alias must be a highly descriptive synonym for the monitored server. It is recommended that yougroup measures on a particular machine.
For example, both WebLogic and IIS might be installed on the same computer. Both servers requiremonitoring, but the two performance measures must appear in separate menu trees.
6. Specify the port, username, and password that are appropriate for the username.
7. Click Next. The Add Rexec Measures page opens.
8. Specify the appropriate values to create the measure that you want to monitor.
Option Description
Measure type For the specified command, enter a type name. All measurements with the sametype name are assembled into one group.
Measure name Enter the measurement name for the specified rexec command. This name isdisplayed in the Performance Explorer chart.
Is an averagemeasure
Check this check box for the rexec command to be considered an averagemeasurement. This setting affects only the generation of TSD files.
Explanation Type additional information for the specified rexec command. This information isdisplayed in Performance Explorer.
Command Specify the rexec command to execute on the remote machine for data collection,such as ps -ef | egrep -c “.*”
Single execution Check this check box if you want the PDCE to connect to the remote machine andexecute the command every time a new data point is requested. With shortintervals, this setting might place some load on the remote machine. However, thePDCE does not start a new command on the remote machine if the command ofthe last interval has not finished.
By unchecking the Single execution check box, multiple execution is enabled.
Regular expr Every line of data that is returned by the remote machine is filtered by using thegiven regular expression. If the regular expression does not match a certain line,the line is discarded. Only the remaining lines are used for further steps. Bydefault, ^.*$ are entered.
28 | Performance Explorer 18.5

Option Description
For example, a command's response might appear as follows for each interval:
XXXXXXXX XXXXXXXX XXXXXXXXX 123400 103093 121092
Only the lines with numbers are of interest. The following regular expression allowsonly lines with numbers and spaces.
[1234567890 ].*
Any other lines are ignored.
Field index The line used for data generation is separated into fields. The separation isaccomplished by using either white-space characters or custom separatorcharacters.
Use this text box to specify the field index that must be converted into a numericalvalue and used as the next measurement value.
This index is a one-based index.
Separators Use this text box to specify the custom separator characters to use to separate thelines for data generation into fields.
By default, the Whitespaces are separators check box is checked.
Whitespaces areseparators
Check this check box to insert a separator for each empty space.
Lines to skip Use this text box to specify the number of lines the PDCE ignores after the start ofthe command on the remote machine. This option might be useful to filter outgarbage data that the command returns at the beginning. Only lines that match theprovided regular expression use this setting. If more than one valid line is providedfor an interval, the last line is used for data calculation.
9. Click Add.
10.Repeat the previous steps until you have entered all the commands that you require for measurecollection, then click Close. The Select displayed measures page opens.
11.Check the check boxes for those measures that you want to include in the initial monitor view and thenclick Finish.
A connection to the specified host is established, and an initial view that contains the measures youselected is displayed.
Example
Enter the command, in slightly modified form, that was used when defining multipleexecutions as follows:
while [true]; do ps -ef | egrep -c “.*”; sleep {%Interval};done
Note: The command sleep {%Interval} is a placeholderfor a number provided by Performance Explorer. This number isthe collection interval. For example, Performance Explorermight collect new data every five seconds.
A command's response might appear as follows for each interval:
XXXXXXXX XXXXXXXX XXXXXXXXX 123400 103093 121092
Performance Explorer 18.5 | 29

The Field index value specifies the column that is relevant for your defined measure. IfField index 1 is specified, the value 123400 is returned from the table. If Field index 2is specified, the value 103093 is returned.
Columns in the preceding example are separated by white spaces. However, othercharacters, such as colons, can be used. Such values are specified in the Separatorstext box. White spaces are the default separators.
Memory Free Custom Example
Consider this command for Linux machines:
cat/proc/meminfo
It returns the following table.
total: used: free: shared: buffers: cached:
Mem: 131084288
54214656 76869632 26947584 7938048 28471296
Swap: 70148096 3387392 66760704
MemTotal: 128012kB
MemFree: 75068 kB
MemShared: 26316 kB
Buffers: 7752 kB
Cached: 27804 kB
SwapTotal: 68504 kB
SwapFree: 65196 kB
The following table identifies the field values to use to obtain the value for MemFree from the precedingtable:
Command cat /proc/meminfo
Single execution Checked
Regular expr ^MemFree:.*$
Field index 2
Separators Check Whitespaces are separators
Lines to skip 0
SNMP SupportStandard SNMP support includes a generic interface for all SNMP data sources in which MIBs are present.Specific measures are accessed using a combination of object ID (OID) and instance ID (when objectshave more than one instance). The challenge with this approach is that you must know exactly whichcounter instance is to be applied. Instances are only distinguished by instance ID, not by instance name.Compounding this challenge is the fact that when servers reboot, certain instance numbers can changedue to dynamic monitoring-object creation. Therefore monitoring scripts must be able to cope with dynamicmonitoring targets.
The value of Silk Performer's enhanced SNMP support is that it allows you to access values not by OIDand instance ID, but by OID and instance name.
30 | Performance Explorer 18.5

The following example illustrates the enhanced SNMP support that is available with Silk Performer. Thisexample shows how predefined ESNMP measures are defined, how they are used, and how additionalmeasures can be added to the list of pre-defined measures.
Identifying instance IDs and OIDs
The first step in working with a predefined ESNMP measure is to identify the OID, instance ID, andinstance name of a WebLogic counter. The JDBC Connection Pool Runtime Active Connections CurrentCount for a certain instance is accessible with the OID:
1.3.6.1.4.1.140.625.190.1.25 + <Instance ID>
Without enhanced SNMP support, you have to provide the OID of the table containing the values and thecorrect instance ID.
JDBC Connection Pool Runtime Object Name and JDBC Connection Pool Runtime Name contain thehuman readable names of the instances and are accessible with the OIDs:
1.3.6.1.4.1.140.625.190.1.5 + <Instance ID> for “Object Names”
and...
1.3.6.1.4.1.140.625.190.1.15 + <Instance ID> for “Names”
ESNMP support provides you with the option of specifying an instance name, retrieving an instance IDusing the (object-) name table, and then getting the value for the correct counter. With ESNMPsupport, the following must be provided:
• OID of the table containing the values• Instance name• OID of the table containing the instance names
Monitoring Server Performance Through SNMP
Performance Explorer offers you the possibility of selecting the object identifiers (OIDs) of managementinformation bases (MIBs) from several sources for use as data sources for server monitoring. For example,database systems like Oracle offer extensive performance data for collection through an SNMP protocol.
1. Click Monitor Server on the Performance Explorer workflow bar. The Data Source Wizard opens inthe Select Data Sources dialog box.
2. Click the Select from predefined Data Sources option button and click Next. The System Selectiondialog box opens.
3. In the System menu tree, expand the Custom Data folder.
4. Select SNMP Data, then click Next. The Connection Parameters dialog box opens.
5. In the Connection parameters area, specify connection parameters such as the host name or IPaddress of the appropriate server system, the port number, and other data required to connect to thedata source.
You must possess access rights to the specified server, and the SNMP service must be configuredproperly on the server system.
6. Click Next. The Add SNMP Measures dialog box opens
7. Select one of the precompiled MIBs delivered with Performance Explorer or click Compile New MIB touse an MIB that was shipped with the server system.
To use the contents of an MIB with Silk Performer, the MIB must be compiled first. A number of commonMIBs are delivered in a precompiled format. You can compile a new MIB if necessary.
After you select a compiled MIB, its contents are displayed in a menu tree.
8. Click the OID in w hich you are interested and click Get Value(s). Connection to the server isestablished, and the actual data item is shown.
Performance Explorer 18.5 | 31

9. Click the corresponding data item and then click Add.
10.Repeat the previous two steps until you select all the OIDs you want.
11.Click Close. The Select Displayed Measures dialog box opens
12.Select the factors to be monitored and click Finish. A Monitor graph displays the specified elements in areal-time, color-coded, display of server performance.
Compiling a New MIB
Vendors of hardware and software systems provide information about the nature of their systems by way ormanagement information bases (MIBs). This information can be retrieved with the help of the SNMPprotocol by specifying the appropriate object identifier (OID). MIB browsers assist you in selecting theappropriate OID stored in an MIB.
1. In the Add SNMP Measure dialog box, click Compile New MIB for an MIB that has been shipped withthe server system. The Compile New MIB dialog box opens.
2. Browse for the MIB file you want to compile and click Open.
3. Click Compile. If the compilation succeeds, a new name is added to the list of compiled MIBs.
4. If the message Could not IMPORT from <name>-MIB appears, compile the MIB to which errormessage refers.
5. Click Close. The new MIB can now be used to monitor server performance through SNMP.
Defining an SNMP Data Source
To define a new data source, do not edit the REALTIME.INI file. If you do, you will lose your changeswhen you next upgrade Silk Performer. To avoid this, create a new file in the sub-folder <installationpath>\Silk\Silk Performer 15.0\Include\DataSrcWzd, for examplemyESNMP_realtime.ini. This file must contain the S= and the M= lines of your data source definition.
By searching for “WebLogic” and “ESNMP” in the REALTIME.INI file, you will find the following entries:
S= Application Server\BEA WebLogic preconfigured\SNMP, ESNMP:BEA-WEBLOGIC-MIB,
M= ESNMP:1.3.6.1.4.1.140.625.340.1.25, BEA WebLogic\JVM Runtime\HeapFreeCurrent, eAvgOnlyCounter, 0, kbytes, 0, 1, 2, 3, 4, 5, Current Heap Free, measureMatchName=Runtime Object Name;measureMatchOID=1.3.6.1.4.1.140.625.340.1.5;
M= ESNMP:1.3.6.1.4.1.140.625.340.1.30, BEA WebLogic\JVM Runtime\HeapSizeCurrent, eAvgOnlyCounter, 0, kbytes, 0, 1, 2, 3, 4, 5, Current Heap Size, measureMatchName=Runtime Object Name;measureMatchOID=1.3.6.1.4.1.140.625.340.1.5;
M= ESNMP:1.3.6.1.4.1.140.625.180.1.25, BEA WebLogic\Queue Runtime\ExecuteThreadCurrentIdleCount, eAvgOnlyCounter, 0, , 0, 1, 2, 3, 4, 5, Thread Idle Count, measureMatchName=Queue Runtime Object Name;measureMatchOID=1.3.6.1.4.1.140.625.180.1.5;
M= ESNMP:1.3.6.1.4.1.140.625.180.1.35, BEA WebLogic\Queue Runtime\PendingRequestCurrentCount, eAvgOnlyCounter, 0, , 0, 1, 2, 3, 4, 5, Current Requests, measureMatchName=Queue Runtime Object Name;measureMatchOID=1.3.6.1.4.1.140.625.180.1.5;
M= ESNMP:1.3.6.1.4.1.140.625.180.1.40, BEA WebLogic\Queue Runtime\ServicedRequestTotalCount, eAvgOnlyCounter, 0, , 0, 1, 2, 3, 4, 5, Total Requests, measureMatchName=Queue Runtime Object Name;measureMatchOID=1.3.6.1.4.1.140.625.180.1.5;
M= ESNMP:1.3.6.1.4.1.140.625.430.1.50, BEA WebLogic\WebApp Component Runtime\OpenSessionsCurrentCount, eAvgOnlyCounter, 0, , 0, 1, 2, 3, 4, 5, Open
32 | Performance Explorer 18.5

sessions, measureMatchName=Runtime Object Name;measureMatchOID=1.3.6.1.4.1.140.625.430.1.25;
M= ESNMP:1.3.6.1.4.1.140.625.430.1.55, BEA WebLogic\WebApp Component Runtime\OpenSessionsHighCount, eAvgOnlyCounter, 0, , 0, 1, 2, 3, 4, 5, Session High Count, measureMatchName=Runtime Object Name;measureMatchOID=1.3.6.1.4.1.140.625.430.1.25;
M= ESNMP:1.3.6.1.4.1.140.625.550.1.25, BEA WebLogic\Execute Queue\ThreadCount, eAvgOnlyCounter, 0, , 0, 1, 2, 3, 4, 5, Thread Count, measureMatchName=Queue Object Name;measureMatchOID=1.3.6.1.4.1.140.625.550.1.5;
The first line, which begins with S=, is the data source definition header. You only need one definitionheader per data source. So if you want to enhance the existing WebLogic ESNMP data source, you canleave the data source definition header as is.
Subsequent lines are for the individual measures:
• Following M= is the OID that is to be queried, without the instance ID (for example,1.3.6.1.4.1.140.625.190.1.25).
• Following that is the name of the measure as it will appear in the GUI. Note that back slashes are usedto create the hierarchy (for example, BEA\JDBC Connection Pool\Active Connections).
• Following that are standard entries: measure class, scale, unit, scale factor, and five unusedfields (for example, eAvgOnlyCounter, 0, , 0, 1, 2, 3, 4, 5).
• The next field is a description for tool-tip help in Performance Explorer. You might write, Currentcount of active connections in the JDBC connection pool runtime. The measurename itself can be shorter.
• The last entry is divided into two parts:
• omeasureMatchName= This is used in the data source wizard to describe the instances (forexample, JDBC Connection Pool Runtime Object Name).
• omeasureMatchOID= This is the OID of the table that contains the instance names (for example,1.3.6.1.4.1.140.625.190.1.15).
Note: The final measure name consists of the measure name given here (BEA WebLogic\JDBCConnection Pool\Active Connections) and the instance name in parenthesis.
So the key for the measure should appear as follows:
M= ESNMP:1.3.6.1.4.1.140.625.190.1.25, BEA WebLogic\JDBC Connection Pool\Active Connections, eAvgOnlyCounter, 0, , 0, 1, 2, 3, 4, 5, Current count of active connection in the JDBC connection pool runtime, measureMatchName=JDBC Connection Pool Runtime Object Name;measureMatchOID=1.3.6.1.4.1.140.625.190.1.15;
Secure Shell Performance MonitoringUse Performance Explorer to retrieve performance metrics by using a secure shell. For example, retrieveCPU-utilization or memory-utilization statistics from a SunOs system. Performance Explorer is shipped witha highly configurable performance-monitoring project that allows for the scripting of any monitors by usingthe secure shell. This process is done by driving a Silk Performer project inside Performance Explorer. Thiscapability also allows you to keep track of system performance in real time.
The Silk Performer project is located in a SilkEssential package named Ssh.sep, which is located at C:\Program Files\Silk\Silk Performer18.5\Monitors.
Monitoring Performance by Using a Secure Shell
The system that you want to monitor by using a secure shell must be running a secure shell daemon. Makesure the monitored user has permission to log on multiple times.
Performance Explorer 18.5 | 33

1. On the Real-Time Monitoring tab, in the Monitor group, click System. The Data Source wizardopens.
2. Click the Select from predefined Data Sources option button.
3. Click Next. The System selection page opens.
4. Expand the Miscellaneous folder and click Secure Shell.
5. Click Next.
The Connection parameters page opens.
6. In the Hostname text box, specify the host that you want to monitor.
7. Click Next. The Attributes Configuration page opens.
8. Define the following monitoring specific attributes:
• Username – The user to be used when logging on to a remote system by using a secure shell.• Password – The user's password.• Command(x) – The preconfigured package allows for retrieving up to five performance measures by
using secure shell as the following table shows:
Attribute Type Value
Command1 string ps -ef | egrep -c \”.*\”
Command1.Active boolean true
Command1.Column number 1
Command2 string mpstat | head -n 2 |tail -1
Command2.Active boolean true
Command2.Column number 13
9. Click OK. The Select displayed measures page opens.
10.Check the check boxes for those measures that you want to include in the initial monitor view and thenclick Finish.
A connection to the specified host is established, and an initial view that contains the measures youselected is displayed.
Example Command2
This example works for a SunOs system. The following command is sent to the server.
mpstat | head -n 2 | tail -1
This command returns a one-line response in the following format.
0 0 0 0 228 25 106 1 0 0 0 219 0 0 0 99
The attribute Command2.Column specifies which column to pass on to PerformanceExplorer for keeping track of the performance counter. In this case, it is column 13,which is the percentage of user time on a SunOs system.
Command2.Active specifies only whether this measure must be collected.
Example Command1
The following command is sent to the server.
ps -ef | egrep -c \".*\"
34 | Performance Explorer 18.5
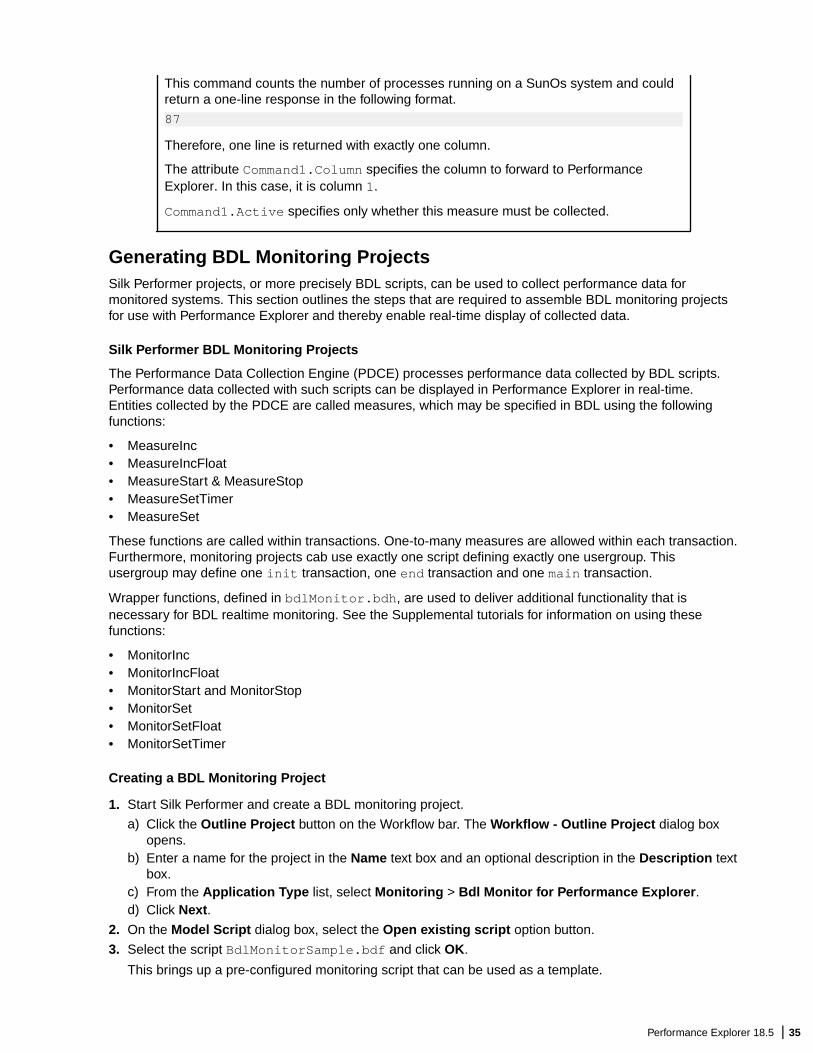
This command counts the number of processes running on a SunOs system and couldreturn a one-line response in the following format.
87
Therefore, one line is returned with exactly one column.
The attribute Command1.Column specifies the column to forward to PerformanceExplorer. In this case, it is column 1.
Command1.Active specifies only whether this measure must be collected.
Generating BDL Monitoring ProjectsSilk Performer projects, or more precisely BDL scripts, can be used to collect performance data formonitored systems. This section outlines the steps that are required to assemble BDL monitoring projectsfor use with Performance Explorer and thereby enable real-time display of collected data.
Silk Performer BDL Monitoring Projects
The Performance Data Collection Engine (PDCE) processes performance data collected by BDL scripts.Performance data collected with such scripts can be displayed in Performance Explorer in real-time.Entities collected by the PDCE are called measures, which may be specified in BDL using the followingfunctions:
• MeasureInc• MeasureIncFloat• MeasureStart & MeasureStop• MeasureSetTimer• MeasureSet
These functions are called within transactions. One-to-many measures are allowed within each transaction.Furthermore, monitoring projects cab use exactly one script defining exactly one usergroup. Thisusergroup may define one init transaction, one end transaction and one main transaction.
Wrapper functions, defined in bdlMonitor.bdh, are used to deliver additional functionality that isnecessary for BDL realtime monitoring. See the Supplemental tutorials for information on using thesefunctions:
• MonitorInc• MonitorIncFloat• MonitorStart and MonitorStop• MonitorSet• MonitorSetFloat• MonitorSetTimer
Creating a BDL Monitoring Project
1. Start Silk Performer and create a BDL monitoring project.
a) Click the Outline Project button on the Workflow bar. The Workflow - Outline Project dialog boxopens.
b) Enter a name for the project in the Name text box and an optional description in the Description textbox.
c) From the Application Type list, select Monitoring > Bdl Monitor for Performance Explorer.d) Click Next.
2. On the Model Script dialog box, select the Open existing script option button.
3. Select the script BdlMonitorSample.bdf and click OK.
This brings up a pre-configured monitoring script that can be used as a template.
Performance Explorer 18.5 | 35

4. Select Project > Project Attributes to define the project attributes.
Each measure exported to Performance Explorer requires a fixed set of project attributes.
To be viewed with Performance Explorer, each measure requires at least these three project attributes:
• Name: Name to be shown in Performance Explorer• Type: An average value or a cumulative value.• Enabled: Reserved. Always set to true.
5. Review the sample monitor script
As specified in the project attributes, the project exports two measures that can be viewed inPerformance Explorer in real-time.
Look for MonitorInc and MonitorIncFloat in the TMon transaction. This is where the last snapshotis handed over to Performance Explorer.
use "bdlMonitor.bdh"
const nMeasure1 := 1; nMeasure2 := 2;
dclrand rRand : RndExpN (1..10000: 100.000000); rRandf : RndExpF (5.500000);
var fScale : float; dcluser user VMon transactions TInit : begin; TMon : 1; TEnd : end; dcltrans transaction TInit begin fScale := AttributeGetDouble("scale"); end TInit;
transaction TMon var n : number; f : float; begin n := rRand; MonitorInc(1, n); f := rRandf; f := f * fScale; MonitorIncFloat(2, f); end TMon;
6. Edit the .conf file.
The sample .conf file is available in the Project tree under the Data Files node. Double-clickthe .conf file to open it and change the value of the Type entry. This indicates where in thePerformance Explorer hierarchy the project is to be located. For example, use <Type>Monitoring\Sample Project</Type> to locate the monitoring project in Performance Explorer under Monitor >Add DataSource > Predefined data sources at the location Monitoring\Sample Project.
36 | Performance Explorer 18.5

7. Export the project to a single ZIP archive.
Choose File > Export Project. Check the Zip to single archive file check box.
For the Export location, set C:\Program Files\Silk\Silk Performer <version>\Monitors\BdlMonitorSample.sep.
Note: Save the file with an .sep extension.
8. Start a Realtime BDL Monitoring Project
a) Start Performance Explorer. On the Monitoring tab, in the Monitor group, click System. Select theSelect from predefined Data Sources option button and click Next.
b) Select the newly created monitoring project (for example, Monitoring > Sample Project) and clickNext.
c) Enter the name of the host that is to be monitored (select localhost or the host recommended byPerformance Explorer and click Next).
This brings up a dialog on which project attributes can be modified (only one attribute can bemodified in this instance).
d) Enter a value greater than 0. This value will be used in the monitoring project. See the sample scriptfor details.
e) Click OK. This brings up a choice of measures specified in the BDL monitoring project.f) Select both measures and click Finish. This launches the monitoring project. The values can now be
seen in real-time using a monitoring graph.
Creating a Silk Performance Manager Infrastructure Monitor
1. Click File > New Project or click Start here on the workflow bar if no project is open. The Workflow -Outline Project dialog opens.
2. Enter a Name and optionally a Description.
3. From the list of application types, select Monitoring > Performance Manager - Infrastructure Monitorand click Next. Performance Explorer opens and the Data Source Wizard displays.
4. Follow the wizard to select a data source. A monitor chart displays and the monitoring automaticallystarts.
5. On the Real-Time Monitoring tab, in the Export group, click As Project.
6. Follow the Reuse Monitor Wizard to export the monitor chart.
7. Specify the settings on the Upload Project dialog and click OK.
Performance Data Collection Engine (PDCE)
The Performance Data Collection Engine (PDCE) is a module inside the Performance Explorer engine thatis used for querying monitoring data in real-time. Its functionality can alternately be accessed through theBenchmark Description Language (BDL). The BDL interface for the PDCE is described in the pdce.bdhinclude file.
Each of the measurements that Performance Explorer monitors can alternately be monitored via SilkPerformer using BDL scripts. After registering measurements of interest, a monitoring data set can beretrieved from the PDCE via the provided polling functions (PDCE API). These functions provide data,status information, and descriptions of the measurements (if available).
Tutorial
This tutorial consists of two use cases: (1) a simple use case to get you started and (2) an advanced usecase. The first use case involves a monitor project that consists of one user group with a single transactionand a single measure.
The second use case illustrates how to have several user groups, transactions, and measures in a singleproject.
Performance Explorer 18.5 | 37

Basic Use Case
In this use case you will create a project that keeps track of the number of processes running on a SunOs.SunOs can usually be accessed through remote execution. Compare with the Win2000 command line toolrexec. To count the number of processes running on a SunOs, execute 'ps -ef | egrep -c ".*"'within an X-Terminal, Telnet session, rexec, or other preferred tool. For example, at a DOS prompt type: c:\>rexec yourSunHost -l username "ps -ef | egrep -c \".*\""
This returns the number of processes running on your SunHost. The goal here is to continuously track anddisplay this value in a Performance Explorer real-time chart.
Creating a New Project
Create a new project of application type Monitoring/Bdl Monitor for Performance Explorer asexplained earlier in this section. Enter a simple project description that reflects the overall purpose of themonitoring project to be displayed in Performance Explorer - for example, "A powerful project used tocollect the number of running processes on SunOs systems."
Planning Project Attributes
Begin by entering a name for the measure in the project attributes, for example CountNrOfProcesses.This name will also be used in the Performance Explorer hierarchy. A hierarchy is introduced with '\'.
For example, to create this hierarchy:
OS Processes CountNrOfProcesses Another Counter
Specify the name of the measure as SunOs\Processes\CountNrOfProcesses.
This will be an AvgCounter (for average) counter and it should be collected by default.
These values must be transferred into the project's attributes. Open the attribute editor by choosing Project> Project Attributes.
38 | Performance Explorer 18.5

The values in the project attributes identify a single measure. Several attributes (lines in the dialog) may berequired to create a measure however. For example, all entries beginning with #BDLMonitor1 in the aboveexample. This is how settings are defined for a measure.
The measure is now defined with a name, a type, and the setting Enabled. A second measure will beginwith #BDLMonitor2 (covered in the Advanced Use Case).
Creating a BDL Monitoring Script
To remotely execute certain command line tools in BDL, for example "ps" on a SunOs, three functions arerequired:
• Connect to a remote machine's "exec" server.• Send the command, to be executed on the remote machine.• Close the connection
// hCon will be assigned the connection handlefunction Connect(/*inout*/hCon : number; sHost : string)begin WebTcpipConnect(hCon, sHost, 512); end Connect;
// Send a request to the remote execution server// remote execution protocol: // What does a request look like in binary:// 00username00password00shellCommandToExecute00// What does the response look like// 00responseData// sample request:// 00root00labpass00ps -ef | egrep -c ".*"00function Request(hCon: number; sUser: string; sPwd: string; sCmd: string):numbervar
Performance Explorer 18.5 | 39

sSend : string; sBuf : string; nSize : number; nRec : number;begin sSend := "\h00"; SetString(sSend, 2, sUser); SetString(sSend, Strlen(sUser) + 3, sPwd); SetString(sSend, Strlen(sUser) + Strlen(sPwd) + 4, sCmd); nSize := 3 + Strlen(sUser) + Strlen(sPwd) + Strlen(sCmd) + 1; WebTcpipSendBin(hCon, sSend, nSize); WebTcpipRecvExact(hCon, NULL, 1); WebTcpipRecv(hCon, sBuf, sizeof(sBuf), nRec); Request := number(sBuf);end Request;
// Closes the connection to the remote exec serverfunction Close(hCon : number)begin WebTcpipShutdown(hCon); end Close;
A function wrapper is needed around the Silk Performer MeasureInc functions. This function can be usedin all monitoring projects. A function named MonitorInc is created to access project attributes. Thisfunction accesses the attributes you specified earlier.
The MonitorInc function can also be imported from an existing bdh, bdlMonitor.bdh.
function MonitorInc(nMon : number; nVal : number)var sMeasure : string;begin // This will check whether the attribute // "#BDLMonitor1.Enabled" was set to true if AttributeGetBoolean("#BDLMonitor" + string(nMon) + ".Enabled") then // If yes then let's read the name of the measure. // To do this we read the the project attribute // "#BDLMonitor1.Name" and store it // to a local variable named sMeasure. // sMeasure will have the value: // "SunOs\Processes\CountNrOfProcesses" AttributeGetString("#BDLMonitor" + string(nMon) + ".Name", sMeasure, sizeof(sMeasure)); // Set a new value for // "SunOs\Processes\CountNrOfProcesses" MeasureInc(sMeasure, nVal, MEASURE_KIND_AVERAGE); end;end MonitorInc;
Now the transaction that will take the snapshot using all the functions that have been defined can becoded. This transaction also accesses the project file attributes. The goal is to later have these attributesset in Performance Explorer. For now however, to ensure that the script works, four attributes need to beadded to the project attributes.
Note: Attribute names are case sensitive.
• host: Assign it a sample value, for example sunserver• command: Assign it a sample value, for example ps -ef | egrep -c ".*"
40 | Performance Explorer 18.5

• user: Assign a sample value, for example root• password: Assign a sample value for testing purposes
Open the project attributes editor by choosing Project > Project Attributes and add these additionalattributes. All are of type string except for the attribute password which is type password. Assign values tothe attributes for testing purposes. Choose a description for each attribute that conveys the purpose of theattribute.
const nMeasure := 1;
dcluser user VMonitor transactions TSnap : 1;
dclfunc.... // your functions here
dcltrans transaction TSnap var hCon : number init 0; sHost : string; sCmd : string; sUser : string; sPwd : string; nVal : number; begin AttributeGetString("host", sHost, sizeof(sHost)); AttributeGetString("command", sCmd, sizeof(sCmd)); AttributeGetString("user", sUser, sizeof(sUser)); AttributeGetString("password", sPwd, sizeof(sPwd)); Connect(hCon, sHost); nVal := Request(hCon, sUser, sPwd, sCmd); MonitorInc(nMeasure, nVal); Close(hCon); end TSnap;
The project now consists of the newly created script. Save the project and verify that it works by initiating aTryScript run. Have nVal printed or written to a log file to verify that the script works. If the script works,save and close the project.
Packaging the BDL Monitoring Script
To export the project as a single ZIP file, go to File > Export Project. Check the zip to single archivecheck box and export the file to C:\Program Files\Silk\Silk Performer 10.0\Monitors\CountProcess.sep. (Note the .sep extension).
Before the .sep file can be used with Performance Explorer the .conf file for the .sep must be modified.The .conf file looks like this:
<?xml version='1.0' encoding='UTF-8'?><Project> <Type>Sample\Remote</Type> <Copyright>Borland</Copyright> <Author>Borland</Author> <Version>5.1</Version></Project>
For the type setting, specify a hierarchy separated by "\". This hierarchy will be reflected in PerformanceExplorer.
Performance Explorer 18.5 | 41

Using the Monitoring Project inside Performance Explorer
1. Launch Performance Explorer. On the Real-Time Monitoring tab, in the Monitor group, click System.Select the Select from predefined Data Sources option button and click Next.
2. Select the newly created monitoring project and click Next.
3. Specify the host that is to be monitored, preferably a machine running SunOs. Click Next to bring up adialog for setting project attributes. This dialog displays the attributes that you set (except for the hostwhich was specified previously).
Therefore, the dialog displays the following attributes:
• user• password• command
4. Select the measures (in this case only a single measure) and click OK. The measures are thenimmediately handed over to the data collection mechanism.
Advanced Use Case
This use case includes a project with two user groups, the user group from the previous use case and anew user group that measures HTTP requests. The two URLs and host are configurable through projectattributes.
Creating a Silk Performer Project
Enter a simple project description that is to be displayed in Performance Explorer. The description shoulddescribe the overall purpose of the monitoring project. For example, a powerful project used forcollecting the number of running processes on SunOs systems and measuring twoconfigurable HTTP requests.
Planning Project Attributes
For this tutorial you will plan three measures. Pick measure names that indicate the hierarchy and purposeof the measures. In this example, a measure counts the number of processes on a SunOs system andincludes two measures that measure HTTP requests (Performed using WebUrl):
• SunOs\Processes\CountNrOfProcesses• SunOs\Http Server\URI1• SunOs\Http Server\URI2
The intended hierarchy will then look like the following:
SunOs Processes CountNrOfProcesses Http Server URI1 URI2
A BDL script with two user groups and two transactions is written. See the table below to see howmeasures are assigned to transactions and how transactions relate to user groups.
User Group Transaction Measure
VMonitor TSnap CountNrOfProcesses
VWebMon TWebSnap URI1
VWebMon TWebSnap URI2
42 | Performance Explorer 18.5

With projects that include numerous transactions and/or user groups, measures must be specified with thecorresponding user group and assigned measure. This differs from the basic use case outlined previously,which involved only one transaction and one user group.
Open the project attributes editor at Projects > Project Attribute and enter the following data:
Name Type Value
#BDLMonitor1.Name string SunOs\Processes\CountNrOfProcesses
#BDLMonitor1.Type string AvgCounter
#BDLMonitor1.Enabled boolean True
#BDLMonitor1.Script string remote.bdf
#BDLMonitor1.Usergroup string VMonitor
#BDLMonitor1.Transaction string TSnap
#BDLMonitor2.Name string SunOs\Http Server\URI1
#BDLMonitor2.Type string AvgCounter
#BDLMonitor2.Enabled boolean true
#BDLMonitor2.Script string remote.bdf
#BDLMonitor2.Usergroup string VWebMon
#BDLMonitor2.Transaction string TWebSnap
#BDLMonitor3.Name string SunOs\Http Server\URI2
#BDLMonitor3.Type string AvgCounter
#BDLMonitor3.Enabled boolean True
#BDLMonitor3.Script string remote.bdf
#BDLMonitor3.Usergroup string VWebMon
#BDLMonitor3.Transaction string TWebSnap
host sunserver sunserver
command string ps -ef | egrep -c ".*"
user string root
password password ***********
URI1 string /
URI2 string /manual/ibm/index.html
Creating a BDL Monitoring Script
To remotely execute certain command line tools in BDL, for example "ps" on a SunOs, three functions arerequired:
• Connect to a remote machine's "exec" server.• Send the command, to be executed on the remote machine.• Close the connection
// hCon will be assigned the connection handlefunction Connect(/*inout*/hCon : number; sHost : string)begin WebTcpipConnect(hCon, sHost, 512); end Connect;
Performance Explorer 18.5 | 43

// Send a request to the remote execution server// remote execution protocol: // What does a request look like in binary:// 00username00password00shellCommandToExecute00// What does the response look like// 00responseData// sample request:// 00root00labpass00ps -ef | egrep -c ".*"00function Request(hCon: number; sUser: string; sPwd: string; sCmd: string):numbervar sSend : string; sBuf : string; nSize : number; nRec : number;begin sSend := "\h00"; SetString(sSend, 2, sUser); SetString(sSend, Strlen(sUser) + 3, sPwd); SetString(sSend, Strlen(sUser) + Strlen(sPwd) + 4, sCmd); nSize := 3 + Strlen(sUser) + Strlen(sPwd) + Strlen(sCmd) + 1; WebTcpipSendBin(hCon, sSend, nSize); WebTcpipRecvExact(hCon, NULL, 1); WebTcpipRecv(hCon, sBuf, sizeof(sBuf), nRec); Request := number(sBuf);end Request;
// Closes the connection to the remote exec serverfunction Close(hCon : number)begin WebTcpipShutdown(hCon); end Close;
A function wrapper is needed around the Silk Performer MeasureInc functions. This function can be usedin all monitoring projects. A function named MonitorInc is created to access project attributes. Thisfunction accesses the attributes you specified earlier.
The MonitorInc function can also be imported from an existing bdh, bdlMonitor.bdh.
function MonitorInc(nMon : number; nVal : number)var sMeasure : string;begin // This will check whether the attribute // "#BDLMonitor1.Enabled" was set to true if AttributeGetBoolean("#BDLMonitor" + string(nMon) + ".Enabled") then // If yes then let's read the name of the measure. // To do this we read the the project attribute // "#BDLMonitor1.Name" and store it // to a local variable named sMeasure. // sMeasure will have the value: // "SunOs\Processes\CountNrOfProcesses" AttributeGetString("#BDLMonitor" + string(nMon) + ".Name", sMeasure, sizeof(sMeasure)); // Set a new value for // "SunOs\Processes\CountNrOfProcesses" MeasureInc(sMeasure, nVal, MEASURE_KIND_AVERAGE); end;end MonitorInc;
44 | Performance Explorer 18.5

Now the transaction that will take the snapshot using all the functions that have been defined can becoded. This transaction also accesses the project file attributes. The goal is to later have these attributesset in Performance Explorer. For now however, to ensure that the script works, four attributes need to beadded to the project attributes.
Note: Attribute names are case sensitive.
• host: Assign it a sample value, for example sunserver• command: Assign it a sample value, for example ps -ef | egrep -c ".*"• user: Assign a sample value, for example root• password: Assign a sample value for testing purposes
Open the project attributes editor by choosing Project > Project Attributes and add these additionalattributes. All are of type string except for the attribute password which is type password. Assign values tothe attributes for testing purposes. Choose a description for each attribute that conveys the purpose of theattribute.
const nMeasure := 1;
dcluser user VMonitor transactions TSnap : 1;
dclfunc.... // your functions here
dcltrans transaction TSnap var hCon : number init 0; sHost : string; sCmd : string; sUser : string; sPwd : string; nVal : number; begin AttributeGetString("host", sHost, sizeof(sHost)); AttributeGetString("command", sCmd, sizeof(sCmd)); AttributeGetString("user", sUser, sizeof(sUser)); AttributeGetString("password", sPwd, sizeof(sPwd)); Connect(hCon, sHost); nVal := Request(hCon, sUser, sPwd, sCmd); MonitorInc(nMeasure, nVal); Close(hCon); end TSnap;
The project now consists of the newly created script. Save the project and verify that it works by initiating aTryScript run. Have nVal printed or written to a log file to verify that the script works. If the script works,save and close the project.
Packaging the Project
Export the project to a single ZIP file. Go to File > Export Project. Check Zip to single archive andexport the file to C:\Program Files\Silk\Silk Performer\Monitors\Advanced.sep (note theSEP file extension).
Performance Explorer 18.5 | 45

Before the SEP file can be used with Performance Explorer, the CONF file for the SEP must be modified.The CONF file appears as:
<?xml version='1.0' encoding='UTF-8'?><Project> <Type>Sample\Advanced\HttpHit</Type> <Copyright>Borland</Copyright> <Author>Borland</Author> <Version>5.1</Version></Project>
For the type setting, specify a hierarchy that is to be reflected in Performance Explorer, separated bybackward slashes ("\").
Using the Monitoring Project in Performance Explorer
1. Start Performance Explorer. On the Real-Time Monitoring tab, in the Monitor group, click System.Choose Select from predefined Data Sources.
2. Select the newly created monitoring project and click Next.
3. Enter the name of the server that is to be monitored. For example, enter sunserver and click Next. Adialog box appears. Define the following attributes:
• command: As with the basic test case you set up earlier in this tutorial, a command that counts thenumber of processes.
• user: A valid user account for accessing the remote machine.• password: The password.• URI1: The URI where response time is to be measured.• URI2: A second URI where response time is to be measured.
4. Select the measures (in this case there is only one) and click OK. The measures are immediatelyhanded over to the data collection mechanism. The choice corresponds to the hierarchy defined in theproject attributes.
Best Practices
This section outlines suggestions for working with real-time monitoring projects as relates to the writing ofmonitoring scripts.
Loops
Performance Explorer executes transactions that run snapshots at regular intervals. For example, asnapshot transaction might be executed every 10 seconds. In such a case, Performance Explorer assumesthat the entire transaction is executed within this one interval. Otherwise Performance Explorer returns awarning stating that it can not collect the interval's snapshot.
Do not use endless loops such as the following:
// Forbiddentransaction TSnapbegin while true do Snap(); end;end TSnap;
ThinkTimes and Wait
Be careful with wait statements. Think-times are ignored. A monitoring transaction must be executed withina given interval. Wait statements block execution and transactions may not return on time.
46 | Performance Explorer 18.5

Example
// Forbiddentransaction TSnapbegin wait 500000.0;end TSnap;
Initialization
Do not place function calls in TInit transactions that may stop runtime. For example, OraLogon maygenerate a ProcessExit on a failed logon. Performance Explorer will not catch this message and willassume that the project is still running. Of course, Performance Explorer will report that it cannot gatherdata, but it will not be able to report why this is happening.
Other Best Practices
Name Length
Attribute value lengths must not exceed 79 characters.
Performing a Try Script run for the Project
Execute a Try Script run to verify that the project is working before you create an SEP file.
Special Project Attributes
The monitoring-project attribute host can be accessed within BDL scripts using the following function call:AttributeGetString("host", sHost, sizeof(sHost));
Instead of host, an attribute called #MonitorHost may also be queried. Those two attributes are treatedequally.
In Performance Explorer the value for this attribute is set using the following dialog:
Monitoring Data SourcesBefore you can start monitoring a system with Performance Explorer, you need to specify the system andthe measures. There are two ways to do so:
• You can select a predefined data source.
Performance Explorer provides predefined data sources for the most popular web servers, applicationservers, database servers, and operating systems. You are not restricted to using only these datasources. These data sources are included to speed the selection process for measures that are to bemonitored.
• You can use the data source scanner to detect data sources.
The Data Source Scanner checks your system for a variety of data sources that are commonly found ona range of platforms and returns a list of available data sources.
To specify a system, click System in the Monitor group on the Real-Time Monitoring tab and follow thewizard.
Predefined Data SourcesThis page lists the predefined data sources that are available with Performance Explorer and outlinesspecific installation and configuration requirements for each server type that Performance Explorer canmonitor.
Performance Explorer 18.5 | 47
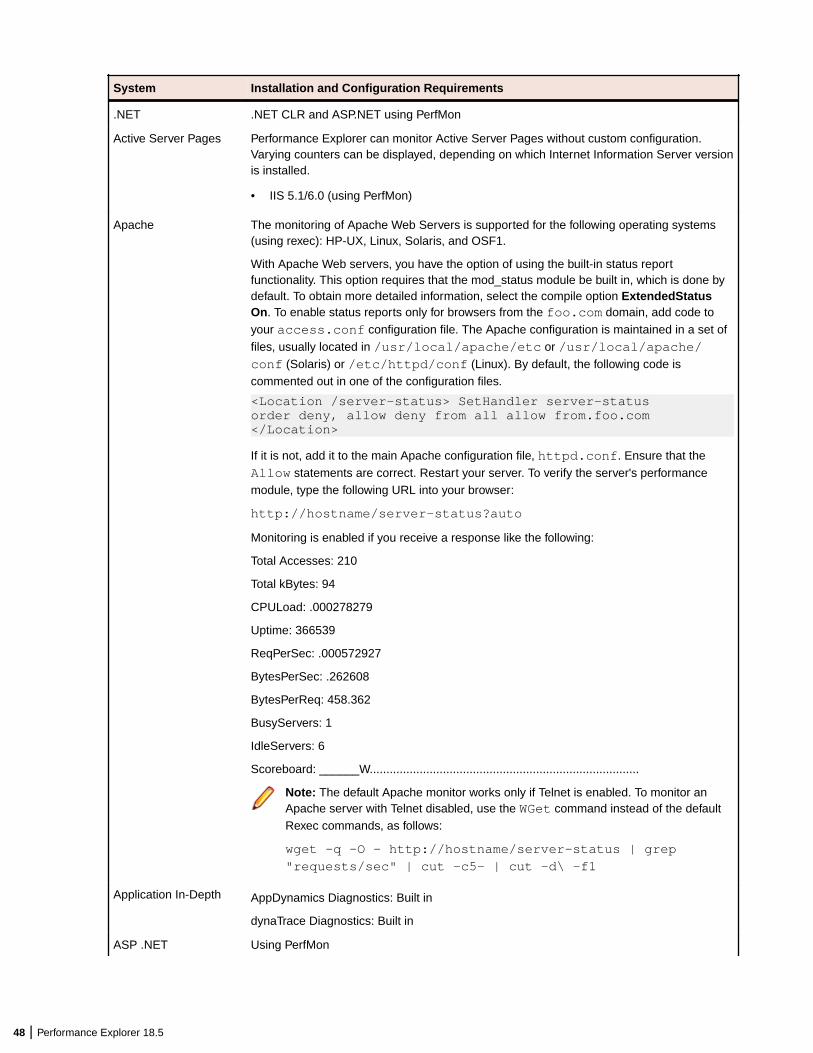
System Installation and Configuration Requirements
.NET .NET CLR and ASP.NET using PerfMon
Active Server Pages Performance Explorer can monitor Active Server Pages without custom configuration.Varying counters can be displayed, depending on which Internet Information Server versionis installed.
• IIS 5.1/6.0 (using PerfMon)
Apache The monitoring of Apache Web Servers is supported for the following operating systems(using rexec): HP-UX, Linux, Solaris, and OSF1.
With Apache Web servers, you have the option of using the built-in status reportfunctionality. This option requires that the mod_status module be built in, which is done bydefault. To obtain more detailed information, select the compile option ExtendedStatusOn. To enable status reports only for browsers from the foo.com domain, add code toyour access.conf configuration file. The Apache configuration is maintained in a set offiles, usually located in /usr/local/apache/etc or /usr/local/apache/conf (Solaris) or /etc/httpd/conf (Linux). By default, the following code iscommented out in one of the configuration files.
<Location /server-status> SetHandler server-status order deny, allow deny from all allow from.foo.com </Location>
If it is not, add it to the main Apache configuration file, httpd.conf. Ensure that theAllow statements are correct. Restart your server. To verify the server's performancemodule, type the following URL into your browser:
http://hostname/server-status?auto
Monitoring is enabled if you receive a response like the following:
Total Accesses: 210
Total kBytes: 94
CPULoad: .000278279
Uptime: 366539
ReqPerSec: .000572927
BytesPerSec: .262608
BytesPerReq: 458.362
BusyServers: 1
IdleServers: 6
Scoreboard: ______W.................................................................................
Note: The default Apache monitor works only if Telnet is enabled. To monitor anApache server with Telnet disabled, use the WGet command instead of the defaultRexec commands, as follows:
wget -q -O - http://hostname/server-status | grep"requests/sec" | cut -c5- | cut -d\ -f1
Application In-Depth AppDynamics Diagnostics: Built in
dynaTrace Diagnostics: Built in
ASP .NET Using PerfMon
48 | Performance Explorer 18.5

System Installation and Configuration Requirements
BEA WebLogic 8.x, 9.x,10.x, 11.x
Performance Explorer can monitor WebLogic 8.x, 9.x, 10.x, and 11.x servers. Formonitoring BEA WebLogic 8.x and 9.0 - 9.1, the JNDI protocol is used to connect by way ofthe Management EJB (MEJB) to the MBean Server. For versions 9.2 and higher, JSR-160over IIOP is used. Default connection parameters are preconfigured in PerformanceExplorer.
Support for WebLogic Server 11.x includes the following:
• WebLogic Server 11g (10.3.1)
• WebLogic Server 11gR1 PS1 (10.3.2)
• WebLogic Server 11gR1 PS2 (10.3.3)
• WebLogic Server 11gR1 PS3 (10.3.4)
Performance Explorer needs to know the application server installation directory or haveaccess to a copy of it to build the correct classpath.
A JMX browser allows the selection of the MBean attributes to monitor. An Easy JMXprofile can be used to preselect interesting MBeans.
Also using SNMP.
Borland ApplicationServer 6.6
Performance Explorer can monitor Borland Application Server 6.6 by way of JSR-160standard by using the Corbaloc protocol over IIOP. The application server must beconfigured to allow access to the MBean Server by way of IIOP.
Performance Explorer needs to know the application server installation directory or haveaccess to a copy of it to build the correct classpath.
A JMX browser allows the selection of the MBean attributes to monitor. An Easy JMXprofile can be used to preselect interesting MBeans.
Certain MBeans do not function properly without applying patch 7697 to BorlandApplication Server.
Custom data • JMX Data
• NT Performance Monitor Data
• Rexec Data
• SNMP Data
F5 Labs 3DNS Using SNMP
Helix Server Using PerMon
IBM Universal DatabaseDB2
Using Snapshot
IBM UniversalDatabaseDB2 7.1
Using PerfMon
IBM WebSphereApplication Server 6.1
Performance Explorer can monitor WebSphere Server without custom configuration of theapplication server.
JNDI protocol is used to connect by way of the Management EJB (MEJB) to the MBeanServer. Default connection parameters are preconfigured in Performance Explorer.
Performance Explorer needs to know the application server installation directory or haveaccess to a copy of it to build the correct classpath. Performance Explorer needs to use thesame IBM JVM version for monitoring.
A JMX browser allows the selection of the MBean attributes to monitor.
JMX monitoring of WebSphere requires that you specify an IBM JDK.
Performance Explorer 18.5 | 49

System Installation and Configuration Requirements
IBM WebSphereApplication Server 7.0,8.0, 8.5
Performance Explorer can monitor WebSphere Servers without custom configuration of theapplication server. This does not apply to WebSphere Server 7.0 with enabledadministrative security and inbound CSIv2 transport layer. In such a case SSL is required.For details, see the table below.
The JSR-160/Plain IIOP protocol is used to connect by way of the Management EJB(MEJB) to the MBean Server. Default connection parameters are preconfigured inPerformance Explorer.
Performance Explorer needs to know the application server installation directory or needsto have access to a copy of it to build the correct classpath and to set additional JVMparameters correctly.
JMX monitoring of WebSphere requires that you specify an IBM JDK with the sameversion. If your WebSphere server has disabled administrative security or enabledadministrative security and the inbound CSIv2 transport layer is TCP/IP, you can specify aSUN JDK.
A JMX browser allows for the selection of MBean attributes for monitoring.
Internet InformationServer 5.1, 6.0, 7.0, 7.5
Performance Explorer can monitor IIS Web servers without custom configuration.
SNMP is supported only with a custom monitoring configuration. Windows NT SNMPService must be installed before the IIS Web server is installed.
JBoss 4, 5, 6, 7 Performance Explorer can monitor JBoss 4, 5, 6, and 7 Server without customconfiguration of the application server. JNDI protocol is used to connect by way of theManagement EJB (MEJB) to the MBean Server. Default connection parameters arepreconfigured in Performance Explorer. Performance Explorer needs to know theapplication server installation directory or have access to a copy of it to build the correctclasspath. A JMX browser allows the selection of the MBean attributes to monitor. TwoEasy JMX profiles can be used to preselect interesting MBeans.
To access your JBoss 5, 6 or 7 server remotely, JBoss must not point to the default location127.0.0.1, it must point to your server's external IP address. To point JBoss to theexternal IP address, proceed as follows:
JBoss 5 In run.conf.bat of your JBoss application server, add the followingsetting: set "JAVA_OPTS=%JAVA_OPTS% -Djboss.bind.address=<your server's external IP>
JBoss 6 Start your JBoss application server from the command line with the commandrun.bat -b 0.0.0.0
JBoss 7 Start your JBoss application server from the command line with the commandStandalone.bat -b 0.0.0.0 -Djboss.bind.address.management=<your server'sexternal IP>
Micro Focus EnterpriseServer
Performance Explorer can monitor Micro Focus Enterprise Server without customconfiguration of the application server.
Note: Monitoring support is available for Windows platforms only.
When setting up your Micro Focus Enterprise Server monitoring project, from the DataSource Wizard, select Micro Focus > Micro Focus Enterprise Server > System(perfmon).
On the Connection Parameters dialog, click Attributes Configuration to open theAttributes Configuration dialog.
50 | Performance Explorer 18.5

System Installation and Configuration Requirements
• In the #Perfmon.User - Value field, enter a Windows user name for the server to bemonitored.
• In the #Perfmon.Password - Value field, enter the corresponding password.
• In the #Perfmon.Domain - Value field, enter the domain of the server to be monitored.
• In the #Region.Name - Value field, enter the name of the region or the server name.
Microsoft Proxy Server2.0
Microsoft Proxy Servers are monitored by the Performance Monitor.
No special configuration is required.
Operating System Data Operating system data can be monitored for the following platforms:
• Windows
• Windows XP/2003
• Windows 7/Vista/2008
• Linux
• System (rexec:vmstat)
• System (rstat)
• System (ucd snmp)
• Solaris
• System (rexec:mpstat)
• System (rexec:vmstat/iostat/df)
• System (rstat)
• HP-UX
• System (rexec:vmstat/iostat)
• System (rstat)
• AIX (using rstat)
• Unix (using rstat)
• OSF1
• System (rexec:vmstat/iostat)
• System (rstat)
If available on the host, information such as processor utilization, disc usage, swap fileutilization, and network packets can be monitored.
On Microsoft systems, operating system data is monitored by the Performance Monitor. ForUNIX systems, a remote execution daemon must be running. Such daemons run on UNIXsystems by default.
Note:
When fetching values using Rexec:vmstat, there can be cases in whichPerformance Explorer reflects the values of other measures. This can be caused byVMSTAT on a particular server returning values to an unexpected column.
The columns in which Performance Explorer expects to receive values fromVMSTAT are defined in realtime.ini (C:\Program Files\Silk\SilkPerformer18.5\Include). You may edit the column values in this file toproperly capture the values of desired measures.
For example, your server might return values for System\CPU Usage Systemin column 13, while Operating System Data\Linux\System
Performance Explorer 18.5 | 51

System Installation and Configuration Requirements
(rexec:vmstat) uses column 14 for System\CPU Usage System. Tocorrect this behavior, you must edit realtime.ini.
Oracle Using SNMP and v$sysstat
Oracle 9, 10, 11, 12 Using PerfMon
Performance Explorer can monitor Oracle 9, 10, 11, and 12 servers without customconfiguration. However, Oracle counters for Windows Performance Monitor are not installedwith the default Oracle installation options and need to be made available in the custominstallation options. Refer to the Oracle Performance Monitoring section in the PerformanceExplorer Help for detailed information on monitoring Oracle servers.
Oracle ApplicationServer 10.1.3
Performance Explorer can monitor Oracle Application Server 10.1.3 without customconfiguration of the application server.
JNDI protocol is used to connect by way of the Management EJB (MEJB) to the MBeanServer. Default connection parameters are preconfigured in Performance Explorer.
Performance Explorer needs to know the application server installation directory or haveaccess to a copy of it to build the correct classpath.
A JMX browser allows the selection of the MBean attributes to monitor. An Easy JMXprofile can be used to preselect interesting MBeans.
Oracle FormsApplication Server
PeopleSoft • Application Server (BEA Tuxedo)
• Database System
• IBM Universal Database DB2 (using snapshot)
• Oracle (using v$sysstat)
• Operating System
• AIX (using ssh)
• HPUX (using ssh)
• Solaris (using ssh)
• Process Scheduler
• Oracle
• SQL Server 2000
• Web Server
• Apache
• BEA WebLogic (using SNMP)
SAP and SAP V7 SAPGUI Monitoring, SAPGUI OS-Monitoring
Secure Shell
Silk Central 2008, 2008R2, 2009, 2009 R2,2010, 2010 R2, 2011
Application server and front-end server
Silk Performer 18.5controller
The performance metrics in this section are related to the currently running load test, inparticular the health values such as memory, CPU or responsiveness, represent the worsevalues over all agents
52 | Performance Explorer 18.5

System Installation and Configuration Requirements
Silk Performer 18.5agent
The performance metrics in this section are related to the currently running load test fromthe perspective of the selected agent
SQL Server 7.0, 2000,2005, 2008, 2008 R2
Using PerfMon
The most significant versions of SQL Server can be monitored with the PerformanceMonitor.
No special configuration is required, but make sure that all Performance Monitor countersare enabled on the server that hosts your SQL Server.
SUN JVM 1.5, 1.6, and1.7
Using EJMX and JMX MBeanServer
Performance Explorer can monitor SUN JVM 1.5, 1.6, and 1.7 by way of JSR-160 standardusing the RMI protocol. Any application or application server using the platform MBeanServer can be monitored in this way. No custom configuration is necessary.
A JMX browser allows the selection of the MBean attributes to monitor. An Easy JMXprofile can be used to preselect interesting MBeans.
Terminal Services Using PerfMon
VMware ESX Serverpreconfigured
Using SNMP
Windows MediaServices
Using PerfmMon
Security settings
WebSphere Version
Disabledadministrativesecurity
Enabledadministrativesecurity. InboundCSIv2 TransportLayer = TCP/IP
Enabledadministrativesecurity. InboundCSIv2 TransportLayer = SSL-supported
Enabledadministrativesecurity. InboundCSIv2 TransportLayer = SSL-required
7.0.0.27 + + + - *
8.0.0.5 + + + +
8.5.0.1 + + + +
*) There is successful connection but not all MBeans are acessible.
Enabling Monitoring for Apache Servers
With Apache Web servers, you have the option of using the built-in status report functionality. Thisfunctionality requires that a mod_status module be built in, which is done by default.
1. Click the ExtendedStatus On option button to view more detailed information.
2. Add code to the configuration file access.conf to enable status reports only for browsers from thefoo.com domain.
The Apache configuration is maintained in a set of files typically located in /usr/local/apache/etcor /usr/local/apache/conf (Solaris) or /etc/httpd/conf (Linux).
3. Add the following code to the main Apache configuration file, httpd.conf.
<Location /server-status> SetHandler server-statusorder deny, allow deny from all allow from .foo.com</Location>
If this code already exists but is commented out, un-comment it.
Performance Explorer 18.5 | 53

Note: For monitoring to function appropriately, all allow statements must be correct.
4. Restart your server.
5. To verify the server's performance module, type the URL http://<hostname>/server-status?auto into your browser. Monitoring is enabled if you receive a response like the following message:Total Accesses: 210 Total kBytes: 94 CPULoad: .000278279 Uptime: 366539 ReqPerSec: .000572927BytesPerSec: .262608 BytesPerReq: 458.362 BusyServers: 1 IdleServers: 6 Scoreboard:______W.................................................................................
Note: The default Apache monitor works only if Telnet is enabled. To monitor an Apache serverwith Telnet disabled, use the WGet command instead of the default Rexec commands, as thefollowing example shows.
wget -q -O - http://<hostname>/server-status | grep"requests/sec" | cut -c5- | cut -d\ -f1
Enabling SNMP Support for Silverstream Servers
1. Run SilverStream designer.
2. Choose SilverMaster3 database > Objects .
3. Open AgSNMPGetStats in design mode.
4. Double-click the trigger icon. The Properties page opens.
5. Set the Enabled option to true.
6. Save the changes and close the file.
Monitoring Silk Central Performance
Use Performance Explorer to monitor performance and reliability metrics of a Silk Central applicationserver and front-end server.
1. On the Real-Time Monitoring tab, in the Monitor group, click System. The Data Source wizardopens.
2. Click the Select from predefined Data Sources option button.
3. Click Next. The System selection page opens.
4. Expand the Silk folder and the Silk Central folder with the version that you want to monitor, then selectapplication server or front-end server.
5. Click Next.
The Connection parameters page opens.
6. Specify the following settings:
• In the Hostname text box, specify the host name or IP address on which Silk Central is running.• Optional: In the Alias text box, specify an alias for the server which is monitored.• If Silk Central does not listen on the default port, specify the JMX port number in the Port text box.• If JMX authentication is enabled, enter the Username and Password. Per default JMX
authentication is disabled and Username and Password should be empty.
Note: Make sure that your local firewall is turned off or that ports 19140 and 19142 are allowed tocommunicate through the firewall.
7. Click Next. The JMX Data Source Browser opens.
8. Select the measures that you want to include in the initial monitor view and click Add. When you aredone adding the measures, click Close.
Tip: Select the Simple Query tab and filter the measures by borland.com to quickly access therelevant Silk Central measures.
The Select displayed measures page opens.
54 | Performance Explorer 18.5

9. Check the check boxes for those measures that you want to include in the initial monitor view and thenclick Finish.
A connection to the specified host is established, and an initial view that contains the measures youselected is displayed.
IBM DB2 Performance Monitoring
Use Performance Explorer to retrieve performance metrics from IBM DB2 database systems no matter thedatabase platform. For example, the database can run on a SunOs, Linux, or a Windows system.
With Performance Explorer, you can monitor DB2 database systems in a platform-independent way. Toaccomplish this task, execute a DB2-specific command for retrieving a database's performance andutilization measures and drive a Silk Performer project inside Performance Explorer. This approach alsoallows Performance Explorer to keep track of the database system's performance in real time.
The Silk Performer project is located in a Essential package named DB2Monitor.sep, which is located atC:\Program Files\Silk\Silk Performer18.5\Monitors.
Prerequisites for DB2 Monitoring
To monitor DB2, ensure that your environment meets the following requirements:
• IBM DB2 client software (DB2 Connect) must be installed on the machine on which you intend to runPerformance Explorer.
• The DB2 command line processor, db2cmd.exe, must be installed as part of the client installation. Thisprerequisite is met by default.
• The appropriate DB2 database user must possess one of the following authorizations:
• sysadm• sysctrl• sysmaint
• DB2 snapshot monitoring must be set up correctly.
Testing DB2 Snapshot Monitoring
1. Connect to a DB2 database.
db2 command:
=> connect to sample user <dbusername> using <password>
2. Attach to a DB2 instance.
db2 command:
=> attach to <db2instancename> user <dbusername> using <dbusername>
3. Check if monitor switches are on.
db2 command:
=> get monitor switches
Monitor Recording Switches
Switch list for node 0
Buffer Pool Activity Information (BUFFERPOOL) = ON 02-06-200218:27:48.722132Lock Information (LOCK) = ON 02-06-200218:28:00.095212Sorting Information (SORT) = ON 02-06-200218:28:12.263183SQL Statement Information (STATEMENT) = ON 02-06-200218:28:24.323446
Performance Explorer 18.5 | 55
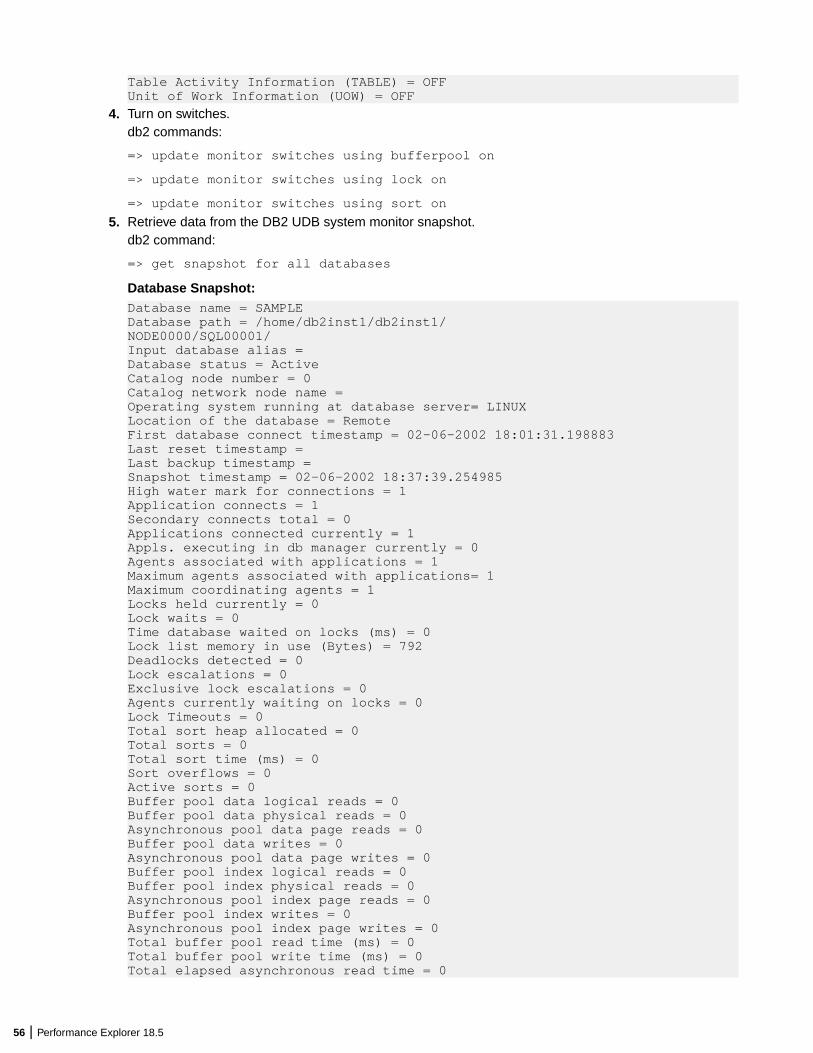
Table Activity Information (TABLE) = OFFUnit of Work Information (UOW) = OFF
4. Turn on switches.db2 commands:
=> update monitor switches using bufferpool on
=> update monitor switches using lock on
=> update monitor switches using sort on
5. Retrieve data from the DB2 UDB system monitor snapshot.db2 command:
=> get snapshot for all databases
Database Snapshot:Database name = SAMPLEDatabase path = /home/db2inst1/db2inst1/NODE0000/SQL00001/Input database alias =Database status = ActiveCatalog node number = 0Catalog network node name =Operating system running at database server= LINUXLocation of the database = RemoteFirst database connect timestamp = 02-06-2002 18:01:31.198883Last reset timestamp =Last backup timestamp =Snapshot timestamp = 02-06-2002 18:37:39.254985High water mark for connections = 1Application connects = 1Secondary connects total = 0Applications connected currently = 1Appls. executing in db manager currently = 0Agents associated with applications = 1Maximum agents associated with applications= 1Maximum coordinating agents = 1Locks held currently = 0Lock waits = 0Time database waited on locks (ms) = 0Lock list memory in use (Bytes) = 792Deadlocks detected = 0Lock escalations = 0Exclusive lock escalations = 0Agents currently waiting on locks = 0Lock Timeouts = 0Total sort heap allocated = 0Total sorts = 0Total sort time (ms) = 0Sort overflows = 0Active sorts = 0Buffer pool data logical reads = 0Buffer pool data physical reads = 0Asynchronous pool data page reads = 0Buffer pool data writes = 0Asynchronous pool data page writes = 0Buffer pool index logical reads = 0Buffer pool index physical reads = 0Asynchronous pool index page reads = 0Buffer pool index writes = 0Asynchronous pool index page writes = 0Total buffer pool read time (ms) = 0Total buffer pool write time (ms) = 0Total elapsed asynchronous read time = 0
56 | Performance Explorer 18.5

Total elapsed asynchronous write time = 0Asynchronous read requests = 0LSN Gap cleaner triggers = 0Dirty page steal cleaner triggers = 0Dirty page threshold cleaner triggers = 0Time waited for prefetch (ms) = 0Direct reads = 0Direct writes = 0Direct read requests = 0Direct write requests = 0Direct reads elapsed time (ms) = 0Direct write elapsed time (ms) = 0Database files closed = 0Data pages copied to extended storage = 0Index pages copied to extended storage = 0Data pages copied from extended storage = 0Index pages copied from extended storage = 0Host execution elapsed time = 0.000000Commit statements attempted = 1Rollback statements attempted = 0Dynamic statements attempted = 0Static statements attempted = 1Failed statement operations = 0Select SQL statements executed = 0Update/Insert/Delete statements executed = 0DDL statements executed = 0Internal automatic rebinds = 0Internal rows deleted = 0Internal rows inserted = 0Internal rows updated = 0Internal commits = 1Internal rollbacks = 0Internal rollbacks due to deadlock = 0Rows deleted = 0Rows inserted = 0Rows updated = 0Rows selected = 0Rows read = 9Binds/precompiles attempted = 0Log space available to the database (Bytes)= 20400000Log space used by the database (Bytes) = 0Maximum secondary log space used (Bytes) = 0Maximum total log space used (Bytes) = 0Secondary logs allocated currently = 0Log pages read = 0Log pages written = 0Appl id holding the oldest transaction = 0Package cache lookups = 0Package cache inserts = 0Package cache overflows = 0Package cache high water mark (Bytes) = 51824Application section lookups = 0Application section inserts = 0Catalog cache lookups = 0Catalog cache inserts = 0Catalog cache overflows = 0Catalog cache heap full = 0Number of hash joins = 0Number of hash loops = 0Number of hash join overflows = 0Number of small hash join overflows = 0
Performance Explorer 18.5 | 57

Retrieving IBM DB2 Performance Metrics
Establish a connection to a data source to monitor IBM DB2 DBMS systems and to create an initial viewthat contains the measures you want to monitor.
1. On the Real-Time Monitoring tab, in the Monitor group, click System. The Data Source wizardopens.
2. Click the Select from predefined Data Sources option button.
3. Click Next. The System selection page opens.
4. Expand the Database System folder and select IBM Universal Database DB2 (snapshot dll).
5. Click Next.
The Connection parameters page opens.
6. In the Hostname text box, specify the host on which the DB2 database is running.
7. Click Next. The Attributes Configuration page opens.
8. Define the following monitoring-specific attributes:
• Alias – The database alias is used by the monitoring project in the following DB2-specific command:"connect to 'alias' user 'user' using 'password'".
• Instance – The instance name is used by the monitoring project for executing the following DB2-specific command: "attach to 'Instance' user 'user' using 'password'".
• User – Specify a user with the following DB2 authorizations:
• sysadm• sysctrl• sysmaint
• Password – The password for the user.
9. Click OK. The Select displayed measures page opens.
10.Check the check boxes for those measures that you want to include in the initial monitor view and thenclick Finish.
A connection to the specified host is established, and an initial view that contains the measures youselected is displayed.
IBM WebSphere Application Server Monitoring
With Performance Explorer, you can monitor the following IBM WebSphere application servers:
• IBM WebSphere Application Server 6.1 via JMX• IBM WebSphere Application Server 7.0 via JMX• IBM WebSphere Application Server 8.0 via JMX• IBM WebSphere Application Server 8.5 via JMX
Typical Performance Measures on WebSphere Application Server 6.1
The following table displays typical performance measures and definitions for WebSphere applicationserver.
Performance Measure Description
BeanModule Specific data about deployed EJBs, such as how manybeans were created.
ConnectionPoolModule Contains performance counters about JDBC connections,like how many JDBC connections are currently in thepool.
58 | Performance Explorer 18.5
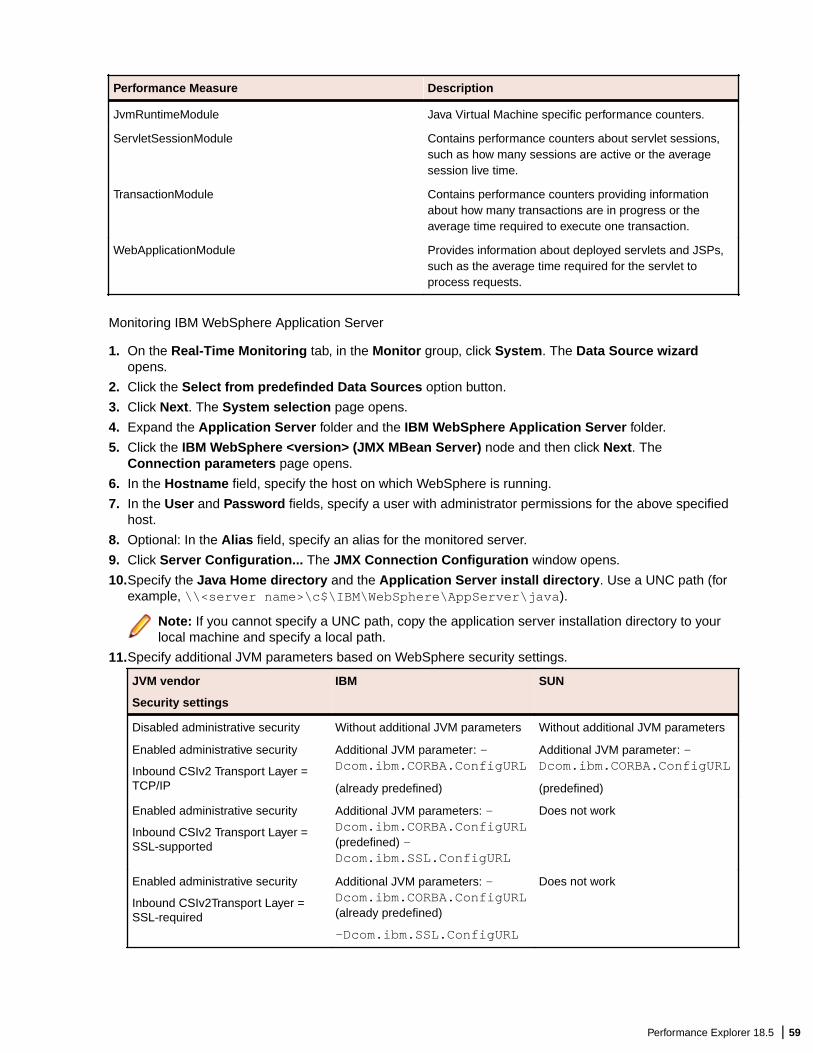
Performance Measure Description
JvmRuntimeModule Java Virtual Machine specific performance counters.
ServletSessionModule Contains performance counters about servlet sessions,such as how many sessions are active or the averagesession live time.
TransactionModule Contains performance counters providing informationabout how many transactions are in progress or theaverage time required to execute one transaction.
WebApplicationModule Provides information about deployed servlets and JSPs,such as the average time required for the servlet toprocess requests.
Monitoring IBM WebSphere Application Server
1. On the Real-Time Monitoring tab, in the Monitor group, click System. The Data Source wizardopens.
2. Click the Select from predefinded Data Sources option button.
3. Click Next. The System selection page opens.
4. Expand the Application Server folder and the IBM WebSphere Application Server folder.
5. Click the IBM WebSphere <version> (JMX MBean Server) node and then click Next. TheConnection parameters page opens.
6. In the Hostname field, specify the host on which WebSphere is running.
7. In the User and Password fields, specify a user with administrator permissions for the above specifiedhost.
8. Optional: In the Alias field, specify an alias for the monitored server.
9. Click Server Configuration... The JMX Connection Configuration window opens.
10.Specify the Java Home directory and the Application Server install directory. Use a UNC path (forexample, \\<server name>\c$\IBM\WebSphere\AppServer\java).
Note: If you cannot specify a UNC path, copy the application server installation directory to yourlocal machine and specify a local path.
11.Specify additional JVM parameters based on WebSphere security settings.
JVM vendor
Security settings
IBM SUN
Disabled administrative security Without additional JVM parameters Without additional JVM parameters
Enabled administrative security
Inbound CSIv2 Transport Layer =TCP/IP
Additional JVM parameter: -Dcom.ibm.CORBA.ConfigURL
(already predefined)
Additional JVM parameter: -Dcom.ibm.CORBA.ConfigURL
(predefined)
Enabled administrative security
Inbound CSIv2 Transport Layer =SSL-supported
Additional JVM parameters: -Dcom.ibm.CORBA.ConfigURL(predefined) -Dcom.ibm.SSL.ConfigURL
Does not work
Enabled administrative security
Inbound CSIv2Transport Layer =SSL-required
Additional JVM parameters: -Dcom.ibm.CORBA.ConfigURL(already predefined)
-Dcom.ibm.SSL.ConfigURL
Does not work
Performance Explorer 18.5 | 59

Note: If your WebSphere server has enabled administrative security and the inbound CSIv2transport layer is SSL-supported (or SSL-required), copy the application server installationdirectory to your local machine. Specify Additional JVM parameters according to the table above.The Additional JVM parameters field holds the predefined parameter -Dcom.ibm.CORBA.ConfigURL.
The value for the -Dcom.ibm.CORBA.ConfigURL parameter must be the URL path to the filesas.client.props. The default sas.client.props file is located in the folder %INSTALL_DIR%/Include/jmx-config/WebSphere%MAJOR_VERSION%. For example: For WebSphere 7, the URLpath is C:\Program%20Files%20(x86)\Silk\Silk%20Performer%2010.0\Include\jmx-config\WebSphere7. If your server has specific settings, you can use the sas.client.props filefrom the properties folder of the WebSphere profile. For Example: file:/C:\Program%20Files%20(x86)\IBM\WebSphere\AppServer1\profiles\AppSrv01\properties\sas.client.props
Pay attention to the following two variables and their values in your sas.client.props file:com.ibm.CSI.performTransportAssocSSLTLSRequired=false andcom.ibm.CSI.performTransportAssocSSLTLSSupported=true
The value for the -Dcom.ibm.SSL.ConfigURL parameter must be the URL path to the filessl.client.props, which is found in the properties folder of the WebSphere profile. For example:file:/C:\Program%20Files%20 (x86)\IBM\WebSphere\AppServer1\profiles\AppSrv01\properties\ssl.client.props.
Pay attention to the variable user.root in the file ssl.client.props. It must contain the valid pathto the profile folder with the etc directory that contains the key- and trust-files. Blanks in the URL path tothe files sas.client.props and ssl.client.props must be replaced with %20.
12.Click OK.
13.Click Next. The JMX Data Source Browser opens.
14.Choose MBeans for those measures that you want to include in the initial monitor view. Select the typeof measures (Average, Sum, or Incremental) and click Add.
15.Click Close. The Select displayed measures page opens.
16.Check the checkboxes for those measures that you want to include in the initial monitor view.
17.Click Finish.
Internet Information Server (IIS) Performance Monitoring
Monitoring Internet Information Services (IIS)
1. On the Real-Time Monitoring tab, in the Monitor group, click System. The Data Source wizardopens.
2. Click the Select from predefined Data Sources option button.
3. Click Next. The System selection page opens.
4. Expand the Web Server folder and the IIS <version> folder.
5. Click the System Statistics (PERFMON) node and then click Next. The Connection parameterspage opens.
6. In the Hostname text box, specify the host on which IIS is running.
7. In the User and Password text boxes, specify a user with administrator permissions on the above-specified host.
8. Optional: In the Alias text box, specify an alias for the monitored server.
9. Click Next. The Select displayed measures page opens.
10.Check the check boxes for those measures that you want to include in the initial monitor view.
11.Click Finish.
60 | Performance Explorer 18.5

Available IIS Performance Measures
Performance Measures on IIS 6.0
Measures can be divided into several groups according to perfmon objects.
Web Service Measures
• Web Service(_Total)\Bytes Received/sec
Rate of total bytes transferred by service (received)• Web Service(_Total)\Bytes Sent/sec
Rate of total bytes transferred by service (sent)• Web Service(_Total)\Bytes Total/sec
Rate of total bytes transferred by service (sum of bytes sent and received)• Web Service(_Total)\Current Connections
Current number of connections to the service• Web Service(_Total)\Get Requests/sec
Total number of HTTP GET requests received by WWW service• Web Service(_Total)\Post Requests/sec
Number of HTTP requests using POST method
Web Service Cache Measures
• Web Service Cache(_Total)\Current Files Cached
Current number of files whose content is in the user-mode cache• Web Service Cache(_Total)\Current Metadata Cached
Current number of metadata information blocks currently in the user-mode cache.• Web Service Cache(_Total)\Current URIs Cached
URI information blocks currently in the user-mode cache• Web Service Cache(_Total)\File Cache Hits %
The ratio of user-mode file cache hits to total cache requests (since service startup). Note: This valuemight be low if the Kernel URI cache hits percentage is high.
• Web Service Cache(_Total)\Metadata Cache Hits
The ratio of user-mode metadata cache hits to total cache requests (since service startup)• Web Service Cache(_Total)\URI Cache Hits %
The ratio of user-mode URI Cache Hits to total cache requests (since service startup)• Web Service Cache(_Total)\Kernel:URI Cache Hits %
Applies to static unauthenticated content and dynamic content that is marked as cacheable
Performance Measures on IIS 7.0, 7.5
All IIS 6.0 measures are available for IIS 7.0/7.5, but in IIS7 there are additional performance counters thatgive you insight into worker processes level at runtime.
Web Service Measures - Same as IIS 6.0.
Web Service Cache Measures - Same as IIS 6.0.
W3SVC_W3WP Cache Measures
• W3SVC_W3WP(_Total)\Requests / Sec
HTTP requests/sec being processed by the worker process
Performance Explorer 18.5 | 61

• W3SVC_W3WP(_Total)\Active Requests
Current number of requests being processed by the worker process• W3SVC_W3WP(_Total)\Active Threads Count
Number of threads actively processing requests in the worker process• W3SVC_W3WP(_Total)\Current File Cache Memory Usage
Current number of bytes used by user-mode file cache• W3SVC_W3WP(_Total)\Current Files Cached
Current number of files whose contents are present in user-mode cache• W3SVC_W3WP(_Total)\Current URIs Cached
URI information blocks currently in the user-mode cache• W3SVC_W3WP(_Total)\Current Metadata Cached
Number of metadata information blocks currently present in user-mode cache• W3SVC_W3WP(_Total)\Metadata Cache Hits
Total number of successful lookups in the user-mode metadata cache (since service startup)• W3SVC_W3WP(_Total)\Metadata Cache Misses
Total number of unsuccessful lookups in the user-mode metadata cache (since service startup)• W3SVC_W3WP(_Total)\Metadata Cache Flushes
Total number of user-mode metadata cache flushes (since service startup)• W3SVC_W3WP(_Total)\File Cache Hits / sec
Rate of successful lookups in file cache during last sample interval• W3SVC_W3WP(_Total)\File Cache Misses / sec
Rate of unsuccessful lookups in file cache during last sample interval• W3SVC_W3WP(_Total)\Metadata Cache Hits / sec
Rate of successful lookups in metadata cache during last sample interval• W3SVC_W3WP(_Total)\Metadata Cache Misses / sec
Rate of unsuccessful lookups in metadata cache during last sample interval• W3SVC_W3WP(_Total)\Uri Cache Hits / sec
Rate of successful lookups in URI cache during last sample interval• W3SVC_W3WP(_Total)\Uri Cache Misses / sec
Rate of unsuccessful lookups in URI cache during last sample interval
Troubleshooting IIS Monitoring
Issues With x64/x86 Counters
For support, please refer to http://support.microsoft.com/kb/891238.
Issues With W3SVC_W3WP
Note that this group of counters monitors worker processes at runtime. So when no workers are running,this group of counters returns NULL values.
Microsoft SQL Server Performance Monitoring
Monitoring Microsoft SQL Server
1. On the Real-Time Monitoring tab, in the Monitor group, click System. The Data Source wizardopens.
62 | Performance Explorer 18.5
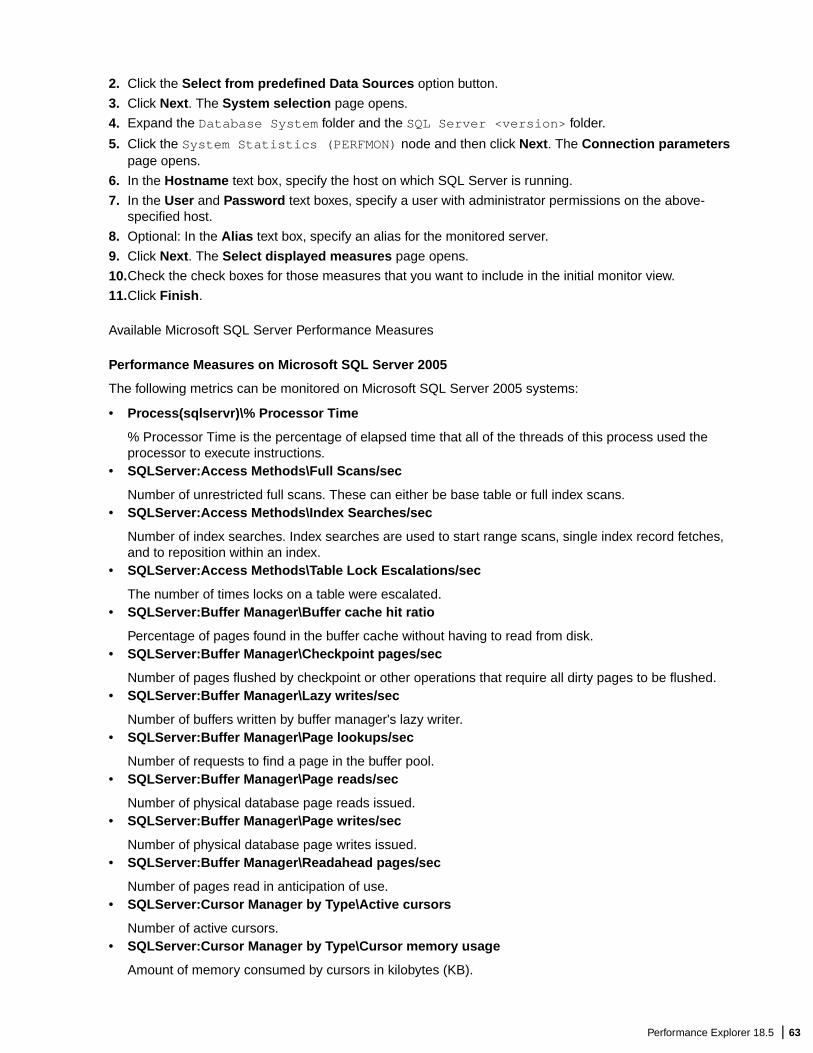
2. Click the Select from predefined Data Sources option button.
3. Click Next. The System selection page opens.
4. Expand the Database System folder and the SQL Server <version> folder.
5. Click the System Statistics (PERFMON) node and then click Next. The Connection parameterspage opens.
6. In the Hostname text box, specify the host on which SQL Server is running.
7. In the User and Password text boxes, specify a user with administrator permissions on the above-specified host.
8. Optional: In the Alias text box, specify an alias for the monitored server.
9. Click Next. The Select displayed measures page opens.
10.Check the check boxes for those measures that you want to include in the initial monitor view.
11.Click Finish.
Available Microsoft SQL Server Performance Measures
Performance Measures on Microsoft SQL Server 2005
The following metrics can be monitored on Microsoft SQL Server 2005 systems:
• Process(sqlservr)\% Processor Time
% Processor Time is the percentage of elapsed time that all of the threads of this process used theprocessor to execute instructions.
• SQLServer:Access Methods\Full Scans/sec
Number of unrestricted full scans. These can either be base table or full index scans.• SQLServer:Access Methods\Index Searches/sec
Number of index searches. Index searches are used to start range scans, single index record fetches,and to reposition within an index.
• SQLServer:Access Methods\Table Lock Escalations/sec
The number of times locks on a table were escalated.• SQLServer:Buffer Manager\Buffer cache hit ratio
Percentage of pages found in the buffer cache without having to read from disk.• SQLServer:Buffer Manager\Checkpoint pages/sec
Number of pages flushed by checkpoint or other operations that require all dirty pages to be flushed.• SQLServer:Buffer Manager\Lazy writes/sec
Number of buffers written by buffer manager's lazy writer.• SQLServer:Buffer Manager\Page lookups/sec
Number of requests to find a page in the buffer pool.• SQLServer:Buffer Manager\Page reads/sec
Number of physical database page reads issued.• SQLServer:Buffer Manager\Page writes/sec
Number of physical database page writes issued.• SQLServer:Buffer Manager\Readahead pages/sec
Number of pages read in anticipation of use.• SQLServer:Cursor Manager by Type\Active cursors
Number of active cursors.• SQLServer:Cursor Manager by Type\Cursor memory usage
Amount of memory consumed by cursors in kilobytes (KB).
Performance Explorer 18.5 | 63
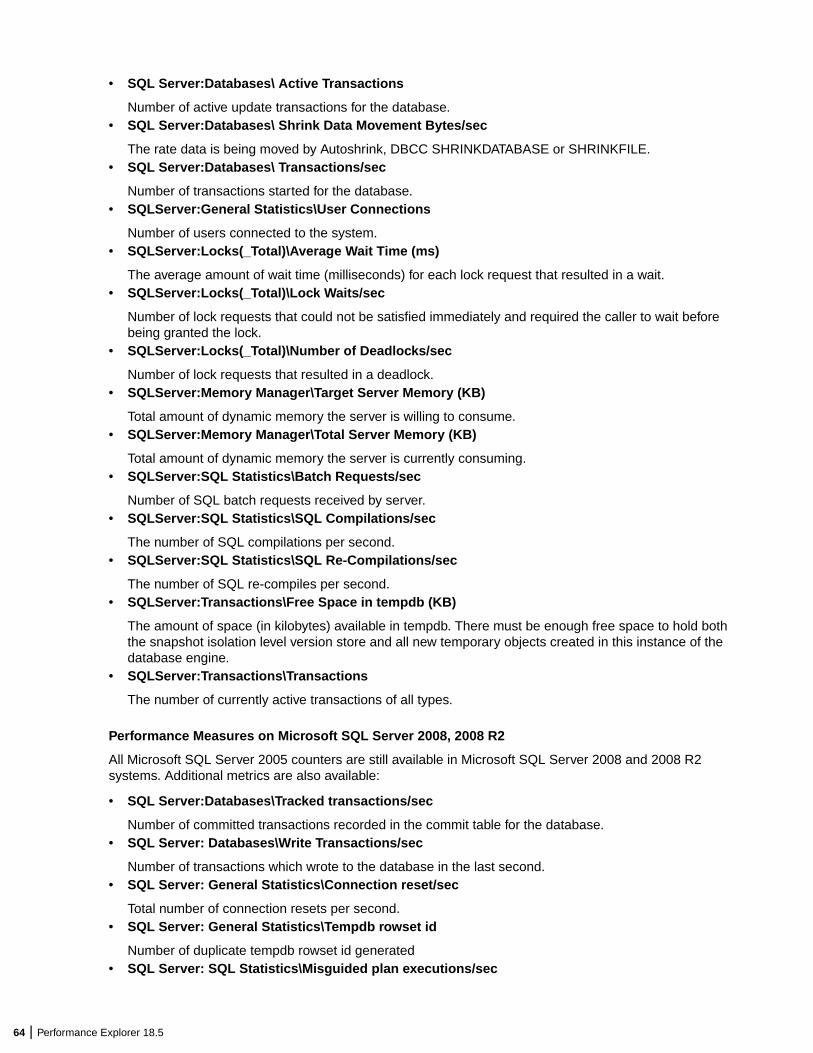
• SQL Server:Databases\ Active Transactions
Number of active update transactions for the database.• SQL Server:Databases\ Shrink Data Movement Bytes/sec
The rate data is being moved by Autoshrink, DBCC SHRINKDATABASE or SHRINKFILE.• SQL Server:Databases\ Transactions/sec
Number of transactions started for the database.• SQLServer:General Statistics\User Connections
Number of users connected to the system.• SQLServer:Locks(_Total)\Average Wait Time (ms)
The average amount of wait time (milliseconds) for each lock request that resulted in a wait.• SQLServer:Locks(_Total)\Lock Waits/sec
Number of lock requests that could not be satisfied immediately and required the caller to wait beforebeing granted the lock.
• SQLServer:Locks(_Total)\Number of Deadlocks/sec
Number of lock requests that resulted in a deadlock.• SQLServer:Memory Manager\Target Server Memory (KB)
Total amount of dynamic memory the server is willing to consume.• SQLServer:Memory Manager\Total Server Memory (KB)
Total amount of dynamic memory the server is currently consuming.• SQLServer:SQL Statistics\Batch Requests/sec
Number of SQL batch requests received by server.• SQLServer:SQL Statistics\SQL Compilations/sec
The number of SQL compilations per second.• SQLServer:SQL Statistics\SQL Re-Compilations/sec
The number of SQL re-compiles per second.• SQLServer:Transactions\Free Space in tempdb (KB)
The amount of space (in kilobytes) available in tempdb. There must be enough free space to hold boththe snapshot isolation level version store and all new temporary objects created in this instance of thedatabase engine.
• SQLServer:Transactions\Transactions
The number of currently active transactions of all types.
Performance Measures on Microsoft SQL Server 2008, 2008 R2
All Microsoft SQL Server 2005 counters are still available in Microsoft SQL Server 2008 and 2008 R2systems. Additional metrics are also available:
• SQL Server:Databases\Tracked transactions/sec
Number of committed transactions recorded in the commit table for the database.• SQL Server: Databases\Write Transactions/sec
Number of transactions which wrote to the database in the last second.• SQL Server: General Statistics\Connection reset/sec
Total number of connection resets per second.• SQL Server: General Statistics\Tempdb rowset id
Number of duplicate tempdb rowset id generated• SQL Server: SQL Statistics\Misguided plan executions/sec
64 | Performance Explorer 18.5
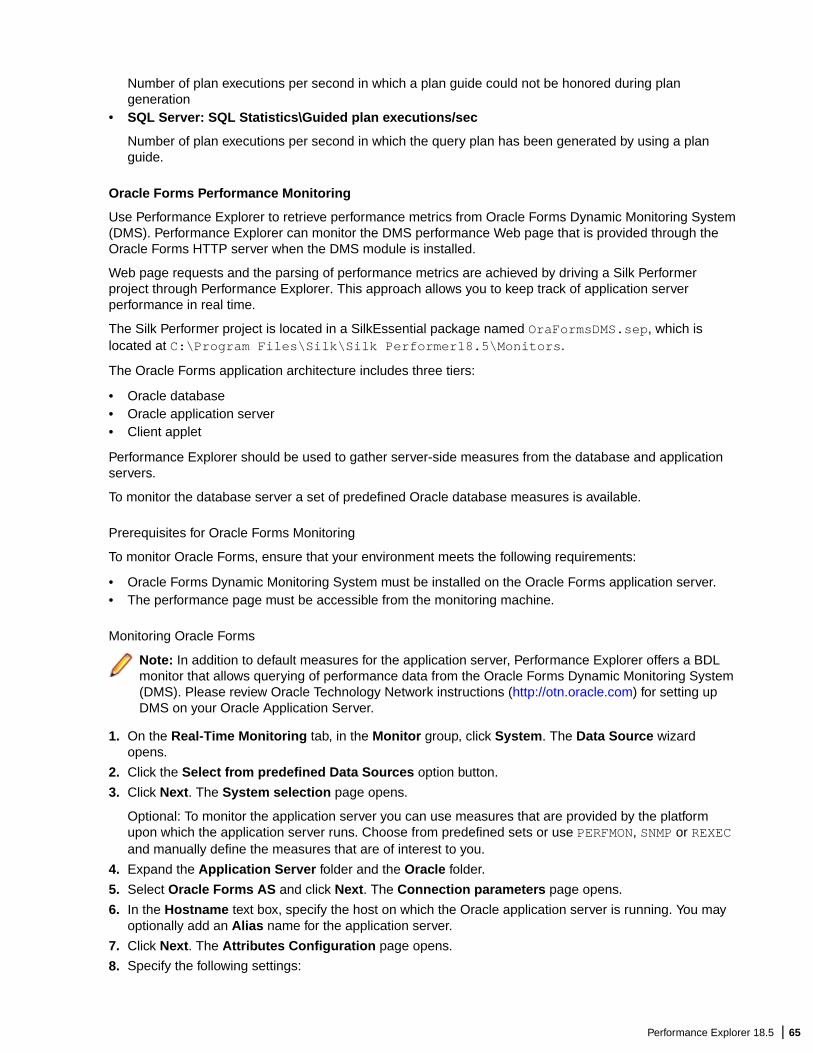
Number of plan executions per second in which a plan guide could not be honored during plangeneration
• SQL Server: SQL Statistics\Guided plan executions/sec
Number of plan executions per second in which the query plan has been generated by using a planguide.
Oracle Forms Performance Monitoring
Use Performance Explorer to retrieve performance metrics from Oracle Forms Dynamic Monitoring System(DMS). Performance Explorer can monitor the DMS performance Web page that is provided through theOracle Forms HTTP server when the DMS module is installed.
Web page requests and the parsing of performance metrics are achieved by driving a Silk Performerproject through Performance Explorer. This approach allows you to keep track of application serverperformance in real time.
The Silk Performer project is located in a SilkEssential package named OraFormsDMS.sep, which islocated at C:\Program Files\Silk\Silk Performer18.5\Monitors.
The Oracle Forms application architecture includes three tiers:
• Oracle database• Oracle application server• Client applet
Performance Explorer should be used to gather server-side measures from the database and applicationservers.
To monitor the database server a set of predefined Oracle database measures is available.
Prerequisites for Oracle Forms Monitoring
To monitor Oracle Forms, ensure that your environment meets the following requirements:
• Oracle Forms Dynamic Monitoring System must be installed on the Oracle Forms application server.• The performance page must be accessible from the monitoring machine.
Monitoring Oracle Forms
Note: In addition to default measures for the application server, Performance Explorer offers a BDLmonitor that allows querying of performance data from the Oracle Forms Dynamic Monitoring System(DMS). Please review Oracle Technology Network instructions (http://otn.oracle.com) for setting upDMS on your Oracle Application Server.
1. On the Real-Time Monitoring tab, in the Monitor group, click System. The Data Source wizardopens.
2. Click the Select from predefined Data Sources option button.
3. Click Next. The System selection page opens.
Optional: To monitor the application server you can use measures that are provided by the platformupon which the application server runs. Choose from predefined sets or use PERFMON, SNMP or REXECand manually define the measures that are of interest to you.
4. Expand the Application Server folder and the Oracle folder.
5. Select Oracle Forms AS and click Next. The Connection parameters page opens.
6. In the Hostname text box, specify the host on which the Oracle application server is running. You mayoptionally add an Alias name for the application server.
7. Click Next. The Attributes Configuration page opens.
8. Specify the following settings:
Performance Explorer 18.5 | 65

• URL of the DMS-Site. The standard format is http://server:port/dms0• Proxy (if you need to connect using an HTTP proxy)• Proxy-Port of the HTTP proxy• Username (if you need to authenticate against the Web server to access the DMS site)• Password for accessing the DMS site
This monitor provides interesting measures that are provided by the DMS including:
• Common Apache measures• Module information for HTTP, OC4J, and PLSQL• Database connection statistics
9. Click OK. The Select displayed measures page opens.
10.Check the check boxes for those measures that you want to include in the initial monitor view and thenclick Finish.
A connection to the specified host is established, and an initial view that contains the measures youselected is displayed.
Oracle Forms Client-Side Measures
Client-side measures are automatically generated by load test agents during Oracle Forms load tests. Theyare aggregated into a single result file by the load test controller.
Agents create measures for the following:
• Time taken by an action on a control (for example, button press or control edit)• Number of bytes received for an action• Number of bytes sent for an action• Number of messages received for an action• Number of messages sent for an action• Number of round-trips for an action
Oracle Performance Monitoring
Use Performance Explorer to retrieve performance metrics from Oracle database systems no matter thedatabase platform. For example, the database can run on a SunOs, Linux, or a Windows system.
Monitoring Oracle Database via Perfmon
Oracle Database Monitoring Prerequisites
Installing Oracle Client and Oracle Counters for Windows
Before you monitor Oracle Database, ensure that the following requirements have been met:
• SQL*NET client software must be installed on the machine on which you run Performance Explorer.• SQL*Plus must be available on the machine on which you run Performance Explorer.• Oracle Counters for Windows Performance Monitor must be available.• The Oracle client must have DB administrator permissions and be able to recognize the targeted
database server.
Note: Oracle Counters for Windows Performance Monitor is not installed with default installationoptions (for example, Instant Client and Administrator installations). It is only available via custominstallation options.
66 | Performance Explorer 18.5

Adding Oracle Counters to Windows Performance Monitor
1. Open file <Oracle Home>\network\admin\tnsnames.ora and add the connection string to thedatabase you want to monitor.
2. Start the command line and test the connection with the command sqlplus <user>/<password>@<database>
3. Configure which database is to be monitored using the operfcfg command: <Oracle Home>\bin\operfcfg [-U username] [-P password] [-D TNS_Alias_for_database]
If successful, you will receive the message operfcfg: New registry values have beensuccessfully set.
4. Start Windows Performance Monitor Start > Run > Perfmon.
5. Oracle Counters for Windows Performance Monitor can now be added via the Add Counters dialogbox.
Monitoring Oracle Performance (Perfmon)
1. Choose Monitor > Add Data Source. The Data Source wizard opens.
2. Click the Select from predefined Data Sources option button.
3. Click Next. The System selection page opens.
4. Expand the Database System folder and the Oracle 9/10/11 (perfmon) folder.
5. Click the System Statistics ( PERFMON ) node and then click Next. The ConnectionParameters page opens.
6. In the Hostname text box, specify the host on which the Oracle Client and Counters for WindowsPerformance Monitor are running.
7. In the User and Password text box, specify the user with administrator permissions on the abovespecified host.
8. Optional: In the Alias text box, specify an alias for the host where the Oracle database is running.
9. Click Next.10.The Select displayed measures page opens.
11.Check the check boxes for those measures that you want to include in the initial monitor view and thenclick Finish.
Performance Counters
Oracle Database Buffer Cache
The counter is phyrds/gets %. The percentage of phyrds/gets is calculated as a miss ratio. The lowerthe Miss counter, the better. To improve performance, increase the number of buffers in the buffer cache, ifmemory is available on the computer. This value is not time-derived.
Oracle Database Redo Log Buffer
The counter is redo log space requests. The value of this counter must be near zero. If this valueincrements consistently, then processes have had to wait for space in the redo log buffer. In this case, itmay be necessary to increase the size of the redo log buffer.
Oracle Database Data Dictionary Cache
The counter is getmisses/gets %. The value of this counter must be less than 10-15% for frequentlyaccessed data dictionary caches. If the ratio continues to increase over this threshold while yourapplication is running, then increase the amount of memory available to the data dictionary cache.
To increase the memory available to the cache, increase the value of initialization parameterSHARED_POOL_SIZE. This value is not time-derived.
Performance Explorer 18.5 | 67

Oracle Database Library Cache
The counter is reloads/pins %. This is the percentage of SQL statements, PL/SQL blocks, and objectdefinitions that required reparsing. Total Reloads must be near zero. If the ratio of Reloads to Pins isgreater than 1%, then reduce the library cache misses. This value is not time-derived.
Oracle Database DBWR stats1
The two counters available, buffers scanned/sec and LRU scans/sec, are helpful in tuning Buffer Cache.Buffers scanned/sec is the number of buffers DBWR scanned in each second. The buffers scanned are onthe LRU (Least Recently Used) list. LRU scans/sec is the number of times DBWR scanned the (LeastRecently Used) buffer list in each second.
Oracle Database DBWR stats2
The two counters available, timeouts/sec and checkpoints/sec, are helpful in determining how much workDBWR has been requested to perform. Timeouts/sec is the number of times DBWR timed-out in eachsecond. DBWR is on a three second timeout interval. If DBWR has not been posted within a three secondinterval, then it times out.
Checkpoints/sec is the number of checkpoint messages processed by the database writer each second.Whenever a checkpoint occurs, DBWR must be messaged (posted) to "write dirty buffers todisk."
Oracle Database Dynamic Space Management
The counter is recursive calls/sec. Dynamic extension causes Oracle Database to execute SQLstatements in addition to those SQL statements issued by user processes. These SQL statements arecalled recursive calls.
Oracle Database Free List
The counter is free list waits/requests %. Contention for free lists is reflected by contention forfree data blocks in buffer cache. You can determine if contention for free lists is reducing performance byquerying V$WAITSTAT.
If the number of free list waits for free blocks is greater than 1% of the total number of requests, thenconsider adding more free lists to reduce contention.
Oracle Database Sorts
The available counters are sorts in memory/sec and sorts on disk/sec. The default sort area size isadequate to hold all data for most sorts. However, if your application often performs large sorts on data thatdo not fit into the sort area, then you may increase sort area size.
Known Issues
Silk Performer can monitor both 32bit and 64bit Oracle Database performance, but only the 32bit Oracleclient version (Oracle Counters for Windows Performance Monitor) is supported.
Note: The 32bit Oracle client works fine on a 64bit OS and it is not an issue to monitor a 64bitdatabase from a client machine running a 64bit OS.
Monitoring Oracle Database via V$SYSSTAT
You can monitor DB2 database systems in a platform-independent way by fetching performanceinformation from an Oracle database's V$SYSSTAT table.
Prerequisites for Oracle Monitoring
Before you monitor Oracle, ensure that the following requirements have been met:
68 | Performance Explorer 18.5

• Oracle Net (part of Oracle Net Services) client software is installed on the machine on which you runPerformance Explorer.
• The Oracle client must be a 32-bit version, must have DB administrator permissions and be able torecognize the targeted database server.
• The relevant project attributes have been changed accordingly for your Oracle installation (chooseMenu Project > Project Attributes ).
• SQL*Plus is available on the machine on which you want to run Performance Explorer.• Log on using the specified user name, password, and server information and perform the query SELECT
* FROM V$SYSSTAT.
If the logon attempt is successful, the environment is most likely set up correctly.
If the logon attempt fails, you can judge from the error messages generated by SQL*Plus what causedthe problem.
Monitoring Oracle Performance
Drive a Silk Performer project from inside Performance Explorer to keep track of the database system'sperformance in real time. The Silk Performer project is located a Essential package namedOracleMonitoring.sep, which is located at C:\Program Files\Silk\SilkPerformer18.5\Monitors.
1. On the Real-Time Monitoring tab, in the Monitor group, click System. The Data Source wizardopens.
2. Click the Select from predefined Data Sources option button.
3. Click Next. The System selection page opens.
4. Expand the Database System folder and the Oracle (v$sysstat) folder.
5. Click the System Statistics (v$sysstat) node and then click Next. The Connection parameters pageopens.
6. In the Hostname text box, specify the host on which the Oracle database is running.
7. Optional: In the Alias text box, specify an alias for the host where the Oracle database is running.
8. Click Next. The Attributes Configuration page opens.
9. If necessary, change the attribute values.
Typically, the Oracle TNS name, UserId, and Password are included in these settings.
10.Click OK. The Select displayed measures page opens.
11.Check the check boxes for those measures that you want to include in the initial monitor view and thenclick Finish.
A connection to the specified host is established, and an initial view that contains the measures youselected is displayed.
SAP Performance Monitoring
Use Performance Explorer to monitor performance and reliability metrics of a SAP system. PerformanceExplorer is shipped with two monitors specially designed for monitoring SAP installations.
1. On the Real-Time Monitoring tab, in the Monitor group, click System. The Data Source wizardopens.
2. Click the Select from predefined Data Sources option button.
3. Expand the Application Server folder and the SAP folder.
4. Depending on the type of SAPGUI monitor that you want to use, select the appropriate monitor type.
The following types of SAPGUI monitors are available:
• SAPGUI Monitoring (ST02): Monitors buffer related metrics. SAP transaction ST02 is executed whenrunning this monitor.
Performance Explorer 18.5 | 69

• SAPGUI Monitoring (ST03N): Monitors application specific metrics. SAP transaction ´ST03n isexecuted when running this monitor.
• SAPGUI Monitoring (ST04): Monitors database related metrics. SAP transaction ST04 is executedwhen running this monitor.
• SAPGUI Monitoring (ST07): Monitors user distribution on the SAP system. SAP transaction ST07 isexecuted when running this monitor.
• SAPGUI OS-Monitoring (ST06): Monitors operating system specific metrics. SAP transaction ST06is executed when running this monitor.
5. Click Next.
The Connection parameters page opens.
6. In the Hostname text box, specify the host of the machine to be monitored
This value is for display purposes only. It is not used in the monitor itself.
7. Click Next. The Attributes Configuration page opens.
8. Define the following monitoring-specific attributes:
• ConnectionString – Complete connection string to the SAP server. If you are not sure, record thelogon sequence with Silk Performer. The connection string is the first parameter ofSapGuiOpenConnection.
• Username – SAP username with access rights to the monitoring transaction.• Password – Password for the SAP user.• ClientNum – Client number for the logon procedure, such as 850.• Language – Language to use for logon, such as EN.• Entity – The data entity that should be monitored, such as Dialog, RFC, or Background.
Note: The Entity attribute does not have to be provided for the SAP OS-Monitor.
• TimeFrame – SAP provides the average values of the past interval that you define.
Note: The Timeframe attribute does not have to be provided for the SAP OS-Monitor.
• Server - (ST03N only)The server that should be monitored. Its the name of the tree node that is tobe selected in ST03N. Total will return measures from the overall SAP System
9. Click OK. The Select displayed measures page opens.
10.Check the check boxes for those measures that you want to include in the initial monitor view and thenclick Finish.
A connection to the specified host is established, and an initial view that contains the measures youselected is displayed.
WebLogic (SNMP) Monitoring
This section explains how to monitor BEA WebLogic using Performance Explorer. It also explains importantWebLogic performance measures.
By default, the WebLogic SNMP agent is not running. You can enable SNMP support by using theWebLogic Administration Console. Open the console by typing the URL http://weblogichost:port/console into your browser. In the menu tree on the left, select the SNMP node. This selection opens theSNMP configuration page. Within this page, verify that the SNMP agent is enabled. You must restartWebLogic to enable SNMP support.
Monitoring BEA WebLogic (SNMP)
Establish a connection to a data source to query BEA WebLogic through SNMP and to create an initialview that contains the measures you want to monitor.
70 | Performance Explorer 18.5

1. On the Real-Time Monitoring tab, in the Monitor group, click System. The Data Source wizardopens.
2. Click the Select from predefined Data Sources option button.
3. Click Next. The System selection page opens.
4. Expand the Application Server folder and the BEA WebLogic (SNMP) folder.
5. Select the SNMP node and then click Next. The Connection parameters page opens.
6. In the Hostname text box, specify the host on which WebLogic is running.
7. Click Next. The Add SNMP Measures page opens. BEA-WEBLOGIC-MIB is selected in the list box ofavailable MIBs.
The following entries for monitoring the performance of your WebLogic Server are available:
• bea.wls.jdbcConnectionPoolRuntimeTable• bea.wls.servletRuntimeTable• bea.wls.ejbEntityHomeRuntimeTable• bea.wls.ejbStatelessHomeRuntimeTable• bea.wls.executeQueueRuntimeTable
8. Select jdbcConnectionPoolRuntimeEntry and click Get value(s) to retrieve all available JDBCconnection pools.For example, when monitoring the Pet Store sample application, a connection pool namedServerRuntime:petstoreServer is returned.
Interesting performance counters exposed by connection pools include the following counters:
• JdbcConnectionPoolRuntimeActiveConnectionsCurrentCount – Returns the number ofconnections that are currently being used.
• JdbcConnectionPoolRuntimeWaitingForConnectionCurrentCount – Returns the number ofwaiters for connections. This number is greater than zero when all connections are in use andadditional requests for connections are being sent to the connection pool.
• JdbcConnectionPoolRuntimeWaitSecondsHighCount – Returns the maximum number ofseconds a client waits to check out a connection from the connection pool.
9. To monitor the number of active connections, search for thejdbcConnectionPoolRuntimeActiveConnectionsCurrentCount column in the table that waspreviously returned and select the cell.
Note: Connection pools provide a large number of performance counters. You might need toresize some columns to view the columns in which you are interested.
10.Click Add.
11.Repeat the previous steps until you have entered all commands you require for measure collection, thenclick Close. The Select displayed measures page opens.
12.Check the check boxes for those measures that you want to include in the initial monitor view and thenclick Finish.
A connection to the specified host is established, and an initial view that contains the measures youselected is displayed.
WebLogic (JMX) Monitoring
This section explains prerequisites for monitoring WebLogic (JMX) Server, including configuring IIOP andJMX Management Server.
Enabling JMX Management Server
Enable the JMX Management Server in the Oracle WebLogic console at Configuration > General >Advanced Settings. Set both Compatibility Mbean Server Enabled and Management EJBEnabled. This enables both the legacy and the new JMX interface.
Performance Explorer 18.5 | 71

You must restart your system for these changes to go into effect.
Enabling and Configuring IIOP
You must enable and configure the IIOP protocol in Oracle WebLogic 11g R1 before you can monitorWebLogic (JMX).
1. In the Change Center of the Oracle WebLogic administration console, click Lock & Edit.
2. In the left pane of the console, expand Environment and select Servers.
3. Select the Protocols tab, then select IIOP.
4. Check the Enable IIOP check box to enable the IIOP protocol.
5. To modify the default configuration, click Advanced.
6. To specify a default IIOP user name and password:
a) In the Default IIOP User field, enter a user name.b) In Default IIOP Password field, enter a password.
7. To activate these changes, in the Change Center of the administration console, click ActivateChanges.
You must restart your system for these changes to take effect.
Monitoring WebLogic (JMX)
1. On the Real-Time Monitoring tab, in the Monitor group, click System. The Data Source wizardopens.
2. Click the Select from predefined Data Sources option button.
3. Click Next. The System selection page opens.
4. Expand Application Server and select the WebLogic server version to be monitored.
Select either EJXM or JMX.
5. Click Next. The Connection parameters page opens.
6. In the Hostname text box, specify the host on which WebLogic is running.
7. Specify the WebLogic Port (Default is 7001).
8. Do not specify a user or password.
9. Click Server Configuration.
10.Specify the Java Home directory and the Application Server install directory.
Use a UNC path, including the folder lib. Example: \\<server name>\Oracle\Middleware\wlserver_10.3\server\lib.
Note: If you can not specify a UNC path, copy wljmxclient.jar from the folder <WL_HOME>\server\lib to your local machine and add it to the classpath.
11.Click OK.
12.Click Next. The JMX Data Source Browser opens.
13.Select measures that you want to include in the initial monitor view.
14.Click Finish.
Custom Data SourcesIn addition to predefined data sources, Performance Explorer offers the following monitoring interfaces:
• PerfMon – Provides access to all Windows Performance Monitoring data sources.• REXEC – Provides access to data sources on UNIX-based systems through the Remote Execution
Protocol.
72 | Performance Explorer 18.5

• SNMP – Provides access to monitoring data that is exposed by Simple Network Management Protocolservices.
Monitoring PerfMon Data Sources
PerfMon is a Microsoft-specific monitoring interface that queries performance counters. Establish aconnection to a PerfMon data source and create an initial view that contains the measures you want tomonitor.
1. On the Real-Time Monitoring tab, in the Monitor group, click System.
2. Click Select from predefined Data Sources and then click Next.
3. Expand the Custom Data folder, click NT Performance Monitor Data, and click Next.
4. In the Hostname text box, specify the machine to be monitored.
The host to be monitored might be located on a different NT Domain.
5. Optional: In the Alias text box, specify the alias name.
The alias must be a highly descriptive synonym for the monitored server. It is recommended that yougroup measures on a particular machine.
For example, both WebLogic and IIS might be installed on the same computer. Both servers requiremonitoring, but the two performance measures must appear in separate menu trees.
6. In the Username text box, specify a user who has administrative security rights.
7. In the Password text box, specify the appropriate password for the username.
8. Click Next.
9. Examine your system for available performance counters and add them to the monitoring template.
To select multiple counters from the list, press Ctrl or Shift.
a) Select a counter.b) Select the amount of instances.c) Click Add. The Counter Usage page opens.d) Ensure that Is an average measure is enabled.e) Click Next.f) Add more counters as described above.g) When you are done, click Close.
10.Check the check boxes for those measures that you want to include in the initial monitor view and thenclick Finish.
A connection to the specified host is established, and an initial view that contains the measures youselected is displayed.
Querying Through SNMP
Performance Explorer provides a set of predefined data sources that are queried through SNMP. However,you can add an entry for ORADB-MIB in an SNMP datasource.
Establish a connection to a data source to query through SNMP and create an initial view that contains themeasures you want to monitor.
SNMP involves an SNMP agent, which is typically provided by the application vendor. For example, Oracledatabases expose data sources using their SNMP agents. The client-side counterpart is PerformanceExplorer, which collects performance data.
1. On the Real-Time Monitoring tab, in the Monitor group, click System.
2. Click Select from predefined Data Sources and then click Next.
3. Expand the Custom Data folder, click Snmp Data, and then click Next.
4. In the Hostname field, specify the host running the SNMP agent.
Performance Explorer 18.5 | 73
5. Optional: In the Alias text box, specify the alias name.
The alias must be a highly descriptive synonym for the monitored server. It is recommended that yougroup measures on a particular machine.
For example, both WebLogic and IIS might be installed on the same computer. Both servers requiremonitoring, but the two performance measures must appear in separate menu trees.
6. Specify the port, community, and version that are appropriate and click Next. If you select version 3, thecommunity field disappears.
7. If you have selected version 3, specify the authentication details for SNMPv3 and click Next.
8. Specify the appropriate values to create the measure that you want to monitor as follows:
a) Select an MIB from the Select a MIB, and object, and get the object's value(s) list box. After youselect an MIB, the objects and the object values display in a hierarchical tree below the list box.
b) Select the object that you want to measure. The object's properties are displayed in the text boxesadjacent to the list box.
c) Click Get value(s) to check the object's availability.
If the performance counter is queried successfully, the object's value is displayed in the grid below thelist box.
9. Click Add to add the SNMP measure.
10.Repeat the previous steps until you have entered all the commands that you require for measurecollection, then click Close. The Select displayed measures page opens.
11.Check the check boxes for those measures that you want to include in the initial monitor view and thenclick Finish.
A connection to the specified host is established, and an initial view that contains the measures youselected is displayed.
Adding MIB Files to Browse SNMP Agents
To browse SNMP agents for available performance counters, your MIB files must contain textualdescriptions of performance counters.
1. On the Real-Time Monitoring tab, in the Monitor group, click System.
2. Click Select from predefined Data Sources and then click Next.
3. Expand the Custom Data folder, click Snmp Data, and then click Next.
4. In the Hostname field, specify the host running the SNMP agent.
5. Optional: In the Alias text box, specify the alias name.
The alias must be a highly descriptive synonym for the monitored server. It is recommended that yougroup measures on a particular machine.
For example, both WebLogic and IIS might be installed on the same computer. Both servers requiremonitoring, but the two performance measures must appear in separate menu trees.
6. Specify the port, community, and version that are appropriate and click Next.
7. Select Import new Mib... from the Select a MIB, and object, and get the object's value(s) list.
8. Type the MIB file name that you want to compile in the MIB source file field.
Alternative: Click [...] to navigate to and select the file.
Commonly used MIB files are located in the <public user documents>\Silk Performer18.5\Data\Mibs\VendorMibs directory.
9. Click Import. The MIB file is added to the Compiled MIBs list.
Automatic Detection of Data SourcesThe data source scanner queries your machine for data sources that can be monitored. This eliminates theneed for you to do the search manually. The automatic detection might not find every possible data source,
74 | Performance Explorer 18.5

since it is based on a configuration that closely mimics the predefined data sources. It goes through the listof the predefined data sources and checks for their availability.
For example: The data source scanner queries your machine for the number of processors, the number ofnetwork interfaces, the number of database instances, and how these components can be monitored.
Details such as the platform on which your system runs (NT, AIX, or Linux) do not matter because themonitored components, such as CPU or hard disk utilization, are platform-independent.
Using the Data Source Scanner
The data source scanner queries your machine for data sources that can be monitored.
1. On the Real-Time Monitoring tab, in the Monitor group, click System.
2. Click Have Data Sources detected and then click Next.
3. In the Hostname field, specify the machine that is to be scanned.
4. Optional: In the Alias text box, specify the alias name.
The alias must be a highly descriptive synonym for the monitored server. It is recommended that yougroup measures on a particular machine.
For example, both WebLogic and IIS might be installed on the same computer. Both servers requiremonitoring, but the two performance measures must appear in separate menu trees.
5. Click Next.
The data source scanner now queries your system for the following data sources on various platforms:
• .NET• Active Server Pages• Apache• Coldfusion• IBM Universal Database DB2• Internet Information Servers• iPlanet Directory Servers• Microsoft Proxy Servers• Microsoft SQL Servers• Netscape Directory Servers• Netscape Enterprise 3.0• Netscape/iPlanet Directory Server• Operating System Data, such as hard disk, CPUs, and network interfaces• Oracle Databases• Rstat which often can be queried on UNIX-based systems and provides large amounts of operating
system-related data.• SilkPerformer Agent• SilkPerformer Controller• Silverstream
While your system is scanned, the data source scanner might display dialog boxes that requestcredentials for specific data sources (for a remote execution daemon, for example).
The scanner also checks whether your system resides within a remote NT domain. In such instances,you must provide the domain name of the specified host.
Note: The specified user must possess administration security rights, which are necessary formonitoring NT based systems.
6. When the Progress section indicates Done, click Next.
7. Check the check boxes for those measures that you want to include in the initial monitor view and thenclick Finish.
Performance Explorer 18.5 | 75

A connection to the specified host is established, and an initial view that contains the measures youselected is displayed.
Monitoring Load TestsWith Performance Explorer, you can collect data for client-side monitoring in addition to server data.
Configuring Load Test MonitoringTo use real-time client-side measures, such as in built-in charts and monitor reports, add a connectionentry for the client-side data source.
1. On the Real-Time Monitoring tab, in the Monitor group, click Load Test.
2. In the Hostname field, specify the host name of the load test controller.
3. In the Alias field, specify the alias for the controller that provides the client-side measures. The alias willdisplay in the Client-Side Measures tree.
4. Click Finish.
The host appears in the tree. The client-side measures that are available on this data source are listed infolders in the tree.
Note: Check the Enable real-time measures check box in the Workload Configuration dialog,which instructs the runtime system to supply host measures. A green icon on in the Client-SideMeasures tree indicates a successful connection to the data source. A red icon indicates that thedata source is not connected.
Removing Client-Side MeasuresYou can remove a client-side measure node from the tree. However, Silk Performer replaces the measurenode if it receives updated information for the measure.
1. Click the Client-Side Measures tab in the tree area.
2. Right-click the measure node that you want to delete and click Remove Client-Side Data Source.
3. Click Yes.
Monitor Charts and Monitor WritersPerformance Explorer provides monitor charts and monitor reports to display and store measured values.
• A monitor chart displays the measured values of a data source in real-time. You can adjust the pollinginterval of a monitor chart.
• A monitor writer records the measured values of a data source and stores them in a .tsd file. Monitorwriters are also useful to compare server-side and client-side measures when a load test is completed.
Note: A short polling interval can reduce the performance of your computer which, consequently, caninfluence test results. For large load tests, define intervals greater than 60 seconds.
Note: The values that display in a monitor chart cannot be written to a .tsd file afterwards.
Creating Monitor ChartsMonitor charts are useful for providing a graphical overview of the state of a system.
1. On the Real-Time Monitoring tab, in the New group, click Monitor Chart.
2. Drag measures from the Monitor tree onto the chart.
3. Right-click a measure in the measure list and click Properties.
76 | Performance Explorer 18.5

4. On the General tab, you can adapt the caption and description.
5. On the Monitor tab, you can adapt monitor and view options: The Interval defines the refresh rate forretrieving new values. The Page size defines how many intervals display on each page. The Historysize defines how many intervals are stored in the chart history.
6. Click OK.
Tip: You can also create a Transaction Rate Monitor. Performance Explorer will automaticallypopulate this chart with transaction measures. Make sure to Enable real-time measures on theWorkload Configuration dialog before you start monitoring.
Creating Monitor WritersA monitor writer can be defined to capture measures during load tests. Monitor writes write a time seriesdata (.tsd) file that you can include in an overview report or use as the basis for a chart.
1. On the Real-Time Monitoring tab, in the New group, click Monitor Writer.
2. Drag measures from the Monitor tree onto the writer.
3. On the Real-Time Monitoring tab, in the Control group, click Recording.
4. Specify a directory for the .tsd file and click Save. Performance Explorer will write all captured valuesinto this .tsd file.
Note: If you are running a load test and the workspace you have assigned to your profiles containsa monitor writer, all monitor writers begin writing automatically when the test starts and stop whenthe test finishes.
All monitor writers are stored in the result directory of the load test.
Note: For SAPGUI data sources, it is recommended that you change the monitor interval to 20seconds or higher. To change the interval, click Properties in the Report group, on the Report tab.Then click the TSD-Writer tab and change the interval.
Host DataYou can change, rename, and duplicate hosts and update the credentials that allow you to access a host.
Changing HostsYou can change a host that has already been specified or you can change just the alias of the host. In bothcases, the specified measures, which display in the tree, will not be lost.
1. Select a host (a top-level node) in the Monitor tree.
2. On the Real-Time Monitoring tab, in the Host group, click Change.
3. To change the host, enter the Hostname of the new host, enter an Alias, and click Next.
4. To change the alias of the host (the name that displays in the Monitor tree), enter the Hostname of thecurrent host, enter a new Alias, and click Next.
5. Enter the Username and Password and click Finish.
Duplicating Hosts
When you duplicate a host, Performance Explorer creates a new host node in the Monitor tree and addsall measures that are specified for the selected host.
1. Select a host (a top-level node) in the Monitor tree. This host will be duplicated.
2. On the Real-Time Monitoring tab, in the Host group, click Duplicate.
Performance Explorer 18.5 | 77

3. Specify the Hostname of the new host and an Alias and click Next. The alias will display as name ofthe new host in the Monitor tree. Depending on the specified data source, fields with variousconnection parameters appear. These fields are automatically populated with the original values.
If there are configurable attributes for the specified data source, a Change Attributes button appears.
4. Enter the credentials of the host and click Finish. The measures are checked to confirm validity. Ifinvalid measures are discovered, you have the option of changing the connection parameters orignoring the measures.
Note: It is not possible to duplicate or rename invalid measures.
Note: Measures are grouped into measure groups when they use the same data source andconnection parameters. For example: If you have PerfMon measures with different credentials, youhave different measure groups.
Editing Host CredentialsThe security policies of many companies require that user passwords expire at regular intervals. Suchpolicies can create in automatic access of tools like Performance Explorer. For such environments,Performance Explorer enables you to change user names and passwords for existing hosts.
1. Select a host (a top-level node) in the Monitor tree.
2. On the Real-Time Monitoring tab, in the Host group, click Edit Credentials.
3. The Hostname and the Alias of the selected host are already prefilled. Click Next.
4. If necessary, click Change Attributes.
5. Change the Username and Password as required and click Finish.
Converting Data from CSV to TSDSilk Performer offers a command-line tool (csv2tsd.exe) that enables you to convert .csv files (comma-separated values) into .tsd files (time series data).
Converting data to the .tsd format is useful when you monitor external Windows data that, for securityreasons, cannot be monitored by Silk Performer. By converting .csv data into the .tsd format, external datacan be analyzed alongside internal Silk Performer monitoring data within Performance Explorer.
For example, if a performance counter measures the behavior of a remote server and the results of thatmonitor are saved in .csv files, those results can be imported into Performance Explorer for analysisalongside the results of a Silk Performer load test involving the same server. Using Silk Performer, you thenhave the opportunity to look for correlations between the two data sets.
Generating a CSV File on a Remote Server for Windows XP/2003Any performance counter log (CSV) file you specify in the command line tool must follow the formatgenerated by the Windows Performance Monitor tool ( Administrative Tools > Performance ). So, beforeusing csv2tsd.exe you must create a performance counter with settings that will allow you to import itsdata.
1. Open the Windows Performance Monitor tool ( Administrative Tools > Performance ).
2. Expand the Performance Logs and Alerts tree node.
3. Right-click the Counter Logs node and select New Log Settings from the context menu.
4. Enter a name for the new log settings file on the New Log Settings dialog and click OK.
5. The properties dialog for the new log settings file is displayed. Click the Add Counters button to openthe Add Counters dialog.
6. Specify the computer, performance object, counter and counter instances for which you want to trackresults.
78 | Performance Explorer 18.5
7. Close the Add Counters dialog.
8. Click the Log Files tab on the <Counter log> Properties dialog box.
9. From the Log file type list box, select Text File (Comma delimited).
10.Click OK to close the dialog.
11.Close the Performance Monitor.
Once you have configured a performance counter so that its log results can be converted to TSD formatusing csv2tsd.exe, you can start capturing behavioral data using the performance counter.
Generating a CSV File on a Remote Server for Windows 7/2008 R2Any performance counter log (CSV) file you specify in the command line tool must follow the formatgenerated by the Windows Performance Monitor tool ( Administrative Tools > Performance ). So, beforeusing csv2tsd.exe you must create a performance counter with settings that will allow you to import itsdata.
1. Open the Windows Performance Monitor tool ( Administrative Tools > Performance ).
2. Expand the tree Performance > Data Collector Sets > User Defined.
3. Right-click and select New > Data Collector Set from the context menu.
4. Enter a name and select Create manually (Advanced) and click Next.
5. Create data logs and select Performance counter. Click Next.
6. Specify the location of the CSV file and click Next.
7. Optional: Specify a different user in Run as. Click Save and close the dialog box.
8. Right-click on the defined Data Collector Set and select New > Data Collector from the context menu.
9. Enter a name and select Performance counter data collector. Click Next.
10.Click Add to add the performance counters.
11.Specify the computer (can be both local and remote) and performance counter instances for which youwant to track results.
12.Select Open properties for this data collector and click Next.
13.On the Performance Counters tab specify the log format to be Comma Separated.
14.Select the File tab and specify a file name.
15.Click OK to close the dialog.
16.Close the Performance Monitor.
Once you have configured a performance counter so that its log results can be converted to TSD formatusing csv2tsd.exe, you can start capturing behavioral data using the performance counter.
Capturing Performance Counter Log DataOnce you have configured a performance counter so that its log results can be converted to TSD formatusing csv2tsd.exe, you can start capturing remote-server log data using the performance counter.
1. Open the Windows Performance Monitor tool ( Administrative Tools > Performance ).
2. Expand the Performance Logs and Alerts tree node.
3. Click the Counter Logs node.
4. Right-click a counter log in the right-hand window and select Start from the context menu.
Active counters are shown in green. Inactive counters are shown in red.
Generated CSV counter log files have the following format:
"(PDH-CSV 4.0) (W. Europe Standard Time)(-60)","\\JONES\Processor(_Total)\% Interrupt Time","\\JONES\Processor(_Total)\% Privileged Time","\\JONES\Processor(_Total)\% Processor Time""02/25/2008 23:24:23.826"," "," "," "
Performance Explorer 18.5 | 79

"02/25/2008 23:24:38.841","0","0.10406093659265107","0.10150087105497141""02/25/2008 23:24:53.841","0.052084666700800877","1.8229633345280307","2.4454192693999621""02/25/2008 23:25:08.840","0.052084666700800877","3.0729953353472514","5.4663299380464103""02/25/2008 23:25:23.840","0.052084666700800877","0.57293133370880955","1.0391332684783428"
Converting a Properly Formatted CSV File to TSD Format
1. Launch csv2tsd.exe ( Start > All Programs > Silk > Silk Performer18.5 > Analysis Tools > CSVto TSD Converter ).
2. Enter file-import and export settings using the following format: Csv2Tsd <csvFile> <tsdfile>[[+/-]<time offset>].
<csvFile> is the full path of the CSV file to be imported. <tsdFile> is the full path of the TSD file thatis to be generated. <time offset> is the time difference in seconds (the default is 0).
3. Hit Enter to execute the conversion.
Example:
Csv2Tsd C:\perflogs\Test1.csv C:\perflogs\Test1.tsd
Built-In MeasuresA measure is the smallest grouping entity for the values that are collected during a load test or during amonitoring session for a particular measuring point. A measure has a name and type. A set of measuredvalues that are related to the measure is stored as a series in a time series data (.tsd) file.
Measures can be either timers or counters. Timers collect data related to response times, counters collectdata on throughput and load test events.
Performance Explorer provides a big amount of measures, which are divided into groups.
Summary MeasuresThe group Summary Measures contains summarized measurements on a global level. It containsmeasures that aggregate individual measures from other measure groups as well as measure types thatrepresent information on a global level that are not included in other measure groups.
This group contains only counters, it does not contain timers. It represents a fixed set of global measuresthat are collected only during the measurement period, thus excluding the warm-up and shutdown periodof the load test. The Summary Measures group contains measure types that are available as real-time dataand time-series data (.tsd).
General MeasuresDisplays the measures that are shown at the beginning of the overview report.
Measure Description
Active users The number of active virtual users. A virtual user is regarded as active if ithas been started and is currently in one of the following states:
• executing• warm up• wait database
80 | Performance Explorer 18.5

Measure Description
• loading documents• wait resource• rendezvous• thinktime• shutdown
A virtual user is regarded as inactive if it currently is in one of the followingstates:
• starting• wait queue• wait user• wait stop• pacing time• suspended
Transactions The number of Silk Performer transactions that have completed,regardless of whether or not they were successful.
The overview report shows the following information:
• A graph indicating how many transactions ended in a given second.• Average number of ended transactions per second.• Total number of ended transactions.
Errors The number of API errors, including Internet, database, and middlewareAPIs. An API error is counted if the severity is error or higher(transaction exit or process exit). An error is ignored if theseverity is informational or warning.
Running users The number of running virtual users. A virtual user is regarded as runningif it has been started and not been stopped. In contrast to the measureActive users, it also includes virtual users that are in one of the followingstates:
• wait queue• wait user• wait stop• pacing time
Agent Health Control MeasuresDescribes the measures that are used for analyzing an agent's health.
Measure Description
CPU utilization The percentage of time that a processor is busy executing tasks. If theprocessor utilization is equal to or near 100%, the computer has run outof available processing capacity.
Memory The percentage amount of memory allocated (committed) by the drivermachine in relation to the total amount of physical RAM. High memoryutilization indicates that the driver machine is low on available memory,and this situation can cause disk swapping, which degrades the overallperformance of the computer.
Note: Task Manager may show different memory statisticsdepending on your operating system.
Responsiveness For most Silk Performer project types the responsiveness measure isdetermined directly by the internal measure System Health.
Performance Explorer 18.5 | 81

Measure Description
For Silk Performer projects of type SAP GUI, Citrix, or browser driven loadtesting (BDLT), the responsiveness measure also takes into account thehealth of the application under test (SAP GUI orperfBrowserHost.exe). This health is indicated by the internal AppHealth value. The overall Responsiveness measure corresponds to theworse of these two health values.
Internet-Related MeasuresDescribes the measures that are related to the internet connection.
Measure Description
Concurrent connections The number of currently open TCP/IP connections.
Requests sent The number of HTTP requests sent by low-level web functions, thenumber of data packets sent by TCP/IP-level functions, or the number ofcommands sent by POP3, SMTP, FTP, or LDAP function calls. SilkPerformer also includes LDAP traffic in this measure; it reports thenumber of LDAP requests sent. IIOP uses other counters.
Requests failed The number of the requests listed above that are not sent or executedsuccessfully. IIOP uses other counters.
Request data sent The amount of data (in KB) sent to the server, including header and bodycontent information as well as all TCP/IP-related traffic (HTTP, nativeTCP/IP, IIOP, POP3, SMTP, FTP, and LDAP), and secure traffic over SSL/TLS. It does not include data overhead caused by encryption usingSSL/TLS or other API-related traffic like TUXEDO ATMI, ODBC, andOracle OCI.
Responses received The number of HTTP responses received by low-level web functions, thenumber of data packets received by TCP/IP-level functions, and thenumber of responses received by POP3, SMTP, FTP, and LDAPfunctions. IIOP uses other counters.
Responses failed The number of the expected responses that are not receivedsuccessfully. IIOP uses other counters.
Response data received The amount of data (in KB) received from the server, including headerand body content information as well as TCP/IP-related traffic (HTTP,native TCP/IP, IIOP, POP3, SMTP, FTP, and LDAP), and secure trafficover SSL/TLS. It does not include API-related traffic like TUXEDO ATMI,ODBC, and Oracle OCI.
Connects successful The number of successful TCP/IP connects to the remote hostsestablished by low-level, TCP/IP-level, IIOP, SMTP, POP3, FTP, or LDAPfunctions.
Connects failed The number of TCP/IP connection failures caused by invalid host names,invalid IP addresses, invalid ports, unavailable remote hosts, network-related problems, or authentication failures. This counter is used by low-level, TCP/IP-level, IIOP, SMTP, POP3, FTP, and LDAP functions. Bydefault, low-level web functions perform up to three connect attempts (upto two retries). Only if all attempts fail, a failure is recorded.
Connects retries The number of attempts to connect to the server if the initial connectionfails.
Page data The amount of data (in KB) for all requests and responses related to therequest and retrieval of an entire Web page, including all embeddedobjects.
Embedded objects data The amount of data (in KB) for all requests and responses related to therequest and retrieval of objects embedded in a Web page.
82 | Performance Explorer 18.5

Web-Specific MeasuresDescribes the measures that are specific for the Web.
Measure Description
HTTP request retries The number of times a client is forced to retry a request. This mayhappen when the server closes a persistent connection (available withKeep-Alive or HTTP/1.1) because of a timeout occurring while the clienttries to send a request. This counter is used only by low-level webfunctions.
HTTP redirections The number of HTTP redirections performed due to a Web serverresponse with status code 3xx. This measure is incremented only by Webfunctions.
HTTP re-authentications The number of re-authentications necessary because of a status code401 or 407 returned by the Web server. This counter is used only by Webfunctions that perform basic authentication.
HTTP hits The number of HTTP requests that arrive at the Web server. Thismeasure is incremented only by Web functions.
Hits failed The number of failed HTTP requests. This measure is incremented onlyby Web functions.
HTTP 1xx responses The number of HTTP responses containing status codes indicating thattheir content has the status informational. This measure isincremented by Web functions.
HTTP 2xx responses The number of HTTP responses containing status codes indicatingsuccessful requests. This measure is incremented by Web functions.
HTTP 3xx responses The number of HTTP responses containing status codes indicatingredirected requests. This measure is incremented by Web functions.
HTTP 4xx responses The number of HTTP responses containing status codes indicating clienterrors. This measure is incremented by Web functions.
HTTP 5xx responses The number of HTTP responses containing status codes indicatingserver errors. This measure is incremented by Web functions.
HTTP cache conditional reloads The number of requests sent to the server to download an item if itscontent has changed since it was last placed in the cache.
HTTP cache hits The number of times requests that are fulfilled from the cache.
HTTP cookies sent The number of cookies sent by low-level web functions. If the header lineof an HTTP cookie request contains multiple cookies, each cookie in theheader is counted.
HTTP cookies received The number of cookies received by low-level web functions. If the HTTPresponse includes multiple cookie header lines, each cookie of theseheader lines is counted.
HTTP pages The number of HTML pages requested by the page-level Web API or bythe low-level Web API when Java script simulation is enabled.
IIOP-Related MeasuresThe following table describes the scripted measures which relate to IIOP operations.
Measure Description
IIOP messages The number of IIOP messages sent by Silk Performer.
IIOP requests The number of IIOP request messages sent by Silk Performer.
IIOP loc requests The number of IIOP locate request messages sent by Silk Performer.
IIOP fragments sent The number of fragmented IIOP messages sent by Silk Performer.
Performance Explorer 18.5 | 83

Measure Description
IIOP replies OK The number of IIOP reply messages with status OK received by SilkPerformer.
IIOP replies exception The number of IIOP reply messages with the status exceptionraised received by Silk Performer. This count includes systemexceptions as well as user exceptions.
IIOP replies obj moved The number of IIOP reply messages with the status object hasmoved. This status message causes Silk Performer to reissue therequest to the new location.
IIOP request timed out The number of times the time limit for receiving data (specified in theload-testing script) was exceeded while waiting for a pending reply.Whenever the time limit is exceeded, no reply is received and SilkPerformer sends an IIOP Cancel Request message to inform theserver about the aborted operation.
IIOP loc replies obj here The number of IIOP Locate Reply messages with status objecthere received by Silk Performer.
IIOP loc replies obj unknown The number of IIOP Locate Reply messages with status objectunknown received by Silk Performer.
IIOP loc replies obj moved The number of IIOP Locate Reply messages with status objectmoved received by Silk Performer.
IIOP message errors The number of IIOP error messages received by Silk Performer.
IIOP fragments received The number of fragmented IIOP messages received by Silk Performer.
IIOP loc request timed out The number of times that the time limit for receiving data (specified in theload-testing script) was exceeded while waiting for a pending locate reply.Whenever the time limit is exceeded, no locate reply is received and SilkPerformer sends an IIOP Cancel Request message to inform theserver about the aborted operation.
Database-Specific MeasuresThe following table describes the measures that are specific to the database.
Measure Description
SQL commands The number of SQL commands sent to the DBMS for execution.
Open database logins Counts the currently open database sessions. This counter is relevant forthe OCI, ODBC, and ODBC high-level interfaces (This measure is notavailable in report files).
Open database cursors Counts the currently opened database cursors (handles). This counter isrelevant for the OCI, ODBC, and ODBC high-level interfaces. For ODBC,only OdbcClose calls with the SQL_DROP option decrease this measurevalue. (This measure is not available in report files.)
Transaction MeasuresThe Transaction measure group contains response-time data on the transaction level. For each transactiondefined in your load-test script, a measure of this group type is automatically created, using the name ofthe transaction as the key for the measures. Only measures that contain a counted value are displayed.This fact means that Trans.failed is not displayed if none of the transactions fail.
Note: The transactions TInit and TEnd do not count towards the load-test measures becausebeginning and ending transactions should not contain measures that relate to the application undertest.
84 | Performance Explorer 18.5

The following table describes the corresponding measure types.
Measure Description
Trans. ok The response time for successful transactions, in seconds. A transactiontime is reported in this measure type if no API function call performedwithin the transaction returns an error message.
Trans.(busy) ok The busy time for successful transactions, in seconds. A transaction busytime is the transaction response time without any think time, wait time,and time necessary for function transformations. A transaction time isreported in this measure type if no API function call performed within thetransaction returns an error message.
Trans. failed The response time for failed transactions, in seconds. A transaction timeis reported in this measure type if at least one error of severity error orhigher occurs within the transaction.
Trans.(busy) failed The busy time for failed transactions, in seconds. A transaction busy timeis the transaction response time without any think time, wait time, andtime necessary for function transformations. A transaction time isreported in this measure type if at least one error of severity error orhigher occurs within the transaction.
Trans. canceled The response time for canceled transactions, in seconds. A transactiontime is reported in this measure type if a return statement in the script isissued with a return value of 1.
Web Form MeasuresThe Web Form measure group contains the measure types related to forms declared in the dclformsection of a load-test script. The Web Form measure group provides response time and throughput ratesfor form submissions with the POST, GET, and HEAD command sent by scripting function calls. For eachform declared in the dclform section, a measure group is created automatically with the name of the formas the key. The following table describes the corresponding measure types:
Measure Description
Server busy time Measure, in seconds, that starts after the user has sentthe complete request and ends when the user receivesthe first part of the response.
Round trip time The time, in seconds, that it takes to send a request andreceive the appropriate response. It also includes theconnect and shutdown time when the connection is notpersistent (the connection can persist if the Keep-Aliveoption is enabled or HTTP/1.1 is used).
Hits The number of successful form submissions.
Request data sent The amount of data (in KB) sent to the Web server duringsubmission of a form. This measure also includes HTTPheader and body content information. The count specifiesthe number of Web server requests sent.
Response data received The amount of data (in KB) received from the Web serverin response to the submission of a form. This measurealso includes HTTP response header and body contentinformation. The count specifies the number of Webserver responses received.
Performance Explorer 18.5 | 85

Web Page MeasuresThe Web Page measure group contains the measure types related to Web pages. For each Web page thatis downloaded during a load test, a measure group is created automatically with the name of the Web pageas the key. The following table describes the corresponding measure types:
Measure Description
Page time The time, in seconds, that it takes to retrieve an entire Web page fromthe server, that is, for retrieving all HTML documents and all embeddeddocuments, such as images, videos, and audio files.
Document download time The time, in seconds, that it takes to retrieve all HTML documents of aWeb page.
Server busy time The time, in seconds, that the server takes to process a Web pagerequest. This measure starts after a virtual user has sent the last byte ofthe request and ends when the user retrieves the first byte of theresponse.
Page data The amount of data (in KB) for all requests and responses related to therequest and retrieval of an entire Web page including all embeddedobjects.
Embedded objects data The amount of data (in KB) for all requests and responses related to therequest and retrieval of objects embedded on a Web page.
Browser-Driven MeasuresThe following table describes the corresponding measure types:
Measure Description
Dom interactive Reflects the time span from the request until the browser has completedparsing all HTML elements and constructing the DOM.
Dom complete Reflects the time span from the request until the browser has completeddownloading and processing all resources (images, stylesheets, scripts,and so on).
Load End Reflects the time span from the request until the browser has completedexecuting the onLoad function. As a final step in every page load processthe browser sends an onLoad event, which triggers the onLoad function.Once the onLoad functions are executed, additional application logicmight be executed.
First paint Reflects the time span from the request until the page begins to display.
Time to interact Reflects the time span from the request until all TTI-relevant elementsare available on the page. At this point in time, the user can interact withthe web page.
Action time Reflects the time span from the request until the browser has completeddownloading and processing all resources. The end of this time spanvaries, depending on the defined synchronization mode: If thesynchronization mode HTML is defined, the action time ends when theonLoad function is completed. If the synchronization mode AJAX isdefined, the action time ends during the Asynchronous Application Logicphase.
86 | Performance Explorer 18.5

CORBA-Specific MeasuresThe IIOP measure group contains the measure types related to IIOP operations that are called within aload-testing script. It provides response time and throughput ratings for the IIOP operation calls issued bythe API function IiopRequest. With the IiopObjectSetMeasures function you can specify a prefix tothe name of the measure groups associated with the operations of a certain CORBA object. If you decidenot to do so, the name of the operation is used as the name of the corresponding measure group. Thefollowing table describes the corresponding measure types:
Measure Description
Round trip time The time measured, in seconds, from when the processing of theIiopRequest function call begins to when the processing of thereply of the CORBA object ends.
Server busy time Measure, in seconds, that starts after a user has sent the last byte ofthe CORBA operation call and ends when the user retrieves the firstbyte of the response.
Note: Depending on the content of the application and therequest, server busy time might begin before the last byte is sentand continue after the user has received the first byte.Therefore, server busy time is, in many cases, only anapproximation.
For non-blocking IIOP requests, these measures are performed in the same way. This approach can leadto a situation where the sum of all your measured times exceeds the total time of your load test.
If a CORBA object decides to redirect a request, the IiopRequest function has to reissue this request toa different location. The result is two request-reply message pairs, where both are measured separately. Asin the case of the measure times for the IiopRequest function, the sum of both (separately measured)request-reply pairs is supplied.
SQL Database-Specific MeasuresThe following table describes the corresponding measure types:
Measure Description
Parse The time, in seconds, that it takes to prepare (Oracle terminology: parse) a SQLcommand. Preparing a SQL command usually includes a server round-trip during whichthe SQL command is sent to the server. The SQL command is then parsed andtransformed into an internal format that can be reused on subsequent calls of that SQLcommand.
Note: If you use the OraParse function with the ORA_DEFERRED option, theparsing of the SQL command is deferred to the execute step, and the serverround-trip time is produced for the parse step. In this case, this measure type ismeaningless.
Exec The time, in seconds, in which a SQL command is executed. Executing a SQL commandincludes at least one server round-trip for sending the command and returning the resultto enable the SQL command to be executed. Because of the considerable amount of dataprocessing required on the server for a SQL command, executing SQL commands usuallygenerates a major part of the load on the database server. A separate measure type in theSQL measure group is used for fetching data. Fetching data can either be included as part
Performance Explorer 18.5 | 87

Measure Description
of the execute step or in a separate step. In the latter case, results are not included in theSQL measure group.
ExecDirect The time, in seconds, in which a SQL command is prepared and executed.
Middleware-Specific MeasuresThe TUXEDO measure group contains the measure types related to TUXEDO service calls performed in aload-testing script. It provides response time and throughput ratings for the TUXEDO service calls issuedby the functions Tux_tpcall, Tux_tpacall, Tux_tpsend, Tux_tprecv, Tux_tpgetrply,Tux_tpenqueue, and Tux_tpdequeue. For each TUXEDO service used in these TUXEDO functions, ameasure group is created automatically with the name of the service as the key. The following tabledescribes the corresponding measure types:
Measure Description
Response time The response time, in seconds, for a TUXEDO service call. Forsynchronous service calls, the response time includes the time theserver needs to process the call. For asynchronous service calls, SilkPerformer reports the time that elapses between sending the requestand receiving the reply, plus the time spent waiting for the request.Asynchronous service calls do not measure the time a server needs toexecute the service. For send and request calls, Silk Performermeasures the time for sending data across an open connection as wellas the time for receiving data from an open connection. For queuingcommunication, both the time required for sending the service call tothe queue and the time for retrieving the results of a service call aremeasured.
Request data sent The amount of data (in KB) sent to the TUXEDO server for submissionof a given service. Silk Performer measures the application data buffersize used by the service calls rather than the transferred bytes on thenetwork.
Response data received The amount of data (in KB) received from the TUXEDO server by agiven service. Silk Performer measures the application data buffer sizeused by the service calls rather than the transferred bytes on thenetwork.
Citrix-Specific MeasuresThe Citrix Synchronization Points measure group states how many synchronization functions already havebeen executed. The main purpose of this measure is to visualize the progress of a transaction.
Measure Description
Citrix Synchronization points The number of executed Citrix synchronization functions(CitrixWaitForXXX).
Custom Timer MeasuresThe Custom Timer measure group contains the timers that are defined in the load test script with theMeasureStart and the MeasureStop functions, as the following table shows.
88 | Performance Explorer 18.5

Measure Description
Response time The time, in seconds, measured between MeasureStart andMeasureStop function calls.
Busy time The busy time, in seconds, measured between MeasureStart andMeasureStop function calls.
A busy time is the response time without any think time, wait time, andtime necessary for function transformations.
Note: You can pause and resume timers with the MeasurePause and the MeasureResume function.
Custom Counter MeasuresThe Custom Counter measure group contains the counters that are defined in the load-testing script withthe MeasureInc function, as the following table shows.
Measure Description
Custom counter Counts values that are set with the MeasureInc function.
Streaming MeasuresThe following table describes the corresponding measure types:
Measure Description
Actual video duration The play time of all downloaded media segments (thecomplete stream) in seconds.
Overall download time The download time of all media segments in seconds.
Segments The number of all downloaded media segments.
Segments critical D/P ratio The number of media segments with a D/P ratio(download time/play time ratio) of more than 0.9.
Stream D/P ratio The ratio of the download time to the play time (D/P ratio).A value over 0.9 indicates potential lagging/stuttering/buffering.
Stream size The size of all downloaded media segments (thecomplete stream) in kilobytes.
Time to first segment The time elapsed from loading the page to the completedownload of the first media segment.
Command Line ParametersPerformance Explorer offers a number of parameters that you can execute from a command line interface.
Available CommandsThe following table lists the Performance Explorer commands that you can use in a command lineinterface.
Performance Explorer 18.5 | 89
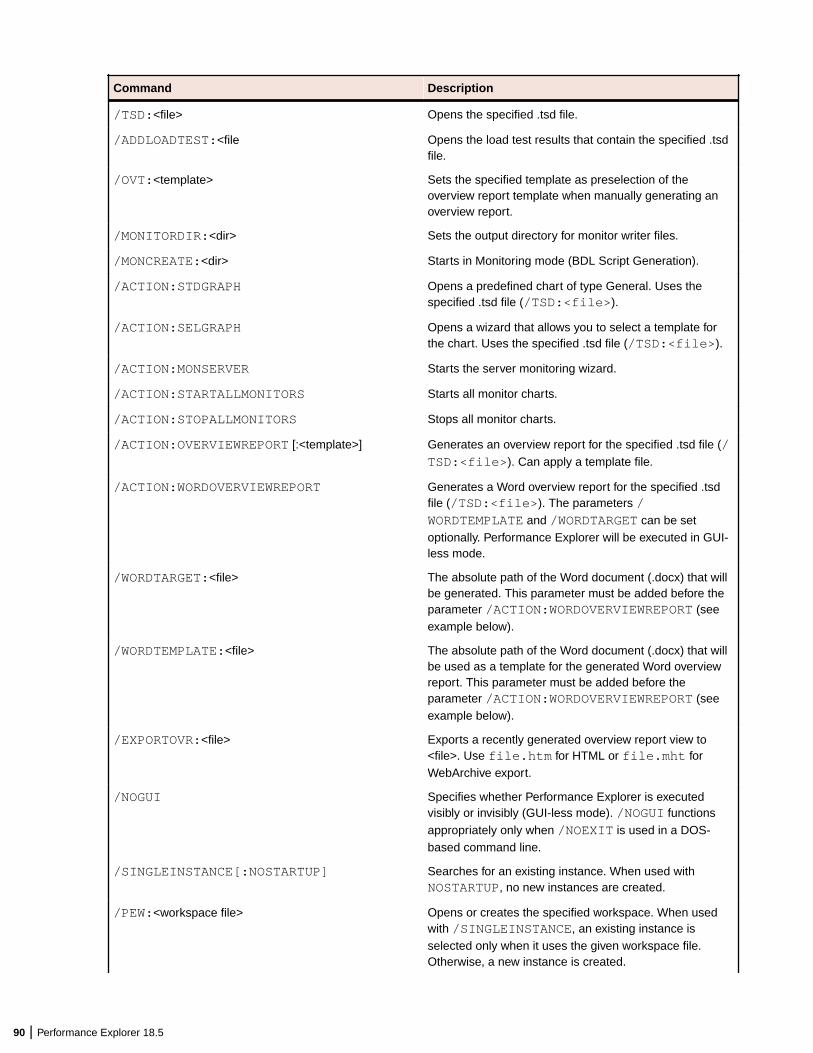
Command Description
/TSD:<file> Opens the specified .tsd file.
/ADDLOADTEST:<file Opens the load test results that contain the specified .tsdfile.
/OVT:<template> Sets the specified template as preselection of theoverview report template when manually generating anoverview report.
/MONITORDIR:<dir> Sets the output directory for monitor writer files.
/MONCREATE:<dir> Starts in Monitoring mode (BDL Script Generation).
/ACTION:STDGRAPH Opens a predefined chart of type General. Uses thespecified .tsd file (/TSD:<file>).
/ACTION:SELGRAPH Opens a wizard that allows you to select a template forthe chart. Uses the specified .tsd file (/TSD:<file>).
/ACTION:MONSERVER Starts the server monitoring wizard.
/ACTION:STARTALLMONITORS Starts all monitor charts.
/ACTION:STOPALLMONITORS Stops all monitor charts.
/ACTION:OVERVIEWREPORT [:<template>] Generates an overview report for the specified .tsd file (/TSD:<file>). Can apply a template file.
/ACTION:WORDOVERVIEWREPORT Generates a Word overview report for the specified .tsdfile (/TSD:<file>). The parameters /WORDTEMPLATE and /WORDTARGET can be setoptionally. Performance Explorer will be executed in GUI-less mode.
/WORDTARGET:<file> The absolute path of the Word document (.docx) that willbe generated. This parameter must be added before theparameter /ACTION:WORDOVERVIEWREPORT (seeexample below).
/WORDTEMPLATE:<file> The absolute path of the Word document (.docx) that willbe used as a template for the generated Word overviewreport. This parameter must be added before theparameter /ACTION:WORDOVERVIEWREPORT (seeexample below).
/EXPORTOVR:<file> Exports a recently generated overview report view to<file>. Use file.htm for HTML or file.mht forWebArchive export.
/NOGUI Specifies whether Performance Explorer is executedvisibly or invisibly (GUI-less mode). /NOGUI functionsappropriately only when /NOEXIT is used in a DOS-based command line.
/SINGLEINSTANCE[:NOSTARTUP] Searches for an existing instance. When used withNOSTARTUP, no new instances are created.
/PEW:<workspace file> Opens or creates the specified workspace. When usedwith /SINGLEINSTANCE, an existing instance isselected only when it uses the given workspace file.Otherwise, a new instance is created.
90 | Performance Explorer 18.5
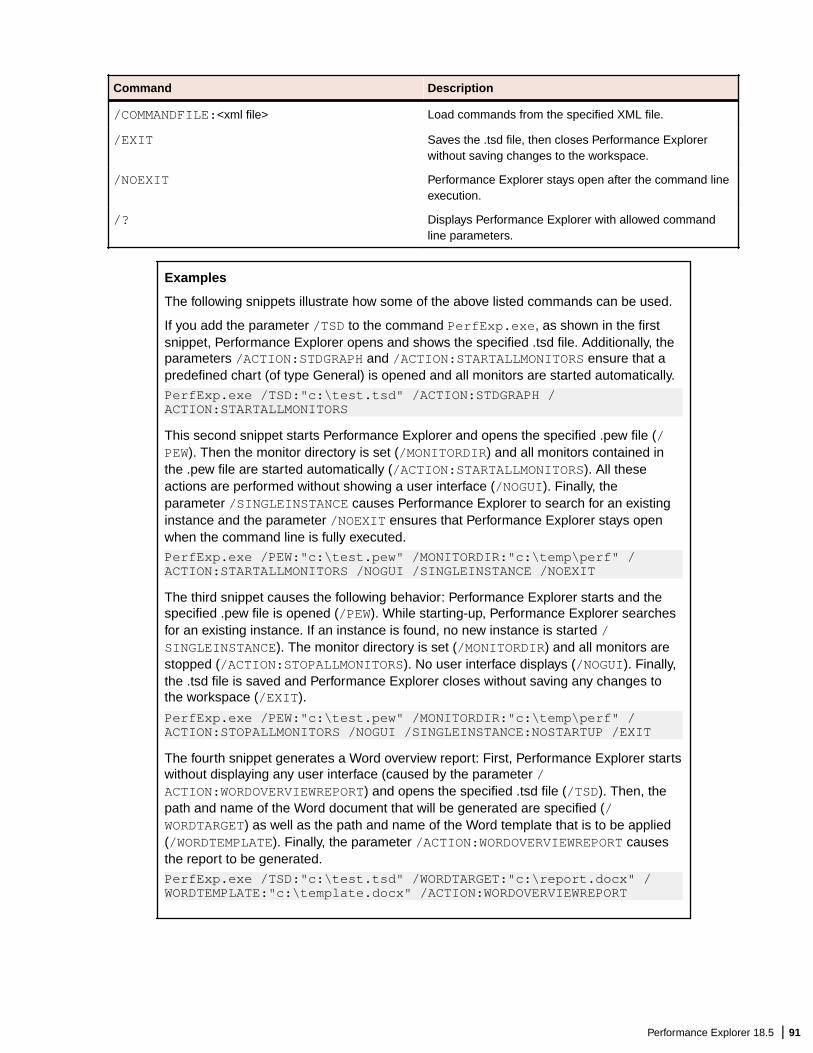
Command Description
/COMMANDFILE:<xml file> Load commands from the specified XML file.
/EXIT Saves the .tsd file, then closes Performance Explorerwithout saving changes to the workspace.
/NOEXIT Performance Explorer stays open after the command lineexecution.
/? Displays Performance Explorer with allowed commandline parameters.
Examples
The following snippets illustrate how some of the above listed commands can be used.
If you add the parameter /TSD to the command PerfExp.exe, as shown in the firstsnippet, Performance Explorer opens and shows the specified .tsd file. Additionally, theparameters /ACTION:STDGRAPH and /ACTION:STARTALLMONITORS ensure that apredefined chart (of type General) is opened and all monitors are started automatically.
PerfExp.exe /TSD:"c:\test.tsd" /ACTION:STDGRAPH /ACTION:STARTALLMONITORS
This second snippet starts Performance Explorer and opens the specified .pew file (/PEW). Then the monitor directory is set (/MONITORDIR) and all monitors contained inthe .pew file are started automatically (/ACTION:STARTALLMONITORS). All theseactions are performed without showing a user interface (/NOGUI). Finally, theparameter /SINGLEINSTANCE causes Performance Explorer to search for an existinginstance and the parameter /NOEXIT ensures that Performance Explorer stays openwhen the command line is fully executed.
PerfExp.exe /PEW:"c:\test.pew" /MONITORDIR:"c:\temp\perf" /ACTION:STARTALLMONITORS /NOGUI /SINGLEINSTANCE /NOEXIT
The third snippet causes the following behavior: Performance Explorer starts and thespecified .pew file is opened (/PEW). While starting-up, Performance Explorer searchesfor an existing instance. If an instance is found, no new instance is started /SINGLEINSTANCE). The monitor directory is set (/MONITORDIR) and all monitors arestopped (/ACTION:STOPALLMONITORS). No user interface displays (/NOGUI). Finally,the .tsd file is saved and Performance Explorer closes without saving any changes tothe workspace (/EXIT).
PerfExp.exe /PEW:"c:\test.pew" /MONITORDIR:"c:\temp\perf" /ACTION:STOPALLMONITORS /NOGUI /SINGLEINSTANCE:NOSTARTUP /EXIT
The fourth snippet generates a Word overview report: First, Performance Explorer startswithout displaying any user interface (caused by the parameter /ACTION:WORDOVERVIEWREPORT) and opens the specified .tsd file (/TSD). Then, thepath and name of the Word document that will be generated are specified (/WORDTARGET) as well as the path and name of the Word template that is to be applied(/WORDTEMPLATE). Finally, the parameter /ACTION:WORDOVERVIEWREPORT causesthe report to be generated.
PerfExp.exe /TSD:"c:\test.tsd" /WORDTARGET:"c:\report.docx" /WORDTEMPLATE:"c:\template.docx" /ACTION:WORDOVERVIEWREPORT
Performance Explorer 18.5 | 91

Command FileBesides submitting commands directly within the command line, you can also submit a command file inXML format. Specify the commands by using the following syntax.
Perfexp.exe /COMMANDFILE:<CmdFile>
The command file is designated for batch operation.
The structure of the XML file to use as a command file consists of a root node calledPerfExpCommandFile and two optional sub-nodes called OverviewReport and Command.
PerfExpCommandFile
Possible specifications in the root node PerfExpCommandFile include the following examples:
• NoGui="True" / NoGui="False"
Specifies whether Performance Explorer launches visibly or invisibly.• LogFile="<filename>"
Specifies the name and location of the log file.
Different Command and OverviewReport nodes can reside below the root node.
OverviewReportThe OverviewReport node specifies which .tsd file Performance Explorer uses. The following attributesare available:
• File
Specifies which .tsd file to use. If omitted, the last file loaded by Performance Explorer is used.• Export
Specifies the output file to which the overview report is saved. Available formats include the followingoptions:
• HTML (.htm)• WebArchive (.mht)
• Template
Specifies an optional template OVT file to use for the overview report.
Command
The text of a Command node is interpreted as a command line parameter. Nodes are executed sequentially.
The following code shows an XML command file:
<?xml version="1.0" encoding="UTF-8" ?><PerfExpCommandFile NoGui="True" LogFile="c:\TEMP\Results\PerfExp.log"> <OverviewReport File="c:\TEMP\Results\m@[email protected]" Export="c:\TEMP\Results\Simple.mht" /> <Command>PEW:"c:\test.pew"</Command> <Command>SINGLEINSTANCE</Command> <Command>ACTION:STARTALLMONITORS</Command> <Command>EXIT</Command></PerfExpCommandFile>
92 | Performance Explorer 18.5

Help command
Use the help command /? with the following syntax.
Perfexp.exe /?
Performance Explorer opens and displays the command line help.
Customizing VisualizationPerformance Explorer offers numerous possibilities to customize the appearance of charts, graphs, andreports. You can set default values for a variety of visualization settings and you can set specific options forindividual charts, graphs, and reports.
Default OptionsYou can change the default options for how charts, graphs, and reports are visualized.
Setting Default Chart Options
1. Click the Performance Explorer Application Button (on the top left) and click Options.
2. Check the Highlight Selected Series check box to display the currently selected series with anemphasized, thicker line.
Note: While this option might be useful as long as you are working with charts, uncheck the checkbox before you export or print charts.
3. Check the Overlay series check box to assume that all time series that are displayed in a chart start atthe same time.
Use this option when you are viewing a chart that contains time series from tests with different startingtimes.
4. From the Background colors lists, select the colors that you want to use to enhance your charts.
To use a custom color, click [...] to the right of the list box.
Performance Explorer displays a vertical color transition from the first to the second color as thebackground image.
5. From the Text and grid color list box, select the color that you want to use for the axis information andthe grid in your charts.
To use a custom color, click [...] to the right of the list box.
6. In the Scaling area, you can enable the following features:
• Enable Scale values between 0 and 100 to display scaled values rather than real time series datavalues.
• Enable Use same scale factor for similar series to set the same scale factor for series of the sametype.
7. Click OK.
Setting Default Time Series Data Options
1. Click the Performance Explorer Application Button (on the top left) and click Options.
2. Click the Series tab.
3. If you want to display null values by default, check the Display NULL values check box.
On the Series tab, in the Display group, you can click Null Values to enable or disable null valuesseparately for single measures. The check box in the Options dialog enables or disables null values forall measures.
Performance Explorer 18.5 | 93
4. From the Show summary and counter values per list box, select the time unit for which you want timeseries data to be displayed.
• Select Interval if you want to display data for the computation interval contained in the .tsd file.• Select Second to scale displayed data to one-second intervals.
To change the default computation interval, use the Time Series tab of the Profile Settings – Resultsdialog.
5. From the Default line width list, select a line width to use whenever you add a new measure to a chart.
6. To display a chart marker for each measure value of each series, indicating the exact measure value,check the Show chart markers check box.
7. In the Decimal digits field, type the number of digits to display in the chart markers.
Use chart markers to display exact measure values for each measure within a chart.
8. Click OK.
Setting Default Chart Exporting Options
1. Click the Performance Explorer Application Button (on the top left) and click Options.
2. Click the HTML View tab.
3. In the Chart picture resolution area, select an option to determine the resolution of the image that isgenerated when you export a chart as an HTML document.
The size of an image file is directly proportional to its resolution. As a result, images with higherresolutions take longer to transfer over the web than images with lower resolutions.
4. Use the Picture type area to select the picture format of your chart in an HTML document.
• Click JPEG to include the chart in an HTML document as a JPEG file.• Click BMP (only with Internet Explorer) to include the chart in an HTML document as a BMP file.
5. Click OK.
Setting Default Candle Graph Options
1. Click the Performance Explorer Application Button (on the top left) and click Options.
2. Click the Candles tab.
3. From the Border color list box, select the color you want to use for the candle borders in your currentgraph.
To use a custom color, click [...] to the right of the list box.
4. In the Candle width spin box, enter the width for the candles in your current graph.
5. From the Marker color list box, select the color you want to use for the markers.
To use a custom color, click [...] to the right of the list box.
6. In the Marker height spin box, specify the height for the markers.
7. Click OK.
Setting Default Monitoring Options
1. Click the Performance Explorer Application Button (on the top left) and click Options.
2. Click the Monitor tab.
3. In the Interval field, set the length of the intervals at which the chart is updated.
Note: When modifying the monitor interval to a value lower than the default minimum intervalduring a run, the interval will be reset to the minimum monitor interval upon reopening the savedworkspace.
4. In the Page size field, set the number of measured values currently displayed per graph on thehorizontal axis.
94 | Performance Explorer 18.5

5. In the History size field, set the number of measured values stored for the entire graph on thehorizontal axis.
6. From the Background colors lists, select the colors that you want to use to enhance your charts.
To use a custom color, click [...] to the right of the list box.
Performance Explorer displays a vertical color transition from the first to the second color as thebackground image.
7. From the Text and grid color list box, select the color that you want to use for the axis information andthe grid in your charts.
To use a custom color, click [...] to the right of the list box.
8. Click OK.
Setting Default TSD Writer Options
1. Click the Performance Explorer Application Button (on the top left) and click Options.
2. Click the TSD-Writer tab.
3. In the Interval field, select a time interval and a time unit for the time series data that is written.
4. Click OK.
Setting Default Reporting Options
1. Click the Performance Explorer Application Button (on the top left) and click Options.
2. Click the Reporting tab.
3. To automatically display an overview report when you start exploring the results of a test, check theGenerate overview reports automatically check box.
An overview report contains the most important results of a test, such as the number of virtual usersthat were active, the number of transactions that were executed, and the number of errors that occurred.
4. To display null values in charts, check the Show NULL values in charts check box.
If you uncheck this check box, Performance Explorer replaces each null value with a direct line from thepreceding to the following value.
5. To use a previously stored template for the creation of overview reports, check the Use template whencreating a new overview report check box, click [...], and select the template. The selected template isused to create a new overview report for all projects.
6. Click OK.
Customizing Chart DisplayPerformance Explorer displays charts in a standard format but offers numerous possibilities forcustomization. You can enable scaling, overlay graphs, highlight graphs, export charts, and more. Thesedisplay options can be found on the Chart tab, which is a contextual tab. It displays when you create orselect a chart.
1. Create a chart and drag measures from the tree onto the chart.
2. On the Chart tab, in the Chart group, you have the following options:
• Scaling: The scaling feature allows you to visually equalize graphs in a chart. This means thatmeasures with big values and measures with small values can be displayed appropriately and ameaningful chart can be drawn. Without scaling, measures with small values would display as flatlines, while measures with big values would display as steep lines. To set a specific scaling factor forindividual graphs, select a factor from the Scaling list, in the Series group on the Series tab.
• Overlay Graphs: When you overlay graphs, all graphs are shifted to a common start time,regardless of the actual start time. Use this option when you are viewing a chart that containsmeasures from tests with different starting times.
Performance Explorer 18.5 | 95

• Logarithmic Y-Axis: Changes the linear y-axis into a logarithmic y-axis.• Highlight: Emphasizes the selected graph with a thicker line.
Tip: Highlighting graphs is useful while you work with and view charts in Performance Explorer.However, make sure to uncheck this option before you export or print a chart.
• Scale Similar Series: Performance Explorer applies the same scaling factor to similar series.Similar series are series with the same type (see the Type column in the measure list). To use thisfeature, progress as follows: Drag a measure with a certain type onto an empty chart. Right-click themeasure and select a custom scaling factor (not Auto). Enable Scale Similar Series, on the Charttab. Drag further measures with the same type onto the chart. Performance Explorer automaticallyapplies the scaling factor that you have manually specified for the first measure.
• Properties: In the properties, you can type a Caption and a Description for the chart. These willdisplay above the chart when you export or print it.
• Export: Exports the active chart as a .csv file or as an Excel document. When you click Export AsCSV File you can choose from a range of file types, like .csv, .htm, .mht, or .png.
3. In the Display group, you have the following options:
• Series Points: Displays the series points of all graphs.• Zoom Out: Resets the zoom level.• Zoom & Scale: Zoom & Scale is enabled by default. It allows you to zoom into the chart, which
means that both the x- and y-axis are adjusted. When you disable Zoom & Scale, only the x-axis willbe adjusted.
• Measure List: Shows or hides the measure list. The measure list can also be regarded as thelegend of the chart. However, it provides lots of additional information for each measure.
4. In the Generate group, you have the following options:
• Monitor Writer: Creates a new monitor writer with the real-time measures from a monitor graph.• VUser-based Chart: Creates a new virtual user-based chart using the same measures as the active
time-based chart. A time-based chart displays the measured values on the y-axis and the time onthe x-axis. A VUser-based chart displays the number of virtual users on the x-axis.
5. In the Data group, you have the following options:
• Clear Monitor Chart: Clears all graphs from the active monitor chart.• View in Browser: Shows the active chart as HTML document in a browser.
Customizing Graph DisplayPerformance Explorer displays graphs in a standard format but offers numerous possibilities forcustomization. You can change colors, line width, and line styles. You can change scaling options, insertmarkers, and more. These display options can be found on the Series tab, which is a contextual tab. Itdisplays when you create or select a chart.
1. Create a chart, drag measures from the tree onto the chart, and select a graph or a measure from themeasure list.
2. On the Series tab, in the Line Style group, you have the following options:
• Style: Select from various line styles.• Color: Select a color.• Width: Select a width.
3. In the Series group, you have the following options:
• Scaling: The scaling factor allows you to visually equalize graphs in a chart. This means thatmeasures with big values and measures with small values can be displayed appropriately and ameaningful chart can be drawn. Without scaling, measures with small values would display as flatlines, while measures with big values would display as steep lines. To enable auto scaling for allgraphs in the chart, click Scaling in the Chart group on the Chart tab.
96 | Performance Explorer 18.5

• Display as: Select a display type for the selected graph. This can be Line, Candle, Candle withsticks, and Area.
• Source Type: Select one of the following source types: Average, Count, Sum, Maximum, Minimum,StdDev.
4. In the Display group, you have the following options:
• Markers: Markers show the measured values in the chart.• Null Values: Displays the null values for the selected graph.• Measure Bounds: Displays the bounds for the selected graph. You can configure these bounds in
the Automatic Threshold Generation dialog before you start a load test.• Performance Level Conditions: Displays the performance levels for the selected graph. You can
define and assign performance levels on the Reports tab.• Normalized Values: Displays normalized values for the selected graph. Normalized values are
values per second.• Standard Deviation Area: Displays the standard deviation for the selected graph.• Visible: Click this check box to show or hide the selected graph. You can also use the check boxes
in the measure list to show or hide graphs.
Displaying Measure BoundsBefore you start a load test, you must define a lower and upper bound within the Automatic ThresholdGeneration dialog or directly within the script. The values of the bounds display in the Overview Report.
To display measure bounds in a chart:
1. Create or open a chart.
2. Drag measures that have defined bounds onto the chart.
3. Click a measure in the measure list to active it.
4. On the Series tab, in the Display group, enable Measure Bounds.
The chart shows a red and a yellow colored area. The red colored area is the area above the upper bound.The yellow colored area is the area between the upper bound and the lower bound.
Note: The colored areas only display if the measure exceeds the configured thresholds. PerformanceExplorer only shows graphical measure bounds for one measure at a time. When you displaymeasure bounds, the scale of the chart may adjust automatically.
Performance Explorer shows graphical bounds for the Average, Maximum, and Minimum values of thefollowing measures:
• Page and Action Timer - Action Time• Page and Action Timer - Page Time• Timer - Response Time[s]• Transaction - Trans. (busy) Ok
Displaying Performance Level ConditionsBefore you can display performance levels in charts, you have to define and assign them. You can do sobefore a load test execution (proactive approach) or after an execution (reactive approach).
To display performance level conditions in a chart:
1. Create or open a chart.
2. Drag measures that have performance levels assigned onto the chart.
3. Click a measure in the measure list to activate it.
4. On the Series tab, in the Display group, enable Performance Level Conditions.
Performance Explorer 18.5 | 97

The chart shows colored boundaries for the conditions of the assigned performance level and a smalllegend describing them. For example: If the current performance level contains a condition like P90 < 0.2,the condition is fulfilled if 90 % of the graph lie below the shown boundary.
Note: Performance Explorer only shows performance level conditions for one measure at a time.
98 | Performance Explorer 18.5
IndexA
addingattributes 25
adding resultsfrom results folder 10from Silk Central 10overview 9single result files 10
agentsagent health
responsiveness 81files 5health 81
Apache server 53attribute pools 25
B
BDL monitoring projectsadvanced use case 42basic use case 38creating 35creating new project 38creating script 39, 43in Performance Explorer 46intialization 47loops 46more best practices 47overview 35packaging the script 41planning project attributes 38, 42ThinkTimes and Wait 46tutorial 37using projects 42
BEA WebLogicmonitoring 70
C
chartscreating 10creating monitors 76customize appearance 95exporting 17setting default options 93, 94viewing in web browser 16
client-side measuresconfiguring 76removing 76
command line interfacecommand files 92commands 89
command-line interfaceoverview 89
comparison reportscreating custom 21creating region 20
creating user type 21custom 20region 20types of 19user type 20
Connection Parameters dialog 31contact lost 15controller loses contact 15converting CSV to time-series data format 80CPU utilization
agent health 81CSV
automating file export 16capturing remote-server performance data 79conversion to time-series data 78converting remote-server performance log data 80exporting results in CSV format 15generating performance-counter log on a remote
server 78, 79customize
charts 95graphs 96
D
data source tree menu 9data sources
automatic detection 74custom 72defining 47JMX 23PerfMon 73predefined 47scanning 75UNIX 27wizards 47
dialog boxesSystem Selection 25
E
error analysis graphs 12errors
analyzing 11executions 27exporting
charts 17
F
filesCSV conversion to time-series data 78, 79
G
graphscomparing 13
Index | 99

customize appearance 96default options 93error analysis 12setting candle options 94
GUIPerformance Explorer tour 8
H
hostschanging 77duplicating 77editing credentials 78
HTMLexporting reports 17
HTML overview reportscreating 19templates 19
I
IBMDB2
monitoring 55retrieving performance metrics 58snapshot monitoring 55
WebSphereperformance measures 58
IIOP 72IIS performance monitoring
available performance measures 61troubleshooting 62
intermediate files 5
J
JMXadvanced queries 26connecting 23filtering beans 26monitoring prerequisites 23queries 25
JMX management server 71
L
launching product 7Linux commands 30load test results
merging 14
M
Management Information Base (MIB) 32MBeans specifying 24measure bounds
displaying 97measurements
correlating 12measures
browser-driven 86
Citrix 88CORBA 87custom counter 89custom timer 88database 84general 80IIOP 83Internet 82middleware 88overview 80SQL database 87summary 80transaction 84TUXEDO 88Web 83Web form 85Web page 86
MemFree 30memory utilization
agent health 81merged files 5MIB 32MIB files 74Microsoft SQL Server performance monitoring
available performance measures 63monitor
charts 76monitoring
IBM WebSphere application servers 59interfaces 72monitor charts 76monitor writers 76real-time 21
real-time monitoringoverview 21
setting default options 94windows machines 22
monitoring projectsinfrastructure monitor 37
multiple executions 27
O
OIDs 31Oracle
monitoring 66, 68, 69Oracle database monitoring
adding Oracle counters 67Installing Oracle Client and Oracle Counters 66known issues 68monitoring Oracle performance (Perfmon) 67performance counters 67
Oracle Formsclient-side performance measures 66monitoring 65
overview reportsHTML 18word 18
P
PerfMon 72, 73
100 | Index

performancemonitoring 31
Performance Data Collection Engine 37Performance Explorer
overview 4real-time monitoring 4results analysis 4terminology 4
performance levelsdisplay in charts 97
performance measuresWebSphere 58
productstarting 7
Qqueries
JMX 26REXEC 28running 27UNIX 28
Rreal-time
files 5remote executions 27remote servers
capturing performance data 79converting performance log data 80generating performance-counter log 78, 79
reportingtypes of 18
reportscomparison 19creating 11custom comparison 20, 21default options 93exporting command-line 17Performance Explorer 11region comparison 20setting default options 95templates 19user type comparison 20, 21viewing in web browser 17
resamplingload test results 14result files 14
responsivenessagent health 81
resultsanalysing 11exporting 15processing 13
REXECmonitoring 72overview 27
REXEC queries 28root cause analysis 12
SSAP
monitoring 69
saved queries 27secure shells 33server performance
monitoring 31Silk Central
integration 93Silverstream 54single executions 27SNMP
adding datasource 73monitoring 70, 72querying 73
SNMP supportdata source definition 32
starting product 7System Selection
dialog box 25
T
tablesviewing in web browser 17
technologiesmonitoring 22
templatecreating a word overview report 18
templatesassigning 19
test resultsexploring 9
time seriesdata writer
setting default options 95setting data options 93
time-seriesfile types 5
time-series dataconversion from CSV 78, 79
touruser interface, Performance Explorer 8
U
UNIX queries 28user files 5user interface
Performance Explorer overview 8
W
Web browsersviewing results 16
WebLogic (JMX) monitoringIIOP 72JMX management server 71
welcomePE 4windows machines
monitoring requirements 22word overview reports
template 18viewing 18
Index | 101

workflow barPerformance Explorer 8
writers
creating monitors 77
102 | Index