1887 - 2005
DESCRIPTION
1887 - 2005. Pratt Institute Statistical Presentation. General Information Institute Ranking Institute Organization Student Information Academic Programs Faculty & Staff Finance Pratt on Web. General Information. - PowerPoint PPT PresentationTRANSCRIPT

1887 - 2005
Pratt InstituteStatistical Presentation

General Information
Institute Ranking
Institute Organization
Student Information
Academic Programs
Faculty & Staff
Finance
Pratt on Web

General Information
● Pratt Institute was founded 1887 by Charles Pratt, an industrialist who made his fortune in petroleum. The first class in art consisted of twelve students, and began in October of 1887.
● The Institute is organized into four schools on two campuses. The schools are: Art and Design, Architecture, Information and Library Science, and Liberal Arts and Sciences.
● Pratt employs more than 800 full-time, visiting and adjunct faculty members, who are working professionals in the arts, architecture, design and business.
● Pratt Institute enrolls more than 5,000 students, including Continuing Education students and Munson-Williams Proctor students.
● Pratt’s operational budget exceeds 120,000,000 dollars. About 20% of it represent expenses for student financial aid.

General Information
● Students of Pratt Institute generate 125,000 credits yearly in more than 80 majors.
● Pratt students represent 47 American states and 55 foreign countries.
● The number of Pratt alumni is about 28,000.
● Institute campus consist of 30 buildings on 25 acres.
● Pratt Library was the first free public library in the USA
Pratt Library, 1906

Institute Ranking
Pratt Institute is ranked by the US News and World Report magazine among the top schools in the country in the field of Art and Design.
Pratt’s Painting program ranked as 10th in the nation, and Printmaking Program is 8th, together with Yale University Printmaking Program.
Pratt’s Fine Arts program ranked 19th in the US, higher than the Art programs of such universities as Berkley, Stanford, or Cornell.

Board of Trustees
VP Student Affairs
Director Institutional Research & Assessment President
•Academic Deans
•Libraries
•Continuing Education.
•Registrar
Institute Organization
VP Enrollment Management
VP Institutional Advancement
VP Finance and Operations
Provost …………….
Academic Senate …….
•Residential Life
•Health & Counseling
•International Affairs
•Student Activities
•Budget
•Human Resources
•Facilities
•Security
•Public Relations
•Alumni Affairs
•Communications
•Grants and Giving
•Admissions
•Marketing
•Financial Aid
Denotes Advisory Role
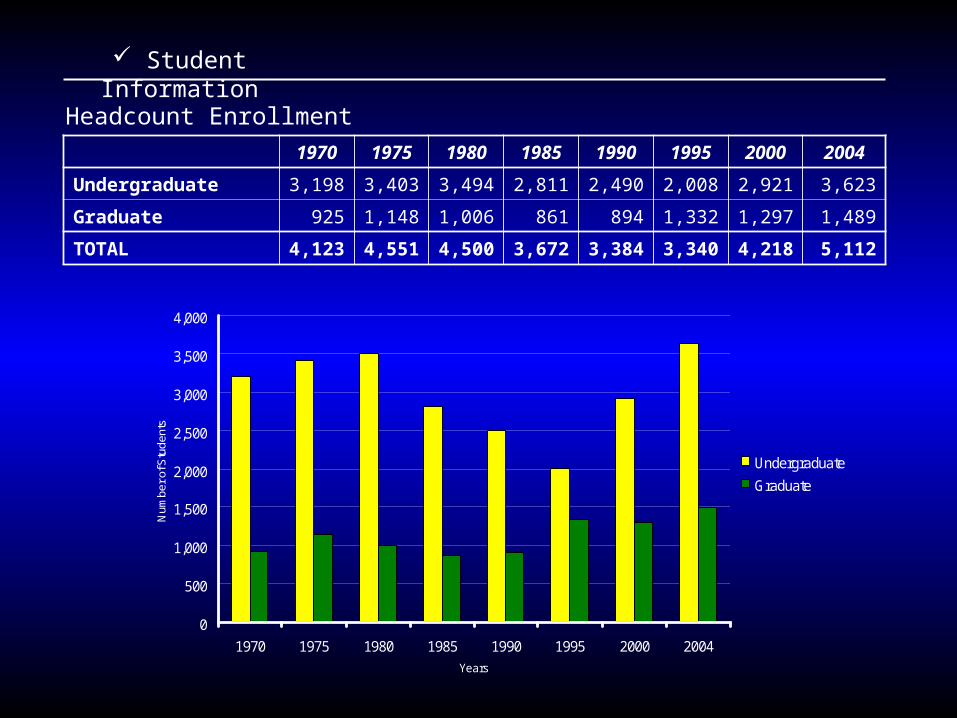
Student Information
1970 1975 1980 1985 1990 1995 2000 2004
Undergraduate 3,198 3,403 3,494 2,811 2,490 2,008 2,921 3,623
Graduate 925 1,148 1,006 861 894 1,332 1,297 1,489
TOTAL 4,123 4,551 4,500 3,672 3,384 3,340 4,218 5,112
Headcount Enrollment
0
500
1,000
1,500
2,000
2,500
3,000
3,500
4,000
1970 1975 1980 1985 1990 1995 2000 2004
Years
Num
ber o
f Stu
dent
s
Undergraduate
Graduate
Architecture16%
Art & Design64%
Liberal Art & Sciences
2%
Information and Library Science
5%
Center for CE13%
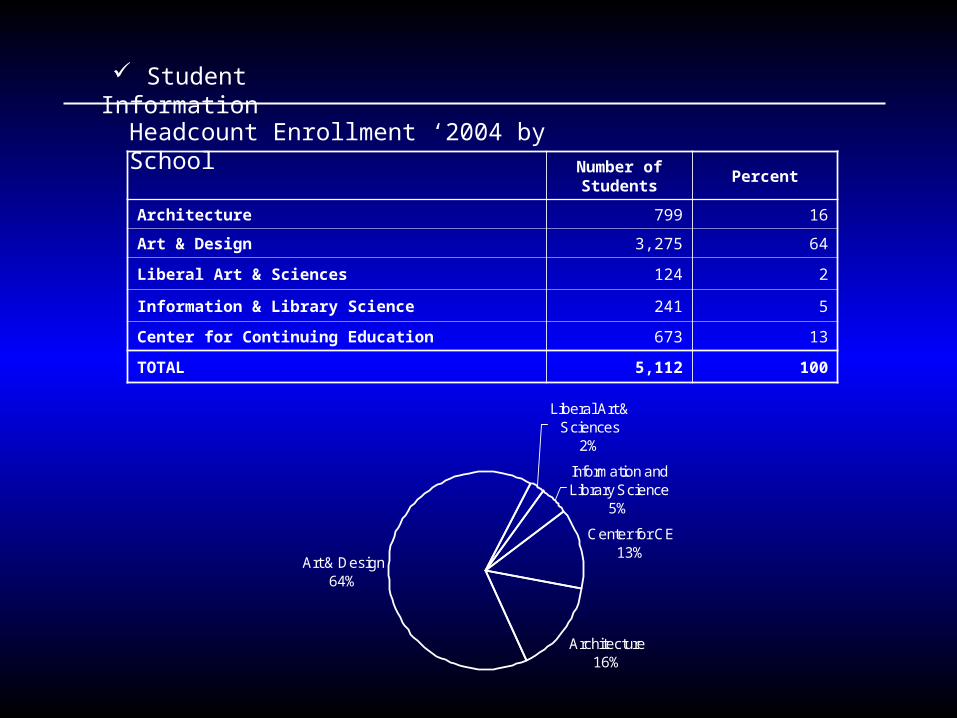
Student Information
Headcount Enrollment ‘2004 by SchoolNumber of Students
Percent
Architecture 799 16
Art & Design 3,275 64
Liberal Art & Sciences 124 2
Information & Library Science 241 5
Center for Continuing Education 673 13
TOTAL 5,112 100

Student Information
Headcount Enrollment ‘2004 by Ethnic OriginNumber of Students
Percent
Black 405 8
Asian 1,005 20
Hispanic 359 7
White 2,717 53
Unspecified 626 12
TOTAL 5,112 100
Black8%
Asian20%
Hispanic7%
White53%
Unspecified12%

Student Information
Headcount Enrollment by Gender
0
500
1000
1500
2000
2500
3000
3500
1978
1979
1980
1981
1982
1983
1984
1985
1986
1987
1988
1989
1990
1991
1992
1993
1994
1995
1996
1997
1998
1999
2000
2001
2002
2003
2004
Years
Num
ber
of S
tude
nts
Male
Female

Student Information
Domestic Students by State
New York - 59%
Other states - 15%
Florida - 1%Texas - 2%California - 2%
Massachusetts - 3%
Connecticut - 3%
Pennsylvania - 3%
New Jersey - 12%

Student Information
Foreign Students by Region
Eu
rop
e
No
rth
Am
eri
ca
So
uth
Am
eri
ca
Mid
dle
Ea
st
Asia
0% 10% 20% 30% 40% 50% 60% 70% 80% 90% 100%
Percent

Student Information
Degrees Conferred
0
100
200
300
400
500
600
Nu
mb
er o
f G
rad
uat
es
Associate
Baccalaureate
Master

Academic Programs
Ten Most Popular Majors
Major Enrollment, Fall 2004
Bachelor of Architecture 545Graphic design 312M.S. Communications Design 247Industrial Design 231Illustration 213M.S. Library and Information Science 213Fashion Design 176Painting 175M.S. Interior Design 171M.F.A. Fine Arts 169

Academic Programs
Credits Taught, Fall Semesters
0
10,000
20,000
30,000
40,000
50,000
60,000
Cre
dits
Tau
ght
1980 1981 1982 1983 1984 1985 1986 1987 1988 1989 1990 1991 1992 1993 1994 1995 1996 1997 1998 1999 2000 2001 2002 2003 2004
Undergraduate Graduate

Academic Programs
Credits Taught by School
School Credits Taught, Fall 2004
Architecture 9,502
Art & Design 38,533
Liberal Arts & Science 11,720
Information & Library Science 1,440
TOTAL 61,195
0
5,000
10,000
15,000
20,000
25,000
30,000
35,000
40,000
45,000
Architecture Art & Design Liberal Arts &Science
Information & LibraryScience
Schools
Cre
dit
s T
aug
ht
Architecture16%
Liberal Arts & Science
19%
Information & Library Science
2%
Art & Design63%

Faculty and Staff
Employees Headcount, Fall Semesters
1990 1997 2004
Faculty * 525 607 861
Administration 175 163 196
Staff
Clerical/Secretarial 111 71 59
Maintenance 74 54 50
Technical 24 16 13
Security 41 32 30
Total Staff 250 173 152
Total Employees 950 943 1,209
* Includes faculty administration and chairpersons

Faculty and Staff
Faculty Members by Rank and Status, Fall 2004
ProfessorAssociate Professor
Assistant Professor
Instructor TOTAL
Full-Time 52 35 23 0 110
Adjunct 43 69 80 27 219
Visiting 12 52 234 207 505
TOTAL 107 156 337 234 834
Faculty by Rank
Professor13%
Associate Professor19%
Assistant Professor40%
Instructor28%
Faculty by Status
Full-Time13%
Adjunct26%
Visiting61%

Faculty and Staff
Female Faculty
0
50
100
150
200
250
300
350
Nu
mb
er o
f F
acu
lty
1980 1990 1995 2000 2001 2002 2003 2004
Years

Finance
Revenue and Expenses
0
20,000,000
40,000,000
60,000,000
80,000,000
100,000,000
120,000,000
140,000,000
1980
- 1
981
19
81 -
198
2
19
82 -
198
3
19
83 -
198
4
19
84 -
198
5
19
85 -
198
6
19
86 -
198
7
19
87 -
198
8
19
88 -
198
9
19
89 -
199
0
19
90 -
199
1
19
91 -
199
2
19
92 -
199
3
19
93 -
199
4
19
94 -
199
5
19
95 -
199
6
19
96 -
199
7
19
97 -
199
8
19
98 -
199
9
19
99 -
200
0
20
00 -
200
1
20
01 -
200
2
20
02 -
200
3
20
03 -
200
4
Years
Do
llar
s
Revenues Expenses

Student Financial Aid
Finance
0
2
4
6
8
10
12
14
16
18
20
22
24
Years
Fin
an
cia
l A
id, m
illio
n d
olla
rs
Undergraduate Graduate

