19 years after one group, two different … years after... ...one group, two different strategies...
TRANSCRIPT
THE GALENICA GROUP – EXCELLENCE IN THE HEALTHCARE MARKET
19 YEARS AFTER... ...ONE GROUP, TWO DIFFERENT STRATEGIES
March 2015

GALENICA GROUP OVERVIEW
2 © Galenica Group
Move to Galenica Santé by mid-2015
#1 Worldwide #3 Switzerland #1 Switzerland #1 Switzerland #1 Switzerland

GALENICA FINANCIAL PROFILE
3 © Galenica Group
21 26 30 34 42 49 54 59 67 64 80
104
135
189 210
232 256
277 296
312
'95 '96 '97 '98 '99 '00 '01 '02 '03 '04 '05 '06 '07 '08 '09 '10 '11 '12 '13 '14
Minorities
SWISS GAP until 2003 IFRS
NET PROFIT BEFORE MINORITIES (*)
(CHFm)
Cumulative Growth: +1,372% CAGR: +15%
(*) like-for-like (excludes non-cash one off effects of CHF39m in 2013)
EPS DEVELOPMENT
9.9 12.3
15.9
20.7
29.1 32.3
35.5 34.6
39.4 39.8 43.9
-
5.0
10.0
15.0
20.0
25.0
30.0
35.0
40.0
45.0
50.0
2004 2005 2006 2007 2008 2009 2010 2011 2012 2013 2014
(CHF)
Cumulative Growth: +345% CAGR: +16%

SHARE PRICE PERFORMANCE 1995-2014 STOCK MARKET VALUE FROM CHF 250M TO >5BN
4 © Galenica Group
Scaling to 100 from 1995 Share Price (CHF)
0
100
200
300
400
500
600
700
800
900
1'000
0
500
1'000
1'500
2'000
2'500
SMI Berkshire Hathaway CHF Swiss Life Sciences Index Galenica
Cumulative Growth: ~2,100%; Average growth rate p.a.: 19.5% Total shareholder return p.a.: 22% (incl. dividends)

ORGANISATION OF GROUP MANAGEMENT LEADERSHIP TEAM
5 © Galenica Group
CEO VIFOR Pharma Søren Tulstrup
CEO GALENICA Santé Jörg Kneubühler
Deputy CEO VIFOR Pharma Gianni Zampieri
Logistics / HealthCare Information Jean-Claude Clémençon
Retail Felix Burkhard
GALENICA Executive Chairman Etienne Jornod

GALENICA GROUP CORPORATE TIMELINE
1994 2015 1996 2000 2001 2004 2009 2008 2013
VIFO
R P
harm
a G
ALE
NIC
A Sa
nté
Cor
pora
te GALENICA is floated on the
Swiss Stock Exchange New strategy based on a vision of turning the company into a player engaged in the entire drug value chain in Switzerland
Expansion of distribution activities Acquisition of Galexis and Amidro
1997: Acquisition of Laboratoire Golaz (OTC)
1997 1999
Partnership with Alliance Boots Partnership is based on a contract that runs to this day
Beginning of international expansion in the area of iron replacement Products redesigned / positioned as Venofer and Maltofer
FDA approval of Injectafer FDA approval for Velphoro
2007 2014
2001: Venofer is approved by the FDA 2004: Creation of VIFOR Pharma
2008: Acquisition of Aspreva Phamaceuticals 2009: Acquisition of OM pharma 2010: Creation of VIFOR-FMC Renal Pharma
1999: Acquisition of Medichemie (phythotherapy and gastroenterology)
Acquisition of MediService International expansion with Venofer and Maltofer Launch of Ferinject
Creation of Galenicare
Acquisition of Sun Store pharmacy chain
2005
The pharmacies of Galenicare appear under a new brand: Amavita
Acquisition of Medifilm Acquisition of a 49% stake in Bahnhof Apotheke Zurich
Velphoro receives EU marketing authorisation
GALENICA lays foundation for two listed independent companies with new management structure
2010
6 © Galenica Group

VIFOR PHARMA OVERVIEW
Strategic projects 1. Vifor Fresenius Medical Care Renal Pharma: Global Leader 2. Ferinject® : Approved in 63 countries, launched in 54 countries
3. Injectafer®: approved (FDA July 2013) and launched in USA 4. Velphoro® : Launched in USA in March 2014 / Approved in EU, Switzerland,
Australia & Singapore. Velphoro® is now approved in 36 countries. 5. Tecfidera ®: toll manufacturing contract with Biogen (since 2013)
6. Strengthen network of subsidiaries: overall completed
7 © Galenica Group

8
VIFOR PHARMA SUMMARY SUMMARY OF MARKETED PRODUCTS
OTC(1)
VIFOR PHARMA
Iron Franchise
Infectious Disease /
OTX(1)
Perskindol Anti-Brumm
OTC portfolio to be separated from VIFOR Pharma and merged with GALENICA Santé by mid-2015
Algifor Triofan Equazen Eye Q
(1) Select key products only.
Iron replacement products for the treatment of ID and an iron-based phosphate binder
Diversified portfolio of prescribed non-prescription medicines
Portfolio of OTC products (analgesics, cough & cold)
188
15
51
127
Product 2014 Net Sales
(CHFm) Indication Partners (Region)
Ferinject / Injectafer
Velphoro
Venofer
Maltofer
OTX
ID (general) Anaemia in CKD (dialysis) Anaemia in CKD (non-dialysis) Cardiology Gastroenterology Chemotherapy-induced anaemia
FMC (dialysis) Hikma (MENA) Luitpold (N.A.) Zeria (Japan)
FMC (dialysis) Kissei (Japan)
Hyperphosphataemia
FMC (dialysis) JW Group (S.Korea) Luitpold (N.A.) UCB (China)
ID (general) Anaemia in CKD (dialysis) Anaemia in CKD (non-dialysis)
China Medical System (China)
Abdi Ibrahim (Turkey)
Iron-deficiency anaemia Mineral deficiency
Sandoz (China, Russia, CIS) Takeda (Italy, Brasil)
Infectious diseases / OTX franchise (e.g. respiratory/urinary infections)
Growth products
Consumer Health
89 OTC products (e.g. cough &
cold, analgesics, pain killer…)
2/3 in Switzerland
113
8 © Galenica Group

IRON FUNCTION BODY DISTRIBUTION AND BALANCE
9 © Galenica Group
Eisenmangelanämie
Normal Iron deficiency Iron deficiency anemia
Iron store (Ferritin) Iron transporter (Transferrin) Red Blood cells (Hb value)
< 30 µg/ml
< 20%
♀ ≥ 12 g/dl ♂ ≥ 13 g/dl
< 15 µg/ml
< 20%
< 12 and 13 g/dl
_ In the event of inflammation, iron stores are blocked and cannot be transported anymore (functional iron deficiency)
20%-40%
Normal
> 30 µg/ml
Iron body store in adult ~2-4g Role of iron in the body:
1. Transportation of oxygen => Metabolic energy
2. Catalyst for the production of red blood cells (lifespan of 120 days => iron recycling is vital)

VIFOR PHARMA GLOBAL MARKET LEADER IN ORAL AND I.V. IRON
OUTSIDE DIALYSIS
Ferinject®: >2.2 m patients per year
Venofer®: >16m patients per year
34% VIFOR
Pharma
Global Iron CHF 2,365m
64% VIFOR
Pharma
11% VIFOR
Pharma
Intravenous Iron Oral Iron
IRON FRANCHISE PRODUCTS GLOBAL IRON MARKET (2014)
CHF 1,043m CHF 1,322m
Dialysis & Hospital Chronic Use
Paediatric / Pregnancy
10 © Galenica Group

MARKETED PRODUCTS FERINJECT VS OTHER IV IRON DRUGS
NBbrs Admin
Admin time in min (standard for 1,000mg)
Savings of €90-110 per 1,000mg per patient €430
Ferrlecit®
16x
320
€413
Cosmofer®
1x
352
€410
Venofer®
5x
161
€320
Ferinject®
1x
15
Admin costs(1) p/1,000 mg
Costs of IV iron p/1,000mg
Higher-generation IV products provide real cost savings with a significant reduction in admin time
Source: Szucs et al 2009, University of Zurich, ASH HE. (1) Costs converted into € based on CHF/EUR FX rate of 1.3.
Therapeutics Areas
Required Average Iron
Need (mg)
Infusions prior to
Ferinject®
Infusions with
Ferinject®
ND-CKD 1,200 – 1,800 6 – 28 2
Cardiology 1,500 6 – 18 2
Oncology 750 – 1,200 4 – 19 1 – 2
Gastro 1,450 8 – 23 2
PBM* / Surgery > 1,000 5 – 16 1 – 2
Ob/Gyn 960 – 1,500 5 – 24 1 – 2
* Patient Blood Management
11 © Galenica Group

FERINJECT® / INJECTAFER® EFFICIENT, CONVENIENT AND COST EFFECTIVE
Patients treated: >2.2 million First, high-dose, non-dextran i.v. iron − Ferinject® : Single dose up to 1,000mg − Injectafer ®: Single dose up to 750mg − Short application time:
• 200mg in fast push injection • 1,000mg / 750mg (USA) in 15-minute infusion/injection
Total repletion in few visits Lower medical care costs − Worldwide clinical trials have established a large base of clinical evidence − Approved in 64 countries, launched in 56 countries − FDA approval for the treatment of iron deficiency anemia (25 July 2013)
12 © Galenica Group
Net sales 2014: CHF 188M (+19%)
IMS sales 2014: CHF 265M (+42%)

INJECTAFER® US LAUNCH UPDATE − Injectafer building momentum in US market
• Temporary Reimbursement Q code effective July 2014, loaded in CMS listing in October 2014; Permanent J code effective January 2015
• Strong commercial insurance coverage - 98% of covered lives • Luitpold initial focus in Hematology Infusion Clinic setting • Full program of promotional, reimbursement and medical education support • Customer and patient feedback has been very positive
− Strong relationship and collaboration in place: • Luitpold Pharmaceuticals benefiting from VIFOR Pharma launch experience
in EU countries • Close coordination across functions • Joint funding of few key initiatives
− Launch in Gastro planned April 2015 (Sales rep. launch event held)
13 © Galenica Group

VENOFER® VENOFER® AND IRON SUCROSE SIMILARS (ISS) − Positioning of Venofer® as drug of choice in HD with a
distinct safety and efficacy profile compared to ISS preparations − In addition to clinical data on differences in efficacy,
new clinical observation reports increased adverse event rate of ISS − Major authorities recognize the complexity of the product and discuss the limitation of the
approval of ISS preparations through the generic pathway
14 © Galenica Group
ROTTEMBOURG STUDY DEMONSTRATES SUPERIORITY OF VENOFER®
− Patients with anemia and iron deficiency treated successfully with erythropoiesis-stimulating agents (ESA) and Venofer® switched to FerMylan®
− Outcome to regain control of hemoglobin: + 35% i.v. iron, + 12% ESA, + 12% costs − A recent study conducted in Spain confirmed the Rottembourg study: «The treatment with
generic i.v. iron needs a higher dose of iron and ESA to keep hemoglobin stable». LEE STUDY SHOWS A SIGNIFICANT INCREASE OF ADVERSE EVENTS WITH ISS − Retrospective analysis of gynecological patients treated in a single South Korean site over
a period of four years with i.v. iron − Increased adverse events rates observed in patients treated with ISS vs Venofer®
− As a result of safety concerns, the use of ISS was abandoned
Net sales 2014: CHF 113M (-12%)

I.V. IRON MARKET LARGE POTENTIAL GROWTH OUTSIDE DIALYSIS
15 © Galenica Group
Worldwide market Swiss market
44%
31%
10%
2% 2% 2%
4% 5%
Gynaecology
Internal Medicine
Nephrology
Cardiology
Oncology/Hematology
Geriatry
Gastroenterology
Other TAs
70% 30%
Nephrology segment
70% of the worldwide i.v. market is in Nephrology (CKD 3-5) vs 10% in Switzerland 2014 Swiss Sales in i.v. iron amounted to CHF 49 million Still large potential in Switzerland in women’s health (fatigue) & elderly people New therapeutic areas (TAs) are still unexplored: RLS, elderly people

VIFOR PHARMA SWITZERLAND VENOFER® AND FERINJECT SALES HISTORY
16 © Galenica Group
0
10
20
30
40
50
60
01 06 11 04 09 02 07 12 05 10 03 08 01 06 11 04 09 02 07 12 05 10 03 08 01 06 11 04 09 02 07 12 05 10 03 08 01 06 11 04 09 02 07 12
1997 1998 1999 2000 2001 2002 2003 2004 2005 2006 2007 2008 2009 2010 2011 2012 2013 2014
Milli
on CH
F Ferinject
Venofer
Source: MIK / Hyperion
MAT 12/2014 49 Mio. CHF

Patients Therapeutic Area Patients eligible for i.v. iron treatment
Wom
en
elde
rly p
eopl
e
(chr
onic
) dis
ease
I.V. IRON MARKET LARGE POTENTIAL IN NEW THERAPEUTIC AREAS
0 20'000 40'000 60'000 80'000 100'000
Neurology (Restless Legs Syndrome)
Inflammatory Bowel Disease
Dialysis
Chemotherapy Induced Anaemia
Other chronic disease
Chronic Kidney Disease (non-dialysis)
Chronic Heart Failure
Patient Blood Management
Heavy Menstrual Bleeding / Fatigue
Obstetrics (Pregnancy / Post-partum)
Patients treated with i.v. iron
Patients not treated with i.v. iron
17 © Galenica Group

EUROPEAN I.V. IRON MARKET
18 © Galenica Group Source IMS
Venofer
Ferinject
ISS Pharmacosmos
EUROPEAN I.V. IRON MARKET (SALES) EUROPEAN I.V. IRON MARKET SHARE (VALUE)
The European market represents 1/3 of the worldwide i.v. iron market Vifor Pharma has kept 3/4 market share in a market that doubled since 2008 Market growth driven by Ferinject® (mostly outside dialysis)
(CHFm)
39 63
88 134
170 189 98 89
81
67
58 56
17 27
24
27
27 29
18
18 16
15
15 13
9
9 8
12
17 19
183
207 220
258
289 308
-
50
100
150
200
250
300
2009 2010 2011 2012 2013 2014
Ferinject Venofer ISS Gluconate Pharmacosmos Other
21%
30%
40%
52%
59% 61%
54%
43%
37% 26%
20% 18%
9% 13%
11% 10% 9% 9%
4% 6%
2009 2010 2011 2012 2013 2014

NORTH AMERICAN I.V. IRON MARKET
19 © Galenica Group Source IMS
Venofer
Feraheme
Gluconate
The North American market represents >50% of the worldwide i.v. iron market Venofer® leads the USA iron market with ~60% market share The USA market is mostly a «Nephrology» market, leaving significant opportunities for Injectafer® in
other therapeutic areas (TAs)
USA I.V. IRON MARKET (SALES) USA I.V. IRON MARKET SHARE (VALUE)
Injectafer
(CHFm)
50
391 442 418
329 296 313
115 72
65
63 55
52
60 54
57 74
92
31 37
36
39 44
39
565 611
573
488 471
546
-
100
200
300
400
500
600
700
2009 2010 2011 2012 2013 2014Injectafer Venofer Gluconate Feraheme Other
9%
69% 72% 73%
67% 63%
57%
20%
12% 11% 13%
12% 9% 10% 9%
12%
16% 17%
2009 2010 2011 2012 2013 2014

WORLD I.V. IRON MARKET
20 © Galenica Group Source: IMS
Venofer
Ferinject
ISS
Feraheme
Vifor Pharma owns 2/3 of the worldwide i.v. iron market with 64% market share (66% USA, 76% Europe)
Venofer® remains the «gold» standard product in dialysis patients Ferinject® offers significant opportunities outside dialysis (higher dosing / faster infusion time)
WORLD I.V. IRON MARKET (SALES) WORLD I.V. IRON MARKET SHARE (VALUE)
(CHFm)
Gluconate 43 63 88 136 179
256
527 567 537 438 399
416
47 68 74
90 101
118 135
91 83 79 71
66 61 54 57 74
93
54 65 69 79 90
93
834 915 905 879 914
1'043
-
200
400
600
800
1'000
2009 2010 2011 2012 2013 2014
Ferinject Venofer ISS Gluconate Feraheme Other
5% 7% 10%
15% 20%
25%
63% 62% 59%
50%
44% 40%
11%
16%
10%
6% 9%
2009 2010 2011 2012 2013 2014

FERINJECT® GROWTH REQUIRES TOP DOWN EDUCATION OF TARGET GROUPS
Patients
Physicians
Medical staff
Advisory Boards
Education on Iron Therapy
International Congresses
Iron Working Groups
Sales Representatives
Publications
PR-Campaign
Post-marketing Surveillance Study
Infusion Training
Patient-brochure
KOLs
21 © Galenica Group

MAY
FERINJECT® MEETINGS / CONGRESSES PRESENCE IN 2015
MAR APR JAN JULY AUG OCT NOV
ERA-EDTA London Booth & Symposium
ECCO Barcelona Booth
FEB JUNE
EHA Vienna Booth & Symposium
SEPT
HFA Sevilla Booth
Gastroenterology Cardiology Oncology Nephrology
22 © Galenica Group
EORTC Madrid Country Dinner
ESC London Booth & Symposium
Hematology
European Academy Paris
ASN San Diego Booth & Symposium
Galenica event Iron Academy
Swiss Academy Zurich/Lausanne
Swiss Academy Lugano
23
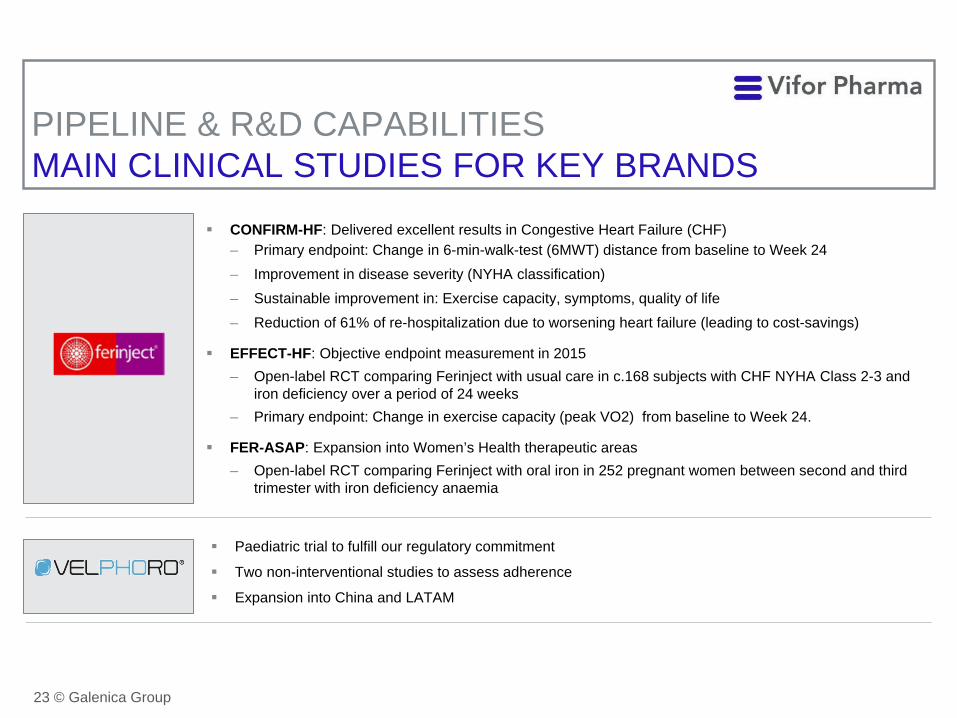
PIPELINE & R&D CAPABILITIES MAIN CLINICAL STUDIES FOR KEY BRANDS
CONFIRM-HF: Delivered excellent results in Congestive Heart Failure (CHF) – Primary endpoint: Change in 6-min-walk-test (6MWT) distance from baseline to Week 24 – Improvement in disease severity (NYHA classification) – Sustainable improvement in: Exercise capacity, symptoms, quality of life – Reduction of 61% of re-hospitalization due to worsening heart failure (leading to cost-savings)
EFFECT-HF: Objective endpoint measurement in 2015 – Open-label RCT comparing Ferinject with usual care in c.168 subjects with CHF NYHA Class 2-3 and
iron deficiency over a period of 24 weeks – Primary endpoint: Change in exercise capacity (peak VO2) from baseline to Week 24.
FER-ASAP: Expansion into Women’s Health therapeutic areas – Open-label RCT comparing Ferinject with oral iron in 252 pregnant women between second and third
trimester with iron deficiency anaemia
Paediatric trial to fulfill our regulatory commitment
Two non-interventional studies to assess adherence
Expansion into China and LATAM
23 © Galenica Group

24
Randomized Studies N=38
Observational "Real World
Studies" N=17
Cardio
Surgery
WH
Onco
Nephro
Gastro
ID
Neuro
Pediatric
Rheuma
Diabetes
VIFOR PHARMA SUPPORTS PHASE 4 STUDIES WITH FERINJECT®
Current Focus Areas (91%)
New Areas (9%)
Scientific interest continues to be strong
24 © Galenica Group

STRATEGIC PARTNERSHIPS STRUCTURE, SCOPE & OBJECTIVES
Minority profits (45% of JV net profit)
VIFOR
VIFOR-FMC Renal Pharma
Venofer and Ferinject in CKD Velphoro(1)
Payment for minority stake 45% stake 55% stake
100% consolidated
Distribution partners incl. FMC
(1) Velphoro IP rights owned by VIFOR-FMC Renal Pharma.
JV STRUCTURE KEY OBJECTIVES
Allows VIFOR Pharma focus “scope for growth” strategy on Ferinject® outside the field of nephrology
Access to FMC’s large pool of patients (over 280k dialysis patients worldwide)
Maximizes sales forces synergies between VIFOR Pharma and Fresenius
Optimizes commercial success of Velphoro® through access to patients and a single field force that has a
complete nephrology portfolio
Potential to build a world-leading nephrology specialty care pharma company
Most importantly, patients benefit most from faster access to high-quality care
SCOPE OF OPERATIONS
JV holds the global nephrology commercialisation rights to Ferinject, Venofer and Velphoro (1)
Development and commercialisation of Ferinject in indications outside of dialysis and pre-dialysis remains the responsibility of VIFOR
25 © Galenica Group

VIFOR PHARMA INTERNATIONAL ORGANISATION WELL ESTABLISHED GLOBAL INFRASTRUCTURE
26 © Galenica Group
Manufacturing – 6 sites Switzerland – 4 sites Portugal – 1 site United Kingdom – 1 site
Vifor Pharma / OM Pharma - 14 Affiliates Austria Belgium France Germany
Netherlands
Romania
Spain Sweden Switzerland United Kingdom
Peru Portugal
Singapore
Italy
Vifor Pharma - 6 Offices Argentina
Canada Russia
United States
Australia
United Arab Emirates Countries managed by Vifor Pharma Affiliates
Countries managed with Partners

27
MARKETING & COMMERCIAL ORGANISATION VIFOR PHARMA GLOBAL NETWORK
Note: CEE: Central & Eastern Europe, CIS: Russian Commonwealth.
Other Partnerships: Roche: Collaboration to explore the clinical use of CellCept outside of transplantation Helsinn Healthcare: Entered into an exclusive license and distribution agreement for Helsinn’s nepupitant-palonosetron fixed dose combination since 2013
Mexico, Brazil, Argentina, South Africa
Nephrology Global Russia, CIS
Russia, CEE, CIS, China, Poland
MENA
Russia
China
27 © Galenica Group

28
VELPHORO® A CLEAR VALUE PROPOSITION
− Velphoro® is a calcium-free iron-based phosphate binder offering safety, efficacy, simplicity and high acceptance
− Velphoro® clinical data fully support an attractive target profile: effective with low pill burden (3.3 pills per day after 52 weeks)
− Velphoro® is approved in 36 markets, launched in 5 markets (US, Germany, UK, Portugal, Denmark) and 14 more approvals expected in 2015
− Velphoro® in US: Prescriptions and sales reflect expectations, Negotiations with healthplans on track, Patient Access programs in place
Net sales 2014: CHF 15M
Patients who require fewer pills show improved compliance
Improved compliance Improved outcomes Fewer pills
Formulation allows for phosphorus control with fewer pills
Better compliance offers improved outcomes
28 © Galenica Group

29
VELPHORO® IS DIFFERENTIATED… … SAFETY, EFFICACY, HIGH ACCEPTANCE
! SAFETY – Non-calcium iron based – No risk of iron accumulation – No interaction with oral vitamin D EFFICACY & SIMPLICITY – 1 tablet per meal HIGH ACCEPTANCE – Good chewability & pleasant taste – Quickly disintegrated
vs. Fosrenol vs. Renvela vs. Auryxia
! ! 29 © Galenica Group

INFECTIOUS DISEASES/OTX LEADING PRODUCTS IN EMERGING MARKETS
30 © Galenica Group
− Respiratory immuno enhancer − #1 Broncho-Vaxom® marketed in 65 countries
− Micro-vascular complications − Doxium® presence in 47 countries worldwide
− Antihemorragic − Worldwide presence in 42 countries
− Urinary immuno enhancer − Marketed in 56 countries worldwide
Net sales 2014: CHF 126.7M

VIFOR PHARMA OTC No. 3 IN SWITZERLAND
− 4 leading products (listed in Top 10 Swiss OTC products): Perskindol® +12.6%, Triofan® +8.7%
− Continuous optimisation and expansion of portfolio:
− Cooperation with Retail: Medical Training: 3x higher sales in the pharmacies that took part! Growth in sales outperformed the market
Perskindol® Algifor® Triofan® Anti-Brumm®
31 © Galenica Group
Sales 2014 CHF 59.6M
(in Switzerland)

GALENICA SANTÉ OVERVIEW
Strategic projects 1. Integrate Consumer Health by mid-2015
2. Retail: improvement on processes, back office, efficiency and performance
3. Logistics: strengthen and broaden our offering to customers
32 © Galenica Group

33
GALENICA SANTE SUMMARY POSITIONING IN CORE MARKETS
SANTÉ #1 POSITIONING IN CORE MARKETS
Ret
ail M
arke
t W
hole
sale
Mar
ket
Market Share: ~55% 30% 10%
GALENICA
Market Leader +6000 customers
Acquired by Phoenix in 2007
Covers German-speaking areas of
Switzerland
# of pharmacies, as of 2014, total = 1,757
312
179
1518274985
4916.0x # of pharmacies
(1)
(1) 312 own pharmacies (Amavita and Sun Store) and 179 independent partners (under Winconcept partnerships).
Pill
Pha
rmac
ies
& D
rugs
tore
s
Pha
rmac
ies
Pop
ulai
res
Gen
éve
Topw
ell
Dr.
Bäh
ler
Dro
pa
BE
NU
(P
hoen
ix)
GA
LEN
ICA
GALENICA SANTÉ
HCI & Others
Retail
Wholesale & Pre-
Wholesale
Network of own and partners’ pharmacy chain
Network on pharmaceutical products and laboratory equipment wholesale suppliers and pre-wholesalers across Switzerland
Handling of the purchase, sale, warehousing and distribution of products for third parties
Technology solutions, databases and management solutions development for the networked healthcare market
33 © Galenica Group

34
GALENICA SANTÉ SWISS RETAIL & WHOLESALE OPPORTUNITIES
MARKET Expand and
strengthen the position
EFFICIENCY To be improved
SYNERGIES More targeted use of complementary
strengths
New services and products offerings
Increasing market share of GALENICA Santé products
Exploit potential synergies along the value chain
Reduce inventories Process simplification Increase purchasing
power of GALENICA Santé
Focus on capacity increases and efficiency gains
Optimise support process
Promote leadership and entrepreneurial spirit
OBJECTIVES
34 © Galenica Group

35
GALENICA SANTÉ RETAIL – NO. 1 IN SWITZERLAND
PHARMACIES AND REVENUE PER PHARMACIES
> 100,000 customers daily Network: No. 1 with 491 pharmacies in the best locations MediService: No. 1 as Specialty Pharmacy GALENICA Santé synergies (project LoRe, Coaxial,
Medifilm, etc.) Objective of 500 pharmacies
312
Ow
n ph
arm
acie
s
179
Phar
mac
ies
part
ners
146 104 61 1
OVERVIEW OF RETAIL DIVISION
161 6 12
Total number of pharmacies in Switzerland: 1,757
35 © Galenica Group
(CHFm)
54%
32%
63%
46%
68%
37%
0
1
2
3
4
5
0%
20%
40%
60%
80%
100%
Amavita Sun Store Swiss Market
Rx part Non Rx part Average Revenue / Pharmacy
Amavita / Sun Store Average Revenue Pharmacy (2014): CHF4.1m per pharmacy

36
GALENICA SANTÉ WHOLESALE & PRE-WHOLESALE BUSINESS
LOGISTIC NETWORK OVERVIEW OF DIVISIONS
Lausanne - 8‘200 m2 storage space - 900 containers/hr. - 30‘000 lines/day - 40 delivery vehicles - 190 employees
Niederbipp - 21‘000 m2 storage space - 2‘800 containers/hr. - 100‘000 lines/day - 70 delivery vehicles - 500 employees
Who
lesa
le
Pre-
Who
lesa
le
1,000 Pharmacies
4,000 Doctor Practices
450 Drugstores
580 Hospitals/ Aged Care
Over 1,100 suppliers 80,000 products, 42,000 always in stock including
Pharmaceutical, non-pharmaceutical, practice laboratory equipment, and medical equipment
Over 6,000 customers
Serv
ice
Largest Swiss pre-wholesaler, offers specialised logistics services with distribution centre in Burgdorf
14,000 products in stock 80 partners
Handles and coordinates the purchase, sale, warehousing and distribution of products for third parties
Neuenberg
Lausanne-Ecubiens
Genf Sitten
Barbengo-Lugano
Chur Luzern Bern
Niederbipp
Basel
Zurich
Burgdorf
Wholesale
Pre-wholesale
36 © Galenica Group

37
GALENICA SANTÉ OVERVIEW HEALTHCARE INFORMATION
Provides technology solutions for the GALENICA Santé market
Maintains databases and develops management solutions tailored specifically to the needs of the networked healthcare market
Activities consist of content management (Documed and e-mediat) and IT systems (TriaMed and TriaPharm)
Overall strategy is to further develop service offering to support the “eHealth Switzerland strategy”, which was defined by the Swiss federal and cantonal governments and aims to introduce electronic patient filing across the whole country by 2015
SERVICES AND PRODUCT PORTFOLIO OVERVIEW OF HEALTHCARE INFORMATION DIVISION
Digital editions of Swiss drug compendium (online and smartphone app)
Master database for all stakeholders in Swiss health market
Our software solutions TriaMed® and TriaPharm®
− about 1,300 doctors offices
− about 260 pharmacies Sun Store and Amavita
37 © Galenica Group

FINANCIALS
38 © Galenica Group

GALENICA GROUP KEY FINANCIALS
39 © Galenica Group
in million CHF 2013 2013 (L4L) 2014 ∆ % L4L
Net Sales – Vifor Pharma 662.7 662.7 706.2 +6.6%
Net Sales – Galenica Santé 2,765.9 2,765.9 2,781.9 +0.6%
Net Sales – Galenica Group 3,359.4 3,359.4 3,416.2 +1.7%
Other operating income 304.7 304.7 254.7 -16.4%
Operating revenue 3,664.1 3,664.1 3,671.0 +0.2%
COGS -2,179.4 -2,179.4 -2,185.4 -0.3%
OPEX -1,018.6 -1,041.7 -1,038.7 +0.3%
EBITDA 466.2 443.1 446.7 +0.8%
EBIT 390.6 367.5 370.2 +0.7%
ROS (%) 11.6% 10.9% 10.8%
Net Profit (before minorities) 334.8 296.2 312.0 +5.3%
Net Profit (after minorities) 296.2 257.6 284.5 +10.4%
EPS (in CHF) 45.7 39.8 43.9 +10.3%
1)
1) 2013 incl. IAS 19 cost reduction of CHF 23.1mio

GALENICA GROUP Net profit after minorities: +10.4% on a comparable basis
+0.8%
+3.9% 428.0 443.1 446.8
23.1466.2
446.8
2012 2013 2014
EBITDA
IAS19
in million CHF
+3.5%
+8.9%
+0.8%
-4.2%
352.0 367.5 370.2
23.1390.6
370.2
2012 2013 2014
EBIT in million CHF
+4.4%
+11.0%
IAS19
+0.7%
-5.2%
276.5 296.2 312.0
38.6334.8
312.0
2012 2013 2014
Net Profit before minorities
+7.2%
+21.1%
IAS19 & CRA
in million CHF
+5.3%
-6.8%
40 © Galenica Group
255.1 257.6 284.5
38.6296.2
284.5
2012 2013 2014
Net Profit after minorities
IAS19 & CRA
in million CHF
+1.0%
+16.1%
+10.4%
-4.0%

41 © Galenica Group
VIFOR PHARMA Net sales: +6.6%, R&D: 98.1 million
633 663 706
271 253 206
2012 2013 2014
291.7 304.7 301.0
257.1 269.3 265.0
0
300
600
2012 2013 2014
in million CHF
ROS1) 28.4% 29.6%
+4.8% -1.6%
29.2%
+4.5% -1.2%
1) EBIT in % net sales & other operating income
+4.6% +6.6%
Other Revenue
Net sales
Total other revenue
(-18) (-47)
in million CHF
EBITDA EBIT

GALENICA SANTE Solid ROS performance
136.0 139.2 143.3
94.9 99.3 102.9
0
150
300
2012 2013 2014
Galenica Santé in million CHF
ROS 3.5% 3.6% 3.7%
+2.4%
+4.6%
+2.9%
+3.6%
81.0 85.1 88.5
60.3 63.0 65.0
0
75
150
2012 2013 2014
Retail
ROS
in million CHF
+4.5%
+5.0% +4.0%
+3.2%
5.1% 5.1% 5.2%
46.3 46.6 46.8
30.7 31.1 31.4
0
50
100
2012 2013 2014
Logistics
ROS
in million CHF
1.5% 1.5% 1.5%
+0.5%
+1.3%
+0.5%
+1.0%
42 © Galenica Group
10.78.2 8.4
4.3 4.0 5.00
10
20
2012 2013 2014
HealthCare Information
ROS
in million CHF
9.1% 10.2%
-23.0%
+23.9%
+3.0%
13.0%
-5.7%
EBITDA EBIT

GALENICA GROUP FREE CASH FLOW & INVESTMENTS
43 © Galenica Group
In million CHF Actual 2012
Actual 2013
Actual 2014
Cash flow from operating activities 291.7 329.0 355.8
+ Proceeds from property, plant and equipment, investment properties, intangible assets, , financial assets and securities 26.0 12.7 12.9
- Investments in property, plant and equipment, investment properties and intangible assets -51.8 -71.6 -69.9
- Investments in financial assets, associates & subsidiaries -19.9 -49.4 -100.6
Free Cash Flow 246.1 220.7 198.2
46.057.3 60.0
7.5
14.4 10.153.5
71.7 70.0
0
50
100
2012 2013 2014
in million CHF Investment
Investment tangible assets Investment intangible assets

GALENICA GROUP BALANCE SHEET – KEY FIGURES
44 © Galenica Group
in million CHF / % Actual 2012
Actual 2013
Actual 2014
Interest coverage 10.8 14.9 17.1
Debt coverage 1.3 0.9 0.8
Gearing 42.0% 28.1% 19.5%
Operating net working capital 500 521 536
% of Total liabilities and shareholders' equity
1) trade accounts receivable + inventories ./. trade accounts payable
1)
1'3321'555 1'750
559 437 341
0
1'500
3'000
2012 2013 2014
in million CHF
Net debt
Equity
42%
18% 14% 11%
51% 55%

CONTACT INFORMATION
Jörg Kneubühler CFO Galenica Group & CEO Galenica Santé Tel.: +41 58 852 81 11 Mail: [email protected]
Søren Tulstrup CEO Vifor Pharma Tel.: +41 58 851 80 87 Mail: [email protected]
Investor Relations: Media: Julien Vignot Christina Hertig Head Investor Relations Head Corporate Communication Tel.: +41 58 852 85 29 Tel.: +41 58 852 85 17 Mail: [email protected] Mail: [email protected]
45 © Galenica Group

DISCLAIMER
46 © Galenica Group
Certain statements, beliefs and opinions in this presentation are forward-looking, which reflect the Company’s or, as appropriate, the Company’s directors’ current expectations and projections about future events. By their nature, forward-looking statements involve a number of risks, uncertainties and assumptions that could cause actual results or events to differ materially from those expressed or implied by the forward-looking statements. These risks, uncertainties and assumptions could adversely affect the outcome and financial effects of the plans and events described herein. A multitude of factors including, but not limited to, changes in demand, competition and technology, can cause actual events, performance or results to differ significantly from any anticipated development. Forward-looking statements contained in this presentation regarding past trends or activities should not be taken as a representation that such trends or activities will continue in the future. As a result, the Company expressly disclaims any obligation or undertaking to release any update or revisions to any forward-looking statements in this presentation as a result of any change in expectations or any change in events, conditions, assumptions or circumstances on which these forward-looking statements are based. Neither the Company nor its advisers or representatives nor any of its of their parent or subsidiary undertakings or any such person’s officers or employees guarantees that the assumptions underlying such forward-looking statements are free from errors nor does either accept any responsibility for the future accuracy of the forward-looking statements contained in this presentation or the actual occurrence of the forecasted developments. You should not place undue reliance on forward-looking statements, which speak only as of the date of this presentation.