1901 improving upland cotton by introducing desirable ... · 1901 improving upland cotton by...
TRANSCRIPT

1901 Improving Upland Cotton by Introducing Desirable Genes from Pima Cotton
Dr. Jinfa Zhang , New Mexico State University, Las Cruces, NM Dr. Richard Percy , Arid-Land Agricultural Research Center, USDA-ARS, Maricopa, AZ
Abbreviations: AFLP, amplified fragment length polymorphism; BAC, bacterial artificial chromosome; BIL, backcross inbred line; CSL, chromosome substitution line; CSSL, chromosome substitution segment line; DH, double haploid; ELS, extra long staple; ESTs, expressed sequence tags; ILs, introgressed lines; NIL, near isogenic line; QTL, quantitative trait locus; RAPD, random amplified polymorphic DNA; RFLP, restricted fragment length polymorphism; RIL, recombinant inbred line; SD, segregation distortion; SNP, single nucleotide polymorphism; SSD, single seeded descent; SSR, simple sequence repeats
Acknowledgements: This research was supported in part by grants from Cotton Incorporated, Cary, N.C., USA, USDA-ARS, and the New Mexico Agricultural Experiment Station, NM, USA.
ABSTRACT
The narrow genetic base of elite Upland cotton (Gossypium hirsutum) germplasm has been a significant impediment to sustained progress in the development of cotton cultivars to meet the needs of cotton growers and industry in the recent years. The prospect of widening the genetic base of Upland cotton by accessing the genetic diversity and fiber quality of extra long staple Gossypium barbadense cotton has encouraged interspecific hybridization and introgression efforts for the past century – with limited success. Modern DNA marker technology has renewed interest in this area, with many quantitative trait loci (QTLs) being reported from numerous segregating interspecific populations. However, genetic barriers between the two species in the forms of divergent gene regulatory systems, accumulated gene mutations, gene order rearrangements and cryptic chromosomal structure differences have resulted in hybrid breakdown, hybrid sterility and selective elimination of genes. These genetic incompatibilities between species have caused complications in marker and gene mapping that has resulted in extreme difficulty in QTL verification and employment in cotton breeding. The objective of this paper is to provide a mini-review in interspecific hybridization between G. hirsutum and G. barbadense cotton relevant to breeding under the following sections: (1) quantitative genetics, (2) introgression breeding, (3) mapping population design and development, (4) QTL mapping progress, and (5) problems with current QTL mapping. Case studies of successful examples from the authors are provided.
INTRODUCTION
Cotton is the world’s leading fiber crop and its fiber production represents a multi-billion dollar industry in the U.S. Cotton is grown in more than 6.2 million hectares across 17 southern states from Virginia to California with 21.7 million bales of cotton harvested in 2006 (National Cotton Council, U.S.). The United States is the leading exporter, accounting for over 70% U.S. cotton production and one-third of global trade in raw cotton. The U.S. cotton industry accounts for more than $25 billion in products and services annually with more than 400,000 jobs generated in the industry sectors from farms to textile mills (http://www.ers.usda.gov/publications/CWS/2007/03Mar/CWS07B01/cws07B01.pdf).
However, the past 15 years has seen stagnation in cotton fiber yield (Meredith, 2000). Thus, improving cotton yield and fiber quality is increasingly recognized as pivotal to the survival of the U.S. cotton grower in the internationally competitive marketplace. The narrow genetic base of Upland cotton germplasm used in breeding has been considered one of the main reasons contributing to the lack of steady progress in the development of cotton cultivars to meet the needs of cotton growers and industry in the U.S. in the recent 15 years (Meredith, 2000; Lewis, 2001). May et al. (1995) predicated that a narrow gene base may result in a decline in long-term gains in lint yield and fiber quality. A series of studies on pedigrees, coefficients of parentage, and genetic diversity for 260 cotton cultivars released in the U.S. between 1970 and 1990 have been conducted, and have indicated a fairly narrow genetic base for commericial G. hirsutum (May et al., 1995; Bowman et al., 1996; Van Esbroeck et al., 1998; Bowman and Gutierrez, 2003). Investigations utilizing various molecular marker techniques such as isozymes, random amplified polymorphic DNA (RAPD), amplified fragment length polymorphism (AFLP), restricted fragment length polymorphism (RFLP), and simple sequence repeats (SSR) agree with pedigree analyses and coefficient of parentage estimates, confirming a low level of genetic diversity in cultivated cotton germplasm (Wendel, et al., 1992; Tatineni et al., 1996; Abdalla et al., 2001; Iqbal et al., 2001; Gutierrez et al., 2002; Lu and Myers, 2002). In one of the first investigations of this type, using allozyme analyses, Wendel et al. (1992) found a representative set of Upland cultivars to possess half the number of alleles per locus, half the percentage of polymorphic loci, and half the mean panmictic heterozygosity of the species as a whole. Research in other countries such as Australia, China, and Pakistan has obtained similar results (Multani and Lyon, 1995; Zuo et al., 2000; Rahman et al., 2002).
Cotton fibers are differentiated epidermal individual cells developed from the outer integument of ovules. As a single cell, cotton fiber has become a model system for studies of cell initiation, elongation, differentiation, and cell wall biosynthesis (Basra, 1999; Kim and Triplett, 2001). Significant information has been accumulated regarding structural development and growth regulation of cotton fiber cells, isolation and characterization of genes whose expression is related to cellulose biosynthesis in developing fibers, genetic variation in fiber quality, and fiber modification through genetic engineering (for review, see Basra, 1999; Wilkins and Jernstedt, 1999; Wilkins and Arpat, 2005). Research in molecular genetics and genomics of cotton fiber has developed substantial genomic tools and materials, including ESTs (expressed sequence tags), microarrays, BAC (bacterial artificial chromosome) libraries, DNA markers and linkage maps, and QTLs (quantitative trait loci). The disseminated information and resources are evidently highly valuable in equipping the cotton research community with novel ideas and approaches in structural, functional, and comparative evolutionary genomic research using fiber as a unified platform. However, the inability to associate fiber genes with phenotypes remains an important missing link to connect genes to functions.
Upland cotton, producing >90% world cotton fiber, is known for its wide adaptation, fuzzed seed, high lint percentage, and high yield; whereas extra long staple (ELS) G. barbadense cotton, accounting for ~5% world cotton production, is known for its superior fiber qualities, naked seed, lower lint percentage, and lower yield potential. Previous research has been unable to answer some scientifically intriguing questions at the molecular and genomic levels, such as why G. hirsutum cottons have more fibers, and therefore, higher yield and why G. barbadense ELS cottons have much lower number of fibers, produce little fuzz, and produce a much longer, stronger and finer fiber? The use of naked seed or fiberless mutants could help identify developmental switches for fiber cell initiation to answer why these mutant cottons do not produce short fiber (fuzz), or lint fiber, or both. However, questions still remain as to why and how G. hirsutum cotton produces more fiber initials than G. barbadense cotton and how we can manipulate it. From the whole biology perspective, fiber
development is regulated not only by genes expressed in fibers, but also genes from ovules and ovaries which house the fiber cell and provide nutrients, hormones, and protection. Therefore, focus on only fiber ESTs and genes represents the danger of “seeing only trees, but missing the forest”. QTL mapping for cotton yield, yield components, and fiber quality traits has been reported in recent years. These QTLs have been identified by bracketing with DNA markers, but to date no candidate genes have been associated with these bracketed QTL regions. The objective of this paper is to provide a mini-review in interspecific hybridization between G. hirsutum and G. barbadense cotton relevant to breeding under the following sections: (1) quantitative genetics, (2) introgression breeding, (3) mapping population design and development, (4) QTL mapping progress, and (5) problems with current QTL mapping. Case studies of successful examples from the authors are provided. This paper reflects the views of the authors as applied geneticists working on Pima genetics and Acala breeding including interspecific breeding, and is by no means a comprehensive summary of research progress in above areas. It is our hope that more attention and discussion will be encouraged in the cotton genetics and genomics community with the aim to identify solutions for cotton breeding.
QUANTITATIVE GENETICS
Investigations in G. hirsutum
Cotton fiber quality traits typically have been found to be quantitatively inherited, and to be influenced by genotype by environment interactions. Meredith (1984) and May (1999) comprehensively reviewed the genetic basis of fiber properties and concluded that even though environmental effects (such as locations, years of testing) affect fiber length, strength, and fineness, the magnitude of genetic variation generally is greater than that of non-genetic factors. Among the genetic factors, additive variation and effects generally play a more important role in controlling expression of the fiber properties, thereby rendering moderate to high heritability. Effective numbers of genes controlling the traits were estimated. For example, estimates of gene number affecting fiber strength ranged from 5 to 14. However, only a few major genes were involved in the development of several segregating populations (May, 1999). Several morphological mutations, such as fiber color and plant pilosity, also have been found to affect fiber quality. However, the traditional quantitative genetic approach cannot separate individual gene effects and localize them on the cotton genome.
Investigations in G. barbadense and interspecific populations
It should be pointed out that above results and conclusions were from G. hirsutum , while quantitative genetic studies using G. barbadense cottons have been much fewer. Therefore, it is difficult to know how quantitative inheritance in one species relates to the other species. A greater number of quantitative investigations have occurred in interspecific populations. These interspecific investigations began prior to the 1950s (Knight, 1950), but few definitive conclusions were drawn from them, due in part to quantitative genetic analyses being in its infancy at the time. Due to the state of quantitative analyses tools, many interspecific population studies were conducted using Mendelian methods. For example, Harland in work conducted in 1915-1929 found no apparent Mendelian segregation in bract, boll, calyx, and fiber traits in interspecific hybrids (Knight, 1950). The work conducted by Kearney and Peebles in 1926 and 1927 reported that fruit and boll abscission rate between F2 and F3 was correlated in a cross of Pima x Acala (Knight, 1950). Ware’s work conducted in 1929-1931 found that high lint percentage (LP) was partially

dominant in F1 from a cross between low LP Pima and high LP Upland and that the segregating results in F2 and backcross between F1 and the low LP parent indicated that LP was controlled by one pair of genes (Knight, 1950).
In the late 1950s and early 1960s when diallel analysis, NCII, and generation mean analysis were developed or became more widely utilized, a number of quantitative genetic studies were conducted on G. hirsutum x G. barbadense interspecific hybrid populations. Marani was the first to use the above quantitative genetic designs in interspecific hybrids in Israel (Marani, 1963, 1964, 1967, 1968a, b; Marani and Avieli, 1973). Quantitative genetics in G. hirsutum x G. barbadense hybrids were also conducted in other major cotton growing countries such as U.S. and China (Percy and Turcotte, 1988; Zhang et al., 1994b, c). Results from diallel matings and NCII designs indicated that for most of the traits studied including earliness, yield, yield components, fiber quality, and plant height, much of the variation was due to the general combining abilities (gca), and in many cases variation due to specific combining abilities (sca) was also detected. For earliness, gca was more predominant than sca. Based on generation mean analysis, additive effect, dominant effects, and epistatic effects usually existed for yield and yield components; for fiber quality traits, both additive and dominant effects were important, while there existed epistatic effect (e.g., additive x additive) for fiber length; for plant height and early maturity traits including flowering date and first harvest percentage, both additive and dominant effects were detected. For example, Marani (1968a, b) reported that there existed additive and dominant effects for seedcotton yield, lint yield, lint percentage, boll size, boll number, seed index, lint index, seed number per boll, flowering number, boll setting percentage, maturity date, plant height, fiber length, strength, and fineness. Additive x additive gene effects occurred for all the above traits, except for seed index, fiber strength, and fineness. Dominant x dominant gene interactions were also observed for the above traits, with the exception of boll size, seed index, seed number per boll, boll setting percentage, plant height, and fiber quality traits. Additive x dominant effects were only detected for seed index, lint index, and seed number per boll.
Heterosis of interspecific hybrids
There have been numerous reports on the performance of G. hirsutum x G. barbadense interspecific hybrids (Davis, 1978, 1979; Weaver et al., 1984; Zhang et al., 1994a; Saranga et al., 1998). From these investigations has emerged a general consensus on heterotic traits common to interspecific hybrids relative to their parent species or intraspecific hybrids. Among traits common to interspecific hybrids are heterosis for: (1) higher seed and seedling vigor, and a higher early growth rate, resulting in strong vegetative growth, large leaf areas, tall plants, and heavy biomass; (2) earlier squaring and flowering, greater number of fruiting sites, higher fruit retention, higher seed index; and (3) greater cold and drought tolerance. However, interspecific hybrids also display very late cutout dates, resulting in large number of bolls that cannot mature before frost; small boll sizes; low lint percentages; and high embryo abortion and motes rates that result in fewer seed per boll. As a result, lint yields of interspecific F1 hybrids are usually lower than Upland cottons but higher than ELS cottons. Selection of short statured, early maturing parental lines has been shown to counter the excessive vegetative vigor of hybrids, increase their earliness of maturity and increase their productivity (Percy and Turcotte, 1988). Interspecific hybrids usually have fiber quality that approaches that of ELS cotton. However, due to the high percentage of motes produced by interspecific hybrids and their later maturity, hybrids often produce weaker fiber and more neps in production. There has been limited success in the release and commercial production of interspecific hybrids in the U.S., and greater success in India.

INTROGRESSION BREEDING
In the past century cotton breeders and geneticists have identified a significant number of desireable agronomic, yield, quality, and resistance traits scattered among diverse germplasm pools created by intraspecific or interspecific breeding. The goal of the breeder has always been to incorporate as many of these traits into a single genotype to create the ideal cultivar, possessing such traits as Acala-type fiber quality, Delta-type fiber yield, and resistance to Verticillium wilt, Fusarium wilt, nematodes, heat stress, and insects. The goal has been made difficult by a lack of knowledge of the number and location of genes controlling these traits within the cotton genome. Under these conditions, transfer of traits between different germplasm pools has been difficult and inefficient. Traditional breeding techniques have had success in pyramiding desirable genes to create successful cultivars, but success has been slow and incomplete.
Brief history of introgression breeding
Due to many desireable traits within the G. barbadense species, fiber quality being primary among them, numerous efforts have been made in the past century to transfer these traits to Upland cotton through interspecific hybridization. Successes in interspecific hybridization have been surprisingly few and difficult. One noted success has been the improvement of fiber quality in Acala cotton. The uniqueness of the Acala cotton has been attributed to its unique breeding history in which germplasm from G. barbadense and a three species Triple Hybrid (ATH, G. arboreum x G. thurberi x G. hirsutum) has been introgressed into the Acala cotton (Smith and Cothren, 1999; Zhang et al., 2005a, b). Interspecific introgression has also contributed significantly to the development of high quality of Pee Dee germplasm lines (May, 2001). The Pee Dee germplasms involved multiple introgressions from the Triple Hybrid, G. barbadense and Acalas. The Pee Dee program resulted in a great increase in yield and earliness in cultivars grown in the Mid-south and elsewhere. Almost all the current Mid-south cultivars have a contribution of PD 2-164. For example, DES 56 was derived from a cross of STV 213 x PD 2-164, which was in the parentage of many commercial cultivars including DPL 50, 51, 5415, SG 125, SG 747 and STV 474, and their subsequent transgenic versions (Bowman et al., 2006). However, attempts to introduce fiber quality genes from Acala and/or Pee Dee lines into other cottons to develop high-yielding cultivars with improved fiber quality has met with limited success (Bowman and Gutierrez, 2003), even though 45% of U.S. cotton cultivars developed from 1950 to 1990 contained New Mexico Acala germplasm (Bowman et al., 1996).
Fiber quality in cotton is a complex of traits, each displaying a multigenic inheritance. It is somewhat understandable that transfer of these traits across species has proven difficult. Greater success has been made in transferring simply inherited traits, conditioned by one or two genes, between species. Traits conditioned by major genes that have been successfully transferred include the dominantly inherited single gene (Gl2e) glandless trait, (Yuan et al., 2000), the sub-okra leaf allele, L2
e (Zhang et al., 1993), pest resistance traits such as the bacterial blight resistance gene, B5 (Percy and Kohel, 1999), Verticillium wilt (Wilhelm et al., 1985) and spider mite resistance from Pima into Upland cotton (Zhang et al., 1992, 1993). Attempts to produce high fiber quality lines through introgression have resulted in numerous stable breeding lines (Ma and Liu, 1982; Zhang et al., 1993; Cantrell and Davis, 2000; Liu et al., 2005), but only after many generations of backcrossing, selfing, and continuous pedigree selection. However, almost no commercial cotton cultivars are claimed to have been developed directly from an interspecific hybrid population.
Strategies of introgression breeding
The major obstacle for successful introgression breeding has been hybrid breakdown, instability, and selective elimination of desirable genes during selfing. Interspecific breeding has proven to be a long term process where conventional intra-specific breeding schemes such as backcross and pedigree breeding have had to be modified and extended over numerous generations and long periods of time to be effective. During the long process, many desirable genes from Pima cotton may be lost due to selective elimination or/and lack of crossovers in homologous chromosome regions between Upland and Pima cotton. Due to the multigenic nature of many fiber quality traits, the efficiency of transfer of desirable traits is low. During this process the breeder must also select to remove unwanted Pima cotton genetic material and stabilize the introgressed genetic backgrounds.
One method to stabilize the interspecific genetic backgrounds has been the creation of doubled haploids via semigamy (Mahill et al., 1983). However, a large scale haploid production and efficient chromosome doubling technique still remains to be established. Another strategy in interspecific introgression is to use G. barbadense cotton chromosome substitution lines (CSL) on Upland cotton backgrounds to cross with Upland cotton cultivars. This will create chromosome substitution segment lines (CSSL) and the genome-wide hybrid breakdown will be minimized. However, based on the results published so far, only limited positive effects from a few Pima cotton chromosomes were detected. Compared with their TM-1 recurrent (recipient) parent, 7 CSL (A2, A4, A5sh, A6, A7, B15sh-D1sh, and B22Lo-D4 Lo) had similar yield; 5 (B16-D7, B18-D13, B05sh-A5sh, B22sh-D4sh, and B22Lo-D4Lo) had higher lint percentage; 2 (B17-D3 and B25-D6) had lower micronaire; 3 (B25-D6, B14sh-D2sh, and B15sh-D1sh) had longer fiber; 4 (A2, B25-D6, B14sh-D2sh, and B15sh-D1sh) had stronger fiber (Saha et al., 2004, 2006; Jenkins et al., 2006, 2007); and CSL-A5sh significantly increased flower production (McCarty et al., 2006). The maximum positive effects of the individual G. barbadense chromosomes on the fiber quality traits were only 1/4~ 1/3 of the G. barbadense parent genotypic effects, indicating the multigenic control (accumulated effects from individual genes and their positive interactions on different chromosomes) of fiber quality. Repulsion linkage between genes with opposite effects may also play a role. Some other G. barbadense chromosomes had deleterious effects on yield and the fiber quality traits. As expected, several CSL (B16-D7, B17-D3, B18-D13, B14sh-D2sh, and perhaps B22sh-D4sh and B25-D6) had significantly lower yield than their recurrent parent, indicating negative effects of the G. barbadense chromosomes on yield in G. hirsutum backgrounds. This demonstrates the complex genetic basis of yield and fiber quality from G. hirsutum x G. barbadense crosses.
Perhaps the most efficient strategy in introgressing fiber quality genes from G. barbadense is to pyramid desirable fiber quality genes through population improvement using intermating or recurrent selection and then develop homozygous intermediate G. hirsutum lines with G. barbadense type fiber quality, e.g., Del Cerro (Smith and Cothren, 1999). The G. hirsutum lines with G. barbadense fiber quality can then be further utilized to cross with elite Upland cotton for further improvement. For example, by crossing with TM-1, a stabilized introgression line NM 24016 (Cantrell and Davis, 2000) has yielded a number of RILs showing high fiber quality and acceptable agronomic properties (Percy et al., 2006). Even though many of the RILs have unacceptable yield or average fiber, the number of lines produced has increased the chance that one or two may have the right combination of yield and quality. Several RILs have been used in our heat tolerance/fiber quality breeding project.
Regardless of introgression technique employed, the identification of QTLs and development of markers for marker assisted selection would be a great boon to the cotton breeder, providing greater precision in trait transfer, identification of desirable trait combinations, etc.
MAPPING POPULATION DESIGN AND DEVELOPMENT
F2 and F2.3 populations
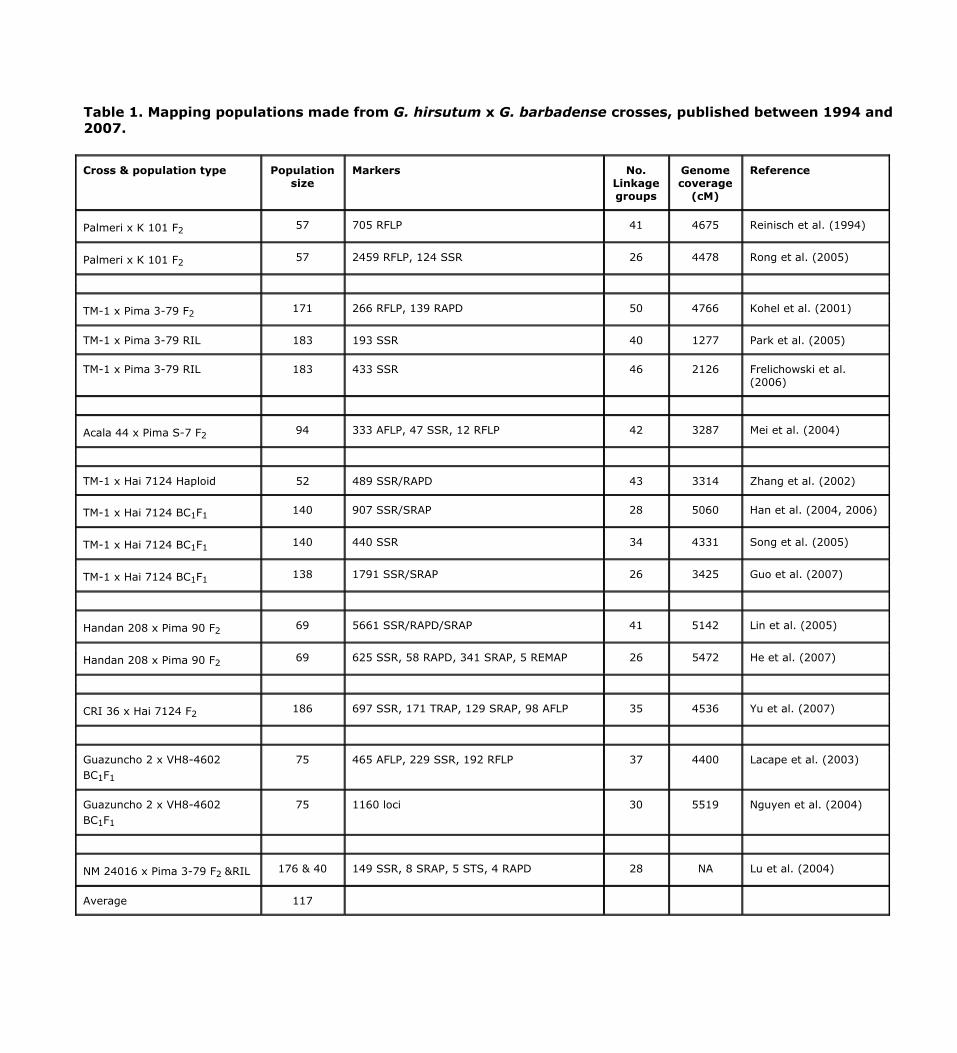
In the past decade, the most frequently used strategy for interspecific population development and analyses has been the creation and genotyping of an F2 population, accompanied by phenotyping the same F2 population or its F2 derived F3 (i.e., F2.3) progenies in a few cases in the field or greenhouses (see Table 1 and 2 for details). This permits a quick generation and reporting of a molecular linkage map using F2 and QTL identifications using F2 (mainly) or F2.3 phenotypic data. However, this strategy suffers numerous intrinsic shortcomings, including, (1) loss of genotypic and phenotypic data, particularly fiber quality and yield data, due to hybrid breakdown and sterility; (2) a high percentage of markers displaying distorted segregation that consequently interferes with reliable placement of the markers within linkage groups; (3) higher sampling and environmental errors occurring during phenotyping due to the singular or limited number of plants per progeny available to be phenotyped; (4) impracticality of testing in multiple environments, resulting in the inability to detect QTLs occurring in differing environments (E) and QTL x E interactions; and (5) the genotyping and phenotyping of different populations (i.e. different generations within a segregating population) that renders impossible mapping of the majority of minor QTLs with small effects and their epistatic effects. The choice to use F2 and F2.3 populations has been the result of numerous factors, including the rapidity of population development and analyses and limited available resources. Many of these populations appear to have been produced with a primary goal of producing a mapping population. Their utility in QTL analyses and as breeding populations appears to have been secondary goals in many cases. Though these populations have proven adequate for generating molecular maps, they are less suited for QTL analyses, for the reasons given above.
Recombinant inbred line (RIL) populations
Permanent mapping populations from recombinant inbred lines (RILs) developed by single seeded descent (SSD) can facilitate gene mapping (Lu et al., 2004; Park et al., 2005; Frelichowski et al., 2006). The use of RILs has the following advantages: (1) new markers developed from BAC libraries of parental genotypes (such as TM-1) are immediately useful in gene mapping. (2) many important genome regions for fiber yield and quality, and stress resistance will be the targets for fine mapping using the BAC libraries and integrated with physical mapping. (3) permanent mapping populations can be distributed and tested across diverse environmental and stress conditions over different locations and years, resulting in more reliable phenotypic data, greater accuracy in QTL identification, and the evaluation of QTL x E. (4) marker data for a population can be added at any time and anywhere, and further testing can be conducted by different researchers for various purposes. (5) DNA marker data on the RIL populations can be stored in a database accessible to the public sector for possible new gene discovery. (6) repeated selfing permits breaking of tight linkage between markers or genes/QTLs to expand genetic distances for high resolution mapping. However, dominant effects (d) and d x d and d x additive interactions of QTLs can not be estimated using RILs. Another disadvantage of RIL populations or any scheme that relies upon advanced generations of an interspecific cross is that hybrid breakdown and
sterility occur in these generations, leading to the loss of RIL lines and poorly adaptive lines. This in turn greatly limits the ability to test interspecific RIL populations across multiple environments of the cotton belt.
Backcross populations
One strategy to minimize the above problems is to use advanced backcrossing (AB) followed by several generations of selfing to develop backcross inbred lines (BIL) (Zamir, 2001). In our program (Pang et al., 2007), Upland and Pima or Egyptian Giza cotton were hybridized as an initial step in creating a BIL population – with the goal of broadening the G. hirsutum genetic base and introducing genes for fiber quality and other desirable traits from G. barbadense into G. hirsutum, .We backcrossed the F1 for two generations using G. hirsutum cotton as the recurrent parent and then selfed the BC2F1 for three times to develop BC2F4 backcross inbred lines (BILs). For one BIL population, two field tests (Maricopa, AZ and Las Cruces, NM) have been conducted in 2005, 2006 and 2007. Based on the replicated field tests on the BIL population, (1) individual plants within a line are highly uniform, indicating that within-line variation is minimal; (2) the BIL lines have, in general, Upland cotton plant type and morphological characteristics, showing no hybrid breakdown or weakness; (3) plant height, maturity, boll size, and productivity display tremendous between-line variation; and (4) many BIL lines have performed very well in the field, showing high yield potential. The field data from 2005-2006 indicated high levels of genetic variation among lines (e.g., fiber length: 26.1-33.8 mm; strength: 23.6-39.1 g/tex; micronaire: 2.6-5.7; lint percentage: 29.8-42.6%). These fiber quality results reveal successful introgression and stabilization of varying portions of the G. barbadense genome within the primarily G. hirsutum BIL. Genotypes x environment interactions were observed for most of the traits analyzed. Compared with the recurrent parent, a high yielding G. hirsutum cultivar, many BIL lines showed significantly higher yields, suggesting that high-yielding genes from Pima cotton also may have been introgressed into Upland cotton. A number of other investigations have reported using advanced backcrossing in interspecific populations prior to genotyping and phenotyping advanced generation (BC1 to BC3) individual plants within these populations (Lacape et al., 2005; Chee et al., 2005a, b; Draye et al., 2005). However, to date, no recombinant inbred lines have been produced from these BC populations for genotyping and phenotyping in multiple environments. BIL populations suffer from disadvantages similar to those experienced in RIL populations, that is inability to estimate dominant effects (d), d x d and d x additive interactions of QTLs and loss of lines due to hybrid breakdown and sterility in the development process.
Use of introgressed lines (ILs)
Another strategy has been to use stabilized introgressed lines as parents in producing mapping and breeding populations. These parental lines, which are homozygous and intermediate in phenotype, can serve as a bridge to avoid the hybrid breakdown and selective elimination of genes that occurs in interspecific segregating populations. A RIL population created from the introgressed parent NM 24016 and the Upland TM-1 has demonstrated both the stability of the resulting recombinant inbred lines and the genetic variability that can be realized in such a population (Zhang et al., 2005c; Percy et al., 2006). In another example, no severe hybrid breakdown has been noted from a cross between Acala 1517-99 and Pima Phy 76 during consecutive selfing process. In 2007, more than 1,500 advanced F5.6 progeny rows are being field tested in Las Cruces, NM. This will create one of the largest RIL populations for high resolution mapping of fiber yield and

quality genes in cotton. It is anticipated that genes and/or QTLs for lint yield, fiber quality, and stress resistance identified in this population can be validated to a degree not possible in previous populations and put into use in breeding programs.
Chromosome substitution lines (CSL)
Still another strategy in the movement and mapping of genetic traits between species has been the development of chromosome substitution lines (CSL). Many individual chromosomes or chromosome arms from Pima cotton have been transferred into Upland cotton through monosomic or telosomic cytogenetic stocks, resulting in the development of 17 CSL in Upland cotton TM-1 background (Stelly et al., 2005). Genetic effects of Pima cotton chromosome A1, A2, A4, A6, D3 (formerly c17) and D13 (formerly c18) were reported earlier (Kohel et al., 1977; Ma and Kohel, 1983), while 13 CSL (B02-A2, 04-A4, 05sh-A5sh, 06-A6, 07-A7, 14sh-D2sh, 15sh-D1sh, 16-D7, 17-D3, 18-D13, 22Lo-D4Lo, 22sh-D4sh, and 25-D6) and their hybrids with several Upland cotton cultivars have been recently tested for their effects on yield, yield components, fiber quality, and flower production (Saha et al., 2004, 2006; Jenkins et al., 2006, 2007; McCarty et al., 2006). However, the genetic effects of CSL A11sh, A12sh, and D12Lo have not been reported.
QTL MAPPING
Molecular linkage maps of interspecific populations
Since 1994, at least 16 linkage maps based upon eight G. hirsutum x G. barbadense interspecific hybrid populations have been published or updated with various numbers of marker densities and segregants (Table 1). In five cases, markers have been added to an existing map to create a new map. Eight maps were constructed using F2 populations, five were constructed using BC1F1 populations, and three maps were based on two RIL populations. The genome coverage was over 4,000 cM in most maps and the average number of plants was 117, resulting in relatively low resolution in marker mapping and analysis. These maps have facilitated studies on genome organization, transmission, evolution, and QTL identifications. The highest density maps have used a Palmeri x K 101 F2 population (with 2459 RFLP and 124 SSR; Rong et al., 2004), a CRI 36 x Hai 7124 F2 population (697 SSR, 171 TRAP, 129 SRAP, and 98 AFLP; Yu et al., 2007), a Guazuncho 2 x VH8 BC1F1 population (1160 loci; Nguyen et al., 2004), and a TM-1 x Hai 7124 BC1F1
population (1791 SSR/SRAP; Guo et al., 2007). As a result, 13 pairs of homoelogous chromosomes (A1-A13/D1-D13), two major translocations (A2/A3, and A4/A5), and numerous minor inversions were identified (Reinisch et al., 1994; Lacape et al., 2003; Rong et al., 2004; Guo et al., 2007).
QTL mapping
Numerous QTLs for cotton yield, yield components, fiber quality, and insect and disease resistance among other traits, have been reported from interspecific crosses of G. hirsutum and G. barbadense cottons in recent years using the above and other working maps (Jiang et al., 1998; Kohel, et al., 2001; Saranga et al., 2001, 2004; Mei et al., 2004; Paterson et al., 2003; Chee et al., 2005a, b; Draye et al., 2005; He et al., 2005, 2007; Lacape et al., 2005; Lin et al., 2995; Park et al., 2005; Frelichowski et al., 2006; Rong et al., 2006, 2007; Yu, 2006). More than 680 QTLs have been identified in at least 23 reports to date (Table 2). Depending on population and marker density, the number of QTLs identified ranged from 1 (Rong et al., 2006, 2007) to 80 (Saranga et al., 2001; Lacape et al., 2005; Yu, 2006). The quantitative traits studied were mainly fiber related traits (with more than 400 QTLs; Rong
et al., 2007), and yield and yield components in several cases. QTLs for plant trichomes (Wright et al., 1999; Lacape and Nguyen, 2005), bacterial blight resistance (Wright et al., 1998), Verticillium wilt resistance (Bolek et al., 2005), drought tolerance (Saranga et al., 2001, 2004), and leaf and flower morphological traits (Jiang et al., 2000; Rong et al., 2007) also have been reported.
Chromosomal locations and sub-genome distributions of QTLs
It is difficult to determine how many of the reported QTLs are unique across different investigations, owing to different markers used in different experiments and the wide confidence intervals (10-50 cM) of QTL positions. Therefore we have examined the chromosomal distributions of QTLs for fiber length, strength, elongation, and micronaire which usually have higher heritabilities when measured on an individual plant basis than yield and yield component traits (Table 3, 4, 5 and 6). Most of the chromosomes were found to have at least one QTL for each trait in at least one experiment. While fiber quality QTLs on chromosomes A1, A3, A6, A7, A8, A11, and A12 were equally detected as their respective Dt homeologous chromosomes, QTLs for the above fiber quality traits on D2, D4, D5, D9, D10, and D13 were more frequently detected than their respective At counterparts. QTLs for fiber strength have been reported in 21 of the 26 chromosomes of cotton. The exceptions were chromosomes A2, A6, A10, A12, and D12. Among the chromosomes reported to possess fiber strength QTLs, ten had QTLs detected in more than one report. For fiber elongation, all cotton chromosomes have been reported to have at least one QTL, with the exceptions of A4, A7, and D7. Fourteen chromosomes have been identified to have fiber elongation QTLs in two or more tests. Only one chromosome (D4) has not been reported to have QTLs for fiber length, while 17 chromosomes have been reported to have fiber length QTLs in more than one report. Twelve chromosomes have had fiber micronaire QTLs in two or more tests, while only five chromosomes (A1, A7, A12, D7, and D13) have had no reports of micronaire QTLs. To date very few investigations have reported QTLs for the fiber quality traits on homoelogous chromosomes A7 and D7, while A12 remains devoid of QTLs for strength and micronaire, and chromosome D12 is devoid of fiber strength QTLs. The homoelogous chromosomes A12/D12 contain only 1-2 QTLs for other fiber quality traits. The chromosomes with most often reported fiber quality QTLs are A1, A3, A8, D1, D2, D5, D9, D10, and D13. Based on mega analysis, Rong et al. (2007) stated that fiber related QTLs were not randomly distributed across the cotton genome, in that 5 At chromosomes (A1, A6, A7, A11 and A13) possessed more fiber QTLs than their Dt homoelogs and 7 Dt chromosomes (D2, D3, D4, D5, D8, D9, and D10) contained more fiber-related QTLs than their At homoelogous counterparts. A total of 41 (21%) QTLs for six fiber traits were potential homoelogs and many (47%) fiber QTLs clustered in specific genome regions (12% of the genome).
Four investigations of QTLs for cotton yield have cumulatively found QTLs on 19 of the 26 cotton chromosomes (Table 7). The seven chromosomes lacking yield QTLs were A7, A13, D3, D5, D7, D8, and D11. Only six of the 19 chromosomes reported to have yield QTLs appeared in more than one of the four investigations. Similar to fiber quality QTLs, no yield QTLs were detected on homoelogous chromosomes A7 and D7. It also seems that fewer yield QTLs (13) were detected on Dt subgenome than At subgenome (18). However, the difference is statistically insignificant.
Since the great majority of cotton QTLs have not been validated, one should exercise caution when assigning importance to their subgenomic distributions. Based on fiber quality and bacterial blight resistance, Jiang et al. (1998) and Wright et al. (1998) initially found more QTLs (16 of 21) on the Dt-subgenome. Lacape et al. (2005) also reported slight
overrepresentation (58%) of fiber quality QTLs on the Dt subgenome. However, subsequent data did not appear to corroborate this conclusion (Chee et al., 2005a, b; Draye et al., 2005). More recently, Rong et al. (2007) have reiterated their assessment that “cotton fiber QTLs are enriched in the D subgenome”. QTL mapping results from several other groups fail to support the over representation of QTLs in the Dt-subgenome (Kohel et al., 2001; Mei et al., 2004; Park et al., 2005; Frelichowski et al., 2006; He et al., 2007).
PROBLEMS WITH CURRENT QTL MAPPING
There has been a surprising lack of correspondence between QTLs detected in various studies. In one QTL study of fiber quality traits, low consistency between QTLs was detected between two consecutive backcross generations, BC1 and BC2 (10%), and between the BC2F1 and BC2S1 (20%) populations made from the same two parental lines (Lacape et al., 2005). In another study of yield and agronomic traits which usually exhibit higher environmental influence and therefore lower heritabilities, common QTLs identified between F2 and F2.3 from the same cross was even lower (7%) (Yu, 2006). In yet another investigation that used meta-analysis to integrate QTLs identified from at least 10 different QTL mapping experiments, only 10% of the total QTL set (>400 for fiber related traits) showed correspondence (Rong et al., 2007). What was even more surprising was that “comparison in the same environment of two new mapping populations which shared one identical parent, Pima S-7, and had closely-related alternative parents that differed in carrying specific fiber mutants (n2 and im, respectively), showed virtually no common QTLs” (Rong et al., 2007). The authors pointed out that “the validity of many QTLs in each of these populations is supported by their correspondence to QTLs found in other populations”. But it still did not explain why no common QTLs were detected in two virtually identical F2 populations (the only difference was that one with n2 and another with im segregated). In contrast, one third (26) of the QTLs (80) detected in the French BC populations (Lacape et al., 2005) were congruent with those reported by several other groups (Jiang et al., 1998; Kohel et al., 2001; Paterson et al., 2003; Mei et al., 2004). In an investigation in which individual plants of 24 BC3F2 families were tested for fiber quality traits, 2 common QTLs for elongation, 8 common QTLs for fineness and micronaire, and 4 common QTLs for 2.5% span length were detected in two or more BC3F2 families made from the same interspecific hybrid, Tamcot 2111 x Pima S-6 (Chee et al., 2005a, b; Draye et al., 2005).
Inadequate phenotyping or characterization
Several factors contributing to the current low levels of correspondence of QTLs between experiments include mapping population background (B), environment (E), QTL effect, QTL x B, QTL x E, sampling error, and false positives. Several of the above factors, including sampling error, environmental factors, and QTL by environment interactions can be attributed to phenotyping on individual F2 and occasionally F2.3 progeny, or on individual BC1, BC2 or BC3 plants, where replication has been impossible to implement.. Although phenotyping of individual F2 and occasionally F2.3 progeny has been common in many early QTL investigations, its limitations due to the inability to replicate measurements within an environment or across environments are obvious. Statistically, a QTL has been declared when merely a significant association between a marker or a set of linked markers and a trait is detected. Therefore, experimental errors derived from the environment and sampling (due to no replicates, small sampling size, and genetic elimination of DNA/progeny) make it inevitable to declare false QTLs that are in fact nonexistent. For example, a map with 250 markers and 4 traits will have 1,000 coefficients of correlation for QTL detection, of which, 10 associations could be significant by chance at P= 0.01 and as high as 50 at P= 0.05. However, based on the published reports for cotton, the numbers of associations between

markers and traits ranged from 127 to 12,770 with an average of 3,170. The number of QTLs declared ranged from 1 to 80 with most being between 10 and 25 (Table 2). Therefore, there has been a high probability of declaring false positive QTLs in QTL mapping experiments. At this point, we simply have no experimental means to find the percentage of false positive QTLs reported in the literature, since no mapping populations reported can be retested. One may argue that mega analysis and comparative analysis of previously reported QTLs could help clarify this issue. Again, reports of only 10-20% QTLs detected in common in investigations (Lacape et al., 2005; Rong et al., 2007) reinforce the need for reliable experimental and genetic designs in QTL mapping. In the genomics age, one should remember that Fisher’s three basic principles of experimental design (replication, randomization, and blocking control) still apply when it comes to a field or greenhouse test for QTL identifications. The accuracy of QTL mapping is dependent to a large degree on the accuracy of phenotyping. In fact, for a QTL mapping project, field experiments should be more stringent for experimental error control since minor QTLs with small effects are expected to be detected. In regional cotton variety trials with at least three replicates and large plot size per genotype, coefficients of variation (CV) higher than 15% are usually deemed less desirable. One may expect even higher CV (and environmental variation) when individual plants (such as individual F2 or BC plants used for most of QTL mapping reported in cotton) are the units for measurements. Heritability estimates based on individual plots are usually much higher than those of individual plants, which is why cotton breeders routinely test progenies in replicated plots.
Segregation distortions
Another problem encountered in QTL identification and mapping is segregation distortion due to the genetic incompatibility and genome instability between the two cultivated species in early generations (e.g., F2 and F2.3). On the one hand, translocations between homologous chromosomes (e.g., A2/A3 and A4/A5) and numerous cryptic inversions in the two species may have caused suppression of recombination during meiosis within the involved regions and gamete abortions after meiosis in the interspecific hybrids. One of the genetic consequences from these and other cryptic structural differences between the chromosomes in the two species is segregation distortions (SD) of widespread markers (Table 8) and selective elimination of chromosomal segments and markers. Reinisch et al. (1994) detected 42 SD blocks distributed on 26 of 41 linkage groups including A4, A8, A10, A11, A13, D2, D4 and D10, while Lacape et al. (2003) found that most of SD markers were on D10 and four other chromosomes (A6, A12, D1, and D3). Recently, Guo et al. (2007) indicated that two homoelogous chromosomes A7 and D7 each contained a block with 17 (15.4 cM) and 16 SD markers (13.2 cM), respectively, where Pima cotton alleles were preferentially transmitted in a BC1F1 population. After confirming that A7 and D7 indeed carried SD markers, Yu et al. (2007) and He et al. (2007) indicated that SD is more widespread with most chromosomes carrying SD markers. Yu et al. (2007) pointed out that A2, A5, A6, A7, A8, A9, A10, A13, D1, D2, D3, D7, D8, D9, and D13 carried most of the SD markers. Depending on populations and markers, the percentage of SD markers ranged from 7.7% (Song et al., 2005) to 17.5% (He et al., 2007). Depending on populations and chromosome regions, many SD markers were biased toward Pima cotton (Lacape et al., 2003; Guo et al., 2007; Yu et al., 2007) such as chromosome A6, A7, A12, D1, D3, D7, and D10. Lu et al. (2004) even noticed that some G. barbadense alleles were retained in all the RIL lines. However, in some other chromosome regions, G. barbadense alleles may be completely void (Jiang et al., 2000; Lu et al., 2004). This will hamper the detection of QTLs and introgression of favorable alleles from G. barbadense. Many unlinked markers could also have been falsely mapped in the same linkage groups.

Other problems encountered in current QTL mapping efforts
Other problems are encountered in current QTL mapping efforts due to segregating populations or when genotyping and phenotyping occur in different generations. QTL mapping based on associations between F2 markers and F2.3 phenotypes will miss identifications of minor QTLs. A simplified scenario is that a marker is M/m tightly linked to a QTL A/a without crossover and assumes no experimental error. Under the dominance situation, where for example the numerical genotype values for AA, Aa, and aa is 4, 4, and 0 in F2. The genotypic values for their respective F2.3 progeny would be 4, 3 and 0. Under the partial dominance situation, where for example the numerical genotype values for AA, Aa, and aa is 4, 2, and 0 in F2. The genotypic values for their respective F2.3 progeny would be still 4, 2 and 0. Under the recessive situation, where for example the numerical genotypic values for AA, Aa, and aa is 0, 0, and 4 in F2. The genotypic values for their respective F2.3 progeny would be 0, 1 and 4. One can see that under both dominance and recessive situations, association between F2 markers and F2.3 genotypic value is reduced from 1 to 0.97. Considering that hundreds if not thousands of polymorphic markers/genes are segregating in an interspecific population, the heterogeneous and heterozygous status in F2.3 progenies makes it impractical and less desirable to study interactions between QTL/genes using F2 marker genotypes.
The validity of association between RIL marker genotypes and F2 phenotypes (Park et al., 2005; Frelichowski et al., 2006) is genetically questionable. As it is well known, a heterozygous locus marker genotype (e.g., Mm) in F2 will produce two homozygous genotypes, either dominant MM or recessive mm in RIL population after several generations of selfing using SSD. Assume that marker M/m is tightly linked to a QTL A/a in a coupling phase without crossover and with no experimental error. A heterozygous F2 MmAa will give rise to either MMAA or mmaa in its RIL line. If allele A has a completely dominant or even partially dominant effect and the RIL line is MMAA, the genotype MMAA in the RIL can still be used to predict the phenotypic performance of its progenitor heterozygous F2 plant. However, there is a fifty percent chance that the RIL line has been fixed in the homozygous state mmaa. Then the RIL phenotype of the mmaa marker genotype should not be used to reflect its progenitor F2 genotype (MmAa).
Finally, it has been noted that G. hirsutum and G. barbadense have developed numerous duplicate recessive loci, each of which does not render any phenotypic effects in their own genome. However, genetic recombination after interspecific hybridization generates double recessive mutations, many of which are lethal or have marked reduction in fitness (Percy and Kohel, 1999), such as as1as2 (causing female sterility), ob1ob2 (open buds causing low productivity), chl1chl2 (chlorophyll deficiency causing lethality), and ckxcky (corky causing lethal or low productivity). These and other unknown duplicate recessive genes could be one of the reasons for sporophytic selections. Other major mutations in G. barbadense may also cause complications in QTL mapping, as evidenced by Rong et al. (2006, 2007) where segregation of a major fiber mutant (e.g., n2) masked the detections of fiber QTLs.
Compared to the more than 11,000 QTLs in the Gramene Database for grass species (http://www.gramene.org/documentation/release_notes/ releasenotes.html#qtl), the number of QTLs (>680) detected in cotton interspecific mapping populations is very small. Furthermore, there is no current public verification of cotton QTLs identified from the mapping projects, by means of AB-QTL or other approaches. This is in part due to a lack of integration of QTL mapping projects into an applied public cotton breeding program. Another reason is that there is a lack of knowledge of which QTLs, with what effect, can be reliably chosen for breeding. Choosing a minor QTL without a consistent genetic effect

across environments and genetic backgrounds would not justify the long term involvement of limited resources from a breeding program. The dilemma is how would a breeder choose any particular QTL for use in his or her breeding program without first having verification using AB-QTL in various backgrounds? However, once a QTL is confirmed using AB-QTL strategy, the QTL has been already integrated in the breeding program.
In conclusion, the current status of QTL identification from the interspecific populations is probably best summed up by Rong et al. (2007) “in terms of basic genetics, the heterogeneity in QTLs revealed by the different experiments reiterates the need for study of a broad sampling of germplasm, in a wide range of environments, to gain a representative picture of the true genetic complexity of a trait in a particular taxon. From an applied standpoint, the data highlight the need to validate QTLs specifically in each genetic background in which they are to be deployed (for example in mainstream breeding)”. Another important aspect of improving QTL mapping not directly addressed by Rong et al. (2007) is that future population development should prioritize creation of populations that will allow the identification and validation of QTLs across a wide range of environments and that are conducive to applied improvement efforts (i.e. breeding).
CONCLUDING REMARKS
Since the turn of the last century, the prospect of combining the fiber quality found in G. barbadense with the yield potential of G. hirsutum has encouraged tremendous efforts in interspecific breeding in major cotton-growing countries- with limited success. However, enormous information has been accumulated using traditional qualitative and quantitative genetic approaches. Thus far, a fair number of simply inherited traits (e.g. the dominant glandless gene,Gl2e, the semigamy trait (Se), the bacterial blight resistance gene, B5, Verticillium wilt resistance, and spider mite resistance among others) have been discovered in G. barbadense (Yuan et al., 2000; Percy and Kohel, 1999; Wilhelm et al., 1985) and transferred to G. hirsutum. However, genetic barriers between the two species observed in cytological and molecular investigations have created barriers to the successful transfer and pyramiding of genes responsible for the expression of multigenic traits.
Modern genomics technology has revived interest in the identification and transfer of genes controlling multigenic traits such as fiber quality across species. Presently, genome-wide linkage maps using interspecific G. hirsutum x G. barbadense populations have allowed the identification of more than 680 QTLs for cotton yield, yield components, and fiber quality traits, among others. However, none of the QTLs identified has been reported to have been used in any public cotton breeding program. Reasons for the lack of use of QTL markers vary, but include a lack of coordination of QTL mapping and breeding efforts and the current poor congruence of QTLs identified in different G. hirsutum x G. barbadense populations or generations. The lack of correspondence of QTLs may have several causes, but inadequate phenotyping due to unsuitable mapping populations (F2, F2.3, and individual BC1F1, BC2, BC3 plants) surely has played a role. To put the genomics to work in the farmer’s field, a breeding-oriented community-wide involvement should be fostered and strengthened in population development, QTL mapping, validation, and marker-assisted selection of favorable QTLs. To this end, specific population development strategies (such as BIL, CSSL, intermediate breeding lines, IL, DH, and NIL) should be employed to tackle the intrinsic problems associated with hybrid breakdown and to facilitate genome-wide introgression and stabilization of the donor DNA/genes. Several permanent mapping populations with relatively large sizes should be developed in a complementary manner for phenotyping in a wide arrange of environments or conditions. A large number of markers including fiber gene markers and other functional markers will certainly need to be developed for a genome-

wide coverage of linkage mapping. Selective genotyping/phenotyping and bulked segregant analysis may be used to identify QTLs and more markers for high resolution mapping of QTLs. Expression QTLs during different fiber development stages should be detected using DNA array technology to fill the missing link between fiber quality/yield QTLs and DNA markers. Once major QTLs with large and consistent effects are discovered and validated, anchored markers should be immediately utilized in applied cotton breeding programs.
With concerted community-wide collaboration and cooperation from multiple disciplines including molecular biologists, geneticists, breeders, statisticians, bioinformaticists, agronomists, physiologists, pathologists, and entomologists, all the structural and functional genomics tools should be well integrated into well-thought out breeding oriented research programs. A breakthrough in developing superior cotton cultivars with super high yield and fiber quality will be no longer a dream in the near future.
REFERENCES
Abdalla, A.M., O.U.K. Reddy, K.M. El-Zik, and A.E. Pepper. 2001. Genetic diversity and relationships of diploid and tetraploid cottons revealed using AFLP. Theor. Appl. Genet. 103:547-554.
Basra, A.S. 1999. Cotton fiber: developmental biology, quality improvement and textile processing. The Haworth Press, Inc., Binghamton, NY
Bolek, Y., K.M. El-Zik, A.E. Bell, A.A. Bell, C.W. Magill, P.M. Thaxton, and O.U.K. Reddy. 2005. Mapping of Verticillium wilt resistance genes in cotton. Plant Sci. 168:1581-1591.
Bowman, D.T., O.L. May, and D.S. Calhoun. 1996. Genetic base of upland cotton cultivars released between 1970 and 1990. Crop Sci. 36:577-581.
Bowman, D.T., and O.A. Gutierrez. 2003. Sources of fiber strength in the U.S. Upland cotton crop from 1980 to 2000. J. Cotton Sci.7:164-169.
Bowman, D.T., O.A. Gutierrez, R.G. Percy, D.S. Calhoun, and O.L. May. 2006. Pedigree of Upland and Pima cotton cultivars released between 1970 and 2005. Miss. Agric. Forestry Exp. Stn. Bull. 1155.
Cantrell, R.G., and D.D. Davis. 2000. Registration of NM24016, an interspecific-derived cotton genetic stock. Crop Sci. 40:1208.
Chee, P.W., X. Draye, C.X. Jiang, L. Decanini, T.A. Delmonte, R. Bredhauer, C.W. Smith, and A.H. Paterson. 2005a. Molecular dissection of interspecific variation between Gossypium hirsutum and Gossypium barbadense (cotton) by a backcross-self approach: I. Fiber elongation. Theor. Appl. Genet. 111:757-763.
Chee, P.W., X. Draye, C.X. Jiang, L. Decanini, T.A. Delmonte, R. Bredhauer, C.W. Smith, and A.H. Paterson. 2005b. Molecular dissection of phenotypic variation between Gossypium hirsutum and Gossypium barbadense (cotton) by a backcross-self approach: III. Fiber length. Theor. Appl. Genet. 111:772-781.
Davis, D.D. 1978. Hybrid cotton: special problems and potentials. Adv. Agron. 30:129-147.

Davis, D.D. 1979. Synthesis of commercial F1 hybrids in cotton: II. Long, strong-fibered G. hirsutum L. x G. barbadense L. hybrids with superior agronomic properties. Crop Sci. 19:115-116.
Draye, X., P. Chee, C.X. Jiang, L. Decanini, T.A. Delmonte, R. Bredhauer, C.W. Smith, and A.H. Paterson. 2005. Molecular dissection of interspecific variation between Gossypium hirsutum and G. barbadense (cotton) by a backcross-self approach: II. Fiber fineness. Theor. Appl. Genet. 111:764-771.
Frelichowski, J.E., M.B. Palmer, D. Main, J.P. Tomkins, R.G. Cantrell, D.M. Stelly, J. Yu, R.J. Kohel, and M. Ulloa. 2006. Cotton genome mapping with new microsatellites from Acala 'Maxxa' BAC-ends. Mol. Genet. Genomics 275:479-491.
Guo, W.Z., C. Cai, C. Wang, Z. Han, X. Song, K. Wang, X. Niu, C. Wang, K. Lu, B. Shi, and T.Z. Zhang. 2007. A microsatellite-based, gene-rich linkage map reveals genome structure, function and evolution in Gossypium. Genet. 176:527-541.
Gutierrez, O.A., S. Basu, S. Saha, J.N. Jenkins, D.B. Shoemaker, C.L. Cheatham, and J.C. McCarty Jr. 2002. Genetic distance among selected cotton genotypes and its relationship with F2 performance. Crop Sci. 42: 1841-1847.
Han, Z.G., Guo W..Z, Song X.L, and T.Z. Zhang. 2004. Genetic mapping of EST-derived microsatellites from the diploid Gossypium arboreum in allotetraploid cotton. Mol. Genet. Genomics. 272:308-327.
Han, Z.G., Wang C., Song X., Guo W., Gou J., Li C., Chen X., and T.Z. Zhang. 2006. Characteristics, development and mapping of Gossypium hirsutum derived EST-SSRs in allotetraploid cotton. Theor. Appl. Genet. 112: 430-439
He, D., Z. Lin, X. Zhang, Y. Nie, X. Guo, C. Feng, and J.McD. Stewart. 2005. Mapping QTLs of traits contributing to yield and analysis of genetic effects in tetraploid cotton. Euphytica 144:141-149.
He, D. Z. Lin, X. Zhang, Y. Nie, X. Guo, Y. Zhang, and W. Li. 2007. QTL mapping for economic traits based on a dense genetic map of cotton with PCR-based markers using the interspecific cross of Gossypium hirsutum x Gossypium barbadense. Euphytica 153:181-197.
Iqbal, M.J., O.U.K. Reddy, K.M. El-Zik, and A.E. Pepper. 2001. A genetic bottleneck in the ‘evolution under domestication' of upland cotton Gossypium hirsutum L. examined using DNA fingerprinting. Theor. Appl. Genet. 103:547-554.
Jenkins, J.N., J.C. McCarty, J.X. Wu, S. Saha, O. Gutierrez, R. Hayes, and D.M. Stelly. 2006. Genetic effects of thirteen Gossypium barbadense L. chromosome substitution lines in topcrosses with upland cotton cultivars: I. Yield and yield components. Crop Sci. 46:1169-1178.
Jenkins, J.N., J.C. McCarty, J.X. Wu, S. Saha, O. Gutierrez, R. Hayes, and D.M. Stelly. 2007. Genetic effects of thirteen Gossypium barbadense L. chromosome substitution lines in topcrosses with upland cotton cultivars: II. Fiber quality traits. Crop Sci. 47:561-570.
Jiang, C.X., R.J. Wright, K.M. El-Zik, and A.H. Paterson. 1998. Polyploid formation created unique avenues for response to selection in Gossypium (cotton). Proc. Natl. Acad. Sci. USA 95:4419-4424.
Jiang, C.X., P.W. Chee, X. Drage, D.L. Morrell, C.W. Smith, and A.H. Patterson. 2000. Multi-locus interactions restrict gene introgression in interspecific populations of polyploid Gossypium (cotton). Evolution 54:798–814.
Kim, H.J., and B.A. Triplett. 2001. Cotton fiber growth in planta and in vitro: Models for plant cell elongation and cell wall biogenesis. Plant Physiol. 127:1361-1366.
Knight, R.L. 1950. Abstract bibliography of cotton breeding and genetics 1900-1950. Cambradge, p1-256.
Kohel, R.J., J.E. Endrizzi, and T.G. White. 1977. An evaluation of Gossypium barbadense L. chromosome 7 and 17 in the G. hirsutum L. genome. Crop Sci. 17:404-406.
Kohel, R.J., J. Yu, Y. Park, and R. Lazo. 2001. Molecular mapping and characterization of traits controlling fiber quality in cotton. Euphytica 121:163-172.
Lacape J. M., T.B. Nguyen, S. Thibivilliers, B. Bojinov, B. Courtois, R.G. Cantrell, B. Burr, and B. Hau. 2003. A combined RFLP-SSR-AFLP map of tetraploid cotton based on a Gossypium hirsutum x Gossypium barbadense backcross population. Genome 46:612-626.
Lacape, J.M., T.B. Nguyen, B. Courtois, J.L. Belot, M. Giband, J.P. Gourlot, G. Gawryziak, S. Roques, and B. Hau. 2005. QTL analysis of cotton fiber quality using multiple Gossypium hirsutum x Gossypium barbadense backcross generations. Crop Sci. 45:123-140.
Lacape, J.M., and T.B. Nguyen. 2005. Mapping quantitative trait loci associated with leaf and stem pubescence in cotton. J. Hered. 96: 441-444.
Lewis, H. 2001. A review of yield and fiber quality trends and components in American upland cotton. p. 1447-1453. In Proc. Beltwide Cotton Conf., Anaheim, CA. 9-13 Jan. 2001. Natl. Cotton Counc. Am., Memphis, TN.
Lin, Z., D. He, X. Zhang, Y. Nie, X. Guo, C. Feng, and J. McD. Stewart. 2005. Linkage map construction and mapping QTL for cotton fibre quality using SRAP, SSR and RAPD. Plant Breed. 124:180-187.
Liu, J.S., B.X. Yang, Z.Y. Gao, S.J. Yang, F. Zheng, Y. Yan, and Z.J. Ban. 2005. High fiber strength medium and long staple cottons developed by hybridization between Upland and Sea-island cotton. China Cottons 32:12-14.
Lu, H.J., and G.O. Myers. 2002. Genetic relationships and discrimination of ten influential Upland cotton varieties using RAPD markers. Theor. Appl. Genet. 105:325-331.
Lu, Y.Z, J.F. Zhang, R.G. Percy, and R.G. Cantrell. 2004. An integrated SSR-STS-AFLP-SRAP genetic map using recombinant inbred line populations in tetraploid cottons. p1156-1161. In Proc. Beltwide Cotton Conf., San Antonio, TX. Jan. 5-9 2004. Natl. Cotton Counc. Am., Memphis, TN.
Ma, F.Z., and J.S. Liu. 1982. Genetic advances in economic traits of interspecific progenies between Gossypium hirsutum and G. barbadense. J. China Agric. Univ. 8:23-32.
Ma, J.Z., and R.J. Kohel. 1983. Evaluation of 6 substitution lines in cotton. Acta Agronomica Sinica 9:145-150.
Mahill, J.F. 1983. Registration of eight germplasm lines of cotton (Reg. Nos. GP 210 to GP 217). Crop Sci. 23:653-660.
Marani, A. 1963. Heterosis and combining ability for yield and components of yield in a diallel crosses of two species of cotton. Crop Sci. 3:552-555.
Marani, A. 1964. Heterosis and combining ability for plant height and developmental data ina diallel cross of two species of cotton. Crop Sci. 4:265-268.
Marani, A. 1967. Heterosis and combining ability in intraspecific and interspecific crosses of cotton. Crop Sci. 7:519-522.
Marani, A. 1968a. Heterosis and inheritance of quantitative characters in interspecific crosses of cotton. Crop Sci. 8:299-303.
Marani, A. 1968b. Inheritance of lint quality of characteristics in interspecific crosses of cotton. Crop Sci. 8:653-660.
Marani, A., and E. Avieli. 1973. Heterosis during early phases of growth in intraspecific and interspecific crosses of cotton. Crop Sci. 13:15-18.
May, O.L. 1999. Genetic variation in fiber quality. Chapter 9. In Cotton Fibers (A.M. Basra, ed.). Hawthorne Press, New York. pp. 183-230.
May, O.L., D.T. Bowman, and D.S. Calhoun. 1995. Genetic diversity of U.S. Upland cotton cultivars released between 1980 and 1990. Crop Sci. 35:1570–1574
May, O.L. 2001. Registration of PD 94045 germplasm line of Upland cotton. Crop Sci. 41:279-280.
McCarty, J.C., J.X. Wu, S. Saha, J.N. Jenkins, and R. Hayes. 2006. Effects of chromosome 5sh from Gossypium barbadense L. on flower production in G. hirsutum L. Euphytica 152:99-107.
Mei, M., N.H. Syed, W. Gao, P.M. Thaxton, C.W. Smith, D.M Stelly, and Z.J. Chen. 2004. Genetic mapping and QTL analysis of fiber-related traits in cotton (Gossypium). Theor. Appl. Genet. 108:280-291.
Meredith, W.R., Jr. 1984. Quantitative genetics. In Kohel, R. J. & Lewis, C. F. (eds.) Cotton. Am. Society of Agronomy, pp. 131-150.
Meredith, W.R. Jr. 2000. Cotton yield progress- why has it reached a plateau. Better Crops 84:6-9.
Multani, D.S., and B.R. Lyon. 1995. Genetic fingerprinting of Australian cotton cultivars with RAPD markers. Genome 38:1005-1010.
Nguyen, T.B., M. Giband, P. Brottier, A.M. Risterucci, and J.M. Lacape. 2004. Wide coverage of the tetraploid cotton genome using newly developed microsatellite markers. Theor. Appl. Genet. 109:167-175.
Pang, M.X., R.G. Percy, M. Ulloa, R.G. Cantrell, and J.F. Zhang. 2007. Identification and analysis of candidate genes for fiber traits. p.1622. In Proc. Beltwide Cotton Conf., New Orleans, LA. Jan. 9-12, 2007. Natl. Cotton Counc. Am., Memphis, TN.
Park, Y.H., M.S. Alabady, M. Ulloa, B. Sickler, T.A. Wilkins, J. Yu, D.M. Stelly, R.J. Kohel, O.M. El-Shihy, and R.G. Cantrell. 2005. Genetic mapping of new cotton fiber loci using EST-derived microsatellites in an interspecific recombinant inbred line cotton population. Mol. Genet. Genomics 274:428-441.
Paterson, A.H., Y. Saranga, M. Menz, C. Jiang, and R.J. Wright. 2003. QTL analysis of genotype x environment interactions affecting cotton fiber quality. Theor. Appl. Genet. 106:384-396.
Percy, R.G., and E.L. Turcotte. 1988. Development of short and coarse-fibered American Pima cotton for use as parents of interspecific hybrids. Crop Sci. 28:913-916.
Percy, R.G., and R.J. Kohel. 1999. Qualitative genetics. p.319-360. In Smith C.W. and J.T. Cothren, Cotton: Origin, history, technology and production. John Wiley & Sons, Inc. New York.
Percy, R.G., J.F Zhang, and R.G. Cantrell. 2006. Genetic variation for agronomic and fiber properties in an introgressed recombinant inbred population of cotton. Crop Sci. 46: 1311-1317.
Rahman, M., D. Hussain, and Y. Zafar. 2002. Estimation of genetic divergence among elite cotton cultivars–genotypes by DNA fingerprinting technology. Crop Sci. 42:2137-2144.
Reinisch, A.J., J.M. Dong, C.L. Brubaker, D.M. Stelly, J.F. Wendel, and A.H. Paterson 1994. A detailed RFLP map of cotton, Gossypium hirsutum x Gossypium barbadense: chromosome organization and evolution in a disomic polyploid genome. Genet. 138:829-847.
Rong, J., C. Abbey, J.E. Bowers, C.L. Brubaker, C. Chang,, P.W. Chee, T.A. Delmonte, X. Ding, J.J. Garza, B.S. Marler, C.H. Park, G.J. Pierce, K.M. Rainey, V.K. Rastogi, S.R. Schultze, N.L. Trolinder, J.F. Wendel, T.A. Wilkins, D. Williams-Coplin, R.A. Wing, R.J. Wright, X. Zhao, L. Zhu, and A.H. Paterson. 2004. A 3347- locus genetic recombination map of sequence-tagged sites reveals features of genome organization, transmission and evolution of cotton (Gossypium). Genet. 161:389-417.
Rong, J.K. G.J. Pierce, V.N. Waghmare, C.J. Rogers, A. Desai, P.W. Chee, O.L. May, J.R. Gannaway, J.F. Wendel, T.A. Wilkins, and A.H. Paterson. 2006. Genetic mapping and comparative analysis of seven mutants related to seed fiber development in cotton. Theor. Appl. Genet. 111:1137-1146.

Rong, J., F.A. Feltus, V.N. Waghmare, G.J. Pierce, P.W. Chee, X. Draye, Y. Saranga, R.J. Wright, T.A. Wilkins, O.L. May, C.W. Smith, J.R. Gannaway, J.F. Wendel, and A.H. Paterson. 2007. Meta-analysis of polyploid cotton QTLs shows unequal contributions of subgenomes to a complex network of genes and gene clusters implicated in lint fiber development. Genet. Jun 11; [Epub ahead of print]
Saha, S., J.N. Jenkins, J. Wu, J.C. McCarty, Jr., O.A. Gutierrez, D.M. Stelly, R.G. Percy, and D.A. Raska. 2004. Effects of chromosome substitutions from Gossyoium barbadense L. 3-79 into G. hirsutum L. TM-1 on agronomic and fiber traits. J. Cotton Sci. 8:162-169.
Saha, S., J.N. Jenkins, J. Wu, J.C. McCarty, Jr., O.A. Gutierrez, R.G. Percy, R.G. Cantrell, and D.M. Stelly. 2006. Effects of chromosome specific introgression in Upland cotton on fiber and agronomic traits. Genet. 172:1927-1938.
Saranga, Y., N. Sass, Y. Tal, and R. Yucha. 1998. Drought conditions induce mote formation in interspecific cotton hybrids. Field Crops Res. 55:225-234.
Saranga, Y., Menz M., Jiang C., Wright R.J., Yakir D., and A.H. Paterson. 2001. Genetic dissection of genotype x environment interactions conferring adaptation of cotton to arid conditions. Genome Res. 11:1988-1995.
Saranga, Y., C.X. Jiang, R.J. Wright, D. Yakir, and A.H. Paterson. 2004. Genetic dissection of cotton physiological responses to arid conditions and their inter-relationships with productivity. Plant, Cell & Environ. 27:263-277.
Smith, C.W., and J.T. Cothren, eds. 1999. Cotton: origin, history, technology, and production, New York: John Wiley & Sons, Inc.
Song, X., K. Wang, W. Guo, J. Zhang, and T.Z. Zhang. 2005. Comparison of genetic maps constructed from haploid and BC1 mapping populations from the same crossing between Gossypium hirsutum L. and Gossypium barbadense L. Genome 48:378-390.
Stelly, D.M., S.A. Saha, D.A. Raska, J.N. Jenkins, J.C. McCarty, Jr., and O.A. Gutierrez. 2005. Registration of 17 germplasm lines of upland cotton (Gossypium hirsutum) cotton, each with a different pair of G. barbadense chromosomes or chromosome arms substituted for the respective G. hirsutum chromosome or chromosome arms. Crop Sci. 45:2663-2665.
Tatineni, V., R.G. Cantrell, and D.D. Davis. 1996. Genetic diversity in elite cotton germplasm determined by morphological characteristics and RAPDs. Crop Sci. 36:186-192.
Van Esbroeck, G.A., D.T. Bowman, D.S. Calhoun, and O.L. May. 1998. Changes in the genetic diversity of cotton in the USA from 1970 to 1995. Crop Sci. 38:22-27.
Weaver, J.B., A.M. El-Marakby, and A.M. Esmail. 1984. Yield, fiber, and spinning performance of interspecific cotton hybrids having a common parent. Crop Sci. 24:637-640.
Wendel, J.F., C.F. Brubaker, and A.E. Percival. 1992. Genetic diversity in Gossypium hirsutum and the origin of Upland cotton. Am. J. Bot. 79:1291-1310.

Wilhelm, S., J.E. Sagen, and H.Tietz. 1985. Phenotype modification in cotton for control of verticillium wilt through dense plant population culture. Plant Dis. 69-283-288.
Wilkins, T.A., and J.A. Jernstedt. 1999. Molecular genetics of developing cotton fibers. Chapter 9. p. 231-267. In Cotton Fibers (A.M. Basra, ed.). Hawthorne Press, New York..
Wilkins, T.A., and A.B. Arpat. 2005. The cotton fiber transcriptome. Physiologia Plantarum 124:295-300.
Wright, R.J., P.M. Thaxton, K.M. El-Zik, and A.H. Paterson. 1998. D-subgenome bias of Xcm resistance genes in tetraploid Gossypium (cotton) suggests that polyploid formation has created novel avenues for evolution. Genet. 149:1987-1996.
Wright, R. J., P.M. Thaxton, K.M. El-Zik, and A.H. Paterson. 1999. Molecular mapping of genes affecting pubescence of cotton. J. Hered. 90:215-219.
Yu, J.W. 2006. Genetic diversity evaluation of shorted-season upland cotton cultivars and localization of QTLs for important agricultural and economic traits. Agronomy D. Dissertation, Huazhong Agric. Univ., Wuhan, China
Yu, J.W., S.X. Yu, C. Liu, W. Wu, S.L. Fan, M.Z. Song, Z.X. Lin, X.L. Zhang, and J.F. Zhang. 2007. High-density linkage map of cultivated allotetraploid cotton based on SSR, TRAP, SRAP and AFLP markers. J. Integrated Plant Biol. 49:716-724.
Yuan, Y.L., Y.H. Chen, C.M. Tang, S.R. Jing, S.L. Liu, J.J. Pan, R.J. Kohel, and T.Z. Zhang. 2000. Effects of the dominant glandless gene Gl2e on agronomic and fibre characters of Upland cotton. Plant Breed. 119:59–64.
Zamir, D. 2001. Improving plant breeding with exotic genetic libraries. Nat. Rev. Genet. 2:983–989.
Zhang, J., Guo W., and T. Zhang. 2002. Molecular linkage map of allotetraploid cotton (Gossypium hirsutum L. x Gossypium barbadense L.) with a haploid population. Theor. Appl. Genet. 105: 1166-1174.
Zhang, J.F., J.Z. Sun, J.L. Liu, and Z.B. Wu. 1992. Genetic analysis of cotton resistance to spider mites. J. Huazhong Agric. Univ. 11:127-133.
Zhang, J.F. 1993. Transferring and utilization of genes from Gossypium barbadense L. to G. hirsutum L. Agronomy D. Dissertation, Huazhong Agric. Univ., Wuhan, China
Zhang, J.F., J.Z. Sun, J.L. Liu, and Z.B. Wu. 1993. Identification of cotton varieties resistant to carmine spider mites and exploration of resistance mechanism. Acta Phytophylacica Sinica 20: 155-161.
Zhang, J.F., Z.P. Gong, J.Z. Sun, and J.L. Liu. 1994a. Heterosis of agronomic traits in interspecific hybrids between Gossypium hirsutum and G. barbadense. Acta Gossypii Sinica 6:140-145.
Zhang, J.F, C.X. Wang, J.Z. Sun, and J.L. Liu. 1994b. Genetic effects of economic traits in interspecific hybrids between Gossypium hirsutum and G. barbadense. Acta Gossypii Sinica 6:163-168.
Zhang, J.F, Z. Zhong, J.Z. Sun, and L.J. Liu. 1994c. Heterosis and combining ability in interspecific hybrids of Gossypium hirsutum x G. barbadense. J. Huazhong Agric. Univ. 13:9-14.
Zhang, J.F., Y. Lu, H. Adragna, and E. Hughs. 2005a. Genetic improvement of New Mexico Acala cotton germplasm and their genetic diversity. Crop Sci. 45:2363-2373.
Zhang, J.F., Y. Lu, R.G. Cantrell, and E. Hughs. 2005b. Molecular marker diversity and field performance in commercial cotton cultivars evaluated in the Southwest U.S. Crop Sci. 45:1483-1490.
Zhang, J.F., R.G. Percy, Y. Lu, M. Ulloa, G. Becelaere, P. Chee, and R.G. Cantrell. 2005c. A molecular linkage map and quantitative trait locus analysis based on a recombinant inbred line population of cotton. p 899. In Proc. Beltwide Cotton Conf., New Orleans, LA. Jan. 4-7, 2005. Natl. Cotton Counc. Am., Memphis, TN.
Zuo, K.J., J.Z. Sun, J.F. Zhang, Y.C. Nie, and J.L. Liu. 2000. Genetic diversity evaluation of some Chinese elite cotton varieties with RAPD markers. Acta Genetica Sinica 27:817-823.
See Tables 1 through 8 starting on the next page.
52
Back to Paper: Improving Upland Cotton by Introducing Desirable Genes from Pima Cotton
Table 1. Mapping populations made from G. hirsutum x G. barbadense crosses, published between 1994 and 2007.
Cross & population type Population size
Markers No. Linkage groups
Genome coverage
(cM)
Reference
Palmeri x K 101 F2 57 705 RFLP 41 4675 Reinisch et al. (1994)
Palmeri x K 101 F2 57 2459 RFLP, 124 SSR 26 4478 Rong et al. (2005)
TM-1 x Pima 3-79 F2 171 266 RFLP, 139 RAPD 50 4766 Kohel et al. (2001)
TM-1 x Pima 3-79 RIL 183 193 SSR 40 1277 Park et al. (2005)
TM-1 x Pima 3-79 RIL 183 433 SSR 46 2126 Frelichowski et al. (2006)
Acala 44 x Pima S-7 F2 94 333 AFLP, 47 SSR, 12 RFLP 42 3287 Mei et al. (2004)
TM-1 x Hai 7124 Haploid 52 489 SSR/RAPD 43 3314 Zhang et al. (2002)
TM-1 x Hai 7124 BC1F1 140 907 SSR/SRAP 28 5060 Han et al. (2004, 2006)
TM-1 x Hai 7124 BC1F1 140 440 SSR 34 4331 Song et al. (2005)
TM-1 x Hai 7124 BC1F1 138 1791 SSR/SRAP 26 3425 Guo et al. (2007)
Handan 208 x Pima 90 F2 69 5661 SSR/RAPD/SRAP 41 5142 Lin et al. (2005)
Handan 208 x Pima 90 F2 69 625 SSR, 58 RAPD, 341 SRAP, 5 REMAP 26 5472 He et al. (2007)
CRI 36 x Hai 7124 F2 186 697 SSR, 171 TRAP, 129 SRAP, 98 AFLP 35 4536 Yu et al. (2007)
Guazuncho 2 x VH8-4602 BC1F1
75 465 AFLP, 229 SSR, 192 RFLP 37 4400 Lacape et al. (2003)
Guazuncho 2 x VH8-4602 BC1F1
75 1160 loci 30 5519 Nguyen et al. (2004)
NM 24016 x Pima 3-79 F2 &RIL 176 & 40 149 SSR, 8 SRAP, 5 STS, 4 RAPD 28 NA Lu et al. (2004)
Average 117

Table 2. Population type, traits, QTL number and genome association reported in G. hirsutum x G. barbadense populations, 1998 to 2007.
Cross & population type Population size
Traits (no. traits) No. QTLs
No. QTL-
At
No. QTLs-
Dt
No. Associations*
Linkage map Authors
(TM-1 x Pima 3-79) F2 171 Fiber quality (3) 13 6 7 1215 405 loci, 50 LG, 4766c M Kohel et al. (2001)
(TM-1 x Pima 3-79) F2/RIL 183 Fiber quality (5) 8 6 3 965 193 loci, 40 LG, 1277 cM Park et al. (2005)
(TM-1 x Pima 3-79) F2/RIL 183 Fiber quality (5) 25 11 14 2165 433 loci, 46 LG, 2126 cM Frelichowski et al. (2006)
(Handan 208 x Pima 90) F2.3 69 Yield and fiber quality (8)
52 30 22 8232 1029 loci, 26 LG, 5472 cM He et al. (2007)
(CRI 36 x Hai 7124) F2/F2.3 186 Yield and fiber quality (16)
79 33 46 17520 1095 loci, 35 LG, 4536 cM Yu et al. (2006)
(Guazuncho 2 x VH8-4602) BC1,
BC2, BC2S1
75/200 Fiber quality (11) 80 34 46 12771 1161 loci, 5519 cM Lacape et al. (2005)
(Guazuncho 2 x VH8-4602) BC1,
BC2, BC2S1
75/200 Pubescence (4) 9 6 3 12771 1161 loci, 5519 cM Lacape and Nguyen (2005)
(Acala 44 x Pima S-7) F2 94 Fiber related traits (11) 7 5 1 4312 392 loci, 42 LG, 3287 cM Mei et al. (2004)
(Acala 44 x Pima S-7) F2 110 Verticillium wilt resistance (5)
11 9 2 105 35 loci, 11 LG, 531 cM Bolek et al. (2005)
(CAMD-E x Sea Island Seaberry) F2 271 Yield and fiber quality (14)
18 4 11 3654 261 loci, 27 LG, 3767 cM Jiang et al. (1998)
(DPL 61 x Sea Island Seaberry) F2 180 leaf morphology (14) 21 7 14 3654 234 loci, 29 LG, 3942 cM Jiang et al. (2000)
(Empire B2b6, B2, B3, S295 x Pima S-7) F2
119-150 Bacterial blight resistance (1)
7 1 5 648/1012 162-253 loci, 45-49 LG, 922-2101 cM
Wright et al. (1998)
(Empire B2b6, B2, B3, S295 x Pima S-7) F2
119-150 Pubescence (4) 8 5 3 648/1012 162-253 loci, 45-49 LG, 922-2101 cM
Wright et al. (1999)
(Siv'on x F-177) F2/F2.3 406/208 Fiber quality (6) 79 34 45 1566 261 loci, 26 LG, 3664 cM Paterson et al. (2003)
(Siv'on x F-177) F2/F2.3 406/208 Yield & drought response (16)
79 36 42 4048 253 loci, 26 LG, 3664 cM Saranga et al. (2001)
(Tamcot 2111 x Pima S-6) 24 BC3F2 families
33-191 Fiber length (15) 45 22 22 1905 262 loci, 26 cM, 3901 cM Chee et al. (2005a)
(Tamcot 2111 x Pima S-6) 24 BC3F2 families
33-191 Fiber elongation (1) 22 10 12 1905 262 loci, 26 cM, 3901 cM Chee et al. (2005b)
(Tamcot 2111 x Pima S-6) 24 BC3F2 families
33-191 Fiber fineness (2) 41 12 28 1905 262 loci, 26 cM, 3901 cM Draye et al., (2005)
(Fb x Pima S-7) F2 140 Yield components (5) 1 1 0 NA NA Rong et al. (2005)
(N1 x Pima S-7) F2 143 Yield components (5) 1 1 0 NA NA Rong et al. (2005)
(im x Pima S-7) F2 124 Yield and fiber quality (8)
17 10 7 2904 363 loci, 37 LG, 3371 cM Rong et al. (2007)
(im x Pima S-7) F2 124 Flower morphology (?) 36 16 20 NA 364 loci, 39 LG, 3457 cM Rong et al. (2007)
(n2 x Pima S-7) F2 124 Yield and fiber quality (8)
22 11 11 2968 370 loci, 41 LG, 3116 cM Rong et al. (2007)
Combined
681 310 364
*Number of correlation coefficients between markers and traits.

Table 3. Chromosome distribution of QTLs detected for fiber strength
in seven investigations between 1998 and 2007
Chromosome Jiang et al.
(1998)
Paterson et al.
(2003)
Mei et al.
(2004)
Lacape et al.
(2005)
Frelichowski et al.
(2005)
Yu (2006)
He
et al. (2007)
Sum
A1
2
2
A2
0
A3
1 1
2
A4
1
1
2
A5
2
2
A6
0
A7
1
1
A8 (LGA02)
1
2 3
A9
1
1
A10
0
A11 (LGA03)
1
1
2
A12
0
A13 (LGA01)
1
1
2
D1 (chr 15)
2
2
D2 (chr 14)
1
1
2
D3 (chr 17)
1
1
D4 (chr 22) 1 2
3
D5 (chr 19/LGD08)
2
2
D6 (chr 25) 1 1
1
3
D7 (chr 16)
1
1
D8 (chr 24/LGD03)
2
2
D9 ((chr 23)
1
2
1 4
D10 (chr 20) 1 1
2
D11 (chr 21/LGD02)
1 1
1
3
D12 (chr 26)
0
D13 (chr 18)
2
2 2
6
Comined
48

Table 4. Chromosome distribution of QTLs detected for fiber elongation
in seven investigations between 1998 and 2006.
Chromosome Jiang et al.
(1998)
Paterson et al.
(2003)
Mei et al.
(2004)
Lacape et al.
(2005)
Frelichowski et al.
(2005)
Chee et al.
(2005)
Yu et al.
(2006)
Sum
A1
2 1 3
A2
1
1
A3
1
1
A4
0
A5
1
1
2
A6
2
2
A7
0
A8 (LGA02) 1 1
2
A9
1 1
2
A10
1
1
2
A11 (LGA03)
1
2
3
A12
1
1
A13 (LGA01)
1
1
D1 (chr 15)
1
1 1
1 4
D2 (chr 14)
1 1
D3 (chr 17)
1
1
2
D4 (chr 22) 1
1
1
3
D5 (chr 19/LGD08)
1
4
5
D6 (chr 25) 1
1
D7 (chr 16)
0
D8 (chr 24/LGD03)
1
1
D9 ((chr 23)
2
1
1 1 5
D10 (chr 20) 1
2
1
4
D11 (chr 21/LGD02)
1
2
3
D12 (chr 26)
1
1
D13 (chr 18)
2
2 1 1 6
Combined
56

Table 5. Chromosome distribution of QTLs detected for fiber length
in eight investigations between 1998 and 2007.
Chromosome Jiang et al.
(1998)
Paterson et al.
(2003)
Mei et al.
(2004)
Lacape et al.
(2005)
Frelichowski et al.
(2005)
Chee et al.
(2005)
Yu et al.
(2006)
He et al.
(2007)
Sum
A1
2 2 1 5
A2
1 1 1
3
A3
2
1
3
A4
1
1
2
A5
1
1
2
A6
1
1 1 1 4
A7
1
1
A8 (LGA02)
1
1
1 3
A9
1
1
1 3
A10
1
1
A11 (LGA03)
1
1
2
A12
1
1 1
3
A13 (LGA01)
1
1
2
D1 (chr 15)
1
1
D2 (chr 14)
1
1 2
D3 (chr 17)
1
1
D4 (chr 22)
0
D5 (chr 19/LGD08)
2
2
D6 (chr 25)
2
2
D7 (chr 16)
1
1
D8 (chr 24/LGD03)
1
1
2
D9 ((chr 23)
1
1
2
D10 (chr 20)
1
1
2
4
D11 (chr 21/LGD02)
1
1
2
D12 (chr 26)
2
2
D13 (chr 18)
1 3
1
5
Combined
60
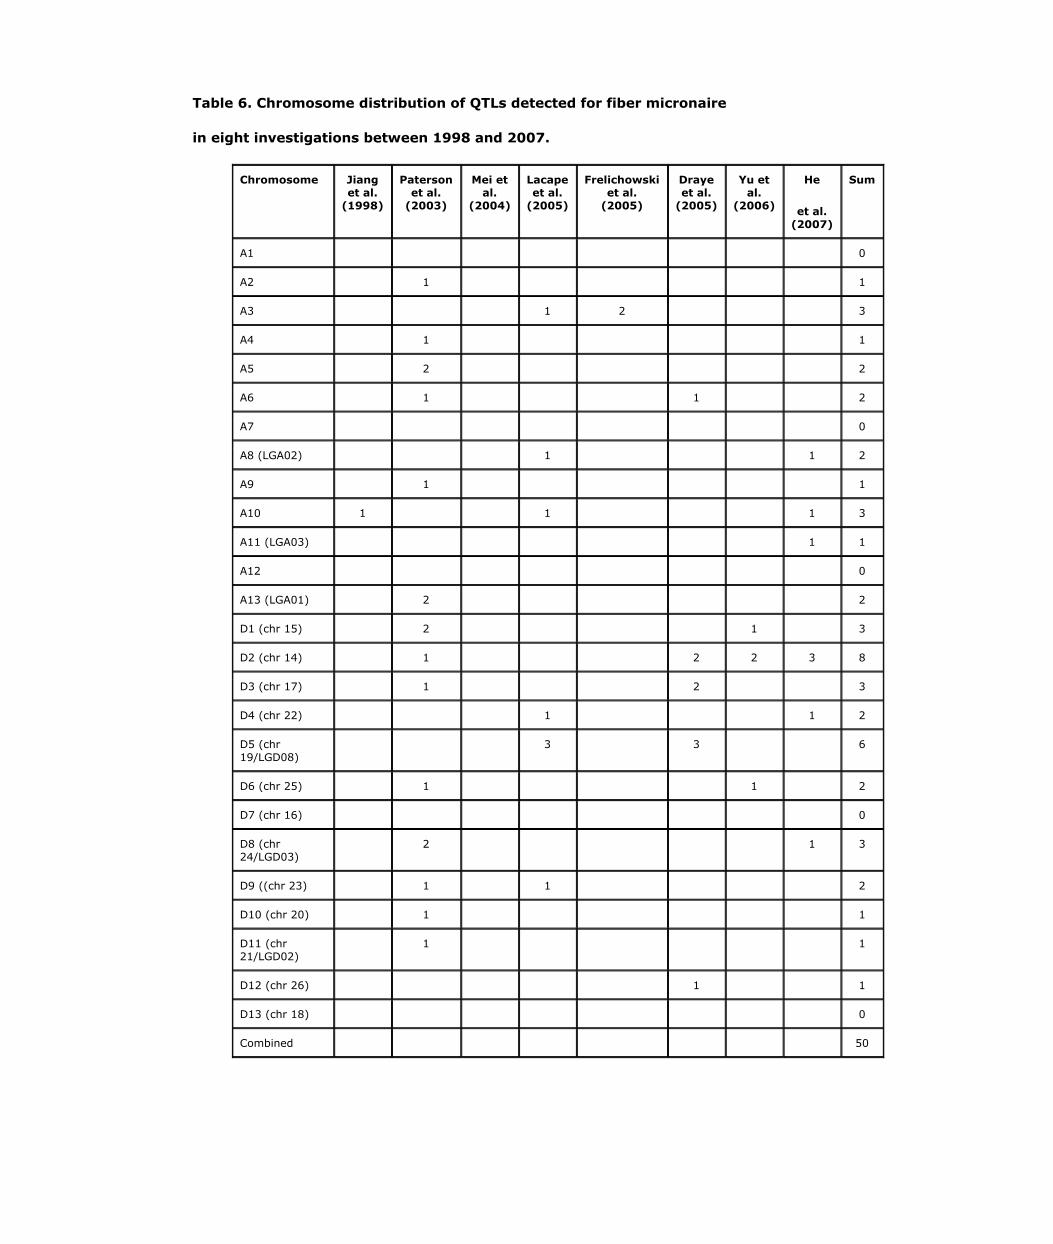
Table 6. Chromosome distribution of QTLs detected for fiber micronaire
in eight investigations between 1998 and 2007.
Chromosome Jiang et al.
(1998)
Paterson et al.
(2003)
Mei et al.
(2004)
Lacape et al.
(2005)
Frelichowski et al.
(2005)
Draye et al.
(2005)
Yu et al.
(2006)
He
et al. (2007)
Sum
A1
0
A2
1
1
A3
1 2
3
A4
1
1
A5
2
2
A6
1
1
2
A7
0
A8 (LGA02)
1
1 2
A9
1
1
A10 1
1
1 3
A11 (LGA03)
1 1
A12
0
A13 (LGA01)
2
2
D1 (chr 15)
2
1
3
D2 (chr 14)
1
2 2 3 8
D3 (chr 17)
1
2
3
D4 (chr 22)
1
1 2
D5 (chr 19/LGD08)
3
3
6
D6 (chr 25)
1
1
2
D7 (chr 16)
0
D8 (chr 24/LGD03)
2
1 3
D9 ((chr 23)
1
1
2
D10 (chr 20)
1
1
D11 (chr 21/LGD02)
1
1
D12 (chr 26)
1
1
D13 (chr 18)
0
Combined
50
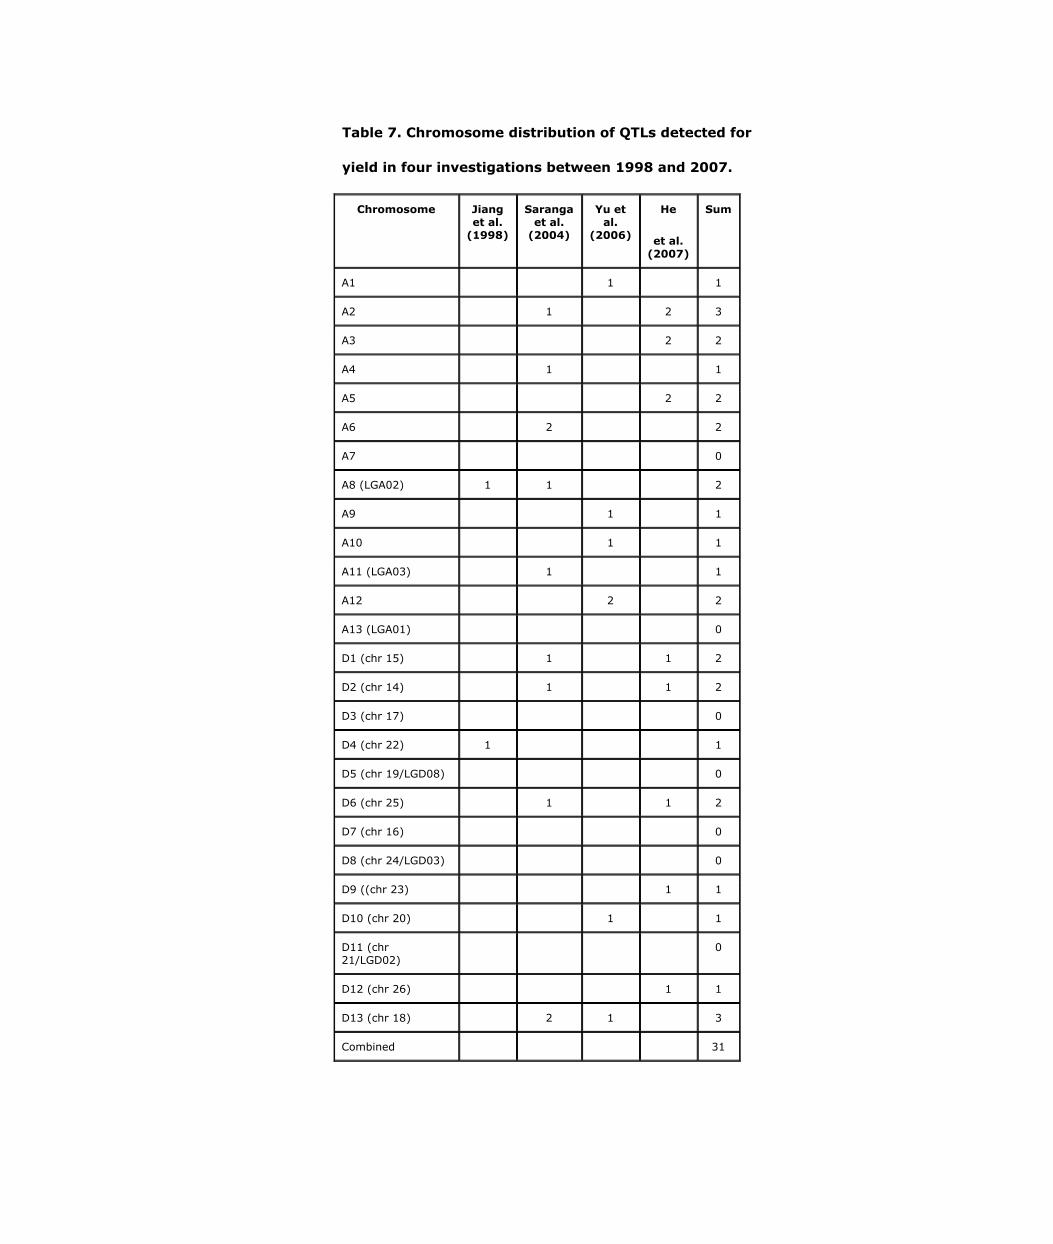
Table 7. Chromosome distribution of QTLs detected for
yield in four investigations between 1998 and 2007.
Chromosome Jiang et al.
(1998)
Saranga et al.
(2004)
Yu et al.
(2006)
He
et al. (2007)
Sum
A1
1
1
A2
1
2 3
A3
2 2
A4
1
1
A5
2 2
A6
2
2
A7
0
A8 (LGA02) 1 1
2
A9
1
1
A10
1
1
A11 (LGA03)
1
1
A12
2
2
A13 (LGA01)
0
D1 (chr 15)
1
1 2
D2 (chr 14)
1
1 2
D3 (chr 17)
0
D4 (chr 22) 1
1
D5 (chr 19/LGD08)
0
D6 (chr 25)
1
1 2
D7 (chr 16)
0
D8 (chr 24/LGD03)
0
D9 ((chr 23)
1 1
D10 (chr 20)
1
1
D11 (chr 21/LGD02)
0
D12 (chr 26)
1 1
D13 (chr 18)
2 1
3
Combined
31

Table 8. Segregation distortions (number of SD markers) reported
in six mapping projects.
Chromosome Reinisch et al.
(1998)
Lacape et al.
(2005)
Lu et al.
(2004)
Yu et al.
(2007)
He et al.
(2007)
Guo et al.
(2007)
Sum
A1
3 7
10
A2
13
13
A3
1 1 4
6
A4 1
7
8
A5
1 9
10
A6
7 1 8
16
A7
11 8 17 36
A8 (LGA02) 2
1 23 14
40
A9
1 7
8
A10 2
20 6
28
A11 (LGA03) 2
5 0 11
18
A12
21
3
24
A13 (LGA01) 2
1 7 7
17
D1 (chr 15)
6 1 6 6
19
D2 (chr 14) 2
7 7
16
D3 (chr 17)
15
10 9
34
D4 (chr 22) 3
1 6
10
D5 (chr 19/LGD08)
4 1 17
22
D6 (chr 25)
3 21
24
D7 (chr 16)
16 9 16 41
D8 (chr 24/LGD03)
3 8
11
D9 ((chr 23)
2 10
12
D10 (chr 20) 3 13
6 5
27
D11 (chr 21/LGD02)
1 4
5
D12 (chr 26)
2 7
9
D13 (chr 18)
12
12
Combined
476