196 best available copy - defense technical information center · marh 196 best available copy ......
TRANSCRIPT
AYOP
HYDRAULIC-PNEUMATIC FLOATING
R 430 FENDER - ADDITIONAL IN-SERVICE
S~ TESTS, FIRST SERIES
Marh 196 Best Available Copy
Distebutoorn of this docmtenft is wnh1moed.
U. S. NAVAL CIVIL ENGINEERING LABORATORYPORT HUENEME, CALIFORNIA

HYDRAULIC-PNEUMATIC FLOATING FENDER - ADDITIONAL IN-SERVICETESTS, FIRST SERIES
Technical Report R-430
Y-F015-10-03-303
by
T. T. Lee
ABSTRACT
Tests of two experimental hydraulic-pneumatic floating fenders, first ina well-protected harbor (Port Hueneme) and then in a relatively exposed harbor(San Diego), are described. Each fender consists of a 50-foot-long bulkhead frontedby two air-filled and two water-filled rubber bags. Also included is information toaid engineers in increasing the energy-absorption capacity of existing dock fendersystems.
After 19 months of in-service tests of t1he floating fender it was concludedthat (1) the energy-absorption capacity of the fender is adequate for a well-protected harbor such as that at Port Hueneme; (2) a fender system serving shipsunder navigation conditions and in a marine environment similar to those at PortHueneme, requires a minimum energy-absorption capacity of 16 and a maximum of50 inch-tons per 1,000 tons of ship displacement; and (3) resistance to ship motion,including the hydrodynamic mass effect, is an important parameter which requiresfurther investigation. It is recommended that (1) full-scale tests of berthing impactbe continued, particularly at exposed harbors, to determine energy requirements Forother fender designs and (2) model tests of berthing impact be initiated, particularlyof the resistance to motion, for use in evaluating hydrodynamic mass. Althoughmeasurements were not made at San Diego, it is; concluded that the fenders providedsatisfactory service but were not loaded to capacity.
Distribution of this document is unlimited.
Copies available at the Clearinghouse (CFSTI) $3.00The Laboratory invites comment on this report, particularly on the
results obtained by those who have applied the information.

CONTENTSpage
~~~BACKGROUND . .. .. .. .. .. .. .. .. .. .. .. .. .. .. . .. 1
PART I. TESTS AT PORT HUENEME HARBOR
* INTRODUCTION . . . . . . . . . . . . . . . . . . . . .*. . . . . . . . . . 2
EQUIPMENT AND PROCEDURE... ......... ..... ...... 2i
"" TEST CONDITIONS. . . . . . . . . . . . . . . .. . . . . . . . . .. . . . 9
TESTS . . . . . . . . . . . . . . . .* . . . . . . .. . . . . . . . . . . .. . 9
Position of Berthing Impact ........... ........... 9Berthing Force Characteristics ............ ..... .... 9Loading to Ship-hull. . .*. . . . . . . . . .0 0 . . . . .0. . . .. .. 12Berthing Velocity Characteristics o . . . . . . o .. . . . . 0 . . . . 12Effects of Hydrodynamic Mass and Water Friction . . . o o ..o. . . .. 13
RESULTS . . . .. .o. .. .. .. oo.. .. .. o.. o... o. . . .. .. ... . 13
FINDINGS . . . . . . . ... . .. . .. o o .. . .9. . . o o o . . . 27
CONCLUSIONS. .. . .. o . .. .. .. .. o .9 . . . . . . . 28
RECOMMENDATIONS. . . . . .. . . .. . . . . . . . . . . . . . . . 28
PART II. TESTS AT SAN DIEGO HARBOR
INTRODUCTION . . . . . . . .. . ... . .. .. . .. .. . ... . 29
INSTALLATION . o. . . . . . . . . . . . . . o . o . . . .. . . . .. . .. 29
TEST CONDITIONS. . . . . . . . . . .. .. . a.* *. .* .. . 32
W inds . . . . . . . . ... . . . a . . . . 0 . 9 a ... . . . 32Wave . . . .. . o . . . . . . . o 0 0 0 * * 0 . .. . . . . . .0 * * 32Current .. . 0... .... . . . . .. . . . .. . .0 * o . .. 32Tide . . . .. . ... . .. . . .. . . . .a . . .a . . .* . 32Berthing and Mooring Ships. ...... .......... ...... . 32Arrangement of Fenders .................... ..... 34

9Q
page
TE.:TS.. ...... . .o o o e o o o sot... . ... .. .. ...... ... . 34
General .. . . . . . . . . . . . . . . . . . . . . . . . . . . . . . . 34Special Test Operation. .......... ........... .... 34
FINDiNG S . .. .. .. ... . ... 00 . ........... 0 0 0. .. 0... . 39
CONCLUSIONS . . . . . . . . . . . . . . . . . . . . . . . . . . . . . . . 45
ACKNOWLEDGMENTS. . . . . . . .. . .. . .. . . . . .. . . ... . 45
REFERENCES . . . . . . . . . . . . . . . . . . . . . . . . . . . . . . . .. 45
APPENDIXES
A - Measurements of Berthing Ships at Port Hueneme Harbor ..... 47B - Velocity Measurements of Berthing Ships at Port Hueneme
Harbor .. .. . . . . . . . . . . .* . .. . .. .. . . . . 66
iv
BACKGROUND
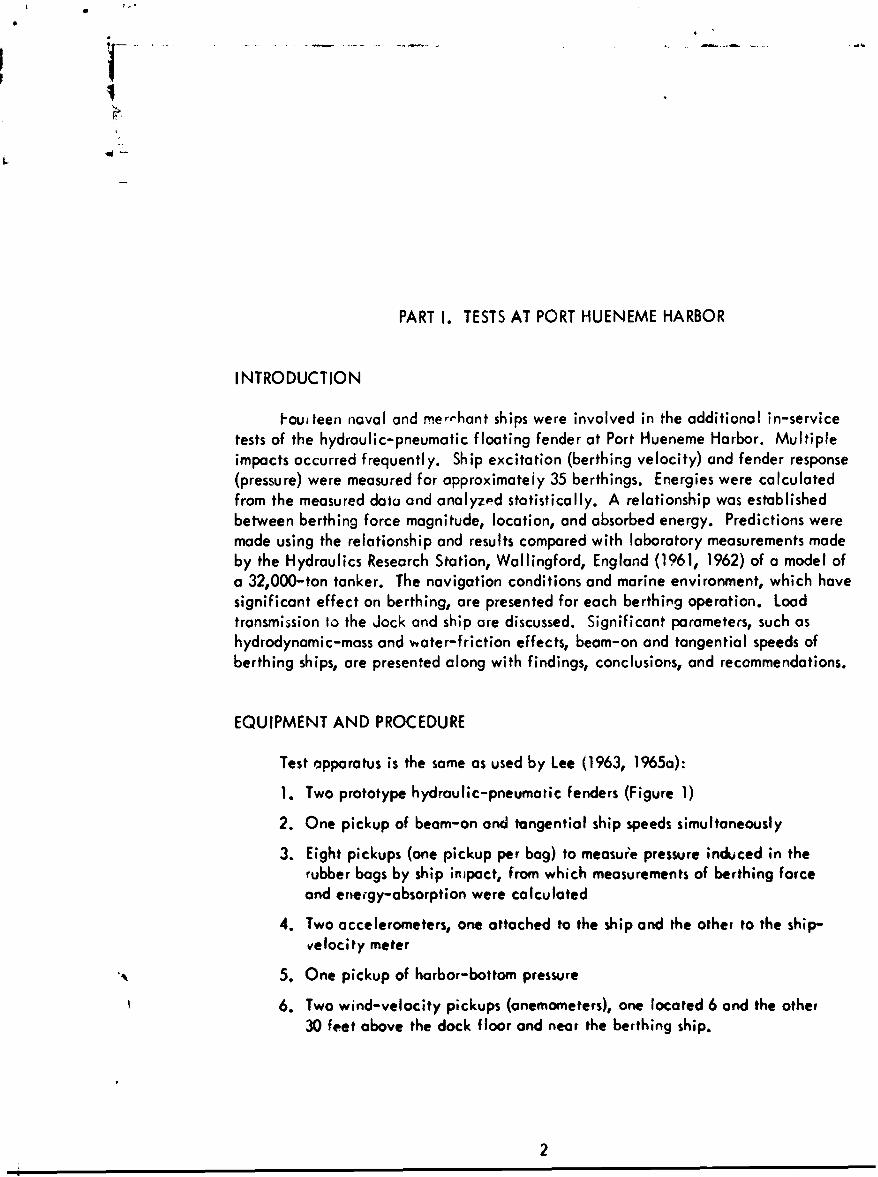
Lee (1963, 1965a) describes the initial in-service tests at the harbor of PortHueneme, California of the two hydraulic-pneumatic floating fenders (camels) treatedin this report. As designed by Bowman and Cave (1961) each fender consists of afloating bulkhead, two air-filled and two water-fMlled bags flon+ing in front of thebulkhead, chains with weights to maintain position, and a keel in the form of an18-inch-OD pipe filled with concrete ballast. The bulkhead is 50 feet long, 1 foot8 inches wide, and 11 feet 6 inches high. It has a steel framework, a creosoted-timber covering, and a core of polyurethane foam for buoyancy. The four rubber bagsare standard off-the-shelf items, each ,0 inches in OD by 60 inches long. They tendto absorb most of the impact energy of berthing and moored ships. The air-filled bag(Mountcastle, 1961) absorbs energy by air compression and the water-filled bag bywater displacement. Water is forced out of the bag through a screen connected by ahose to axial openings in each end of the bag. After compression the bag is restoredto its original shape by the spring action of water "hoses" inside the bag. Absorptiondepends on the magnitude and velocity of the mass of the incident ship.
The total energy-absorption capacity of the fenders is from 490 inch-tonsminimum to 2,300 inch-tons maximum. Measurements are based on (1) initialpneumatic-bag pressure of 12 psi per bag; (2) maximum working pressure of 50 psiper bag; (3) total allowable load of 42.5 tons over 15 square feet of the ship's hull;(4) only one pneumatic bag in action at minimum capacity and all four bags in actionat maximum capacity; (5) deflection of 70% and/or 28 inches. At 70% bag deflection,the minimum and maximum energy-absorption capacity would be 330 and 1,940 inch-tons respectively.
Lee (1963, 1965c) reported on approximately 30 berthings. Of these, three wereselected for reporting as representative of berthing alongside a deep-dock concretefascia wall protected by standard timber pile fenders. One ship was an oceanographicresearch vessel of 1,400 tons displacement, with bow propeller for maneuvering; twowere naval transports of 15,000 and 17,000 tons. Ship velocity during berthing wascorrelated with the pressure it induced in the fender bags, and deflection and energy-absorption characteristics were computed. Results from measurements comparedreasonably well with those predicted by theory (Risselado and van Lookeren Campagne,1964). Lee (1965a) concluded that the hydraulic -pneumatic flooting fender metBuDocks' requirement of reducing damage to piers, ship hulls, and pier fenders, par-ticularly in protected harbor!, but that first cost and maintenance were relativelyvery high. He recommended modifications and the continuation of in-service tests ina more exposed harbor with heavier traffic than Port Hueneme.
Part I of this report presents an analysis of measurements made in the initialin-service tests at Port Hueneme but not fully reported previously. Part II presentsadditional in-service test. made in San Diego Harbor.
aQ
PART I. TESTS AT PORT HUENEME HARBOR
INTRODUCTION
1oui teen naval and mer-hant ships were involved in the additional in-servicetests of the hydraulic-pneumatic floating fender at Port Hueneme Harbor. Multipleimpacts occurred frequently. Ship excitation (berthing velocity) and fender response(pressure) were measured for approximately 35 berthings. Energies were calculatedfrom the measured data and analyzed statistically. A relationship was establishedbetween berthing force magnitude, location, and absorbed energy. Predictions weremade using the relationship and results compared with laboratory measurements madeby the Hydraulics Research Station, Wallingford, England (1961, 1962) of a model ofa 32,000-ton tanker. The navigation conditions and marine environment, which havesignificant effect on berthing, are presented for each berthing operation. Loadtransmission to the Jock and ship are discussed. Significant parameters, such ashydrodynamic-mass and water-friction effects, beam-on and tangential speeds ofberthing ships, are presented along with findings, conclusions, and recommendations.
EQUIPMENT AND PROCEDURE
Test apparatus is the same as used by Lee (1963, 1965a):
1. Two prototype hydraulic-pneumatic fenders (Figure 1)
2. One pickup of beam-on and tangential ship speeds simultaneously
3. Eight pickups (one pickup per bag) to measuie pressure induced in therubber bags by ship inmpact, from which measurements of berthing forceand eneegy-absorption were calculated
4. Two accelerometers, one attached to the ship and the other to the ship-velocity meter
5. One pickup of harbor-bottom pressure
6. Two wind-velocity pickups (anemometers), one located 6 and the other30 feet above the dock floor and near the berthing ship.
2
Z41 stool ®guide pipe 40" x 60" pneumatic shi'p fender 4"x60" ship fender, as modified,inflated with asir 12 psig filled with water and packed with
(BuShips Dwg. No. 805.1363949) rubber hoses (Sae Detail A)
Plan
lifting and mooring eye Bcreosote-treated
we"-igh ts(eel Dietbailase B)waersren0135"vbe hoven , wire d atrsuto
with 0.265" square opening
Front ViewA
0 5 feetscale
position maintaining device. pacLed with 2" WatW hoses foradjusted with tides recovery of original undisturbed
movable mooring beat shope after the release of ship4' stel imipact 160d
guid sto palyurethone
I 4 lb, cw ftpneumatic hydrjIcQ I denit
Cutaway View of Deteil A
'0UV W"" ~ hydatulic shp fede)
3 4- A-litnks ' 34 -ik
concrete weigho Sott.on 8-S .(3.600 Ib) 0 2 feet
scalet Cutoway View, of Detail a
End View A-A 02* o
0 2 feat scalescale
Note. This figure was pwepared based on Y&D Dwg. Ne. 946116 ead 946117. es modified by MCIEL.
Figure 1. Hydraulic-pneumtatic energy-absorbing floating fender (CCw'i.).
V.
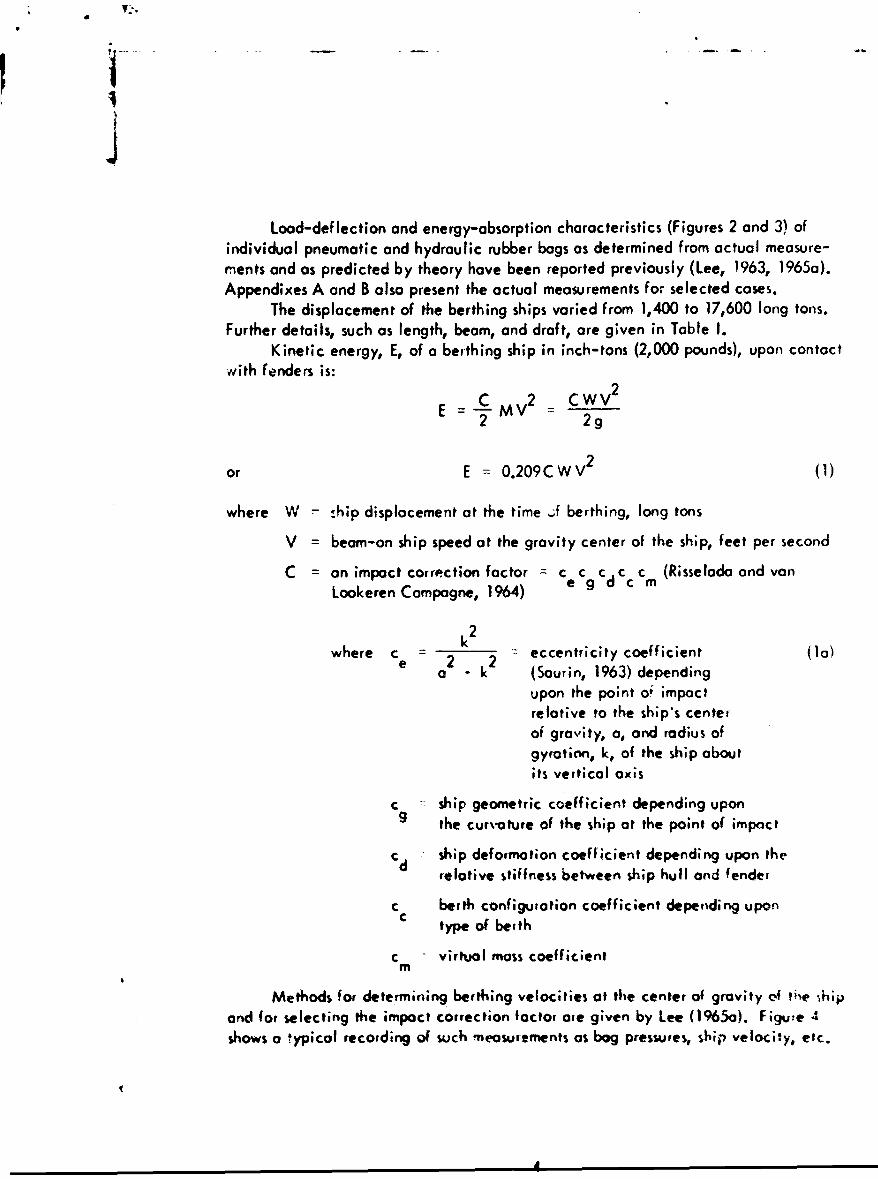
Load-deflection and energy-absorption characteristics (Figures 2 and 3) ofindividual pneumatic and hydraulic rubber bogs as determined from actual measure-
ments and as predicted by theory have been reported previously (Lee, 1963, 19 65a).Appendixes A and B also present the actual measurements for selected cases.
The displacement of the berthing ships varied from 1,400 to 17,600 long tons.Further details, such as length, beam, and draft, are given in Table I.
Kinetic energy, E, of a berthing ship in inch-tons (2,000 pounds), upon contactwith fenders is:
=C 2 CWV 2
2 V2
or E 0.209CWV2 (1)
where W - .hip displacement at the time ;f berthing, long tons
V : beam-on ship speed at the gravity center of the ship, feet per second
C = an impact correction factor : c c c c ccm (Risselada and vonLookeren Campagne, 1964) • g
where ce -2 2 eccentricity coefficient (0a)a k (Sourin, 1963) depending
upon the point oi impactrelative to the ship's centerof gravity, a, and radius ofgyration, k, of the ship aboutits vertical axis
c ship geometric coefficient depending uponthe curvature of the ship at the point of impact
cd ship deformation coefficient depending upon therelative stiffness between ship hull and fender
c berth configuration coefficient depetding upontype of berth
c virtual moss coefficientm
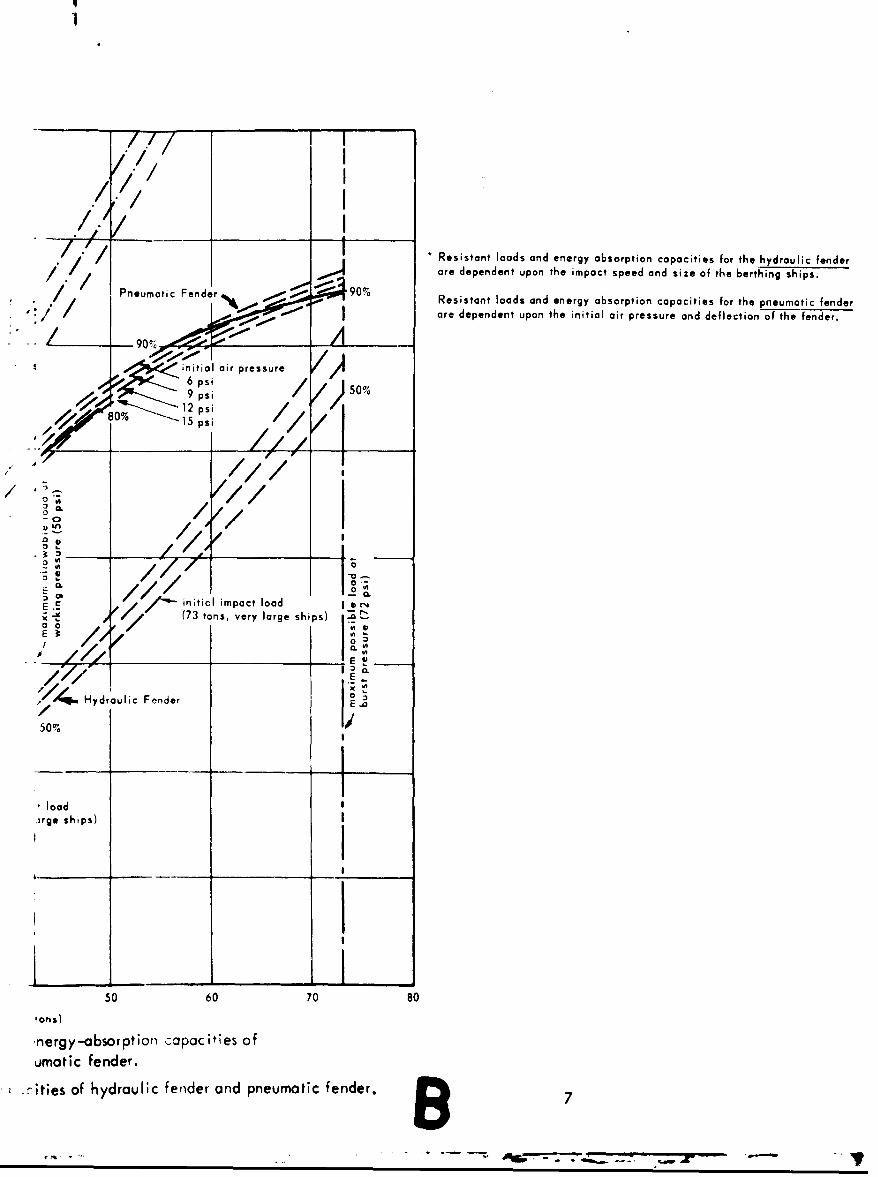
Methods for determining berthing velocities at the center of gravity C4f tie h6iPand for selecting the impact correction foctor are given by Lee (1965a). Figue 4
shows a typical recording of such measurements as bog pressures, ship velocity, etc.

.- ..... .. - 4. --
Table 1. Summary of Berthing Ships Characteristics, Navigetion Conditions, c
Sh* "44 l - , o f -L -
ulW G"*. 62. 1.
112 Dec-be %Jd
4m;'
023 Ap,; !96C"-
UýNSC-c4% 4. D- :6 ;40 4* 4.-
lvw
565 12.O'a i. ) 3 4' ~
I At . Q4 , 4. ,*.
4 ~~~ - *5.
2.00 IU .W&5 q 3.M5 5.24 *
too,' 4%0 t5.
213Moo 3.1 ?A'
I~I Al6'. 4
IV 4 .
44 IIN r. 4
C., 'J IS & ZI 3. IA

thing Ships Characteristics, Navigation Conditions, and Significant Measurements
7 - . . . . . . . .
i•n;. Ser. P ,o, ,r i t M.c, InpNct Mo. 6poc9 - Navioor% Cc.,f(por noodn
0.470 1 !.60 122.52 ,rive ,vodenaole P70 0.82, 11.3 !1.3
4 orir0.475 .d.50 1p.oc.0 3s, oFdsi do be,'An. i8g r, .Nnce 0.90 12.5 12.6
S0,477 -ý. 30 214.27 l. ki 0.95 13.V 13.36 0.4po :-.80 i69 9. go" ^30 1.24 17.2 1 1.3E'.e82 o.r0 d Iný.d5 D9c 1.17 16.3 i---
led 87L 843.0+ -tiil 25koWS,%- 4 nt- .4 .5.506-
.O',e: r•gtde, -4.2 itON[. o o- 4---o--"- 10"
Is. 0A 70 20.75 43 ind: 2 Kots 37 2, ' ' 0.5f, 8.1 3.60.75 .60 '2.52 wno.e 0.50 1.9 3.1
t,•e: -5.0 1!angle of Ol•,mch. !0*
44,'9 dlQ.80 6.83 not recoded 76 15 0 0.892 i32.6 1.£" -.7 17.60 1.!0 r b ig I.16 16.5 ;2.6
3 - :5.80 116.83 -P,.25 17.4 9.64 -- 1.'.20 89.20 610 16 16.! 7.3
19.2 7 0.16 8.7! 30.60 wind: 6 knot,, P ' t 6 35( 3.00 13.9 0 .0
G 6.0 4.5ý1 15.93 .,aecairlm 160 1.00 ;304.5.t0.5 ;.65 6.36 lid*.: .3.7 it 1 10 0.94 13.0• ?. 1
brtdside b4t.2;N
81.5 0.7-&5 6.30 50.46 wind: 3 6nOts, NNW 76 250 0.22 3.0 3.5
0.75 8.30 WOO ~~wave: no3" 05 5 .
tide- .5.0 itabnr oads r be cth- 1
9.7 U -. 19.36 75.72 83 ot recoded 73 780 1.38 19.2 17.6(.32 4.48 20.0 0 3.16 4.5 4.5
J .70 2 .950 116.8 0.20 2,7 3.04 0.14 4.65 37.10 C0 0.90 12.41 4.7
12.1 0.568 832.95 191.06 not 6ecorded -76 51, 35 1.39 13.3 50.9
2 -. 521 25.59 183.45 1,02, t. 5a 22.G 16.97..50 2,11 135.7e 880 1.33 18.5 12.3
16.0 0.a75 5.64 18.16 rid 4 .,,7s, NE 63 230 0.94 13.6 4.7
tode 3.5 it
•,=gle of o;'p,vach: I0
8.5 1 0.500 21.6.30 0.04 wind: 15 knots, W 7 1.100 1.43 1.9 13.3
wo%*• roughtide 43.5 htbroadside behing
13." .32 4.10 20.20 .nd, 5 roi, NE 62 550 1 .2 14.0 4.7
ov'col~n07de2 92.5 It
brooovi e bertihlng
6.0 -- .| 36.2 wir'd * knots, W 70 2iJ.1 15.A 7.224 43.90 33.6 col, 0.06 .4 4.7
-- 6.72 32'.2 t Ido -2.0 1 t (boeth, (j) 270 I.0W9 15.2 6.72.6 4 ileoong) -- 6 16 28.2 -3.6 it tllooing) 250 1 08 1506.2
anchor dropped to control uýP tperdL
32.3 I 6 32.74 48.4 not recorded 76 350 3.918 16.4 8.7
8.5 .5.d 25 nots, W 76 1,30 12.0 30.1
wove u couqhatoe .O30 itSbroads,,de berth,ng I
B5

Deflection (%;) DeflIect,'00 50 0 SC
!i ~ initial impact load
In initial air pressure
15 psias 16 psi
301 16 s
Iu i Hydrauli RubbrdFnde(sze (size:h 40-inc diar', 60-ncnlnghtpa)e
c with 2 -inch-diam rubber tubes)0
u-_ _ _ _ _ _ 4 _ _ 0__
400 a
E in~itial impact load (42.5 tons,500 ~ _________________________i.e., large ship)
00-E30 - .0 f? sec -
0 0.7 ft secE 0.4 ft sec
600 15pi20-
initial impact loadLOADX(25 tons, medium
size ship)1,0 ft sec0.7 ft/sec0.4 ft sec
initialsmallI 1.0 ft0.7 ft
800 0.4 ft
8000 3 Fgur Deflection (inch2 :) 8e 0 ~lection
Figue 2.Load-deflection and energy-absorption characteristics of hydraulic fender and p-
A

Deflection M%so 100)
- 0
I .? i
42.5 \7ton
25 ~ ~ ~ ~ ~ ~ ~ ~ ~ ~ ~~~. to I010 Mxmmpsiledfeto o yrui
.010 aiumpssbedeflection for hnumtdrandr uslicie
by the burst pressure and is dependentS upon the initial air pressure.
* Maximum, allowable deflection for both thehydraulic fender and the pneumatic fenderis limited by the diameter of the rteed endflange. Diameter of the flange is 12 incies.
Hydraulic Rubber Fendersize: 4O-inch diam, 60-inch length, pocke
with 2 -inch-diam rubber tubes)
initial impact load (42.5 tons,0i.e., large ship)
6 00
initial impact load(25 tons, medium
initial impact load (0i tons,j
I 16 24 32800
Deflection (inches)
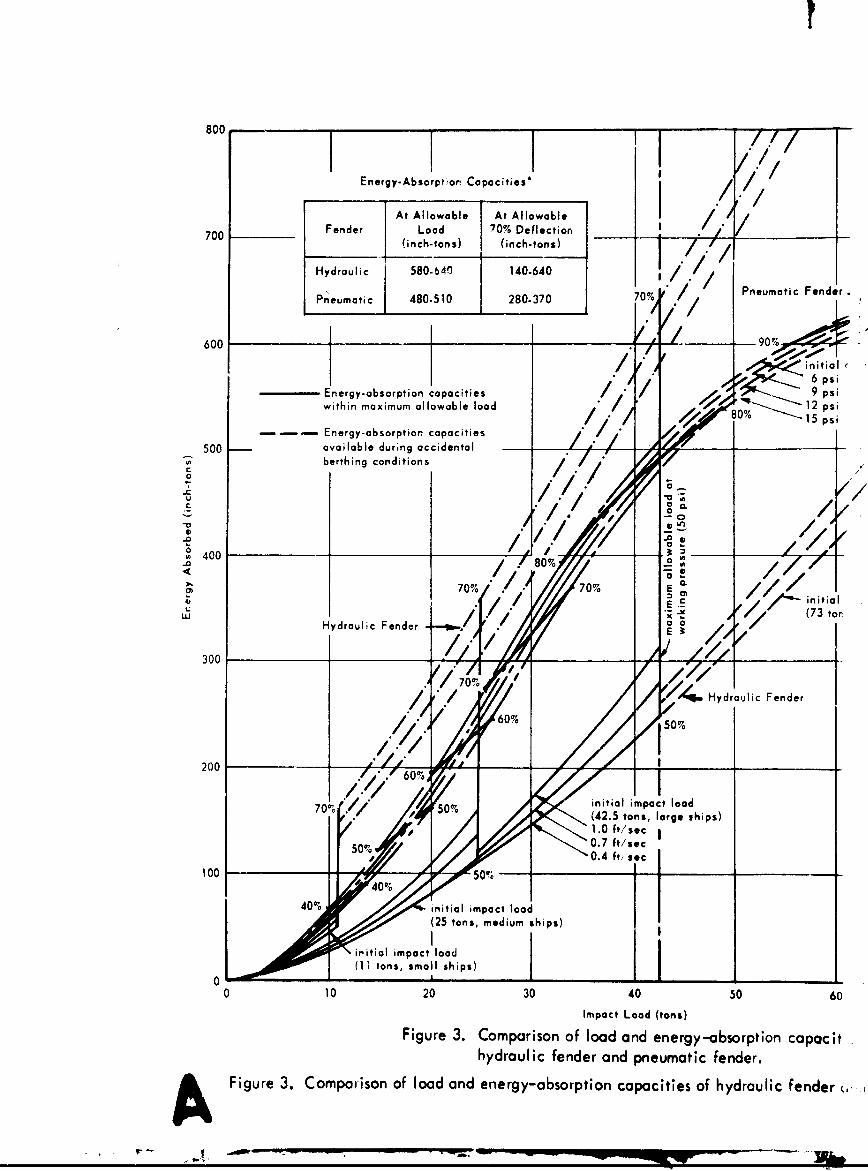
;oicteristics of hydraulic fender and pneumatic fender. B 6
800 1] 77/
Energy-A.borpior Capacities'
At Allowable At Allowable '700 Fender Load 70% Deflection I
7 (inch-tons) (inch-tons)
Hydraulic 580-640 140.640Pneumatic 480.510 280-370 70%Pneumatic FenderPnumti 70umtene
600Sinitial
E nergy-absorption capacities 9 psiwithin maximum allowable load 8 # 10% 12 psi
Energy-a bsorption capacities 15 8%i
500 available during accidental
berthing conditions- -
Oa
a 0
C -- / 0o
3400 00.I. -Q.
70% 70%
Hydraulic Fender Fend t60
300--
/'I44, Hydraulic Fender
60%%
200 60
70% 50% initial impact loadX0(42.5 tons, large ships)
50% 0 " 0.4 ft, sec
100 50%
S•40 initial m a tla
//(25 tons, medium ships)
I,iritial impact load(11 tons, small ships)
0 10 20 30 40 50 60Impact Load (tons)
Figure 3. Comparison of load and energy-absorption capacithydraulic fender and pneumatic fender.
A Figure 3. Comparison of load and energy-absorption capacities of hydraulic fender
•./ I/. _ _ _ _ _ _ I_ _
I J* Resistant loads and energy absorption capacities for the hydraulic fender
/ .1 are dependent upon the impact speed and size of the berthing ships.
Pneumatic Fender 90% Resistant loads and energy absorption capacities for the pneumatic fender
I are dependent upon the initial air pressure and deflection of the fender.
initial air pressure 0
80% 15 psi // _ I
A I
iL//0~100
-o
E / / /11C,- itiol impact load 1 I ,,
00 0/A (73 tons, very large ships)
.E
Hydraulic Fender E
50% 1
loadirge ships)
I
50 60 70 80
tons)
,nergy-obsorption capacities ofumatic fender.
,I .7ities of hydraulic fender and pneumatic fender. 8............ ..
fPS2 Ogship oc..:eloraiionI Og I II
ship velocity normal to wharf 0.5
-- 0.5
k.pneumatic pressure (S- l-P) 4.0
NothCmSŽuth Camel
Notruli Northu~ come-2-Hn
hydraulic pr estsure (S3
Figure~~~~~~~~~~ ~~~~~~ 4.Atpclrcrpgs il eaueet;teewr oe uinaberhin 0fteUN eea ila Mcel2Dcme 93
1.8
V - ~ -- 6~*2.0
K-
TEST CONDITIONS
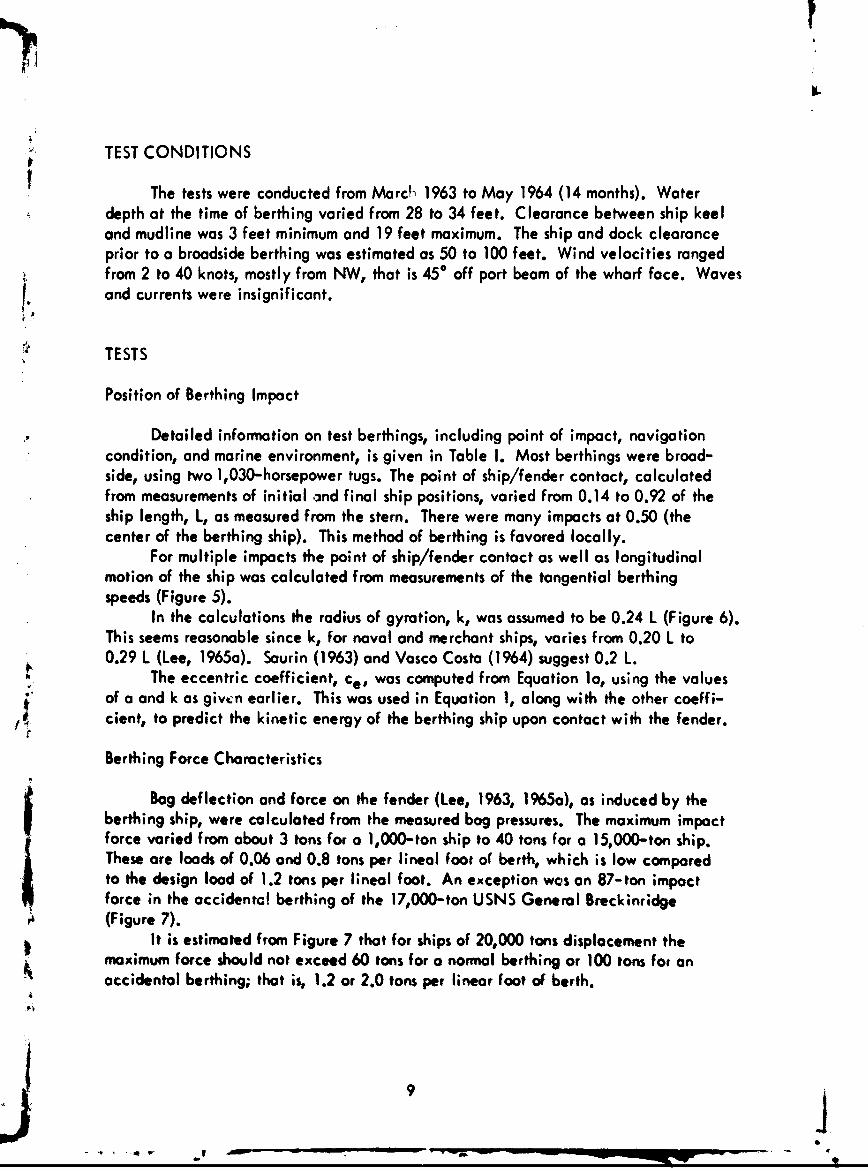
The tests were conducted from Marcl 1963 to May 1964 (14 months). Waterdepth at the time of berthing varied from 28 to 34 feet. Clearance between ship keeland mudline was 3 feet minimum and 19 feet maximum. The ship and dock clearanceprior to a broadside berthing was estimated as 50 to 100 feet. Wind velocities rangedfrom 2 to 40 knots, mostly from NW, that is 45* off port beam of the wharf face. Wavesand currents were insignificant.
TESTS
Position of Berthing Impact
Detailed information on test berthings, including point of impact, navigationcondition, and marine environment, is given in Table I. Most berthings were broad-side, using two 1,030-horsepower tugs. The point of ship/fender contact, calculatedfrom measurements of initial and final ship positions, varied from 0.14 to 0.92 of theship length, L, as measured from the stern. There were many impacts at 0.50 (thecenter of the berthing ship). This method of berthing is favored locally.
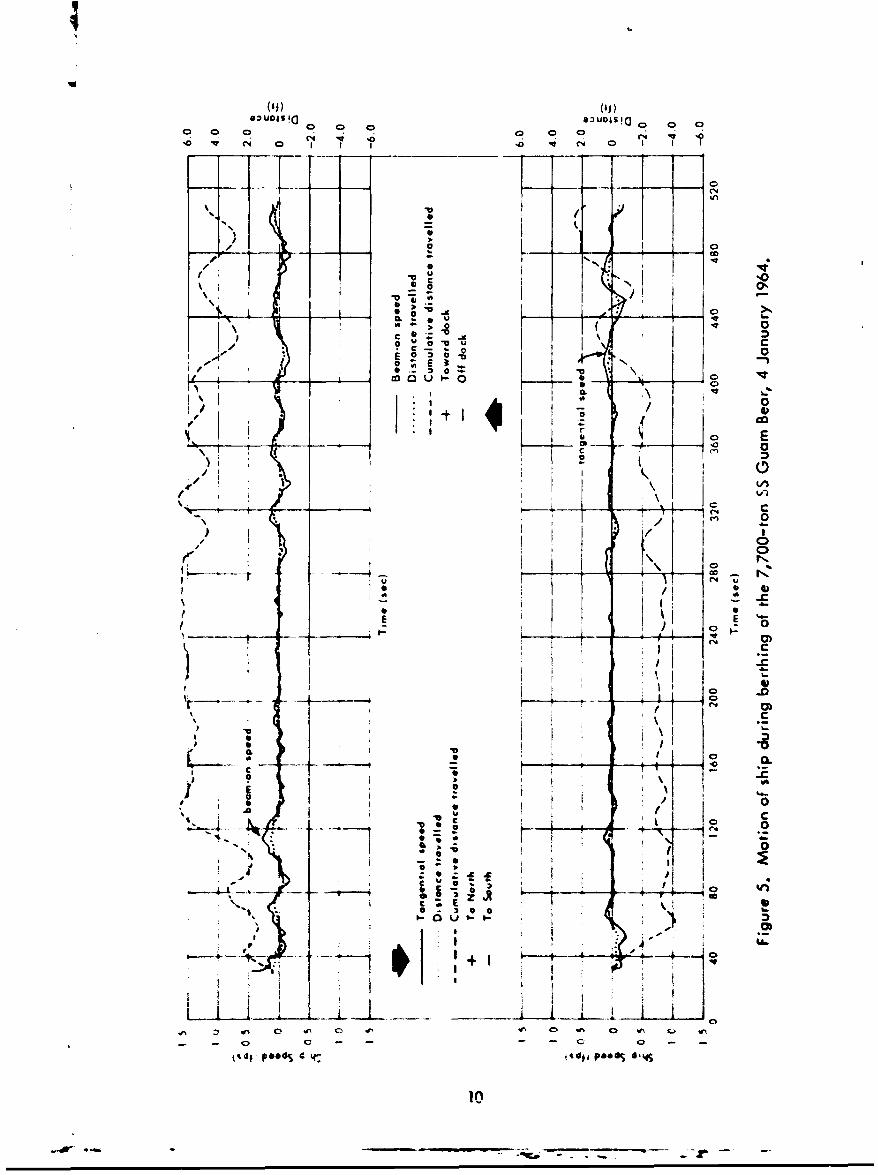
For multiple impacts the point of ship/fender contact as well as longitudinalmotion of the ship was calculated from measurements of the tangential berthingspeeds (Figure 5).
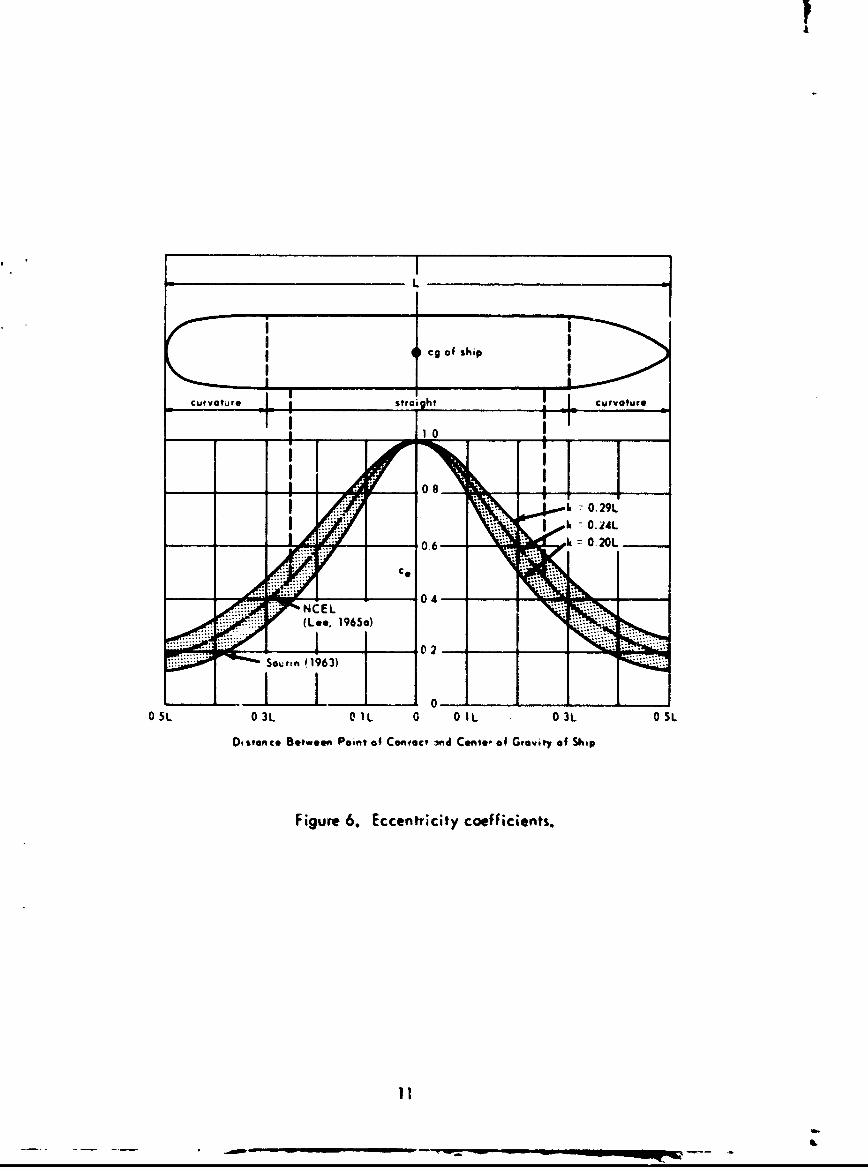
In the calculations the radius of gyration, k, was assumed to be 0.24 L (Figure 6).This seems reasonable since k, for naval and merchant ships, varies from 0.20 L to0.29 L (Lee, 1965a). Saurin (1963) and Vasco Costa (1964) suggest 0.2 L.
The eccentric coefficient, c, was computed from Equation la, using the valuesof a and k as given earlier. This was used in Equation 1, along with the other coeffi-cient, to predict the kinetic energy of the berthing ship upon contact with the fender.
Berthing Force Characteristics
Bag deflection and force on the fender (Lee, 1963, 1965a), as induced by theberthing ship, were calculated from the measured bag pressures. The maximum impactforce varied from about 3 tons for a 1,000-ton ship to 40 tons for a 15,000-ton ship.
These are loads of 0.06 and 0.8 tons per lineal foot of berth, which is low comparedto the design load of 1.2 tons per lineal foot. An exception was an 87-ton impactforce in the accidentc! berthing of the 17,000-ton USNS General Breckinridge
I(Figure 7).It is estimated from Figure 7 that for ships of 20,000 tons displacement themaximum force should not exceed 60 tons for a normal berthing or 100 tons fat an
" accidental berthing; that it, 1.2 or 2.0 tons per linear foot of berth.
9
Slo-. ' ": - Vll -*-* II I L-*• I _ I .. 4
('J) ('I)o• uotssl]a•uis!
,Co aI" ia I I, I ~ 0
00 0 0 0 v 010 v C4 00 1w 4 T
I i; 1I l -r"00 4
i ii-I -- --- r-
0 a M 0
E 0 -r 0
I f I . 0
I,~~ E ~
C4 0
I- 0
4" 1ý
0~ Q ,I 5 f
cog of ship
I tcurvoture straight curvoture
I _I_- .08
k0.29L
I k 0.2L
NCC.
(Leo. 1965.)
0 5L 0 XO.IL 0 0 IL 0 3 0 SL
DQsoSnce Between Point of Contoct 3nd Conti. of Gravity of Shop
Figure 6. Eccentricity coefficients.
I1

J100
100 occident (87 tons) W
a80
600
I -•
40 Oto* -
E
000
n__ .0. too0 0
0 5.000 10.000 15.000 20.000
Berthing Ship Displacement (long tons)
Figure 7. Maximum berthing force to dock.
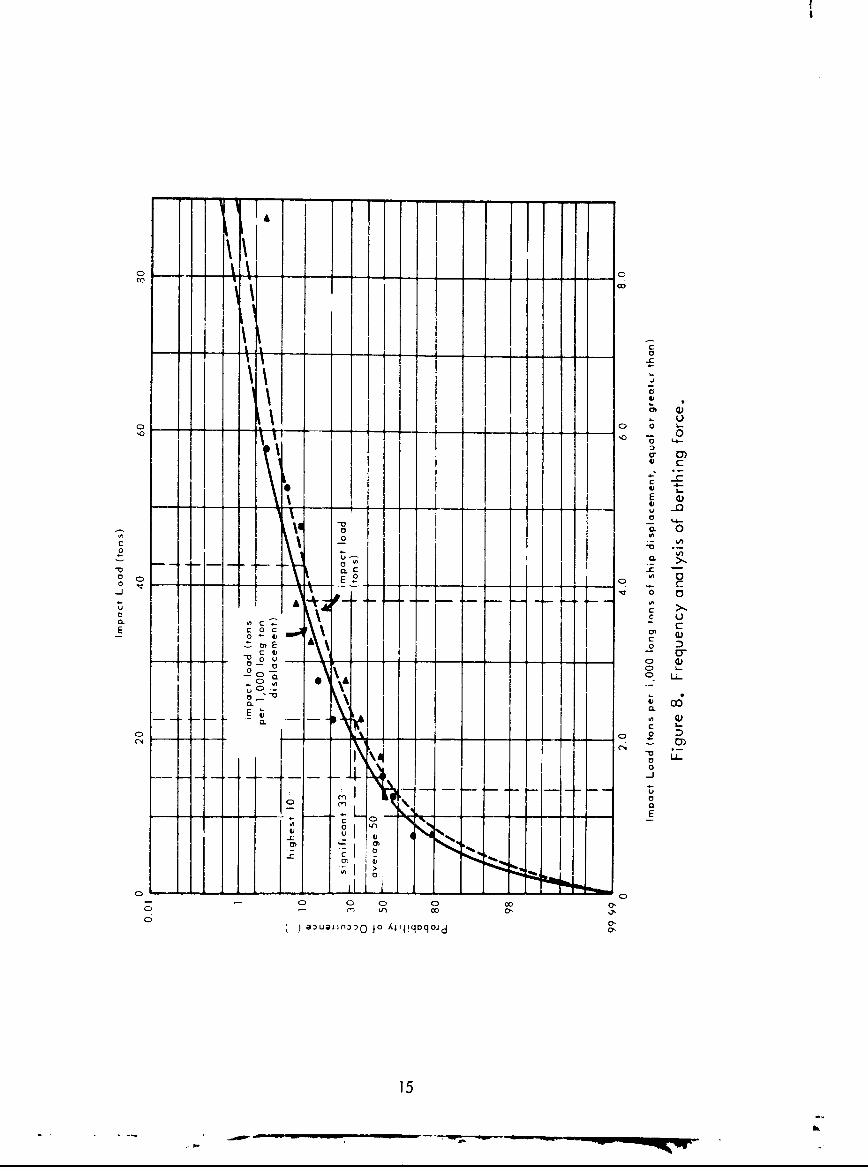
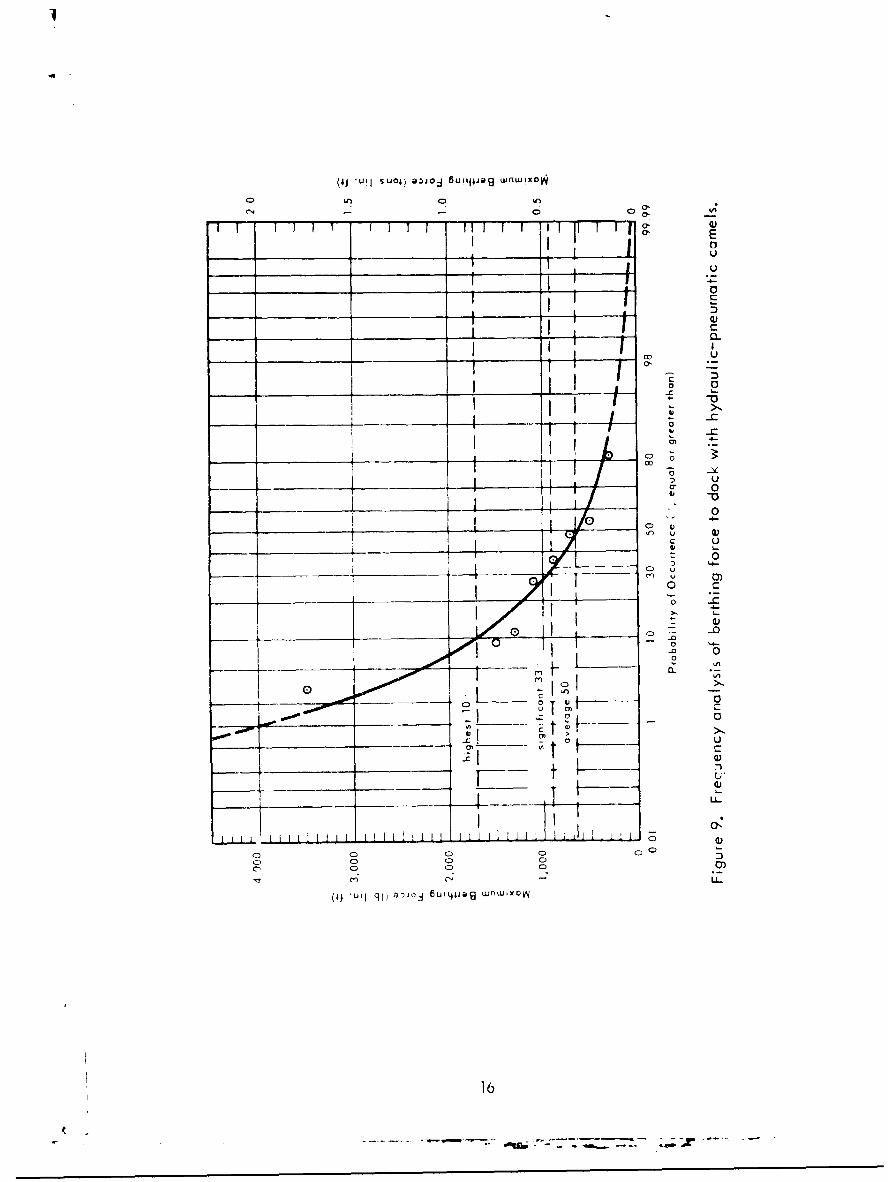
The frequency of berthing force transmitted tt 'ock and to ship hull was
an3lyzed, using measurements of 33 berthing impacts (Figures 8, 9, and 10). Normally,
the berthing force transmitted to the dock did not exceed 1,500 pounds per linear foot
of berth where 2,500 is conventional fo, design. The exception noted above resulted
in a load of 1.7 tons per linear foot of berth (Table I); no damage was observed.
Loading to Ship Hull
The berthing force transmitted to ship hull was 0.2 to 4.0 tons per square foot,or 3 to 55 pounds per square inch, averaging approximately 15 pounds per square inch(Table I). No damage to hulls was noted.
Berthing Velocity Characteristics
Berthing S'eeds both normal and pOrollel to the dock face were measured eitherat the point of impact o. at the center of the ship. Those normal to the dock varied
from, 0.1 to 0.4 foot per second jnder norml conditions; the maximum was 1.0 footper second. Appendix B presents the typical pattern of the velocities of translation
12
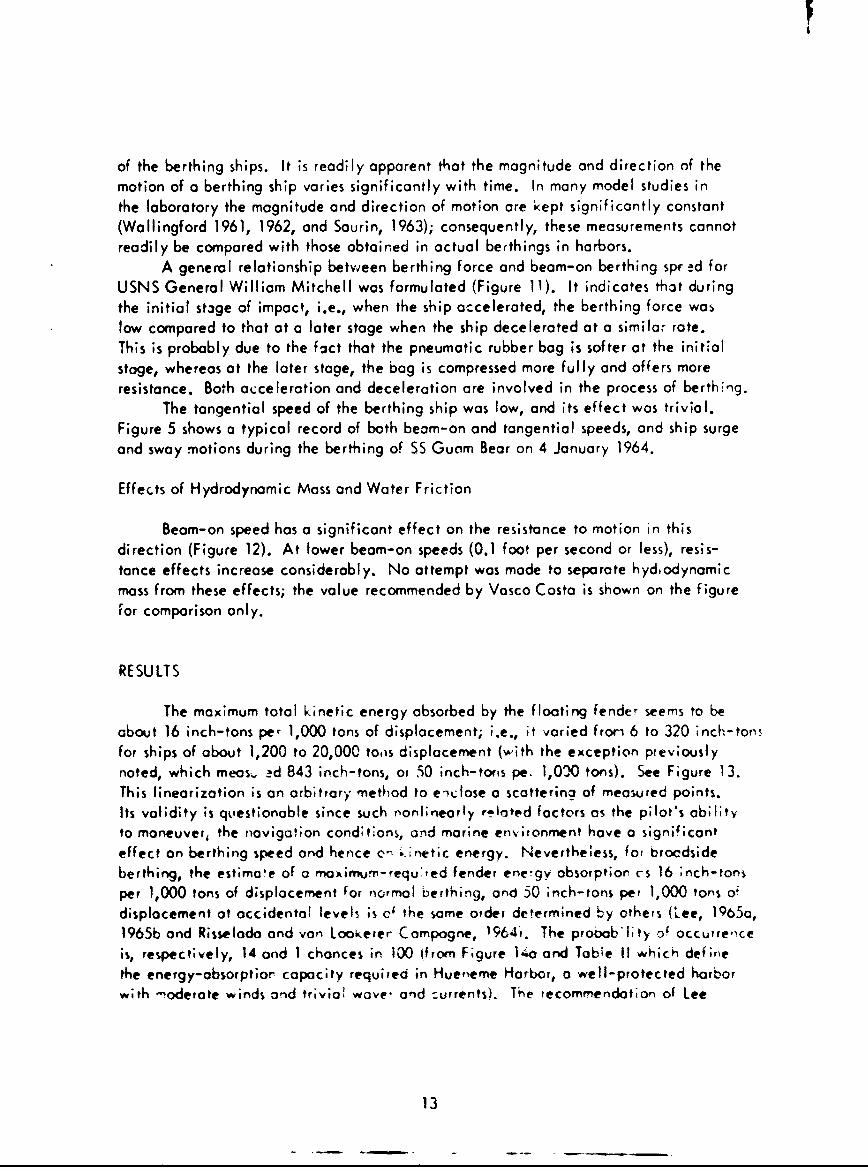
of the berthing ships. It is readily apparent that the magnitude and direction of themotion of a berthing ship varies significantly with time. In many model studies inthe laboratory the magnitude and direction of motion are kept significantly constant(Wallingford 1961, 1962, and Saurin, 1963); consequently, these measurements cannotreadily be compared with those obtained in actual berthings in harbors.
A general relationship between berthing force and beam-on berthing speed forUSNS General William Mitchell was formulated (Figure 11). It indicates that duringthe initial st3ge of impact, i.e., when the ship accelerated, the berthing force waolow compared to that at a later stage when the ship decelerated at a similar rate.This is probably due to the f2ct that the pneumatic rubber bag is softer at the initialstage, whereas at the later stage, the bag is compressed more fully and offers moreresistance. Both acceleration and deceleration are involved in the process of berthing.
The tangential speed of the berthing ship was low, and its effect was trivial.Figure 5 shows a typical record of both beam-on and tangential speeds, and ship surgeand sway motions during the berthing of SS Guam Bear on 4 January 1964.
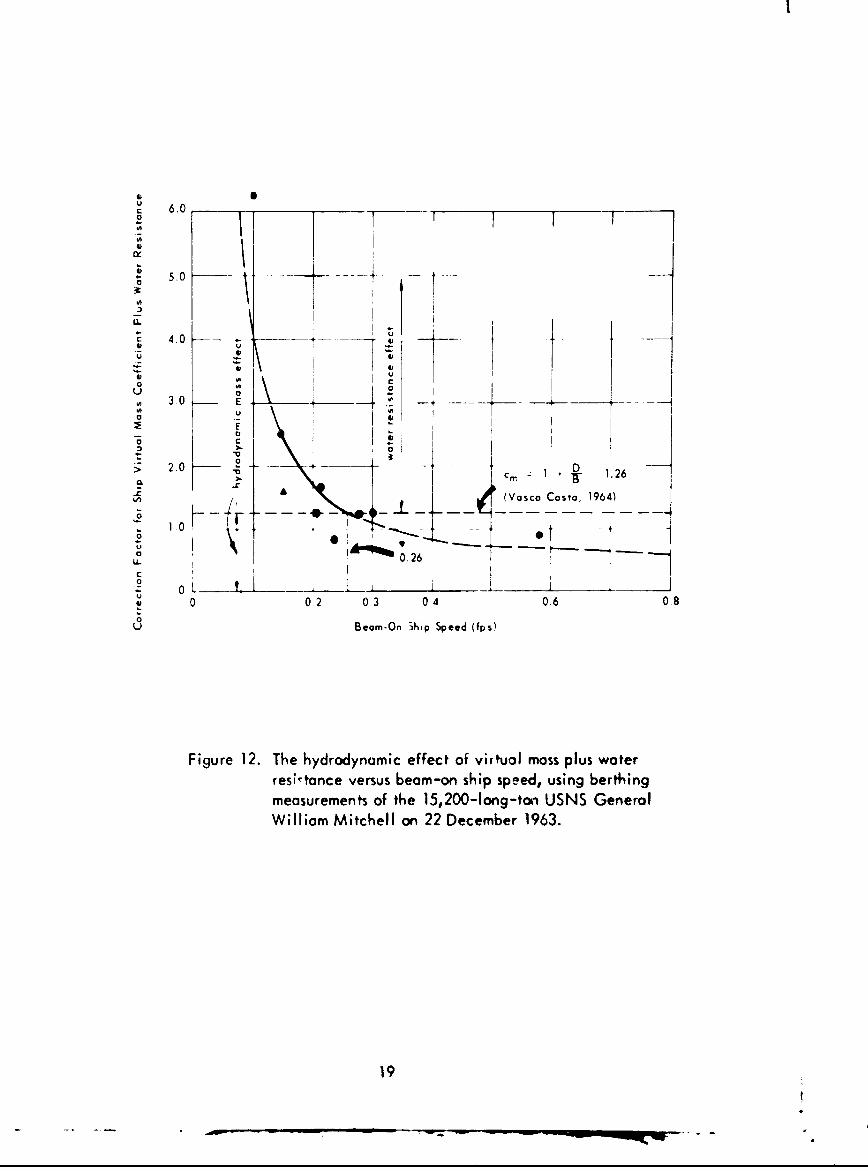
Effects of Hydrodynamic Mass and Water Friction
Beam-on speed has a significant effect on the resistance to motion in thisdirection (Figure 12). At lower beam-on speeds (0.1 foot per second or less), resis-tance effects increase considerably. No attempt was made to separate hydiodynamicmass from these effects; the value recommended by Vasco Costa is shown on the figurefor comparison only.
RESULTS
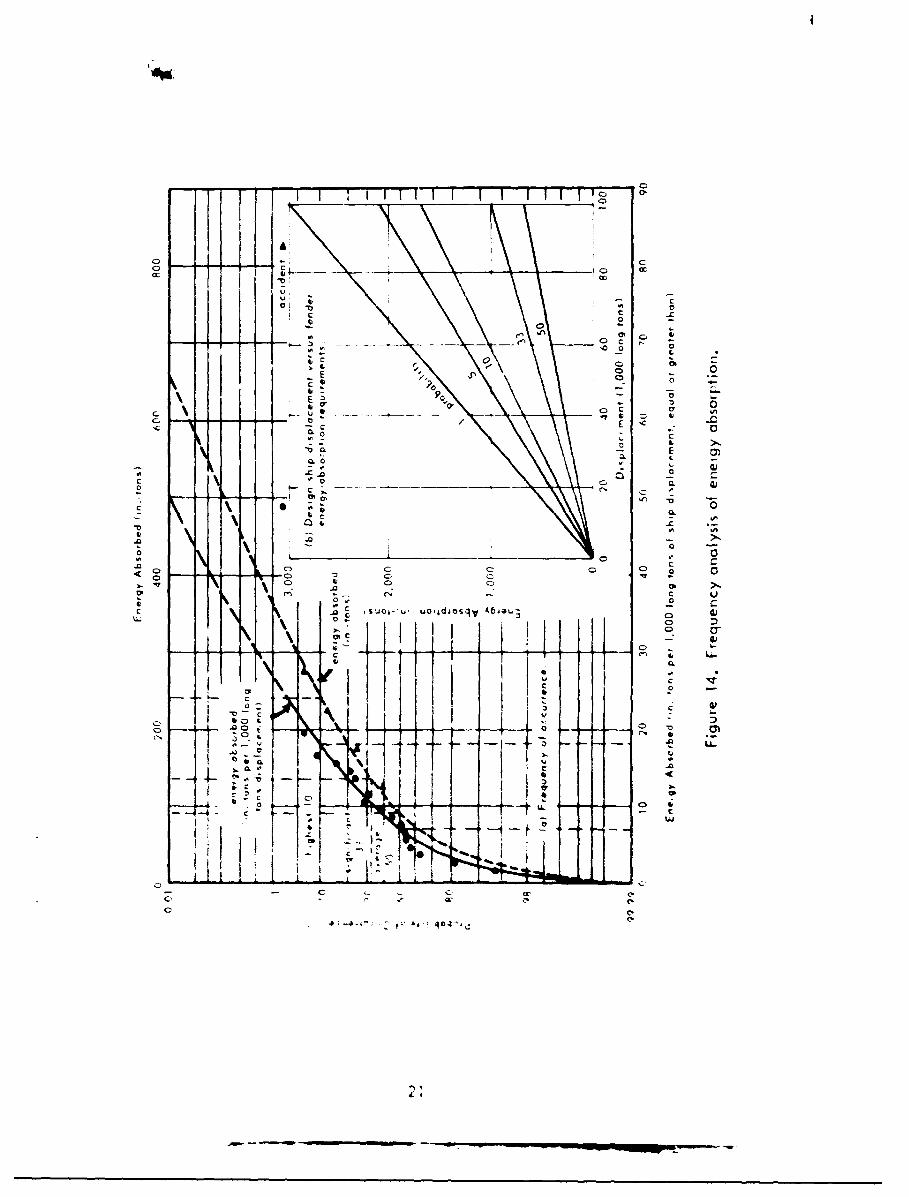
The maximum total kinetic energy absorbed by the floating fender seems to beabout 16 inch-tons per 1,000 tons of displacement; i.e., it varied frorl 6 to 320 inch-tonsfor ships of about 1,200 to 20,000 tons displacement (with the exception previouslynoted, which meas.- !d 843 inch-tons, or 50 inch-torts pe. 1,0' 10 tons). See Figure 13.This linearization is an arbitrary method to e-iclose a scattering of measured points.Its validity is questionable since such nonlinearly r-lated factors as the pilot's abilityto maneuver, the novigat.ion conditions, and marine environment have a significanteffect on berthing speed and hence c, 6kinetic energy. Neverthetess, for brccldsideberthing, the estimate of a maximum-requ',ed fender ene~gy absorption cs 16 inch-tonsper 1,000 tons of displacement fo, normal berthing, and 50 inch-tons per 1,000 tons 0!
displacement at occidental levels is c4 the some order determined by others (Lee, 19 65a,1965b and Risselodo and van Lookerer Compogne, 19641. The probob'i1ty of occurre,-ceis, respectively, 14 and 1 chances in 100 1from F;gure 1.4o and Table II which def;inethe energy-obsorptior capacity required in Hueneme Harbor, a well-protected harborwith "odefote winds and trivial wave, and :urrents). The tecommendotion of Lee
13

(1965b) coincides with 5% probability (Figure 14b). Economic- may dictate changesin ihese values for particular designs. The curves are fitted by eye through pointsbased on measurements; they did not warrani use of such elegant approaches as extremevalue theory (Saurir, 1963) since the data collected are rather limited.
Maximum berthing force occurred during a high wharf-on wind with gusts Lo40 knots, but there were some fairly high forces during such moderate wharf-off windsas those of 14 knots. Generally, berthing impacts were relatively light during calmweather.
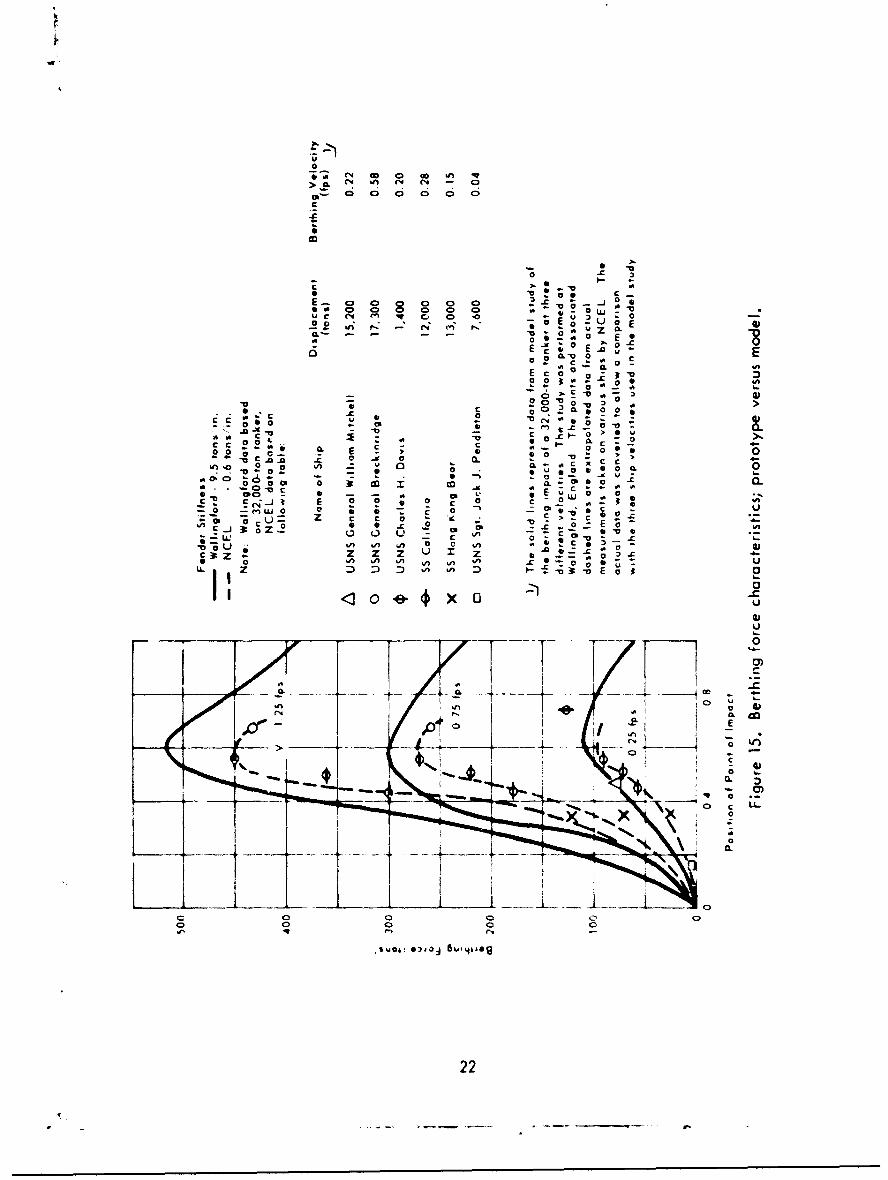
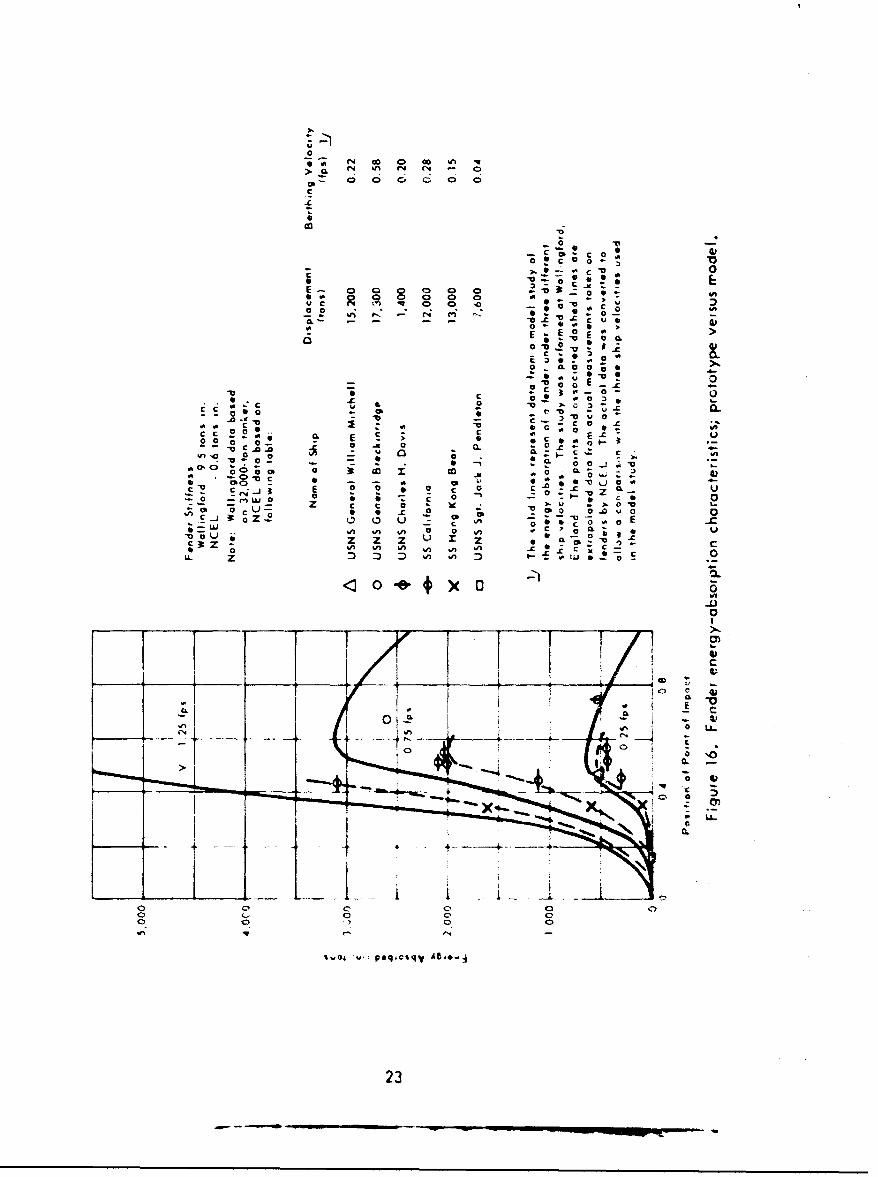
The measured berthing forces cnd related energy absorption were comparei withthose measured on modls by Wallingford Research Station (1961 and 1962). SeeFigures 15 and 16. Agreement is faii, but perhaps comparison iý not pertinent becauseof the many differences. The Hueneme test fender is much less stiff than those usedat Wallingford; thus, the energy-absorption capacity of the Hueneme fender is alsoless. Ship size and test conditions (such as berth configurations, relative stiffness ofship hull and fender, and natural environment) were not identical. The model testsat Wallingford are concerned with forces caused by rotation of the ship ahout thestern rather than those caused by beam-on translation as in the Hueneme tests. Theo-retically, in the latter, foi an equal velocity at the same po;nt of contact, the amounrof energy to be absorbed by a fender is larger when the impact is caused by a shiptranslation than when it results from a ship rotation (Vasco Costa, 1964). The amountof absorbed energy varies with the position in which the berthing ship contacts thefender; resistance to motion at various berthing speeds is significant.
Many investigators assume that the center of gravity of the ship coincides withthe center of the ship length (Wallingford, 1961, 1962; Saurin, 1963; Vasco Costa,1964; Lee, 1965a). Errors proportional to the difference will result if the center ofmass is remote from the center of fhe ship, as in naval destroyers. Generally thecenter of mass (ends to vary with draft quite independent of any architectural aspects.
Resistance to motion at a shiF beam-on speed of 0.10 foot per second varies asmuch as 600 to 800% rIrom that :uggested by Vasco Costa (1964) as due to tN.e hydro-dynamic mass effect alone (Figure 12); at 0.26 foot per second the difference isnegligible. Full-scale measurements conducted at Finnort, Scotland and Bombay,India indicate a similar effect (Grant, 1965).
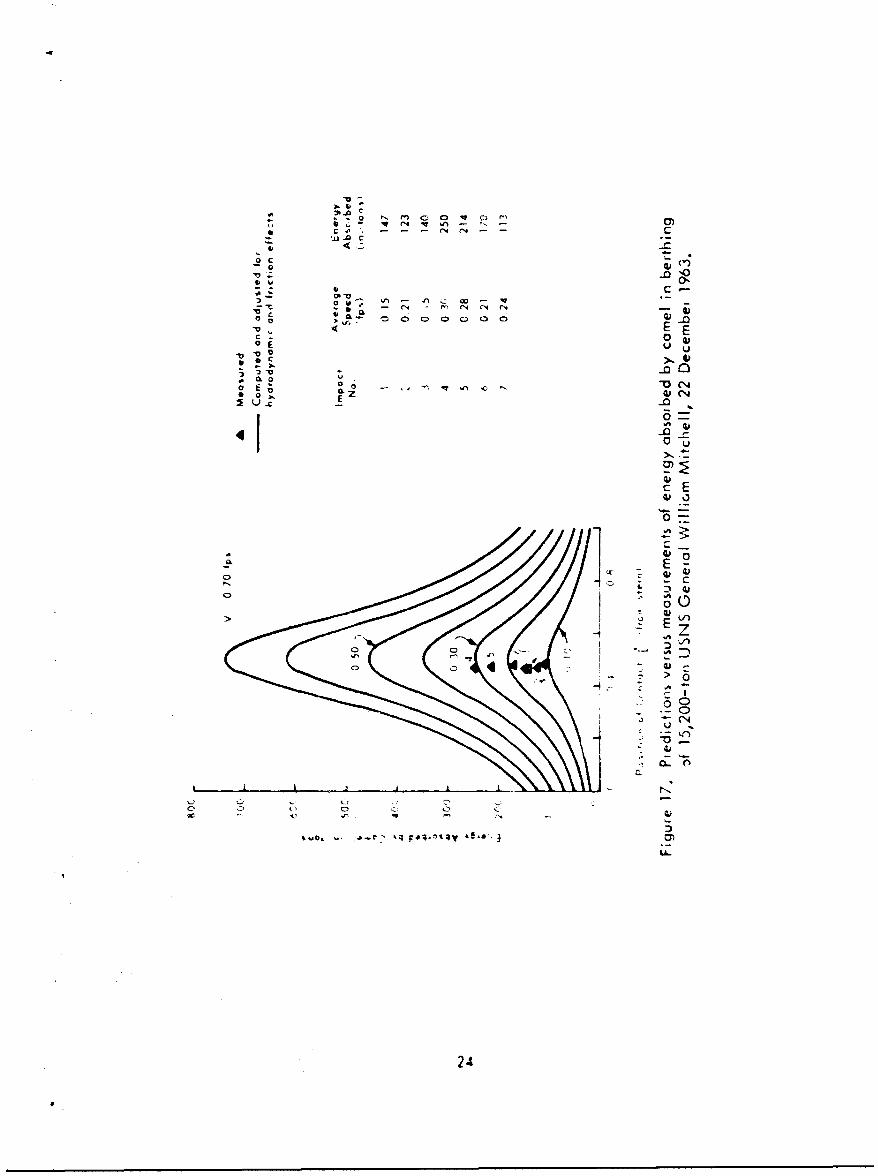
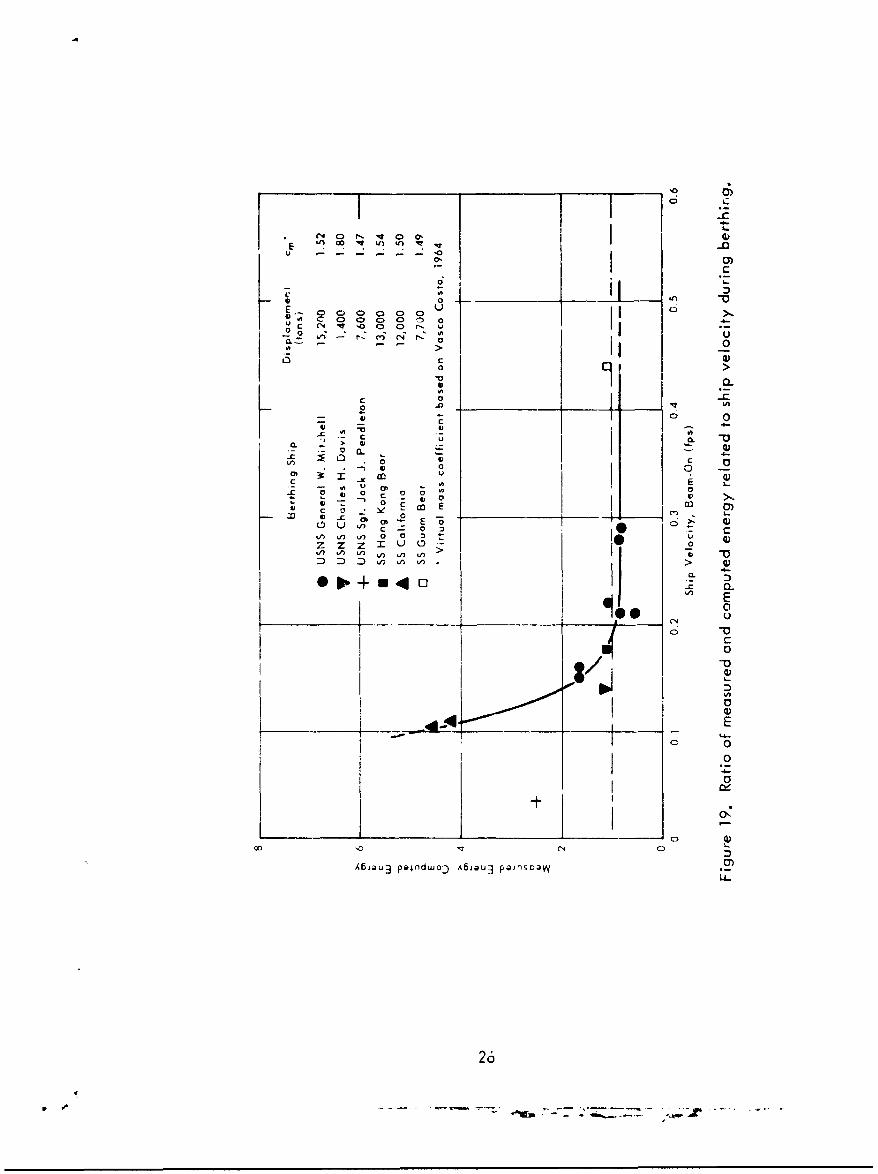
Furthermore, the computed or predicted values of the kinetic energies aLsorbedby the floaling fenders compare fair only with those actually measured (Figure 17).1he error was ±25% generally. As shown in Figures 18 and 1K, the measured energyis considerably higher than predicted ones when a -,hip's beam-on speed is lower than0.1 foot per second, but measured energy is lower at snip speeds greater than 0.2 footper second. Fortunately, the energy-absotptio characteristics at extreme low speedshave no significan, value in the determination of a fender capacity; therefore, fordesign purpose, the predicted energy normally induced by a ship at a relatively highspeed is adequate.
14
ClC
-c:
a
C0 0 U-10~~ 1~0 _0 0
0- 0
* -C
E
a.C
6- C u
0 A
o -0 C ~-L f4 C_ 0 D
-0
-
o
4C)
00 0l 0
a~uajnznD0 jo A4Iioqgojd o
15
.C4
(4 TUI I I I~f I)JO W 1F8 U l I a-
~1 1 1 E
I 1.1 o
____ ___ ____ __ _ ____ __cc
CC
00
0 02
ID C
____ q___ a--.-- --- -- 6-Hjp 0njxo-
I 064

oý 0 0 03 0 0D
o '0 0
-o 0 C0 C 0 0 0l 0 0
00
-C
co 3 -
21 ~ C
II X
0*
-1-0
0 L-
CD C, C, c -0 C 0 ( cL0
0l 0o r 0 L n C
aaJO *jo_ 6utipjaq W'wIxoN
17

4O
impact
4
Vl
SNote: Impact duration - 14 sec-o 20 . .... ÷--Oo • Htghest impact load &
-'J speed - impact no. 4
S.... Jr___2' Impact I O!-I3 A
• 4 •
I 6 ÷
li
beginning •,, ......of , eA•/.
impact
0 P-0 02 04
Speed at Centerline of Ship Berthing Beam-0n ifps!
Figure 11. The relatonshlp of berthing force to shipspeed from berthing measurements of the
15,200-ton USNS General William Mitchell.
18
1( .4
4)C 6.0o 1 - 1
' 504.a c
w. I
3M
S2
30 2 DL
Vo (Vasco Cota 196410
U o
0~
U 2.0 0. . 21--6 .260a
02 03 04 0.6 08
U ~Beam-On 3hip Speed (fps)
Figure 12. The hydradynamic effect of virual mass plus waterres,.tnceversus beam-on ship speed, using berthing
measurements of the 15,200-long-tan USNS GeneralWilliam Mitchell on 22 December 1963.
19
- -. 10. - -- " -• _ . -• - - • .V o o f....1...

accident(843 tons) *
400 4
o 300
_________________ ol~o\, ~2 200.4
C 00"' 100,,. ....
0 _ _ _ __I O
0 5,000 10,000 15,000 20,000
Berthing Ship Displacement (long tons)
Figure 13. Maximum energy absorbed by hydraulic-pneumatic fender.
Table II. Energy-Absorption Requirements in ProtectedHarbors with Moderate Winds
Ship Probability of Occurrence (%)Displacements T 5 i
(long tons) 50 33 10 5
10,000 70 100 180 220 300
20,000 140 200 360 440 600
40,000 280 400 720 880 1,200
60,000 420 600 1,080 1,320 1,800
80,000 560 800 1,440 1,760 2,400
1o0,000 700 1 1,000 1,800 2,200 3,000
20
r
C)C
CK)
kn M 0
E 3cr-
o0 C U
E c
ZL E
c 0 CL
(P C
e- -.--.--- c- ---- ~-0 -
r ~ ;
00
A~~ -. ,jA
00
CC
£o
0
0000 0 0 0 0 0
Oa 0 000 0 0 C-
- - - -1U c 0 6 rI~ Z06 C 0V 0 a 0
in o 0 ~ 0 0 C0 x
M~ E A a 0
CCV z 0cc 0 -J 3roZ.0
z P.-I t 390
< e. xI o
0 au O 0
a-~ M
VI~o- - * ~ -~22
0C4 Go 0 00 %
0 0 0 0
~~01':
E- 0, 0 8 ,
0 0 0 )
M a. aE
60 a
SC- -o ; . o I
- - 0
ca C a C0L
Oý O4. cc0u~~~,0~ V~=U Qoc.
C- O uO 11 0 r - 4,
LJ C > a Ix 0
-~ z z z u 1: zCLOOCU~~ C C.
0 Cwl 0 UJ a o o o
0A -e xn 0
0
0 I
0 0 0
23
oC C
-0
.4 Z.
& ) 4 .- 4 , C,
f C CL0 0 0 00C) CIl
E E
.C
34 V
A 00
0-
U
~~:E
Cr -- E
C) 0 via, C N -
wL
IL

300
S..... // /i /
/ /25 / / 0.30
/ 0.28
200S. ... . . . .. ... . . 5,• >L .
£ i / o1 -#,4,A0 .0 / / 06 ,i
2 ./0.21 t
.- i i ,00 .,
o~o, o. *.//"A-
1.00000
/o--o0- - . z-----__
A o o 0.1 / /
0 0 0 . 201,
/1 A 0.240 ..0"100 + 000-
(tons . 01.
i SS ong ong ear 3,0001.5
50 0.liorni 1 20 0015
El SSGuamBear7,70.1.4
0 3
50 50 10 15A0 5 0
Figue 1. R latonsip f m asued ndComputed Enry ( prdn.e ) negyab0 ptono
thS e e dralu.Mic eli - n u a c 15,200r .52N t - T en m e s s o nb sd0.03 G 0.p4
Figure 18.Relationsip ofComputedad En puerg ( prdin.-tnegons)ptono
* USNS Ge erlW Myruit -numtchl f5e200 r.52Nt-Tenmess nbsd
7 ~ ~ ~ ~ ~ 2 Copyhre . ai ,0 .8 h onsrersn vrg
(N - - - -~ 0 -~ -
0 0
CL0
V) 000ILm 0 l0 0 0 0
L 0 co E c,, -2 E 00
- 0 1c)40~'n V) U) V V0 D* .4-n
0)0 rN ua-- ~ 0 C)
00 10 0 -04
AZZZu O; -ando -oa3PJ I
262
I
FINDINGS
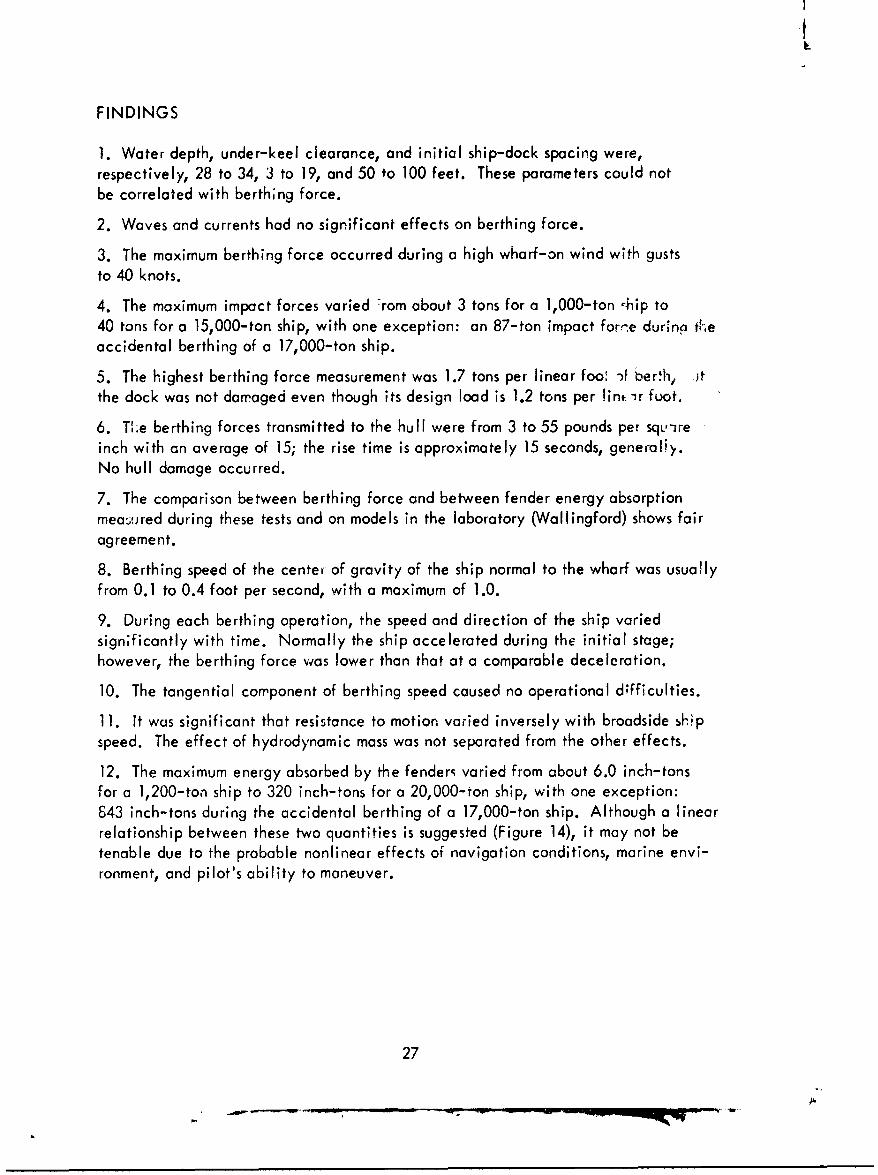
1. Water depth, under-keel clearance, and initial ship-dock spacing were,respectively, 28 to 34, 3 to 19, and 50 to 100 feet. These parameters could notbe correlated with berthing force.
2. Waves and currents had no significant effects on berthing force.
3. The maximum berthing force occurred during a high wharf-on wind with guststo 40 knots.
4. The maximum impact forces varied rom about 3 tons for a 1,000-ton -hip to40 tons for a 15,000-ton ship, with one exception: an 87-ton impact for-e dursno theaccidental berthing of a 17,000-ton ship.
5. The highest berthing force measurement was 1.7 tons per linear fool -) berth,, )tthe dock was not damaged even though its design load is 1.2 tons per lint ir foot.
6. T,.e berthing forces transmitted to the hull were from 3 to 55 pounds per sqL',reinch with an average of 15; the rise time is approximately 15 seconds, generaliy.No hull damage occurred.
7. The comparison between berthing force and between fender energy absorptionmeastired during these tests and on models in the laboratory (Wallingford) shows fairagreement.
8. Berthing speed of the center of gravity of the ship normal to the wharf was usuallyfrom 0.1 to 0.4 foot per second, with a maximum of 1.0.
9. During each berthing operation, the speed and direction of the ship variedsign;ficantly with time. Normally the ship accelerated during the initial stage;however, the berthing force was lower than that at a comparable deceleration.
10. The tangential component of berthing speed caused no operational d;fficulties.
11. It was significant that resistance to motion varied inversely with broadside Shipspeed. The effect of hydrodynamic mass was not separated from the other effects.
12. The maximum energy absorbed by the fenders varied from about 6.0 inch-tonsfor a 1,200-ton ship to 320 inch-tons for a 20,000-ton ship, with one exception:643 inch-tons during the accidental berthing of a 17,000-ton ship. Although a linearrelationship between these two quantities is suggested (Figure 14), it may not betenable due to the probable nonlinear effects of navigation conditions, marine envi-ronment, and pilot's ability to maneuver.
27

CONCLUSIONS
1. The energy-absorption capacity of the floating fenders is adequate for a well-protected harbor such as that at Port Hueneme.
2. A fender system for a well-protected harbor should be designed with a minimumabsorption capacity of 16 inch-tons per 1,000 tons of ship displacement for normalberthing, and with a maximum capacity of 50 inch-tons per 1,000 tons displacement.This also seems a sensible maximum for coping with accidental berthings.
3. Resistance to motion in berthing is a very important parameter which needs to beinvestigated further. It includes the effect of hydrodynamic mass which is importantin the analytical treatment of berthing problems.
RECOMMENDATIONS
1. That full-scale tests of berthing impact be continued, part*cularly in exposedharbors, and that simpler instruments be deveioped for the purpose. The objectiveis to determine the energy requirements for other fender designs for exposed harbors.
2. That model tests or berthing impact be initiated, particularly of the resistanceto motion for consequent evaluation of the pertinent hydrodynamic mass.
28
PART II. TESTS AT SAN DIEGO HARBOR
INTRODUCTION
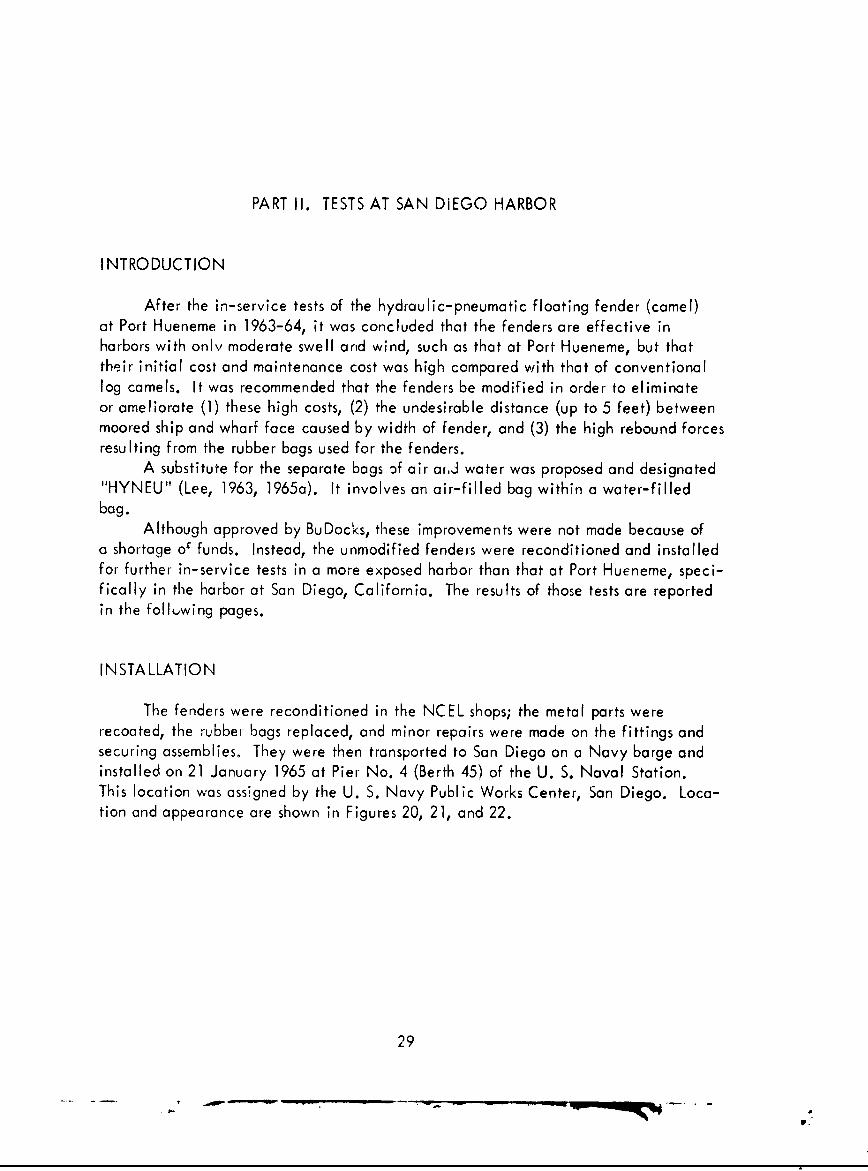
After the in-service tests of the hydraulic-pneumatic floating fender (camel)at Port Hueneme in 1963-64, it was concluded that the fenders are effective inharbors with only moderate swell and wind, such as that at Port Hueneme, but thattheir initial cost and maintenance cost was high compared with that of conventionallog camels. It was recommended that the fenders be modified in order to eliminateor ameliorate (1) these high costs, (2) the undesirable distance (up to 5 feet) betweenmoored ship and wharf face caused by width of fender, and (3) the high rebound forcesresulting from the rubber bags used for the fenders.
A substitute for the separate bags of air ar.J water was proposed and designated"HYNEU" (Lee, 1963, 1965a). It involves an air-filled bag within a water-filledbag.
Although approved by BuDocks, these improvements were not made because ofa shortage oZ funds. Instead, the unmodified fenders were reconditioned and installedfor further in-service tests in a more exposed harbor than that at Port Hueneme, speci-fically in the harbor at San Diego, California. The results of those tests are reportedin the folltwing pages.
INSTALLATION
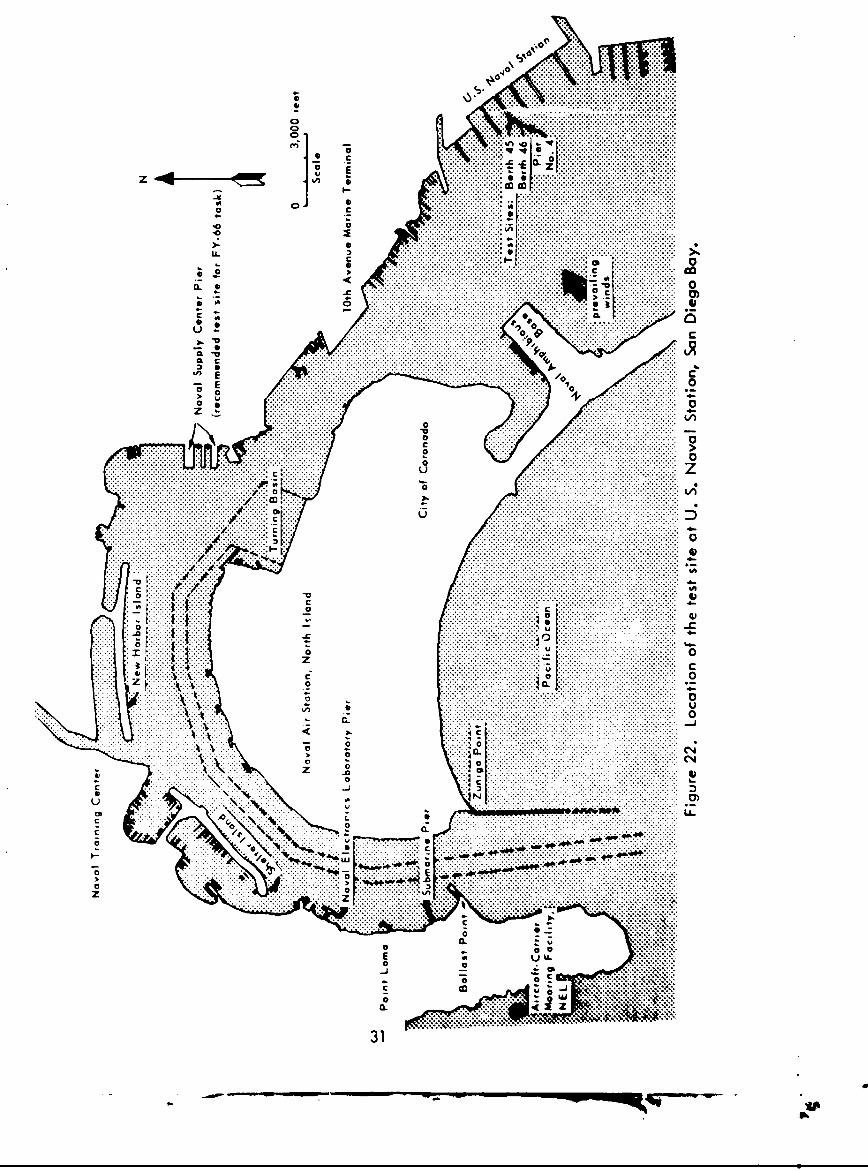
The fenders were reconditioned in the NCEL shops; the metal parts wererecoated, the rubber bags replaced, and minor repairs were made on the fittings andsecuring assemblies. They were then transported to San Diego on a Navy barge andinstalled on 21 January 1965 at Pier No. 4 (Berth 45) of the U. S. Naval Station.This location was assigned by the U. S. Navy Public Works Center, San Diego. Loca-tion and appearance are shown in Figures 20, 21, and 22.
29
-. -..

Figure 20. Installation of the test fender.
Figure 21. Test fender in operational position atPier No. 4, Naval Station, Sun Diego.
30- -- i
00
00
..............
4 ....... .........
CtC
-E .. . .. .
z a I.. .. . . . . .. . . . . .
........ .......... ... ... .. ... ... .I... ... ..... .. .. .. ... .. .. ... .. .. .. .. .. .. ..
... ... ... ...
0 .. . . . . . .0.. . . . .
0 0. . . . . . . . . . . . . .
.. ................. ..... ..... . . . . . . . . . . . ... .....
.. .. . ... ... . .. . .
.. . . . . . . .. . . . . . . . ... . . . . . . . . .. . . . . . . .
.. ..........z. ......... .. .. .. .. .. ..
IL .. .. .c .. .... .... ... ... ... .0... . . . . . . .. . . . . . .
- !
4
TEST CONDITIONS
Winds
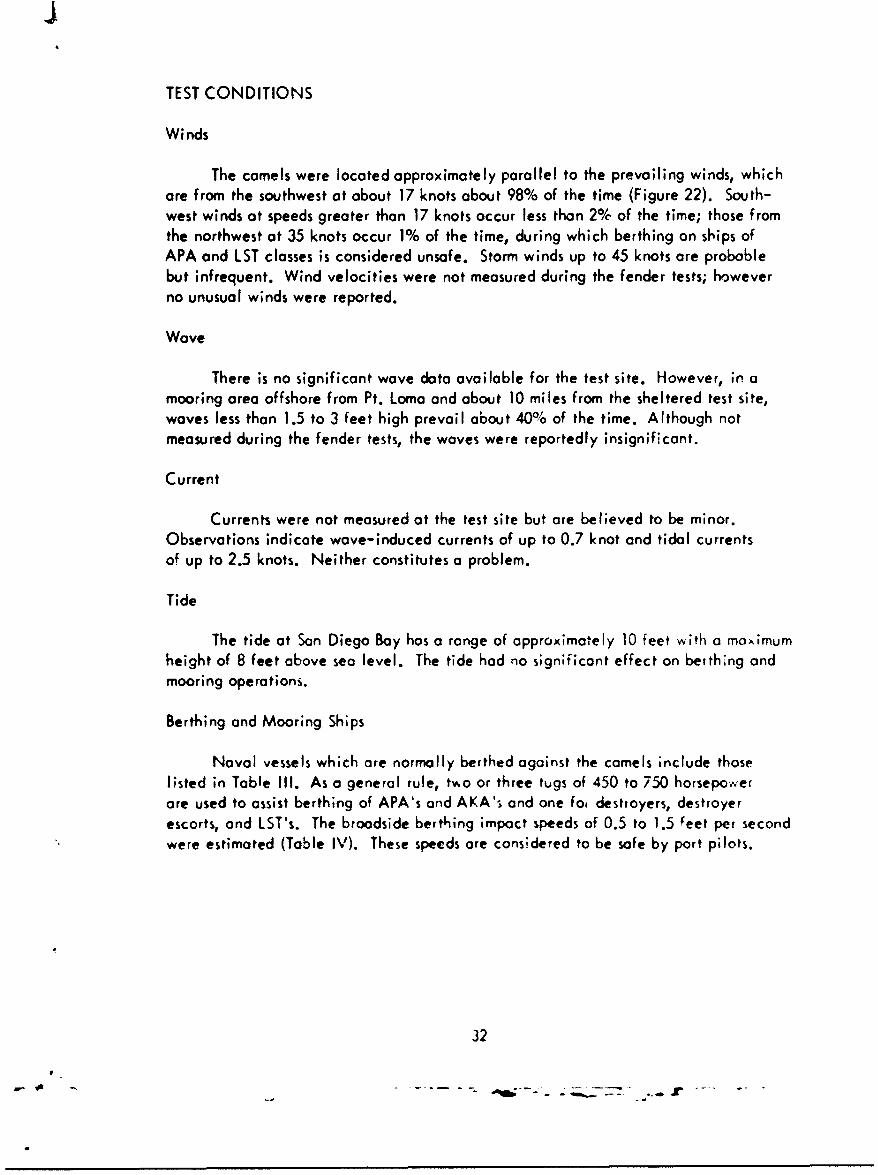
The camels were located approximately parallel to the prevailing winds, whichare from the southwest at about 17 knots about 98% of the time (Figure 22). South-west winds at speeds greater than 17 knots occur less than 2% of the time; those fromthe northwest at 35 knots occur 1% of the time, during which berthing on ships ofAPA and LST classes is considered unsafe. Storm winds up to 45 knots are probablebut infrequent. Wind velocities were not measured during the fender tests; howeverno unusual winds were reported.
Wave
There is no significant wave data available for the test site. However, in amooring area offshore from Pt. Loma and about 10 miles from the sheltered test site,waves less than 1.5 to 3 feet high prevail about 40% of the time. Although notmeasured during the fender tests, the waves were reportedly insignificant.
Current
Currents were not measured at the test site but are believed to be minor.Observations indicate wave-induced currents of up to 0.7 knot and tidal currentsof up to 2.5 knots. Neither constitutes a problem.
Tide
The tide at San Diego Bay has a range of approximately 10 feet with a mox;mumheight of 8 feet above sea level. The tide had no significant effect on berthing andmooring operations.
Berthing and Mooring Ships
Naval vessels which are normally berthed against the camels include thosel;sted in Table Ill. As a general rule, tvo or three tugs of 450 to 750 horsepo.verare used to assist berthing of APA's and AKA's and one fo. destroyers, destroyerescorts, and LST's. The broadside berthing impact speeds of 0.5 to 1.5 feet per secondwere estimated (Table IV). These speeds are considered to be safe by port pilots.
32
q,

Table III. Types of Berthing Ships
Displacement
Type Description (long tons)
APA Attack Transport 8,000- 10,000
AKA Attack Cargo Ship 8,000- 10,000
DD Destroyer 1,100- 2,400
DE Escort Vessel 1,100- 2,400
LST Landing Ship Tank 1,700- 2,600
Table IV. Safe Impact Speeds
Approach at an Angle BodieBrhnBroadside Berthing
Ship tto Wharf FaceShip Speed Normal
Type tc Wharf FaceSpeed Angle(kt)(knots)* (deg)
APA AKA 1.0 10 0.5
DD,. DE 2.0 10 1.5
LST 2.5 10 1.5
*Speed c long long axis of ship
33
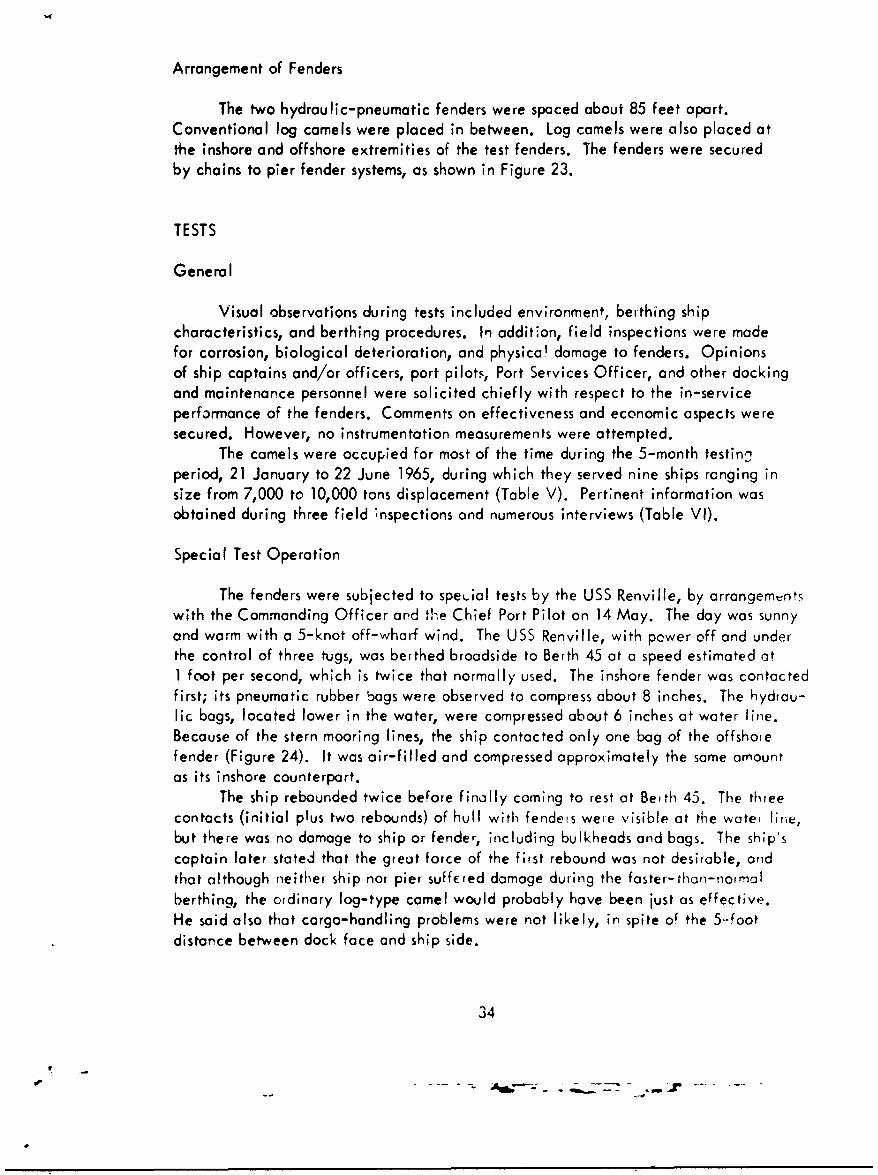
Arrangement of Fenders
The two hydraulic-pneumatic fenders were spaced about 85 feet apart.Conventional log camels were placed in between. Log camels were also placed atthe inshore and offshore extremities of the test fenders. The fenders were securedby chains to pier fender systems, as shown in Figure 23.
TESTS
General
Visual observations during tests included environment, berthing shipcharacteristics, and berthing procedures. In addition, field inspections were madefor corrosion, biological deterioration, and physical damage to fenders. Opinionsof ship captains and/or officers, port pilots, Port Services Officer, and other dockingand maintenance personnel were solicited chiefly with respect to the in-serviceperformance of the fenders. Comments on effectiveness and economic aspects weresecured. However, no instrumentation measurements were attempted.
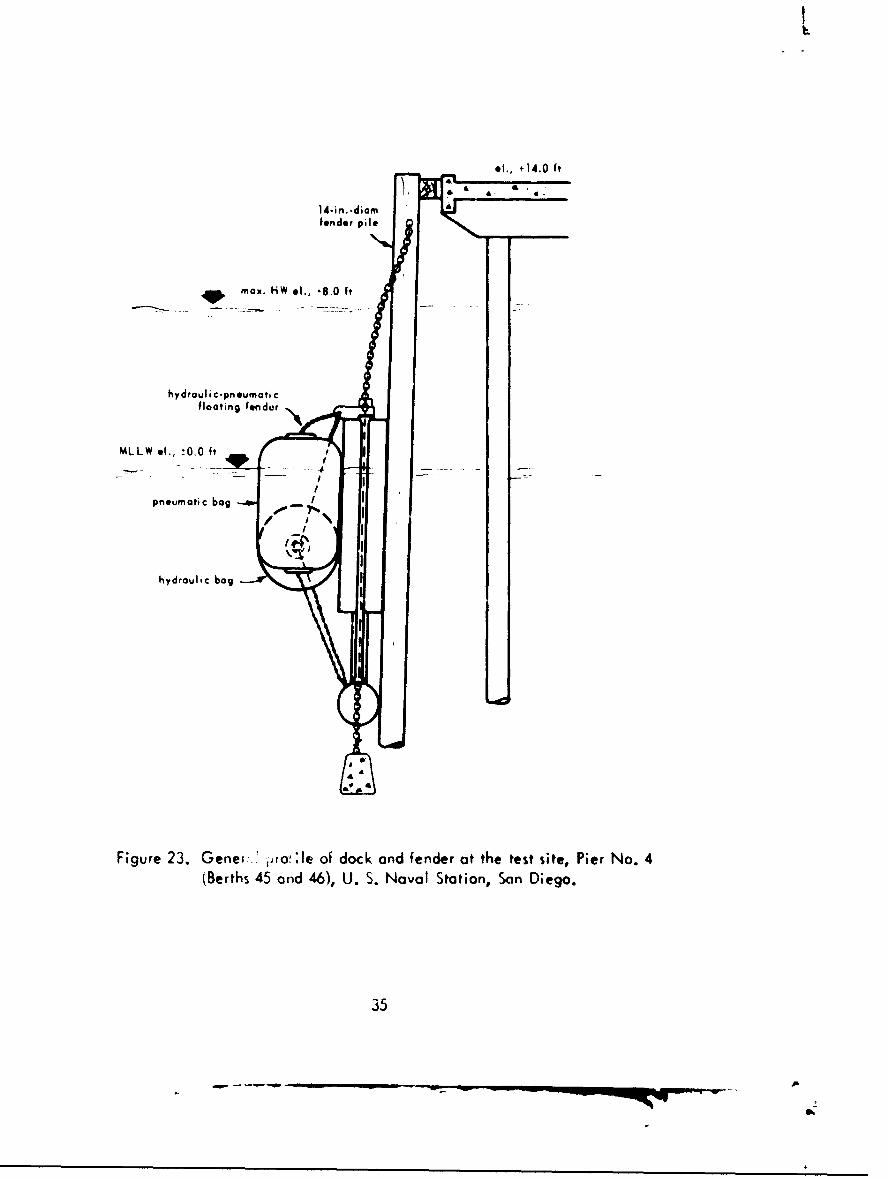
The camels were occupied for most of the time during the 5-month testin2period, 21 January to 22 June 1965, during which they served nine ships ranging insize from 7,000 to 10,000 tons displacement (Table V). Pertinent information wasobtained during three field ;nspections and numerous interviews (Table VI).
Special Test Operation
The fenders were subjected to speý_ial tests by the USS Renville, by arrangementswith the Commanding Officer and the Chief Port Pilot on 14 May. The day was sunnyand warm with a 5-knot off-wharf wind. The USS Renville, with power off and underthe control of three tugs, was berthed broadside to Berth 45 at a speed estimated at1 foot per second, which is twice that normally used. The inshore fender was contactedfirst; its pneumatic rubber bags were observed to compress about 8 inches. The hydrau-lic bags, located lower in the water, were compressed about 6 inches at water line.Because of the stern mooring lines, the ship contacted only one bag of the offshorefender (Figure 24). It was air-filled and compressed approximately the same amountas its inshore counterpart.
The ship rebounded twice before finally coming to rest at Beith 45. The threecontacts (initial plus two rebounds) of hull with fenders were visible at the watef line,but there was no damage to ship or fender, including bulkheads and bags. The shipscaptain later stated that the great force of the first rebound was not desirable, andthat although neither ship nor pier suffcred damage during the faster- than-normalberthing, the ordinary log-type camel would probably have been just as effective.He said also that cargo-handling problems were not likely, in spite of the 5-footdistance between dock face and ship side.
34
el., 004.0 .t
14-in.-diamfender pile
w max. H W *1., +-8.0 It i -
hydraulic-pneumatic
floating f~ndor
M L L W el., _-'0.0 ft _
pneumatic bag I
hydraulic bag--.1•
Figure 23. Geneis tro!:le of dock and fender at the test site, Pier No. 4(Berths 45 and 46), U. S. Naval Station, Son Diego.
35

'4U
-u
U
t n
-ID
to
-D•
C•4)
o u• E C•
mm•4,
34,
if£
.•q• o m•. •-" .. IJ•C
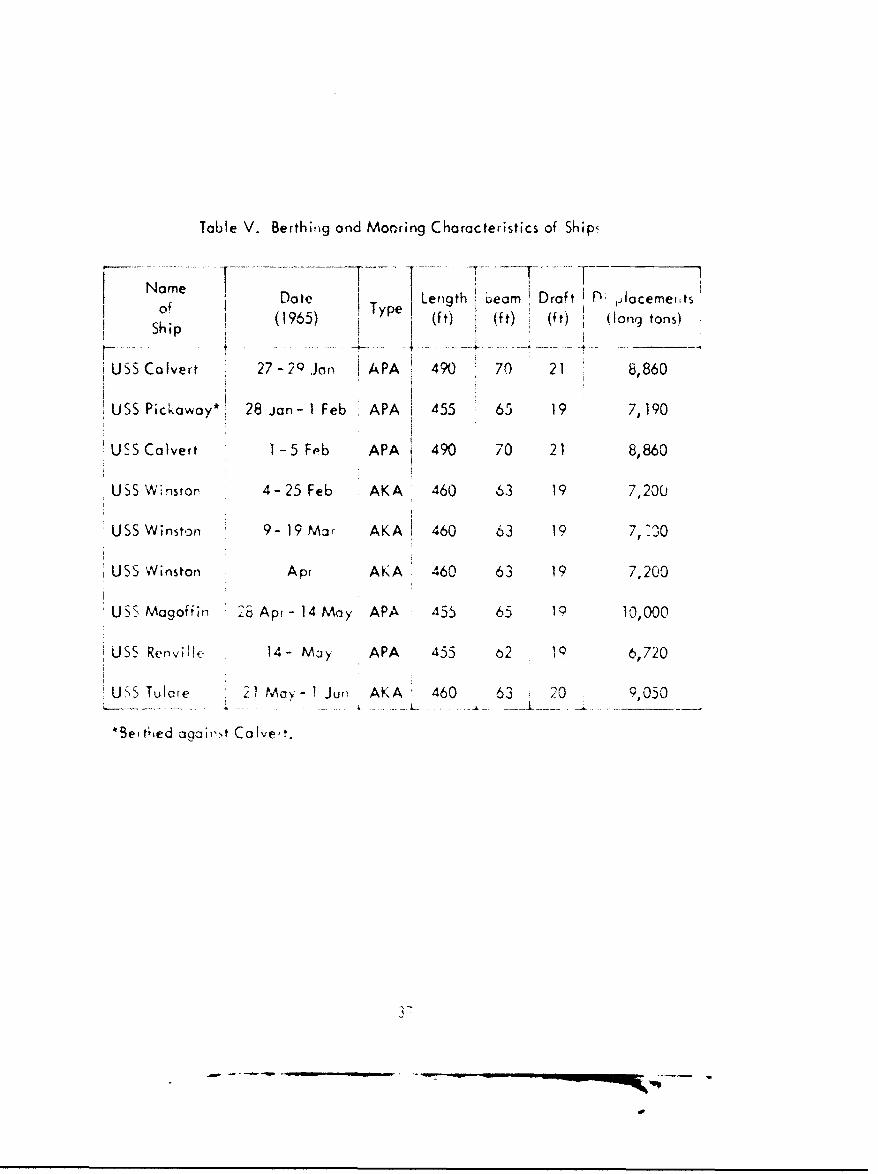
Table V. Berthi,,g and Mooring Characteristics of Ship.
Name I UDoa Typ Length ueam Draft I D ,.lacemertts
(1965) (ft) (ft) (ft) (Iong tons)Ship
USS Calvert 27-29 .JOn APA 490 70 21 8,860
USS Pickaway* 28 jan- I Feb APA 455 65 19 7,A190
USS Calvert 1-5 Fob APA 490 70 21 8,860
USS Wnsror 4-25 Feb AKA 460 63 19 7,200
USS Winston 9- 19 Mar AKA 460 63 19 7,-0
USS Winston Apr AKA 460 63 i9 7,200
USS Magoffin 26 Apr - 14 May APA 4.55 65 i9 i0,000
USS Rernvile 14- May APA 455 62 10 6,720
USS Tulare 21 Moy- I Jur- AKA 460 63 20 9,050
*Ber tned aqciTrt Cakvet.
Table V11 Summary of Comments on BuDocs-'Des~gned Hydriculic-Pneumatic Camels
Field 1,15pectiin a-d f~rtcCm'sU vrbeCmetSourc.e of Corma.e-'
- 3 Ap,~ i 165
Berthing Suc' The carrels oe-4c*,ed oe'!, -o crpo--,~ere rece .ed.
Aws. Berthin-g Supt. Tre cam-elS *L-.ti0`-e ; sat'S'0Ct0; ,
nowe -.e", ý,ey -~ere -o! 'occed e- -e,-
,i-elr di 6ivj brrtý' g. P-?vailirgwnas ,.ere directly )f !1 he piier 'ajce,trhus relucirq impoa- rciad.
Port Services Officer The canreis ore~er-ted isg'ý,rocnt damrage(then ship's engineeri to US!\5 Genreral Breci<,rridge during a
violent be't'-inai at Po'r Huen'eme Harboron 23 Apr: ! pý64.
Ope'criuns Off ic-ers During sudden win)d shifts, thie camels Ship cannot useaccommodlatiori la-dde:US: Winston preve!.ted darnaye !o' moored snrip durl~g olonr-side pier due to ex~cessive ho I
25 ýo 35 -.o- indls in March 1965. This zo-t-t-l distance frmpier to side of'ype a' lende- dei', ;,ey wou.ld have pre- 5hip, caused by came's.dentedl Kill damagje sustained by USS
Winston at Naval Repair FacilityYokOSuiKa, a.'d at BKcrner Bay, Oýr'rawa,on a similar occasion.
1:- 12 - 14 May 1965
Inspection Engqineer Ail visible rretol and wojod rdarts were in Rubbe- hags below water line weresound con-dition). The camels stood up covered with marine growth. Ai.very well during a high-speed (twice pressures decreased from 12 to 6 psi
ora,1foot per second) ;n-service iafter 4-months operations.test -)n 14 Miy. The pne~rnatie andhydraulic baogs were camp et-ýd 8 inches.
C.O. and Operations Officers, The camels performed well while the ship Similar pneumatic tenders Ourst inUSS Magoff in Was berthed Out were never subjected to Pear" Harbor under normal weather
excessive loads. conditions.
Berthing Supt. and The camels were so IsFactory for quietAsst. Berthing Supt. environment and 'eady for severe ir;-
ser% ice tests.
Maint. Control Personnel, PWC The camels were satisfactorv sirce nonegative reaction as received. i
C 0. of USS Renyille In spite of the 5-foot distance betw.Žen The ship hojd a noticeable and unde-the dock~ and ship, no caigo-handling sirable bounce after first impact. Thepioblem was ant~cipatt-d. log, camel would be just as effective
as the test camel.
38
FINDINGS
Performance
1. The fenders, spaced about 85 feet apart, served nine naval ships of 7,000 to10,000 tons displacement, and were in use about 50% of the time during the 5-monthtesting period from 21 January to 22 lune 1965. Bert' ing impact was generally light.
2. The fenders functioned satisfactorily, preventing damage to a ship moored duringwirnds of 35 knots.
3. The standoff distance necessitated by the fender is considered a major drawbackby most users, as is the rebound of the ship ineuced by the pneumatic rubber bags.
Deterioration After Approximately 5 Months In Service
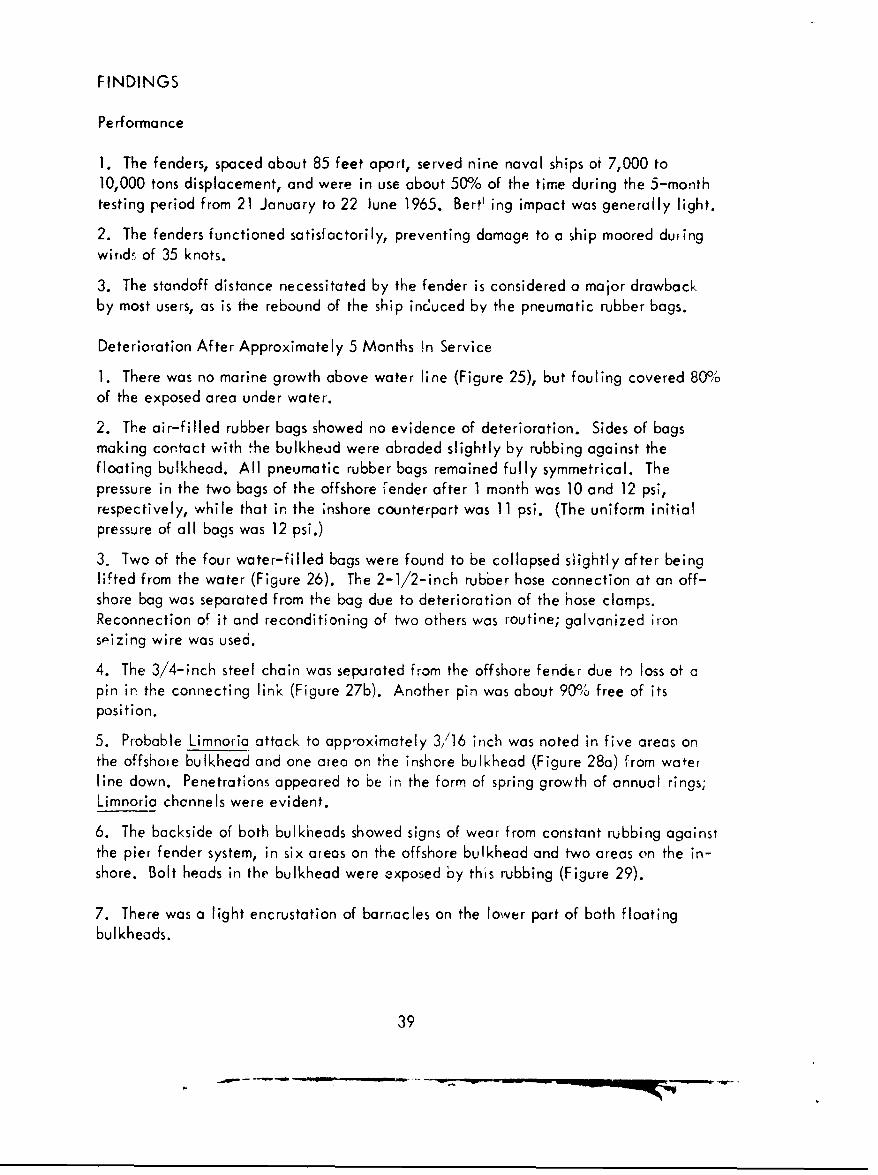
1. There was no marine growth above water line (Figure 25), but fouling covered 80%'of the exposed area under water.
2. The air-filled rubber bags showed no evidence of deterioration. Sides of bagsmaking contact with the bulkhead were abraded slightly by rubbing against thefloating bulkhead. All pneumatic rubber bags remained fully symmetrical. Thepressure in the two bags of the offshore render after 1 month was 10 and 12 psi,respectively, while that in the ;nshore counterpart was 11 psi. (The uniform initialpressure of all bags was 12 psi.)
3. Two of the four water-filled bags were found to be collapsed slightly after beinglifted from the water (Figure 26). The 2-1/2-inch rubber hose connection at an off-shore bag was separated from the bag due to deterioration of the hose clamps.Reconnection of it and reconditioning of two others was routine; galvanized irons-izing wire was used.
4. The 3/4-inch steel chain was separated from the offshore fender due to loss of apin in the connecting link (Figure 27b). Another pin was about 9000 free of itsposition.
5. Probable Limnoria attack to approximately 3/16 inch was noted in five areas onthe offshore bulkhead and one area on the inshore bulkhead (Figure 28 a) from waterline down. Penetrations appeared to be in the form of spring growth of annual rings;Limnoria channels were evident.
6. The backside of both bulkheads showed signs of wear from constant rubbing againstthe pier fender system, in six areas on the offshore bulkhead and two areas on the in-shore. Bolt heads in the bulkhead were exposed by this rubbing (Figure 29).
7. There was a light encrustation of barnacles on the lower part of both floatingbulkheads.
39

4)
-0
U)
c :C3
o04
EE0)z4
0)
400
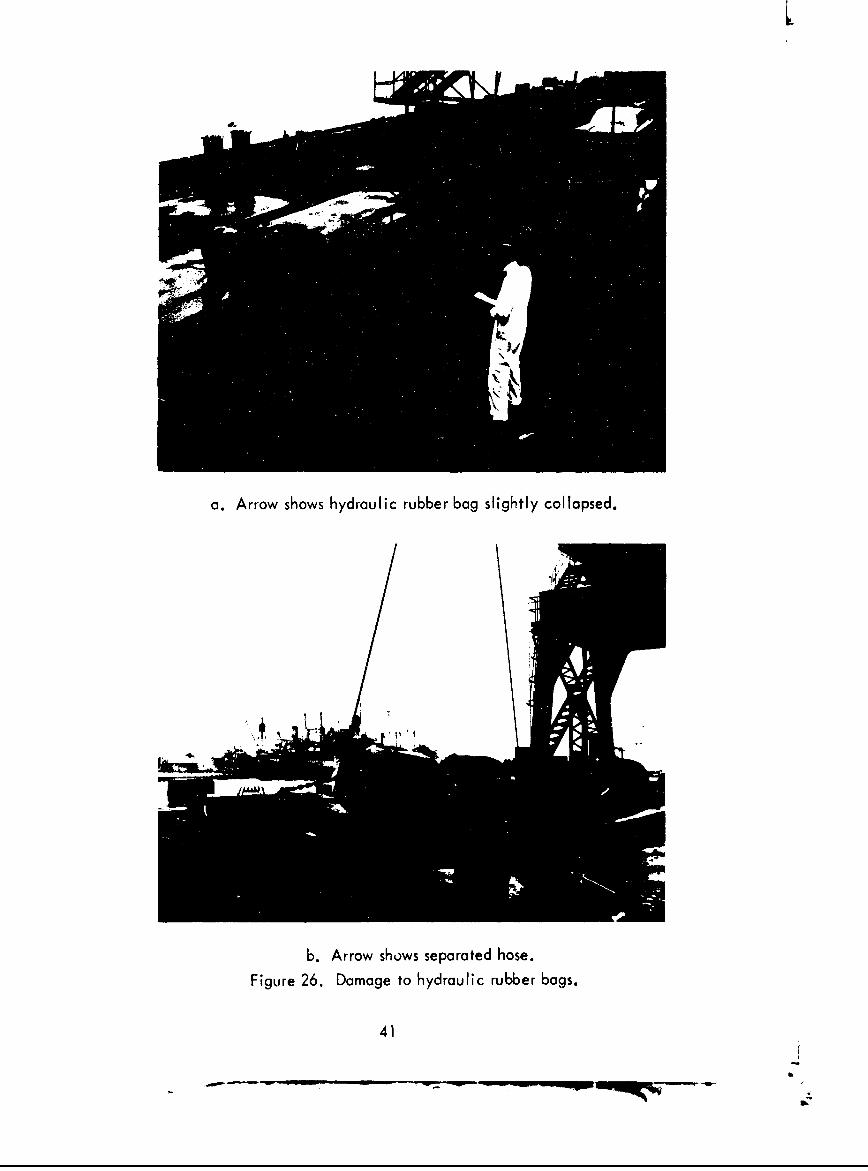
a. Arrow shows hydraulic rubber bag slightly collapsed.
b. Arrow shows separated hose.
Figure 26. Damage to hydraulic rubber bogs.
41
It Boom

a. Deteriorated hose clamps of hydraulic rubber bDag.
b. Loose shackle-pin connections.Figure 27. Defective connections of hydraulic rubber bags.
42
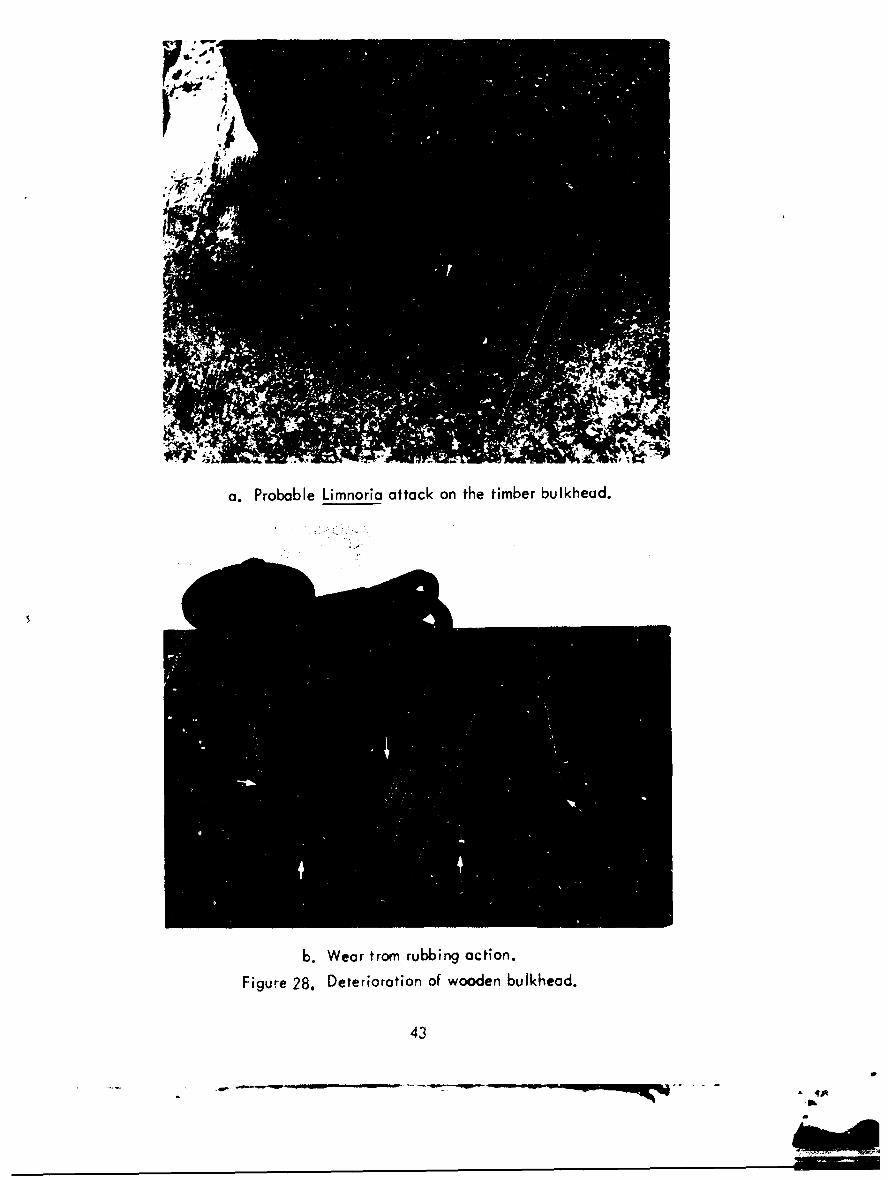
a. Probable Limnoria attack on the timber bulkhead.
b. Wear trom rubbing action.
Figure 28. Deterioration of wooden bulkhead.
43
~ =ANA
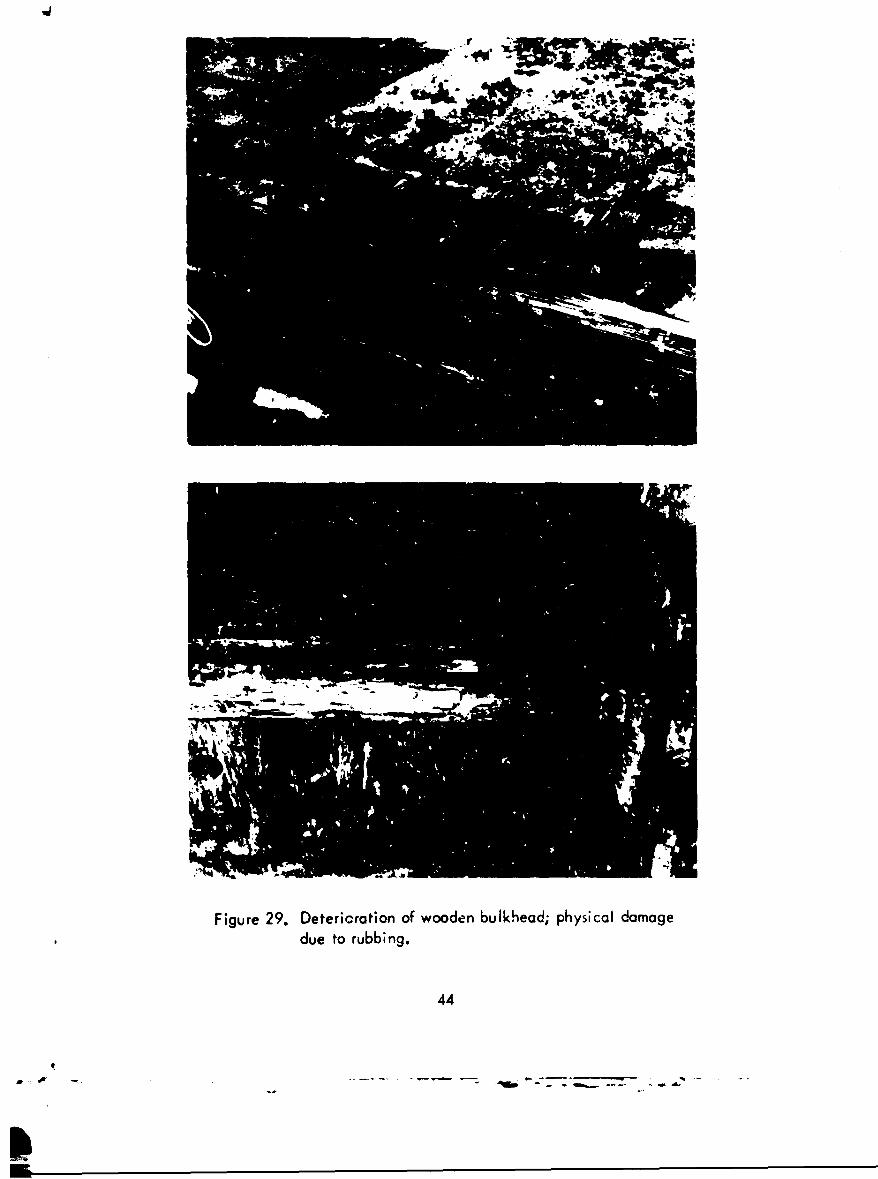
Figure 29. Detericration of wooden bulkhead; physical damagedue to rubbing.
44
w - . - __ - - - -

8. The concrete mooring weights were about 90% covered by marine algae andbarnacles (Figure 26b).
9. The mooring chains showed signs of rusting and about 40% wear at the pointwhere the chain rubs on the 4-inch steel guide pipe. This pipe was broken andflared out at the offshore end.
10. Two bolts holding the closure plate to the ballast pipe were loose. There wasrust at the base of all pad eyes where they were welded to the ballast pipe.
CONCLUSIONS
1. The fender provided satisfactory service during the 5-month test period. Theshortcomings mentioned above are not considered serious.
2. Since traffic was limited and impact loading was light, the fender was riottested to capacity.
ACK •ýOWLEDGMENTS
A number of people assisted and cooperated in the reported work:LCDR R. M. McClenahan, Port Services Officer, NCBC; C. A. Stine, MarineTerminal Division Director; and Captains R. E. Fosse and G. F. Swanson, PortPilots, ail at Port Hueneme.
Gratitude is also expressed for the help of San Diego personnel: E. J, Kiefer,K. G. Karekin, David Vosconcellos, Public Works Center; N. R. Warner, BerthingSuperintendent; and the ship captains and naval officers who furnished comments.
J. P. Cosenza, Structural Engineer of the Mechanical and Electrical EngineeringDepartment at NCEL, assisted in the inispection and evaluation of the San Diego tests.
REFERENCES
Bowman, K. M. and P. Cave (1961). Y&D Drawings nos. 946116 and 946117:Experirrmntal energy absorbing came!. Bureau of Yards ind Dock•, Washington D. C.,27 Nov. 1961.
Grant, E. J. (1965). Technical Pape, no. 301: Ship berthing and mooring. FloridaEngineering and Industrial Experimeni Stalion, University of Florida, Gainesville,Apr. 1965.
45
- . . . . . -- - :--411% I
.4

Great Britain (1961). Hydraulic Research Station. Report no. Ex-143: A modelinvestigation to determine impact forces on fenders caused by the berthing of tankers.Wallingford, England, Jan. 1961.
-(1962). Report no. Ex-181: Further model ttsts to determine impact forces onfenders during the berthing of tankers. Wallingford, England, Aug. 1962.
Lee, T. T. (1963). Technical Note N-515: Evaluation of a hydro-pneumatic floatingfender or camel. U. S. Naval Civil Engineering Laboratory, Port Hueneme, Calif.,June 1963.
-- (1965a). Technical Rsport R-334: A hydraulic-pneumatic floating fender.NCEL, Po-t Hueneme, Calif., Feb. 1965.
-- (1965b). Technical Report R-312: A study of effective fender systems forNavy piers and wharves. NCEL, Port Hueneme, Calif., Mar. 1965.
Mountcastle, A. E. (1961). "Pneumatic and unicellular fenders,' Bureau of ShipsJournal, vol. 10, no. 7, July 1961, pp. 21-23.
Risselada, T. J. and J. P. A. van Lookeren Campagne (1964). Report on ConttactN-62558-4054 for the U. S. Naval Civil Eng'neering Laboratory: Report on theeffective fender systems in European countries. Rotterdam, The Netherlands,May 1964. (Unpublished manuscript on file at NCEL.)
Saurin, B. F. (1963). "Berthing forces of large tankers," in 6th World PetroleumConference, Proceedings, Frankfurt am Main, Germany, June 1963, Section VII,Paper 10.
Vasco Costa, F. (1964). "The berthing sh;p," Dock and Harbour Authority, vol. 45,no. 523, pp. 22-26; no. 524, pp. A9-52; no. 525, pp. 90-94, May, June, July 1964.
46
wow X
APPENDIX A
MEASUREMENTS OF BERTHING SHIPS AT PORT HUENEME HARBOR
NOTE: See NCEL Technical Report R-334 'Lee, 1965a) for
load deflection and energy-absorption characteristics of thetested hydraulic-pneumatic floating fenders during berthing of
LiSNS General W.tiom Mitchell, USNS General Breckinridge,
and USNS Choales H. Davis.
47
40 _ _ _ _ __ _
3---
.00.
000
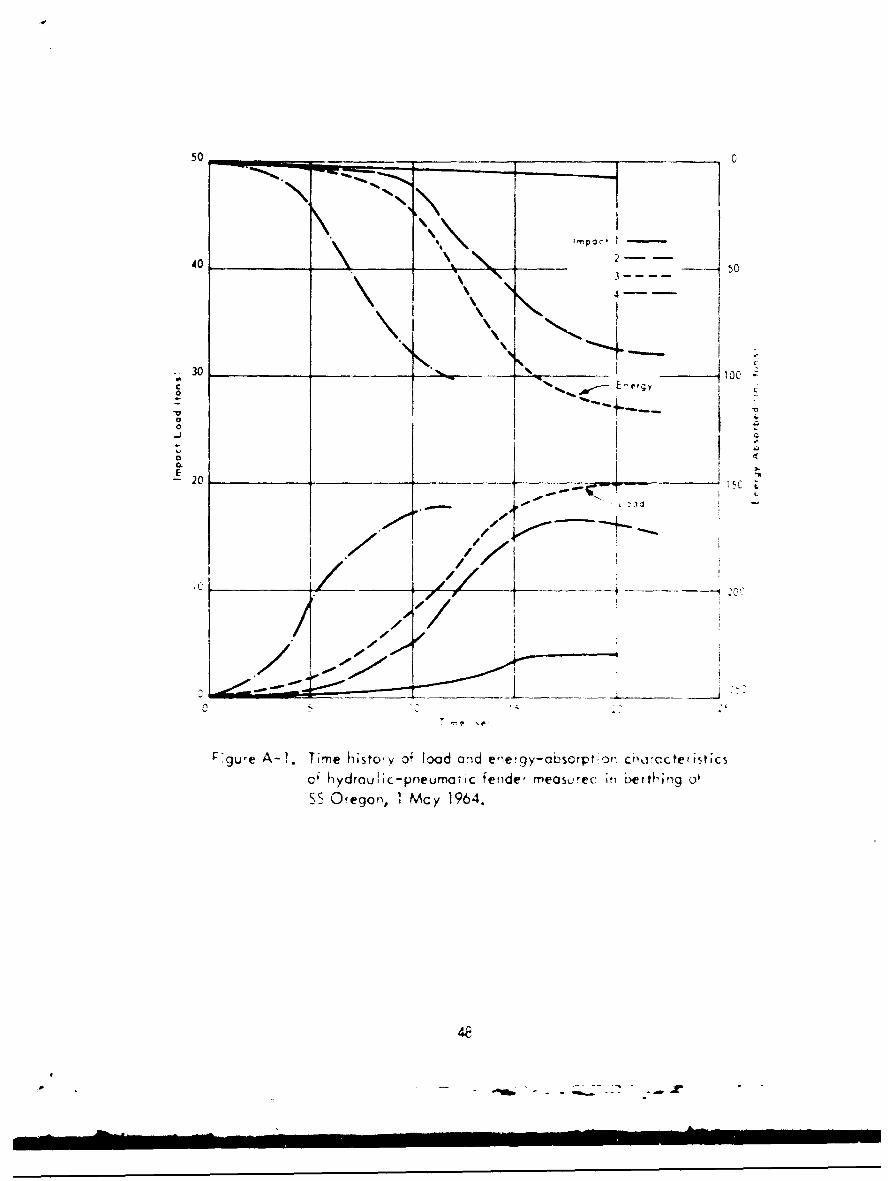
rgu,-e A - T I-me histoi v of foad wid energy-absorptrio ciluIoctef~sisfcs
&ý kydraulic-pneumaric fende! measurec In i-ervit'ig o'
SS Oregon', I Mcy 1964.
4:
50 0________ ___ _____
I4tc so
3--
10
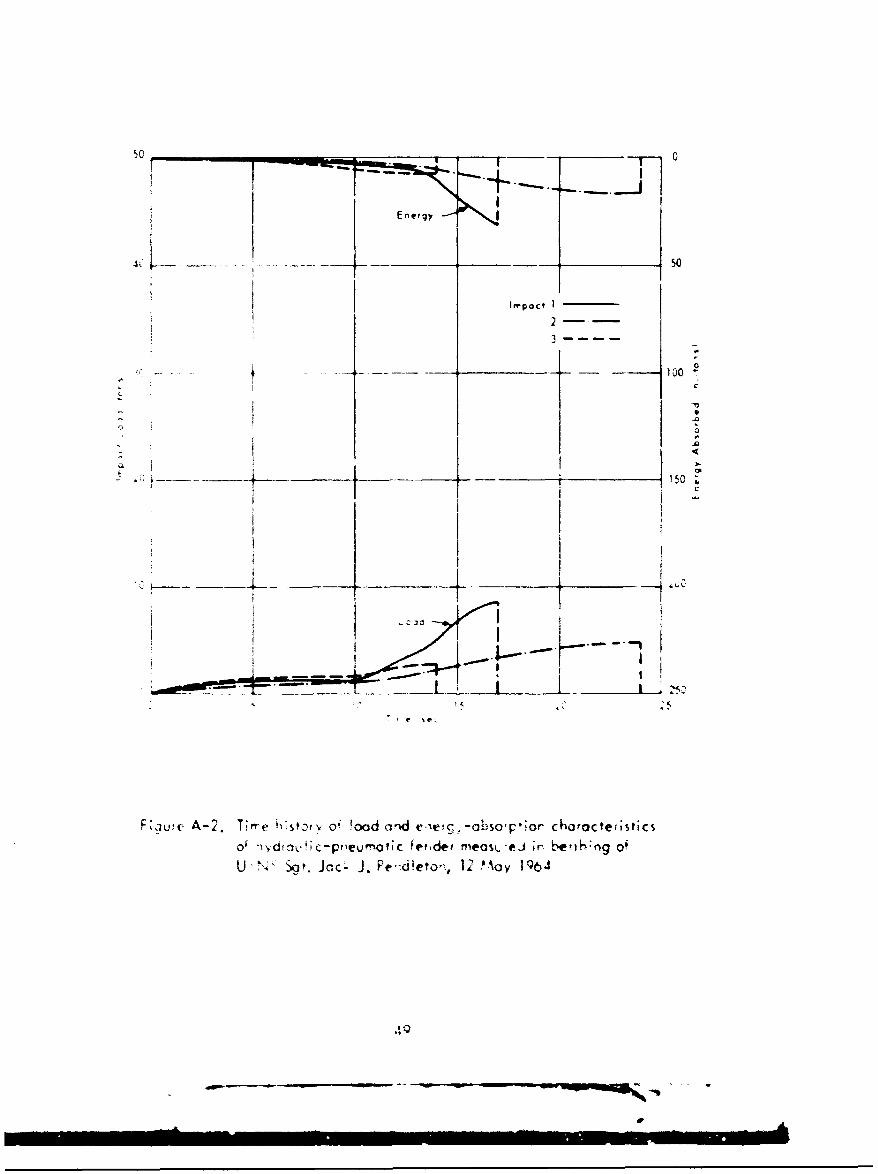
Fcaurc A-2. T~r're I-S-tvr 0' !ood ,id e-"cci -tsp!r charocter;st'c
o;"' dtinv!)-pi'eunatic fei~der meosi--eJ ;r 1 Yi6nqo
U >'Sov J ac.; J. P r-ci1e t o', 1 M-ay1

50 0
Energy •
40 50
0
30 100
0 0
UL
10 00
L- 20 150
10 520
Load
I ,0I j 2 5 0
05 10 15 20
Time (sec)
Figure A-3. Time history of load and energy-absorption characteristicsof hydraulic-pneumatic fender measured in berthing ofSS Hong Kong Bear, 28 April 1964.
50
70 0
60 50
50 100
40 .... _150 r0
C .-
0
U O~
o
-3U 200Cw
20 4 - o_
10 300
0 •3500 5 10 15 20
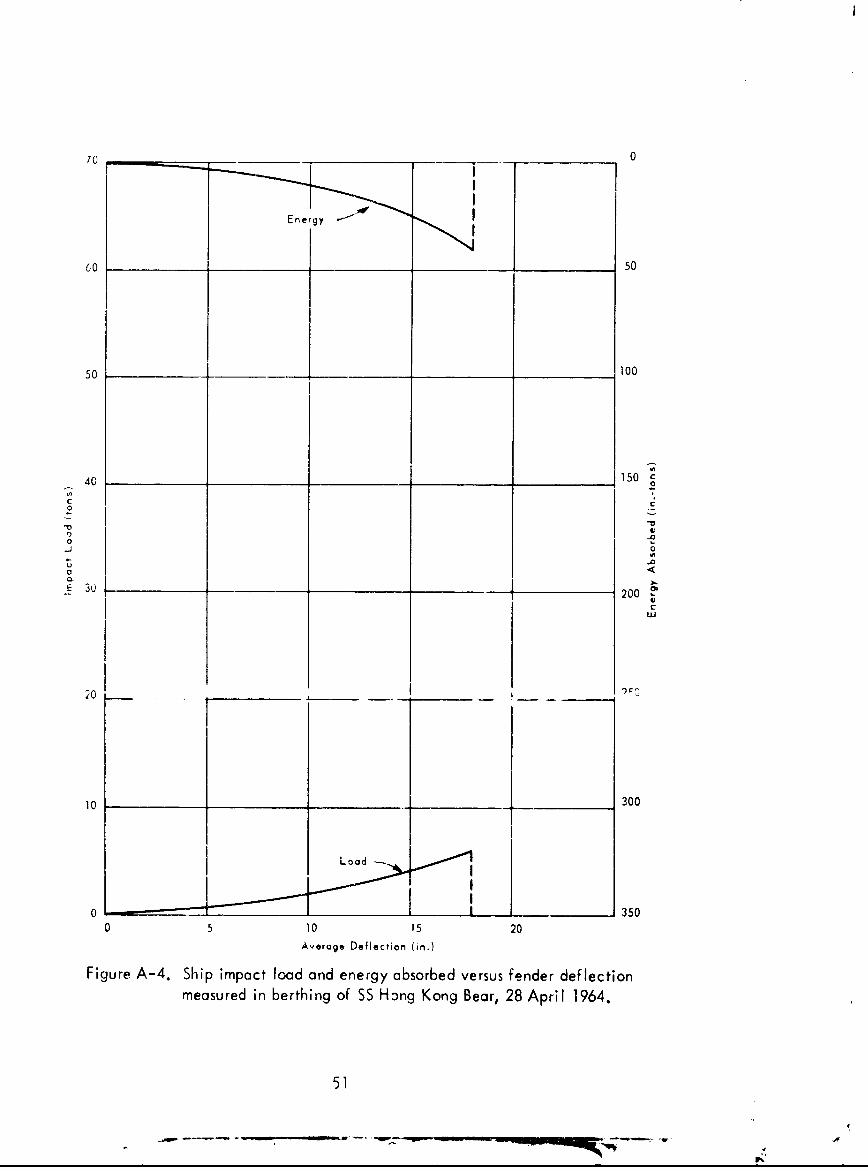
Average Deflection (in.)
Figure A-4. Ship impact load and energy absorbed versus fender deflectionmeasured in berthing of SS Hang Kong Bear, 28 April 1964.
51
- - ~..
60
50
40
0
c30
wuJ
20 __ _ _ _ ___ _ _ _ _
10 _________ _ _ _
10
0 10 20 36Deflect,on ',n.
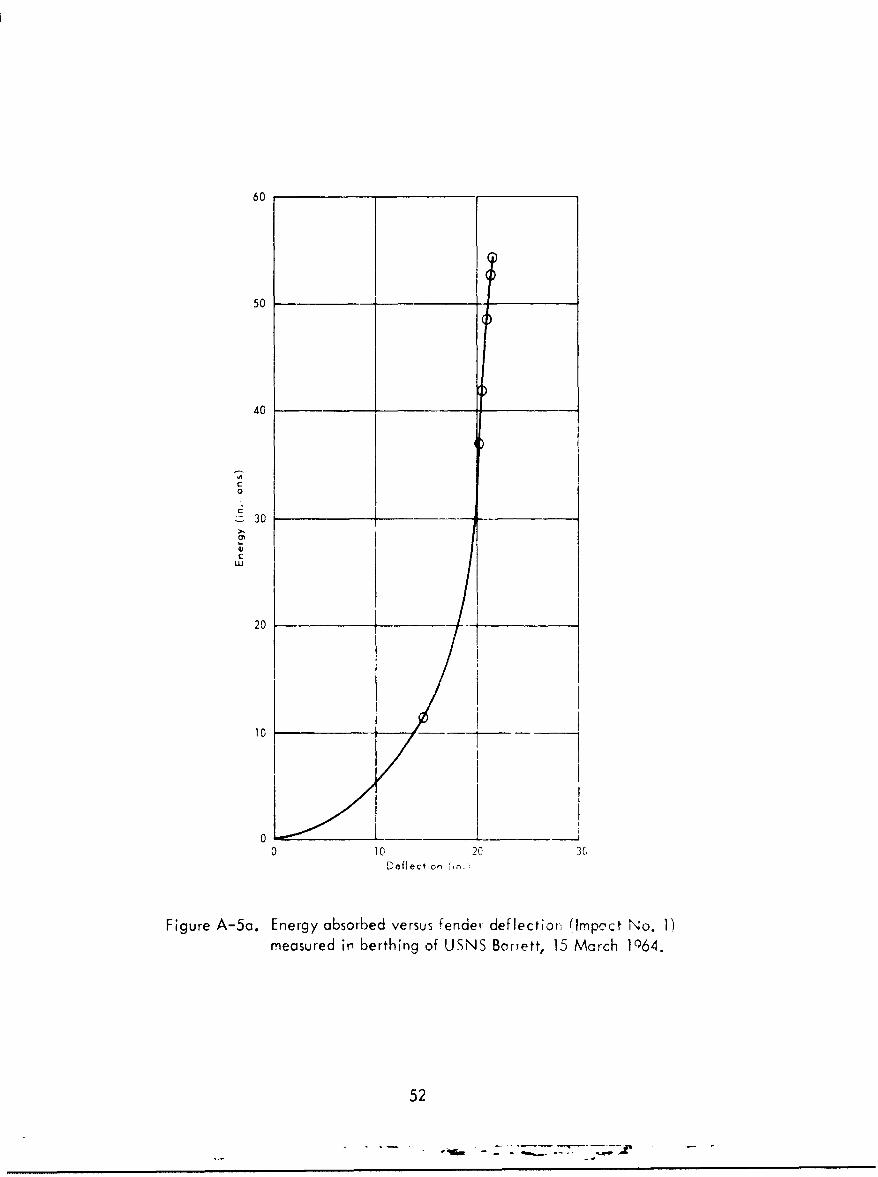
Figure A-5a. Energy absorbed versus fender deflection (Irpcct No. 1)measured in berthing of USNS Barrett, 15 March 1Q64.
52

2C
10 3
Figure A-5b. Ship ir'ipaori ioad veisus "e'-ice i' -lectiolr dmpoct No. I'measured in coerthing of USN-- S-ýrrett, 15 March 1964.
211 F/
-te
Fiu(-S i i p c la eru lm, -ýp c N l-n ojrd i
C le:1. fU NSB ret 9 '
A53
60
50
40
C
C
S30C:
Uj
20 -_
-oL__ _ __ _ _
00 10 15
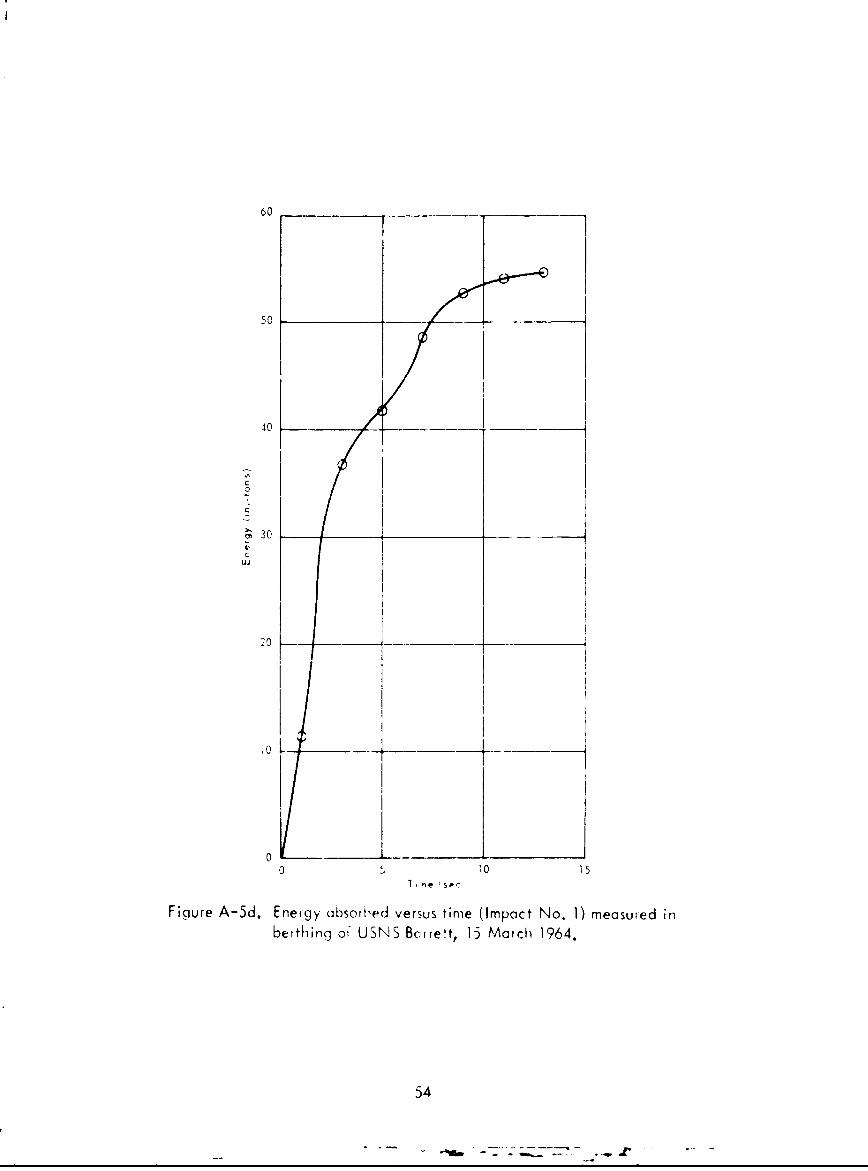
Figure A-5d. Energy ubsoi,[ed versus time (Impact No. 1) measured inberthing or USNS BcoreHt, 15 March 1964.
54
~X
1 00 '
S.50
0 2Q05 10 15 20
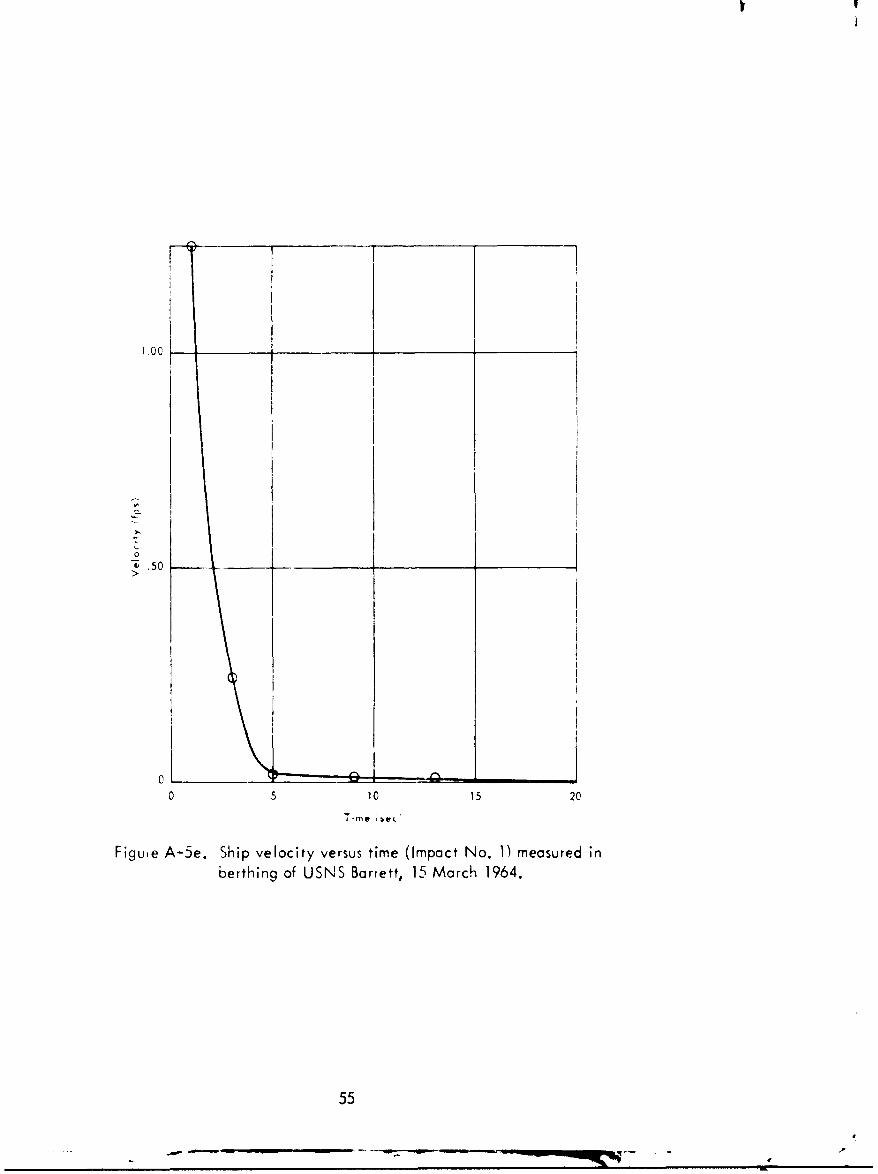
Figue A-5e. Ship velocity versus time (Impact No. 1) measured inberthing of USNS Barrett, 15 March 1964.
55

10
0
Uo-J
0 10 20 30
Deflection (in,)
Figure A-6a. Ship impact load versus fender dcflection (Impact No. 2)measured in berthing of USNS Barrett, 15 March 1964.
20
10
0'
0 10 20 30
Figure A-6b. Energy absorbed versus fender deflection (Impact No. 2)measured in berthing of USNS Barrett, 15 March 1964.
0
0 5 10 20Tim~e secý
Figure A-6c. Ship impact load versus time (Impact No. 2) measured inberthing of U'SNS Barrett, 15 March 10r64.
56

2C
10
05 10 15 20
Time 'sec)
Figure A-6d. Energy absorbed versus time (Impact No. 2) measured inberthing of USNS Barrett, 15 March 1964.
0
0 5 10 15 20
Figure A-6e. Ship velocity normal to dock versus time (Impact No. 2)mensuied in berthing of USNS Barrett, 15 March 1964.
57
o 10
20
Ct
i3
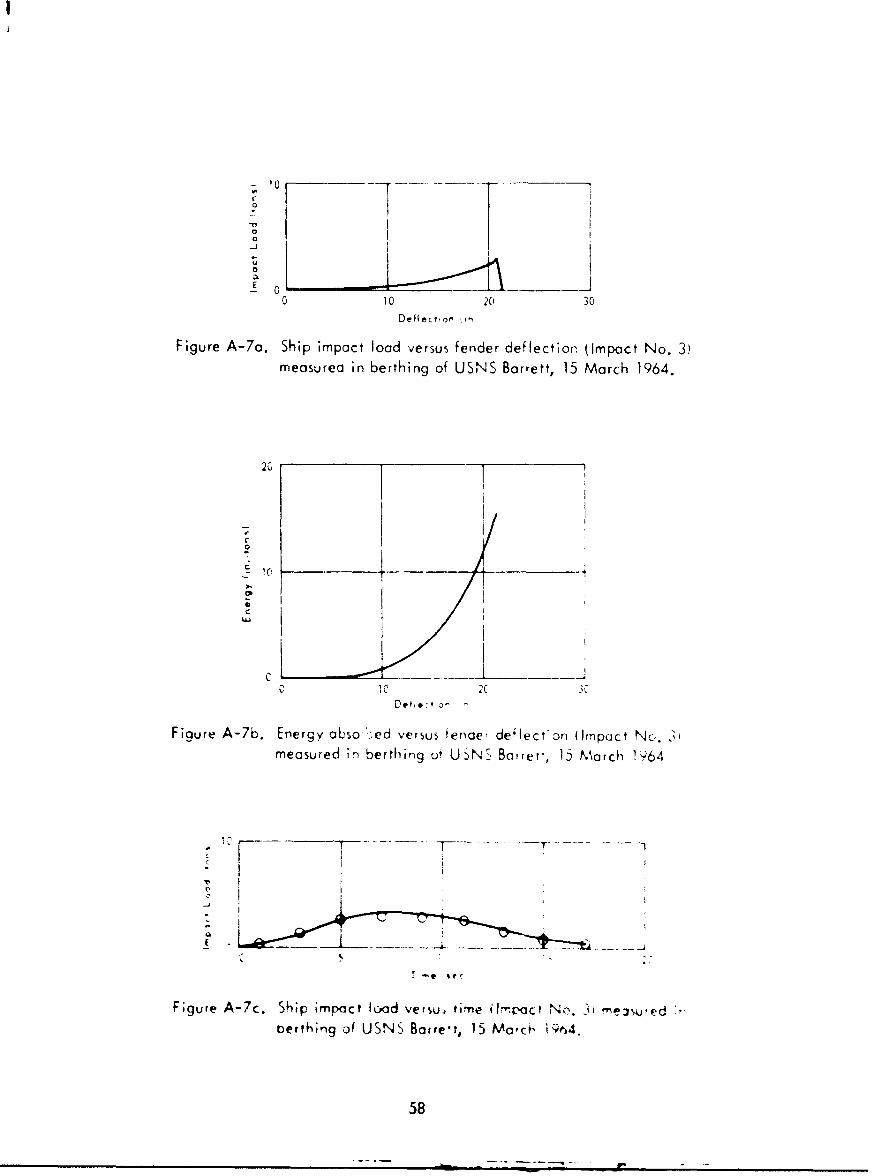
Figure A-7a. Sherg imact load versus fender dleflection Ormpact Noý. 3,measurea in berthing of USINS Barrett, 15 March 19614.
2101
0
- 11 T- -T-
C
Figure A-7b. Energy abso loed versus tender deriecf on (Io.poct Noi. 2measured Hn berthing o'• U.•NS Bonre', 1,5 March 1964
I -
F;gure A-7c. Ship impactlfoad ,.ersus, time il'mpact No. )k'en ueberthing of USNS Barre't, 15 Ma'c' i9s4.
58
20
0 5 10 15 20
Time (sec)
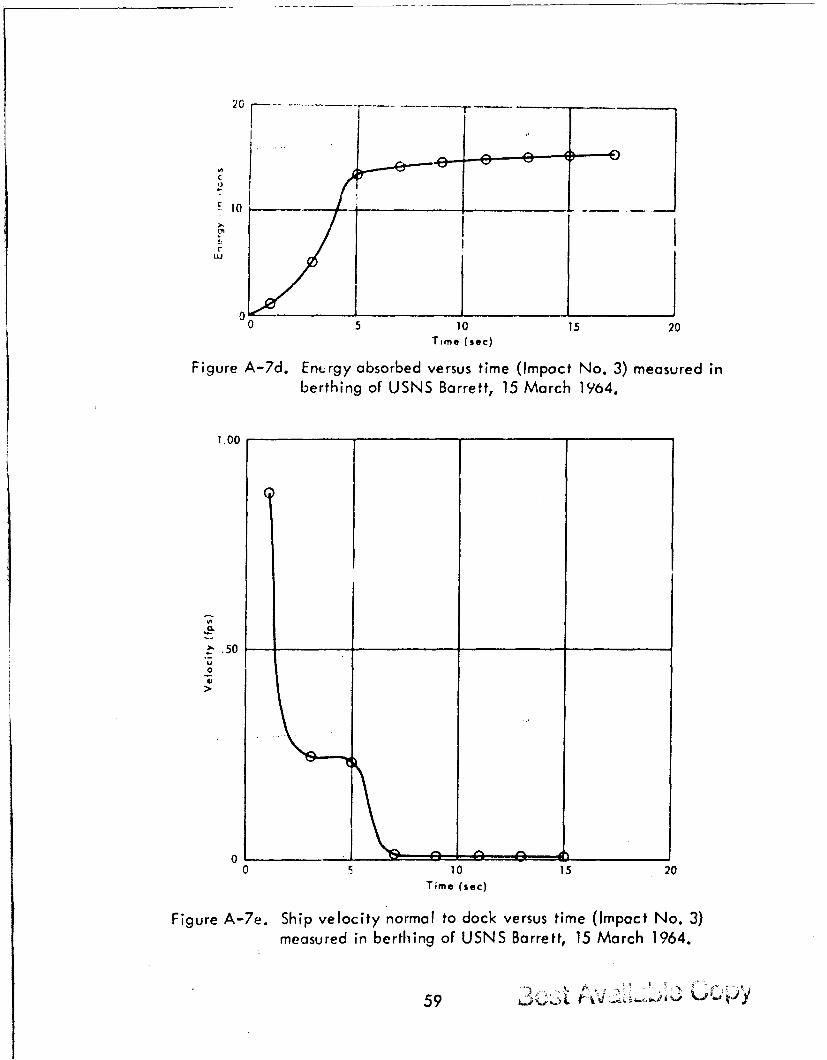
Figure A-7d. Entrgy absorbed versus time (Impact No. 3) measured inberthing of USNS Barrett, 15 March 1964.
1.00 1
a.
• .50
0
0 5 10 15 20Time (see)
Figure A-7e. Ship velocity normal to dock versus time (Impact No. 3)measured in berthing of USNS Barrett, 15 March 1964.
59i~.
20 oFender -
2
3
415 ........
"Impoct 3t-0
, -- 12.3 tons
0
° ~/(
1 5 _E /
;mpact1 0
1", .•1.6 tons
0.8 tons
1•9tons
0 LS/ /
S15
/0 t- s7
o /
o /6, ,
5 5.3 ton !. on
Su - t - --- 1 tn
0
0 50-5 1" - 2ý. Ron,
0 Defle -ton (on.
.,rpopec I
0
-. 6." ton'C ... ... /• "'/ - 5.3,to,.
0 j 105 10 ilL 20 3Deflection (in.)
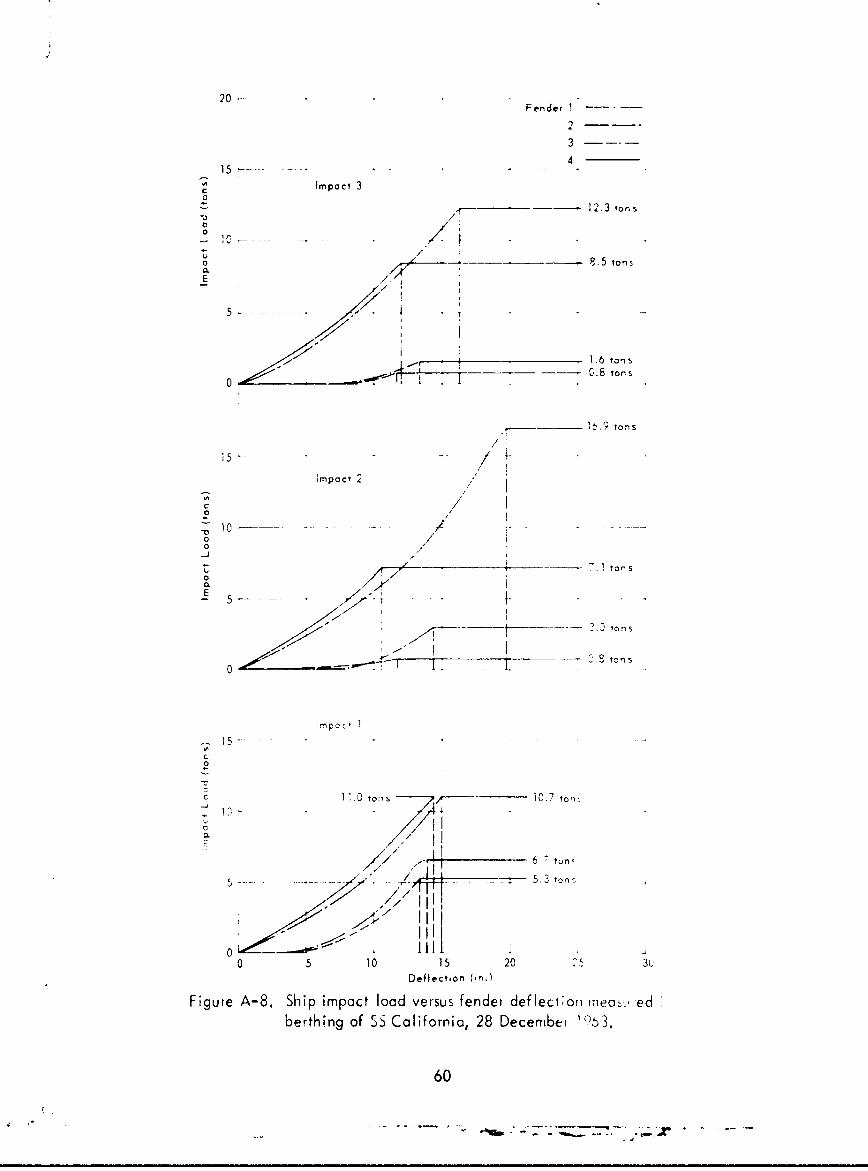
Figure A-8. Ship impact load versus fender deflect~on mea•,, edberthing of SS Californio, 28 Decernbei 1%53.
60
70
60 __50
Energy -
50 _______ 100
S40 ,l150 o
000
40 Impact i I v__ _ _ _ _ _ _ _ _ _ 5
o
1 0 300
UU
10 300
.uJ
05 10 15 20 25
Average Deflection (in.)
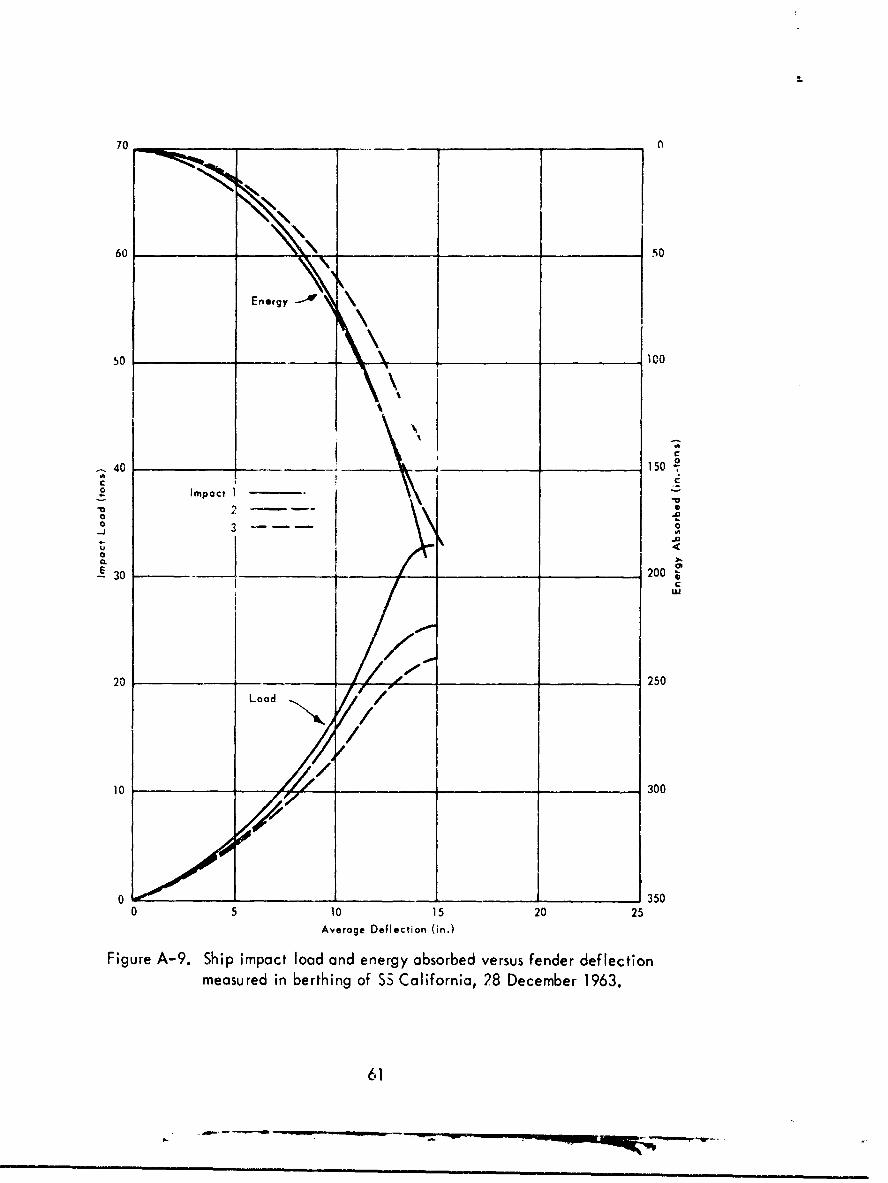
Figure A-9. Ship impact load and energy absorbed versus fender deflectionmeasured in berthing of 05 California, 28 December 1963.
61
(suoa-us) paqiosqy Abjeu3
II~ 04 (N
4I-U
C4~I M 4-
- I-
I~ cc
0)
C)),Q )
E EQ
04
C;
Ln
00
U, (n ~ (4
(suoFI pDoo- podtu,
62

'0
0
10
LO
c
0
C4 4
-u
(suoi)~ po- 4ow
63~
Oo o

1
6 _ _ _ _0
5 5
Energy
0
C"-O -•
S3 1.5 o
U /0
_E U5Loa
2 20
1 -_______ 25
0 300 1 2 3 5 6
Average Deflection (in.)
Figure A-12. Ship impact load and energy absorbed versus Fender deflectionmeasured in berthing of SS Guam Bear, 4 January 1964.
64
to-
-IIl I ~ - ~ 7 ~ >

6 l0
r"r
5 15
Eneorgy
4 ________ _______ _______10
C
0 3 15
2-j
2 0
033
Time (sec)
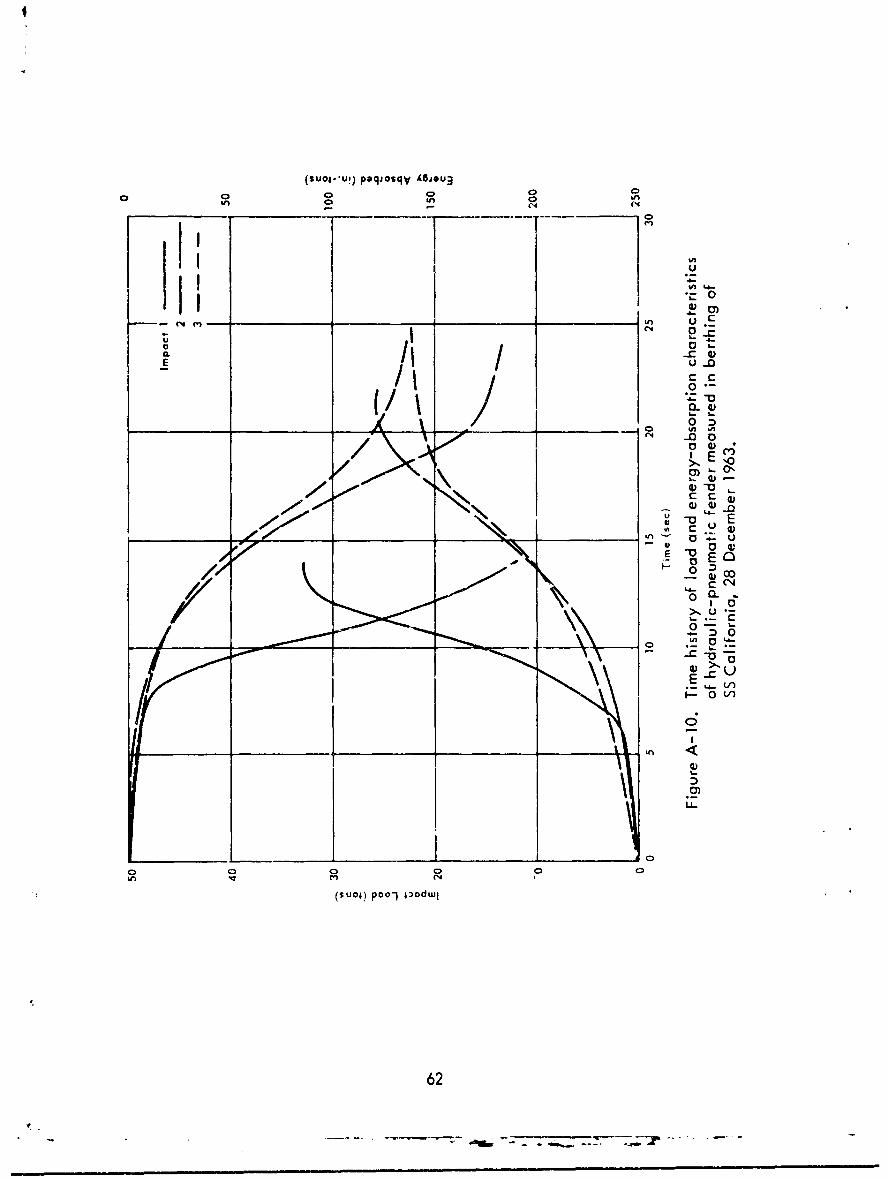
Figure A-13. Time history of load and energy absorption characteristics
of hydraulIi c- pneumatic fender measured in berthing of
SS Guam Bear, 4 January 1964.
65
oiai
E cI~S
APPENDIX B
MEASUREMENTS OF BERTHING SHIPS AT PORT HUENEME HARBOR
46
66
V
0.50
/ parallel to dock
0.00 _ _.....
\ I
oI
I nomal to dock
-0 .50_ - _\ I
-I O0
-1 000 10 20 30 40 50
Tom* (sec)
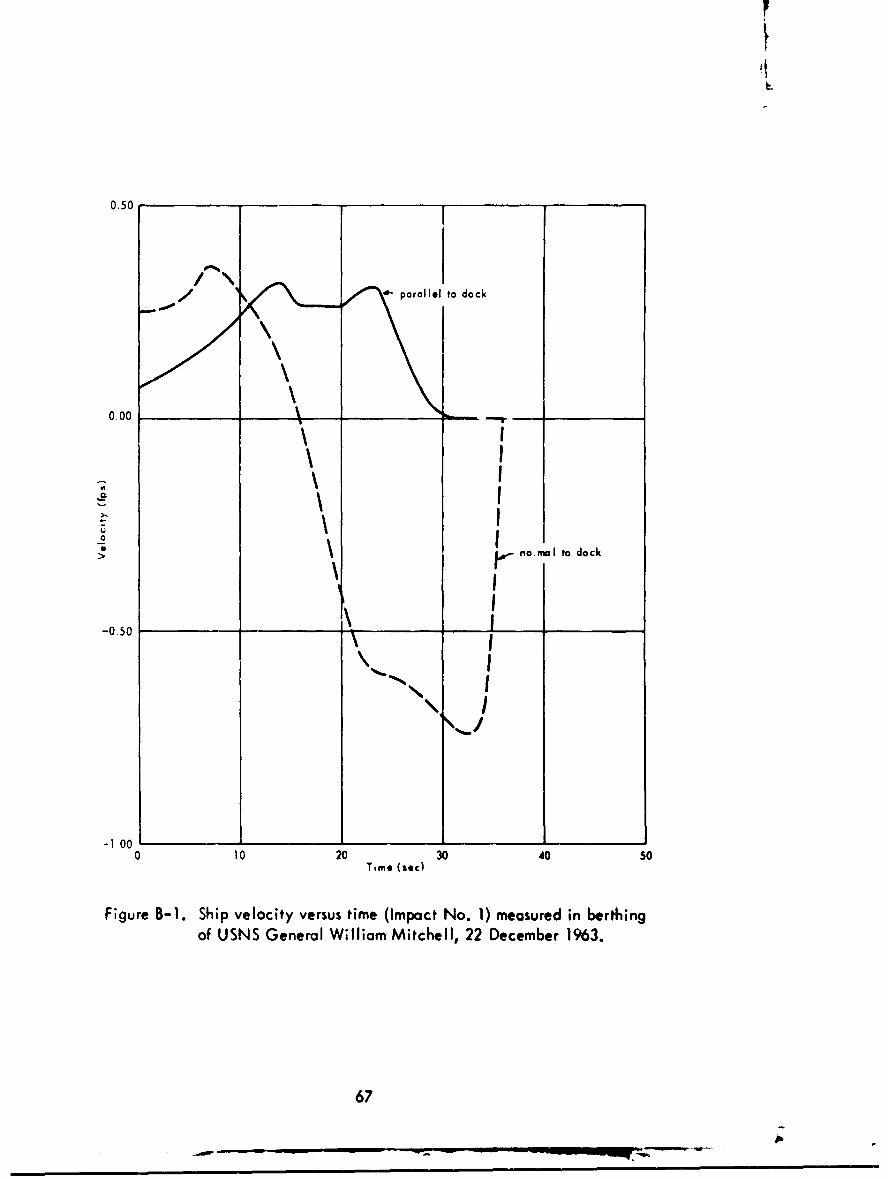
Figure B-1. Ship velocity versus time (Impact No. 1) measured in berthingof USNS General William Mitchell, 22 December 1%3.
67
mp
Y
1.00
0.50parallel to dock
U0
0.00 N I
"ormal to dock
-0.500 I 20 30 40 50Time Isec)
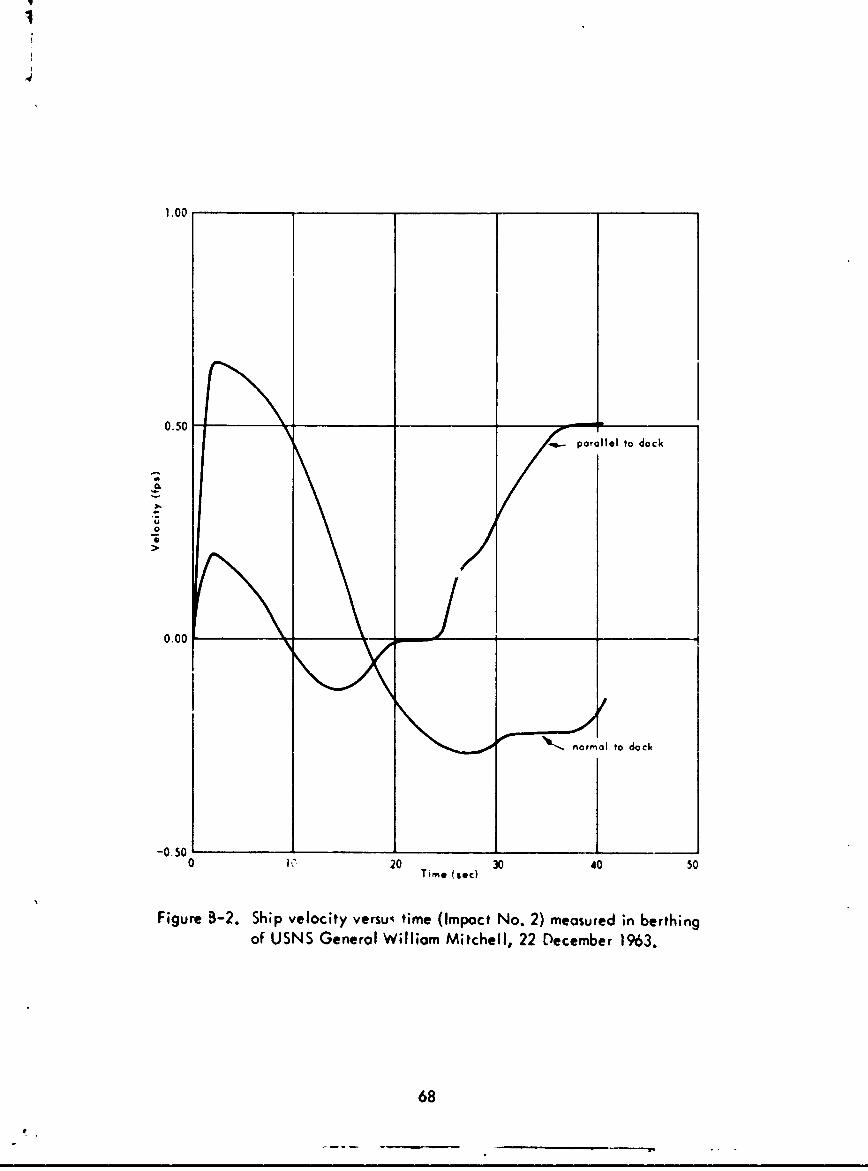
Figure B-2. Ship velocity versu5 time (Impact No. 2) measured in berthingof USNS General William Mitchell, 22 December 1963.
68
#
1.00-- _ _ _ _ _ _
0.50
-Parallel to dock
o 00 _______
~- normalto u
5C 3 5
T.-P .
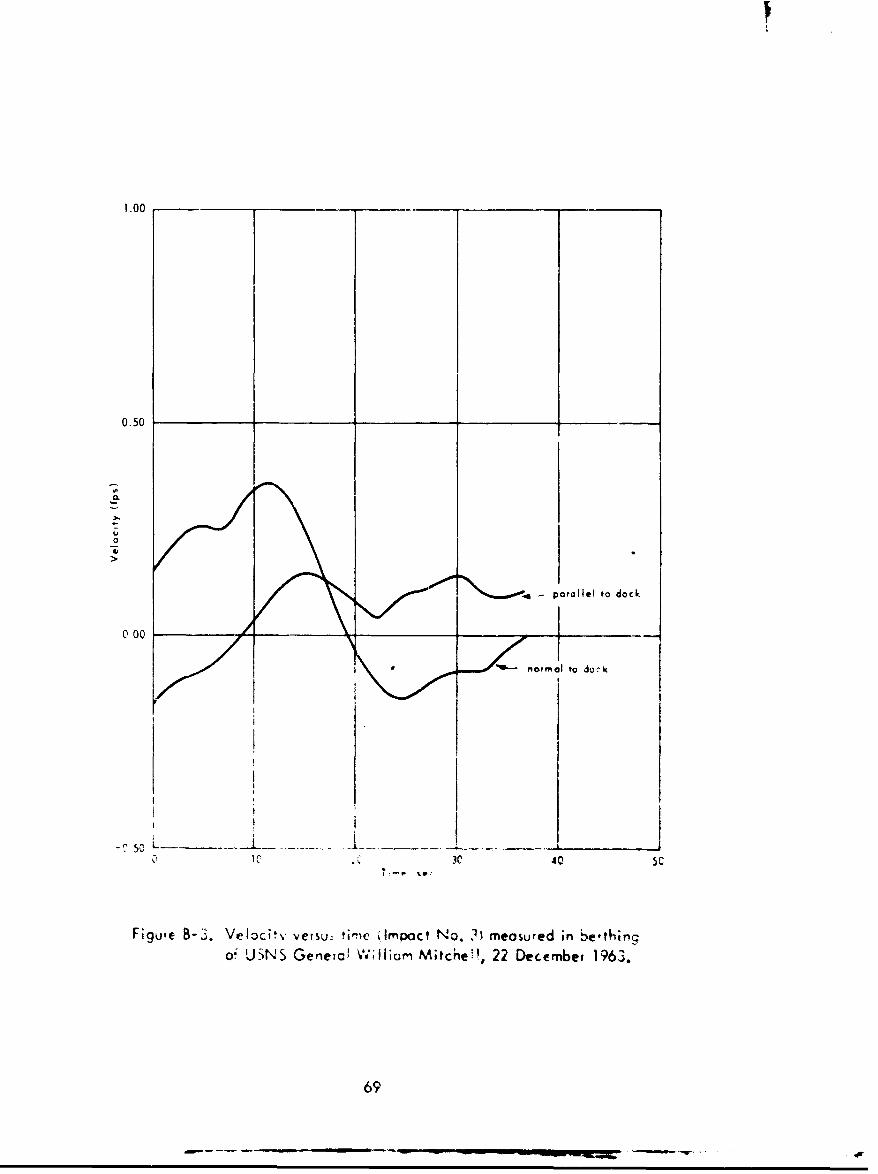
F;gu'e B-.3~. Veloci-v veisuý tir'ic ;Impact No. ?measured in be'thing0& 'JNS Geneic! Wilhom Mitcheý!, 22 December 1963.
69
1.00
0.50
Z
$
"parallel to dock
0.00 Uk0
n~s~ t o alck
-0 S 100 t0 10 40 50T.m. i ,(
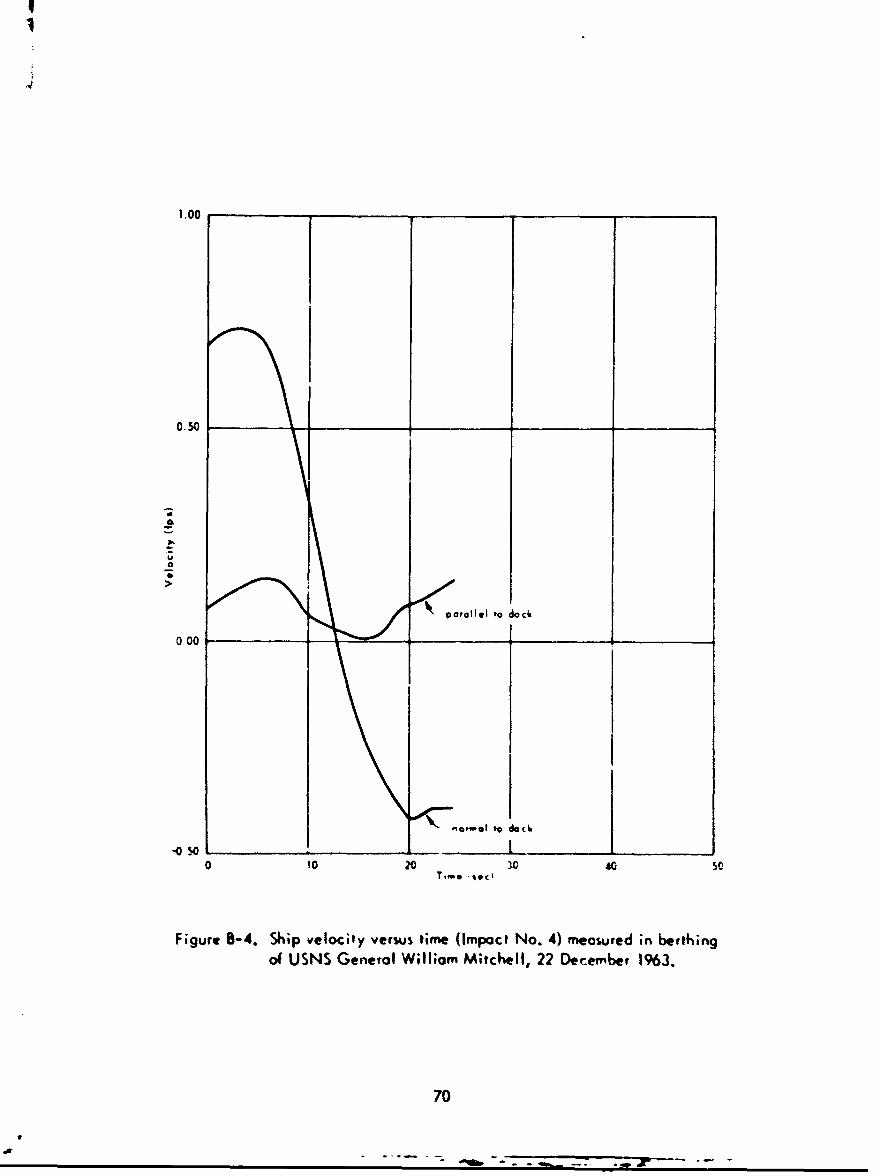
Figure B-4. Ship velocity versus time (Impact No. 4) measured in berthing
of USNS General William Mitchell, 22 December 1963.
70
'"o j r:: - -7 -

F
1.00
0.50 t
0.00
MormoI to dPc6
povoltel 'a do,:
-050 s0 10 20 30 40 so
Figure B-5. Ship velocity versus ,me (Impact No. 5) measured in beilhingof USNS General Willianm Mitchell, 22 December 1963.
71

1.00
0.50
0
normal to dock
-- parallel to dock
-0.500 10 20 30 40 50
Time (sec)
Figure B-6. Ship velocity versus time (Impoct No. 6) measured in berthingof USNS General William Mitchell, 22 December 1963.
72

I
1.00
0.50
0.
0.00parallel to dock
normal to dock
--0 50 10 10 20 30 40 50Time (sec)
Figure B-7. Ship velocity versus time (Impact No. 7) measured in berthingof USNS General William Mitchell, 22 December 1963.
73

1.00
Pparollel to dock
0.00
•normal to dock
-1.00
-2.00
0 10 20 30 40 50Time (sec)
Figure B-8. Ship velocity versus time (Impact No. 1) measured inberthing of SS Oregon, 1 May 1964.
74
1.00
0.00
.- parallel to dock
normal to dock
C.
10 0
-2.00
0 10 20 30 40 50Time (sec)
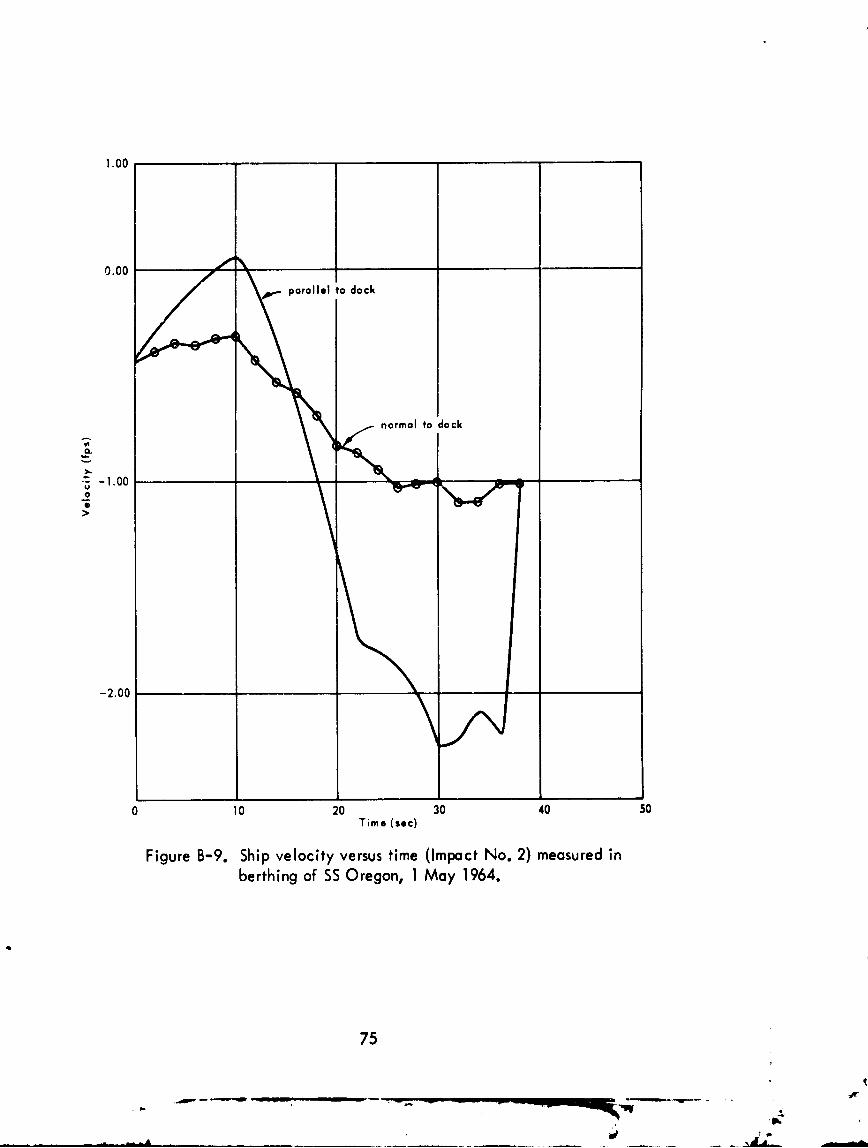
Figure B-9. Ship velocity versus time (Impact No. 2) measured inberthing of SS Oregon, 1 May 1964.
75
,-'.- "-"W

1.00
or, parallel to dock
0.00 d 0
normal to dock
-1.00
0 10 20 30 40 50Time (sec)
Figure B-10. Ship velocity versus time (Impact No. 3) measuled inberthing of SS Oregon, 1 May 1964.
76
-I V
1.00 parallel to doc .c
normal to dock
S0.00
*i
I
-1.00
0 10 20 30 40 50
lime (see)
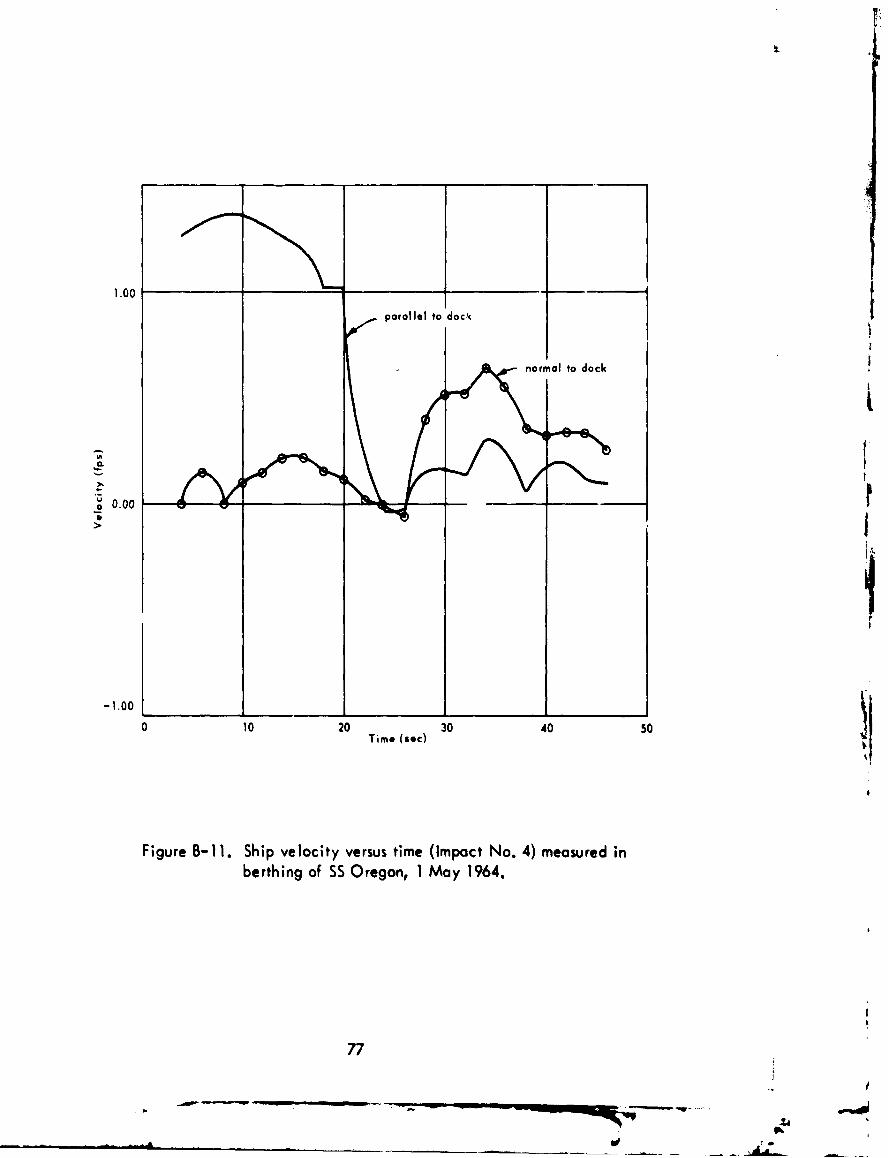
Figure B-1]. Ship velocity versus time (Impact No. 4) measured inberthing of SS Oregon, I May 1964.
77
UnclassifiedSe-urity Classification
DOCUMENT CONTROL DATA- R&D(Security classillcation of title, body of abstract and indexing annotation must be entered when the overall report to classifed)
I ORIGINATING ACTIVI'Y (Corporate author) 20 REPORT SECURITY C LASSIFICATION
U. S. Naval Civil Engineering Laboratory Unclassified
Port Hueneme, California 93041 2b GNOp
3 REPORT TITLE
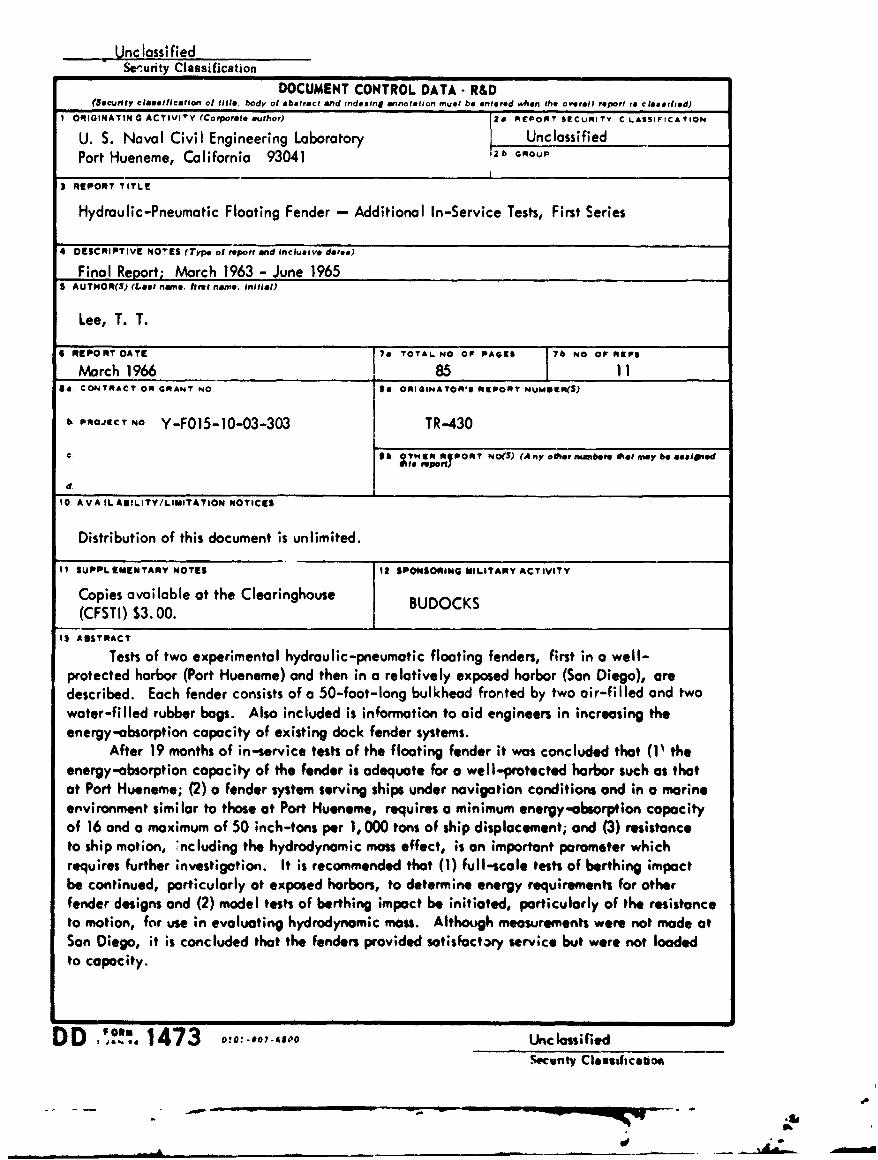
Hydraulic-Pneumatic Floating Fender - Additional In-Service Tests, First Series
4 DESCRIPTIVE NOTES (Type of report and Inclusive dates)
Final Report; March 1963 - June 19655 AUTHOR(S) (Last nate, first name, initial)
Lee, T. T.
6 REPORT DATE 70 TOTAL NO OF PAGES 76. NO OP REPS
March 1966 85] 11441. CONTRACT OR GRANT NO, 90. ORIGINATORNU REPORT NUMEIIIR(S)
b, PROJECT NO Y-F015-10-03-303 TR-430
CM SbeaortPORT NO(S) (Any other nuibere lhat may be seseiotd
d.
10 AVA ILAS!LITY/LIMITATION NOTICES
Distribution of this document is unlimited.
II SUPPLEMENTARY NOTES I2 SPONSORING MILITARY ACTIVITY
Copies available at the Clearinghouse BUDOCKS(CFSTI) $3.00.
13 ABSTRACT
Tests of two experimental hydraulic-pneumatic floating fenders, first in a well-protected harbor (Port Hueneme) and then in a relatively exposed harbor (San Diego), aredescribed. Each fender consists of a 50-foot-long bulkhead fronted by two air-filled and twowater-filled rubber bags. Also included is information to aid engineers in increasing the
energy-absorption capacity of existing dock fender systems.After 19 months of in-service tests of the floating fender it was concluded that (1' the
energy-absorption capacity of the fender is adequate for a well-protected harbor such as thatat Port Hueneme; (2) a fender system serving ships under navigation conditions and in a marineenvironment similar to those at Port Hueneme, requires a minimum energy-absorption capacityof 16 and a maximum of 50 inch-tons per 1, 000 tons of ship displacement; and (3) resistanceto ship motion, including the hydrodynamic mass effect, is an important parameter whichrequires further investigation. It is recommended that (1) full-scale tests of berthing impactbe continued, particularly at exposed harbors, to determine energy requirements for otherfender designs and (2) model tests of berthing impact be initiated, particularly of the resistanceto motion, for use in evaluating hydrodynamic mass. Although measurements were not made atSon Diego, it is concluded that the fenders provided satisfactory service but were not loadedto capacity.
DD ° 1473 II I I I lI I,.UnclassifiedS.'c n ty Clessaf~cabon.
S. . . . ' ..I-a • I - - I I I L ... ,, .4 '

Urnclassified___Security Classification
14LINK A LINK 8 LINK CKEY VIOROS ~L
Buffers Hydrodynamic moassFenders DisplocernentCamelIsHydraul~c-penumaticFooioangAbsorptionEnergyDamagePiersShipsWharves
Motion resistance- -
I NSTRUCTIONS1,ORIGINATING ACTIVITY. Enter the name and address imposed by security classification. using standard statements
or the contracto)r. subcontractor, Krantee, Department of De- such as:tense at tiv it y or other organie'atinn (corPorit' dtuthror) Issuing (1) "Qualified requesters may obtain t opies of thisthe report. report from DDC. t2a. REPORT SECURITY CLASSIFICATION; I--nter the over- (2) "Foreign announcement and dissemination of thisall security classifiscat ion of the report. Indicate whether rpr yDCi.ntatoie."Restricted Date" is includedl. Marking in to be in aceorcyord- otathrze.
ance with appropriate security rekulations. (3) -U. S. Government agencies may obtain copies ofthis report directly from DDC. Other qualified DDC2h. GROUP: Automatic downgrading is specified in DoD Di- users shall request through
rective 5.100. 10 and Armed Force% Industrial Manual. Enrtertt he group nurpber Also. w'hen applicabile, show that optionalmarkings have beeri used for Grouup I and Group 4 d% auithor- (4) "U. S. military agencies may obtain copies of thisized report directly from DDC. Other qualified users3. REPORT TITLE: Enter the complete report title in all shall request throughcapital letters. Titles in all cases should he unclassified.If a meaningful title cannot he selected without classifica-tion, show title clsissificstitun in all capitals in parenthesis (5) "All distribution of this report is controlled. Qual-immediately following the title, fied DDC users shall request through
4. DE-SCRIPTIVE NOTES: If appropriate,. enter the tyfpe of ___________________1________
report. e.g.. interim. progress. %uirmmiry, annual, or fin~al. If the report has been furnished to the Office of TechnicalGlive the mitltisive date-% when it sp.'cisit reporting period isi Services, Department of Commerce, for sale to the public. indi.covered. cate this fact and enter the price, if known.%. AUTIIC)RtS). Enter the name(s) of author(s) as shown on 11 SUPPLEMENTARY NOTES: Use for additional explana-or in the. rep.'rt. Fntei last na.me, first name, middle initial. tory [not es.
If ilitaury, show rank ioil tii ,nc-h of service. rhe name ofthe I'rin, ipal aupthor -' on .etoeoluie ntinimumn requirement. 12. SPON9ORING MILITARY ACTIVITY: Enter the name of
the departmental project office or laboratory sponsoring (par-ft. REPORT DATE'. Enter the date '4 the report :is day, ing, for) the research and development. Include address.month. year. or month. year. If mon', than tine dot~e appearson the report. us, date of publication. 13 AB3STRACT: Enter an abstract giving a brief and factual
siummary of the document indicative of the report, even though7 o TIOTAL NUMHER OF PAGE;PS The total pag~e count ~ t may also appear elsewhere in the body of the technical re-should foillo~w normal poagination proi etutess. i.e., enter the port. If additional space is required. a continuation sheet shallntimter of pafe's containing Information, he it~tached.71, NUMliERt 0F REFEHFRNCFvS~ Enter the' total number of It is highly destirable that the abstract of classified reportsref,.re'n, v% culed in the report. fbe unclassified. Each paragraph of the abstract shall end withNae CONTRA(Tr OR GRANT N1UMIIR: If appropripte, enter jan indication of the military security clas.sification of the in-the' tipIlh auble number of 'he- ciintract or grran! tinder which formation in the paragraph, represented as (Ts). (5). (C). or (ti)the repi rt was written. There is no limitation on the length of the abstract. How-8h. ft & 84. PROJECT NUMBER: Enter the appropriate ever, the suggested length is from I1SO to 225 words.niletary department Identification, such as project number, 4KYWRS e od r tcnclymaigu emsubpriiject numbler. system numbers, task number. etc. 1 E OD:Kywrsaetcnclymaigu em
or short phrases that characterize a report and may be used as4a. ORIGINATOR'S REPORT NUMtBER(5): Enter the offi-. index entries for cataloging the report. Key words must beciial repart number hy which the document will be identified -.elected so that no security classification is required. Identi -and cicntrollec! li the originating a ctivity. This number must fiers. such as equipment model designation, trade name, militarybe unique. to this report. project code name, geographic location. may be used as key,I,. OTHER REFORT NtIMIIFR(S,): Itthe report hots been words but will be followed by an indication of technical con-assignel any other report numbers (eithe~r by the originator text. T7he assignment of links, roles, and weights is. optional.or by the sponsor), also enter this number(s).10. AVAIL ABILITYr1LIMITATION NOTICES: Enter any lim-itations ton further dissemination of the report, other than thoacl
I UnclaossifVied^C -%I copy Security Casfcto