1/96 clean development mechanism project design document form
TRANSCRIPT

UNFCCC/CCNUCC
CDM – Executive BoardPROJECT DESIGN DOCUMENT FORM
FOR AFFORESTATION AND REFORESTATION PROJECT ACTIVITIES (CDM-AR-PDD) - Version 04
1/96
CLEAN DEVELOPMENT MECHANISMPROJECT DESIGN DOCUMENT FORM FOR AFFORESTATION AND REFORESTATION
PROJECT ACTIVITIES (CDM-AR-PDD) Version 04
CONTENTS
A. General description of the proposed A/R CDM project activity
B. Duration of the project activity / crediting period
C. Application of an approved baseline and monitoring methodology
D. Estimation of ex ante net anthropogenic GHG removals by sinks and estimated amountof net anthropogenic GHG removals by sinks over the chosen crediting period
E. Monitoring plan
F. Environmental impacts of the proposed A/R CDM project activity
G. Socio-economic impacts of the proposed A/R CDM project activity
H. Stakeholders’ comments
Annexes
Annex 1: Contact information on participants in the proposed A/R CDM project activity
Annex 2: Information regarding public funding
Annex 3: Baseline information
Annex 4: Monitoring plan

UNFCCC/CCNUCC
CDM – Executive BoardPROJECT DESIGN DOCUMENT FORM
FOR AFFORESTATION AND REFORESTATION PROJECT ACTIVITIES (CDM-AR-PDD) - Version 04
2/96
SECTION A. General description of the proposed A/R CDM project activity:
A.1. Title of the proposed A/R CDM project activity:>>Title – Reforestation of degraded land by MTPL in India.Version – 09Date – 14.06.2011
A.2. Description of the proposed A/R CDM project activity:>>Mangalam Timber Products Limited, part of diverse B K Birla Group, a premier business conglomerateof India, was established on 27th August, 1982 in one of the most backward district Nabarangpur inOrissa (India) under joint venture with Industrial Promotion and Investment Corporation of OrissaLimited (IPICOL), a Govt. of Orissa company and started its commercial production from 11 th
November, 1987.
The company manufactures Medium Density Fibreboard (MDF) under the brand name of DURATUFFwhich is flawless, smooth and uniformly strong. MDF is made from the fibres of short rotation plantationtimber, waste wood or agro-wastes bounded together with synthetic resins contributing to save preciousforest resources.
DURATUFF conforms to rigorous quality standards laid down by Bureau of Indian Standards (BIS), IS12406:2003 for plain MDF and IS 14587:2008 for pre-laminated MDF. The company’s managementsystems are certified to international standards, ISO 9001:2008 for quality, ISO 14001:2004 forenvironment and OHSAS 18001:2007 for occupational health & safety.
The proposed CDM project activity by MTPLinvolves carbon sequestration of degradedland through reforestation activities. Manydiscrete parcels of degraded land that isowned by small and poor farmers/ tribal whodo not have the capability of plantationwithout any external financial support andtechnical guidance are reforested under FarmForestry Scheme. The project encompasses12437 parcels of land measuring 14969.46hectares owned by 12002 farmers distributedin seven districts across three states Orissa,Andhra Pradesh and Chattisgarh, majority
being in Orissa which constitutes almost 83% area of the project, 14% in Andhra Pradesh and only 3% inChhatishgarh.
The farmers participating in the reforestation activity are small and marginal farmers mostly owningsmall parcels of land. As shown in Fig A.2.2 the land holding of almost 92% farmers is 5 acres or lessout of which 60% own land 3 acres or less. Merely 8% farmers are holding more than 5 acres of landamong which only 1% above 10 acres.
Table A.2.1: Planted area in three states
83%
14% 3%
Orissa Andhra Pradesh Chhatishgarh

UNFCCC/CCNUCC
CDM – Executive BoardPROJECT DESIGN DOCUMENT FORM
FOR AFFORESTATION AND REFORESTATION PROJECT ACTIVITIES (CDM-AR-PDD) - Version 04
3/96
The reforestation activity taken upby Mangalam Timber is not only tosafeguard environment but alsoenrich the forest resources byextensive plantation. The speciesselected for the sequestration isEucalyptus which is a fast growingspecie, harvested first time normallyafter 5 years and thereafter thrice at4 year intervals.
The farmers are encouraged by thecompany officials for eucalyptusplantation on their degraded land
which was otherwise lying barren since long without any return. Company’s representatives holdmeetings with the land owners in different villages explaining reforestation scheme and making themaware of the benefits of the scheme. Under the scheme the banks provide finance by way of loan asapproved by NABARD, company provides seedling, fertilizers and technical assistance for plantationand the farmers invest their land and effort resulting into reforestation of degraded land.
Joint survey is conducted by the bank’s field staff, company’s representative and farmer for identificationand demarcation of land and to ensure that the land is degraded before sanction of loan. Clear title isensured through land title document issued by land revenue authorities of respective state government,locally known as “Land Patta” in Orissa & Chhatishgrh and “Land Passbook” in Andhra Pradesh. Nil-encumbrance certificate (NEC) and No-dues certificate (NDC) is also obtained from land revenueofficials in respect of each land parcel to ensure that the land is free from any burden and that the title isclear.
A tripartite agreement is entered into between the farmer, bank and the company on mutually agreedterms wherein the obligations of all the three parties are clearly stated. MTPL agrees to supply goodquality of seedlings and fertilizers on competitive price to farmers. The company ensures freereplacement of moratorium. The company agrees to provide technical, assistance and services relating toplanting and maintenance of such plantation till they are harvested. The company also assists farmers toobtain no objection certificate for plantation, felling, cutting and billeting of trees and transportation oftimber from farmers site to the factory of the company from competent authority of the forest departmentas and when required. The company agrees to buy back the harvested timber at prevailing market price orminimum rate mentioned in the agreement or at the rate fixed by Orissa Forest Development Corporationwhichever is higher at the time of harvest.
The farmers agree to plantation on their degraded land, their upkeep for proper growth and protectionform illegal felling. They also agree to deposit the title deed of the land with bank as security till theentire loan with accrued interest is paid back. For transparency, the loan is disbursed to the farmersthrough Saving Bank account opened in their name at respective branch of financing banks.
Unless tripartite agreement is entered into after fulfilling all the stipulated criteria, no loan is advancedand therefore no plantation proceeds. In the process company’s field officers all through guide thefarmers and provide all necessary assistance. Planting techniques and all technical assistance throughoutplantation activity is provided by the company in view of getting better yield. MTPL undertakes some in -house research and development activity for improving the quality and progeny of species for maximumyield.
Fig A.2.2: Land Ownership Structure of Farmers
60%
32%
7% 1%
≤ 3 Acres >3 to 5 Acres >5 to 10 Acres > 10 Acres

UNFCCC/CCNUCC
CDM – Executive BoardPROJECT DESIGN DOCUMENT FORM
FOR AFFORESTATION AND REFORESTATION PROJECT ACTIVITIES (CDM-AR-PDD) - Version 04
4/96
Since land for reforestation under the project activity is owned by poor down trodden farmers & tribal,its not possible for them to claim carbon credit on such reforestation. As such they individually authorizeMTPL to claim carbon credit on their behalf and the company agrees to share a part of carbon revenuewith them. A separate authorization letter is signed by all the participating farmers individually onmutually agreed terms & conditions.
The project has been undertaken to protect the land which was severely degraded or degrading. Prior tothe project activity the lands were wastelands due to severe soil erosion without considerable flora.Besides increasing the forest cover the project activity would also provide enhanced sources oflivelihood and income in rural areas by generating large employment opportunities. The project alsodirectly contributes to the significant reduction in top soil losses due to wind and water erosion andbiodiversity conservation.
Contribution of the project activity to Sustainable Development:
The A/R project is a human induced reforestation on degraded lands and erosion prone areas toimprove soil stabilization and soil fertility. Soil organic matter will increase as result of increaseof net primary productivity and degraded soil will be improved.
The reforestation under the proposed project activity is on degraded land which was lying barrensince decades. The farmers who own the land are mainly poor farmers/tribal who do not have thecapability of growing plantation of their own without any external financial support andtechnical guidance. They do not have capital to invest for plantation without any return for fiveyears. In absence of the project activity the land would have continued as degraded land ordegrading would continue further.
Eucalyptus being fast growing species, the project activity would generate more incomeopportunities for the farmers on long term.
Silviculture activities like raising nursery, site preparation, seedling transportation, planting,fencing and maintenance of plantation will generate employment opportunity for the localcommunity.
The carbon revenues generated from the project activity will be shared with the participatingfarmers through a carbon contract entered between MTPL, the project implementing agency andthe participating farmers individually, thus resulting into additional financial support to them.
Both the project participant and local farmers hold a view that the proposed A/R CDM project activitywill contribute to poverty alleviation and environment (biodiversity conservation and soil erosioncontrol), thus contribute to sustainable development.
A.3. Project participants:>>Please list project participants and Party(ies) involved and provide contact information in Annex 1.Information shall be indicated using the following tabular format.

UNFCCC/CCNUCC
CDM – Executive BoardPROJECT DESIGN DOCUMENT FORM
FOR AFFORESTATION AND REFORESTATION PROJECT ACTIVITIES (CDM-AR-PDD) - Version 04
5/96
Name of Party involved (*)((host) indicates a host Party)
Private and/or public entity(ies)project participants (*)
(as applicable)
Indicate if the Partyinvolved wishes to be
considered as a projectparticipant (Yes/No)
IndiaMangalam Timber ProductsLimited (Private entity, projectparticipant)
No
(*) In accordance with the CDM A/R modalities and procedures, at the time of making the CDM-AR-PDD public at the stage of validation, a Party involved may or may not have provided its approval. At thetime of requesting registration, the approval by the Party(ies) involved is required.
A.4. Description of location and boundaries of the A/R CDM project activity:
A.4.1. Location of the proposed A/R CDM project activity:
The project site is distributed over three states – Orissa, Andhra Pradesh and Chattisgarh.The northern part of the Orissa state lies on the edge of the great Indo-Gangetic plain. The ChhotaNagpur plateau occupies the western and northern portions of the state. Andhra Pradesh is surrounded byMadhya Pradesh and Orissa in the north, the Bay of Bengal in the east, Tamilnadu and Karnataka in thesouth and Maharashtra in the west. Chattishgarh borders Madhya Pradesh on the northwest, Maharashtraon the west, Andhra Pradesh on the south, Orissa on the east, Jharkhand on the northeast and UttarPradesh on the north.

UNFCCC/CCNUCC
CDM – Executive BoardPROJECT DESIGN DOCUMENT FORM
FOR AFFORESTATION AND REFORESTATION PROJECT ACTIVITIES (CDM-AR-PDD) - Version 04
6/96
Figure 4.1.1: Location of Seven Districts under A/R CDM Project Activity
A.4.1.1. Host Party(ies):>>India
A.4.1.2. Region/State/Province etc.:>>Orissa, Andhra Pradesh and Chhatishgarh (India)
A.4.1.3. City/Town/Community etc:>>The project activity is spread across seven districts namely Nabarangpur, Koraput & Malkangiri inOrissa, Vishakhapatnam, Vizianagaram & Srikakulm in Andhra Pradesh and Bastar in Chhatishgarhcovering reforestation of a total area of 14969.46 hectares as under:
Table A.4.1.3 : Year-wise plantation in different districts (All figures in hectares)S
NoState District 2001 2002 2003 2004 2005 2006 2007 Total
1 Orissa Nabarangpur 156.26 465.48 428.80 778.12 819.73 695.95 1115.91 4460.25
2 Koraput 361.95 517.07 723.06 1200.56 1468.48 1541.34 1399.94 7212.40
3 Malkangiri 2.37 18.33 49.48 150.61 169.84 141.34 176.03 708.00
4 Andhra Pradesh Vishakhapatnam 215.18 734.32 900.88 1850.38
5 Vizianagaram 38.16 20.30 1.39 59.85
6 Srikakulam 34.42 210.11 6.55 251.08
ANDHRA PRADESH
CHATTISGARH
ORISSA
NabarangpurBastar
Koraput
Malkangiri
Vishakhapatnam
Vizianagaram
Srikakulam

UNFCCC/CCNUCC
CDM – Executive BoardPROJECT DESIGN DOCUMENT FORM
FOR AFFORESTATION AND REFORESTATION PROJECT ACTIVITIES (CDM-AR-PDD) - Version 04
7/96
7 Chhatishgarh Bastar 102.11 260.63 64.76 427.50
Total: 520.58 1000.88 1201.34 2163.71 3023.61 3400.43 3658.91 14969.46
A.4.2 Detailed geographic delineation of the project boundary, including informationallowing the unique identification(s) of the proposed A/R CDM project activity:>>The A/R CDM activity contains more than one discrete parcel of land. The project activity includesreforestation of 12437 parcels of land distributed over seven districts across three states belonging to12002 farmers. For administrative control the parcels are grouped bank area wise and assigned to thebranch of financing bank from where the farmer has availed loan. Each discrete parcel represented by thename of the farmer has been assigned with a unique identification no. which will be used consistentlythroughout the PDD and monitoring the project activity as detailed in Table 4.2.1 below. The uniqueidentification no contains three letters followed by three digits e.g. “XXX000. The letters ‘XXX’represent bank area, first letter for district, 2nd & 3rd letter for Bank area and the digits ‘000’ representserial no of the parcel. More than one parcel of same farmer is further identified adding (a), (b), (c)….with the serial no.
Table A.4.2.1: Unique Identification of Parcels planted yearwiseNo of Parcels planted yearwise
2001 2002 2003 2004 2005 2006 2007SNo
District &State Bank Area Are
a IDSt 1 St 2 St3 St 4 St 5 St 6 St 7
TotalUnique
IdentificationNo of Parcels
ORISSA1 NABARANGPUR Nandahandi NNH 25 4 7 33 31 22 38 160 NNH001 to 1362 Nabarangpur NNP 7 14 31 59 66 57 51 285 NNP001 to 2623 Sindhiguda NSG 12 5 10 18 16 32 46 139 NSG001 to 1304 Rajoda NRJ 8 21 25 15 20 26 37 152 NRJ001 to 1485 Tumberla NTB 3 3 4 9 19 NTB001 to 0246 Kosagumuda NKM 8 17 20 18 14 15 46 138 NKM001 to 1367 Jotabal NJB 3 8 19 12 48 27 19 136 NJB001 to 1338 Katharguda NKG 8 17 32 26 11 23 39 156 NKG001 to 1529 Kumuli NKL 13 23 32 39 39 21 40 207 NKL001 to 19210 B Singhpur NBS 10 12 18 14 15 19 77 165 NBS001 to 157
A.4.1: Districtwise Planted Area (Ha)
4460
7212
708
1850
60
251
428
Nabrangpur Koraput Malkangiri Vishkhapatnam Vizianagaram Srikakulam Bastar

UNFCCC/CCNUCC
CDM – Executive BoardPROJECT DESIGN DOCUMENT FORM
FOR AFFORESTATION AND REFORESTATION PROJECT ACTIVITIES (CDM-AR-PDD) - Version 04
8/96
11 Sanmosigaon NSM 18 27 39 67 59 42 29 281 NSM001 to 28212 Challanguda NCG 10 14 16 50 35 20 73 218 NCG001 to 20413 Dhamnahandi NDH 12 10 9 19 14 64 NDH001 to 06114 Raighar NRG 28 5 116 57 59 92 357 NRG001 to 40015 Jharigaon NJG 36 26 46 66 70 73 317 NJG001 to 32116 Dhodra NDD 12 12 22 58 74 29 207 NDD001 to 21117 Kotagaon NKT 43 8 10 25 36 61 183 NKT001 to 18718 Umerkote NUK 8 16 22 6 29 54 135 NUK001 to14419 Sosahandi NSH 12 23 39 43 20 10 147 NSH001 to 14120 Singsari NSS 23 20 25 68 NSS001 to 06921 Turudhi NTD 28 13 14 55 NTD001 to 06022 Chandili NCD 3 8 10 11 21 53 NCD001 to 05323 Kundei NKN 13 8 9 30 NKN001 to 03224 Boriguma NBG 5 19 24 NBG001 to 02525 Kodinga NKD 4 6 4 44 58 NKD001 to 05826 Tentulikuthi NTK 25 61 71 41 198 NTK001 to 17527 Maidalpur NMP 36 44 12 23 115 NMP001 to 118
Total: 137 386 397 734 737 705 971 4067 3891 Farmers1 KORAPUT Boipariguda KBG 67 66 40 22 39 40 43 317 KBG001 to 3142 Ramgiri KRG 17 29 29 37 73 58 44 287 KRG001 to 2913 Kundra KKN 28 26 34 58 100 91 81 418 KKN001 to 4164 Digapur KDG 16 19 37 57 88 89 51 357 KDG001 to 3555 Dongerpausi KDP 14 23 30 47 71 111 111 407 KDP001 to 3996 Ambaguda KAG 3 2 14 17 39 28 103 KAG001 to 1007 Kusumi KKS 13 15 32 102 58 61 64 345 KKS001 to 3448 Phamphuni KPP 13 16 23 42 53 65 65 277 KPP001 to 2779 Nandpur KNP 33 55 67 86 101 108 136 586 KNP001 to 57510 Padwa KPD 7 35 21 39 47 44 20 213 KPD001 to 23811 Lamtaput KLP 11 9 40 75 22 30 61 248 KLP001 to 26212 Mathalput KMP 11 7 36 40 18 5 12 129 KMP001 to 13613 Jolaput KJP 11 9 18 28 36 10 35 147 KJP001 to 16614 Semiliguda KSG 4 3 21 30 41 62 57 218 KSG001 to 22015 Koraput KKP 6 9 8 12 7 6 48 KKP001 to 05716 Podagada KPG 5 14 19 48 49 62 60 257 KPG001 to 33017 Kakriguma KKG 9 11 18 9 18 65 KKG001 to 06618 Dasmantpur KDS 8 28 37 43 38 54 208 KDS001 to 22319 Pottangi KPT 6 6 14 25 17 25 93 KPT001 to 10520 Sunki KSN 5 35 42 21 18 20 141 KSN001 to 17821 Jeypore KJR 34 36 12 82 KJR001 to 08122 Sunabeda KSB 2 27 5 9 43 KSB001 to 04323 Onkadeli KOD 11 11 KOD001 to 011
Total: 268 367 556 878 1005 978 948 5000 4938 Farmers1 MALKANGIRI Pangam MPG 2 5 12 49 22 90 MPG001 to 0912 Maithili MML 1 1 3 12 27 100 144 MML001 to 1573 Malkangiri MMG 20 59 83 81 11 254 MMG001 to 2534 Kudumulguma MKG 7 7 11 1 26 MKG001 to 034
Total: 2 13 40 111 128 109 111 514 511 FarmersANDHRA PRADESH
1 VISHAKHAPATNAM Arkuvalley VSA 107 245 394 746 VSA001 to 13162 Kinchumanda VSK 137 270 343 750 VSK001 to 10993 Paderu VSP 272 137 409 VSP001 to 1215
Total: 244 787 874 1905 1728 Farmers1 VIZIANAGARAM Sallur VZS 31 22 1 54 VZS001 to 0962 Gajpatinagram VZG 2 2 VZG001 to 002

UNFCCC/CCNUCC
CDM – Executive BoardPROJECT DESIGN DOCUMENT FORM
FOR AFFORESTATION AND REFORESTATION PROJECT ACTIVITIES (CDM-AR-PDD) - Version 04
9/96
Total: 33 22 1 56 52 Farmers1 SRIKAKULAM Kottur SKT 45 28 73 SKT001 to 0812 Veergatham SVG 220 220 SVG001 to 3083 Palkonda SPK 53 53 SPK001 to 0584 GL Puram SGL 5 5 SGL001 to 005
Total: 45 301 5 0 351 338 FarmersCHHATISHGARH
1 BASTAR Bastar BBS 101 198 52 351 BBS001 to 3512 Lohaniguda BLH 30 36 24 90 BLH001 to 0903 Bhanpuri BBH 8 36 44 BBH001 to 0444 Kesharpal BKP 38 38 BKP001 to 0385 Bokaband BBK 12 12 BBK001 to 0126 Bojaband BBJ 9 9 BBJ001 to 009
Total: 139 329 76 544 544 Farmers69 Grand Total: 407 766 993 1768 2587 2935 2981 12437 12002 Farmers
Project boundaries are geographically delineated and represented through GIS maps of each discreetparcel. The company outsourced GIS mapping to specialist agency, M/s Salim Ali Centre forOrnithology & Natural History (SACON) under Ministry of Environment & Forests, Govt of India. Sitespecific database of each parcel has been generated by SACON using Satellite Remote Sensing dulyidentified with their unique identification no. Altogether 132 maps were generated listed in Table A.4.2.2below. The spread of parcels in each bank area is represented through GIS coordinates of the each area asunder:
Table A.4.2.2: Geographic delineation - GIS Maps & Coordinates bank area wiseGIS Coordinates of Bank Area
Lattitude LongitudeS
No Bank Area No ofParcels
Unique ID No offarmers Map ID No No of
MapsFrom To From To
1. NABARANGPUR1 Nandahandi 160 NNH001 to 136 N 01 1 19 09 22.2 N 19 17 02.3 N 82 37 01.2 E 82 46 14.8 E2 Nabarangpur 285 NNP001 to 262 N 02 – N 05 4 19 09 53.5 N 19 19 33.6 N 82 18 13.4 E 82 40 02.1 E3 Sindhiguda 139 NSG001 to 130 N 06 1 19 09 25.3 N 19 16 09.0 N 82 31 58.0 E 82 40 26.0 E4 Rajoda 152 NRJ001 to 148 N 07 1 19 08 43.0 N 19 17 02.8 N 82 09 49.2 E 82 21 23.9 E5 Tumberla 19 NTB001 to 024 N 08 1 19 19 40.8 N 19 22 21.5 N 82 32 15.0 E 82 37 02.1 E6 Kosagumuda 138 NKM001 to 136 N 10– N 11 2 19 08 56.8 N 19 19 12.5 N 82 08 46.9 E 82 16 48.6 E7 Jotabal 136 NJB001 to 134 N 11 – N 12 2 19 20 23.0 N 19 27 00.7 N 82 24 05.1 E 82 30 35.7 E8 Kathargada 156 NKG001 to 152 N 13 – N 14 2 19 05 07.0 N 19 10 03.6 N 82 40 59.6 E 82 46 23.8 E9 Kumuli 207 NKL001 to 192 N 15 – N 16 2 19 03 19.1 N 19 11 00.1 N 82 38 35.9 E 82 43 40.0 E10 B Singpur 165 NBS001 to 157 N 17 – N 18 2 18 58 25.8 N 19 07 43.8 N 82 35 03.9 E 82 42 22.2 E11 Sanmosigaon 281 NSM001 to 282 N 19 – N 21 3 19 11 47.2 N 19 19 46.1 N 82 20 26.1 E 82 29 36.7 E12 Chalanguda 218 NCG001 to 204 N 22 – N 25 4 19 01 59.3 N 19 12 32.8 N 82 29 51.4 E 82 39 53.7 E13 Dhamnahandi 64 NDH001 to 061 N 26 1 19 04 47.7 N 19 07 50.5 N 82 16 51.9 E 82 19 13.9 E14 Raighar 357 NRG001 to 400 N 27 – N 29 3 19 49 19.9 N 19 58 40.8 N 81 33 01.2 E 82 45 42.8 E15 Jharigaon 317 NJG001 to 321 N 30 – N 33 4 19 31 57.2 N 19 45 55.0 N 82 11 26.0 E 82 27 25.2 E16 Dhodra 207 NDD001 to 211 N 34 – N 37 4 19 32 38.7 N 19 46 50.8 N 82 10 22.4 E 82 21 13.6 E17 Kotagaon 183 NKT001 to 187 N 38 – N 40 3 19 19 16.4 N 19 28 06.2 N 82 09 56.2 E 82 21 26.9 E18 Umerkote 135 NUK001 to144 N 41 – N 43 3 19 37 04.1 N 19 44 07.8 N 82 04 43.3 E 82 17 10.9 E19 Sosahandi 147 NSH001 to 141 N 44 - N 45 2 19 00 50.0 N 19 10 23.7 N 82 26 07.1 E 82 33 37.9 E20 Singsari 68 NSS001 to 069 N 46 – N 48 3 19 23 01.9 N 19 35 01.4 N 82 03 42.1 E 82 21 26.8 E21 Turudhi 55 NTD001 to 060 N 49 1 19 53 04.1 N 19 59 23.8 N 81 50 53.3 E 81 56 14.1 E22 Chandili 53 NCD001 to 053 N 50 1 19 00 26.6 N 19 06 44.6 N 82 12 12.2 E 82 21 38.8 E23 Kundei 30 NKN001 to 032 N 51 1 20 01 13.0 N 20 04 12.2 N 81 46 55.8 E 81 59 29.1 E24 Borigumma 24 NBG001 to 025 N 52 1 19 00 07.1 N 19 08 25.5 N 82 34 50.1 E 82 41 41.9 E25 Kodinga 58 NKD001 to 058 N 53 – N 54 2 19 14 56.4 N 19 24 09.6 N 82 15 43.0 E 82 22 28.7 E

UNFCCC/CCNUCC
CDM – Executive BoardPROJECT DESIGN DOCUMENT FORM
FOR AFFORESTATION AND REFORESTATION PROJECT ACTIVITIES (CDM-AR-PDD) - Version 04
10/96
26 Tentulikuthi 198 NTK001 to 175 N 55 1 19 14 07.1 N 19 19 23.5 N 82 40 45.2 E 82 45 31.7 E27 Maidalpur 115 NMP001 to 118 N 56 – N 58 3 19 24 16.1 N 19 33 25.1 N 82 13 15.0 E 82 38 57.3 E
Total: 4067 582. KORAPUT1 Boipariguda 317 KBG001 to 314 K 01 – K 02 2 18 40 33.8 N 18 49 39.4 N 82 16 28.1 E 82 28 16.2 E2 Ramgiri 287 KRG001 to 291 K 03 – K 05 3 18 41 57.0 N 18 52 17.5 N 82 10 30.6 E 82 21 08.9 E3 Kundra 418 KKN001 to 416 K 06 – K 07 2 18 49 36.8 N 19 00 08.1 N 82 16 56.0 E 82 25 05.6 E4 Digapur 357 KDG001 to 355 K 08 – K 09 2 18 46 09.3 N 18 53 03.9 N 82 18 06.2 E 82 30 18.2 E5 Dongerpaunsi 407 KDP001 to 399 K 10 – K 11 2 18 50 49.5 N 19 01 00.6 N 82 21 38.3 E 82 27 39.1 E6 Ambaguda 103 KAG001 to 100 K 12 1 18 56 27.9 N 19 00 22.8 N 82 30 15.1 E 82 37 54.0 E7 Kusumi 345 KKS001 to 344 K 13 – K 14 2 18 59 06.1 N 19 06 13.4 N 82 19 39.1 E 82 28 45.8 E8 Phamphuni 277 KPP001 to 277 K 15 – K 16 2 18 50 05.7 N 18 57 50.4 N 82 25 01.2 E 82 31 11.4 E9 Nandapur 586 KNP001 to 575 K 17 – K 20 4 18 29 03.1 N 18 44 47.9 N 82 29 35.4 E 82 53 01.6 E10 Padwa 213 KPD001 to 238 K 21 – K 22 2 18 16 07.2 N 18 37 45.7 N 82 34 47.7 E 82 46 53.3 E11 Lamtaput 248 KLP001 to 262 K 23 – K 25 3 18 29 00.4 N 18 46 14.3 N 82 30 33.3 E 82 40 03.1 E12 Mathalput 129 KMP001 to 136 K 26 1 18 43 22.3 N 18 49 59.8 N 82 53 49.0 E 82 58 58.0 E13 Jolaput 147 KJP001 to 166 K 27 1 18 25 16.6 N 18 31 42.2 N 82 33 32.1 E 82 39 10.9 E14 Semiliguda 218 KSG001 to 220 K 28 – K 30 3 18 33 02.6 N 18 42 56.2 N 82 46 11.4 E 82 56 58.1 E15 Koraput 48 KKP001 to 057 K 31 – K 32 2 18 47 10.8 N 18 53 10.3 N 82 38 09.9 E 82 52 43.4 E16 Podagada 257 KPG001 to 330 K 33 – K 34 2 18 47 35.0 N 18 56 50.3 N 82 41 00.4 E 82 59 29.8 E17 Kakiriguma 65 KKG001 to 066 K 35 – K 36 2 18 52 04.4 N 18 59 58.0 N 82 53 06.2 E 83 04 05.2 E18 Dasmantpur 208 KDS001 to 223 K 37 – K 38 2 18 58 07.7 N 19 09 29.6 N 82 49 53.3 E 83 00 05.3 E19 Pottangi 93 KPT001 to 105 K 39 1 18 27 45.6 N 18 34 19.0 N 82 51 39.1 E 83 00 11.1 E20 Sunki 141 KSN001 to 178 K 40 1 18 22 38.1 N 18 30 43.4 N 82 55 22.2 E 83 04 05.1 E21 Jeypore 82 KJR001 to 081 K 41 1 18 54 04.0 N 18 59 26.7 N 82 29 17.0 E 82 35 40.0 E22 Sunabeda 43 KSB001 to 043 K 42 1 18 38 34.6 N 18 45 27.0 N 82 45 30.2 E 82 53 37.3 E23 Onkadili 11 KOD001 to 011 K 43 1 18 30 01.5 N 18 34 29.1 N 82 25 09.0 E 82 27 01.0 E
Total: 5000 433. MALKANGIRI1 Pangam 90 MPG001 to 091 M 01 – M 02 2 18 22 58.1 N 18 33 34.8 N 82 01 43.4 E 82 10 03.2 E2 Maithili 144 MML001 to 157 M 03 1 18 28 51.0 N 18 36 52.2 N 82 04 29.0 E 82 13 30.2 E3 Malkangiri 254 MMG001 to 253 M 04 – M 06 3 18 19 50.8 N 18 29 37.6 N 81 55 17.3 E 82 06 15.2 E4 Kudumulguma 26 MKG001 to 034 M 07 1 18 15 31.4 N 18 26 22.0 N 82 05 29.6 E 82 11 23.8 E
Total: 514 074. VISAKHAPATNAM1 Arkuvalley 746 VSA001 to 1316 VS 01 - 02 2 18 10 22.6 N 18 23 20.4 N 82 01 28.9 E 83 10 41.2 E2 Kinchunmanda 750 VSK001 to 1099 VS 03 - 04 2 18 08 34.9 N 18 26 37.8 N 82 39 49.9 E 82 52 49.8 E3 Paderu 409 VSP001 to 1219 VS 05 - 06 2 18 01 19.5 N 18 12 43.9 N 82 32 24.7 E 82 50 51.7 E
Total: 1905 065. VIZIANAGARAM1 Sallur 54 VZS001 to 096 VZ 01 1 18 24 58.5 N 18 31 24.8 N 83 00 12.0 E 83 11 48.1 E
2 Gajpatinagaram 2 VZG001 to 002 VZ 02 1 18 30 54.2 N 18 31 05.6 N 83 07 31.3 E 83 07 39.7 E
Total: 56 026. SRIKAKULAM
1 Kottur 73 SKT001 to 081 S 01 1 18 37 33.4 N 18 43 23.58N 83 46 34.9 E 83 49 23.9 E
2 Veergatham 220 SVG001 to 308 S 02 - 03 2 18 40 10.4 N 18 46 24.8 N 83 35 56.0 E 83 41 38.0 E
3 Palkonda 53 SPK001 to 058 S 04 - 05 2 18 32 06.7 N 18 44 14.7N 83 41 59.6 E 83 52 00.4 E
4 G L Puram 5 SGL001 to 005 S 06 1 19 02 23.9 N 19 03 11.2 N 83 33 35.4 E 83 39 51.1 ETotal: 351 06
7. BASTAR1 Bastar 351 BBS001 to 351 B 01– B 02 2 19 06 17.7 N 19 19 05.5 N 81 45 20.9 E 81 59 45.3 E2 Lohaniguda 90 BLH001 to 090 B 03 – B 05 3 19 04 48.3 N 19 16 05.5 N 81 35 01.9 E 81 57 35.2 E3 Bhanpuri 44 BBH001 to 044 B 06 1 19 17 02.4 N 19 21 07.4 N 81 43 11.5 E 81 48 38.7 E

UNFCCC/CCNUCC
CDM – Executive BoardPROJECT DESIGN DOCUMENT FORM
FOR AFFORESTATION AND REFORESTATION PROJECT ACTIVITIES (CDM-AR-PDD) - Version 04
11/96
4 Kesharpal 38 BKP001 to 038 B 07 – B 08 2 19 20 04.0 N 19 25 25.9 N 81 43 52.9 E 81 54 51.7 E5 Bokaband 12 BBK001 to 012 B 09 1 19 14 08.7 N 19 14 38.7 N 82 03 29.5 E 82 06 06.5 E6 Bojawand 9 BBJ001 to 009 B 10 1 19 12 54.6 N 19 13 49.3 N 82 07 07.0 E 82 09 23.6 E
Total: 544 10Grand Total: 12437 Parcels 132 Maps
A plantation register is maintained with details of all 12437 parcels belonging to 12002 farmers thatincludes the name of farmers, area of plot, khata no, plot no, village name, bank area, soil type along withtheir unique identification no. The plantation register also contains the GPS coordinates for identificationof geographical boundary of each discrete site. Project boundary of Sindhiguda Bank area ofNabarangpur district is attached below as sample geographical boundary.

UNFCCC/CCNUCC
CDM – Executive BoardPROJECT DESIGN DOCUMENT FORM
FOR AFFORESTATION AND REFORESTATION PROJECT ACTIVITIES (CDM -AR-PDD) - Version 04
12/96
Project Boundary of Sindhiguda Bank Area (District: Nabarangpur)

UNFCCC/CCNUCC
CDM – Executive BoardPROJECT DESIGN DOCUMENT FORM
FOR AFFORESTATION AND REFORESTATION PROJECT ACTIVITIES (CDM-AR-PDD) - Version 04
13/96
A.5. Technical description of the A/R CDM project activity:
A.5.1. Description of the present environmental conditions of the area planned for theproposed A/R CDM project activity, including a concise description of climate, hydrology, soils,ecosystems (including land use):>>CLIMATEOrissa1 - There are three major seasons - Summer (March-June), Rainy Season (July-September) and theWinter (October-February). Orissa lying just South of the Tropic of Cancer, has a tropical climate. It iswarm almost throughout the year in the Western districts of Sundergarh, Sambalpur, Baragarh, Bolangir,Kalahandi and Mayurbhanj with maximum temperature hovering between 40-46 0C and in winter, it isintolerably cool. In the coastal districts, the climate is equable but highly humid and sticky. The summermaximum temperature ranges between 350C - 400C and the low temperatures are usually between 120C-140C. Winter is not very severe except in some areas in Koraput and Phulbani where minimumtemperature may drop to 30C - 40C. The average rainfall is 150 cm, experienced as the result of southwest monsoon during July-September. The state also experiences small rainfall from the retreatingmonsoon in the months of October-November.
Andhra Pradesh2 - The average maximum temperature in most parts of Andhra Pradesh varies from230C - 28 0C. Minimum temperature varies from 100C – 120C. Summers are hot and humid on the coastalplains and some places it touches above 42 0C. The state of Andhra Pradesh experiences a very hotsummer. Andhra Pradesh climate is marked by the onset of monsoons in second week of June whichcontinues till September. This rainfall is caused by south wets monsoon wind.
The state's coast receives heavy rain from northeast monsoon winds or the retreating monsoon winds alsoin October-November. Sometimes it is associated with cyclones as well. Climate in Andhra Pradesh ischaracterized by mild winter, temperature doesn't fall generally below 16 0C
Chhatisgarh3 - Its positioning on the Tropic of Cancer makes the Chattisgarh climate warm. As is usualwith the tropical climate, the summers in Chattisgarh are warm & humid and the winters are cool. Duringa typically hot summer day, the mercury can shoot up to 45 0C. The climate in Chattisgarh shows a majorshift from the sultry heat to the pleasantly cold during the winters. The winters can be chilly with themercury plummeting to hit the 10 0C mark. The average rainfall is around 1400 mm.
HYDROLOGYAndhra Pradesh4 : Krishna and Godavari are the major river systems in the State. Godavari is thebiggest in terms of length and breadth among the rivers of South India. Tungabhadra is an importanttributary of the Krishna. Other important rivers are the Pennar, Vamsadhara and Nagavali. All these
1 http://www.orissatourism.org/climate-in-orissa.html2 http://www.southindiatourtravel.com/andhra-pradesh/travel-to-andhra-pradesh/climate.html3 http://www.indianholiday.com/chhattisgarh/climate-in-chhattisgarh.html4 http://www.indiainfoweb.com/andhra-pradesh/rivers/

UNFCCC/CCNUCC
CDM – Executive BoardPROJECT DESIGN DOCUMENT FORM
FOR AFFORESTATION AND REFORESTATION PROJECT ACTIVITIES (CDM-AR-PDD) - Version 04
14/96
________
rivers are rainfed, and are of great economic significance because of their hydel power and irrigationpotential.
Orissa5 : The northern part of the Orissa state lies on the edge of the great Indo-Gangetic plain. TheRihand River, a tributary of the Ganges, drains this area. The eastern end of the Satpura Range and thewestern edge of the Chota Nagpur Plateau form an east-west belt of hills that divide the Mahanadi Riverbasin from the Indo-Gangetic plain. The central part of the state lies in the fertile plain of the Mahanadiand its tributaries, with extensive rice cultivation. The southern part of the state lies on the Deccanplateau, in the watershed of the Godavari River and its tributary the Indravati River. Other main riversare Hasdo (a tributary of Mahanadi), Rihand, Indravati, Jonk and Arpa.
There are four groups of rivers which flow through Orissa into the Bay of Bengal . They are : (i) Riversthat have a source outside the State (the Subarnarekha, the Brahmani & the Mahanadi). (ii) Rivers havinga source inside the State (the Budhabalanga, the Baitarini, the Salandi, & the Rushikulya). (iii) Rivershaving a source inside the Orissa, but flow through other states (the Bahudu, the Vansadhara & theNagavali). (iv) Rivers having a sourc inside Orissa, but tributary to rivers which flow through otherstates (the Machkund, the Sileru, the Kolab & the Indravati).
River Mahandi - It is the major river of Orissa and the sixth largest river in India. It originates from theAmarkantak hills of the Bastar Plateau in Raipur district of Madhya Pradesh. It is about 857 km long(494 kms. in Orissa) and its catchment area spreads over 141,600 sq. kms (65,580 sq. kms) in Orissa).
The Brahmani - It is the second largest river in Orissa. It flows through the Easter Ghats in Sundargarh,Kendujhar, Dhenkanal, Cuttack and Jajpur districts into the Coastal Plains and enters into the Bay ofBengal along with a combined mouth with the Mahanadi known as the Dhamra. The Brahmani is 799kms. long (541 kms. in Orissa) and its catchment area spreads over 39,033 sq.kms. in Orissa).
The Baitarani - It originates from the Gonasika hills of the Keonjhar districts. It is 365 kms long and itscatchment area spread over 12,790 sq. kms . It enters into the Bay of Bengal after joining of theBrahmani at Dharma mouth near Chandabali Subarnrekha.
The Subarnarekha - It orginates from the Chhotnagpur plateau of Bihar. It is 433 kms long (70 kms inOrissa ) and has a catchment area of 19,500 sq. kms (3,200 sq. kms in Orissa ).
The Budhabalanga - It orginates from the easterns slopes of the Similipala massif. It is about 175 kmslong having a total catchment area of 4840 sq. kms. It is major tributaries are the Sone, the Gangadhar,the Catra etc.
The Rushikulya - It originates from the Rushyamala hills of the Eastern Ghats in Phulbani district. It is165 kms long with 8900 sq. kms of catchment areas. Its tributaries are the Baghua the Dhanei Badanadietc.
The Bahuda - It originates from the Ramgiri hills of the Eastern Ghats and joins the Bay of Bengal inAndhra Pradesh. It is 73 km long with a catchment area of 1250 sq. kms.
5 http://www.welcomeorissa.com/rivers.php
UNFCCC/CCNUCC
CDM – Executive BoardPROJECT DESIGN DOCUMENT FORM
FOR AFFORESTATION AND REFORESTATION PROJECT ACTIVITIES (CDM-AR-PDD) - Version 04
15/96
________
The Bansadhara - It originates from the Flanks of the Durgakangar hills (Lingaraj hills) of the EasternGhats in Kalahandi districts. It is 230 kms long (150 kms in Orissa). It enters in to the Bay of Bengal atKalingapatnam in Andhra Pradesh. It has a catchment area of 11500 sq. kms.
The Nagabali - It originates from the Bijipur Hills of the Eastern Ghat near Lanji garah. It is 210 kmslong (100 kms is in Orissa). It has a total catchment area of about 9410 sq. kms.
The Salandi - It originates from the Meghasani Hills of the Similipal massif in Keonjhar district. It is 144kms long with catchment areas of 1793 sq. kms.The Indirabati - It originates from the Eastern Ghats in Kalahandi districts. It is 530 kms long with acatchment area of 41700 sq. kms as a tributary it flows into the Godabari River.
The Kolab - It originates from the Sinkaran hills of the Eastern Ghats in Koraput districts. It hascatchment areas of 20400 sq. kms.
Springs - There are a number of mountain springs and hot spring in Orissa. The Badaghagara &Sanaghagara in Keonjhar districts, Satpasajya in Denkanal districts, the Chandikhole in Cuttack districts,the Barunei in Khorda districts, the Narayani & Nirmalajhar in Ganjam & Puri districts, the Patalagangain Kalahandi districts, the Nursinghanath in Sambalpur districts and the Harisankar in Bolangir districtsare some of the important mountain springs in Orissa .
Waterfalls - The Barehipani & Joranda (Similipal) in Mayurbhanja district, Sanaghagara & Badaghagarain Keonjhar district, Padhanpuri in Deogarh district, Khandadhar (Banei) in Sundargarh district,Phurlijharan, Khandabaladhar & Rabandhara in Kalahandi district, Kentamari & Putudi in Boudh &Phulbani districts, Dum Duma in Malkangiri district and Bogra in Koraput district are some of the majorwaterfalls of Orissa.
Lakes - The Chillika Lake is blackish water lagoon located in the southern part of the Orissa coastalplain. Its area varies from 780 sq. kms to 144 sq. kms from winter to monsoon seasons. Ansupa, Sara andKanjia are some sweet water lakes of Orissa.
Chhattisgarh6 : 57.48% collection of water is done by Mahanadi & other rivers like Shivnath, Hasdo,Mand, Pary, Jonk, Kelo, Udanti, Sukha etc. in Chhattisgarh. Its second largest river is Godavari. Rihandis the main river in northern side of Chhattisgarh. The Chitrakoot Waterfalls in Jagdalpur in Chhattisgarhare often termed the Niagra of India. Kendai, Tatapani, Ruksganda, Amritdhara, Kothali, GangrailJalashaya, Kharkhara Bandh, Keshkal Teerathgarh waterfall are major waterfalls in Chhattisgarh.
SOIL
The project area has three soil types namely red soil, red & black and red loamy soil. In Orissa, theproject area has Red soil and Red & Black soil. In Chattisgarh, the project area has combination of Red
6 http://www.chhattisgarh.com/commen/chhattisinfo/chhattisinfo.html

UNFCCC/CCNUCC
CDM – Executive BoardPROJECT DESIGN DOCUMENT FORM
FOR AFFORESTATION AND REFORESTATION PROJECT ACTIVITIES (CDM-AR-PDD) - Version 04
16/96
________
Loamy soil, Red & Black and Red soil. In Andhra Pradesh, the soil types are Red Loamy soil, Red &Black and Red soil.
Soil of Nabarangpur District7 : Major portion of the district is covered by lateritic soil followed by redand black cotton soil.
Soil of Malkangiri District8: black soil occurs mainly in Malkangiri district. Sandy and clay type soilpredominate the entire district. The soil is generally acidic in nature and alkaline in some patches. Thesalinity of the soil is normal. The percolated composition of it gives less binding capacity.
Soil of Koraput District9 : The soil of the district is mostly red, mixed red and yellow, alluvial and redand black. The texture is sandy loam to sandy clay loam. As per soil test the soils are acidic and poor infertility status.
Soil of Vizianagaram District10 : The main soils in the Vizianagaram district are Red soils, Sandy loamsand Sandy clay and they constitute 96 % of the total area. The soils in the district are predominantlyloamy with medium fertility. There are mostly red loamy soils, as far as dry lands are concerned and clayloamy in case of wet lands.
Soil of Vishakapatnam District11 : Red Loamy soils predominate with a coverage of 69.9% of thevillages of the district. The Soils are poor textured and easily drained. Sandy loamy soils come nextwith 19.2% villages coverage. 45% of the soils in the district are low in organic content and55% in Phosphorous content.
Soil of Bastar District : Generally Sandy loamy, Red and Lateritic soil is prevalent in Bastar district.The soil throughout the greater portion of Bastar consists of light clay with an admixture of sand. Thetexture of the soil varies from sandy to fine textured clayey soils. The primary laterites are found as a capon the top of the trap and gneissic rocks. Secondary laterites are usually found in the valleys and low-lying places. These soils are of fine texture and darker hues and are rich in humus.
ECOSYSTEM AND SPECIESProject areas in all seven districts are dominated by degraded land. Because of degraded nature of land,majority of parcels are barren. A detailed ecological survey was conducted in the year 2000-2001 in thearea in order to understand different floral and faunal composition of the existing ecosystem. The reportcontains the details of type & no of trees found in individual parcels of the project area alongwith herbs& shrubs contained in them. Very few areas are composed of tree vegetation. In all, 1557 parcels havebeen found with tree vegetation. Varity of trees found in the area are Mangifera indica, Tectona grandis,Anacardium occidentale, Shorea robusta, Madhuca longifolia, Schleichera oleosa, Artocarpus
7 Reddy, C. S., K. Ram Mohan Rao, Chiranjibi Pattanaik and P. K. Joshi (2008). Assessment of Large-Scale Deforestation of Nawarangpur District, Orissa, India for its Sustainable Management: A RemoteSensing Based Study. Environmental Monitoring and Assessment Journal, (DOI: 10.1007/s10661-008-0400-9 – Springerlink Publication).8 http://malkangiri.nic.in/Topography.html9 http://www.manage.gov.in/NATP/Koraput.pdf10 http://vizianagaram.nic.in/AboutVizianagaram.html11 http://visakhapatnam.nic.in/district-profile.html

UNFCCC/CCNUCC
CDM – Executive BoardPROJECT DESIGN DOCUMENT FORM
FOR AFFORESTATION AND REFORESTATION PROJECT ACTIVITIES (CDM-AR-PDD) - Version 04
17/96
heterophyllus etc. In most of the areas during rainy season bushes, grasses grown but at the onset ofsummer everything vanishes. Shrubs and under shrubs like Cassia tora, Ipomea biloba, Achyranthesaspera etc are found in the project area. Cassia tora is a common plant of wasteland and tolerates lowmoisture content in the soil. This plant grows tall under conducive conditions. However, the plant foundat the project site shows stunted growth proving the lowered fertility of the soil. Capparis aphylla growswell in nutrient poor sharply drained gravely soils. This shrub is found in abundance in the area. Basedon ecological survey report all the parcels containing trees through the entire project area has beenshortlisted. The table below shows the list of trees recorded in the project area:
S No Common Name Scientific Name Family1 Mango Mangifera indica Anacardiaceae2 Cashew Anacardium occidentale Anacardiaceae3 Sal Shorea robusta Dipterocarpaceae4 Teak Tectona grandis Lamiaceae5 Mahuwa Madhuca longifolia Sapotaceae.6 Kusum Schleichera oleosa Sapindaceae7 Kendu Diospyros melanoxylon Ebenaceae8 Karanji Pongamia pinnata Papilionaceae9 Chakunda Cassia tora Caesalpinaceae
10 Jackfruit Artocarpus heterophyllus Moraceae11 Guava Psidium gujav Myrtaceae12 Banyan Ficus bengalensis Moraceae13 Pipal Ficus religiocia Moraceae14 Castor Recinus cummunis Euphorbia15 Kachnar Bombax Ceiba Malvales16 Semal Bauhinia Semla Caesalpinaceae17 Arjun Terminilia Arjuna Combretaceae18 Beleric Terminalia Bellirica Combretaceae19 Silver Oak Grevelia Robusta Proteaceae20 Aonla Phyllanthus emblica Phyllanthaceae21 Tendu Diospyros Celebica Ebenaceae22 Tamarind Tamarindus indica Fabaceae
Herbs found in the project area are as follows:
S No Name of the Species Family Habit1 Cassia tora Leguminosae Herb2 Ipomea biloba Convolvulaceae Herb3 Capparis aphylla Capparidaceae Herb4 Croton bonplandianus Euphorbiaceae Herb5 Achyranthes aspera Amarantaceae Herb6 Parthenium hysterophorus Poaceae Herb7 Tephrosia purpurea Pappilionaceae Herb8 Cyperus diformis Cyperaceae Herb9 Chloris montana Poaceae Herb

UNFCCC/CCNUCC
CDM – Executive BoardPROJECT DESIGN DOCUMENT FORM
FOR AFFORESTATION AND REFORESTATION PROJECT ACTIVITIES (CDM-AR-PDD) - Version 04
18/96
________________________________
Cow, goat, dog, crow, rats, rattlesnakes add to the faunal composition of the project area.
A.5.2. Description of the presence, if any, of rare or endangered species and their habitats:>>There is no record of endangered species at the project site. The proposed project lands had the status ofdegraded land. It has emerged during the vegetation survey that the some of the project area have sometree vegetation like Mangifera indica, Tectona grandis, Anacardium occidental etc. In rest of the areaduring rainy season grasses and bushes grown but onset of summer nothing can be found. The land wasnot fit for the habitation of any animals or birds etc. None of these naturally occurring trees are rare orendangered according to the Botanical Survey of India. As the project area is degraded land, so it is notsuitable for the habitation of wild animals.
A.5.3. Species and varieties selected for the proposed A/R CDM project activity:>>The species selected for sequestration is Eucalyptus (E. tereticornis). The species belong to familyMyrtaceae of Angiospermae. This hybrid manifests good hybrid vigour for growth and volumeproduction. It is selected due to its coppicing and drought resistant quality. The species has far greaterrooting depth of 3 metres and offers greater capillary action. There is also a considerable increase in thewater holding capacity of the soil.12
Their popularity is because of their adaptability to grow quickly in a wide range of edaphoclimaticconditions. They are fire hardy, produce relatively large volumes of wood, multipurpose benefits, havecoppicing power and are resistant to being browsed. Eucalyptus uses up water more effectively than anyother perennial crop. It produces maximum biomass compared to local species per unit of waterconsumed. It has been established through studies that Eucalyptus consumes least quantity of water forproduction of higher biomass per unit volume as is evident from the article “Know about EucalyptusTree” by Mr M Harikrishnan, Principal Chief Conservator of Forest (PCCF), Tamil Nadu Forestdepartment, Chennai - 8. Eucalyptus is a better species to meet some specific needs that are seldomfulfilled by local species.
A.5.4. Technology to be employed by the proposed A/R CDM project activity:>>The technological details are as follows:
Nursery Technique: Seeds of Eucalyptus are first treated with broad based fungicide and equal amountof fine quality sand for sowing. Such treated seeds are sown on nursery mother beds of size 10 m long &1 m wide. Beds are covered with paddy straw to protect the seeds from wind and rain besidesencouraging better germination as straw provides optimum micro-environmental condition forgerminating seeds. Seedlings of 2-5 leaf stage are transplanted into polythene bags filled with excellentquality soil, sand and well decomposed farm yard manure in the ratio of 2:1:1. Transplanted seedlings areprovided with partial shade and sufficient water so that within 10 days most of the seedlings getacclimatized and begin to grow in polythene bags. Timely watering, weeding, shifting & grading will bedone. Seedlings of 30-45 cm will be obtained in 3-5 months time. Insecticides/pesticides will be usedonly in case if there is considerable damage to plants.
12 http://www.fao.org/DOCREP/005/AC772E/ac772e06.html

UNFCCC/CCNUCC
CDM – Executive BoardPROJECT DESIGN DOCUMENT FORM
FOR AFFORESTATION AND REFORESTATION PROJECT ACTIVITIES (CDM-AR-PDD) - Version 04
19/96
Site Preparation: Deep repeated ploughing mostly with country plough or tractor ploughing byexceptional farmers is done one month prior to planting. Rows are aligned and pits are dug at a spacingof 3m × 1.5m with an aim to accommodate about 1000 plants per acre. Small pits (40-45 cm in diameterand 30-35 cm in depth) are dug manually for tree planting.
Planting Techniques: The plant of 30-45 cm (excluding container height) with girth of 1-2 cm at collarregion is used for planting. The plants with container are dipped in bucket of water mixed withtermiticides / insecticides just before planting. This helps in keeping better moisture within the ball ofearth and keeps the insects/termites away. The plant are held in one hand and the polythene bag is cutwith sharp knife/blade and completely removed in such a way that the plant roots are intact in ball of soil.
The sapling is planted in such a way that the root collar region is well within the soil, as it is softestportion should not be exposed to sunlight. After planting soil around the plant is thoroughly compactedand is preferably done by using both feet without causing injury to plant.
Plantation management: The plantations are protected from grazing/browsing animals by means of livefencing. Termites are the major insects that cause severe damage to growing plants but is controlled byusing Chlorpyriphos 20% EC. Timely weeding and soil-working is done to boost-up the plant growth.
Harvesting : The plants are harvested when they are 5 years old & onwards. The trees are felled, 3’billeted and loaded on to trucks. Such material is then transported to mills for further use.
A.5.5. Transfer of technology/know-how,if applicable:>>

UNFCCC/CCNUCC
CDM – Executive BoardPROJECT DESIGN DOCUMENT FORM
FOR AFFORESTATION AND REFORESTATION PROJECT ACTIVITIES (CDM-AR-PDD) - Version 04
20/96
Not Applicable
A.5.6. Proposed measures to be implemented to minimize potential leakage:>>No significant leakage is anticipated from the project activity.
Leakage due to the displacement of grazing and cultivation is unlikely to occur as there are sufficientexisting grazing lands under the control of the animal owners that can adopt displaced animals even if allpre-project animals are displaced to existing lands outside the project boundary.
A.6. Description of legal title to the land, current land tenure and rights to tCERs / lCERs issuedfor the proposed A/R CDM project activity:>>The reforestation under the proposed project activity is on many small parcels of land owned by poorfarmers & tribal. Land title, Tripartite agreement between farmer, bank & company and Carbon contractare the mandatory documents to participate in the project activity. These documents are available inrespect of each and every farmer.
Land Title (Land Patta) : The farmers necessarily posses the legal title of the land in the form of “LandPatta” in Orissa & Chhatishgarh and “Land Pass Book” in Andhra Pradesh issued by Land RevenueDepartment of respective State Governments. Nil Encumbrance Certificate (NEC) & No Dues Certificate(NDC) is further obtained from the respective land authorities to ensure that the land is free from anyburden and that the title is clear. These are the base document required to process the loan by t he bank.The patta/passbook is kept by the bank under their custody as security against the loan sanctioned bythem till its recovery in each & every case.
Tripartite Agreement: When degraded land is confirmed from the patta and clear title is ensured by thebank for granting loan, an agreement is entered into by the farmer, the bank and company’s authorizedrepresentative wherein the obligations of all the three parties are clearly stated.
MTPL agrees to supply good quality of seedlings and fertilizers on competitive price to farmers and toprovide technical, assistance and services relating to planting and maintenance of such plantation till theyare harvested. The company agrees to buy back the harvested timber at prevailing market price orminimum rate mentioned in the agreement or at the rate fixed by Orissa Forest Development Corporationwhichever is higher at the time of harvest.
The farmers agree to plantation on their degraded land, their upkeep for proper growth and protectionfrom illegal felling. They also agree to deposit the title deed of the land with bank as security till theentire loan with accrued interest is paid back to the bank. For transparency all loan is disbursed to thefarmers through SB account opened in their name at the branch.
Unless tripartite agreement is reached between three parties after fulfilling all the stipulated criteria, noloan is advanced and therefore no plantation proceeds. Hence tripartite agreement is also available incase of each & every farmer.
Carbon Contract: Reforestation under the project activity is on many small parcels of degraded landowned by poor farmers & tribal. Its not possible for them to claim carbon credit on their reforestation. InIndia there is no specific existing regulation on the rights to carbon credits. As such they individually

UNFCCC/CCNUCC
CDM – Executive BoardPROJECT DESIGN DOCUMENT FORM
FOR AFFORESTATION AND REFORESTATION PROJECT ACTIVITIES (CDM-AR-PDD) - Version 04
21/96
authorize MTPL to claim carbon credit on their behalf and the company agrees to share a part of carbonrevenue with them. A letter “Authorization for Claiming Carbon Credits” is signed by all theparticipating farmers individually on mutually agreed terms & conditions reproduced hereunder:
1. Entire cost incurred on development, documentation, mapping, measurement, validation,verification and registration of CDM project will be borne by the company. The farmers will notbe required to pay on this account. However any incidental expenses which may requireadditionally in future during the crediting period may be charged to the farmers with prior noticeto them.
2. The farmers will get proportionate share in the CER revenue earned by the company on proratabasis in lieu of their plantation included in CDM project boundary. The company agrees to pay12% of the CER revenue earned per acre to the farmers at present or as mutually agreed uponfrom time to time in future.
3. The sum due to the farmers under CDM will be paid normally through bank within three monthsof realization of CER revenue by the company for which they will be required to furnish a SBaccount in their name when asked for by the company. However mode of payment may changeon the basis of mutual agreement.
4. The farmers will not be entitled for CER revenue in the event of failure of their plantation and/or opting out from the scheme and / or other plantation (s) which is not included in the projectboundary.
5. The farmers will not claim for carbon credit for the plantations included in the subject projectboundary through any other agency (ies) or organization (s).
A.7. Assessment of the eligibility of the land:>>In order to assess the eligibility of land to host an A/R CDM project activity, tool referenced in themethodology “Procedures to demonstrate the eligibility of lands for A/R CDM project activities(Version 01)”, EB 35 Report; Annex 18 has been applied. The project activity is reforestation ofdegraded land. The tool requires establishing that the land under project activity was not forest at thetime of start of the project.
The Government of India defines forests as: A single minimum land area of 0.05 hectares; A single minimum tree crown cover of 15%; and Single tree with height of minimum of 2 meters.
Reforestation is defined by decision 11/CP.7 as “direct human-induced conversion of non-forested landto forested land through planting, seeding and/or the human-induced promotion of natural seed sources,on land that was forested but that has been converted to non-forested land. For the first commitmentperiod, reforestation activities will be limited to reforestation occurring on those lands that did notcontain forest on 31 December 1989”.
The activity is an eligible CDM reforestation project activity, which has been demonstrated throughSatellite Imageries of 1989-90 period, Land title document, Baseline vegetation survey and interviewswith the local farmers/communities on land use/cover history and important events during ParticipatoryRural Appraisal (PRA). The land that has been reforested under this A/R CDM project activity wasbarren due to heavy soil erosion and loss of top soil which has caused reduction in carbon stocks overtime to the point where there is little vegetation and the soil has low organic carbon content rendering it

UNFCCC/CCNUCC
CDM – Executive BoardPROJECT DESIGN DOCUMENT FORM
FOR AFFORESTATION AND REFORESTATION PROJECT ACTIVITIES (CDM-AR-PDD) - Version 04
22/96
unusable for historic land uses. There was no woody vegetation found in December, 1989 as the land wasunder severe soil erosion and hence satisfies the criteria of being non-forested since 31st December,1989.(a) Satellite imageries: The satellite imageries of 1989-90 period (Map overlay on Landsat TM datadated 19 Nov 1990 and classified image) provided in respect of all parcels of land, indicate that the landtaken up for present project activity neither contain any forest nor fall under the forest category asdefined by the State of Forest Report (1999) Government of India. They fall under the category ofdegraded land. Land cover map in respect of Sindhiguda division is attached forthwith:
(b) Land title document: The farmers owning the land necessarily posses the title document of the landlocally known as “Land Patta” in Orissa & Chhatishgarh and “Land Pass Book” in Andhra Pradeshissued by Land Revenue Department of respective State Governments wherein the land category is alsomentioned. The land pattas of entire area under A/R CDM consideration clearly evidence that they arenot forest land. They are categorically mentioned as degraded land locally known as “Donger land” inOrissa, “Parat land” in Chhatishgarh and “Mettu bhumi”in Andhra Pradesh.
(c) Certificates from Local Tehsildars: Officials from local land revenue department of all the threestates, the Tehsildars of the area have certified that the land category mentioned as Dongar, Parat, Mettuin patta/ passbook is nothing but degraded land.
(d) Baseline Vegetation Survey: A survey aiming to assess baseline vegetation was conducted by theteam of MTPL field staff in the year 2001 before start of the project activity. The survey was conducted

UNFCCC/CCNUCC
CDM – Executive BoardPROJECT DESIGN DOCUMENT FORM
FOR AFFORESTATION AND REFORESTATION PROJECT ACTIVITIES (CDM-AR-PDD) - Version 04
23/96
in different time periods, first post monsoon (October, 2000 to January, 2001) and thereafter pre -monsoon in summer (May-June 2001). From the survey it was observed that there were very few treesgrowing in the project site, and the species Anacardium occidentale is the dominant tree species in thearea. The field staff visited individual sites alongwith the concerned farmer and penned down thevegetation noticed on the site selected for forestation. The data was then compiled to evidence theeligibility of the land as well as to estimate the baseline carbon sequestration of the project activity.
It was observed from the vegetation report that the pre and post monsoon scenarios widely differed. Inpost monsoon period the land was flourished with grass, bushes and weeds but in summer everythingvanished and the land was totally barren leaving no vegetation at all. It was further observed that the landis divided into two categories – land without vegetation and land with vegetation. The land withvegetation contained grasses, shrubs and a few trees like mango, cashew, teak, sal, jackfruit etc. Theother category was totally barren having light scattered grass at the most.
(e) Participatory Rural Appraisal (PRA): A ground based survey was also conducted to gatherinformation on land use/cover history and important events that have impacted the land use/coverchanges and to study the socio-economic and socio-ecological aspects of the project area spread acrossOrissa, Andhra Pradesh and Chhattisgarh. The company contracted a local NGO, Maa SyamalyaVoluntary Organization to conduct PRA exercise. The PRA was conducted over a period of six monthsfrom October, 2008 to March, 2009 through visiting the local farmers/communities and interviewingthem directly with following objectives:
To evaluate the eligibility of the lands under the project area To analyze the potentiality of additionality and leakage in the project area To gather information about technology of Eucalyptus plantation known to the farmers To identify the discrete parcels to be included under the project area To explore the crop productivity, grazing pattern, climate & other relevant points To know the income sources of the project participants and study the socio-economic
conditions of the households and the communities in the villages. To collect information on similar reforestation activities in the area
Tools & techniques used: Semi-structured interviewing Group discussions Village and resource Mapping
MTPL provided the list of all the farmers initially participating in the project activity with their uniqueID no to the agency with instructions to touch at least 10% farmers in each bank area including a fewvillagers and to reach as many villages as possible in order to ensure proper representation of each area inPRA. MTPL field officers assisted them to identify and introduce the farmers. The villagers wereinformed well in advance regarding the visit of PRA team of MTPL to ensure their availability. The PRAteam met the farmers with structured questionnaire which covered mainly the following issues:
Land eligibility: Respondents were asked about their proposed land status, whether it was a forest area,and if so since when?Technology: Respondents were specifically asked about their knowledge regarding planting Eucalyptustrees, preparing land for the plantation activity, seed availability etc.

UNFCCC/CCNUCC
CDM – Executive BoardPROJECT DESIGN DOCUMENT FORM
FOR AFFORESTATION AND REFORESTATION PROJECT ACTIVITIES (CDM-AR-PDD) - Version 04
24/96
________
Grazing for leakage criteria: Respondents were specifically asked about grazing of their cattle in theproposed land and also any grazing by migratory cattle from adjoining areas.Time line and history tracing: Respondents were asked to elaborate about their areas and record anydevelopmental activities in their areas since 1940.Income: land and cattle holding data collected by the field staff was cross-checked with the individualparticipants and the participants were interviewed about the productivity and yield of their lands.Alternative to land use: Respondents were asked to tell whether they have any other alternative availablefor the project lands, had this project not suggested.Species choice: Respondents were categorically asked to tell about the choice of tree species selected forplanting with their full consent and choice.Seasonality of crops: Respondents were requested to prepare a crop cycle map showing seasonality ofvarious crops in their area.Similar Reforestation activities in the area: Detailed information on similar reforestation activities inthe area as far as possible was also collected from the villagers.Views & comments: Respondents were also asked to give their views and comments on the reforestationactivity undertaken by the company.
Altogether 1525 respondents were approached by the agency including 64 villagers who were not projectparticipants. The sample respondents were systematically selected by their ID nos from the list of 14462farmers supplied by the company following the principle, one respondent from each 10 farmers of thebank area or the farmer from a new village or the next farmer available in order to ensure participation ofmaximum villages in PRA exercise. Farmers’ replies were recorded by the team on individual forms inlocal language. The farmers then approved the comments by putting their signature/ thumb impression.Based on the response the agency prepared a consolidated report and submitted to the company as PRAReport and “Report on Similar Reforestation Activities”. The PRA report provides lot of usefulinformation on land use/cover, socio economic aspects of the respondents as under:
All the respondents confirmed that the land included in the project activity never had a forest inlast 30 years nor they fall under the category of forest land.
The respondents invariably reported that the lands owned by them are severely degraded land, notsuitable for growing agricultural crop. It was revealed that they are not just saying because the landis categorized as degraded land by the land authorities of State Government but practicallyexperienced. Many of them or their forefathers tried to cultivate agricultural crop on their land(partly or wholly) in the past and failed. Either the yield was so poor that they could not afford tocontinue or in some cases the crop totally dried in absence of irrigation.
The respondents informed that before MTPL persons approached them, they d idn’t have thetechnical know how of Eucalyptus plantation on degraded land on commercial basis. Even, theydidn’t have the idea from where seedlings were available, how to prepare degraded land forplanting eucalyptus. They also informed that when MTPL persons approached them in the year2000 they required training to implement such kind of activity.
Most important causes of degradation as perceived by the respondents are domestic use byvillagers, business/trading, fuel wood crisis in the region, illegal forest produce sale etc.

UNFCCC/CCNUCC
CDM – Executive BoardPROJECT DESIGN DOCUMENT FORM
FOR AFFORESTATION AND REFORESTATION PROJECT ACTIVITIES (CDM-AR-PDD) - Version 04
25/96
Further there are no developmental activities or incentives by the state to reverse the degradedstatus into cultivatable land or to prevent further degradation. The economic conditions of thefarmers are not such that they can afford to develop the land for agricultural purposes.
In terms of socio-economic profile, the respondents are mainly small farmers/tribal, daily wageearners and small service providers totalling to 96.2%. Per capita annual income stands atRs.4031/- where 86% respondents has been found with income of Rs 5000/- or less which issignificantly low and indicates the degree of deprivation of the people.
Among 91.9% farmers holding land upto 5 acres, 62.3% own less than 3 acres and merely 0.4%own land more than 10 acres.
Almost all the respondents opined that the plantation scheme brought by MTPL has provided agood opportunity for them. Under the scheme they can fetch out some income from their degradedland which was lying barren since their forefathers. In absence of the scheme they had no otheralternative land use except to leave it barren as in the past.
Therefore the land within the project boundary was all non-forest land at the moment the project started,they were degraded, under ongoing process of degradation and confirms as under:
At the time of project start the project land was neither covered by young natural stands orplantations with the potential to reach the national forest threshold; traces of grass found insome parcel of land.
The project land were not temporarily unstocked (i.e. no significant loss of woody biomass hasoccurred due to human intervention or indirect natural causes such as fire or insect damage);and
Have been subject to environmental conditions and human-based degradation which do notpermit the encroachment of natural forest vegetation.
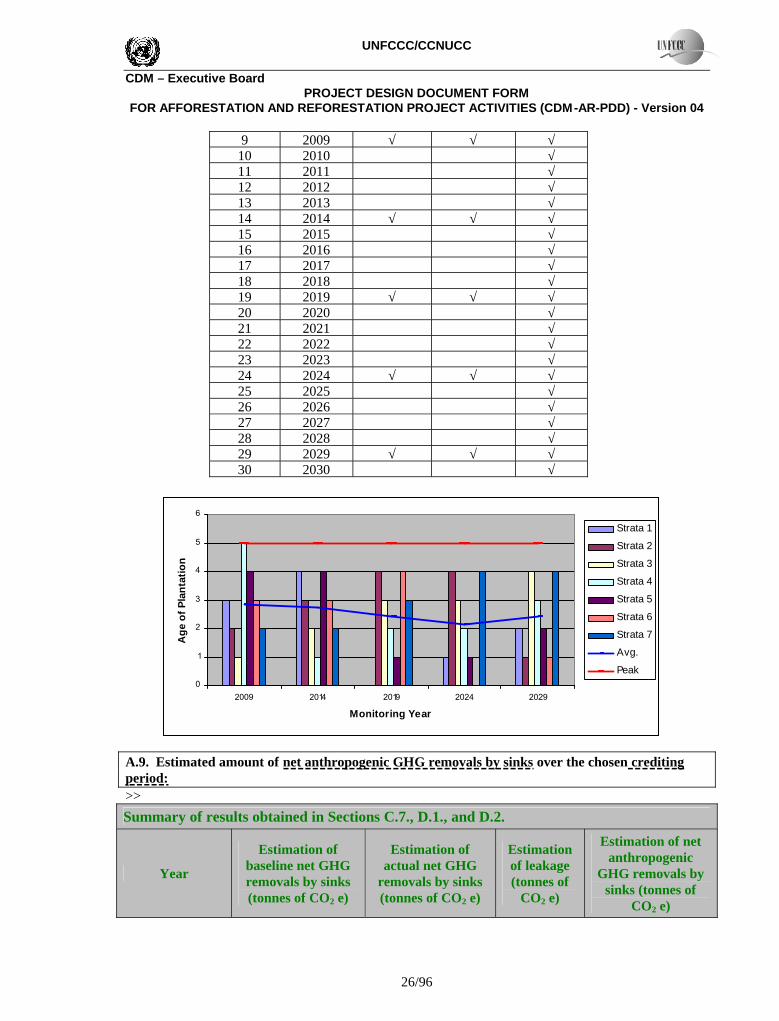
A.8. Approach for addressing non-permanence:>>In order to address the non-permanence issue, project participants have chosen the issuance of tCERs forthe net anthropogenic GHG removals by sinks achieved by the proposed A/R CDM project activity.
The planting activity has been conducted from 2001 to 2007. Eucalyptus sp. would be harvested at theage of 5 years. To avoid the coincidence with peaks in carbon stocks, the first monitoring will beconducted in the year 2009 with subsequent monitoring and verification interval of 5 years, i.e. in 2014,2019, 2024 and 2029.
Year No. Year Monitoring Verification Harvesting1 20012 20023 20034 20045 20056 2006 √7 2007 √8 2008 √
UNFCCC/CCNUCC
CDM – Executive BoardPROJECT DESIGN DOCUMENT FORM
FOR AFFORESTATION AND REFORESTATION PROJECT ACTIVITIES (CDM-AR-PDD) - Version 04
26/96
9 2009 √ √ √10 2010 √11 2011 √12 2012 √13 2013 √14 2014 √ √ √15 2015 √16 2016 √17 2017 √18 2018 √19 2019 √ √ √20 2020 √21 2021 √22 2022 √23 2023 √24 2024 √ √ √25 2025 √26 2026 √27 2027 √28 2028 √29 2029 √ √ √30 2030 √
A.9. Estimated amount of net anthropogenic GHG removals by sinks over the chosen creditingperiod:>>
Summary of results obtained in Sections C.7., D.1., and D.2.
Year
Estimation ofbaseline net GHGremovals by sinks(tonnes of CO2 e)
Estimation ofactual net GHG
removals by sinks(tonnes of CO2 e)
Estimationof leakage(tonnes of
CO2 e)
Estimation of netanthropogenic
GHG removals bysinks (tonnes of
CO2 e)
0
1
2
3
4
5
6
2009 2014 2019 2024 2029
Monitoring Year
Age
of P
lant
atio
n
Strata 1
Strata 2
Strata 3
Strata 4
Strata 5
Strata 6
Strata 7
Avg.
Peak

UNFCCC/CCNUCC
CDM – Executive BoardPROJECT DESIGN DOCUMENT FORM
FOR AFFORESTATION AND REFORESTATION PROJECT ACTIVITIES (CDM-AR-PDD) - Version 04
27/96
1st Year 0 3862.37 0 3862
2nd Year 2.93 28667.04 0 28664
3rd Year 7.68 97471.37 0 97464
4th Year 14.12 261234.66 0 261221
5th Year 24.55 618873.65 0 618849
6th Year 36.35 736103.63 0 736067
7th Year 50.64 1021486.61 0 1021436
8th Year 67.79 1616039.06 0 1615971
9th Year 68.01 -385670.24 0 -385738
10th Year 68.23 365863.64 0 365795
11th Year 68.45 -153435.72 0 -153504
12th Year 68.67 -444309.86 0 -444379
13th Year 68.89 -246434.02 0 -246503
14th Year 69.11 542910.97 0 542842
15th Year 69.33 119992.91 0 119924
16th Year 69.55 -306693.83 0 -306763
17th Year 69.77 -246434.02 0 -246504
18th Year 69.99 542910.97 0 542841
19th Year 70.21 119992.91 0 119923
20th Year 70.43 -306693.83 0 -306764
21st Year 70.65 -247388.42 0 -247459
22nd Year 70.87 537953.35 0 537882
23rd Year 71.10 96287.79 0 96217
24th Year 71.32 -381967.01 0 -382038
25th Year 71.54 -437805.63 0 -437877
26th Year 71.76 586173.24 0 586101
27th Year 71.98 6246.57 0 6175
28th Year 72.21 -909034.72 0 -909107
29th Year 72.43 1588595.05 0 1588523
30th Year 72.65 -413114.25 0 -413187
Total estimatedGHG removals bysinks(tCO2 e)
1751.20 4411684.24 0 4409933
Total number ofcrediting years
30 30 30
UNFCCC/CCNUCC
CDM – Executive BoardPROJECT DESIGN DOCUMENT FORM
FOR AFFORESTATION AND REFORESTATION PROJECT ACTIVITIES (CDM-AR-PDD) - Version 04
28/96
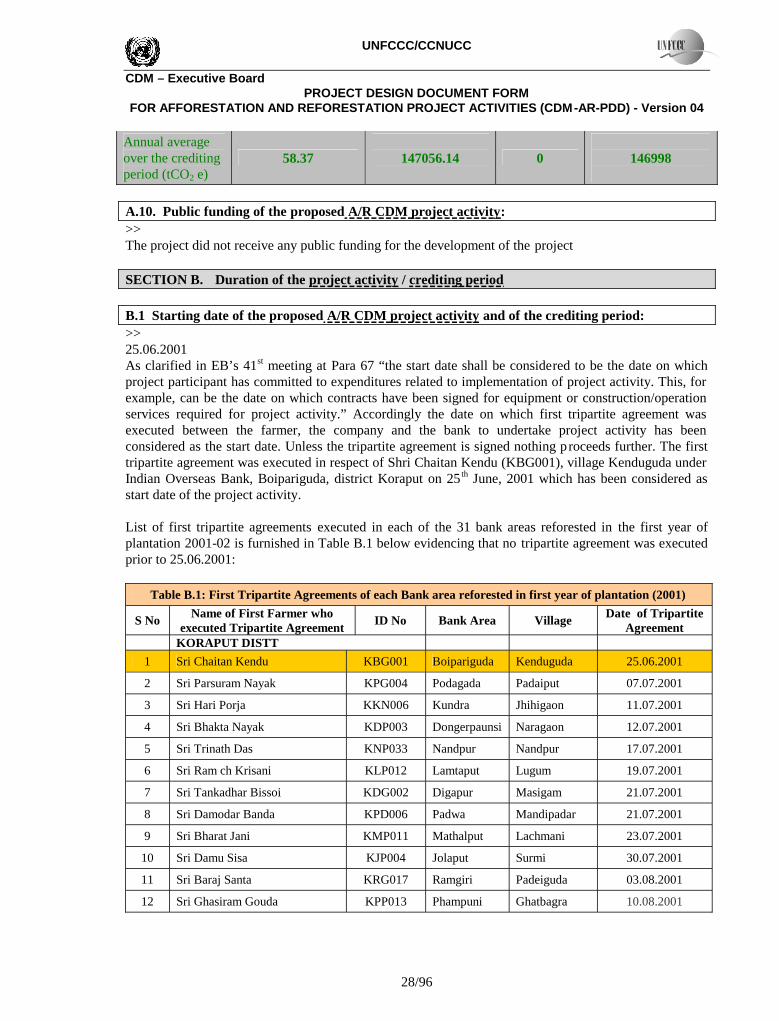
Annual averageover the creditingperiod (tCO2 e)
58.37 147056.14 0 146998
A.10. Public funding of the proposed A/R CDM project activity:>>The project did not receive any public funding for the development of the project
SECTION B. Duration of the project activity / crediting period
B.1 Starting date of the proposed A/R CDM project activity and of the crediting period:>>25.06.2001As clarified in EB’s 41st meeting at Para 67 “the start date shall be considered to be the date on whichproject participant has committed to expenditures related to implementation of project activity. This, forexample, can be the date on which contracts have been signed for equipment or construction/operationservices required for project activity.” Accordingly the date on which first tripartite agreement wasexecuted between the farmer, the company and the bank to undertake project activity has beenconsidered as the start date. Unless the tripartite agreement is signed nothing proceeds further. The firsttripartite agreement was executed in respect of Shri Chaitan Kendu (KBG001), village Kenduguda underIndian Overseas Bank, Boipariguda, district Koraput on 25 th June, 2001 which has been considered asstart date of the project activity.
List of first tripartite agreements executed in each of the 31 bank areas reforested in the first year ofplantation 2001-02 is furnished in Table B.1 below evidencing that no tripartite agreement was executedprior to 25.06.2001:
Table B.1: First Tripartite Agreements of each Bank area reforested in first year of plantation (2001)
S NoName of First Farmer who
executed Tripartite AgreementID No Bank Area Village
Date of TripartiteAgreement
KORAPUT DISTT
1 Sri Chaitan Kendu KBG001 Boipariguda Kenduguda 25.06.2001
2 Sri Parsuram Nayak KPG004 Podagada Padaiput 07.07.2001
3 Sri Hari Porja KKN006 Kundra Jhihigaon 11.07.2001
4 Sri Bhakta Nayak KDP003 Dongerpaunsi Naragaon 12.07.2001
5 Sri Trinath Das KNP033 Nandpur Nandpur 17.07.2001
6 Sri Ram ch Krisani KLP012 Lamtaput Lugum 19.07.2001
7 Sri Tankadhar Bissoi KDG002 Digapur Masigam 21.07.2001
8 Sri Damodar Banda KPD006 Padwa Mandipadar 21.07.2001
9 Sri Bharat Jani KMP011 Mathalput Lachmani 23.07.2001
10 Sri Damu Sisa KJP004 Jolaput Surmi 30.07.2001
11 Sri Baraj Santa KRG017 Ramgiri Padeiguda 03.08.2001
12 Sri Ghasiram Gouda KPP013 Phampuni Ghatbagra 10.08.2001

UNFCCC/CCNUCC
CDM – Executive BoardPROJECT DESIGN DOCUMENT FORM
FOR AFFORESTATION AND REFORESTATION PROJECT ACTIVITIES (CDM-AR-PDD) - Version 04
29/96
13 Sri Ramchandra Gadba KKS005 Kusumi Kangiaguda 10.08.2001
14 Sri Bichendra Pujari KKP005 Korput Podaiput 14.08.2001
15 Sri Sadasiba Patra KAG001 Ambaguda Tentuliguda 27.08.2001
16 Sri Parmanda Hantal KSG004 Semiliguda Subai 28.08.2001
17 Sri Dhaneswar Muduli KKG006 Kakiriguma Lediriguda 07.07.2001
NABARANGPUR DISTT
18 Sri Gopal Chandra Mishra NNH001 Nandahandi Dohana 06.07.2001
19 Sri Tinuparaja NKL002 Kumuli Purnagda 17.07.2001
20 Sri Ramesh Chandra Hial NKG003 Kathargada Paknaguda 26.07.2001
21 Sri Ganeswar Sahu NBS001 B. Singhpur Kandulkhunti 28.07.2001
22 Sri Kamulu Majhi NDH001 Dhamnahandi Bhurusiguda 07.08.2001
23 Sri Dinamani Harijan NTB006 Tumberla Gumidora 07.08.2001
24 Sri Ganpati Bhatra NSM001 Sanmosigaon Kochiaguda 09.08.2001
25 Sri Gangadhar Bhatra NNP005 Nabarabgpur Bongapalli 12.08.2001
26 Sri Raghunath Nayak NSG003 Sindhiguda Dangtatguda 13.08.2001
27 Sri Puran Harijan NCG001 Challanguda Parsola 14.08.2001
28 Sri Laxman Bisoi NKM002 Kosagumuda Kosagumuda 16.08.2001
29 Sri Nabina Harijan NJB002 Jotabal Bhatadhansuli 20.08.2001
30 Sri Daina Miriya NRJ001 Rajoda Bijaguda 11.09.2001
MALKANGIRI DISTT
31 Sri Hari Bhumia MPG002 Pangam Padaguda 29.08.2001
B. 2. Expected operational lifetime of the proposed A/R CDM project activity:>>50 years 0 months.
B.3 Choice of crediting period:
B.3.1. Length of the renewable crediting period (in years and months), if selected:>>Not applicable
B.3.2. Length of the fixed crediting period (in years and months), if selected:>>The fixed crediting period is of 30 years 0 months.
SECTION C. Application of an approved baseline and monitoring methodology
C.1. Title and reference of the approved baseline and monitoring methodology applied to theproposed A/R CDM project activity:

UNFCCC/CCNUCC
CDM – Executive BoardPROJECT DESIGN DOCUMENT FORM
FOR AFFORESTATION AND REFORESTATION PROJECT ACTIVITIES (CDM-AR-PDD) - Version 04
30/96
>>The approved baseline and monitoring methodology titled “Afforestation and reforestation ofdegraded land”, AR-ACM0001 (Version 04), Sectoral Scope: 14, has been applied to the proposedA/R CDM project activity alongwith following tools:
S No Tools used Version No1 “Combined tool to identify the baseline scenario and
demonstrate additionality in A/R CDM project activities”01
2 “Tools for the identification of degraded or degrading landsfor consideration in implementing A/R CDM projectactivities”
01
3 “Calculation of the number of sample plots formeasurements within A/R CDM project activities”
02
4 “Estimation of GHG emissions related to displacement ofgrazing activities in A/R CDM project activity”
02
5 “Procedure to demonstrate the eligibility of lands forafforestation and reforestation CDM project activities”
01
6 “Estimation of GHG emission due to clearing, burning anddecay of existing vegetation attributable to a CDM A/Rproject activity”
03
7 “Tool for testing significance of GHG emissions in A/R CDMproject activities”
01
C.2. Assessment of the applicability of the selected approved methodology to the proposed A/RCDM project activity and justification of the choice of the methodology:>>The proposed A/R CDM project activity complies with the applicability conditions of theapproved baseline methodology AR-ACM0001 as follows:
Applicability Condition JustificationThe A/R CDM project activity isimplemented on degraded lands,which are expected to remaindegraded or to continue to degradein the absence of the project, andhence the land cannot be expected torevert to a non-degraded statewithout human intervention
“Tool for identification of degraded or degrading lands forconsideration in implementing CDM A/R Project activities(Version 01)” applied to establish that the lands in proposedCDM activity are degraded land.
1. Verifiable document in the form of Land Patta or Land PassBook is available in respect of each parcel issued by local LandRevenue Authorities of respective State Government wherein theland has been categorized as “Donger”, “Parat”or “Mettu bhumi”in Orissa, Andhra Pradesh and Chhattisgarh respectively. FurtherTehsildar of the area, official from land revenue department ofState Government, have certified that the Donger, Parat andMettubhumi are the nomenclature used locally for degraded landin the states of Orissa, Chhatishgarh and Andhra Pradeshrespectively.
2. The company appointed M/s Salim Ali Centre for Ornithology& Natural History (SACON) under MoEF, Govt of India for

UNFCCC/CCNUCC
CDM – Executive BoardPROJECT DESIGN DOCUMENT FORM
FOR AFFORESTATION AND REFORESTATION PROJECT ACTIVITIES (CDM-AR-PDD) - Version 04
31/96
conducting GIS mapping of the project area including Changedetection study to know the status of land during 1990 period.Satellite images of 1990 period have been generated byoverlaying the current GIS map of the project parcels over theLandsat Thematic Mapper Satellite data of 1990 period availablefrom Global Land Cover Facility (GLCF). These images areavailable for the entire project area; bank area wise that showsthat the parcels of land under project activity was under degradedcategory.
3. Further PRA that was conducted by one NGO of the area in2008-09 also gathered information on land use/cover history pastand current. It is found from the PRA study that the land wasdegraded land, not fit for any agricultural activity and thus lyingbarren since decades or from the period of their forefathers. Manyof the land owners or their forefathers tried to cultivateagricultural crop on their land (partly or wholly) in the past butfailed because of degraded nature of land. Either the yield was sopoor due to poor fertility that they could not afford to continue orthe crop dried totally in absence of irrigation.
Encroachment of natural treevegetation that leads to theestablishment of forests accordingto the host country definition offorest for CDM purposes is notexpected to occur.
Prior to the implementation of the project activity the landunder the project boundary were degraded lands withoutconsiderable flora due to severe soil erosion without topsoil.
Encroachment of natural tree is not possible as the project activityhas been implemented on degraded land without topsoil due tosevere soil erosion in the past as well as continued degradationwithout considerable flora. The area frequently faced naturalcalamities like drought and excessive rains. The speech in 50 th
National Development Council meeting on 21st December, 2002by the then Chief Minister of Orissa reveals that the state wasravaged by as many as 15 major calamities since 1963. The supercyclone in October 1999, severe droughts in 2000 & 2002 andexcessive rain fall in 2001 have ravaged almost the entire statecausing colossal losses especially in rural areas@.@
http://planningcommission.gov.in/plans/planrel/pl50ndc/orissa.pdfOn the contrary study report says there are indications ofdesertification in many parts of the state especially in western andsouthern uplands. The study by Water Initiatives of Orissa(WIO), a NGO in the state claimed that the rate of landdegradation is going up at an alarming pace and Orissa could wellturn to barren and a land mass akin to desert in next 150 years.“In just 13 years from 1991-92 to 2004-05, severely degradedland in the state has increased by 136%, barren land by 69% andland converted to non-agricultural uses by 34%”, the WIOcoordinator said@@.
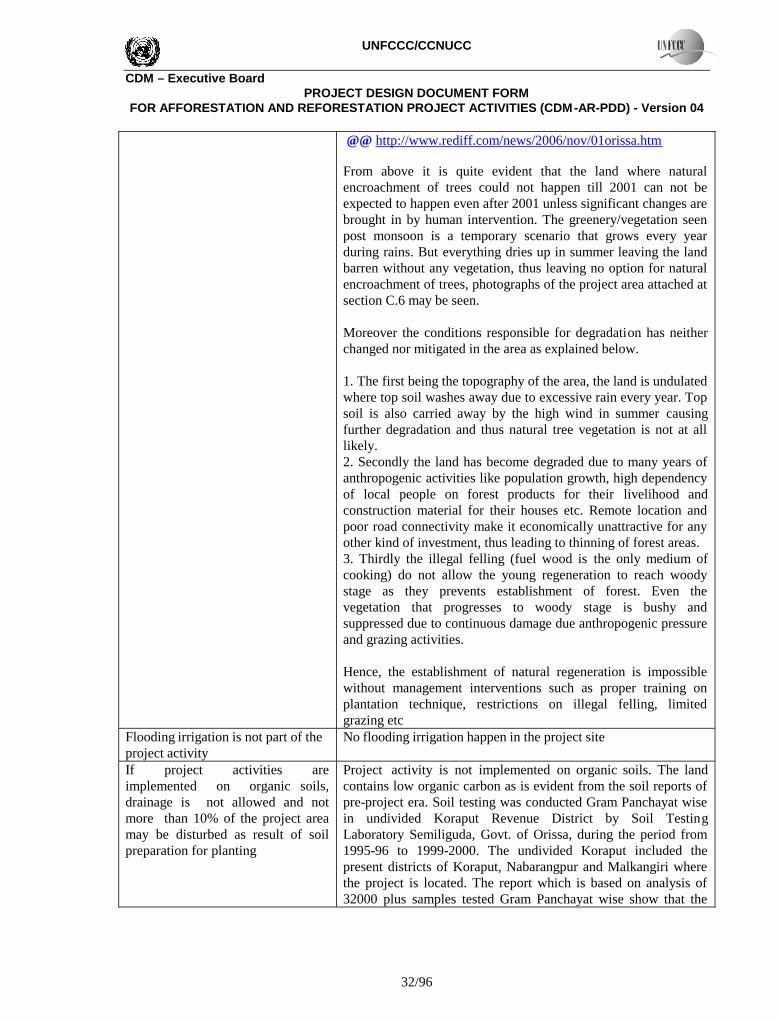
UNFCCC/CCNUCC
CDM – Executive BoardPROJECT DESIGN DOCUMENT FORM
FOR AFFORESTATION AND REFORESTATION PROJECT ACTIVITIES (CDM-AR-PDD) - Version 04
32/96
@@ http://www.rediff.com/news/2006/nov/01orissa.htm
From above it is quite evident that the land where naturalencroachment of trees could not happen till 2001 can not beexpected to happen even after 2001 unless significant changes arebrought in by human intervention. The greenery/vegetation seenpost monsoon is a temporary scenario that grows every yearduring rains. But everything dries up in summer leaving the landbarren without any vegetation, thus leaving no option for naturalencroachment of trees, photographs of the project area attached atsection C.6 may be seen.
Moreover the conditions responsible for degradation has neitherchanged nor mitigated in the area as explained below.
1. The first being the topography of the area, the land is undulatedwhere top soil washes away due to excessive rain every year. Topsoil is also carried away by the high wind in summer causingfurther degradation and thus natural tree vegetation is not at alllikely.2. Secondly the land has become degraded due to many years ofanthropogenic activities like population growth, high dependencyof local people on forest products for their livelihood andconstruction material for their houses etc. Remote location andpoor road connectivity make it economically unattractive for anyother kind of investment, thus leading to thinning of forest areas.3. Thirdly the illegal felling (fuel wood is the only medium ofcooking) do not allow the young regeneration to reach woodystage as they prevents establishment of forest. Even thevegetation that progresses to woody stage is bushy andsuppressed due to continuous damage due anthropogenic pressureand grazing activities.
Hence, the establishment of natural regeneration is impossiblewithout management interventions such as proper training onplantation technique, restrictions on illegal felling, limitedgrazing etc
Flooding irrigation is not part of theproject activity
No flooding irrigation happen in the project site
If project activities areimplemented on organic soils,drainage is not allowed and notmore than 10% of the project areamay be disturbed as result of soilpreparation for planting
Project activity is not implemented on organic soils. The landcontains low organic carbon as is evident from the soil reports ofpre-project era. Soil testing was conducted Gram Panchayat wisein undivided Koraput Revenue District by Soil TestingLaboratory Semiliguda, Govt. of Orissa, during the period from1995-96 to 1999-2000. The undivided Koraput included thepresent districts of Koraput, Nabarangpur and Malkangiri wherethe project is located. The report which is based on analysis of32000 plus samples tested Gram Panchayat wise show that the

UNFCCC/CCNUCC
CDM – Executive BoardPROJECT DESIGN DOCUMENT FORM
FOR AFFORESTATION AND REFORESTATION PROJECT ACTIVITIES (CDM-AR-PDD) - Version 04
33/96
organic carbon content is below 0.5% which indicates loworganic carbon in the project area. The report is available in theSoil Testing Laboratory, Sindhiguda. Thus the project activity isnot implemented on organic soil.
The establishment of project shallnot decrease availability of fuelwood
The pre project fuel wood collection on the project sites happenson a marginal level and the same is not affected with theimplementation of project activity. The areas are degraded; veryfew trees are present on project parcels those are sometimes usedfor fuel wood collection. But the amount per hectare works outnearly zero and would be difficult to monitor and measure.
Local villagers usually harvest herbaceous and shrub biomass forfuel wood. They can collect fuel wood still within the projectboundary by gathering dead wood and branches and shrubsgrowing between the trees.
C.3. Assessment of the selected carbon pools and emission sources of the approved methodology tothe proposed CDM project activity:>>Carbon Pools Selected (Yes / No) Justification / Explanation of choice
Above-groundBiomass
Yes Major carbon pool subjected to the project activity.
Below-groundBiomass
Yes Major carbon pool subjected to the project activity.
Dead Wood No As there is only a few pre-project living trees and the lands tobe planted are degraded and degrading or in a low-levelsteady state, carbon stocks in dead wood in the baselinescenario can be expected to decrease more or increase less,relative to the project scenario. Therefore based on appliedmethodology, this pool can be conservatively omitted.
Litter No As the lands to be planted are degraded and degrading or in alow-level steady state, carbon stocks in litter in the baselinescenario can be expected to decrease more or increase less,relative to the project scenario. Therefore based on appliedmethodology, this pool can be conservatively omitted.
Soil OrganicCarbon
Yes SOC may increase (when compared to baseline) due toimplementation of the A/R CDM project activity. Themethodology provides a default approach for accounting forthis pool if applicability conditions contained in paragraph5.1.4.1 are obeyed.
(i) The lands to be planted are not organic soils (e.g., peat-lands), or wetlands. It is evident from the soil report of Soilchemist, Govt. of Orissa, India before start of the project thatthe character of soil is low to medium range. It is also evidentfrom the PRA and land patta that before the project activity the

UNFCCC/CCNUCC
CDM – Executive BoardPROJECT DESIGN DOCUMENT FORM
FOR AFFORESTATION AND REFORESTATION PROJECT ACTIVITIES (CDM-AR-PDD) - Version 04
34/96
land had no use and it was fallen as degraded land.
(ii) As per baseline vegetation survey altogether 3385 parcelswere found with vegetatation, 1902 parcels having scatteredherbs & shrubs, trees with herbs & shrubs in 252 and onlytrees in 1231 out of 12437 parcels of the project area. Becauseof degraded nature of land majority of parcels are barrenwithout any woody vegetation. Herbs and shrubs that growduring rains, dries and disappear automatically with the onsetof summer. During site preparation at the best these herbs andshrubs are cleared which is less than 5% of the total area.Trees are essentially not removed at all.
(iii) Fine litter (woody twigs less than 2mm diameter, bark andleaves) remain on site. Its a usual practice in the area not tocollect and remove leaves and fine litters from Eucalyptusplantation fields as they are not eaten by goats, cows andbuffalos.
(iv) As detailed in Section A.5.4, at the most 1000 trees peracre are being planted which is established practiced, ie 2471trees per hectare. Pits dug for planting will be small (40-45 cmin diameter and 30-35 cm in depth). Considering maximum pitdia 45 cms, surface area per pit works out to be 0.15 m2.Therefore, the surface area getting disturbed by the sitepreparation is estimated to be 0.15*2471 = 370.65 m2 perhectare, ie 3.7% of the total area planted.
(v) Ploughing for site preparation is done generally withcountry plough, tractor is also used by a few exceptionalfarmers who can afford it. But in all ploughing land contour ismaintained. In no case land contour is disturbed /changed. It isneither required nor the farmers try as they normally do notafford the cost of changing the land contour.
As the project activity satisfies all applicability conditionslisted at paragraph 5.1.4 under soil organic carbon of themethodology the default method shall be used. Accordingly thedefault values of Δc = 0.5 t C per hectare per year and Te = 20years has been considered.
The methodology applied by the proposed A/R CDM project activity considers one emission by sourceswithin the project boundary, i.e., burning of woody biomass. The project activity is not considering‘burning of woody biomass’ for planting activities, however burning can occur accidentally in future.Therefore, CH4 emissions within the project boundary are taken into account.
Sources Gas Included/excluded
Justification/ Explanation of choice

UNFCCC/CCNUCC
CDM – Executive BoardPROJECT DESIGN DOCUMENT FORM
FOR AFFORESTATION AND REFORESTATION PROJECT ACTIVITIES (CDM-AR-PDD) - Version 04
35/96
CO2 Excluded Site burning was not taken up and shall not beemployed even in future. However, carbon stockdecreases due to burning are accounted as acarbon stock change.
CH4 Included Non-CO2 gas emitted from woody biomassburning
Burning ofwoody biomass
N2O Excluded Site burning was not taken up and shall not beemployed even in future. However potentialemissions are negligibly small.
C.4. Description of strata identified using the ex ante stratification:>>Stratification according to pre-existing conditions and baseline projections
Although the project sites are located in different states (as described in section A.5.1), the carbon statusof all the sites is more or less same. It is low or decreasing. The Ex ante stratification is done byconducting field visits and assessing the soil condition of areas under the project. Local communities areinterviewed (PRA conducted) to understand the land use land cover history. Few trees along with bushesof at the most 1 m height of different varieties and grasses and were found in a few parcels of the projectarea. The bushes and grass were visible during monsoon. But with the onset of summer only trees wereleft and all the bushes and grasses vanish. As per AR-ACM0001 (Version 04), section II.4 “changes incarbon stock of above ground and below ground biomass of non tree vegetation may be conservativelyassumed to be zero for all strata in the baseline scenario”. Based on this , the proposed A/R CDM projectarea is stratified depending on vegetation cover. Two strata were identified as below:
1. Baseline Strata I: Project land with few growing trees2. Baseline Strata II: Project land without trees
Baseline Strata I: Project Land with few growing Trees
Based on Ecological survey report all the parcels containing trees through the entire project area has beenshortlisted and assigned to Baseline strata I. A total of 8701 trees of different varieties in almost252+1231=1483 parcels spreading across 2939.30 hectares of project area have been found out of which252 parcels also contained scattered herbs & shrubs. The table below shows the list of trees recorded inthe project area:
S No Common Name Scientific Name Family1 Mango Mangifera indica Anacardiaceae.2 Cashew Anacardium occidentale Anacardiaceae3 Sal Shorea robusta Dipterocarpaceae4 Teak Tectona grandis Lamiaceae5 Mahuwa Madhuca longifolia Sapotaceae.6 Kusum Schleichera oleosa Sapindaceae7 Kendu Diospyros melanoxylon Ebenaceae8 Karanji Pongamia pinnata Papilionaceae9 Chakunda Cassia tora Caesalpinaceae
10 Jackfruit Artocarpus heterophyllus Moraceae

UNFCCC/CCNUCC
CDM – Executive BoardPROJECT DESIGN DOCUMENT FORM
FOR AFFORESTATION AND REFORESTATION PROJECT ACTIVITIES (CDM-AR-PDD) - Version 04
36/96
11 Guava Psidium gujav Myrtaceae12 Pipal Ficus religiocia Moraceae13 Castor Recinus cummunis Euphorbia14 Kachnar Bombax Ceiba Malvales15 Semal Bauhinia Semla Caesalpinaceae16 Arjun Terminilia Arjuna Combretaceae17 Beleric Terminalia Bellirica Combretaceae18 Silver Oak Grevelia Robusta Proteaceae19 Aonla Phyllanthus emblica Phyllanthaceae20 Tendu Diospyros Celebica Ebenaceae21 Tamarind Tamarindus indica Fabaceae
Baseline Strata II: Project Land without Trees
The remaining 10954 parcels without growing trees are assigned to Baseline strata II. Because ofdegraded nature of land, majority of parcels are barren, however herbs and shrubs appearing especiallyduring rains were noticed in almost 1902 parcels. The existing vegetation of the strata without growingtrees is analyzed by using list quadrate method and census survey method which is extensively used forvegetation survey. Considering the huge size and the discrete nature of the project site, a quadrate of size10 m X 10 m is taken for vegetation analysis. To ensure that the flora of the entire 252+1902 = 2154parcels having bushes of different varieties is represented, 20% ie 430 discrete parcels belonging todifferent landholdings are selected for analysis. Representative quadrates identified for analyzing thequalitative characters of vegetation, the details of which are given below.
S No Name of the Species Family Habit1 Acacia nilotica2 Cassia tora Leguminosae Herb3 Ipomea biloba Convolvulaceae Herb4 Capparis aphylla Capparidaceae Herb5 Croton bonplandianus Euphorbiaceae Herb6 Achyranthes aspera Amarantaceae Herb7 Parthenium hysterophorus Poaceae Herb8 Tephrosia purpurea Pappilionaceae Herb9 Cyperus diformis Cyperaceae Herb
10 Chloris montana Poaceae Herb
Table C.4.1 below shows the details of total area and no of parcels assigned to each of Baseline strata Iand II, year wise:
Table C.4.1: Baseline StratificationStrata Plantation Year
2001 2002 2003 2004 2005 2006 2007 TotalTotal nos of Baseline trees 358 526 710 1329 1778 1954 2046 8701No of Parcels per Baseline Strata:
Baseline Strata I (Parcelswith trees)
55 104 131 233 282 327 351 1483

UNFCCC/CCNUCC
CDM – Executive BoardPROJECT DESIGN DOCUMENT FORM
FOR AFFORESTATION AND REFORESTATION PROJECT ACTIVITIES (CDM-AR-PDD) - Version 04
37/96
Baseline Strata II (Parcelswithout trees)
352 662 862 1535 2305 2608 2630 10954
Total: 407 766 993 1768 2587 2935 2981 12437Area per Baseline Strata (ha)Baseline Strata I (Parcelswith trees)
73.30 169.97 254.63 418.35 620.82 673.95 728.28 2939.30
Baseline Strata II (Parcelswithout trees)
447.28 830.91 946.71 1745.36 2402.79 2726.48 2930.63 12030.16
Total: 520.58 1000.88 1201.34 2163.71 3023.61 3400.43 3658.91 14969.46
Stratification according to the planned AR-CDM project activity:
The planting year is the main factor influencing the variation of carbon stock changes for eachreforestation model under the project scenario. The project uses only Eucalyptus plantation. The growthmodel, planting schedule, fertilization, harvesting and replanting cycle are same for the entire projectactivity. The project defines 7 year plantation programme. Accordingly the project stratification has beendone on the basis of planting year. Therefore, the entire land included in the project activity has beenstratified into 7 project strata based on planting year as given in Table C.4.2 below:
Table C.4.2: Project StratificationPlantation Year Strata Area (Ha)
2001 Strata 1 520.582002 Strata 2 1000.882003 Strata 3 1201.342004 Strata 4 2163.712005 Strata 5 3023.612006 Strata 6 3400.432007 Strata 7 3658.91
Total: 14969.46
C.5. Identification of the baseline scenario:>>
C.5.1. Description of the application of the procedure to identify the most plausiblebaseline scenario (separately for each stratum defined in C.4.):>>
C.5.2. Description of the identified baseline scenario (separately for each stratum definedin Section C.4.):>>
C.6. Assessment and demonstration of additionality:>>The steps as outlined in the A/R Methodological tool “Combined tool to identify the baseline scenarioand demonstrate additionality in A/R CDM project activities”(Version 01) are followed todemonstrate that the proposed A/R CDM project activity is additional and not the baseline scenario. Bothbarrier arguments and investment analysis (steps 2 and 3) are applied.

UNFCCC/CCNUCC
CDM – Executive BoardPROJECT DESIGN DOCUMENT FORM
FOR AFFORESTATION AND REFORESTATION PROJECT ACTIVITIES (CDM-AR-PDD) - Version 04
38/96
STEP 0. Preliminary screening based on the starting date of the A/R project activity
The starting date of the project activity is after 31 December 1999:
The project activity has started on 25.06.2001, the date on which first tripartite agreement was executedbetween the company, the farmer and the bank to undertake project activity. The evidence for the startingdate is presented in Section B.1 i.e. the first tripartite agreement in respect of Shri Chaitan Kendu.
Though the project was started on 25.06.2001, CDM project documentation could not be startedimmediately after conceiving the project. The main reason being the company remained sick under BIFRtill November, 2005. It needs indepth analysis of company’s business and background to explain thedelays in CDM documentation.
Why CDM documentation could not be started immediately after conceiving the project:
The main reason that MTPL could not start CDM documentation immediately after conceiving theproject was financial constraints as well as absence of monitoring methodology. MTPL established itsfactory in extremely backward area. Govt of Orissa at the time of incorporation allotted land forplantation to the company on 20 years lease basis subject to payment of royalty. The company plantedthe area but at the time of harvesting, royalty issue got disputed because of charging royalty higher thanthe agreed one and was not allowed to harvest the crop. The company then moved to court of law and thematter is still subjudice. The company also planted lease hold land owned by group companies on piecemeal basis as trial but soon realized that the resulting landed cost was too high and they can’t continuedue to high security expenses to prevent illegal felling. Gradually almost 90% net worth wiped out withaccumulated losses and the company was finally adjudged sick under SICA by BIFR in December, 1998.The company remained sick till November, 2005 when BIFR discharged the company from the purviewof SICA vide their order dated 22.11.2005.
The company struggled for finance all those years while under BIFR. In spite of starting the A/R CDMproject activity in June’01, CDM documentation could not proceed at all. It involved many complicationsand was very cumbersome to get the scheme through from BIFR. Moreover there was no methodology orguidelines available to develop AR-CDM project. Even AR-WG was not formed. The first meeting ofAR-WG was held in July, 2004 and subsequently first monitoring methodology for AR projects wasissued in November, 2005
As soon as BIFR discharged the company from purview of SICA and the methodology for AR projectswas issued in November’05, CDM documentation started as is evident from the time line below:
Table C.6: Time Line of CDM ActivitiesS No Date Description of activity
1 December1998
MTPL incurred severe losses on account of plantation activity and was referred toBIFR as potentially sick company u/s 23 of Sick Industrial Companies (SpecialProvisions) Act (SICA) in 1990. The performance continued to deteriorate and wasfinally declared Sick in December 1998.
2 2000-01 Meanwhile when the company learnt about some external revenue for GHGabatement activities under Kyoto Protocol, the company thought of developingForestry-CDM project in line with farm forestry scheme approved by NABARD.

UNFCCC/CCNUCC
CDM – Executive BoardPROJECT DESIGN DOCUMENT FORM
FOR AFFORESTATION AND REFORESTATION PROJECT ACTIVITIES (CDM-AR-PDD) - Version 04
39/96
Scheme for Eucalyptus plantation on degraded land with bank finance was preparedand company’s field officers approached the farmers and tribal with the scheme.Villagers and farmers, the main stakeholders were consulted through series ofmeetings. 45 such meetings were conducted during December, 2000 to March 2001and response was good.
3 24.04.01 MTPL board then decided in its meeting on 24.04.2001 to go ahead with theproject, after considering CDM benefits under Kyoto Protocol. The minutes ofboard meeting reveals that CDM revenue was seriously considered for the projectwithout which the project was not sustainable as experienced by the company in thepast, copy of minutes provided below at the end of table.
4 25.06.01 Start date of project activity: First tripartite agreement between the farmer ShriChaitan Kendu (KBG001) of Baipariguda, District Koraput, the company and thefinancing bank was executed.
5 11.04.02 The company decided to take the help of external consultants to develop CDMproject and approached few agencies like Vidula Consultancy Services, Ernst &Young, Ordinal Consultants etc.
6 19.08.02 Vidula Consultancy came up to extend advisory services for CDM project and waswilling to make a presentation.
7 15.11.02 Consultants of Vidula Consultancy made a presentation on CDM process anddocumentation required.
8 21.07.03 VCS submitted price offer for visiting plantation sites at Nabarangpur to assessfeasibility of carbon credits which MTPL accepted.
9 08.09.03to
13.09.03
Site visit by the consultants of VCS from 08.09.03 to 13.09.03, report submitted on24.09.03. During the visit the consultants studied the plantation activity under farmforestry scheme and discussed preliminary requirements in view of developingCDM project with plantation team. The consultants concluded that the project hasenough potential to qualify as CDM project.
10 12.07.04 Vidula Consultany later intimated since there is no methodology and guidelinescurrently available for forestry projects, they would first require to develop newmethodology and submit for approval which is a difficult task. VCS was not willingto get into development of a new methodology. They suggested that AR-WG hasbeen formed and MTPL should wait till issue of approved methodology.
11 22.11.05 In the meantime the company remained Sick for five years when BIFR dischargedthe company from the purview of SICA in November’05 vide their order dated22.11.2005.
12 20.12.05 Vidula Consultany intimated that the 1st methodology on AR–CDM projects AR-AM0001 dated 28.11.05 has been issued by UNFCCC.
13 Dec 2005 Soon after coming out of BIFR and issue of AR methodology, the companyimmediately sought the help of Vidula Consultancy to develop CDM project. Otheragencies like Ernst & Young were also invited for their advisory services.
14 24.01.06 Ernst & Young and Vidula consultancy Services submitted their offers. The offerof Ernst & Young was too high and couldn’t be finalised. VCS submitted revisedoffer on 18.04.06 which was accepted.
15 05.05.06 Mandate was finalised with Vidula Consultancy Services for developing CDMproject.
16 07.03.07 PCN & PDD submitted to MoEF for Host Country Approval

UNFCCC/CCNUCC
CDM – Executive BoardPROJECT DESIGN DOCUMENT FORM
FOR AFFORESTATION AND REFORESTATION PROJECT ACTIVITIES (CDM-AR-PDD) - Version 04
40/96
17 03.04.07 Mandate for validation finalised with TUV-Sud (Methodology AR-AM0003).
18 25.04.07 Presentation of project activity at DNA meeting for Host country approval
19 03.06.07 DNA raised 19 issues vide their letter dated 29.05.07
20 11.06.07 Stakeholders’ meeting conducted at Nabarangpur for Orissa farmers
21 21.06.07 GPS data & Satellite Images: Action started for GPS data. Regional RemoteSensing Service Centre, Kharagpur (RRSSC) was enquired to offer for GPS dataand satellite image of the plantation sites.
22 08.07.07 Stakeholders’ meeting conducted at Kottur for Andhra Pradesh farmers
23 24.07.07 Reply sent to DNA’s letter dated 29.05.07
24 12.08.07 Stakeholders’ meeting conducted at Bastar for Chhatishgarh farmers
25 Nov’07 RRSSC sent proposal for mapping Chhatishgarh area only. They expressed theirinability for mapping Orissa and Andhra Pradesh that covered our major plantation.Search continued for other suitable agency.
26 21.11.07 After 04 months of submitting reply, DNA called for another presentation. Ourreply on issues raised in 29.05.07 letter was discussed.
27 06.01.08 After 2 months of our second presentation DNA rose 06 more queries vide letterdated 31.12.07.
28 14.05.08 Reply sent to DNA’s letter dated 31.12.07.
29 02.06.08 DNA sought confirmation on proposed changes in forest definition.
30 12.06.08 Studied and checked. Confirmation sent that our project is not affected with thechanged forest definition.
31 28.08.08 Located other agency for GPS mapping, M/s Salim Ali Centre for Ornithology &Natural History (SACON), Hyderabad who had CDM experience also. Theircredentials reflected they can complete the job within stipulated period of time.Asked to submit offer at the earliest.
32 12.09.08 HCA Approval: After 03 months, DNA issued HCA for the project vide theirletter dated 03.09.08.
33 11.10.08 Identified one NGO M/s Maa Syamalay Voluntary Organisation, Gadbaguda Street,Nabarangpur for conducting PRA. Order placed for conducting PRA.
34 31.10.08 Received offer from SACON and decided to finalise with them for GPS mapping.
35 13.11.08 Consequent upon merger of methodology AR-AM0003 with AR-ACM0001,revised the PDD and sent to Validator(Methodology applied AR-ACM0001 )
36 18.11.08 Final mandate issued to SACON for GPS mapping (Rs 710,000/-) to complete thejob in 4 months from date of receipt of 60% advance ie upto 18.04.09.
37 22.12.08 In view of changed methodology TUV-Sud submitted new offer for validation asper AR-ACM0001 on 12.12.08. Fresh mandate issued for validation on 22.12.08.
38 07.02.09 GSP: Uploaded PDD on UNFCCC website from 07.02.09 to 23.03.09 (45 days)inviting comments from Global Stakeholders.
39 25.02.09 Draft validation report as per new methodology AR-ACM0001 received fromTUV-Sud with 42 CARs.
40 23.03.09 PRA completed. Report received from the NGO, Maa Syamalay VoluntaryOrganisation.

UNFCCC/CCNUCC
CDM – Executive BoardPROJECT DESIGN DOCUMENT FORM
FOR AFFORESTATION AND REFORESTATION PROJECT ACTIVITIES (CDM-AR-PDD) - Version 04
41/96
________
41 26.08.09 Extension to SACON to finish GIS mapping by 31.08.09
42 26.08.09 Received all the maps from SACON: Current Period Maps-132, Maps of 1990Period-69, SHAPE File for entire area.
43 26.08.09 Revised PDD, dated 25.08.09 alongwith reply to all 42 CARs, maps and documentsin 11 annexure as detailed below sent to validator.
44 03.09.09 Validator raised a few issues related to CAR 11, 24, 25 and 28. Issues addressed,reply sent to validator on 11.09.09.
45 20.10.09to
24.10.09
Site visit by TUV auditors for validation
46 03.11.09 Draft validation protocol received on 03.11.09 with 19 CARs and 35 CRs.
CDM consideration:
MTPL incurred severe losses on account of plantation activity and was referred to BIFR as potentiallysick company u/s 23 of Sick Industrial Companies (Special Provisions) Act (SICA) in 1990. Theperformance continued to deteriorate and was finally declared Sick in December 1998. Meanwhile whenthe company learnt about some external revenue for GHG abatement activities under Kyoto Protocol, thecompany thought of developing A/Reforestation CDM project in line with farm forestry schemeapproved by NABARD. Scheme for Eucalyptus plantation on degraded land with bank finance wasprepared and company’s field officers approached the farmers and tribal of nearby villages with thescheme. Response was good. The company then decided to take up reforestation project, afterconsidering CDM benefits under Kyoto Protocol.
Decision to this effect was taken by MTPL board in its meeting on 24.04.2001 to go ahead with theproject, after considering CDM benefits under Kyoto Protocol. Incentive from planned sale of CERs wasseriously considered in the decision to proceed with the project activity. The minutes of board meetingreveals that CDM revenue was seriously considered for the project without which the project was notsustainable as experienced by the company in the past.
STEP 1. Identification of alternative land use scenarios to the proposed A/R CDM project activity
Sub-step 1a: Identify credible alternative land use scenarios to the proposed CDM project activity
a) The land used for agricultural practicesThe degraded condition of the land would not support agricultural practices. The farmers would notafford the costs for preparation of land for carrying cultivation. Some of the farmers or their forefatherstried to cultivate maize, paddy etc in past but the crop either dried or the productivity was very poorbecause of lack of irrigation, lack of proper upkeep and degraded nature of land. The yield was so poorcompared to investment they couldn’t get continue with cultivation anymore and thus the land remainedbarren.
Marginal agriculture by few well off farmers of the area can not be ruled out. Such farmers havedeveloped their land for cultivation on their own. They have alternate source of income, either throughsome business, shop, service or professional activity whose presence has been assessed at about 12% inthe PRA report that included 2% villagers also who are not the project participants. So the majorityfarmers included in the project activity are the poor down trodden farmers/ tribal who are not capable of

UNFCCC/CCNUCC
CDM – Executive BoardPROJECT DESIGN DOCUMENT FORM
FOR AFFORESTATION AND REFORESTATION PROJECT ACTIVITIES (CDM-AR-PDD) - Version 04
42/96
investing money to develop their degraded land for agricultural purpose. Thus this alternative is notfeasible.
b) Reforestation by the farmer on their own without support of MTPLThe project activity has been started in the state of Orissa reckoned to be backward due to poor economicgrowth where 47% population reportedly struggle below poverty line13. The land for reforestation isowned by such poor and illiterate farmers and tribal living below poverty line, most of them holding BPLcard also. They do not have assured source of income to meet their daily needs including fooding,clothing etc. They are daily wage earners, who depend on some labour job in the area for their livelihood,sometimes they get sometime not. Few of them own some agricultural land and earn their livelihoodthrough marginal cultivation. Soil fertility being very poor gives very poor yield resulting into very lowper capita income as is evident from the PRA exercise. The PRA reveals that 96% farmers of the projectactivity mainly depend on cultivation (50%), daily wages (34%) and small service providers (12%) withper capita income as low as Rs 4236/-, Rs 3533/- and Rs 3412/- respectively. Overall per capita incomeof the farmers is Rs 4031/- as against state’s average of Rs 9897/- and national average of Rs 17823/- in2001-0214. Therefore they can not afford to invest for reforestation where any return is expected notearlier than 5-6 years. So much so they dwell in very remote areas having no access to media and bankingfacilities totally unaware of schemes, incentives if any available for plantation activities. It is almostimpossible for them to approach banks for loan. Even if they approach, the bank will not extend financein absence of any means for assured return. They also lack plantation expertise for good crop and goodyield. Thus this alternative is not feasible and the land has remained barren since decades. Thus thisoption is not valid.
c) Reforestation by the farmer with support of MTPL (not undertaken as a CDM A/R project)
The lands to be reforested are heavily degraded due to continuous erosion with time which makes itunattractive for investors. The location of the project area is also remote in backward districts where lackof infrastructure; finance and proper expertise to carry out the project put major barriers. The degradedland in the state is 61.21 lakh hectares15, almost 40% of the total geographical area. The cultivable landexploited for cropping is comparatively more in the coastal districts of Orissa i.e. Balasore , Bhadrak,Cuttack, Ganjam, Jajpur, Jagatasinghpur, Kendrapara, Khurda, Nayagarh, Puri etc and not in the projectarea i.e., Nabarangpur, Koraput and Malkangiri. It would involve huge investment for making the landsuitable for plantation, managing proper infrastructure and employing experienced staff & workers tomonitor the plantations regularly. The company that remained sick till November 2005 and incurring lossthereafter also, can not afford to invest huge cost of plantation sustainably over a period of time withoutany external revenue. MTPL’s investment in the very first year of plantation in 2001-02 was more thanRs 10 lacs. Thus this is not a very viable option because it would need private funding, which is veryhard to obtain.
Furthermore there are commercial risks involved in reforestation on degraded land. Because of degradednature of land yield fluctuation and poor productivity adversely affect the ROI of the project. Uncertaintyprevailed in success rate of reforestation projects, in past, in the country. In 90s many private company’sraised funds from public for teak plantation with an assurance of handsome return. The plantation siteschosen were in remote areas, mostly degraded/ wasteland, that yielded poorly resulting into closure of the
13 www.vasundharaorissa.org/pdf/act&policy14 http://sampark.chd.nic.in/images/statistics/SDP2005R5.pdf15 http://india.gov.in/knowindia/agriculture_orissa.php

UNFCCC/CCNUCC
CDM – Executive BoardPROJECT DESIGN DOCUMENT FORM
FOR AFFORESTATION AND REFORESTATION PROJECT ACTIVITIES (CDM-AR-PDD) - Version 04
43/96
companies. So the financing banks feel that their lending is not effectively covered against failure to payas such reluctant to lend for reforestation projects. The bankers of the company always excludedplantation expenses from the statement while considering working capital.
d) Continuation of present scenario
A study conducted by a NGO, Water Initiatives of Orissa (WIO), a non-profit organization says there areindications of land degradation going up at an alarming pace in the state, land desertification in manyparts, especially in western and southern uplands. They are degrading from drought prone to desert proneareas. In just 13 years from 1991-92 to 2004-05, severely degraded land has increased by 136%, barrenland by 69% and non-agricultural land by 34%16 in the state.
No miracle can be expected from the farmers included in the project activity considering their economicconditions and experience, land topography, soil conditions, climatic conditions and water infrastructurein the project area. The farmers are left with no option other than to leave the land barren with littlemarginal farming, grazing etc. which is continuing since their forefathers. Hence continuation of presentscenario is the most feasible option that is leaving the land as barren and degraded with limited marginalcultivation & grazing.
From the above discussion it was found that the present land use; characterized by degraded lands withheavy soil erosion, without natural regeneration, and grazing activity but with very low yield, is the mostrealistic scenario available to project participants.
Sub-step1b. Consistency of credible alternative land use scenarios with enforced mandatory applicablelaws and regulations
Current laws and/or regulations allow all the alternative land use scenario. Therefore, the identifiedalternatives are entirely in compliance with applicable legal and regulatory requirements, currently and inthe foreseeable future. The following are the list of such laws:
1. The Indian Forest Act, 192717
2. The Wildlife (Protection) Act, 197218
3. Water (Prevention and Control of Pollution) Act, 1974 with Rules19
4. Forest (Conservation) Act, 198020
5. Environmental (Protection) Act, 198621
6. Noise Pollution (regulation and Control) Rules, 200022
16 http://www.rediff.com/news/2006/nov/01orissa.html17 http://www.envfor.nic.in/legis/forest/forest4.html18 http://www.envfor.nic.in/legis/wildlife/wildlife1.html19 http://www.envfor.nic.in/legis/water/wat1.html20 http://www.envfor.nic.in/legis/forest/forest2.html21 http://www.envfor.nic.in/legis/forest/forest2.html22 http://envfor.nic.in/legis/noise/noise.html

UNFCCC/CCNUCC
CDM – Executive BoardPROJECT DESIGN DOCUMENT FORM
FOR AFFORESTATION AND REFORESTATION PROJECT ACTIVITIES (CDM-AR-PDD) - Version 04
44/96
All the above policies are taken into consideration while evaluating the alternatives to the project activityand the following alternatives listed are in compliance with the applicable laws and regulations.
Identified Alternatives Permitted / Not Permittedby RegulationsThe land used for agricultural practices Permitted
Reforestation by the farmer on their own without support ofMTPL
PermittedReforestation by the farmer with support of MTPL (notundertaken as a CDM A/R project)
Permitted
Continuation of present scenario Permitted
STEP 2. Barrier analysis
Sub-step 2a: Identification of barriers that would prevent the implementation of at least onealternative land use scenarios:
The proposed A/R CDM project activity faces a number of investments, technological, infrastructural,institutional and social barriers to its implementation described as below:
a) Investment barriersProject activity involves investments by MTPL well as the farmer – by MTPL for development ofnursery, training and demonstration, monitoring for good growth and by the farmer for planting andmaintenance of trees. Investment barrier is faced by the farmers because of huge initial investmentrequired for reforestation with a longer gestation period. In the project activity, however, the waitingperiod is five years minimum being reforestation of eucalyptus, a fast growing species.
The land under project activity is owned by poor farmers, tribal, daily wage earners who do not havecapital to invest. They own small parcels of land. As per the land ownership structure (Figure A.2.2),64% farmers own land 3 acre or less and 28% between 3 to 5 acres, ie the land holding of the majority92% is 5 acres or less. Among remaining 8%, merely 1% hold land more than 10acres. The PRA studyreveals that 96% farmers of the project activity mainly depend on cultivation (50%), daily wages (34%)and small service providers (12%) with per capita income as low as Rs 4236/-, Rs 3533/- and Rs 3412/-respectively. Overall per capita income of the farmers is Rs 4031/- as against state’s average of Rs 9897/-in Orissa, Rs 12032/- in Chhatishgarh and Rs 17932/- in Andhra Pradesh in 2001-0215. Evidently theireconomic condition do not allow them to afford high establishment cost in the early stage of plantationand to wait for wood harvesting income that will come only after 5-6 years, in best scenarios. Allincomes from timber, and CERs, were envisaged to occur five years after the start of the proposed A/RCDM project activity. High initial investment without quick return is beyond the means of the landowners. Farmers participating in reforestation have little opportunity for debt funding, banks tend to bereluctant to lend to those living at the subsistence level because they have few assets for collateral andlittle disposable income available for debt service. According to the International Fund for AgriculturalDevelopment (IFAD), “more than one billion people – 90 per cent of the world’s self-employed poor –lack access to basic financial services, depriving them of the means to improve their incomes, securetheir existence, and cope with emergencies”23.
b) Technological barriers:
23 http://www.ifad.org/media/press/2004/38.htm

UNFCCC/CCNUCC
CDM – Executive BoardPROJECT DESIGN DOCUMENT FORM
FOR AFFORESTATION AND REFORESTATION PROJECT ACTIVITIES (CDM-AR-PDD) - Version 04
45/96
The tribal farmers in the region do not have access to quality seed sources and lack skills for producinghigh quality seedlings. They also lack expertise for successful tree planting. They are far poorly educatedto have access to information and knowledge that will help them achieve any benefit from the land thatthey own. MTPL encourages the farmers and provides technical support for the plantation activity free ofcost. Technological barriers faced by the farmers are established as per section 7 of PRA report (Page 18)submitted by Maa Syamalay Voluntary organisation, NGO of the area who conducted PRA for theproject.
c) Barriers due to local ecological conditions:The reforestation sites are all degraded land since decades as is evident from Landsat TM 1990 satelliteimagery of the parcels. Land remained barren with no vegetation cover causing undesired compactness ofsoil. Due to direct exposure to wind and water erosion, topsoil is almost eroded. Unfavourablemetrological conditions like frequent drought in the region are not allowing agriculture to flourish in thearea of project activity. The topography of land is undulated, soil is rocky, deficient in necessarynutrients making the land unfit for agriculture uses.
d) Barriers due to social conditions: The barriers due to social conditions are identified as under:Lack of skill and proper training: The technical know how and skill for eucalyptus plantation oncommercial scale to get viable yield is lacked with most of the farmers as most of them are illiterate.There is no mechanism for training and demonstration on good planting, manuring, harvesting, and soilconservation techniques available in the area.
Lack of organisation: Planting large plantations requires more than a single individual. The localcommunities lack the organisational structure to put together a volunteer effort to plant trees. Thisstatement is supported by the fact that India has had a National Forestry Policy in effect since 1988 toaddress the problem of deforestation but is still seeing annual losses in forest cover. MTPL provide theorganisational structure, necessary to overcome this barrier. MTPL provides the training and provides thenecessary manpower and support.
e) Barriers relating to market and transportation:The reforestation sites are mostly in remote areas where road connectivity is poor , roads are undevelopedputting major barrier in transportation of harvested crop. Timber has to be dragged to road at many siteslacking road approach, incurring additional charges for dragging that grind the profitability of timber.Institutional transporters, owing to perceived risks, in general, are reluctant to operate in remote areaswhich is evident from various correspondences with transporters. Letters from two transporters - OrissaBengal Carrier Ltd, Kolkata and Dilip Kumar Tripathy , Nabarangpur showing their reluctance are a fewexamples. So the company has to depend on local vehicle owners, so the company has to depend on localvehicle owners. The farmers too face difficulty in getting market and transport for their crop; they fullydepend on the company which is evident from various correspondences from the farmers. Letter fromfarmers of Nandpur and Padwa bank areas of Koraput district, dated 10.06.02 written in this regard is oneexample.
Besides, in absence of institutional arrangements to assure market and prices for produce, the farmers arehesitant to dedicate their land for farm forestry. Study report “Sustainable land & forest regeneration” byIndira Gandhi Institute of Development Research refers experiences in Haryana and Gujarat whereeucalyptus plantation initially increased but declined with decrease in price25.25Sustainable land & forest regeneration

UNFCCC/CCNUCC
CDM – Executive BoardPROJECT DESIGN DOCUMENT FORM
FOR AFFORESTATION AND REFORESTATION PROJECT ACTIVITIES (CDM-AR-PDD) - Version 04
46/96
Sub-step 2b: Elimination of land use scenarios that are prevented by the identified barriers.
SNo
Alternatives How identified barriers prevent implementation of crediblealternatives identified at step 1a.
Prevented/Not
prevented bybarrier
a) The land used foragriculturalpractices
1. Investment barrier:The land owners in the project activity are poor farmers/ tribal/ dailywage earners who would neither afford the cost of land preparationfor agricultural practices on their own nor can get bank finance due tolack of guaranteed return. Hence stated alternative faces theinvestment barrier.
Prevented bythe barrier
2. Technological Barrier:The required skill and know-how for this alternative is lacked withmost of the farmers except the practices in vogue and whatever theyhave learnt from their forefathers. Few tried agriculture but eitherfailed or stopped due to poor yield. Hence it also faces this barrier tosome extent.
Prevented tosome extent
3. Barriers due to local ecological conditions:Due to the degraded nature of land, eroded top soil, undulatedtopography, rocky soil deficient in necessary nutrients, absence ofwater resources and unfavourable metrological conditions likefrequent drought in the region has made the land unfit for agricultureuses. Soil reclamation for agriculture purposes is very difficult andcostly affair, if not impossible. Land productivity is very poor. Fewtried agriculture but either failed completely or stopped due to pooryield. Hence the alternative faces major ecological barrier.
Prevented bythe barrier
b) Reforestation bythe farmer on theirown withoutsupport of MTPL
1. Investment barrier:The stated alternative faces major investment barrier by the farmers.They are mostly small land owners, 92% holding 5 acre or lessamong which 64% even less than 3 acres that indicates their pooreconomic condition (Figure A.2.2 at page 3). Eucalyptus plantationcosts Rs 8388/- per acre to establish. Per capita income of the farmersof the project activity as revealed from PRA study is Rs 4031/- muchbelow even the states’s average of Rs 9897/- in Orissa, Rs 12032/- inChhatishgarh and Rs 17932/- in Andhra Pradesh in 2001-0212 whichis significantly low and indicates the degree of deprivation. So thefarmers lack capital, their economic condition would not allow themto invest for reforestation where any return is expected not earlierthan 5-6 years. So much so they are not easily accessible to bank forfinance. Even they approach, the banks are reluctant to extend loan inabsence of assured means of return. Hence stated alternative facesmajor investment barrier.
Prevented bythe barrier
2. Technological Barrier:Lack of access to necessary materials: The farmers are not aware ofdevelopment of good quality seedlings, good planting practices,required quality of manure & fertilizer and their applicationprocedure. Therefore, implementation of this alternative is notpossible with the barrier stated. Technological barriers faced by thefarmers are established as per section 7 of PRA report (Page 18) byMaa Syamalay Voluntary organisation, NGO of the area whoconducted PRA for the project.
Prevented bythe barrier.

UNFCCC/CCNUCC
CDM – Executive BoardPROJECT DESIGN DOCUMENT FORM
FOR AFFORESTATION AND REFORESTATION PROJECT ACTIVITIES (CDM-AR-PDD) - Version 04
47/96
3. Barriers due to local ecological conditions:Due to degraded nature of land, top soil erosion, undesiredcompactness of soil, deficiency of necessary nutrients, rocky soil andunfavourable metrological conditions like frequent drought theproductivity of land is adversely affected that puts a major threat toimplementation of project activity.
Prevented bythe barrier.
4. Social Barrier:Lack of skill and proper training: The technical know how andskill for eucalyptus plantation on commercial scale to get viable yieldis lacked with most of the farmers as most of them are illiterate. Thereis no mechanism for training and demonstration on good planting,manuring, harvesting, and soil conservation techniques available inthe area.Lack of organisation: The alternative also faces lack of organisationfor collective reforestation which is very much essential for assuredtransportation and sale of produce. In the event of piece mealplantation, transportation and market both will be difficult for thefarmers, as mostly residing in remote areas. The farmers would not beable to encash the crop resulting into major barrier.
Prevented bythe barrier.
5. Barriers relating to market and transportation:The farmers are residing in remote areas, their reforestation sites arealso in remote areas which has poor road connectivity, no roadconnectivity and undeveloped roads putting major barrier intransportation of harvested crop. Its difficult for them to gettransporters as well as market for their piece meal plantation inremote areas. The farmers are not able to get market and transport fortheir crop, they fully depend on the company which is evident fromvarious correspondences from the farmers addressed to company.letter from farmers of Nandpur and Padwa bank areas of Koraputdistrict, dated 10.06.02 written in this regard is one example.
Besides, in absence of institutional arrangements to assure market andprices for produce, the farmers are hesitant to dedicate their land forfarm forestry. Study report by Indira Gandhi Institute of developmentResearch refers experiences in Haryana and Gujarat where eucalyptusplantation declined with decrease in price25.
Prevented bythe barrier.
c) Reforestation bythe farmer withsupport of MTPL(not undertaken asa CDM A/Rproject)
1. Investment Barrier:MTPL’s investment in the very first year of plantation in 2001-02 wasmore than Rs 10 lacs. The company that remained sick till November2005 and incurring loss thereafter also, can not afford to invest hugecost of plantation sustainably over a period of time without anyexternal revenue. Thus this is not a very viable option because itwould need private funding, which is very hard to obtain.
Prevented bythis barrier
2. Technological Barrier:Lack of access to necessary materials: This barrier is supplementedby MTPL by providing quality seedlings, replacement of moratorium,manure & fertilizer and their application procedure.
Notprevented bythe barrier
3. Barriers due to local ecological conditions:Due to degraded nature of land, top soil erosion, undesiredcompactness of soil, deficiency of necessary nutrients, rocky soil andunfavourable metrological conditions like frequent drought theproductivity of land is adversely affected that puts a major threat to
Notprevented bythe barrier

UNFCCC/CCNUCC
CDM – Executive BoardPROJECT DESIGN DOCUMENT FORM
FOR AFFORESTATION AND REFORESTATION PROJECT ACTIVITIES (CDM-AR-PDD) - Version 04
48/96
implementation of project activity.4. Social Barrier:Lack of proper skill and training: MTPL provides technicalsupport to develop required know how and skill for good plantingpractices for commercial plantation of eucalyptus to get viable yield.The field officers arrange training and demonstration sessions ongood planting, manuring, harvesting, and soil conservation techniquesat a common place convenient to the farmers in their villages.Sometimes these sessions are conducted at factory also, if deemednecessary.Lack of organisation: This barrier is supplemented by MTPL withtheir organisational set up. The field officers encourage the farmersfor collective plantation. A farmer gets motivated with the work ofother farmers and thus no multiplies. This helps them to get assuredtransportation and market thus realising their harvest without anyhassle.
Notprevented bythe barrier
5. Barriers relating to market and transportation:The reforestation sites are mostly in remote areas where roadconnectivity is poor, roads are undeveloped putting major barrier intransportation of harvested crop. Timber has to be dragged to roadside at many sites lacking road approach, incurring additional chargesfor dragging that grind the profitability of timber. Institutionaltransporters, owing to perceived risks, in general, are reluctant tooperate in remote areas which are evident from variouscorrespondences from the transporters. Letters from transporters -Orissa Bengal Carrier Ltd, Kolkata and Dilip Kumar Tripathy,Nabarangpur showing their reluctance are a few example. So thecompany has to depend on local vehicle owners.
Prevented bythe barrier tosome extent.
d) Continuation ofpresent scenario
This alternative does not face any of the identified barriers. Notprevented byany of thebarriers
The alternative land use scenario identified in sub-step 1a above can be eliminated from baselinescenarios due to barriers faced. The alternative land use continuation of present land use scenario i.e.status as degraded land does not face the above-mentioned barriers.
Sub-step 2c. Determination of baseline scenario (if allowed by the barrier analysis)Is afforestation without being registered as an A/R CDM project activity included in the list of land usescenarios that are not prevented by any barrier?
→ no, then:Does the list contain only one land use scenario?
→ yes, the remaining land use is the baseline scenario.
The alternative, leaving the land without any change in land use (continued status as degraded land) does,of course, not face any of the above-mentioned barriers.
STEP 3: Investment analysis
The role of MTPL is like a facilitator. The company creates awareness and encourages farmers forreforestation, provides technical assistance, nursery facility, arrange finance from bank, monitor s

UNFCCC/CCNUCC
CDM – Executive BoardPROJECT DESIGN DOCUMENT FORM
FOR AFFORESTATION AND REFORESTATION PROJECT ACTIVITIES (CDM-AR-PDD) - Version 04
49/96
harvesting & coppicing etc which requires huge expenditure on account of salary & wages of work force,conveyance, trainings & meetings etc.
Sub-step 3a. Determine appropriate analysis method
As per the tripartite agreement entered between the company, bank and the farmers, the companyprovides buy back guarantee for timber proceeds at market price prevailing at the time of harvest . So thecompany does not get any price preference. The only return the company does get is securing rawmaterial for its factory. The project activity therefore does not generate any financial or economicbenefits other than CDM revenues hence Option I: Simple cost analysis is applied for investmentanalysis. The relevant article 1.6 of the tripartite agreement signed with the farmers in the year 2001 isreproduced as below:
“The user industry agrees to pay to the bank to the farmer’s credit the proceeds of the sale of timberreceived at a minimum rate of Rs 1000/- per MT of Hardwood including bark delivered at mill oraccording to the prevailing market rate whichever is higher at the time of harvest. The rate will bedecided and determined by a committee consisting of Bank, representative of Industry and the farmers.”
Sub-step 3b. Option I: Apply simple cost analysis
When MTPL learnt about external revenue for reforestation activities under Kyoto Protocol the companydecided to develop A/Reforestation CDM project in line with farm forestry scheme. The company startedplantation activity in 2001-02 and engaged 14 dedicated personnel for giving technical demonstration &consultation, visiting farmers, organising meetings with them to propel FFS and motivate theirparticipation, organising training for them and monitoring the plantation activity in the degraded land.The company incurred direct expenses of more than Rs 10 lacs in the very first year of plantation,without any return, as computed in the table below:
Table C.6.1: Direct Expenses on Plantation activity by MTPL(Year 2001-02)
SNo
Expense Account HeadTotal Cost in 2001-02
(Rs)1 Salary & Wages 769212
2 Two wheeler expenses 21040
3 Staff conveyance 62484
4 Vehicle hiring expenses 190682
Total: 1043418.4
The above expenses are direct expenses computed conservatively for plantation activity based oncompany’s book of accounts of 2001-02 which are likely to increase every year due to inflation as well asincrease in planted area.
The company provides the above services free of charge as stipulated in Article 1.3 of the tripartiteagreement without which the project would have not happened. Article 1.3 of the agreement reproducedbelow:
UNFCCC/CCNUCC
CDM – Executive BoardPROJECT DESIGN DOCUMENT FORM
FOR AFFORESTATION AND REFORESTATION PROJECT ACTIVITIES (CDM-AR-PDD) - Version 04
50/96
“The industry agrees to provide technical guidance, assistance and services relating to planting andmaintenance of such plantation till they are harvested, and also agrees to undertake the supervisory workin implementing the scheme for Eucalyptus plantation in the farmers’ field. However it is specificallyunderstood and agreed by the parties that the industry will not be liable for any damage or loss sustainedby the farmers on account of failure of crops wholly or partially or low yield or for any other losses forany reason whatsoever.”
Therefore it is evident that the project activity does not generate any financial or economic benefit for thecompany except the CDM related revenue. MTPL, being a loss making company, can not bearsustainably the huge operation and maintenance cost of plantation as above without any external revenue.
Thus investment in such a project, which is prone to so many risks, was a tough decision to take. On theother hand, the continuation of the current scenario would not need any reforestation activity on thedegraded land and does not involve any additional costs.
STEP 4: Common practice analysis
With the growth of forestry based industries in the region there has been some reforestation currentlyunderway but they essentially differ from the project activity at least in three ways. The two paperindustries in the region – Sewa unit of Ballarpur Industries Ltd (BILT) near Jeypore in Koraput districtand JK Paper in Raygada district neighbouring Koraput also require timber as raw material formanufacturing paper. They have also initiated reforestation in the region. JK Paper is conducting thisactivity as a CDM project. BILT is engaged in reforestation activity through its subsidiary unit BILTTree Tech Ltd but widely differs from the scheme adopted in the project activity. The “Report on similarReforestation activities in the area” by the NGO engaged for conducting PRA provides relevantinformation on reforestation by BILT.
BILT, Sewa unit started reforestation in the area in 1995-96 through lease plantation in Boipariguda &Boriguma bank areas of Koraput district on SC/ST land which got subjudice and the company had toreturn the entire land to their owners. The company then started selling seedlings on direct sale basis tointerested farmers who were economically well off or those capable of arranging finance of their own.The company does not facilitate or initiate to arrange finance to the farmers for plantation activity, a fewbig farmers have been named in the report who neither required nor availed bank finance. As a resultonly few well off farmers/communities or SHGs capable of investing on plantation are benefited andhave gone for reforestation. The company at their units at Ballarpur in Maharashtra and Kamalapuram inAndhra Pradesh has been conducting reforestation with bank finance and very recently, FFS with bankfinance started at Sewa unit also.
Whereas the farmers under the project activity are small farmers, 60% owning land ≤ 3 acres, 32%between 3-5 acres, 7% between 5-10 acres and only 1% above 10 acres. They are economically weakwith average annual per capita income of Rs 4031/-, not capable of plantation on their own and reside inremote areas. MTPL officials proactively approach them and encourage them for reforestation on theirdegraded land with financial assistance by local banks. They educate them on farm forestry scheme,availability of bank finance and technical assistance to involve them for refores tation. The land categoryfor reforestation in the project activity is essentially chosen to be degraded land ensuring bank finance.Consequently the project activity has been able to benefit small & poor farmers/tribal at such a largescale, numbering 12000 plus farmers.

UNFCCC/CCNUCC
CDM – Executive BoardPROJECT DESIGN DOCUMENT FORM
FOR AFFORESTATION AND REFORESTATION PROJECT ACTIVITIES (CDM-AR-PDD) - Version 04
51/96
Based on above the essential distinctions are summarised as under:
1. BILT is primarily selling seedlings/clones on direct sale basis to economically well off farmerswho are capable of investing and growing trees of their own without bank finance and tripartiteagreement.
2. Due to non availability of bank finance small & marginal land owners in remote areas may notparticipate in such plantation activity.
3. Thirdly the company targets to plant short-rotation and fast growing species in accessible areasrather than planting degraded land in remote areas which is not economically attractive due tolow land productivity and high transportation cost.
4. Reforestation with bank finance under FFS is practiced in BILT’s other units at Ballarpur(Maharashtra) and Kamalapuram (AP) while at Sewa unit this scheme is at its infant stage.
5. There is no requirement for land being degraded. Land for reforestation may or may not bedegraded land, may be agricultural land also which is evident from their triparti te agreement. InMTPL’s scheme land for reforestation have to be degraded land. Under farm forestry schemeapproved by NABARD the bank finance is available only for reforestation on degraded land andnot on agricultural land.
With establishment of above essential distinctions between the project activity and similar reforestationactivities, the proposed A/R CDM project activity is not the baseline scenario and, hence, it is additional.This also complements the above barrier as well as investment analysis, which indicates thatreforestation, is economically unattractive in the absence of proposed A/R CDM project activity, due topoor economic condition of the farmers, low land productivity and high transportation costs.
Land regeneration programmes:
Study by one local NGO, Water Initiative of Orissa (WIO) indicates severe desertification, degradation atalarming pace and rapid change of drought prone areas into desert prone areas in the state. The NGOclaims, in just 13 years from 1991-92 to 2004-05, severely degraded land has increased by 136%, barrenland by 69% and land converted to non agricultural use by 34%.http://www.rediffnews.com/news/2006/nov/01orissa.htm
The paper “Sustainable Land & Forest Regeneration” reports that the government, alarmed by ecologicaldegradation and consequent poverty, is emphasizing land regeneration programmes involving differentministries in association with several agencies, non government organisations. Despite multiplicity ofland regeneration programmes, the results have not been as encouraging as expected. There are severallacunae and constraints in these programmes – institutional, financial, technical and legal that preventsachieving the targets25.
Recent study “Assessment of large-scale deforestation of Nawarangpur district, Orissa, India: a remotesensing based study” conducted by the scientists C Sudhakar Reddy, K Ram Mohan Rao, ChiranjibiPattanaik & P K joshi of SACON, a Remote Sensing organisation states that there has been increase indeforestation in the district, deforestation rate 3.62 assessed for the period from 1973 to 1990 hasincreased to 3.97 during 1990 to 2004.26http://www.springerlink.com/content/f13257052uwv2471/fulltext.pdf?page=1
With the carbon benefit, reforestation on degraded lands becomes economically acceptable. This createsan incentive to project participants to do the necessary documentation for bank loan on behalf of poor

UNFCCC/CCNUCC
CDM – Executive BoardPROJECT DESIGN DOCUMENT FORM
FOR AFFORESTATION AND REFORESTATION PROJECT ACTIVITIES (CDM-AR-PDD) - Version 04
52/96
tribal/farmers for reforestation on degraded lands. In turn this provides more ecological benefits such asconservation of biodiversity and soil erosion control. This will contribute to the goal of increasing forestresources, as well as the carbon dioxide sequestration and general ecological environment improvement.
C.7. Estimation of the ex ante baseline net GHG removals by sinks:>>The baseline net greenhouse gas removal by sink is calculated by using the equation given in themethodology. The baseline net GHG removal by sink is determined as follows:
∆CBSL = ∆CBSL,tree
∆CBSL Baseline net greenhouse gas removable by sinks, tCO2-e∆CBSL,tree Sum of the carbon changes in above ground and below ground biomass of trees in
the baseline; tCO2-e
For those strata without growing trees the methodology conservatively assumes that, ∆CBSL,tree, baseline=0.For those strata with a few growing trees, baseline, is estimated using stock change method.
J
∆CBSL,AG/BG,i,t = ∑(Cj,i,t2 – Cj,i,t1)/Tj=1
Cj,i,t = CAB_tree,j,i,t + CBB_tree,j,i,t
CAB_tree,j,i,t = ABSL,i * Vtree,j,i,t * Dj * BEF2,j * CFj
CBB_tree,j,i,t = CAB_tree,j,i,t * Rj
∆CBSL,AG/BG,i,t Annual carbon stock change in above-ground and below-ground treebiomass for stratum i, time t; t C yr-1
Cj,i,t2 Total carbon stock in living biomass of trees of species j in stratum i,calculated at time t2; t C
Cj,i,t1 Total carbon stock in living biomass of trees of species j in stratum i,calculated at time t1; t C
T Number of years between times t2 and t1; yrCAB_tree,j,i,t Carbon stock in above-ground tree biomass of species j in stratum i, at time
t; t CCBB_tree,j,i,t Carbon stock in below-ground tree biomass of species j in stratum i, at time
t; t CABSL,i Area of baseline stratum i; haVtree,j,i,t Pre-project tree stem volume for species j, stratum i, at time t; m3 ha-1
Dj Basic wood density for species j; t d.m. m-3
BEF2,j Biomass expansion factor for conversion of stem biomass to above-groundtree biomass for tree species j; t d.m t-1 d.m
Rj Root-shoot ratio appropriate for biomass stock, for species j; t C t-1 Ci 1, 2, 3, … MB strata in the baseline scenarioj 1, 2, 3, … J tree species in the baseline scenariot 1, 2, 3, … t* years elapsed since the start of the A/R CDM project activity

UNFCCC/CCNUCC
CDM – Executive BoardPROJECT DESIGN DOCUMENT FORM
FOR AFFORESTATION AND REFORESTATION PROJECT ACTIVITIES (CDM-AR-PDD) - Version 04
53/96
Data / parameter: ABSL,j,i
Data unit: haUsed in equations: 4, 9, 11Description: Area under trees of species j in baseline stratum iSource of data: GPS coordinates and/or remote sensing dataMeasurement procedures (if any): N/A
Any comment: -
Data / parameter: BEF2,j
Data unit: DimensionlessUsed in equations: 6Description: Biomass expansion factor for conversion of annual net
increment (including bark) in stem biomass to total above-ground tree biomass increment for species j
Source of data: IPCC GPG for LULUCF Table- 3A.1.10Measurement procedures (if any): N/A
Any comment: -
Data / parameter: DjData unit: t.d.m. m-3
Used in equations: 6, 9, 15Description: Basic wood density for species j
Source of data: Project data baseMeasurement procedures (if any): N/A
Any comment: -
Data / parameter: RjData unit: kg d.m.yr-1 (kg d.m.yr-1 )-1
Used in equations: 10, 16, 20Description: Root-shoot ratio appropriate for biomass stock, for species jSource of data: IPCC GPG for LULUCF Table- 3A.1.8Measurement procedures (if any): N/A
Any comment: -
The carbon stock in living biomass of pre-project growing trees is expected to increase in the absence of theproposed A/R CDM project activity, due to continuous growth of the living trees. The carbon stock in theliving biomass of pre-project trees has been predicted using equation from Brown et al.24 (1989) for dryforest in India.
24 Brown, S. 1997. Estimating biomass and biomass change of tropical forests: a primer. FAO ForestryPaper 134, Rome, Italy
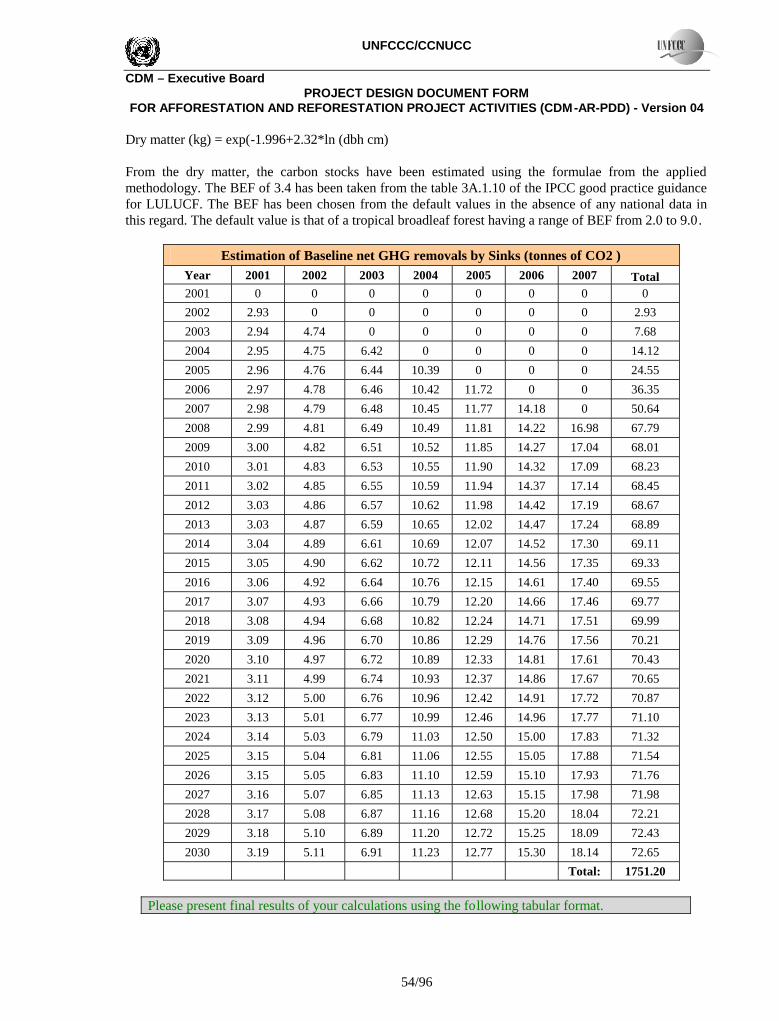
UNFCCC/CCNUCC
CDM – Executive BoardPROJECT DESIGN DOCUMENT FORM
FOR AFFORESTATION AND REFORESTATION PROJECT ACTIVITIES (CDM-AR-PDD) - Version 04
54/96
Dry matter (kg) = exp(-1.996+2.32*ln (dbh cm)
From the dry matter, the carbon stocks have been estimated using the formulae from the appliedmethodology. The BEF of 3.4 has been taken from the table 3A.1.10 of the IPCC good practice guidancefor LULUCF. The BEF has been chosen from the default values in the absence of any national data inthis regard. The default value is that of a tropical broadleaf forest having a range of BEF from 2.0 to 9.0.
Estimation of Baseline net GHG removals by Sinks (tonnes of CO2 )Year 2001 2002 2003 2004 2005 2006 2007 Total2001 0 0 0 0 0 0 0 0
2002 2.93 0 0 0 0 0 0 2.93
2003 2.94 4.74 0 0 0 0 0 7.68
2004 2.95 4.75 6.42 0 0 0 0 14.12
2005 2.96 4.76 6.44 10.39 0 0 0 24.55
2006 2.97 4.78 6.46 10.42 11.72 0 0 36.35
2007 2.98 4.79 6.48 10.45 11.77 14.18 0 50.64
2008 2.99 4.81 6.49 10.49 11.81 14.22 16.98 67.79
2009 3.00 4.82 6.51 10.52 11.85 14.27 17.04 68.01
2010 3.01 4.83 6.53 10.55 11.90 14.32 17.09 68.23
2011 3.02 4.85 6.55 10.59 11.94 14.37 17.14 68.45
2012 3.03 4.86 6.57 10.62 11.98 14.42 17.19 68.67
2013 3.03 4.87 6.59 10.65 12.02 14.47 17.24 68.89
2014 3.04 4.89 6.61 10.69 12.07 14.52 17.30 69.11
2015 3.05 4.90 6.62 10.72 12.11 14.56 17.35 69.33
2016 3.06 4.92 6.64 10.76 12.15 14.61 17.40 69.55
2017 3.07 4.93 6.66 10.79 12.20 14.66 17.46 69.77
2018 3.08 4.94 6.68 10.82 12.24 14.71 17.51 69.99
2019 3.09 4.96 6.70 10.86 12.29 14.76 17.56 70.21
2020 3.10 4.97 6.72 10.89 12.33 14.81 17.61 70.43
2021 3.11 4.99 6.74 10.93 12.37 14.86 17.67 70.65
2022 3.12 5.00 6.76 10.96 12.42 14.91 17.72 70.87
2023 3.13 5.01 6.77 10.99 12.46 14.96 17.77 71.10
2024 3.14 5.03 6.79 11.03 12.50 15.00 17.83 71.32
2025 3.15 5.04 6.81 11.06 12.55 15.05 17.88 71.54
2026 3.15 5.05 6.83 11.10 12.59 15.10 17.93 71.76
2027 3.16 5.07 6.85 11.13 12.63 15.15 17.98 71.98
2028 3.17 5.08 6.87 11.16 12.68 15.20 18.04 72.21
2029 3.18 5.10 6.89 11.20 12.72 15.25 18.09 72.43
2030 3.19 5.11 6.91 11.23 12.77 15.30 18.14 72.65
Total: 1751.20
Please present final results of your calculations using the following tabular format.

UNFCCC/CCNUCC
CDM – Executive BoardPROJECT DESIGN DOCUMENT FORM
FOR AFFORESTATION AND REFORESTATION PROJECT ACTIVITIES (CDM-AR-PDD) - Version 04
55/96
Year Annual estimation of baseline netanthropogenic GHG removals by sinks in
tonnes of CO2 e1st Year 02nd Year 2.933rd Year 7.684th Year 14.125th Year 24.556th Year 36.357th Year 50.648th Year 67.799th Year 68.01
10th Year 68.2311th Year 68.4512th Year 68.6713th Year 68.8914th Year 69.1115th Year 69.3316th Year 69.5517th Year 69.7718th Year 69.9919th Year 70.2120th Year 70.4321st Year 70.6522nd Year 70.8723rd Year 71.1024th Year 71.3225th Year 71.5426th Year 71.7627th Year 71.9828th Year 72.2129th Year 72.4330th Year 72.65
Total estimated baseline net GHGremovals by sinks (tonnes of CO2 e)
1751.20
Total number of crediting years 30Annual average over the creditingperiod of estimated baseline net GHGremovals by sinks (tonnes of CO2 e)
58.37
C.8. Date of completion of the baseline study and the name of person(s)/entity(ies) determining thebaseline:>>Date of Completion: 27/03/2007Name of the person/entity determining the baseline: Ms Tulika BiswasBirla Carbon Management Consulting (P) LimitedKolkata -700 001

UNFCCC/CCNUCC
CDM – Executive BoardPROJECT DESIGN DOCUMENT FORM
FOR AFFORESTATION AND REFORESTATION PROJECT ACTIVITIES (CDM-AR-PDD) - Version 04
56/96
Ph.No:+91-9331887748Fax No: +91-3322317259E-mail ID : [email protected]: www.carbonmcgroup.com
All persons/entity determining the baseline are not the project participants listed in Annex 1.
SECTION D. Estimation of ex ante actual net GHG removals by sinks, leakage and estimatedamount of net anthropogenic GHG removals by sinks over the chosen crediting period
D.1. Estimate of the ex ante actual net GHG removals by sinks:>>The Actual net greenhouse gas removals by sinks represent the sum of the verifiable changes in carbonstocks in the carbon pools within the project boundary, minus the increase in GHG emissions measuredin CO2 equivalents by the sources that are increased as a result of the implementation of an A/R CDMproject activity, while avoiding double counting, within the project boundary, attributable to the A/RCDM project activity. Therefore,
∆CACTUAL = ∆Cp-GHGE …….(12)
where∆CACTUAL Actual net greenhouse gas removals by sinks; t CO2-e.∆Cp Sum of the changes in above-ground and below-ground biomass, dead wood, litter and soil
organic carbon stocks in the project scenario; t CO2-e.GHGE Increases in GHG emissions as a result of the implementation of the proposed AR CDM
project activity within the project boundary; t CO2-e.
Based on the approved methodology applied, the aboveground biomass and belowground biomass are thepools to be accounted for.
Estimates of carbon stock changes in living biomass of planted treesBEF method as presented in Section II.5.1 of the approved methodology applied is used. Above groundbiomass shall be estimated through the following steps:
Step 1: Measuring the diameter at breast height (DBH) at 1.3m above ground and height of trees inpermanent sample plots. The average DBH and height at different ages is taken from the project database which has been computed on the basis of actual measurement of trees in all 1305 permanent sampleplots spread across the entire project area.
Step 2: Estimating the volume of the commercial component of trees based on locally derived equations,expressed as volume per unit area, m3/ha:
V = -2.4726 + 0.4354 B x H (n = 125, R2 = 0.9956)(For volume equation refer page 226 of the book titled “Volume Equations for Forests of India, Nepaland Bhutan” published by Forest Survey of India, 1996)
Step 3: Choosing BEF, root-shoot ratio, wood density and other parameters:

UNFCCC/CCNUCC
CDM – Executive BoardPROJECT DESIGN DOCUMENT FORM
FOR AFFORESTATION AND REFORESTATION PROJECT ACTIVITIES (CDM-AR-PDD) - Version 04
57/96
The wood density has been taken from project data base which is the average density of Eucalyptus speciescomputed on the basis of actual field measurement. Values of BEF and Root-shoot ratio for Eucalyptus aretaken from table 3A.1.10 of IPCC GPG for LULUCF:
Species Wood density BEF Root to shoot ratio
Eucalyptus sp. 0.60672 2 0.27
Reference Project data base IPCC GPG forLULUCFTable- 3A.1.10
IPCC GPG forLULUCFTable- 3A.1.8
Step 4: Converting the volume of the commercial component of trees into carbon stock in abovegroundbiomass and belowground biomass via basic wood density, BEF root-shoot ratio and carbon fraction,given by:
CAB_tree,l,j,i,sp,t = Vl,j,I,sp,t * Dj * BEF2j * CFj
whereCAB_tree,l,j,i,sp,t Carbon stock in above-ground biomass of tree l of species j in plot sp in
stratum i at time t; t C tree-1
Vl,j,I,sp,t Stem volume of tree l of species j in plot sp in stratum i at time t; m3 tree-1
Dj Basic wood density of species j; t d.m. m–3
BEF2j Biomass expansion factor for conversion of stem biomass to above-groundtree biomass for species j; dimensionless
CFj Carbon fraction of biomass for tree species j; t C t-1 d.m. (IPCC default value= 0.5 t C t-1 d.m.)
l Sequence number of trees on plot spi 1, 2, 3, … MPS strata in the project scenarioJ 1, 2, 3, … SPS tree species in the project scenariot 1, 2, 3, … t* years elapsed since the start of the A/R CDM project activity
As per vegetation survey few trees along with scattered herbs & shrubs have been found in almost 1483parcels spreading across 2939.30 hectares of the project area. Because of degraded nature of landmajority of parcels are barren without any woody vegetation. Herbs and shrubs that grow during ra ins,dries and disappear automatically with the onset of summer. During site preparation at the best theseherbs and shrubs are cleared which is maximum 5% of the total area. Existing woody biomass areessentially not removed at all. So, EbiomassLoss = 0
Year Total project carbon stock(tC)
Total carbon stock change(tC)
2001 793 7932002 7851 70582003 33072 252222004 101875 688032005 266704 1648292006 461804 1951002007 732906 2711032008 1166160 433253

UNFCCC/CCNUCC
CDM – Executive BoardPROJECT DESIGN DOCUMENT FORM
FOR AFFORESTATION AND REFORESTATION PROJECT ACTIVITIES (CDM-AR-PDD) - Version 04
58/96
2009 1053492 -1126682010 1145788 922962011 1096457 -493312012 967797 -1286602013 893103 -746942014 1033685 1405822015 1058926 252412016 967797 -911292017 893103 -746942018 1033685 1405822019 1058926 252412020 967797 -911292021 893103 -746942022 1033094 1399912023 1053231 201372024 944017 -1092142025 821085 -1229312026 979121 1580362027 980825 17042028 732906 -2479192029 1166160 4332532030 1053492 -112668
Total: 24598757 1053492
Estimation of GHG emissions within the project boundaryThe increase in GHG emissions as a result of the implementation of the proposed A/R CDM projectactivity within the project boundary can be estimated as:
t*
GHGE = ∑EBiomassBurn,tt=1
whereGHGE Increase in GHG emissions as a result of the implementation of the
proposed A/R CDM project activity within the project boundary; t CO2-eEBiomassBurn,t Non-CO2 emissions due to biomass burning of existing woody vegetation
as part of site preparation during the year t; t CO2-et 1, 2, 3, … t* years elapsed since the start of the A/R CDM project activity
There will be no biomass burning during site preparation, thus there will be no GHG emissions frombiomass burning, i.e., EBiomassBurn,t =0;
So, GHGE = 0
YearAnnual carbonstock change(tCO2e/yr)
GHG emissionby source
(tCO2e/yr)
Estimation of actual netGHG removals by sinks(tCO2e/yr)
2001 2908 0 2908
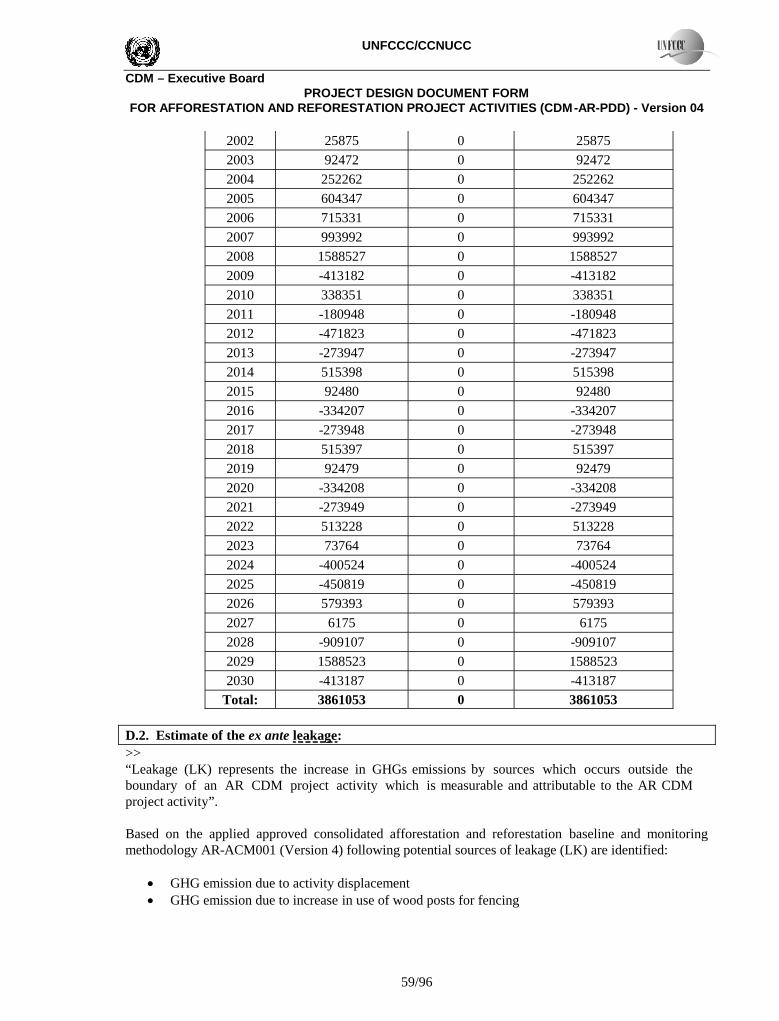
UNFCCC/CCNUCC
CDM – Executive BoardPROJECT DESIGN DOCUMENT FORM
FOR AFFORESTATION AND REFORESTATION PROJECT ACTIVITIES (CDM-AR-PDD) - Version 04
59/96
2002 25875 0 25875
2003 92472 0 92472
2004 252262 0 252262
2005 604347 0 604347
2006 715331 0 715331
2007 993992 0 993992
2008 1588527 0 1588527
2009 -413182 0 -413182
2010 338351 0 338351
2011 -180948 0 -180948
2012 -471823 0 -471823
2013 -273947 0 -273947
2014 515398 0 515398
2015 92480 0 92480
2016 -334207 0 -334207
2017 -273948 0 -273948
2018 515397 0 515397
2019 92479 0 92479
2020 -334208 0 -334208
2021 -273949 0 -273949
2022 513228 0 513228
2023 73764 0 73764
2024 -400524 0 -400524
2025 -450819 0 -450819
2026 579393 0 579393
2027 6175 0 6175
2028 -909107 0 -909107
2029 1588523 0 1588523
2030 -413187 0 -413187Total: 3861053 0 3861053
D.2. Estimate of the ex ante leakage:>>“Leakage (LK) represents the increase in GHGs emissions by sources which occurs outside theboundary of an AR CDM project activity which is measurable and attributable to the AR CDMproject activity”.
Based on the applied approved consolidated afforestation and reforestation baseline and monitoringmethodology AR-ACM001 (Version 4) following potential sources of leakage (LK) are identified:
GHG emission due to activity displacement GHG emission due to increase in use of wood posts for fencing
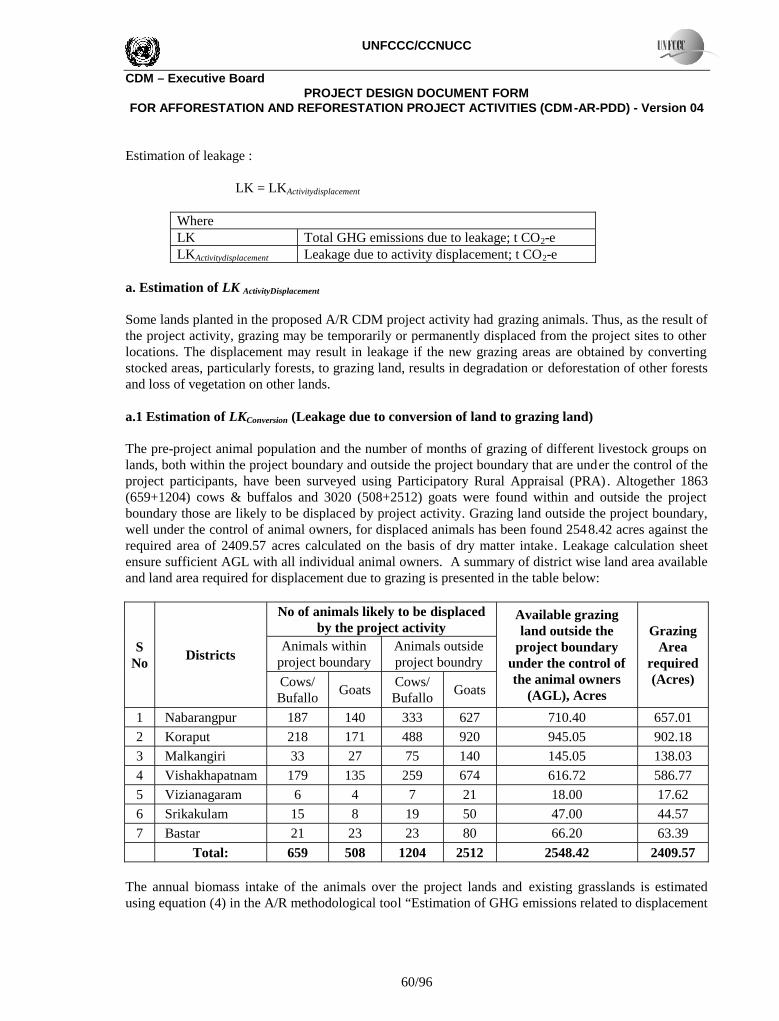
UNFCCC/CCNUCC
CDM – Executive BoardPROJECT DESIGN DOCUMENT FORM
FOR AFFORESTATION AND REFORESTATION PROJECT ACTIVITIES (CDM-AR-PDD) - Version 04
60/96
Estimation of leakage :
LK = LKActivitydisplacement
WhereLK Total GHG emissions due to leakage; t CO2-eLKActivitydisplacement Leakage due to activity displacement; t CO2-e
a. Estimation of LK ActivityDisplacement
Some lands planted in the proposed A/R CDM project activity had grazing animals. Thus, as the result ofthe project activity, grazing may be temporarily or permanently displaced from the project sites to otherlocations. The displacement may result in leakage if the new grazing areas are obtained by convertingstocked areas, particularly forests, to grazing land, results in degradation or deforestation of other forestsand loss of vegetation on other lands.
a.1 Estimation of LKConversion (Leakage due to conversion of land to grazing land)
The pre-project animal population and the number of months of grazing of different livestock groups onlands, both within the project boundary and outside the project boundary that are under the control of theproject participants, have been surveyed using Participatory Rural Appraisal (PRA) . Altogether 1863(659+1204) cows & buffalos and 3020 (508+2512) goats were found within and outside the projectboundary those are likely to be displaced by project activity. Grazing land outside the project boundary,well under the control of animal owners, for displaced animals has been found 2548.42 acres against therequired area of 2409.57 acres calculated on the basis of dry matter intake. Leakage calculation sheetensure sufficient AGL with all individual animal owners. A summary of district wise land area availableand land area required for displacement due to grazing is presented in the table below:
No of animals likely to be displacedby the project activity
Animals withinproject boundary
Animals outsideproject boundry
SNo
Districts
Cows/Bufallo
GoatsCows/Bufallo
Goats
Available grazingland outside the
project boundaryunder the control ofthe animal owners
(AGL), Acres
GrazingArea
required(Acres)
1 Nabarangpur 187 140 333 627 710.40 657.01
2 Koraput 218 171 488 920 945.05 902.18
3 Malkangiri 33 27 75 140 145.05 138.03
4 Vishakhapatnam 179 135 259 674 616.72 586.77
5 Vizianagaram 6 4 7 21 18.00 17.62
6 Srikakulam 15 8 19 50 47.00 44.57
7 Bastar 21 23 23 80 66.20 63.39
Total: 659 508 1204 2512 2548.42 2409.57
The annual biomass intake of the animals over the project lands and existing grasslands is estimatedusing equation (4) in the A/R methodological tool “Estimation of GHG emissions related to displacement

UNFCCC/CCNUCC
CDM – Executive BoardPROJECT DESIGN DOCUMENT FORM
FOR AFFORESTATION AND REFORESTATION PROJECT ACTIVITIES (CDM-AR-PDD) - Version 04
61/96
of grazing activities in A/R CDM project activity” and the required area to accept displaced animals isestimated using equation (5) of the methodological tool.
∑DMIg *(Hexisting,g,k,t + Hg,k,t)DMITOTAL,k,t = *365
1000DMITOTAL,k,t Total dry matter intake of grazing animal on parcel k in year t ; tdm /yearDMIg Daily dry matter intake per grazing animal of animal type g ; kg d.m./head/dayHexisting,g,k,t Number of head of animal type g existing on parcel k and/or being fed by fodder
produces on parcel k before displacement of animals in year t; headHg,k,t Number of head of animal type g displaced and/or the number of animals of type g fed
by fodder for which production is displaced to parcel k in year t; head
DMIg is taken from Table 3 in methodological tool. DMITOTAL,k,t
Arearequired,k,t = ANPPk
Arearequired,k,t Total area of land required for year t to sustain the grazing activities displaced to parcelk; (ha)
DMITOTAL,k,t Total dry matter intake of grazing animals on parcel k in year t ;td.m/yrANPPk Above ground net primary productivity of parcel k in tones dry matter, td.m./ha/yr
The default value for annual net primary production (ANPP) i.e. 8.2 tonnes d.m. ha-1” from Table 3.4.2 ofIPCC good practice guidance LULUCF was used as in the calculation. Daily Dry matter intake has beentaken as 21.6 kg/head/day for cows/buffalos and 4.6 kg/head/day for goat from Table 3 of A/Rmethodological tool “Estimation of GHG emissions related to displacement of grazing activities in A/RCDM project activity” (version 02).
Leakage calculation indicates that sufficient grassland land exists under the control of the projectparticipants that can adopt displaced animals even if all pre-project animals are displaced to existinggrasslands outside the project boundary. Therefore, LKConversion= 0.
As per EB42, monitoring of leakage associated with the use of fencing posts is not required as it isconsidered insignificant.
So, net GHG sequestration as below:
Year
Actual GHGRemoval from
ProjectActivity
(tCO2e/ yr)
SoilOrganicCarbon(tCO2e/
yr)
Total GHG(2+3)
BaselineNet GHGRemoval
(tCO2e/ yr)
ProjectEmissions (tCO2e/
yr)
Leakage(tCO2e/
yr)
NetAnthropogen
ic GHGRemoval
(tCO2e/ yr)[4-(5+6+7)]
Totalnumber of
tCERs
1 2 3 4 5 6 7 8 9
2001 2907.97 954.40 3862.37 0.00 0 0 3862.37 3862
2002 25877.70 2789.34 28667.04 2.93 0 0 28664.11 28664
2003 92479.58 4991.80 97471.37 7.68 0 0 97463.70 97464
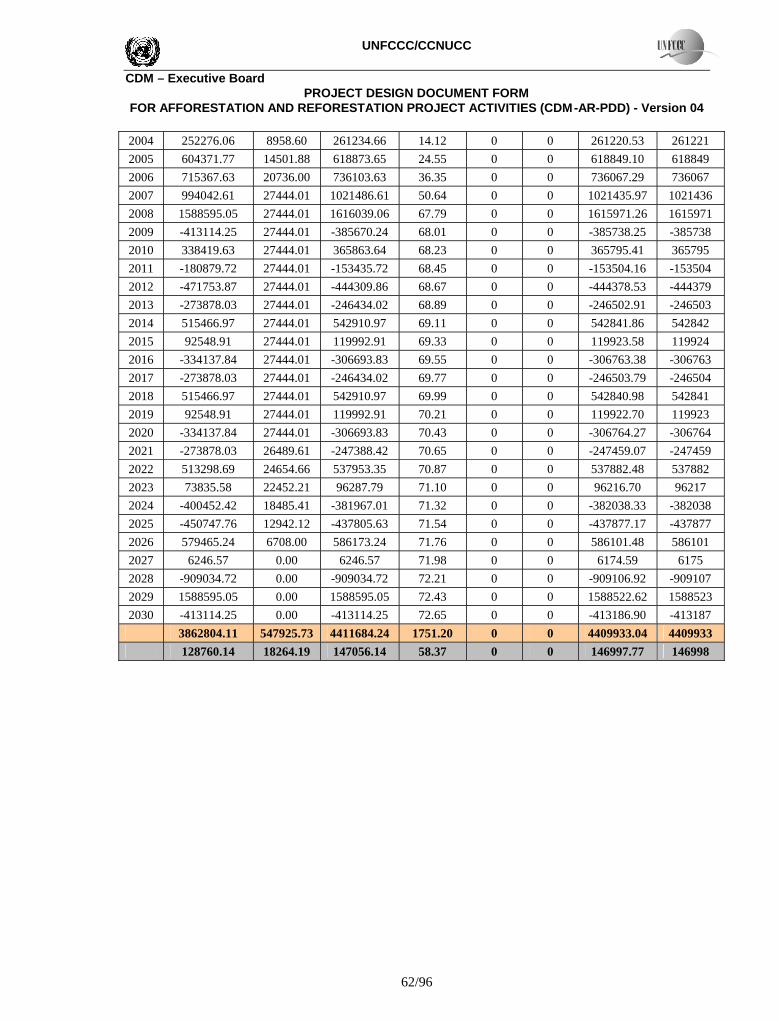
UNFCCC/CCNUCC
CDM – Executive BoardPROJECT DESIGN DOCUMENT FORM
FOR AFFORESTATION AND REFORESTATION PROJECT ACTIVITIES (CDM-AR-PDD) - Version 04
62/96
2004 252276.06 8958.60 261234.66 14.12 0 0 261220.53 261221
2005 604371.77 14501.88 618873.65 24.55 0 0 618849.10 618849
2006 715367.63 20736.00 736103.63 36.35 0 0 736067.29 736067
2007 994042.61 27444.01 1021486.61 50.64 0 0 1021435.97 1021436
2008 1588595.05 27444.01 1616039.06 67.79 0 0 1615971.26 1615971
2009 -413114.25 27444.01 -385670.24 68.01 0 0 -385738.25 -385738
2010 338419.63 27444.01 365863.64 68.23 0 0 365795.41 365795
2011 -180879.72 27444.01 -153435.72 68.45 0 0 -153504.16 -153504
2012 -471753.87 27444.01 -444309.86 68.67 0 0 -444378.53 -444379
2013 -273878.03 27444.01 -246434.02 68.89 0 0 -246502.91 -246503
2014 515466.97 27444.01 542910.97 69.11 0 0 542841.86 542842
2015 92548.91 27444.01 119992.91 69.33 0 0 119923.58 119924
2016 -334137.84 27444.01 -306693.83 69.55 0 0 -306763.38 -306763
2017 -273878.03 27444.01 -246434.02 69.77 0 0 -246503.79 -246504
2018 515466.97 27444.01 542910.97 69.99 0 0 542840.98 542841
2019 92548.91 27444.01 119992.91 70.21 0 0 119922.70 119923
2020 -334137.84 27444.01 -306693.83 70.43 0 0 -306764.27 -306764
2021 -273878.03 26489.61 -247388.42 70.65 0 0 -247459.07 -247459
2022 513298.69 24654.66 537953.35 70.87 0 0 537882.48 537882
2023 73835.58 22452.21 96287.79 71.10 0 0 96216.70 96217
2024 -400452.42 18485.41 -381967.01 71.32 0 0 -382038.33 -382038
2025 -450747.76 12942.12 -437805.63 71.54 0 0 -437877.17 -437877
2026 579465.24 6708.00 586173.24 71.76 0 0 586101.48 586101
2027 6246.57 0.00 6246.57 71.98 0 0 6174.59 6175
2028 -909034.72 0.00 -909034.72 72.21 0 0 -909106.92 -909107
2029 1588595.05 0.00 1588595.05 72.43 0 0 1588522.62 1588523
2030 -413114.25 0.00 -413114.25 72.65 0 0 -413186.90 -413187
3862804.11 547925.73 4411684.24 1751.20 0 0 4409933.04 4409933
128760.14 18264.19 147056.14 58.37 0 0 146997.77 146998

UNFCCC/CCNUCC
CDM – Executive BoardPROJECT DESIGN DOCUMENT FORM
FOR AFFORESTATION AND REFORESTATION PROJECT ACTIVITIES (CDM-AR-PDD) - Version 04
63/96
SECTION E. Monitoring plan
E.1. Monitoring of the project implementation:>>
E.1.1. Monitoring of forest establishment and management:>>During the project development the size and the location of the project area were negotiated with thevillages and the figures on size are subject to the contractual arrangements. The sites were identified anddelineated using topographic maps of 1:25000.
To ensure that the planting quality conforms to the practice described in AR-CDM-PDD and is wellimplemented, the following monitoring activities shall be conducted in the first three years after planting:
Field survey of the boundary of the areas with actual tree planting, site by site. Measuring geographical positions (latitude and longitude) using GPS. The project boundary, and the integrity of the planted area, will be monitored periodically
through the crediting period. Confirm that site and soil preparations are implemented based on practice documented in PDD. Survival checking:
1) The initial survival rate of planted trees shall be counted three months after theplanting, and re-planting shall be conducted if the survival rate is lower than 90 percentof the final planting density.
2) Final checking three years after the planting;3) The checking of the survival rate may be conducted using permanent sample plots.
Weeding checking: check and confirm that the weeding practice is implemented as described inthe PDD;
Survey and check that species and planting for each stratum are in line with the PDD; Document and justify any deviation from the planned forest establishment.
Monitoring of Forest Management
Forest management practices are important drivers of the GHG balance of the project, and thus must bemonitored. Practices to be monitored include:
Cleaning and site preparation measures: date, location, area, biomass removed and othermeasures undertaken;
Planting: date, location, area, tree species (establishment of the stand models); Fertilization: date, location, area, tree species, amount and type of fertilizer applied, etc; Harvesting: date, location, area, tree species, volumes or biomass removed; Coppicing: date, location, area, check and confirm that the site operation practices are
implemented as described in the PDD; Monitoring of disturbances: date, location, area (GPS coordinates and remote sensing as
applicable), tree species, type of disturbance, biomass lost, implemented corrective measures,change in the boundary of strata and stands.
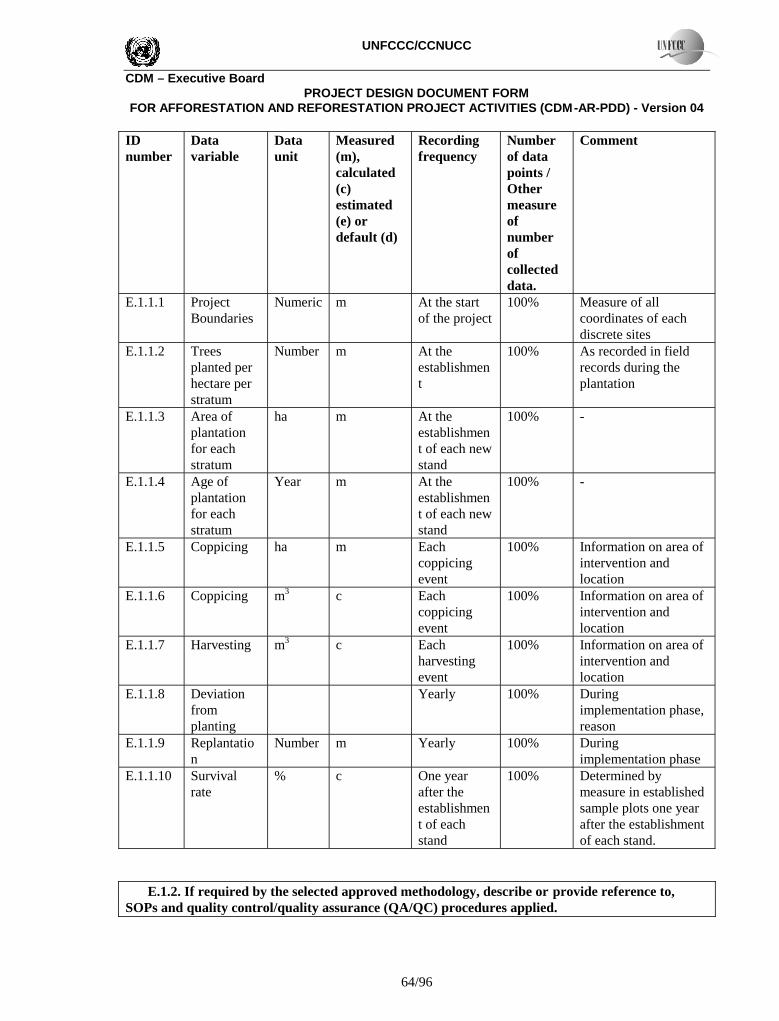
UNFCCC/CCNUCC
CDM – Executive BoardPROJECT DESIGN DOCUMENT FORM
FOR AFFORESTATION AND REFORESTATION PROJECT ACTIVITIES (CDM-AR-PDD) - Version 04
64/96
IDnumber
Datavariable
Dataunit
Measured(m),calculated(c)estimated(e) ordefault (d)
Recordingfrequency
Numberof datapoints /Othermeasureofnumberofcollecteddata.
Comment
E.1.1.1 ProjectBoundaries
Numeric m At the startof the project
100% Measure of allcoordinates of eachdiscrete sites
E.1.1.2 Treesplanted perhectare perstratum
Number m At theestablishment
100% As recorded in fieldrecords during theplantation
E.1.1.3 Area ofplantationfor eachstratum
ha m At theestablishment of each newstand
100% -
E.1.1.4 Age ofplantationfor eachstratum
Year m At theestablishment of each newstand
100% -
E.1.1.5 Coppicing ha m Eachcoppicingevent
100% Information on area ofintervention andlocation
E.1.1.6 Coppicing m3 c Eachcoppicingevent
100% Information on area ofintervention andlocation
E.1.1.7 Harvesting m3 c Eachharvestingevent
100% Information on area ofintervention andlocation
E.1.1.8 Deviationfromplanting
Yearly 100% Duringimplementation phase,reason
E.1.1.9 Replantation
Number m Yearly 100% Duringimplementation phase
E.1.1.10 Survivalrate
% c One yearafter theestablishment of eachstand
100% Determined bymeasure in establishedsample plots one yearafter the establishmentof each stand.
E.1.2. If required by the selected approved methodology, describe or provide reference to,SOPs and quality control/quality assurance (QA/QC) procedures applied.

UNFCCC/CCNUCC
CDM – Executive BoardPROJECT DESIGN DOCUMENT FORM
FOR AFFORESTATION AND REFORESTATION PROJECT ACTIVITIES (CDM-AR-PDD) - Version 04
65/96
>>Collecting reliable field data is an important step in quality assurance. The personnel i nvolved in theproject monitoring and in the measurement of carbon pools should be fully trained in data collection andanalysis. The data collection and organization is based on the standard operating procedures (SOPs)developed for the purpose.
These SOPs contain provisions for documentation and verification so that continuity in the fieldmonitoring is maintained and measurements can be verified. In order to ensure consistency in fieldmonitoring and measurements, the team members shall be made aware of all procedures of datacollection. It is recommended that test plots be used to develop SOPs. The monitoring and data collectiondocuments should list names of all personnel and their responsibilities. The quality of field datacollection shall be verified by undertaking random checks of the plots, including their re-measurement bya senior member of the monitoring team.
Quality assurance (QA) activities and processes ensure that monitoring data meet the requirementsQuality Control (QC) procedures verify the data and reporting requirements for analytical data used insupport of assessment. The project activity has developed and implemented procedures of guarantee andcontrol of quality (QA/QC) in order to guarantee that the gathered data are of acceptable, sustainablequality, and that the appropriate office procedures are followed.
QA/QC for field measurements
Collecting reliable field measurements is an important step in the quality assurance plan. New staff willbe adequately trained. Training courses on field data collection and data analyses will be held for all staffinvolved in the field measurement work. The training courses should ensure that each task team memberis fully aware of all procedures and the importance of collecting data as accurately as requested. Toachieve this, both classroom examination and field examination will be conducted, and only those whopass the required examination can join the task team.
The SOPs include auditing procedures. The first type of audit, a ‘hot check’, consisting of the projectleader observing field crew members during data collection to ensure field measurements SOPs shall befollowed to correct any technique errors. The second type of audit, a ‘blind check’, to quantifymeasurement errors, shall consist of a complete re-measurement of 10% of plots by verifying teamshighly experienced in forest measurement and attentive to detail. After measurement a comparison willbe made with the original data and discrepancies re-verified. Any errors found will be corrected andrecorded. Any errors discovered will be expressed as a percentage of all plots that have been recheckedto provide an estimate of the measurement error.
QA/QC for data entryTo produce reliable carbon estimates the proper entry of data into the data analyses spreadsheets isrequired. Steps will be taken to ensure that errors are minimized. Results will be reviewed and double -checked for typing errors. If there are any problems with the monitoring plot data that cannot be resolved,the plot should not be used in the analysis.
QA/QC for data archivingDue to the long-term length of the project activities, data storage and maintenance is very important. Allelectronic data and reports will be copied on durable media such as compact discs (CDs) and copies ofthe CDs will be stored in multiple locations. The archives include i) Copies of all original field

UNFCCC/CCNUCC
CDM – Executive BoardPROJECT DESIGN DOCUMENT FORM
FOR AFFORESTATION AND REFORESTATION PROJECT ACTIVITIES (CDM-AR-PDD) - Version 04
66/96
measurement data, laboratory data, data analysis spreadsheets; ii) Estimates of the carbon stock changesin all chosen pools and non-CO2 GHG and corresponding calculation spreadsheets; iii) GIS products; iv)Copies of the measuring and monitoring reports.
a. Sampling design and stratification>>The number and boundaries of the strata defined ex-ante in Section C.4 may change during the creditingperiod (ex-post). Therefore, strata will be monitored periodically. If a change in the number and area ofthe project strata occurs, the sampling framework should be adjusted accordingly.
Monitoring of strata
The possible need for ex post stratification will be evaluated at each monitoring event and changes in thestrata should be reported to the DOE for verification. Monitoring of strata and stand boundaries will bedone using a Geographical Information System (GIS). The database on strata will be updated at periodicintervals taking into account the following aspects:
Unexpected disturbances occurring during the crediting period (e.g. due to fire, pests or diseaseoutbreaks), affecting differently different parts of an originally homogeneous stratum or stand;
Changes in the forest management regime if any occurring during the project period (e.g.,pruning, thinning, etc.) and the dates and locations implementing the management regime shallbe monitored and recorded.
Sampling Design
Permanent sampling plots will be used for sampling over time to measure and monitor changes in carbonstocks of above and below ground biomass. The location of samples within the plot has been decidedrandomly to avoid any bias. The project boundary will be monitored by monitoring of parcels usingGPS. Any changes in project boundary will be accounted for in all calculations of actual net GHGremovals by sinks. The monitoring methodology uses permanent sample plots to monitor carbon stockchanges in above- and below-ground biomass pools. To reach the targeted precision level of about ±10%of the mean at the 95% confidence level in a cost-effective manner, the number of plots needed in eachstratum has been determined following equation (5) and (6) in AR-ACM0001 methodological tool“Calculation of the number of sample plots for measurements within A/R CDM project activities”(version 02).

UNFCCC/CCNUCC
CDM – Executive BoardPROJECT DESIGN DOCUMENT FORM
FOR AFFORESTATION AND REFORESTATION PROJECT ACTIVITIES (CDM-AR-PDD) - Version 04
67/96
where:n sample size (total number of sample plots required) in the project areani sample size for stratum IE allowable error of the estimated quantity Qi project strataL total number of strata; dimensionlessα α = 1-α is probability that the estimate of the mean is within the error bound E
zα/2 zα/2 = value of the statistic z (embedded in Excel as: inverse of standard normal probabilitycumulative distribution), for e.g. 1-α = 0.05 (implying a 95% confidence level) zα/2=1.9599
Ni maximum possible number of sample plots in stratum IN maximum possible number of sample plots in the project areasti standard deviation for each stratum i; dimensionless, 30%A total size of all strata, e.g. the total project area; haAi size of each stratum i; haAP sample plot size (constant for all strata); 0.04 haQ approximate average value of the estimated quantity (aboveground wood volume per hectare);
m3 ha-1
p desired level of precision (10%); dimensionless
No of sample plots calculated stratum wise is given in Table E.2(a) below:
Table E.2(a): Number of Sample Plots for ex post MonitoringDefining feature of
StrataStrataYear of Plantation
Area (Ha)No of
Sample Plots
Strata 1 2001 520.58 34Strata 2 2002 1000.88 63Strata 3 2003 1201.34 84Strata 4 2004 2163.71 153Strata 5 2005 3023.61 216Strata 6 2006 3400.43 234Strata 7 2007 3658.91 257
Total: 14969.46 1041
To avoid subjective choice of plot locations (plot centres, plot reference points, movement of plot centresto more “convenient” positions), the permanent sample plots will be located systematically with arandom start, which is considered good practice in GPG-LULUCF. This will be accomplished with thehelp of a GPS in the field. The geographical position (GPS coordinate), administrative location, stratumand sub- stratum series number of each plots will be recorded and archived. It is to be ensured that thesampling plots are distributed randomly, and as evenly spread as possible.
To ensure that the sampling plots are distributed as evenly as possible, permanent sample plots have beensystematically identified from each year of plantation covering each bank area in order to ensureaccuracy and precision in estimating biomass. Preliminary stratification is done on the basis of year ofplantation followed by bank area wise sub-stratification for each year that adequately takes care ofvariance in soil condition of different area in each stratum. Altogether 1305 permanent sample plots havebeen identified against 1041 calculated as per tool. Sampling plan has been prepared to identify 1305

UNFCCC/CCNUCC
CDM – Executive BoardPROJECT DESIGN DOCUMENT FORM
FOR AFFORESTATION AND REFORESTATION PROJECT ACTIVITIES (CDM-AR-PDD) - Version 04
68/96
permanent sample plots so that they are homogeneously distributed across the bank area planted everyyear as shown in Table E.2(b) below:
Table E.2(b): Sampling Plan for ex post MonitoringNo of Permanent Sample Plots identified yearwiseS
NoBank Area
No ofParcels 2001 2002 2003 2004 2005 2006 2007
TotalNos
NABARANGPUR1 Nandahandi 160 2 0 1 3 3 1 3 132 Nabarangpur 285 1 0 3 5 6 5 5 253 Sindhiguda 139 1 1 1 2 2 3 4 144 Rajoda 152 1 2 2 1 3 3 4 165 Tumberla 19 1 0 1 1 36 Kosagumuda 138 1 1 2 2 1 1 5 137 Jotabal 136 0 1 2 1 5 3 2 148 Katharguda 156 1 2 3 2 1 2 4 159 Kumuli 207 1 2 3 4 3 2 4 19
10 B Singhpur 165 1 1 2 1 2 2 7 1611 Sanmosigaon 281 1 1 2 4 6 3 4 2112 Challanguda 218 1 1 1 5 3 2 7 2013 Dhamnahandi 64 1 1 1 2 1 614 Raighar 357 2 1 13 3 3 4 2615 Jharigaon 317 4 2 5 7 6 7 3116 Dhodra 207 1 1 2 6 8 3 2117 Kotagaon 183 4 1 1 2 4 6 1818 Umerkote 135 0 2 2 1 3 6 1419 Sosahandi 147 1 2 4 4 2 1 1420 Singsari 68 1 2 2 521 Turudhi 55 4 1 0 522 Chandili 53 0 1 1 1 2 523 Kundei 30 1 1 1 324 Boriguma 24 1 2 325 Kodinga 58 0 1 0 5 626 Tentulikuthi 198 2 5 6 4 1727 Maidalpur 115 4 5 1 3 13
Total: 4067 13 32 37 70 70 63 91 376KORAPUT
1 Boipariguda 317 7 7 4 1 2 4 4 292 Ramgiri 287 2 3 3 4 7 6 5 303 Kundra 418 3 3 4 5 10 9 8 424 Digapur 357 2 2 4 6 9 10 5 385 Dongerpausi 407 1 2 3 5 7 11 11 406 Ambaguda 103 1 1 2 2 4 3 137 Kusumi 345 1 1 3 10 6 6 6 338 Phamphuni 277 2 2 3 4 5 6 6 289 Nandpur 586 3 5 7 8 10 10 13 56
10 Padwa 213 2 3 2 4 6 5 2 2411 Lamtaput 248 1 1 4 8 1 4 7 26

UNFCCC/CCNUCC
CDM – Executive BoardPROJECT DESIGN DOCUMENT FORM
FOR AFFORESTATION AND REFORESTATION PROJECT ACTIVITIES (CDM-AR-PDD) - Version 04
69/96
12 Mathalput 129 1 1 4 4 3 1 1 1513 Jolaput 147 1 1 2 3 5 1 3 1614 Semiliguda 218 1 1 2 3 4 6 6 2315 Koraput 48 1 1 1 1 1 1 616 Podagada 257 1 1 2 5 7 5 9 3017 Kakriguma 65 1 1 2 1 1 618 Dasmantpur 208 1 3 4 4 4 6 2219 Pottangi 93 1 1 2 3 2 2 1120 Sunki 141 1 4 5 3 3 3 1921 Jeypore 82 3 3 1 722 Sunabeda 43 1 3 1 1 623 Onkadeli 11 0 0
Total: 5000 31 39 60 89 103 100 98 520MALKANGIRI
1 Pangam 90 1 1 2 5 2 112 Maithili 144 1 1 1 1 3 10 173 Malkangiri 254 2 6 8 8 1 254 Kudumulguma 26 1 0 1 1 3
Total: 514 1 3 5 12 12 12 11 56VISHAKHAPATNAM
1 Arkuvalley 746 21 38 37 962 Kinchunmanda 750 13 35 45 933 Paderu 409 50 30 80
Total: 1905 0 0 0 0 34 123 112 269VIZIANAGARAM
1 Sallur 54 7 3 1 112 Gajpatinagaram 2 0
Total: 56 0 0 0 0 7 3 1 11SRIKAKULAM
1 Kottur 73 9 6 152 Veergatham 220 22 223 Palkonda 53 2 24 GL Puram 5 1 1
Total: 351 0 0 0 9 30 1 0 40BASTAR
1 Bastar 351 6 11 4 212 Lohaniguda 90 2 2 1 53 Bhanpuri 44 1 2 34 Kesharpal 38 2 25 Bokaband 12 1 16 Bojaband 9 1 1
Total: 544 9 19 5 3369 Grand Total: 12437 45 74 102 180 265 321 318 1305
The growth of individual trees on plots and soil organic carbon will be measured at each monitoringevent. The carbon stock changes in above- and below-ground biomass of trees on each plot are thenestimated. To avoid the coincidence with peaks in carbon stocks, the first monitoring will be conductedin the year 2009 with subsequent monitoring in 2014, 2019, 2024 and 2029.

UNFCCC/CCNUCC
CDM – Executive BoardPROJECT DESIGN DOCUMENT FORM
FOR AFFORESTATION AND REFORESTATION PROJECT ACTIVITIES (CDM-AR-PDD) - Version 04
70/96
E.3. Monitoring of the baseline net GHG removals by sinks, if required by the selected approvedmethodology:>>Monitoring of baseline net GHG removals by sinks is not needed as per the applied approvedmethodology AR-ACM0001 (Version 04).
E.4. Monitoring of the actual net GHG removals by sinks:>>
E.4.1. Data to be collected in order to monitor the verifiable changes in carbon stock in thecarbon pools within the project boundary resulting from the proposed A/R CDM project activity:>>
Data / parameter: Ai
Data unit: haUsed in equations: 18, 26, 21Description: Area of stratum iSource of data: Actual area measured by GPS coordinates of each stratum
Measurement procedures (if any): GIS data
Monitoring frequency: Before the start of the project and adjusted thereafter every 5-year
QA/QC procedures: -Any comment: -
Data / parameter: Asp i
Data unit: haUsed in equations: 18Description: Total area of all sample plots in stratum iSource of data: Field measurementMeasurement procedures (if any):Monitoring frequency: Before the start of the project and adjusted thereafter every 5 yr
QA/QC procedures:
Any comment:
Data / parameter: DBHData unit: cmUsed in following equations Implicitly used in Eqs. 11, 19Description: Diameter breast height of treeSource of data: Field measurements in sample plotsMeasurement procedures (ifany):
Typically measured 1.3 m above-ground. Measure in thepermanent sample plots all the trees above some minimum DBHthat result from the A/R project activity.
Monitoring frequency: 5 yearsQA/QC procedures:

UNFCCC/CCNUCC
CDM – Executive BoardPROJECT DESIGN DOCUMENT FORM
FOR AFFORESTATION AND REFORESTATION PROJECT ACTIVITIES (CDM-AR-PDD) - Version 04
71/96
Any comment: Measuring the girth and convert to diameter at each monitoringtime per sampling method
Data / parameter: HData unit: mUsed in equations: Implicitly used in Eqs. 11, 19Description: Height of treeSource of data: Field measurements in sample plotsMeasurement procedures (if any): Tree top height is measured with the help of Abney LevelMonitoring frequency: 5 yearsQA/QC procedures:Any comment: Measured in each monitoring on all trees included in each
sampling plot.
Data / parameter: t2 and t1
Data unit: yrUsed in equations: 7, 22, 23, 28Description: Years of the monitoring activitySource of data: Recorded dataMeasurement procedures (if any): -
Monitoring frequency: YearlyQA/QC procedures: -Any comment: -
Data / parameter: Land titleData unit: -Used in equations: -Description: Land ownership through Land Patta or Land PassbookSource of data: Individual farmerMeasurement procedures (if any): -
Monitoring frequency: 5 yearsQA/QC procedures: -Any comment: The land patta were issued by the Govt of India. It will again
reissued after survey (generally it happens in every 100 years)
Data / parameter: Carbon RightData unit: -Used in equations:Description: Authorization for claiming Carbon CreditSource of data: Individual farmerMeasurement procedures (if any):
Monitoring frequency: 5 yearsQA/QC procedures: -Any comment: -

UNFCCC/CCNUCC
CDM – Executive BoardPROJECT DESIGN DOCUMENT FORM
FOR AFFORESTATION AND REFORESTATION PROJECT ACTIVITIES (CDM-AR-PDD) - Version 04
72/96
Data / parameter: Available Grazing Land (AGL)Data unit: acreUsed in equations:Description: Land available for grazing under the control of PPSource of data: SurveyMeasurement procedures (if any):Monitoring frequency: 5 yearsQA/QC procedures: -Any comment: -
Data / parameter: Number of animals of different types in the grazing landData unit: Nos.Used in equations:Description: Different animal head in the available grazing land both for the
PP and others
Source of data: SurveyMeasurement procedures (if any):
Monitoring frequency: 5 yearsQA/QC procedures: -Any comment: -
E.4.2. Data to be collected in order to monitor the GHG emissions by the sources,measured in units of CO2 equivalent, that are increased as a result of the implementation of theproposed A/R CDM project activity within the project boundary:>>In terms of the approved methodology AR-ACM0001 (Version 04) applied in the proposed A/R CDMproject activity; there is potentially one emission by sources, i.e. burning of woody biomass. However,planting, logging in the proposed A/R CDM project activity will be conducted manually. Also, there willbe no burning of woody biomass during the site preparation, thus GHG emissions from biomass burningare nil. However biomass burning will be monitored for future possibility.
Data / parameter: Biomass burningData unit: kgUsed in equations:Description: Biomass burning can be a potential emission source.
Source of data: SurveyMeasurement procedures (if any):
Monitoring frequency: 5 yearsQA/QC procedures: -Any comment: -
E.5. Leakage:>>

UNFCCC/CCNUCC
CDM – Executive BoardPROJECT DESIGN DOCUMENT FORM
FOR AFFORESTATION AND REFORESTATION PROJECT ACTIVITIES (CDM-AR-PDD) - Version 04
73/96
As per the approved methodology applied, there are two potential sources of leakages in the proposedA/R CDM project activity. These are displacement of grazing and the use of wood posts for fencing.However, as elaborated in Section D.2 above, the leakage from the displacement of grazing and the useof wood post for fencing is nil.
E.5.1. If applicable, please describe the data and information that will be collected in orderto monitor leakage of the proposed A/R CDM project activity:>>Though there is no leakage on account of displacement of grazing, the project activity proposes tomonitor the following parameters for future possibility:
Data / parameter: HExisting,g,k,tData unit: headUsed in equations:Description: Number of head of animal type g existing on parcel k and/or
being fed by fodder produced on parcel k before displacement ofanimals in year t
Source of data: Estimated in displacement plan and monitoredMeasurement procedures (if any):
Monitoring frequency: Determined at year of displacementQA/QC procedures: -Any comment: -
Data / parameter: Hg,k,tData unit: headUsed in equations:Description: Number of head of animal type g displaced and/or the number of
animals of type g fed by fodder for which production is displacedto parcel k in year t.
Source of data: Estimated in displacement plan and monitoredMeasurement procedures (if any):
Monitoring frequency: Determined at year of displacementQA/QC procedures: -
Any comment: -
E.5.2. Specify the procedures for the periodic review of implementation of activities and measuresto minimize leakage, if required by the selected approved methodology:>>Leakage is not considered in this project.
E.6. Provide any additional quality control (QC) and quality assurance (QA) proceduresundertaken for data monitored not included in section E.1.3:>>To verify that plots are installed and measurements taken correctly, 10% of plots will be randomlyselected and re-measured independently. The re-measurement elements include the location of plots,DBH, tree height, age of plantation and number of trees in each sample plots. The re-measurement data

UNFCCC/CCNUCC
CDM – Executive BoardPROJECT DESIGN DOCUMENT FORM
FOR AFFORESTATION AND REFORESTATION PROJECT ACTIVITIES (CDM-AR-PDD) - Version 04
74/96
will be compared with the original measurement data. Any deviation between measurement and re -measurement below 5% will be considered tolerable. Errors discovered should be expressed as apercentage of all plots that have been rechecked to provide an estimate of the measurement error.
Data(Indicate ID number)
Uncertainty level of data(High/Medium/Low)
Explain QA/QC procedures planned for thesedata, or why such procedures are notnecessary.
E.6.1Plot location (latitude/longitude)
Low Random plot verification using GPSEnsure that fields data is properly recorded andstored to facilitate detailed review
E.6.2 Age of plantation Low Random verification and ensure that this isproperly recorded and stored to facilitatedetailed review
E.6.3 Diameter atbreast height of living trees(DBH)
Low Random plot verification, check that units areproperly labeled and ensure that this is properlyrecorded and stored to facilitate detailed review
E.6.4 Tree height Low Random plot verification, check that units areproperly labeled and ensure that this is properlyrecorded and stored to facilitate detailed review
E.6.5 Number of trees ineach sampling plot
Low Random plot verification and ensure that this isproperly recorded and stored to facilitatedetailed review
E.7. Please describe the operational and management structure(s) that the project operator willimplement in order to monitor actual GHG removals by sinks and any leakage generated by theproposed A/R CDM project activity:>>The reforestation project will be managed by a team of professional foresters appointed by MangalamTimber Products Limited. This team will be responsible for undertaking periodical field measurement anddata processing. In order to comply with the provisions of the monitoring methodology, arrangementswill be made with local laboratories as well as other information providers. Information will be archivedin electronic and paper form, and will be kept for at least two years posterior to the crediting period.If deemed necessary, internal audits and/or external assistance will be sought so that quality controland quality assurance procedures can be met.
The company has established “Quality Management System in Plantation & Forestry”, wherein a set ofprocedures has been laid down to implement and monitor the project activity. These procedures detail theresponsibility, activity, control and steps required for monitoring key features, including:
a) CDM staff trainingb) CDM data and record keeping arrangementsc) Data collectiond) CDM data quality control and quality assurancee) Equipment maintenancef) Equipment calibrationg) Equipment failure

UNFCCC/CCNUCC
CDM – Executive BoardPROJECT DESIGN DOCUMENT FORM
FOR AFFORESTATION AND REFORESTATION PROJECT ACTIVITIES (CDM-AR-PDD) - Version 04
75/96
The methodology involves monitoring of following data those are identified necessary for calculating theestimated emission reduction:
Area planted Area of sampling frame Total area of sample plots Diameter at breast height (DBH) Top Tree Height (H) Land title (Land patta/passbook) Carbon rights (CER authorization contract)
Roles and responsibilities to ensure that the monitoring procedures are followed strictly have beenestablished. Responsibilities for data collection, recording and archiving of data, ensuring correctprocedure for data collection, correctness of data and reliability in data entry, audit check has beenidentified which may be amended during the crediting period, if deemed necessary, as per internalrequirements of the company.
CDM Manager (Head Office) in association with AGM (Plantation & Forestry) is responsible forensuring that the procedures for on site measurements & monitoring are strictly followed and that theyare continually improved to ensure a reliable monitoring system is established. CDM Manager(HO) isresponsible for entire CDM documentation, GIS mapping, upkeep of GIS data, maps & images andliasioning with external agencies like MoEF & DNA, DOE and consultants to the project.
Internal audit will be conducted periodically to assure consistency of monitored data. The company willconduct a final check of the data and analyze project performance prior to any verification. All staffinvolved in the CDM project will receive relevant training laid down in training procedures. Records oftrained CDM staff will be retained by the Project Developer. The CDM Manager will ensure that onlytrained staff is involved in the operation of the monitoring system.
AGM (Plantation &Forestry)
CDM Manager(Head Office)
DGM (Comm & QC)
Plantation Incharge(Division wise)
Area Incharge
Field Officers
CDM HeadManaging Director
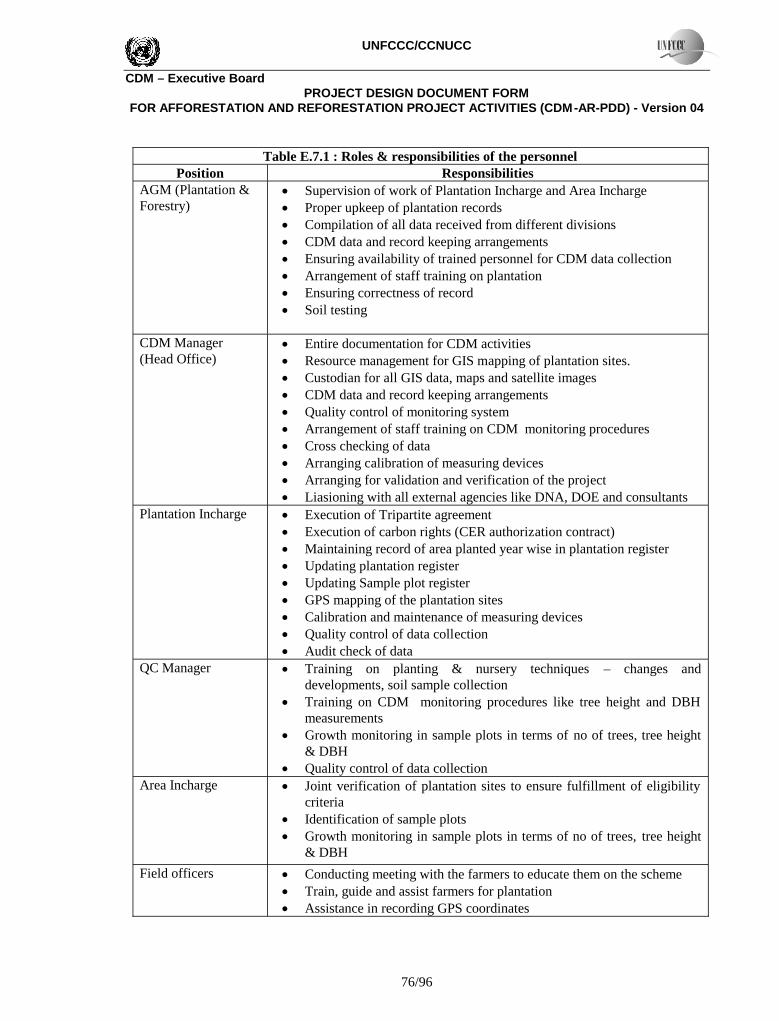
UNFCCC/CCNUCC
CDM – Executive BoardPROJECT DESIGN DOCUMENT FORM
FOR AFFORESTATION AND REFORESTATION PROJECT ACTIVITIES (CDM-AR-PDD) - Version 04
76/96
Table E.7.1 : Roles & responsibilities of the personnelPosition Responsibilities
AGM (Plantation &Forestry)
Supervision of work of Plantation Incharge and Area Incharge Proper upkeep of plantation records Compilation of all data received from different divisions CDM data and record keeping arrangements Ensuring availability of trained personnel for CDM data collection Arrangement of staff training on plantation Ensuring correctness of record Soil testing
CDM Manager(Head Office)
Entire documentation for CDM activities Resource management for GIS mapping of plantation sites. Custodian for all GIS data, maps and satellite images CDM data and record keeping arrangements Quality control of monitoring system Arrangement of staff training on CDM monitoring procedures Cross checking of data Arranging calibration of measuring devices Arranging for validation and verification of the project Liasioning with all external agencies like DNA, DOE and consultants
Plantation Incharge Execution of Tripartite agreement Execution of carbon rights (CER authorization contract) Maintaining record of area planted year wise in plantation register Updating plantation register Updating Sample plot register GPS mapping of the plantation sites Calibration and maintenance of measuring devices Quality control of data collection Audit check of data
QC Manager Training on planting & nursery techniques – changes anddevelopments, soil sample collection
Training on CDM monitoring procedures like tree height and DBHmeasurements
Growth monitoring in sample plots in terms of no of trees, tree height& DBH
Quality control of data collectionArea Incharge Joint verification of plantation sites to ensure fulfillment of eligibility
criteria Identification of sample plots Growth monitoring in sample plots in terms of no of trees, tree height
& DBH
Field officers Conducting meeting with the farmers to educate them on the scheme Train, guide and assist farmers for plantation Assistance in recording GPS coordinates

UNFCCC/CCNUCC
CDM – Executive BoardPROJECT DESIGN DOCUMENT FORM
FOR AFFORESTATION AND REFORESTATION PROJECT ACTIVITIES (CDM-AR-PDD) - Version 04
77/96
Measurement of tree height & DBH Sample plot measurement
E.8. Name of person(s)/entity(ies) applying the monitoring plan:>>Birla Carbon Management Consulting Limited has assisted MTPL in determining and applying themonitoring plan, and the entity is not the project participant listed in Annex 1.
Name of Entity: Birla Carbon Management Consulting ServicesBirla Building, Ground Floor,9/1, R N Mukherjee RoadKolkata - 700 001
Tel: +91 33 65502603Fax: +91 33 22317259Web: www.carbonmcgroup.comContact Person: Ms Tulika BiswasMobile: +91 9331887748Email: [email protected]
SECTION F. Environmental impacts of the proposed A/R CDM project activity:
F.1. Documentation on the analysis of the environmental impacts, including impacts onbiodiversity and natural ecosystems, and impacts outside the project boundary of the proposedA/R CDM project activity:>>The proposed project activity leads to the establishment of around 14969.46 ha of carbon sink onseverely degraded landmasses, which not only contribute environmental services like soil erosioncontrol, improved soil organic carbon, increased forest cover etc. but also aids in fulfilling sustainabledevelopment goals of the country. The project activity aims to restore the degraded land, which has verynegligible species diversity.
Though Environmental Impact Assessment is not a regulatory requirement in India as per EIANotification 199425, for forestry projects, still the project proponent conducted an internal environmentalassessment to map and mitigate, if any irreversible and unacceptable impacts on the environment resultedand would result from the project activity.
The EIA study included identification, prediction and evaluat ion of potential impacts. There was nosignificant negative impact of the A/R CDM project activity under consideration. Other than increasingthe forest cover the activity provides the following additional local benefits:
Controlling soil erosion Improving soil organic carbon Water conservation Wasteland reclamation Reduced dependency on natural forest Additional fuel wood generation
25 http://envfor.nic.in/divisions/iass/notif/eia.html

UNFCCC/CCNUCC
CDM – Executive BoardPROJECT DESIGN DOCUMENT FORM
FOR AFFORESTATION AND REFORESTATION PROJECT ACTIVITIES (CDM-AR-PDD) - Version 04
78/96
Enhance environmental services Improve socio economic conditions of the beneficiaries
The site preparation does not involve GHG emissions. The ploughing activity is carried out once in asixteen year cycle at the time of replanting for which human and animal energy are employed. The soildisturbance during ploughing is not likely as use of heavy machinery is completely avoided. Moreoverthe poor farmers do not afford to hire tractors for ploughing. Also ploughing is done on non-rainy daysso as to avoid topsoil erosion due to surface runoffs.
Eucalyptus plants are resistant to most of the pest attack. A pest attack control plan was planned and thepest attack was taken into account under plant breeding strategy. The area is red laterite area where pestlike termite is not uncommon. Prophylactic treatment is given to pits with Chloropyriphos beforeplanting the seedling. Depending upon requirement Phorate may be required for therapeutic treatment ofthe plant. Foliar blight is the common disease in the area caused by Cylindrocladium fungus. This diseaseis controlled in the initial stages by spraying 0.2% bavistin fungicide.
All the Environmental legislations were studied and are given in a matrix in the EIA report. However, thespecific Environmental legislations applicable for the present project activity and their relevance with thepresent project are mentioned as below.
1. Water (Prevention and Control of Pollution) Act, 1974 with Rules.2. Biological Diversity Act, 200226
3. Provisions of Inter-state Migrant Workmen Act, 197927
The most significant impact of the project activity is improvement in soil organic carbon. Soil samplescollected from various sample plots were tested in ISO certified laboratories in 2008-09 and comparedwith the test reports of the same area for 1995-2000 period, ie before start of the project activity,available with Soil Chemist, Soil Testing Laboratory (Govt of Orissa) Semiliguda. Results show that theproject activity has significant impact in terms of improved soil organic carbon as per the current soil testreports of project land.
However large scale planting of Eucalyptus has caused concern to many people as they thought it wouldhave adverse environmental impacts particularly in relation to high water use. In this regard Mr MHarikrishnan, Principal Chief Conservator of Forest (PCCF), Tamil Nadu Forest department, Chennai , inhis article “Know about Eucalyptus Tree” has clarified many myths associated with Eucalyptusplantation as under:
1. Eucalyptus consumes ground water heavily and thus soil gets desiccated leaving it unfit for any otherpurpose.
Research reports have shown (CAZRI, Jodhpur) that Eucalyptus makes the use of sub-soil moistureleaving top soil moisture intact that can be used by undergrowth and agricultural crops. The taproot ofwidely grown Eucalyptus tereticornis grows upto 3m while depth of water table is often as much as 10m.It only consumes sub-soil moisture around and upto 3m depth and hence does not affect the water table.
26 http://www.envfor.nic.in/divisions/csurv/nba_act.html27 http://labour.delhigovt.nic.in/act/details_acts/interstatemigrnatwirkmen/inter_state/intro.html
UNFCCC/CCNUCC
CDM – Executive BoardPROJECT DESIGN DOCUMENT FORM
FOR AFFORESTATION AND REFORESTATION PROJECT ACTIVITIES (CDM-AR-PDD) - Version 04
79/96
2. Eucalyptus aggravates soil and water erosion due to low interception of rain water as compared toother forest species also does not hold good.
Stem flow and interception studies have shown that compared to some native species like Shorearobusta, Pinus roxburghii, Tectona grandis, Acacia catechu etc., Eucalyptus offers least interception lossof rain water and allows more rain water to percolate by increased stem flow. Eucalyptus plantation inbarren land reduces the run off rate in relation to the run off in natural stratified forest and when the areais planted with local species.
3. Eucalyptus transpires a lot evaporates more moisture and thus increases the evapo-transpiration lossfrom the soil.
Studies in Karnataka reveal that species like Eucalyptus tereticornis are similar to many other treespecies in evapo-transpiration loss. Further the annual transpiration rate in Eucalyptus plantation islowest compared to agricultural crop like pady, wheat, sugarcane, potato, jowar etc. Compared to totalannual rainfall, the total annual evaporation loss any area planted with Eucalyptus is low. For example, inparts of the Nilgiris, the total evaporation loss from Eucalyptus globules has been found 34.75 cmsagainst the annual rainfall of 130 cms.
4. Eucalyptus heavily consumes available soil moisture and thus does not allow any other undergrowth.
It is well accepted that any fast-growing plant consumes more water for its growth. Eucalyptus is alsofast growing plant but consumes least quantity of water for production of higher biomass per unitvolume. Studies reveal that for one litre water consumed, Eucalyptus hybrid produces 2.06 gms ofbiomass as against 1.83 gms in case of Albizzia lebbek, 1.31 gms in case of Dalbergia sisoo and 2.0 gmsin case of Syzgium cuminii.
5. Eucalyptus depletes the soil nutrients and there is no return of nutrients into the soil through leadlitter as they do not decompose easily. They turn the soil acidic and degrade the site, thus preventinggrowth of other species later.
Study report says there was higher accumulation of organic matter with more nitrogen and phosphorousunder Eucalyptus plantation than under a native species like Sal. Eucalyptus plantation grown on treelesssites improves soil fertility by developing humus. Eucalyptus leaf litter, if not removed from the field,reduces the acidity through addition of calcium and makes the soil neutral.
The water budget of Eucalyptus however is efficient compared to other trees as per unit of woodproduction the water consumption is low (Rajan, 1987)28. Eucalyptus appears to use less water per unitweight of biomass produced than other kinds of trees and many agricultural crops (Davidson, 1985 &1998)29.
F.2. If any negative impact is considered significant by the project participants or the host Party, astatement that project participants have undertaken an environmental impact assessment, inaccordance with the procedures required by the host Party, including conclusions and allreferences to support documentation:
28 Rajan, B.K.C. (1987). Versatile Eucalyptus. Diana Pub., Bangalore. pp: 41-201.29 Davidson.J. (1985), Setting aside the idea that Eucalyptus are always bad. FAO pub, Rome.

UNFCCC/CCNUCC
CDM – Executive BoardPROJECT DESIGN DOCUMENT FORM
FOR AFFORESTATION AND REFORESTATION PROJECT ACTIVITIES (CDM-AR-PDD) - Version 04
80/96
>>No significant negative impacts have been identified due to the environmental -friendly techniques to beadopted in the proposed A/R CDM project activity.
F.3. Description of planned monitoring and remedial measures to address significant impactsreferred to in section F.2. above:>>No negative impacts have been identified. However environmental monitoring plan and measures for anyfuture risk would be reviewed and incorporated.
SECTION G. Socio-economic impacts of the proposed A/R CDM project activity:
G.1. Documentation on the analysis of the major socio-economic impacts, including impactsoutside the project boundary of the proposed A/R CDM project activity:>>The majority of reforested area (83%) under the project activity lies in Nabarangpur, Koraput andMalkangiri districts in the state of Orissa reckoned to be one of the most backward states due to pooreconomic growth. The majority of inhabitants are mostly tribal. .Koraput is primarily a tribal district,more than 70% of total population comprises of scheduled tribes. Nabarangpur district was created on 2nd
October 1992 out of a previous subdivision of Koraput. The history of Nabarangpur is inextricablyinterlinked with that of Koraput, with which it shares its language, lifestyle, heritage, flora & fauna andclimate. There are as many as 52 tribal groups in the area; some of the numerically large tribes areKondh, Bhatara, Poraja, Bhumia, Koya, Bondas, Gadaba & Dombs who primarily depend on cultivationand forest products for their livelihood. Dongaria kondhs are shifting cultivator tribal community livingin hills of Koraput. Encounter with the settled and urban population has changed their lifestyle to someextent but communities like Poraja, Kondh and Gadava still live in indigenous style. These tribes speakdialects of Oriya.
Rice and fish is the main food in the area. Paddy, alsi, kosla, mandya, maize are the main crop cultivatedto gain a reasonable level of subsistence. Though fruit trees like mango and jackfruit are the popularchoice, other plants are also grown as per individual liking. Majority families make use of fuel woodcollected from nearby forests for cooking purpose. The area is gifted with abundance of natural foresteasily accessible for fuel wood.
People in the area are God fearing and celebrate many festivals throughout the year. Rath Yatra of dietyJagannath is the most important festival of the state apart from Dashera, Holi and Mahashivaratri. Thisfestival is celebrated throughout the state which brings together the rural/hill tribes and town dwellers incelebration. Many small temples of Jagannath are scattered in the districts, one very old being inNabarangpur town also. Maa Bhandargharani of Nabarangpur is the presiding deity of the locality.Besides, the villagers also celebrate “Chaitra Parva, Pausa Parva, Magh Parva, Nay Khai, Aam Parva”etc during various crop seasons.
The farmers participating in the project activity are generally small & marginal farmers and tribal whoare illiterate and economically weak, most of them holding BPL card. They do not have assured source ofincome to meet their daily needs including food, clothing etc. Males and females both work in the field,the later being prone to work harder as the males tend to neglect work particularly under the influence ofliquor. They are daily wage earners and artisans like washer man, barber, cobbler, fishermen, weavers,

UNFCCC/CCNUCC
CDM – Executive BoardPROJECT DESIGN DOCUMENT FORM
FOR AFFORESTATION AND REFORESTATION PROJECT ACTIVITIES (CDM-AR-PDD) - Version 04
81/96
potters, processing of leaves and other small service providers, who depend on some daily job for theirlivelihood, sometimes they get sometime not.
The objective of this reforestation project is to encourage tree farming practices in degraded land and tocreate employment potential in rural areas particularly among landless agricultural labour. Thereforestation activity involves development of nursery, site preparation, ploughing & levelling of land,digging pits for saplings, planting, fencing, fertilizer & manure application etc which are all donemanually by the farmers and their family members themselves or hiring labour force of the village orfrom nearby areas. Thus the project activity has generated huge employment opportunity for the localvillagers and farmers improving their income level and social condition. The details of employmentgenerated due to the reforestation project in three states are given year-wise in the table below. CDMrevenue generated from project activity is likely to add their income further.
http://srdis.ciesin.columbia.edu/cases/india-010.html
G.2. If any negative impact is considered significant by the project participants or the host Party,a statement that project participants have undertaken a socio-economic impact assessment, inaccordance with the procedures required by the host Party, including conclusions and allreferences to supporting documentation:>>No negative impact is considered due to the implementation of the proposed A/R CDM project activity.
G.3. Description of planned monitoring and remedial measures to address significant impactsreferred to in section G.2 above:>>No negative socio-economic impacts are envisaged.
SECTION H. Stakeholders’ comments:
State Year Employment generated(in man days)
2001-02 2,79,5322002-03 4,21,9112003-04 5,27,5122004-05 8,79,8552005-06 10,87,438
Orissa
2006-07 10,03,1412002-03 1,39,8262003-04 2,22,3332004-05 4,56,0992005-06 5,22,866
Chattisgarh
2006-07 1,06,8522004-05 22,9222005-06 2,48,884Andhra Pradesh2006-07 4,43,539
Total: 6,362,701

UNFCCC/CCNUCC
CDM – Executive BoardPROJECT DESIGN DOCUMENT FORM
FOR AFFORESTATION AND REFORESTATION PROJECT ACTIVITIES (CDM-AR-PDD) - Version 04
82/96
H.1. Brief description of how comments by local stakeholders have been invited and compiled:>>The stakeholders identified are mainly the farmers who are participating in the project activity apart fromnearby villagers, local panchayet, forest officials and the employees of the company. The views andcomments of the stakeholders were collected by way of conducting a series of stakeholders’ consultationmeetings as well as through PRA exercise.
Stakeholder’ Consultation Meeting:
At the start of the project activity stakeholders’ consultation meetings were conducted locally for eachbank area identified for initiating reforestation activity. Company’s field officers arranged meetings withthe land owners in remote villages. The farmers of various villages of the bank area were invited toassemble at one place convenient for all. The farmers were encouraged for eucalyptus plantation on theirdegraded land which was otherwise lying barren since decades without any return. They were explainedabout the reforestation scheme with its benefits, which they all appreciated invariably. MTPL fieldofficers also explained them how they will be contributing towards mitigation of carbon emissionthrough reforestation under the scheme. Altogether 49 such meetings were conducted across the projectarea ensuring participation of 1158 people, 13 meetings in Nabarangpur, 28 in Koraput, 4 in Malkangirifrom December, 2000 to March, 2001 and 4 meetings in Srikakulam from January to March 2004. List ofmeetings conducted is furnished in table H.1 below:
Table H.1: Record of Stakeholder's Meeting
SNo
Date ofMeeting
Venue ofMeeting Bank Area No of
villages Name of participating villagesNo ofParticipant
Name offield
officerNabarangpur Distt:
1 15.01.2001 Soruguda UGB -Nandahandi
13 Dohna, Dongarbheja, Jhadbandhguda,Bhanjaguda, Chotahandi, Morali, Potharlosa,Antashore, Nuagam, Katraguda, Jhodiaguda,Soruguda, PKGuda
24 A D Naidu
2 23.01.2001 Rosiyaguda UGB -Sindhiguda
7 Dongtaguda, Rosiyaguda, Turiyaguda, EkambaRathimajhiguda, Nandahandi, Turniaguda,
17 A D Naidu
3 13.02.2001 Bongapalli UGB -Nabarangpur
2 Bongapalli, Pujariguda 8 A D Naidu
4 28.02.2001 Rajoda UGB -Rajoda
9 Bijaguda, Neigaon, Souraguda, Bamuni,Mankadi, Kantiyaguda, Parjaguda, Rajoda, Kerla
15 A D Naidu
5 11.01.2001 Tumberla UGB -Tumberla
6 Khaduguda, Gumidora, Surigaon, Tumberla,Burjha, Harijansahi
17 A K Mishra
6 15.01.2001 Kosagumuda
UGB -Kosagumuda
8 Badambada, Kosagumuda, Santoshpur, AgnipurHaldiguda, Chelipadar, Dengaguda, Duragaon
14 A K Mishra
7 28.01.2001 Patri UGB -Jotabal
4 Jotabal, Patri, Baddhansuli, Basini 8 A K Mishra
8 22.02.2001 Porsala UGB -Challanguda
5 Porsala, Paknaguda, Bandliguda, Khandiguda,Aunli
16 B Panda
9 27.02.2001 Deodora UGB -Sanmosigaon
5 Kochiaguda, Deodora, Malekote, Jamguda,Chatahandi
19 B Panda
10 29.03.2001 Narahandi UGB -Dhamnahandi
2 Bhurusiguda, Narahandi 13 B Panda
11 16.01.2001 Kathargada UGB -Kathargada
6 Pradhaniput, Paknaguda, Baghbeda, Kathargada,Kenduguda, Rajuguda
20 S K Dhall
12 20.02.2001 Kumuli UGB -Kumuli
5 Narigaon, Gumuda, Kumuli, Semla, Badigaon 10 S K Dhall
13 25.02.2001 Benasur UGB -B.Singhpur
4 Kandulkhunti, Tenkar, Mundaguda, Upparguda 10 S K Dhall
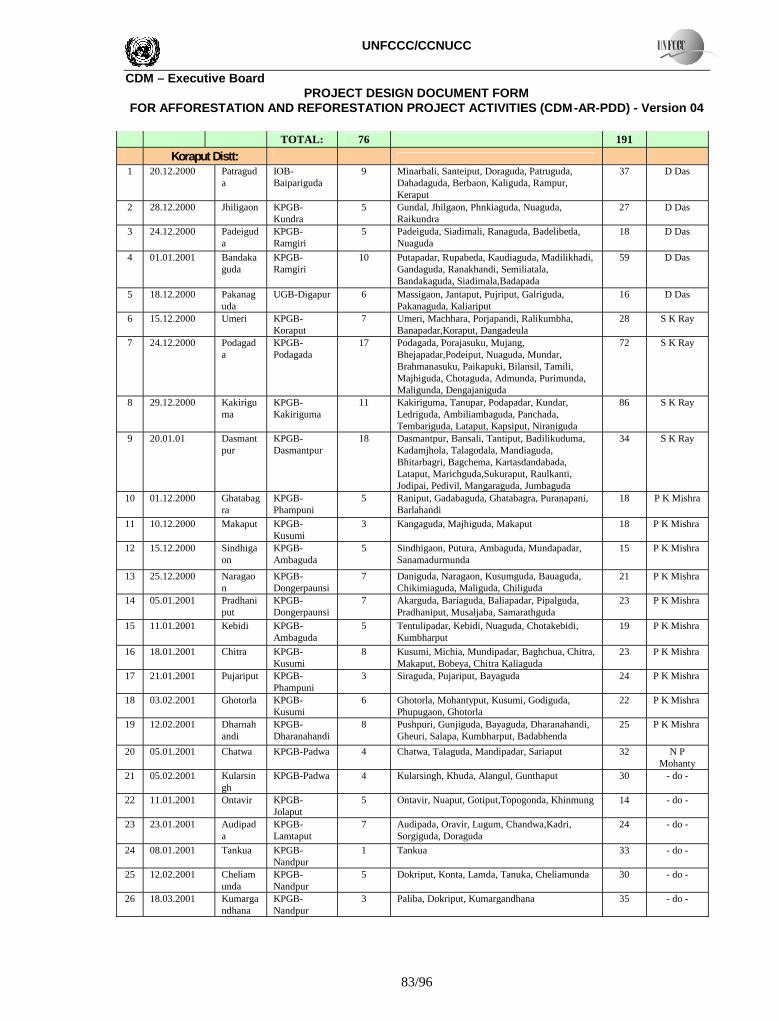
UNFCCC/CCNUCC
CDM – Executive BoardPROJECT DESIGN DOCUMENT FORM
FOR AFFORESTATION AND REFORESTATION PROJECT ACTIVITIES (CDM-AR-PDD) - Version 04
83/96
TOTAL: 76 191
Koraput Distt:1 20.12.2000 Patragud
aIOB-Baipariguda
9 Minarbali, Santeiput, Doraguda, Patruguda,Dahadaguda, Berbaon, Kaliguda, Rampur,Keraput
37 D Das
2 28.12.2000 Jhiligaon KPGB-Kundra
5 Gundal, Jhilgaon, Phnkiaguda, Nuaguda,Raikundra
27 D Das
3 24.12.2000 Padeiguda
KPGB-Ramgiri
5 Padeiguda, Siadimali, Ranaguda, Badelibeda,Nuaguda
18 D Das
4 01.01.2001 Bandakaguda
KPGB-Ramgiri
10 Putapadar, Rupabeda, Kaudiaguda, Madilikhadi,Gandaguda, Ranakhandi, Semiliatala,Bandakaguda, Siadimala,Badapada
59 D Das
5 18.12.2000 Pakanaguda
UGB-Digapur 6 Massigaon, Jantaput, Pujriput, Galriguda,Pakanaguda, Kaliariput
16 D Das
6 15.12.2000 Umeri KPGB-Koraput
7 Umeri, Machhara, Porjapandi, Ralikumbha,Banapadar,Koraput, Dangadeula
28 S K Ray
7 24.12.2000 Podagada
KPGB-Podagada
17 Podagada, Porajasuku, Mujang,Bhejapadar,Podeiput, Nuaguda, Mundar,Brahmanasuku, Paikapuki, Bilansil, Tamili,Majhiguda, Chotaguda, Admunda, Purimunda,Maligunda, Dengajaniguda
72 S K Ray
8 29.12.2000 Kakiriguma
KPGB-Kakiriguma
11 Kakiriguma, Tanupar, Podapadar, Kundar,Ledriguda, Ambiliambaguda, Panchada,Tembariguda, Lataput, Kapsiput, Niraniguda
86 S K Ray
9 20.01.01 Dasmantpur
KPGB-Dasmantpur
18 Dasmantpur, Bansali, Tantiput, Badilikuduma,Kadamjhola, Talagodala, Mandiaguda,Bhitarbagri, Bagchema, Kartasdandabada,Lataput, Marichguda,Sukuraput, Raulkanti,Jodipai, Pedivil, Mangaraguda, Jumbaguda
34 S K Ray
10 01.12.2000 Ghatabagra
KPGB-Phampuni
5 Raniput, Gadabaguda, Ghatabagra, Puranapani,Barlahandi
18 P K Mishra
11 10.12.2000 Makaput KPGB-Kusumi
3 Kangaguda, Majhiguda, Makaput 18 P K Mishra
12 15.12.2000 Sindhigaon
KPGB-Ambaguda
5 Sindhigaon, Putura, Ambaguda, Mundapadar,Sanamadurmunda
15 P K Mishra
13 25.12.2000 Naragaon
KPGB-Dongerpaunsi
7 Daniguda, Naragaon, Kusumguda, Bauaguda,Chikimiaguda, Maliguda, Chiliguda
21 P K Mishra
14 05.01.2001 Pradhaniput
KPGB-Dongerpaunsi
7 Akarguda, Bariaguda, Baliapadar, Pipalguda,Pradhaniput, Musaljaba, Samarathguda
23 P K Mishra
15 11.01.2001 Kebidi KPGB-Ambaguda
5 Tentulipadar, Kebidi, Nuaguda, Chotakebidi,Kumbharput
19 P K Mishra
16 18.01.2001 Chitra KPGB-Kusumi
8 Kusumi, Michia, Mundipadar, Baghchua, Chitra,Makaput, Bobeya, Chitra Kaliaguda
23 P K Mishra
17 21.01.2001 Pujariput KPGB-Phampuni
3 Siraguda, Pujariput, Bayaguda 24 P K Mishra
18 03.02.2001 Ghotorla KPGB-Kusumi
6 Ghotorla, Mohantyput, Kusumi, Godiguda,Phupugaon, Ghotorla
22 P K Mishra
19 12.02.2001 Dharnahandi
KPGB-Dharanahandi
8 Pushpuri, Gunjiguda, Bayaguda, Dharanahandi,Gheuri, Salapa, Kumbharput, Badabhenda
25 P K Mishra
20 05.01.2001 Chatwa KPGB-Padwa 4 Chatwa, Talaguda, Mandipadar, Sariaput 32 N PMohanty
21 05.02.2001 Kularsingh
KPGB-Padwa 4 Kularsingh, Khuda, Alangul, Gunthaput 30 - do -
22 11.01.2001 Ontavir KPGB-Jolaput
5 Ontavir, Nuaput, Gotiput,Topogonda, Khinmung 14 - do -
23 23.01.2001 Audipada
KPGB-Lamtaput
7 Audipada, Oravir, Lugum, Chandwa,Kadri,Sorgiguda, Doraguda
24 - do -
24 08.01.2001 Tankua KPGB-Nandpur
1 Tankua 33 - do -
25 12.02.2001 Cheliamunda
KPGB-Nandpur
5 Dokriput, Konta, Lamda, Tanuka, Cheliamunda 30 - do -
26 18.03.2001 Kumargandhana
KPGB-Nandpur
3 Paliba, Dokriput, Kumargandhana 35 - do -

UNFCCC/CCNUCC
CDM – Executive BoardPROJECT DESIGN DOCUMENT FORM
FOR AFFORESTATION AND REFORESTATION PROJECT ACTIVITIES (CDM-AR-PDD) - Version 04
84/96
27 15.01.2001 Subai KPGB-Semiliguda
4 Subai, Bhitasubai, Hadiguda, Charagaon 24 - do -
28 17.01.2001 Hatapada KPGB-Mathalput
4 Kudumul, Bhejaput, Putraghati, Lachmani 18 - do -
TOTAL: 182 825
Malkangiri Distt:1 15.12.200 Duragud
aUGB-Maithili 2 Duraguda, Ramguda
16S Sumant
2 24.12.2000 Podagada
SBI-Pangam 7 Podagada, Siraguda, Somrathguda,Dudumaguda, Paknaguda, Salpadar, Baliguda
15 S Sumant
3 05.01.2001 Amlajodi SBI-Pangam 3 Amlajodi, Purnagada, Meja 14 S Sumant
4 09.01.2001 Ampada UGB-Maithili 3 Ampada, Pujariguda, Sindhiguda 13 S Sumant
TOTAL: 15 58
Srikakulam Distt:1 05.01.2004 Nawagud
aSBI-Kottur 2 Nawagada, Paduru 12 K Deepak
2 27.01.2004 Goidi SBI-Kottur 5 Goidi, Bethapuram, Somagandi, Rasulpeta,Torangi
15 K Deepak
3 03.02.2004 Pedanamma
SBI-Kottur 7 Pedanamma, Meetuguda, Devinpuram, Kurimi,Musirigguda, Seethimpeta, Janaga
16 K Deepak
4 07.03.2004 Selgmere SBI-Kottur 7 Selgmere, Jagadaguda, Kanbaguda, Muttuguda,Adakulaguda, Kambaguda, Janaga
21 K Deepak
TOTAL: 21 64
49 GRAND TOTAL: 294 1138
Later on the concept was further clarified through stakeholders’ meetings conducted at large scale in2007. To ensure maximum participation by the farmers and nearby inhabitants the meetings wereconducted separately for each of the three states. The notification regarding conduct of meeting andagenda was published in local news paper having wide circulation in the project area apart from personalinvitations, public announcements, notices, word of mouth and telecons. The first meeting for Orissa,which constitutes almost 76% of the project activity, was conducted on June 11, 2007 at large scale atfactory guest house at Nabarangpur (Orissa). Live coverage of the proceedings of the meeting is availablein CD. The second for Andhra Pradesh on July 08, 2007 at Kottur in Srikakulam district andthird for Chhatishgarh on August 12, 2007 at Bastar. More than 400 people from different villages ofthree states attended the meeting.
Stakeholders' meetings conducted at large scale:
SNo
Date Venue StateName of partcipating bank
areasNos Conducted by
1 11.06.2007 Nabarangpur For OrissaAll bank areas of Nabarangpur,Koraput & Malkangiri districts
220All officials of
the area
2 08.07.2007Kottur
(Srikakulam)For Andhra
Pradesh
All bank areas ofVishakhapatnam, Vizianagaram& Srikakulam districts
134All officials of
the area
3 12.08.2007 BastarFor
ChhatishgarhAll bank areas of Bastar districts 54
All officials ofthe area
TOTAL: 408
A brief introduction of the project activity and how it contributes to anthropogenic GHG emissionreduction was presented by the company officials in the meeting. Salient features covered in thepresentation were as under:

UNFCCC/CCNUCC
CDM – Executive BoardPROJECT DESIGN DOCUMENT FORM
FOR AFFORESTATION AND REFORESTATION PROJECT ACTIVITIES (CDM-AR-PDD) - Version 04
85/96
• Introduction to global warming and CDM• Brief introduction of project activity and its relation with CDM• Explanation of how the project activity contributes to reducing anthropogenic GHG
emission• How the project activity is contributing towards environmental and social wellbeing –
locally and globally• How the project activity will contribute to economic upliftment of the local people• Sharing mechanism of the CERs (Carbon Credits) with the farmers
The participants were given opportunity to ask questions or give comments with regard to project activityat the end of the meeting. The comments and queries raised during the meeting were adequatelyaddressed by the company officials and summarized in Minutes of meeting.
Further comments were invited from the stakeholders even after meeting in other forms such as by post,fax or by mail mentioning their name and contact details.
H.2. Summary of the comments received:>>Stakeholders’ meeting at the start of project activity:
The farmers appreciated the plantation scheme. With the scheme they would be getting an opportunity toutilise the degraded land which was otherwise lying barren. As all of them appreciated the contributionof the project activity towards improving the economy of local population as well as environment, it wasdecided to note down the negative comments only. But there were no negative comments at all.
Stakeholders’ meeting in the year 2007:
All the participants invariably opined that the plantation scheme brought by MTPL would be beneficialfor them. Among the most important stakeholders and beneficiaries of the project activity are the farmersand inhabitants of nearby villages. Under the scheme they can fetch out some income from their degradedland which was lying barren since their forefathers. In absence of the scheme they had no otheralternative land use except to leave it barren as in the past.
Since all the invitees appreciated the contribution of the project activity towards improving the economyof local population as well as help India to contribute to mitigate GHG emission, it was decided to notedown the adverse comments only. However there was no adverse comment from anybody.
Public Rural Appraisal (PRA):
Apart from the stakeholders’ consultation meetings the views and comments of the farmers were furt herobtained during PRA exercise in the year 2008-09. The PRA team asked the respondents to give theirviews and comment on the project activity undertaken by MTPL.
PRA study reveals that 79.9% respondents appreciated the project activity and as usual 20.1% did notprefer to comment. Among those who did not comment were mostly females, daily wage earners or smallservice providers. They were either not willing to comment or not knowing what to comment and why to

UNFCCC/CCNUCC
CDM – Executive BoardPROJECT DESIGN DOCUMENT FORM
FOR AFFORESTATION AND REFORESTATION PROJECT ACTIVITIES (CDM-AR-PDD) - Version 04
86/96
________
comment. The respondents opined that the plantation scheme brought by MTPL has provided a goodopportunity for them.
No negative comments have been received so far. CD containing the live coverage of the proceedingsattached.
H.3. Report on how due account was taken of any comments received:>>The queries of attendees were all answered by MTPL officials to the satisfaction of participants andaccepted by them. A few important queries and concern are as under:
S No Stakeholders concern/query/
comments
Clarification/ answer provided by MTPL officials
1 What assistance thecompany will beproviding to promoteplantation activity?
The company officials intimated that they motivate the farmers to gofor plantation that will give them some earning from their degradedland lying barren. This will improve their earning, waste land willbe utilized, and further degradation will be prevented. Besides thecompany is providing technical guidance, assistance in gettingfinance from bank, supply of quality seedlings for better yieldand free replacement of mortality. In view of developing betterseedlings and clonal plants the company is continuously engaged inR&D activity in their nursery. The company is also providing buyback guarantee for the proceeds at prevailing market price.
2 What CER is? The company officials explained CER stands for “CertifiedEmission Reduction” and it is the measuring unit of emissionreduction like kilometre for distance measurement. One CER isequivalent to one tonne of CO2 emission reduction.
3 Whether any farmerwho has a plantation inthe area will be eligiblefor the CER money?
The company official replied “no” and explained the eligibilitycriteria. The farmers will be entitled to get CER revenue on theplantation that has been included in the project boundary. Thatmeans who has signed the tripartite agreement with the companyand bank, have signed the authorization letter for CDM, whoseplantation is essentially on degraded land and who is the owner theland. Any other plantation external to the project boundary or notincluded in the project boundary will not be entitled.
4 How the project isbenefiting localresidents who have noplantation?
The company explained that the project activity has generated hugeemployment opportunities for the local residents to carry out variousactivities of plantation like site preparation, supply of seedlings,planting of seedlings, fencing, harvesting, and transportation ofharvested material in the area.

UNFCCC/CCNUCC
CDM – Executive BoardPROJECT DESIGN DOCUMENT FORM
FOR AFFORESTATION AND REFORESTATION PROJECT ACTIVITIES (CDM-AR-PDD) - Version 04
87/96
Annex 1
CONTACT INFORMATION ON PARTICIPANTS IN THE PROPOSED A/R CDM PROJECTACTIVITY
Organization: Mangalam Timber Products LimitedStreet/P.O.Box: 9/1 R.N.Mukherjee RoadBuilding: Birla Building, 7th FloorCity: KolkataState/Region: West BengalPostfix/ZIP: 700 001Country: IndiaTelephone: +91 33 2243 8857, 3293 9131/32FAX: +91 33 2243 8709E-Mail: [email protected]: www.mangalamtimber.comRepresented by: Mr P. S. PrasadTitle: Dy. General Manager (Commercial & QC)Salutation: MrLast Name: PrasadMiddle Name: ShankarFirst Name: PremDepartment: Commercial & Quality ControlMobile: +91 9903941332Direct FAX: ---Direct tel: ---Personal E-Mail: [email protected]

UNFCCC/CCNUCC
CDM – Executive BoardPROJECT DESIGN DOCUMENT FORM
FOR AFFORESTATION AND REFORESTATION PROJECT ACTIVITIES (CDM-AR-PDD) - Version 04
88/96
Annex 2
INFORMATION REGARDING PUBLIC FUNDING
There is no public funding for this project activity

UNFCCC/CCNUCC
CDM – Executive BoardPROJECT DESIGN DOCUMENT FORM
FOR AFFORESTATION AND REFORESTATION PROJECT ACTIVITIES (CDM-AR-PDD) - Version 04
89/96
Annex 3
BASELINE INFORMATION
The present project site comprises of large, medium and small sized land holdings, distributed as discreteparcels, which are under the possession of the tribal land owners. A survey aiming to assess baselinevegetation was conducted by the team of MTPL field staff in the year 2001 before start of the projectactivity. The survey was conducted in different time periods, first post monsoon (October, 2000 toJanuary, 2001) and thereafter pre-monsoon in summer (May-June 2001). The field staff visited individualsites alongwith the concerned farmer and penned down the vegetation noticed on the site se lected forforestation. Field visits were also conducted to the nearby areas to assess the land use of similar land inthe vicinity. The rural community was interviewed to understand any interventions like fire or naturalcalamities occurred in the past. The data was then compiled to evidence the eligibility of the land as wellas to estimate the baseline carbon sequestration of the project activity.
It was observed from the vegetation report that the pre and post monsoon scenarios widely differed. Inpost monsoon period the land was flourished with grass, bushes and weeds but in summer everythingvanished and the land was totally barren leaving no vegetation at all.
The company appointed M/s Salim Ali Centre for Ornithology & Natural History (SACON) underMoEF, Govt of India for conducting GIS mapping of the project area including Change detection study toknow the status of land during 1990 period. Satellite images of 1990 period have been generated byoverlaying the current GIS map of the project parcels over the Landsat Thematic Mapper Satellite data of1990 period available from Global Land Cover Facility (GLCF). These images are available for theentire project area; bank area wise that shows that the parcels of land under project activity was underdegraded category.
Stratification according to pre-existing conditions and baseline projections
Although the project sites are located in different states (as described in section A.5.1), the carbon statusof all the sites is more or less same. It is low or decreasing. The Ex ante stratification is done byconducting field visits and assessing the soil condition of areas under the project. Local communities areinterviewed (PRA conducted) to understand the land use land cover history. Few trees along with bushesof at the most 1 m height of different varieties and grasses and were found in a few parcels of the projectarea. The bushes and grass were visible during monsoon. But with the onset of summer only trees wereleft and all the bushes and grasses vanish. As per AR-ACM0001 (Version 04), section II.4 “changes incarbon stock of above ground and below ground biomass of non tree vegetation may be conservativelyassumed to be zero for all strata in the baseline scenario”. Based on this , the proposed A/R CDM projectarea is stratified depending on vegetation cover. Two strata were identified as below:
1. Baseline Strata I: Project land with few growing trees2. Baseline Strata II: Project land without trees
Baseline Strata I: Project Land with few growing Trees

UNFCCC/CCNUCC
CDM – Executive BoardPROJECT DESIGN DOCUMENT FORM
FOR AFFORESTATION AND REFORESTATION PROJECT ACTIVITIES (CDM-AR-PDD) - Version 04
90/96
Based on vegetation survey report all the parcels containing trees through the entire project area has beenshortlisted and assigned to Baseline strata I. The table below shows the list of trees recorded in theproject area:
S No Common Name Scientific Name Family1 Mango Mangifera indica Anacardiaceae.2 Cashew Anacardium occidentale Anacardiaceae3 Sal Shorea robusta Dipterocarpaceae4 Teak Tectona grandis Lamiaceae5 Mahuwa Madhuca longifolia Sapotaceae.6 Kusum Schleichera oleosa Sapindaceae7 Kendu Diospyros melanoxylon Ebenaceae8 Karanji Pongamia pinnata Papilionaceae9 Chakunda Cassia tora Caesalpinaceae
10 Jackfruit Artocarpus heterophyllus Moraceae11 Guava Psidium gujav Myrtaceae12 Banyan Ficus bengalensis Moraceae13 Pipal Ficus religiocia Moraceae14 Castor Recinus cummunis Euphorbia15 Kachnar Bombax Ceiba Malvales16 Semal Bauhinia Semla Caesalpinaceae17 Arjun Terminilia Arjuna Combretaceae18 Beleric Terminalia Bellirica Combretaceae19 Silver Oak Grevelia Robusta Proteaceae20 Aonla Phyllanthus emblica Phyllanthaceae21 Tendu Diospyros Celebica Ebenaceae22 Tamarind Tamarindus indica Fabaceae
Baseline Strata II: Project Land without Trees
The existing vegetation of the strata without growing trees is analyzed by using list quadrate method andcensus survey method which is extensively used for vegetation survey. Considering the huge size and thediscrete nature of the project site, a quadrate of size 10 m X 10 m is taken for vegetation analysis. Toensure that the flora of the entire strata without trees is represented, 348 discrete parcels belonging todifferent landholdings are selected. Representative quadrates are selected for analyzing the qualitativecharacters of vegetation. The details of which are given below.
Sl. No. Name of the Species Family Habit1. Acacia nilotica2. Cassia tora Leguminosae Herb3. Ipomea biloba Convolvulaceae Herb4. Capparis aphylla Capparidaceae Herb5. Croton bonplandianus Euphorbiaceae Herb6. Achyranthes aspera Amarantaceae Herb7. Parthenium hysterophorus Poaceae Herb

UNFCCC/CCNUCC
CDM – Executive BoardPROJECT DESIGN DOCUMENT FORM
FOR AFFORESTATION AND REFORESTATION PROJECT ACTIVITIES (CDM-AR-PDD) - Version 04
91/96
8. Tephrosia purpurea Pappilionaceae Herb9. Cyperus diformis Cyperaceae Herb
10. Chloris montana Poaceae Herb
Table C.4.1 below shows the total area of Baseline strata I and II, year wise:
Table C.4.1: Baseline StratificationStrata Plantation Year
2001 2002 2003 2004 2005 2006 2007 TotalTotal nos of Baseline trees 358 526 710 1329 1778 1954 2046 8701No of Parcels per Baseline Strata:
Baseline Strata I (Parcelswith trees)
55 104 131 233 282 327 351 1483
Baseline Strata II (Parcelswithout trees)
352 662 862 1535 2305 2608 2630 10954
Total: 407 766 993 1768 2587 2935 2981 12437Area per Baseline Strata (ha)Baseline Strata I (Parcelswith trees)
73.30 169.97 254.63 418.35 620.82 673.95 728.28 2939.30
Baseline Strata II (Parcelswithout trees)
447.28 830.91 946.71 1745.36 2402.79 2726.48 2930.63 12030.16
Total: 520.58 1000.88 1201.34 2163.71 3023.61 3400.43 3658.91 14969.46
The carbon stock in living biomass of pre-project growing trees is expected to increase in the absence of theproposed A/R CDM project activity, due to continuous growth of the living trees. The carbon stock in theliving biomass of pre-project trees has been predicted using equation from Brown et al.30 (1989) for dryforest in India.
Dry matter (kg) = exp(-1.996+2.32*ln (dbh cm)
Estimation of Baseline net GHG removals by Sinks (tonnes of CO2 )Year 2001 2002 2003 2004 2005 2006 2007 Total2001 0 0 0 0 0 0 0 0
2002 2.93 0 0 0 0 0 0 2.93
2003 2.94 4.74 0 0 0 0 0 7.68
2004 2.95 4.75 6.42 0 0 0 0 14.12
2005 2.96 4.76 6.44 10.39 0 0 0 24.55
2006 2.97 4.78 6.46 10.42 11.72 0 0 36.35
2007 2.98 4.79 6.48 10.45 11.77 14.18 0 50.64
2008 2.99 4.81 6.49 10.49 11.81 14.22 16.98 67.79
2009 3.00 4.82 6.51 10.52 11.85 14.27 17.04 68.01
30 Brown, S. 1997. Estimating biomass and biomass change of tropical forests: a primer. FAO ForestryPaper 134, Rome, Italy

UNFCCC/CCNUCC
CDM – Executive BoardPROJECT DESIGN DOCUMENT FORM
FOR AFFORESTATION AND REFORESTATION PROJECT ACTIVITIES (CDM-AR-PDD) - Version 04
92/96
2010 3.01 4.83 6.53 10.55 11.90 14.32 17.09 68.23
2011 3.02 4.85 6.55 10.59 11.94 14.37 17.14 68.45
2012 3.03 4.86 6.57 10.62 11.98 14.42 17.19 68.67
2013 3.03 4.87 6.59 10.65 12.02 14.47 17.24 68.89
2014 3.04 4.89 6.61 10.69 12.07 14.52 17.30 69.11
2015 3.05 4.90 6.62 10.72 12.11 14.56 17.35 69.33
2016 3.06 4.92 6.64 10.76 12.15 14.61 17.40 69.55
2017 3.07 4.93 6.66 10.79 12.20 14.66 17.46 69.77
2018 3.08 4.94 6.68 10.82 12.24 14.71 17.51 69.99
2019 3.09 4.96 6.70 10.86 12.29 14.76 17.56 70.21
2020 3.10 4.97 6.72 10.89 12.33 14.81 17.61 70.43
2021 3.11 4.99 6.74 10.93 12.37 14.86 17.67 70.65
2022 3.12 5.00 6.76 10.96 12.42 14.91 17.72 70.87
2023 3.13 5.01 6.77 10.99 12.46 14.96 17.77 71.10
2024 3.14 5.03 6.79 11.03 12.50 15.00 17.83 71.32
2025 3.15 5.04 6.81 11.06 12.55 15.05 17.88 71.54
2026 3.15 5.05 6.83 11.10 12.59 15.10 17.93 71.76
2027 3.16 5.07 6.85 11.13 12.63 15.15 17.98 71.98
2028 3.17 5.08 6.87 11.16 12.68 15.20 18.04 72.21
2029 3.18 5.10 6.89 11.20 12.72 15.25 18.09 72.43
2030 3.19 5.11 6.91 11.23 12.77 15.30 18.14 72.65
Total: 1751.20

UNFCCC/CCNUCC
CDM – Executive BoardPROJECT DESIGN DOCUMENT FORM
FOR AFFORESTATION AND REFORESTATION PROJECT ACTIVITIES (CDM-AR-PDD) - Version 04
93/96
Annex 4
MONITORING PLANThe monitoring plan complements the information not included in Section E above or in the monitoringmethodology applied.
1. Monitoring of the project implementationAccording to section E.1 above and Section III.1 of the methodology applied.
2. Sampling design and stratificationAccording to section E.2 above and Section III.2 of the methodology applied.
3. Monitoring of the baseline net GHG removals by sinkAccording to section E.3 above (Monitoring of the baseline net GHG removals by sinks is not needed asper the approved methodology AR-ACM0001 (Version 04) applied.
4. Monitoring of the actual net GHG removals by sinks data
a. Verifiable changes in carbon stocks in the carbon poolsa.1 Measuring and estimating carbon stock changes in living biomass
Sample Plots
Permanent sampling plots will be used for sampling over time to measure and monitor changes in carbonstocks of above and below ground biomass. The location of samples within the plot has been decidedrandomly to avoid any bias. The project boundary will be monitored by monitoring of parcels usingGPS. Any changes in project boundary will be accounted for in all calculations of actual net GHGremovals by sinks. The monitoring methodology uses permanent sample plots to monitor carbon stockchanges in above- and below-ground biomass pools. To reach the targeted precision level of about ±10%of the mean at the 95% confidence level in a cost-effective manner, the number of plots needed in eachstratum has been determined following equation (5) and (6) in AR-ACM0001 methodological tool“Calculation of the number of sample plots for measurements within A/R CDM project activities”(version 02).
where:

UNFCCC/CCNUCC
CDM – Executive BoardPROJECT DESIGN DOCUMENT FORM
FOR AFFORESTATION AND REFORESTATION PROJECT ACTIVITIES (CDM-AR-PDD) - Version 04
94/96
n sample size (total number of sample plots required) in the project areani sample size for stratum IE allowable error of the estimated quantity Qi project strataL total number of strata; dimensionlessα α = 1-α is probability that the estimate of the mean is within the error bound E
zα/2 zα/2 = value of the statistic z (embedded in Excel as: inverse of standard normal probabilitycumulative distribution), for e.g. 1-α = 0.05 (implying a 95% confidence level) zα/2=1.9599
Ni maximum possible number of sample plots in stratum IN maximum possible number of sample plots in the project areasti standard deviation for each stratum i; dimensionless, 30%A total size of all strata, e.g. the total project area; haAi size of each stratum i; haAP sample plot size (constant for all strata); 0.04 haQ approximate average value of the estimated quantity (aboveground wood volume per hectare);
m3 ha-1
p desired level of precision (10%); dimensionless
No of sample plots calculated stratum wise is given in Table E.2(a) below:
Table E.2(a): Number of Sample Plots for ex post MonitoringDefining feature of
StrataStrataYear of Plantation
Area (Ha)No of
Sample Plots
Strata 1 2001 520.58 34Strata 2 2002 1000.88 63Strata 3 2003 1201.34 84Strata 4 2004 2163.71 153Strata 5 2005 3023.61 216Strata 6 2006 3400.43 234Strata 7 2007 3658.91 257
Total: 14969.46 1041
Monitoring frequency
The planting activity has been conducted from 2001 to 2007. Eucalyptus sp. would be harvested at theage of 5 years. To avoid the coincidence with peaks in carbon stocks, the first monitoring will beconducted in the year 2009 with subsequent monitoring and verification interval of 5 years, i.e. in 2014,2019, 2024 and 2029.
Year No Year Monitoring Verification Harvesting1 20012 20023 20034 20045 20056 2006 √

UNFCCC/CCNUCC
CDM – Executive BoardPROJECT DESIGN DOCUMENT FORM
FOR AFFORESTATION AND REFORESTATION PROJECT ACTIVITIES (CDM-AR-PDD) - Version 04
95/96
7 2007 √8 2008 √9 2009 √ √ √
10 2010 √11 2011 √12 2012 √13 2013 √14 2014 √ √ √15 2015 √16 2016 √17 2017 √18 2018 √19 2019 √ √ √20 2020 √21 2021 √22 2022 √23 2023 √24 2024 √ √ √25 2025 √26 2026 √27 2027 √28 2028 √29 2029 √ √ √30 2030 √
Monitoring GHG emissions by sources as the result of the A/R CDM project activity
No biomass burning took place due to project activities and therefore this will not be monitored.
5. Monitoring of leakage
A constant monitoring will be done to determine if any possible new sources of leakage arise, since thereis none at the present time. However will be monitored the grazing.
- - - - -

UNFCCC/CCNUCC
CDM – Executive BoardPROJECT DESIGN DOCUMENT FORM
FOR AFFORESTATION AND REFORESTATION PROJECT ACTIVITIES (CDM-AR-PDD) - Version 04
96/96
History of the document
Version Date Nature of revision04 EB35, Annex 20
19 October 2007 Restructuring of section A; Section “Monitoring of forest establishment and management”
replaces sections: “Monitoring of the project boundary”, and“Monitoring of forest management”;
Introduced a new section allowing for explicit description of SOPsand quality control/quality assurance (QA/QC) procedures ifrequired by the selected approved methodology;
Change in design of the section “Monitoring of the baseline netGHG removals by sinks” allowing for more efficient presentationof data.
03 EB26, Annex 1929 September 2006
Revisions in different sections to reflect equivalent forms used by the MethPanel and assist in making more transparent the selection of an approvedmethodology for a proposed A/R CDM project activity.
02 EB23, Annex 15a/b24 February 2006
Inclusion of a section on the assessment of the eligibility of land and theSampling design and stratification during monitoring
01 EB15, Annex 603 September 2004
Initial adoption