196 ieee transactions on biomedical engineering… · 196 ieee transactions on biomedical...
TRANSCRIPT

196 IEEE TRANSACTIONS ON BIOMEDICAL ENGINEERING, VOL. 64, NO. 1, JANUARY 2017
Reduction of Periodic Motion Artifactsin Photoplethysmography
Ralph W. C. G. R. Wijshoff∗, Massimo Mischi, Senior Member, IEEE, and Ronald M. Aarts, Fellow, IEEE
Abstract—Periodic motion artifacts affect photoplethys-mography (PPG) signals in activities of daily living (ADL),cardiopulmonary exercise testing (CPX), and cardiopul-monary resuscitation (CPR). This hampers measurementof interbeat intervals (IBIs) and oxygen saturation (SpO2 ).Our objective was to develop a generic algorithm to re-move periodic motion artifacts, recovering artifact-reducedPPG signals for beat-to-beat analysis. Methods: The algo-rithm was retrospectively evaluated on forehead PPG sig-nals measured while walking on a treadmill. The step ratewas tracked in a motion reference signal via a second-ordergeneralized integrator with a frequency-locked loop. Tworeference signals were compared: sensor motion relativeto the skin (Δx[n]) measured via self-mixing interferome-try and head motion (av [n]) measured via accelerometry.The step rate was used in a quadrature harmonic model toestimate the artifacts. Quadrature components need onlytwo coefficients per frequency leading to a short filter andprevent undesired frequency-shifted components in the ar-tifact estimate. Subtracting the estimate from the measuredsignal reduced the artifacts. Results: Compared to Δx[n],av [n] had a better signal-to-noise ratio and more consis-tently contained a component at the step rate. Artifact re-duction was effective for distinct step rate and pulse rate,since the artifact-reduced signals provided more stable IBIand SpO2 measurements. Conclusion: Accelerometry pro-vided a more reliable motion reference signal. The proposedalgorithm can be of significance for monitoring in ADL, CPX,or CPR, by providing artifact-reduced PPG signals for im-proved IBI and SpO2 measurements during periodic motion.
Index Terms—Accelerometry, correlation cancellation,frequency-locked loop (FLL), harmonic model, interbeat in-terval (IBI), least mean-squares (LMS), motion artifact re-duction, oxygen saturation, photoplethysmography (PPG),pulse rate (PR), quadrature components, second-order gen-eralized integrator (SOGI), self-mixing interferometry (SMI).
I. INTRODUCTION
PHOTOPLETHYSMOGRAPHY (PPG) is a noninvasiveeasy-to-use optical technology, widely applied to monitor
Manuscript received February 5, 2016; accepted April 5, 2016. Dateof publication April 12, 2016; date of current version December 20,2016. This work was supported by NL Agency, IOP Photonic Devices,IPD083359 HIP—Hemodynamics by Interferometric Photonics. Asteriskindicates corresponding author.
∗R. W. C. G. R. Wijshoff is with the Department of Electrical Engi-neering, Eindhoven University of Technology, 5612, AZ, Eindhoven, TheNetherlands, and also with Philips Research, 5656, AE, Eindhoven, TheNetherlands (e-mail: [email protected]).
M. Mischi is with the Department of Electrical Engineering, EindhovenUniversity of Technology.
R. M. Aarts is is the Department of Electrical Engineering, EindhovenUniversity of Technology, and also with Philips Research.
Digital Object Identifier 10.1109/TBME.2016.2553060
the cardiovascular and respiratory systems [1]–[5]. PPG mea-sures local changes in microvascular blood volume by emittinglight through tissue [6]. PPG can be used to measure cardiacpulse rate (PR) and peripheral arterial functional-hemoglobinoxygen saturation (SpO2) [1], [3], [5], [7]. PR can be derivedfrom the cardiac-induced variations in a PPG signal, either inthe time [8] or frequency domain [9]. An empirical calibrationrelates SpO2 to the ratio of the baseline-normalized cardiac-induced variations in two PPG signals obtained at differentwavelengths, typically red and near-infrared [7], [10]–[14].
PPG signals are highly susceptible to motion which ham-pers their use in, e.g., activities of daily living (ADL) [1], [5],[15], cardiopulmonary exercise testing (CPX) [16], [17], or car-diopulmonary resuscitation (CPR) [18], [19]. In ADL, the useof PPG is, for instance, researched to detect PR changes inpatients with epilepsy [20], as this can indicate seizures [21].Susceptibility to motion hampers beat-to-beat analysis, e.g., toobtain PR variability [22], or to detect atrial fibrillation [23].Motion can also affect SpO2 measurements, e.g., causing falsepositive desaturations during CPX [16], [17]. During CPR, mo-tion artifacts due to chest compressions complicate detection ofa cardiac pulse in the signal [18], [19]. In this paper, we willfocus on quasi-periodic motion artifacts, which is one type ofmotion artifact that can occur in ADL, CPX, and CPR. Quasi-periodic artifacts are, furthermore, relevant because algorithmsmay confuse them with a PR component [24].
Removal of motion artifacts to recover artifact-reduced PPGsignals has been researched extensively. Various generic ap-proaches exist for removal of additive periodic motion artifactsusing correlation cancellation with an accelerometer as a mo-tion reference [24]–[29]. In these approaches, the artifact isestimated by applying a finite impulse response (FIR) filter toa single reference signal and updating all FIR coefficients overtime. However, quadrature reference signals would be preferredhere, because then only two coefficients are needed per fre-quency and undesired frequency-shifted components cancel inthe estimate [30], [31]. Wavelength-independent multiplicativeoptical-coupling artifacts can be removed from a PPG signal bynormalization by a second PPG signal obtained at a differentwavelength [32]–[34]. However, this requires a revised calibra-tion for SpO2 . Artifact-reduced PPG signals can also be recov-ered using a synthetic reference for the cardiac pulse waveform[35], deriving artifact references from the measured PPG signals[36], [37], applying a signal decomposition method [38], [39],or averaging several consecutive pulses [40]. However, the ap-proaches without an additional motion measurement provide asegmented recovery of the artifact-reduced PPG signal, requirea reliable PR measurement prior to artifact removal, or needto detect the individual cardiac pulses in the corrupted PPGsignal.
0018-9294 © 2016 IEEE. Personal use is permitted, but republication/redistribution requires IEEE permission.See http://www.ieee.org/publications standards/publications/rights/index.html for more information.

WIJSHOFF et al.: REDUCTION OF PERIODIC MOTION ARTIFACTS IN PHOTOPLETHYSMOGRAPHY 197
Methods have also been developed focusing on the extractionof averaged physiological parameters from motion-corruptedPPG signals. PR has been determined from the PPG signal fre-quency spectrum using an accelerometer to identify the motionfrequencies [41]–[44]. In [44], an artifact-reduced PPG timetrace is also reconstructed, but the reconstruction is window-based, and uses per window a single PR selected from the PPGfrequency spectrum. PR has also been determined from thePPG signal frequency spectrum after artifact removal with anotch filter at the motion frequency as measured via the photo-diode with the light-emitting diodes (LEDs) switched off [45].Motion-robust SpO2 measurements have been obtained by dis-criminating cardiac-induced arterial and motion-induced venouscomponents based on their different amplitude ratios in the redand near-infrared PPG signals [46], [47]. PR and SpO2 canalso be measured more reliably by using the smoothed pseudoWigner–Ville distribution [48].
In this paper, we focus on a generic approach to remove peri-odic motion artifacts to recover artifact-reduced PPG signals forbeat-to-beat analysis. We determined the fundamental motionfrequency from a motion reference signal via a second-ordergeneralized integrator (SOGI) with a frequency-locked loop(FLL) [49]. We described the motion artifact by a harmonicmodel of quadrature components with frequencies related to thefundamental motion frequency. With quadrature components,only two coefficients need to be estimated per frequency com-ponent, leading to a short filter. We estimated the coefficientsvia a least mean-squares (LMS) algorithm. Quadrature compo-nents also prevent undesired frequency-shifted components inthe artifact estimate. The motion artifact was removed by sub-tracting the harmonic model from the measured PPG signal.Furthermore, we compare two motion reference signals: sensormotion relative to the skin and body motion. Motion relative tothe skin is an origin of artifacts in PPG [1], [7], [26], [32], [33],[35]. We measured relative sensor motion with a laser diode(LD) attached to the PPG sensor using self-mixing interferom-etry (SMI) [50]–[52]. The objective was to gain insight in theamount of relative sensor motion. We measured body motionwith an accelerometer. Red and infrared (IR) PPG signals weremeasured on the forehead while walking on a treadmill to gen-erate periodic motion artifacts. We used a reflective PPG sensor,because measurement of relative motion is more convenientcompared to a transmissive sensor. Furthermore, a reflectivesensor is more widely applicable than a transmissive sensor [5],[11], [53], [54]. We performed a preliminary validation of thealgorithm only, using a limited dataset of thirty measurementsobtained from six healthy volunteers.
II. METHODS A: EXPERIMENT AND MEASUREMENTS
Thirty measurements were performed on six healthy malevolunteers, following the protocol in Fig. 1(a). Each subjectwalked on a treadmill at speeds of 4, 5, 6, 7, and 8 km/h togenerate periodic motion artifacts. Each speed was maintainedfor 2 min and was preceded and followed by 1 min of restwith the subject standing still. The Institutional Review Boardapproved the study. All subjects signed informed consent.
Fig. 1(b) shows the customized forehead sensor. Raw red(660 nm) and near-infrared (900 nm) PPG signals were
Fig. 1. (a) Treadmill protocol to generate periodic motion artifacts. (b)Forehead pulse oximetry sensor with laser diode and triaxial accelerom-eter as motion references.
obtained with a forehead reflectance pulse oximetry sensor(Nellcor Oxisensor II RS-10, Covidien-Nellcor, Dublin, Ire-land), controlled by a custom-built photoplethysmograph. Theheadband delivered with the oximetry sensor was used to ex-ert pressure on the sensor. An 850-nm vertical-cavity surface-emitting LD with an internal monitor diode (ULM-PhotonicsGmbH, Philips, Ulm, Germany) was positioned next to theoximetry sensor to measure sensor motion relative to the skin. AsFig. 1(b) shows, the LD was positioned at an angle of 45◦ in theplane of the oximetry sensor and at an angle of 30◦ with respectto the surface normal, to allow measuring vertical and horizon-tal relative sensor motion. The laser light was focused onto theskin via a ball lens integrated into the LD package. A triax-ial accelerometer (LIS344ALH, STMicroelectronics, Geneva,Switzerland) was placed on top of the oximetry sensor to mea-sure head motion. A lead I electrocardiography (ECG) signalwas recorded as a reference, using a custom-built ECG module.The PPG, accelerometry, monitor diode and ECG signals weresimultaneously recorded using a 16-bit digital data acquisitioncard (DAQ) (NI USB-6259, National Instruments, Austin, TX,USA). A LabVIEW (National Instruments, Austin, TX, USA)program controlled the DAQ. A finger clip pulse oximetry sensor(M1191B, Philips Medizin Systeme Boeblingen GmbH, Boe-blingen, Germany) was used with a commercial pulse oximetryOEM board to obtain SpO2 measurements for comparison.
III. METHODS B: ARTIFACT REDUCTION ALGORITHM
Fig. 2 shows the generic motion artifact reduction algorithmwhich ran at a sampling rate of fs = 250 Hz. The primary in-put was the measured red or IR PPG signal, ppg[n] [V], withsample index n. The algorithm was run once for the red PPGsignal, and once for the IR PPG signal. The secondary inputwas the motion reference signal, mref [n], used to track the fun-damental motion frequency, which was the step rate. We com-pared two motion reference signals: sensor motion relative tothe skin measured via SMI (see Section III-A), and head mo-tion derived from the accelerometer (see Section III-B). Theprimary and secondary input signals were preprocessed by abandpass filter (BPF) (see Section III-C). The fundamental mo-tion frequency, ωFLL[n] [rad/s], was estimated from mref [n]

198 IEEE TRANSACTIONS ON BIOMEDICAL ENGINEERING, VOL. 64, NO. 1, JANUARY 2017
Fig. 2. Overview of the motion artifact reduction algorithm. The primary input is the red or IR PPG signal, ppg[n]. The algorithm runs once for eachof the PPG signals. The secondary input is the motion reference signal, mref [n]. The primary and secondary inputs are preprocessed with a BPF.After the BPF, the PPG signal ppgbpf [n] is assumed a sum of a cardiac pulse component, cp[n], a motion artifact, ma[n], and residual noise, r[n].The BPF also extracts the baseline of the PPG signal, ppgbl [n]. A SOGI-based structure with an FLL tracks the fundamental frequency of motion,ωFLL [n], in mref [n]. This frequency is used to construct the phases φ1−4 [n] of four cosine and sine quadrature components, which are the basis ofthe artifact model. An LMS algorithm with step-size parameter μ determines the amplitudes a1−4 [n] and b1−4 [n] of the cosine and sine quadraturecomponents, respectively, and sums these components to construct the motion artifact estimate, maest [n]. Subtracting maest [n] from ppgbpf [n]yields the artifact-reduced output signal, ppgar [n]. The artifact removal stage is switched on by the GF only if the tracked motion frequency ωFLL [n]is considered stable.
using a SOGI-based structure with an FLL (see Section III-D).The motion artifact was subsequently estimated and removedby constructing quadrature reference signals and applying anLMS algorithm (see Section III-E). The algorithm output wasthe artifact-reduced PPG signal, ppgar[n].
A. Relative Sensor Motion
We measured motion of the oximetry sensor relative to theskin, because we expected that relative sensor motion wouldchange the tissue volume which is illuminated by the LEDs,resulting in a motion artifact. Therefore, we expected a goodcorrelation between relative sensor motion and motion artifactsin the PPG signals.
Relative sensor motion was measured with the LD using SMI.Relative sensor motion caused a Doppler shift in the emittedlaser light. The monitor diode of the LD measured a signalat the Doppler frequency when back-scattered laser light en-tered the laser cavity and interfered with the standing wave. Wedetermined a measure of sensor motion relative to the skin fromthe monitor diode signal.
A DC laser current of about 1.63 mA generated about 0.5 mWof optical output power. The laser current was sinusoidally mod-ulated at a frequency of 40 kHz with an amplitude of 158 μA.The modulation resulted in quadrature Doppler frequency com-ponents around the modulation frequency and its first harmonic,respectively, as was measured by the monitor diode. The DAQsampled the 100-kHz band-limited monitor diode signal at asampling rate of 200-kHz.
The remainder of this section summarizes the determinationof relative sensor motion. More details can be found in [51].
Baseband quadrature Doppler signals were obtained by trans-lating the Doppler signals around the modulation frequency andits harmonic to baseband and applying a 15-kHz low-pass filter(LPF) and a 10-Hz high-pass filter (HPF). The baseband Dopplersignals were normalized via the Hilbert transform, by using theDoppler phase of the resulting analytical signals, φd [n] [rad],in a sine and a cosine. This resulted in the normalized Dopplersignals y[n] and x[n]:
y[n] = sin (φd [n]) (1)
x[n] = cos (φd [n]) . (2)
Relative sensor motion, Δx[n], was then obtained via
Δx[n] =12π
unwrap
[atan2
(y[n]x[n]
)](3)
where unwrap removes the discontinuities in the radian phase byadding multiples of±2π, and atan2 is a four-quadrant arctangentimplementation. After the LPF of the preprocessing stage (seeSection III-C), Δx[n] was downsampled to fs = 250 Hz.
The unit of Δx[n] (3) was the number of Doppler cycles.The absolute unit could not be determined because the anglebetween the laser beam and the skin was unknown and becausea 3-D motion was mapped onto a single axis.
B. Accelerometry
The triaxial accelerometer measured head motion. From thethree axes, the head-vertical axis av [n] contained the strongestfundamental motion-frequency component and was, therefore,used as motion reference mref [n].

WIJSHOFF et al.: REDUCTION OF PERIODIC MOTION ARTIFACTS IN PHOTOPLETHYSMOGRAPHY 199
Fig. 3. Motion frequency, ωFLL [n], is tracked in the motion referencesignal, mref [n], via a SOGI-based structure with an FLL. The integratorsHint (z) of the SOGI filter from the input mref [n] the outputs mi [n] andmq [n], the in-phase and quadrature signals at ωFLL [n], respectively. Thetime constant τSOGI [s] sets the filter bandwidth. The FLL input, Δω[n] =e[n] · mq [n] with e[n] = 2(mref [n] − mi [n])/τSOGI , is a measure of theFLL frequency error and is used to adjust the FLL output ωFLL [n]. TheFLL gain Γ [−] sets the FLL bandwidth.
C. Preprocessing
As preprocessing, the same BPF was applied to ppg[n] andmref [n]. The BPF was an LPF followed by a linear-phase HPF.A sixth-order Butterworth 4-Hz LPF removed high-frequencynoise. To construct the HPF, the low-frequency baseline wasfirst extracted via a filter with impulse response
hbl[n] =sin (2πfc (n − Nbl) /fs)
2πfc (n − Nbl) /fs
wH [n]Shbl
, n = 0, . . . , 2Nbl
(4)with cutoff frequency fc = 0.5 Hz, Hamming window wH [n]centered at n = Nbl , normalization factor Shbl to have hbl[n]sum to 1, and Nbl = fs/fc = 500 samples. The HPF was ob-tained by subtracting the baseline from the original signal de-layed by Nbl samples. The sinc-function in (4) assured a linearphase-response. The Hamming window reduced overshoot andringing in the magnitude frequency response. The extracted PPGsignal baselines, ppgbl[n], were used to determine pulsatility(see Section IV-C) and SpO2 (see Section IV-E).
D. Measurement of the Step Rate
Fig. 3 shows the SOGI-based structure with the FLL [49],[55], [56] used to track the step rate in mref [n] on a sample-to-sample basis. The SOGI has two integrators, Hint(z), whichfiltered from the input mref [n] the outputs mi [n] and mq [n],the in-phase and quadrature signals at FLL frequency ωFLL[n][rad/s], respectively. The FLL used mi [n] and mq [n] to estimatethe frequency error between ωFLL[n] and the step rate, Δω[n],and to make the FLL adaptation speed independent of the mag-nitude of the tracked frequency component. We assumed steprates between 1 and 3 Hz.
The transfer functions from mref [n] to mi [n] and mq [n] are,respectively, using continuous-time for simplicity
Hi(s) =(2/τSOGI)s
s2 + (2/τSOGI)s + ω2FLL
(5)
Hq (s) =(2/τSOGI)ωFLL
s2 + (2/τSOGI)s + ω2FLL
(6)
with s = jω, time constant τSOGI [s], and FLL frequency ωFLL[rad/s] which has been assumed constant here. Frequency ωFLLis the resonance of (5) and (6), where the input appears un-
changed at mi [n] and with a 90◦ lag at mq [n]. The zero of thetransfer function from mref [n] to e[n] shows that loop input e[n]contains no component at ωFLL :
He(s) =Hq (s)ωFLL
(s2 + ω2
FLL). (7)
The 3-dB frequencies fcSOGI [Hz] around the resonances of (5)and (6) describe the bandwidth of the filter:
fcSOGI =12π
√√√√ω2FLL +
2τ 2SOGI
± 2τSOGI
√ω2
FLL +1
τ 2SOGI
.
(8)We used τSOGI = 0.7 s, giving a 3-dB width of about 0.5 Hz.
We implemented Hint(z) as a second-order integrator [55]to accurately approximate an ideal integrator 1/(jω) for theassumed motion frequencies up to 3 Hz:
Hint(z) =Ts
23z−1 − z−2
1 − z−1 . (9)
Compared to an ideal integrator for frequencies up to 3 Hz,the deviation in magnitude and phase frequency response of (9)was at most 0.24% and −0.006◦, respectively. The delays in thenumerator of (9) prevented an algebraic loop.
The FLL adjusted ωFLL[n] to track the frequency ωref [n] inmref [n]. The FLL input, Δω[n] = e[n] · mq [n], is an instanta-neous measure of the frequency error ωFLL[n] − ωref [n]. As (7)shows, e[n] and mq [n] have the same phase when ωFLL[n] >ωref [n] and opposite phase when ωFLL[n] < ωref [n]. Therefore,Δω[n] is on average positive when ωFLL[n] should decrease,and on average negative when ωFLL[n] should increase. Mul-tiplying Δω[n] by the negative FLL gain −Γ [−] resulted ina frequency correction which steered ωFLL[n] towards ωref [n].The input Δω[n] was normalized by m2
i [n] + m2q [n] to make
the adaptation speed independent of the magnitude of thetracked frequency component. When m2
i [n] + m2q [n] = 0, nor-
malization was not performed and ωFLL[n] was not updated.When m2
i [n] + m2q [n] > 0, ωFLL[n] was adjusted according to
the following approximation for ωFLL[n] ≈ ωref [n], by usingω2
FLL [n] − ω2ref [n] ≈ 2ωFLL[n](ωFLL [n] − ωref [n]) in (7):
ωFLL[n + 1] = (1 − Γ) ωFLL[n] + Γωref [n] (10)
where we neglected the double-frequency component in Δω[n].The relation between FLL gain Γ, time constant τFLL [s], and3-dB cutoff frequency fcFLL [Hz] follows from (10):
Γ = 1 − exp(
−1τFLLfs
)= 1 − exp
(−2πfcFLL
fs
). (11)
We used fcFLL = 0.1 Hz (τFLL ≈ 1.6 s) so (10) suppressedthe minimum 2-Hz double-frequency component by a factor oftwenty. We initiated the FLL at ωFLL[0]/(2π) = 1.5 Hz.
The SOGI-based structure in Fig. 3 locked to the frequencyin mref [n] which was closest to ωFLL[n] at start-up or after atemporary loss of signal in mref [n]. It could, therefore, lock to a(sub)harmonic of the step rate. To ascertain locking to the steprate, ωFLL[n] was for each n compared to the frequency fmax ofthe largest local maximum between 1 and 3 Hz in the magnitudefrequency spectrum of mref [n]. Once per second, a coarse spec-trum of mref [n] was determined via the Fast Fourier Transform

200 IEEE TRANSACTIONS ON BIOMEDICAL ENGINEERING, VOL. 64, NO. 1, JANUARY 2017
of a 5-s window and fmax was updated. If ωFLL[n]/(2π) devi-ated by more than 0.5 Hz from fmax , then ωFLL[n] was replacedby 2πfmax to lock to the step rate; otherwise, ωFLL[n] remainedunchanged. Frequency fmax was updated as unavailable if nolocal maximum was found, and then, ωFLL[n] remained un-changed too.
E. Estimation and Reduction of Motion Artifacts
We described the bandpass filtered signal, ppgbpf [n], obtainedby applying the BPF in Section III-C to the measured signalppg[n], as a sum of a cardiac pulse component, cp[n], a motionartifact, ma[n], and residual noise, r[n]:
ppgbpf [n] = cp[n] + ma[n] + r[n]. (12)
We chose an additive model, because spectral analysis ofppgbpf [n] showed that walking introduced components at thestep rate and its (sub)harmonics in ppgbpf [n] in addition to com-ponents at the PR and its harmonics. Subtracting the motion arti-fact estimate maest [n] from ppgbpf [n] gave the artifact-reducedsignal ppgar [n]:
ppgar [n] = ppgbpf [n] − maest [n]. (13)
We obtained maest [n] via a quadrature harmonic model:
maest [n] = G[n]4∑
k=1
[ak [n] cos (φk [n]) + bk [n] sin (φk [n])]
(14)with gating function G[n] [−], amplitudes ak [n] and bk [n] [V],and motion phases φk [n] [rad]. Motion artifact maest [n] wasseparately estimated for the red and IR PPG signal. G[n] as-sessed the stability of ωFLL[n]. G[n] was one when ωFLL[n] wasconsidered stable, and zero otherwise. G[n] forced maest [n] tozero when no stable motion frequency was detected. We deter-mined G[n] via hysteresis detection:
dfFLL[n] =fs
2πHG (z) |ωFLL[n] − ωFLL[n − 1]| (15)
Gh [n] =
{0 → 1, if dfFLL[n] < 0.1 Hz/s
1 → 0, if dfFLL[n] > 0.5 Hz/s(16)
G[n] = HG (z)Gh [n] (17)
HG (z) =1 − exp(−1/(τGfs))z − exp(−1/(τGfs))
(18)
with τG = 0.2 s. HG (z) tracked the envelope in (15) andsmoothed in (17). We initialized Gh [n] at 0. The phases φk [n][rad] were determined as
φk [n] = φk [n − 1] +kωFLL[n]
2fsmod 2π, k = 1, 2, 3, 4
(19)where mod is the modulo operation. Phases were reset toφk [n] = 0 when G[n] < 0.005. The amplitudes ak [n] and bk [n]were estimated via an LMS algorithm [30], [57]:
ak [n + 1] = ak [n] + 2μG[n]ppgar [n] cos (φk [n]) (20)
bk [n + 1] = bk [n] + 2μG[n]ppgar [n] sin (φk [n]) (21)
with step-size parameter μ. Coefficients were reset to ak [n] =0 and bk [n] = 0 when G[n] < 0.005. The LMS-filter transferfunction between ppgbpf [n] and ppgar[n] can be approximatedby a cascade of notch filters at (k/2)ωFLL [30], [57], whereeach notch has a 3-dB bandwidth W [Hz] of about [30]
W ≈ μfs
π. (22)
Furthermore, μ determined the convergence time Tcv [s] to afraction 0 < v < 1 of the targeted values for ak and bk via
Tcv =1fs
ln(1 − v)ln(1 − μ)
. (23)
Removal of pulses with a PR close to the step ratewas limited to ranges of about (kωFLL)/(4π) ± 1/24 Hzby using μ = 0.001, so W ≈ 0.08 Hz ≈ 4.8 min−1 , andTc0.95 ≈ 12 s.
IV. METHODS C: PERFORMANCE EVALUATION
The performance of the artifact reduction was assessed forboth relative sensor motion Δx[n] and head motion av [n]. Theadequacy as motion reference was assessed by the signal-to-noise ratio (SNR) and the stability of the extracted motion fre-quency (see Section IV-A). The artifact-reduced PPG signal wasassessed for accuracy of the interbeat intervals (IBIs) comparedto the ECG R-peak intervals (see Section IV-B–IV-D), and foraccuracy of SpO2 (see Section IV-E).
A. Motion References
The SNR of the motion references was determined as theratio of the root mean square (RMS) amplitude during walkingand rest. The RMS amplitude was determined from Δxbpf [n]and av bpf [n], as obtained by applying the BPF in Section III-C to Δx[n] and av [n], respectively. Episodes with outliers inΔxbpf [n] and av bpf [n], caused by touching the head band,were excluded. The stability of fFLL[n] = ωFLL[n]/(2π) wasassessed for Δx[n] and av [n] in each 2 min walking period bythe standard deviation (SD) of fFLL[n] excluding the first 10 s,and the mean and SD of dfFLL[n] and G[n].
B. R-Peak Detection
As a reference for the IBIs, we used the R-peak to R-peak in-tervals (RRIs) in the ECG signal, which was sampled at 250 Hzand band-limited to 0.5–20 Hz. We detected the steepest as-cent and descent of the QR and RS slopes, respectively, byapplying positive and negative thresholds to the ECG signaltime derivative. The initial R-peak was found as the maximumin the ECG signal between the QR and RS slopes. The timeinstant of the ith R-peak, tR [i], was found by interpolatingthe initial R-peak and its neighboring samples with a second-order polynomial. All detected R-peaks were visually inspected.The RRI was determined from the interpolated time instants asRRI[i] = tR [i] − tR [i − 1].
C. Pulse Detection
Pulses were detected in the red and IR bandpass filtered signalppgbpf [n] and artifact-reduced signal ppgar[n]. In the following
WIJSHOFF et al.: REDUCTION OF PERIODIC MOTION ARTIFACTS IN PHOTOPLETHYSMOGRAPHY 201
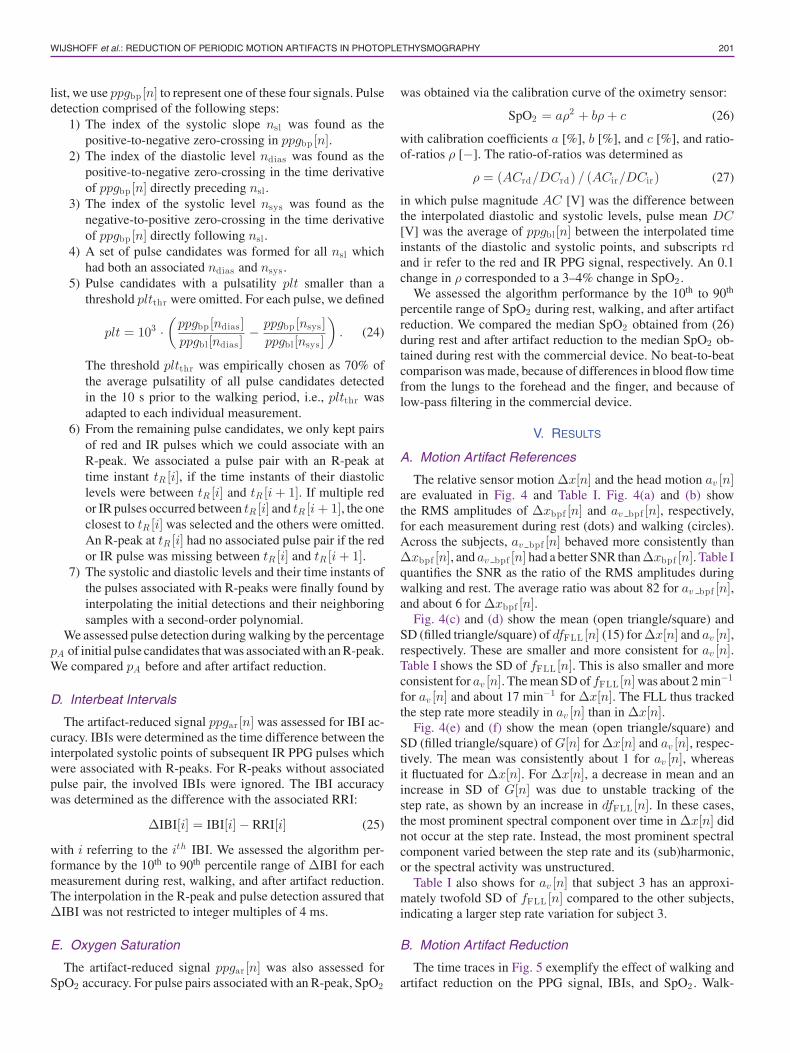
list, we use ppgbp [n] to represent one of these four signals. Pulsedetection comprised of the following steps:
1) The index of the systolic slope nsl was found as thepositive-to-negative zero-crossing in ppgbp [n].
2) The index of the diastolic level ndias was found as thepositive-to-negative zero-crossing in the time derivativeof ppgbp [n] directly preceding nsl .
3) The index of the systolic level nsys was found as thenegative-to-positive zero-crossing in the time derivativeof ppgbp [n] directly following nsl .
4) A set of pulse candidates was formed for all nsl whichhad both an associated ndias and nsys .
5) Pulse candidates with a pulsatility plt smaller than athreshold pltthr were omitted. For each pulse, we defined
plt = 103 ·(
ppgbp [ndias ]ppgbl[ndias ]
− ppgbp [nsys ]ppgbl[nsys ]
). (24)
The threshold pltthr was empirically chosen as 70% ofthe average pulsatility of all pulse candidates detectedin the 10 s prior to the walking period, i.e., pltthr wasadapted to each individual measurement.
6) From the remaining pulse candidates, we only kept pairsof red and IR pulses which we could associate with anR-peak. We associated a pulse pair with an R-peak attime instant tR [i], if the time instants of their diastoliclevels were between tR [i] and tR [i + 1]. If multiple redor IR pulses occurred between tR [i] and tR [i + 1], the oneclosest to tR [i] was selected and the others were omitted.An R-peak at tR [i] had no associated pulse pair if the redor IR pulse was missing between tR [i] and tR [i + 1].
7) The systolic and diastolic levels and their time instants ofthe pulses associated with R-peaks were finally found byinterpolating the initial detections and their neighboringsamples with a second-order polynomial.
We assessed pulse detection during walking by the percentagepA of initial pulse candidates that was associated with an R-peak.We compared pA before and after artifact reduction.
D. Interbeat Intervals
The artifact-reduced signal ppgar [n] was assessed for IBI ac-curacy. IBIs were determined as the time difference between theinterpolated systolic points of subsequent IR PPG pulses whichwere associated with R-peaks. For R-peaks without associatedpulse pair, the involved IBIs were ignored. The IBI accuracywas determined as the difference with the associated RRI:
ΔIBI[i] = IBI[i] − RRI[i] (25)
with i referring to the ith IBI. We assessed the algorithm per-formance by the 10th to 90th percentile range of ΔIBI for eachmeasurement during rest, walking, and after artifact reduction.The interpolation in the R-peak and pulse detection assured thatΔIBI was not restricted to integer multiples of 4 ms.
E. Oxygen Saturation
The artifact-reduced signal ppgar [n] was also assessed forSpO2 accuracy. For pulse pairs associated with an R-peak, SpO2
was obtained via the calibration curve of the oximetry sensor:
SpO2 = aρ2 + bρ + c (26)
with calibration coefficients a [%], b [%], and c [%], and ratio-of-ratios ρ [−]. The ratio-of-ratios was determined as
ρ = (ACrd/DCrd) / (ACir/DCir) (27)
in which pulse magnitude AC [V] was the difference betweenthe interpolated diastolic and systolic levels, pulse mean DC[V] was the average of ppgbl[n] between the interpolated timeinstants of the diastolic and systolic points, and subscripts rdand ir refer to the red and IR PPG signal, respectively. An 0.1change in ρ corresponded to a 3–4% change in SpO2 .
We assessed the algorithm performance by the 10th to 90th
percentile range of SpO2 during rest, walking, and after artifactreduction. We compared the median SpO2 obtained from (26)during rest and after artifact reduction to the median SpO2 ob-tained during rest with the commercial device. No beat-to-beatcomparison was made, because of differences in blood flow timefrom the lungs to the forehead and the finger, and because oflow-pass filtering in the commercial device.
V. RESULTS
A. Motion Artifact References
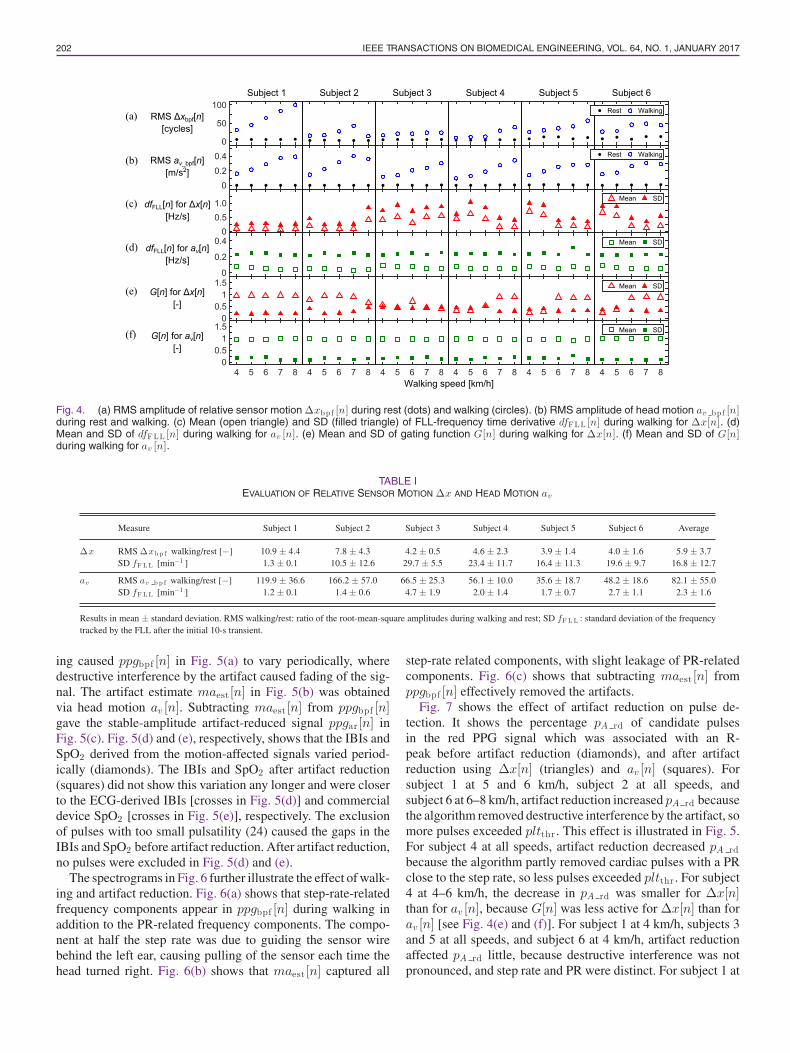
The relative sensor motion Δx[n] and the head motion av [n]are evaluated in Fig. 4 and Table I. Fig. 4(a) and (b) showthe RMS amplitudes of Δxbpf [n] and av bpf [n], respectively,for each measurement during rest (dots) and walking (circles).Across the subjects, av bpf [n] behaved more consistently thanΔxbpf [n], and av bpf [n] had a better SNR than Δxbpf [n]. Table Iquantifies the SNR as the ratio of the RMS amplitudes duringwalking and rest. The average ratio was about 82 for av bpf [n],and about 6 for Δxbpf [n].
Fig. 4(c) and (d) show the mean (open triangle/square) andSD (filled triangle/square) of dfFLL[n] (15) for Δx[n] and av [n],respectively. These are smaller and more consistent for av [n].Table I shows the SD of fFLL[n]. This is also smaller and moreconsistent for av [n]. The mean SD of fFLL [n] was about 2 min−1
for av [n] and about 17 min−1 for Δx[n]. The FLL thus trackedthe step rate more steadily in av [n] than in Δx[n].
Fig. 4(e) and (f) show the mean (open triangle/square) andSD (filled triangle/square) of G[n] for Δx[n] and av [n], respec-tively. The mean was consistently about 1 for av [n], whereasit fluctuated for Δx[n]. For Δx[n], a decrease in mean and anincrease in SD of G[n] was due to unstable tracking of thestep rate, as shown by an increase in dfFLL[n]. In these cases,the most prominent spectral component over time in Δx[n] didnot occur at the step rate. Instead, the most prominent spectralcomponent varied between the step rate and its (sub)harmonic,or the spectral activity was unstructured.
Table I also shows for av [n] that subject 3 has an approxi-mately twofold SD of fFLL[n] compared to the other subjects,indicating a larger step rate variation for subject 3.
B. Motion Artifact Reduction
The time traces in Fig. 5 exemplify the effect of walking andartifact reduction on the PPG signal, IBIs, and SpO2 . Walk-
202 IEEE TRANSACTIONS ON BIOMEDICAL ENGINEERING, VOL. 64, NO. 1, JANUARY 2017
Fig. 4. (a) RMS amplitude of relative sensor motion Δxbpf [n] during rest (dots) and walking (circles). (b) RMS amplitude of head motion av bpf [n]during rest and walking. (c) Mean (open triangle) and SD (filled triangle) of FLL-frequency time derivative dfFLL [n] during walking for Δx[n]. (d)Mean and SD of dfFLL [n] during walking for av [n]. (e) Mean and SD of gating function G[n] during walking for Δx[n]. (f) Mean and SD of G[n]during walking for av [n].
TABLE IEVALUATION OF RELATIVE SENSOR MOTION Δx AND HEAD MOTION av
Measure Subject 1 Subject 2 Subject 3 Subject 4 Subject 5 Subject 6 Average
Δx RMS Δxb p f walking/rest [−] 10.9 ± 4.4 7.8 ± 4.3 4.2 ± 0.5 4.6 ± 2.3 3.9 ± 1.4 4.0 ± 1.6 5.9 ± 3.7SD fF L L [min−1 ] 1.3 ± 0.1 10.5 ± 12.6 29.7 ± 5.5 23.4 ± 11.7 16.4 ± 11.3 19.6 ± 9.7 16.8 ± 12.7
av RMS av b p f walking/rest [−] 119.9 ± 36.6 166.2 ± 57.0 66.5 ± 25.3 56.1 ± 10.0 35.6 ± 18.7 48.2 ± 18.6 82.1 ± 55.0SD fF L L [min−1 ] 1.2 ± 0.1 1.4 ± 0.6 4.7 ± 1.9 2.0 ± 1.4 1.7 ± 0.7 2.7 ± 1.1 2.3 ± 1.6
Results in mean ± standard deviation. RMS walking/rest: ratio of the root-mean-square amplitudes during walking and rest; SD fF L L : standard deviation of the frequencytracked by the FLL after the initial 10-s transient.
ing caused ppgbpf [n] in Fig. 5(a) to vary periodically, wheredestructive interference by the artifact caused fading of the sig-nal. The artifact estimate maest [n] in Fig. 5(b) was obtainedvia head motion av [n]. Subtracting maest [n] from ppgbpf [n]gave the stable-amplitude artifact-reduced signal ppgar[n] inFig. 5(c). Fig. 5(d) and (e), respectively, shows that the IBIs andSpO2 derived from the motion-affected signals varied period-ically (diamonds). The IBIs and SpO2 after artifact reduction(squares) did not show this variation any longer and were closerto the ECG-derived IBIs [crosses in Fig. 5(d)] and commercialdevice SpO2 [crosses in Fig. 5(e)], respectively. The exclusionof pulses with too small pulsatility (24) caused the gaps in theIBIs and SpO2 before artifact reduction. After artifact reduction,no pulses were excluded in Fig. 5(d) and (e).
The spectrograms in Fig. 6 further illustrate the effect of walk-ing and artifact reduction. Fig. 6(a) shows that step-rate-relatedfrequency components appear in ppgbpf [n] during walking inaddition to the PR-related frequency components. The compo-nent at half the step rate was due to guiding the sensor wirebehind the left ear, causing pulling of the sensor each time thehead turned right. Fig. 6(b) shows that maest [n] captured all
step-rate related components, with slight leakage of PR-relatedcomponents. Fig. 6(c) shows that subtracting maest [n] fromppgbpf [n] effectively removed the artifacts.
Fig. 7 shows the effect of artifact reduction on pulse de-tection. It shows the percentage pA rd of candidate pulsesin the red PPG signal which was associated with an R-peak before artifact reduction (diamonds), and after artifactreduction using Δx[n] (triangles) and av [n] (squares). Forsubject 1 at 5 and 6 km/h, subject 2 at all speeds, andsubject 6 at 6–8 km/h, artifact reduction increased pA rd becausethe algorithm removed destructive interference by the artifact, somore pulses exceeded pltthr . This effect is illustrated in Fig. 5.For subject 4 at all speeds, artifact reduction decreased pA rdbecause the algorithm partly removed cardiac pulses with a PRclose to the step rate, so less pulses exceeded pltthr . For subject4 at 4–6 km/h, the decrease in pA rd was smaller for Δx[n]than for av [n], because G[n] was less active for Δx[n] than forav [n] [see Fig. 4(e) and (f)]. For subject 1 at 4 km/h, subjects 3and 5 at all speeds, and subject 6 at 4 km/h, artifact reductionaffected pA rd little, because destructive interference was notpronounced, and step rate and PR were distinct. For subject 1 at

WIJSHOFF et al.: REDUCTION OF PERIODIC MOTION ARTIFACTS IN PHOTOPLETHYSMOGRAPHY 203
Fig. 5. Example time traces of the IR PPG signal, IBIs, and SpO2 from subject 6 while walking at 6 km/h. (a) Walking causes periodic variationin ppgbpf [n]. (b) Motion artifact estimate maest [n] obtained via head motion av [n]. (c) Artifact-reduced signal ppgar [n] = ppgbpf [n] − maest [n]. (d)IBIs from ppgbpf [n] vary periodically (diamonds). IBIs from ppgar [n] (squares) are closer to ECG RRIs (crosses). (e) SpO2 from ppgbpf [n] variesperiodically (diamonds). SpO2 from ppgar [n] (squares) is closer to commercial device SpO2 (crosses). Gaps in IBIs and SpO2 for ppgbpf [n] areexcluded pulses with too small pulsatility.
Fig. 6. Example spectrograms of the IR PPG signal from subject 6 while walking at 6 km/h. (a) Measured PPG signal ppgbpf [n] contains artifactsat step-rate-related frequencies during walking. (b) Artifact estimate maest [n] contains all step-rate-related frequency components. (c) Subtractingmaest [n] from ppgbpf [n] effectively removes the motion artifacts in ppgar [n].
7 and 8 km/h and subject 6 at 5 km/h, artifact reduction affectedpA rd little, because the improvement by removal of destructiveinterference balanced the deterioration due to comparable steprate and PR. For subject 6 at 4 and 5 km/h, spurious detectionof dicrotic notches lowered pA rd overall. Results were similarfor the IR PPG signal.
Fig. 8 gives an overview of ΔIBI for PPG signals at rest(R), with motion artifacts (M), and after artifact reduction us-ing Δx[n] and av [n]. The middle line is the median, the boxextends from the 25th to the 75th percentile, and the whiskersfrom the 10th to the 90th percentile. Motion artifacts increasedthe spread in ΔIBI to various degrees. Motion hardly affectedΔIBI for subject 4, because step rate and PR were compara-ble. The percentages with Δx and av in Fig. 8 are the changesin the 10th to the 90th percentile range after artifact reductioncompared to M. The numbers with Δx and av in Fig. 8 arethe 10th to the 90th percentile ranges after artifact reduction di-vided by this range at R. Table II gives the averages. Artifact
reduction reduced the spread in ΔIBI for subjects 1 and 2. Forsubject 1, artifact reduction was less at 7 and 8 km/h compared to4–6 km/h, because step rate and PR partly coincided. For subject2, a less active G[n] for Δx[n] at 4 and 8 km/h affected artifactreduction compared to 5–7 km/h [see Fig. 4(e)]. For subject 3,using Δx[n] reduced ΔIBI by at most 15% at 6 km/h. The poorquality of Δx[n] hampered tracking of the step rate, as shownby dfFLL[n] and G[n] in Fig. 4(c) and (e), respectively. Usingav [n] only improved ΔIBI at 6–8 km/h. The larger step-ratevariation of subject 3 presumably affected the artifact reduction(see Table I). For subject 4 at 4–6 km/h, ΔIBI increased afterartifact reduction, because of coinciding step rate and PR. At 7and 8 km/h, some reduction in ΔIBI was achieved, because steprate and PR coincided less during walking. For subjects 5 and 6,reduction in ΔIBI was achieved at 6–8 km/h for Δx[n], and atall speeds for av [n]. At 4 and 5 km/h, improvement in ΔIBI wasaffected by a poor quality of Δx[n], which hampered trackingof the step rate, as shown by dfFLL[n] and G[n] in Fig. 4(c) and

204 IEEE TRANSACTIONS ON BIOMEDICAL ENGINEERING, VOL. 64, NO. 1, JANUARY 2017
Fig. 7. Percentage of candidate pulses in the red PPG signal which is associated with an R-peak. The percentages were determined in the walkingintervals before artifact reduction (diamonds), and after artifact reduction using relative sensor motion Δx[n] (triangles) and head motion av [n](squares). Results were similar for the IR PPG signal.
Fig. 8. ΔIBIs from IR PPG signals at rest (R), with motion artifacts (M), and after artifact reduction using relative sensor motion (Δx) and headmotion (av ). From top to bottom, walking speed increases from 4 to 8 km/h. The middle line is the median, the box extends from the 25th to the 75th
percentile, and the whiskers from the 10th to the 90th percentile. The percentages with Δx and av are the changes in the whisker range after artifactreduction compared to this range at M. The numbers with Δx and av are the ratios of the whisker ranges after artifact reduction and at R.
TABLE IIEVALUATION OF MOTION ARTIFACT REDUCTION USING RELATIVE SENSOR MOTION Δx AND HEAD MOTION av
Measure Subject 1 Subject 2 Subject 3 Subject 4 Subject 5 Subject 6 Average
Δx Δ IBI 10–90 perc. [%] −40 ± 9 −51 ± 14 2 ± 16 4 ± 21 −14 ± 19 −18 ± 23 −20 ± 26Δ IBI versus rest [−] 2.8 ± 0.4 2.6 ± 0.8 2.5 ± 0.4 1.1 ± 0.2 1.5 ± 0.3 3.5 ± 0.7 2.3 ± 0.9SpO2 10–90 perc. [%] −42 ± 6 −52 ± 16 −1 ± 7 −5 ± 20 −33 ± 32 −16 ± 14 −25 ± 25SpO2 versus rest [−] 1.3 ± 0.2 1.3 ± 0.2 1.6 ± 0.3 1.0 ± 0.2 1.4 ± 0.3 1.7 ± 0.2 1.4 ± 0.3
av Δ IBI 10–90 perc. [%] −40 ± 11 −59 ± 13 −9 ± 28 16 ± 38 −22 ± 11 −42 ± 16 −26 ± 32Δ IBI versus rest [−] 2.8 ± 0.5 2.2 ± 0.6 2.2 ± 0.6 1.2 ± 0.2 1.3 ± 0.2 2.5 ± 0.5 2.0 ± 0.7SpO2 10–90 perc. [%] −43 ± 7 −62 ± 9 −9 ± 12 −8 ± 14 −51 ± 14 −37 ± 16 −35 ± 24SpO2 versus rest [−] 1.2 ± 0.3 1.1 ± 0.2 1.5 ± 0.3 1.0 ± 0.2 1.1 ± 0.3 1.3 ± 0.3 1.2 ± 0.3
Results in mean ± standard deviation. ΔIBI/SpO2 10–90 perc.: reduction in 10th to 90th percentile range of the IBI error/spread in SpO2 achieved by artifact reduction;ΔIBI/SpO2 versus rest: 10th to 90th percentile range of the IBI error/spread in SpO2 after artifact reduction relative to this range at rest; IBI: interbeat interval; SpO2 :oxygen saturation.

WIJSHOFF et al.: REDUCTION OF PERIODIC MOTION ARTIFACTS IN PHOTOPLETHYSMOGRAPHY 205
Fig. 9. SpO2 from the commercial device at rest (C), and from red and IR PPG signals at rest (R), with motion artifacts (M), and after artifactreduction using relative sensor motion (Δx) and head motion (av ). From top to bottom, walking speed increases from 4 to 8 km/h. The middle lineis the median, the box extends from the 25th to the 75th percentile, and the whiskers from the 10th to the 90th percentile. The percentages with Δxand av are the changes in the whisker range after artifact reduction compared to this range at M. The numbers with Δx and av are the ratios of thewhisker ranges after artifact reduction and at R.
(e), respectively. The 10th to 90th percentile range of ΔIBI afterartifact reduction was mostly one to three times this range atrest.
Fig. 9 gives an overview of the spread in SpO2 measured bythe commercial device during rest (C), and derived from thePPG signals at rest (R), with motion artifacts (M), and afterartifact reduction (Δx and av ). The ranges and numbers shownin Fig. 9 are obtained in the same way as in Fig. 8. Table II givesthe averages. For subject 2, the 10th to 90th percentile range ofSpO2 obtained via (26) was about 4–5% at rest, whereas thiswas about 1–2% for the other subjects. This was caused by thelower SNR of the PPG signals of subject 2. Motion increased thespread in SpO2 to various degrees. Artifact reduction decreasedthe spread in SpO2 for subjects 1 and 2. For subject 1, step rateand PR partly coincided at 7 and 8 km/h, but only at 8 km/hartifact reduction was affected. For subject 2, a less active G[n]for Δx[n] at 4 and 8 km/h affected artifact reduction compared to5–7 km/h [see Fig. 4(e)]. For subject 3, spread in SpO2 was onlyslightly reduced at 6 and 7 km/h for Δx[n]. The poor quality ofΔx[n] hampered tracking of the step rate, as shown by dfFLL[n]and G[n] in Fig. 4(c) and (e), respectively. For av [n], a relativelysmall reduction in spread in SpO2 was achieved at 4–7 km/h. Theirregular step rate of subject 3 presumably affected the reductionin spread in SpO2 (see Table I). For subject 4 at 4–6 km/h, thecoinciding step rate and PR hampered artifact reduction forΔx[n] and av [n]. At 7 and 8 km/h, some reduction in spreadin SpO2 was achieved, because step rate and PR coincided lessduring walking. For subjects 5 and 6, reduction in spread inSpO2 was achieved at 6–8 km/h for Δx[n], and at all speedsfor av [n]. At 4 and 5 km/h, reduction of spread in SpO2 wasaffected by a poor quality of Δx[n], which hampered tracking
of the step rate, as shown by dfFLL[n] and G[n] in Fig. 4(c)and (e), respectively. The 10th to 90th percentile range of SpO2after artifact reduction was mostly one to two times the range atrest. The median SpO2 obtained via (26) at rest and after artifactreduction did not differ more than 2.6% from the median SpO2measured by the commercial device at rest.
VI. DISCUSSION
We developed a generic algorithm to remove periodic motionartifacts from PPG signals (see Fig. 2). The algorithm recoveredan artifact-reduced PPG signal for further time-domain beat-to-beat analysis in addition to, e.g., spectral analysis. We describedthe motion artifact using a quadrature basis so only two coef-ficients are needed per frequency component and the artifactestimate contains no undesired frequency-shifted components[30], [31]. These advantages are not offered by approachesdirectly estimating FIR filter coefficients [30], [31]. We ret-rospectively evaluated the algorithm on forehead PPG signalsmeasured while walking on a treadmill [see Fig. 1(a)]. As mo-tion references we compared sensor motion relative to the skin,Δx[n], measured via SMI, and head motion, av [n], measuredwith an accelerometer [see Fig. 1(b)]. We used a SOGI-basedstructure with an FLL to track the step rate in the reference sig-nals (see Fig. 3). We showed that av [n] had a better SNR thanΔx[n], and that the FLL tracked the step rate more consistentlyin av [n] than in Δx[n] (see Fig. 4 and Table I). Therefore, av [n]outperformed Δx[n] as motion reference. The FLL frequencywas used in a quadrature harmonic model to describe the mo-tion artifact (14). An LMS algorithm estimated the amplitudesof the quadrature components. Subtracting the artifact estimate
206 IEEE TRANSACTIONS ON BIOMEDICAL ENGINEERING, VOL. 64, NO. 1, JANUARY 2017
from the measured PPG signal effectively reduced the artifactin the resulting artifact-reduced PPG signal (see Figs. 5 and 6).When the step rate was stable and different than the PR, theproposed algorithm reduced ΔIBI and the spread in SpO2 by30–70% (see Figs. 8 and 9 and Table II). When step rate and PRwere comparable, the algorithm partly removed cardiac pulsestoo. This was detected by thresholding the magnitude of thebaseline-normalized pulses in the artifact-reduced PPG signal,to exclude too small pulses for further analysis (see Fig. 7).
Degradation of the algorithm performance occurred in threeoccasions. Motion artifacts were removed to a lesser extent,when a low-quality motion reference signal hampered trackingof the step rate, or when the step rate varied faster than the al-gorithm could track. Cardiac pulses were partly removed whenstep rate and PR were comparable. However, when the step ratewas stable and distinct from the PR, and the motion referencesignal consistently contained a component at the step rate, theproposed algorithm considerably reduced ΔIBI and the spreadin SpO2 . Therefore, the proposed algorithm can facilitate anal-ysis of IBIs and SpO2 during periodic motion in, e.g., ADL,sports, CPX, or CPR. Coinciding motion frequency and PR can,furthermore, be identified when pulses in the artifact-reducedPPG signal become too small.
The relative sensor motion Δx[n] was not a stable motionreference signal. The FLL did not steadily track the step ratein Δx[n] in 14 out of 30 measurements (see Fig. 4). This mayindicate little relative sensor motion in these cases. Insufficientoptical feedback into the LD may also contribute to a poorsignal quality of Δx[n]. Therefore, we recommend using anaccelerometer as a motion reference for (quasi-)periodic motion.
After successful artifact reduction, the spread in ΔIBI waslarger compared to measurements at rest (see Fig. 8 andTable II). This may result from residual motion artifacts,or from physiological fluctuations in IBIs during walkingcaused by variations in pre-ejection time and pulse transittime [22]. Inaccuracies in the ECG signal during walking mayalso contribute, resulting from electrode-skin motion, and theelectromyogram [58].
The spread in SpO2 after artifact reduction was about oneto two times the spread at rest and was therefore smaller thanthe spread in ΔIBI after artifact reduction, which was aboutone to three times the spread at rest (see Figs. 8 and 9 and Ta-ble II). This is presumably caused by the different nature of theperformance measures. We only considered the spread in SpO2without direct comparison to a reference, and we therefore donot have a measure of the SpO2 accuracy. In contrast, ΔIBI wasa beat-to-beat comparison of IBIs and ECG-derived RRIs. Con-sequently, although the spread in SpO2 after artifact reductionis more comparable to the spread at rest, this does not indicatea better performance for SpO2 than for IBIs.
The proposed solution has some limitations. The algorithmcan only deal with slowly-varying periodic motion artifacts.When the motion frequency and PR coincide, no improvementcan be obtained. In a real-world application, an additional al-gorithm may be required which first assesses presence and pe-riodicity of motion to determine whether the proposed algo-rithm should be initiated. Furthermore, a limited number ofmeasurements have been performed on a limited number of
subjects, resulting in only a preliminary validation of the al-gorithm. Also, the periodic motion artifacts generated on thetreadmill may be more periodic than encountered in ADL. SpO2accuracy has not been assessed. Only the variation in SpO2 hasbeen quantified, assuming a relatively constant SpO2 for healthysubjects.
VII. CONCLUSION
The proposed generic algorithm can effectively remove peri-odic motion artifacts from PPG signals measured while walkingon a treadmill. A SOGI-based structure with an FLL can trackthe step rate in a motion reference signal. An accelerometry-derived motion reference signal outperforms an SMI-derivedmotion reference signal, which measures sensor motion rela-tive to the skin. Periodic motion artifacts can be described bya harmonic model of quadrature components with frequenciesrelated to the tracked step rate. Subtracting the harmonic modelfrom the measured PPG signal effectively removes the motionartifacts. More stable IBI and SpO2 measurements can be de-rived from the resulting artifact-reduced PPG signals if the steprate and PR are distinct. If step rate and PR are comparable, alsocardiac pulses are partly removed, which can be detected bythresholding the magnitude of the baseline-normalized pulsesin the artifact-reduced PPG signal.
ACKNOWLEDGMENT
The authors would like to thank Dr. J. Veen from the HANUniversity of Applied Sciences, Dr. A. van der Lee, Dr. P. Woer-lee, Dr. W. Peeters, and Dr. J. Muhlsteff from Philips Research,and Prof. J. Bergmans from the Eindhoven University of Tech-nology for the valuable discussions, and B. Wassink from VDLETG Research bv for customizing the forehead sensor.
REFERENCES
[1] J. Allen, “Photoplethysmography and its application in clinical physio-logical measurement,” Physiol. Meas., vol. 28, no. 3, pp. R1–39, Mar.2007.
[2] A. Reisner et al., “Utility of the photoplethysmogram in circulatorymonitoring,” Anesthesiology, vol. 108, no. 5, pp. 950–958, May 2008.
[3] R. Sahni, “Noninvasive monitoring by photoplethysmography,” Clin. Peri-natol., vol. 39, no. 3, pp. 573–583, Sep. 2012.
[4] P. S. Addison et al., “Pulse oximetry-derived respiratory rate in generalcare floor patients,” J. Clin. Monit. Comput., vol. 29, no. 1, pp. 113–120,Feb. 2015.
[5] T. Tamura et al., “Wearable photoplethysmographic sensors—Past andpresent,” Electronics, vol. 3, no. 2, pp. 282–302, Apr. 2014.
[6] A. B. Hertzman, “The blood supply of various skin areas as estimatedby the photoelectric plethysmograph,” Am. J. Physiol., vol. 124, no. 2,pp. 328–340, Jul. 1938.
[7] Y. Mendelson, “Pulse oximetry: Theory and applications for noninvasivemonitoring,” Clin. Chem., vol. 38, no. 9, pp. 1601–1607, Sep. 1992.
[8] K. Nakajima et al., “Monitoring of heart and respiratory rates by pho-toplethysmography using a digital filtering technique,” Med. Eng. Phys.,vol. 18, no. 5, pp. 365–372, Jul. 1996.
[9] T. L. Rusch et al., “Signal processing methods for pulse oximetry,”Comput. Biol. Med., vol. 26, no. 2, pp. 143–159, Mar. 1996.
[10] J. A. Pologe, “Pulse oximetry: Technical aspects of machine design,” Int.Anesthesiol. Clin., vol. 25, no. 3, pp. 137–153, Feb. 1987.
[11] J. G. Webster, Ed., Design of Pulse Oximeters (Medical Science Series).New York, NY, USA: Taylor & Francis, 1997.
[12] T. Aoyagi, “Pulse oximetry: Its invention, theory, and future,” J. Anesth.,vol. 17, no. 4, pp. 259–66, Jan. 2003.

WIJSHOFF et al.: REDUCTION OF PERIODIC MOTION ARTIFACTS IN PHOTOPLETHYSMOGRAPHY 207
[13] P. D. Mannheimer, “The light-tissue interaction of pulse oximetry,” Anesth.Analg., vol. 105, no. 6 Suppl, pp. S10–S17, Dec. 2007.
[14] M. Nitzan et al., “Pulse oximetry: Fundamentals and technology update,”Med. Devices., vol. 7, pp. 231–239, Jul. 2014.
[15] H. H. Asada et al., “Mobile monitoring with wearable photoplethysmo-graphic biosensors,” IEEE Trans. Biomed. Eng., vol. 22, no. 3, pp. 28–40,Jul. 2003.
[16] G. J. Balady et al., “Clinician’s Guide to cardiopulmonary exercise testingin adults: A scientific statement from the American Heart Association,”Circulation, vol. 122, no. 2, pp. 191–225, Jul. 2010.
[17] D. E. Forman et al., “Cardiopulmonary exercise testing: Relevant butunderused,” Postgrad. Med., vol. 122, no. 6, pp. 68–86, Nov. 2010.
[18] R. W. C. G. R. Wijshoff et al., “Detection of a spontaneous pulse inphotoplethysmograms during automated cardiopulmonary resuscitationin a porcine model,” Resuscitation, vol. 84, no. 11, pp. 1625–1632, Nov.2013.
[19] R. W. C. G. R. Wijshoff et al., “Photoplethysmography-based algorithmfor detection of cardiogenic output during cardiopulmonary resuscitation,”IEEE Trans. Biomed. Eng., vol. 62, no. 3, pp. 909–921, Mar. 2015.
[20] J. Van Andel et al., “Using photoplethysmography in heart rate monitoringof patients with epilepsy,” Epilepsy Behav., vol. 45, no. 4, pp. 142–145,Apr. 2015.
[21] W. J. C. Van Elmpt et al., “A model of heart rate changes to detect seizuresin severe epilepsy,” Seizure, vol. 15, no. 6, pp. 366–375, Jun. 2006.
[22] A. Schafer and J. Vagedes, “How accurate is pulse rate variability as anestimate of heart rate variability? A review on studies comparing photo-plethysmographic technology with an electrocardiogram,” Int. J. Cardiol.vol. 166, no. 1, pp. 15–29, Jun. 2013.
[23] L. Ferranti and R. Laureanti, “Atrial fibrillation detection in PPG signalrecorded through a wristband device,” M.S. thesis, Dept. Electron., Inf.Bioeng., Politecnico di Milano, Milan, Italy, Dec. 2015.
[24] G. Comtois et al., “A comparative evaluation of adaptive noise cancel-lation algorithms for minimizing motion artifacts in a forehead-mountedwearable pulse oximeter,” in Proc. Conf. IEEE Eng. Med. Biol. Soc., Aug.2007, pp. 1528–1531.
[25] P. T. Gibbs and H. H. Asada, “Reducing motion artifact in wearable bio-sensors using MEMS accelerometers for active noise cancellation,” inProc. Amer. Control Conf., Jun. 2005, vol. 3, pp. 1581–1586.
[26] L. B. Wood and H. H. Asada, “Low variance adaptive filter for cancellingmotion artifact in wearable photoplethysmogram sensor signals,” in Proc.Conf. IEEE Eng. Med. Biol. Soc., Aug. 2007, pp. 652–655.
[27] B. Lee et al., “Improved elimination of motion artifacts from a pho-toplethysmographic signal using a Kalman smoother with simultaneousaccelerometry,” Physiol. Meas., vol. 31, no. 12, pp. 1585–1603, Dec. 2010.
[28] M.-Z. Poh et al., “Motion-tolerant magnetic earring sensor and wirelessearpiece for wearable photoplethysmography,” IEEE Trans. Inf. Technol.Biomed., vol. 14, no. 3, pp. 786–794, Feb. 2010.
[29] H. Han and J. Kim, “Artifacts in wearable photoplethysmographs duringdaily life motions and their reduction with least mean square based activenoise cancellation method,” Comput. Biol. Med., vol. 42, no. 4, pp. 387–93,Apr. 2012.
[30] B. Widrow et al., “Adaptive noise cancelling: Principles and applications,”Proc. IEEE, vol. 63, no. 12, pp. 105–12, Dec. 1975.
[31] J. R. Glover, “Adaptive noise cancelling applied to sinusoidal interfer-ences,” IEEE Trans. Acoust., Speech, Signal Process., vol. ASSP-25,no. 6, pp. 484–91, Dec. 1977.
[32] M. J. Hayes and P. R. Smith, “Artifact reduction in photoplethysmogra-phy,” Appl. Opt., vol. 37, no. 31, pp. 7437–7446, Nov. 1998.
[33] M. J. Hayes and P. R. Smith, “A new method for pulse oximetry possessinginherent insensitivity to artifact,” IEEE Trans. Biomed. Eng., vol. 48,no. 4, pp. 452–461, Apr. 2001.
[34] J. A. C. Patterson and G.-Z. Yang, “Ratiometric artifact reduction in lowpower reflective photoplethysmography,” IEEE Trans. Biomed. CircuitsSyst., vol. 5, no. 4, pp. 330–338, Jul. 2011.
[35] F. M. Coetzee and Z. Elghazzawi, “Noise-resistant pulse oximetry usinga synthetic reference signal,” IEEE Trans. Biomed. Eng., vol. 47, no. 8,pp. 1018–1026, Aug. 2000.
[36] M. R. Ram et al., “A novel approach for motion artifact reduction in PPGsignals based on AS-LMS adaptive filter,” IEEE Trans. Instrum. Meas.,vol. 61, no. 5, pp. 1445–1457, May 2012.
[37] R. Yousefi et al., “A motion-tolerant adaptive algorithm for wearablephotoplethysmographic biosensors,” IEEE J. Biomed. Health Informat.,vol. 18, no. 2, pp. 670–681, Mar. 2014.
[38] B. S. Kim and S. K. Yoo, “Motion artifact reduction in photoplethysmog-raphy using independent component analysis,” IEEE Trans. Biomed. Eng.,vol. 53, no. 3, pp. 566–568, Mar. 2006.
[39] R. Krishnan et al., “Two-stage approach for detection and reduction ofmotion artifacts in photoplethysmographic data,” IEEE Trans. Biomed.Eng., vol. 57, no. 8, pp. 1867–1876, Aug. 2010.
[40] H.-W. Lee et al., “The periodic moving average filter for removing motionartifacts from PPG signals,” Int. J. Control Autom., vol. 5, no. 6, pp. 701–706, Dec. 2007.
[41] H. Fukushima et al., “Estimating heart rate using wrist-type photoplethys-mography and acceleration sensor while running,” in Proc. Conf. IEEEEng. Med. Biol. Soc., Aug. 2012, pp. 2901–2904.
[42] Z. Zhang et al., “TROIKA: A general framework for heart rate monitoringusing wrist-type photoplethysmographic signals during intensive physicalexercise,” IEEE Trans. Biomed. Eng., vol. 62, no. 2, pp. 522–531, Feb.2015.
[43] Z. Zhang, “Photoplethysmography-based heart rate monitoring in physicalactivities via joint sparse spectrum reconstruction,” IEEE Trans. Biomed.Eng., vol. 62, no. 8, pp. 1902–1910, Aug. 2015.
[44] S. M. A. Salehizadeh et al., “A novel time-varying spectral filteringalgorithm for reconstruction of motion artifact corrupted heart rate signalsduring intense physical activities using a wearable photoplethysmogramsensor,” Sensors, vol. 16, no. 10, pp. 1–20, Dec. 2015.
[45] L. Wang et al., “Multichannel reflective PPG earpiece sensor with passivemotion cancellation,” IEEE Trans. Biomed. Circuits Syst., vol. 1, no. 4,pp. 235–241, Dec. 2007.
[46] J. M. Goldman et al., “Masimo signal extraction pulse oximetry,” J. Clin.Monit. Comput., vol. 16, no. 7, pp. 475–483, Jan. 2000.
[47] Y.-S. Yan and Y.-T. Zhang, “An efficient motion-resistant method forwearable pulse oximeter,” IEEE Trans. Inf. Technol. Biomed., vol. 12,no. 3, pp. 399–405, May 2008.
[48] Y.-S. Yan et al., “Reduction of motion artifact in pulse oximetryby smoothed pseudo Wigner-Ville distribution,” J. Neuroeng. Rehabil.,vol. 2, no. 1, p. 3, Mar. 2005.
[49] P. Rodrıguez et al., “Multiresonant frequency-locked loop for grid syn-chronization of power converters under distorted grid conditions,” IEEETrans. Ind. Electron., vol. 58, no. 1, pp. 127–138, Jan. 2011.
[50] R. W. C. G. R. Wijshoff et al., “PPG motion artifact handling using aself-mixing interferometric sensor,” Proc. SPIE, vol. 7894, p. 78940F-1–78940F-13, Jan. 2011.
[51] R. W. C. G. R. Wijshoff et al., “Reducing motion artifacts in photoplethys-mograms by using relative sensor motion: Phantom study,” J. Biomed.Opt., vol. 17, no. 11, pp. 117007-1–117007-15, Nov. 2012.
[52] R. W. C. G. R. Wijshoff et al., “Improving pulse oximetry accuracyby removing motion artifacts from photoplethysmograms using relativesensor motion: A preliminary study,” Adv. Exp. Med. Biol., vol. 789,pp. 411–417, 2013.
[53] Y. Mendelson and B. D. Ochs, “Noninvasive pulse oximetry utilizing skinreflectance photoplethysmography,” IEEE Trans. Biomed. Eng., vol. 35,no. 10, pp. 798–805, Oct. 1988.
[54] R. G. Haahr et al., “An electronic patch for wearable health monitor-ing by reflectance pulse oximetry,” IEEE Trans. Biomed. Circuits Syst.,vol. 6, no. 1, pp. 45–53, Feb. 2012.
[55] M. Ciobotaru et al., “A new single-phase PLL structure based on secondorder generalized integrator,” Proc. 37th IEEE Power Electron. Spec.Conf., Jun. 2006, pp. 1–6.
[56] K. Mozdzynski et al., “Application of the second order generalized in-tegrator in digital control systems,” Arch. Electr. Eng., vol. 63, no. 3,pp. 423–437, Sep. 2014.
[57] Y. Xiao and Y. Tadokoro, “LMS-based notch filter for the estimation ofsinusoidal signals in noise,” Signal Process., vol. 46, no. 2, pp. 223–231,Oct. 1995.
[58] J. G. Webster, “Reducing motion artifacts and interference in biopotentialrecording,” IEEE Trans. Biomed. Eng., vol. BE-31, no. 12, pp. 823–26,Dec. 1984.
Authors’ photographs and biographies not available at the time ofpublication.