1983 iep diagnostic-feasibility study of dudley pond
DESCRIPTION
Major 1983 Dudley Pond study by IEP consunting leading to nutrient runoff improvements and recommendations for community septic.TRANSCRIPT

534 Boston Post Road.
P.O. Box 438
1-
11Wayland. Mass. 01778
617·358·5156
617·899·7066II:
DIAGNOSTIC/FEASIBILITY STUDY
DUDLEY POND WAYLAND, MASSACHUSETTS
Apri 1 1983
For:
Town of Wayland Surface Water Quality Study Committee
iiCi' TABLE OF CONTENTS
Section Title
EXECUTIVE SUMMARY
1.0 INTRODUCTION
2.0 PHYSICAL CHARACTERISTICS OF THE POND AND ITS WATERSHED
2.1 Climate 2.2 Geology and Soils
4
-i i x
44
2.3 Surface and Groundwater Hydrology 9 2.4 Land Use/Demography 13 2.5 Morphometry, Bathymetry and Bottom Sediments 14
3.0 WATER QUALITY AND AQUATIC ECOLOGY 23
3.1 In-Lake and Tributary 23 3.2 Groundwater Qual ity 31 3.3 San ita ry Survey 35 3.4 Stonnwa ter 43 3.5 Aquatic Vegetation and Plankton 48
4.0 HYDROLOGIC BUDGET 53
5.0 NUTRIENT BUDGET AND TROPHIC STATE 55
5.1 External Phosphorus Loadings (Stonnwater, Back- 55 ground Groundwater, Septic and Direct Atmospheric)
5.2 External Nitrogen Loading 60 5.3 Internal Phosphorus Cycling 60 5.4 Permissible Phosphorus Loadings and Trophic State 62
6.0 EVALUATION OF WATERSHED MANAGEMENT STRATEGIES 65
6.1 Land Use Regulation 65 6.2 Sewage Treatment/Disposal 69 6.3 Stormwater Runoff 76
7.0 EVALUATION OF IN-LAKE MANAGEMENT/RESTORATION 84 ALTERNATIVES
7. 1 Herbicide/Algicide Treatment 84 7.2 Mechanical Harvesting 86 7.3 Hydro-Raking 88 7.4 Dredging 89 7.5 Nutrient Precipitation/Inactivation 92 7.6 Aeration/L ive Bacteria, Hypol imnetic Withdrawal, 94
Biological Controls/Substitution and Drawdown
8.0 CONCLUSIONS AND RECOMMENDATIONS 97
8.1 Program Summary and Costs 97 8.2 Project Schedule and Monitoring Program 100
REFERENCES CITED APPENDICES

LIST OF TABLES iiEi' Table Title
Soils in the Dudley Pond Watershed and Their HYdrologic Classes 7
2 11Summary of Groundwater Elevations
3 Dudl ey POlld ~'orphometric Da ta 15
4 Computation of Muck Sediment Volume 20
,.... 5 Results of Sediment Analysis 21
6 Results of Water Quality Analysis 26
7 Chemical Data - Dudley Pond (July 10, 1978) 29
8 Summary of Total Col iform Monitoring at Dudley 29 Pond (June &July 1978)
9 Results of Groundwater Quality Analyses - Dudley Pond 32
10 Results of Grab Sample Analyses - Shoreline Water 39 Qua 1ity Survey
11 MDWPC Lake Classification System Excerpts 40
12 Phosphorus, Nitrogen and Fecal Coliform Loading From Stormwater, October 1 & 2, 1981 45
13 Phosphorus, Nitrogen and Fecal Coliform Loading From Stormwa ter, July 20, 1982 46
14 Results of Plankton Analyses - Dudley Pond Column 51 Samples, Spring &Sumner, 1981
15 Dudley Pond Annual Phosphorus Budget and Trophic 56 State Boundaries
16 Annual Stormwater Nutrient Loadings from Specified 57 Storm Drains - Dudley Pond
17 Dudley Pond - Household Survey Summary 59
18 Dudley Pond Annual Nitrogen Budget 60
19 Relative Costs and Cost/Effectiveness of Various 70 Alternatives for Mitigation of Loadings from Subsurface Sewage Disposal Systems
20 72Environmental Impact Assessment of Watershed Management Alternatives
iiCi' LIST OF TABLES (cont)
Table Title Page
21 Summary of Stormwater Management Recommendations 77
22 Recommended Management Program Costs 98
23 Suggested Project Implementation Schedule 101
24 Preliminary Monitoring Program and Schedule 103
Figure
1
2
3
4
5
6
7
8
9
10
11
12 -13
14
15
16
17
18 .-
LIST OF FIGURES
Title Page
Dudley Pond Watershed and Locus Map 2
Surficial Geology (map pocket)
Hydrologic Soil Groups 8
Groundwater Sampling Stations (map pocket)
Profile of the Fine Sand, Silt and Clay 12 Sediments Which Occur South of Dudley Pond
Drainage Areas, Stormwater Sample Stations (map pocket) and La nd Use
Bathymetry (Feet) Dudley Pond 17
Thickness (Feet) of Muck Sediments Dudley Pond 18
Water QualitY/Sediment Sampling Stations 24
Temperature/Dissolved Oxygen Profiles at Station 1 25
Septic Leachate Detector System 36
Shoreline Survey Water Quality Results and Plume (map pocket)Locations
Distribution of Aquatic Vegetation 49a
Dudley Pond Trophic Status (Present) 63
Sewage Disposal Recommendations - Preliminary (map pocket)Design
Stormwater Management Recommendations (map pocket)Prel iminary Design
Proposed Area of Sediment Removal and Current 91 Major Town-Owned Land Parcels
Dudley Pond Trophic Status With Effectuation 99 of Watershed Management Controls

EXECUTIVE SUMMARY

DUDLEY POND DIAGNOSTIC/FEASIBILITY STUDYEXECUTIVE SUMMARY
In April of 1981 IEP, Inc. of Wayland, was contracted by the Town of Wayland under the direction of the Surface Water Quality Committee, to undertake a Diagnostic/ Feasibility study of Dudley Pond. The $23,524 project received USEPA funding (70%) under its 314, Lakes Restoration Program. Since the early 20th century, when the Pond was abandoned as a back-up water supply source for the City of Boston, development around the Pond and remaining watershed has caused a decline in Pond water quality. The decline in water quality has resulted in rooted plant and algae growth, often in nuisance proportions. In response to these problems, the study objectives included: (1) identifying, or diagnosing the causes of pollutant and nutrient input to the Pond, (2) evaluating practical, feasible watershed and in-lake management strategies for reducing pollutant and nutrient input, and (3) recommending the most cost effective strategy or combination of strategies for accomplishing the desired reduction in nutrients and pollutants.
In order to accomplish the first objective, IEP conducted surface water quality sampling at 14 points around the Pond's periphery and in its interior. Sampling was conducted during seasonal base (low) flow, high flow and storm runoff conditions as well as through ice in the winter. Inflowing groundwater was also sampled at 15 locations via 1 1/4" observation wells. A septic leachate detector survey was conducted which identified incoming leachate plumes attributable to septic system runoff or other surface and groundwater inflows. IEP utilized these data along with information on land use, soils, geology and hydrology to develop hydrologic and nutrient budgets for the watershed and Pond.
A synopsis of the annual phosphorus budget sources and associated loadings is presented below in Table 15 from the text:
Table 15. Dudley Pond Annual Phosphorus Budget
Phosphorus Budget
Source Annual Loading (Kg/yr) %Total
Stormwater runoff 83.3 57.5
Precipitation (on pond)
Septic Systems
Regional Groundwater Total
9.9
46.6
5.1 144.9
6.8
32.2
3.5 --
100.0
i
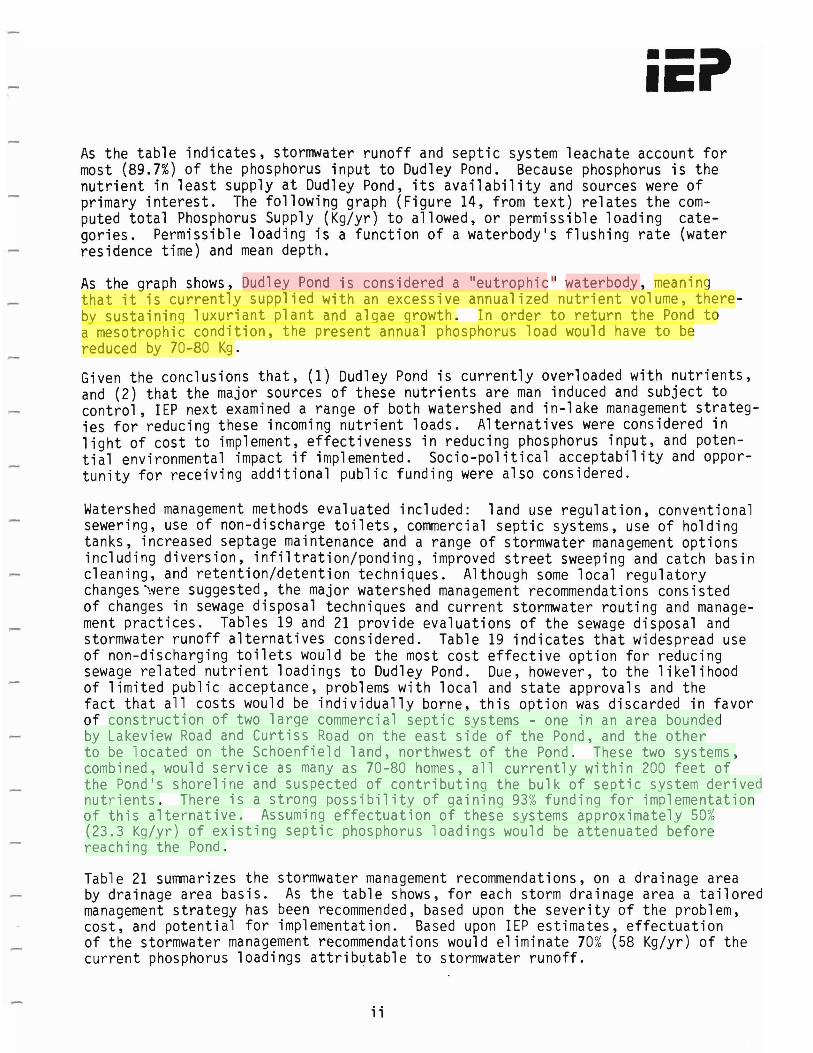
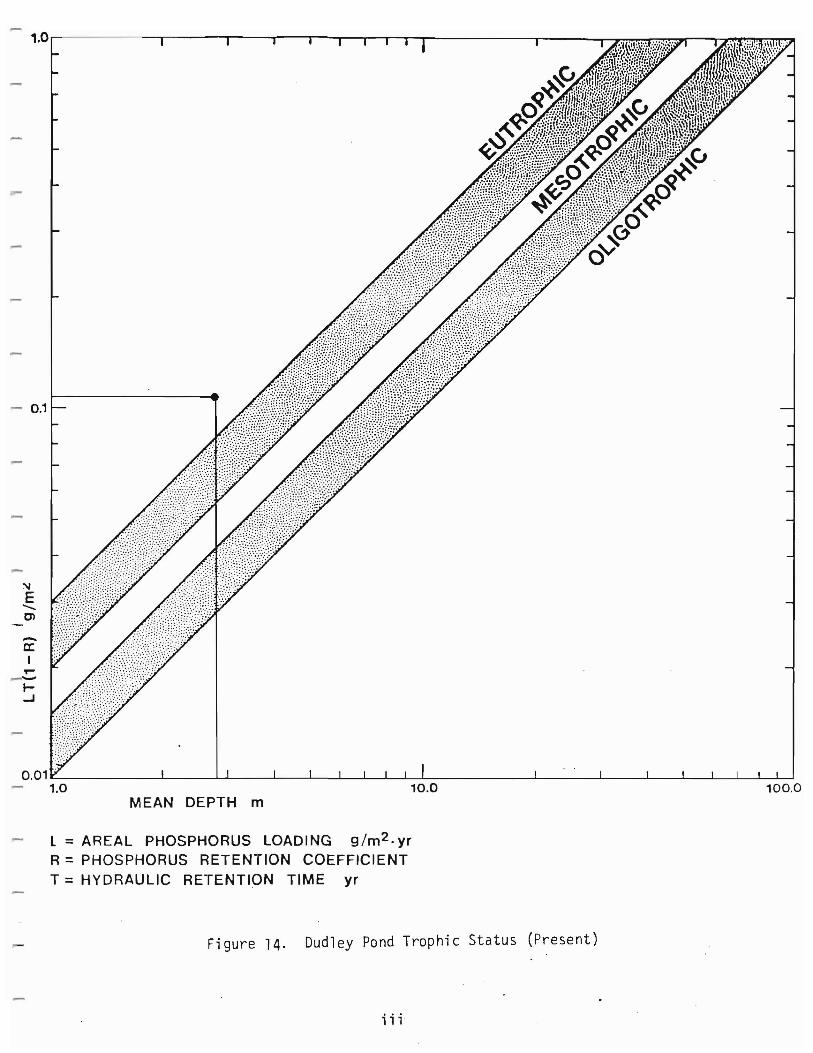
As the table indicates, stormwater runoff and septic system leachate account for most (89.7%) of the phosphorus input to Dudley Pond. Because phosphorus is the nutrient in least supply at DUdley Pond, its availability and sources were of primary interest. The following graph (Figure 14, from text) relates the computed total Phosphorus Supply (Kg/yr) to allowed, or permissible loading categories. Permissible loading is a function of a waterbody's flushing rate (water residence time) and mean depth.
As the graph shows, Dudley Pond is considered a lIeu trophic ll waterbody, meaning that it is currently supplied with an excessive annualized nutrient volume, thereby sustaining luxuriant plant and algae growth. In order to return the Pond to a mesotrophic condition, the present annual phosphorus load would have to be reduced by 70-80 Kg.
Given the conclusions that, (1) Dudley Pond is currently overloaded with nutrients, and (2) that the major sources of these nutrients are man induced and subject to control, IEP next examined a range of both watershed and in-lake management strategies for reducing these incoming nutrient loads. Alternatives were considered in light of cost to implement, effectiveness in reducing phosphorus input, and potential environmental impact if implemented. Socio-political acceptability and opportunity for receiving additional public funding were also considered.
Watershed management methods evaluated included: land use regulation, conventional sewering, use of non-discharge toilets, commercial septic systems, use of holding tanks, increased septage maintenance and a range of stormwater management options including diversion, infiltration/ponding, improved street sweeping and catch basin cleaning, and retention/detention techniques. Although some local regulatory changes\~ere suggested, the major watershed management recommendations consisted of changes in sewage disposal techniques and current stormwater routing and management practices. Tables 19 and 21 provide evaluations of the sewage disposal and stormwater runoff alternatives considered. Table 19 indicates that widespread use of non-discharging toilets would be the most cost effective option for reducing sewage related nutrient loadings to Dudley Pond. Due, however, to the likelihood of limited public acceptance, problems with local and state approvals and the fact that all costs would be individually borne, this option was discarded in favor of construction of two large commercial septic systems - one in an area bounded by Lakeview Road and Curtiss Road on the east side of the Pond, and the other to be located on the Schoenfield land, northwest of the Pond. These two systems, combined, would service as many as 70-80 homes, all currently within 200 feet of the Pond's shoreline and suspected of contributing the bulk of septic system derived nutrients. There is a strong possibility of gaining 93% funding for implementation of this alternative. Assuming effectuation of these systems approximately 50% (23.3 Kg/yr) of existing septic phosphorus loadings would be attenuated before reaching the Pond.
Table 21 summarizes the stormwater management recommendations, on a drainage area by drainage area basis. As the table shows, for each storm drainage area a tailored management strategy has been recommended, based upon the severity of the problem, cost, and potential for implementation. Based upon IEP estimates, effectuation of the stormwater management recommendations would eliminate 70% (58 Kg/yr) of the current phosphorus loadings attribytable to stormwater runoff.
i i
- 0.1
-c:
--I-I or
..J
0.01 L--- --'--__....L-I__----'-_----'-_...&...---'-----'-----L----L -'--__----'-__--'--_--'--_'-----'--'--'---'
1.0 100.0 MEAN DEPTH m
l = AREAL PHOSPHORUS LOADING 91m 2 . yr R =PHOSPHORUS RETENTION COEFFICIENT T = HYDRAULIC RETENTION TIME yr
Figure 14. Dudley Pond Trophic Status (Present)
; ; i
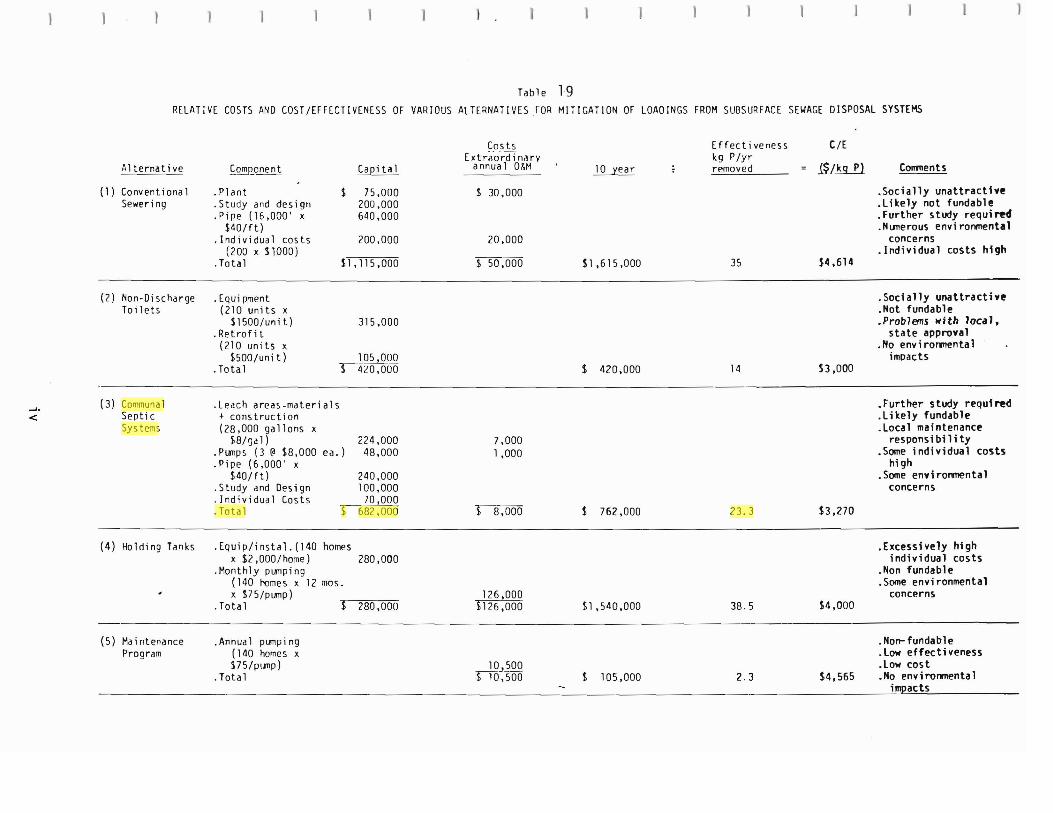
Table 19 RELATIVE COSTS AND COST/EFFECTIVENESS OF VARIOUS ALTERNATIVES ,rOR MITIGATION OF LOADINGS FROM SUOSURFACE SEWAGE DISPOSAL SYSTEMS
Alternative ~Q.I!lR.onent Capital
Costs Extr~-o-rdi'narv
annua 1 O&M 10 year
Effectiveness kg P/yr removed =
t/E
($/kg P) tOlTl11ents
(1) Conventional Seweri ng
· PI ant .Study and design .Pipe (1&.000' x
$40/ft) .Individual costs
(200 x $1000) .Total
$ 75,000 200.000 640,000
200.000
Sl ,115,000
$ 30,000
20.000
$50,000 $1,615,000 35 S4,614
.Socially unattractfve
.Likely not fundable
.Further study reQui~d
.Numerous environmental concerns
.Individual costs hfgh
(2) Non-Discharge Toi lets
· Equi pment (210 units x
S1500/unit) .Retrofit
(210 units x $500/unit)
· Tota 1
315,000
105,000 $4Z0,060 $ 420,000 14 $3,000
.Socially unattractive
.Not fundable
.Problems with local, sta te approval
.No environmental impacts
...... <
(3) Communal Septic Sys tems
.Leach areas-materials + construction (28,000 gallons x
$8/l)a 1) 224,000 .Pumps (3 @ $8.000 ea.) 48,000 .Pipe (6,000' x
$40/ft) 240,000 .Study and Design 100,000 .Individual Costs 70,000 .Total $ 682,000
7,000 1,000
$ 8,000 $ 762,000 23.3 $3,270
.Further study reQuf~d
.Likely fundable
.Local maintenance responsibility
.Some individual costs high
.Some environmental concerns
(4) Holding Tanks .Equip/instal. (140 homes x $2,OOO/home) 280,000
.Monthly pumping (140 homes x 12 mos. x $75/pump)
.Total $ 280,000 126,000
$126,000 $1,540,000 38.5 $4,000
.Excessively high individual costs
.Non fundable
.Some environmental concerns
(5) Maintenance Program
· Annua 1 pumpi ng (140 homes x S75/pllTlp)
.Total 10J500
$T6:S00 $ 105,000 2.3 $4,565
.Non-fundable
.Low effectiveness
.low cost
.No environmental impacts

Table 2l. Summary of Stormwater Management Recommendations
Area Methods
0 Diversion Infiltration/Ponding
1 Improved Street Sweeping/Catch Basin Cleaning
2 Improved Street Sweeping/Catch Basin Cleaning
3 Improved Street Sweeping/Catch Basin Cleaning
4 Diversion 5 Infiltration/Ponding
Infiltration/Ponding Retention/Detention
6 Infiltration/Ponding/ Paving/Drainage Improvements
7 Infiltration/Ponding
8 Diversion
9 Improved Street Sweeping/Catch Basin Cleaning
10 Improved Street Sweeping/Catch Basin Cleaning
11) 12 ) . Infiltration/Ponding
)
*Watershed-wide (purchase O&M town crews
Total
Costs (10 yr)
$50,000 13,000
*
*
* 25,500 37,000 31 ,000 3,000
39,000 15,000 40,000
*
*
$37,000
170,000
$460,500
Cost Kg P/yr Removed Effectiveness
7.71 $ 649 0.9 1,444
* *
* *
* * 7.5 340 1.53 2,418 1.8 1,722 0.25 1,200
4.9 796
1. 31 1,145
19.92 201
* *
* *
4.37 847
8.33 2,041
58.52 $ 787 (avg.
v
In addition to watershed management strategies, in-lake techniques were also examined. These included: herbicide/algicide treatment, mechanical harvesting, hydroraking, dredging t nutrient precipitation/inactivation, aeration with bacterial introduction, hypolimnetic withdrawal, biological substitution, and drawdown. Of the many in-lake management strategies examined only harvesting, nutrient precipitation/ inactivation, and limited dredging were recommended.
Figure 18 summarizes the anticipated effects upon trophic state which would result from implementation of IEP recommendations. As the figure shows, planned effectuation would bring Dudley Pond out of its current eutrophic condition into the mesotrophic range. A substantial reduction in algae density and decrease in aquatic vegetation can be expected to accompany the Pond's projected change in trophic state, following implementation. Table 22 outlines estimated program costs, potential funding source(s) and estimated fundable amount, while Table 23 outlines the proposed project schedule.
vi

_ 1.0r--------,.---.,.....-----.-.......,....-r--r-.......,...........,.........,....-----"""T"'"-----.---..:==~_ __._~~~~
0.1
IMPLEMENTATION OF STORMWATER MANAGEMENT ALTERNATIVES
~--~.;.;::,;.:.;~~:....-..,.~~~~IMPLEMENTATIONOF SEPTIC SYSTEM AND STORMWATER MANAGEMENT ALTERNATIVES
-C'l
LL__L-_L----l...._L-.l_..l._.l_ ...l...___---l.__...l__...L_____I._..l_...l_....L.....__I
1.0 10.0 100.0 MEAN DEPTH !':'. - - .." -- - -- -.
L = AREAL PHOSPHORUS LOAD1NG 91m2 . yr
R = PHOSPHORUS RETENTION COEFFICIENT T = HYDRAULIC RETENTION TIME yr
U.01~ 1___
FIGURE.18 DUDLEY POND TROPHIC STATUS WITH' EFFECTUATION
OF WATERSHED MANAGEMENT CONTROLS
v;;
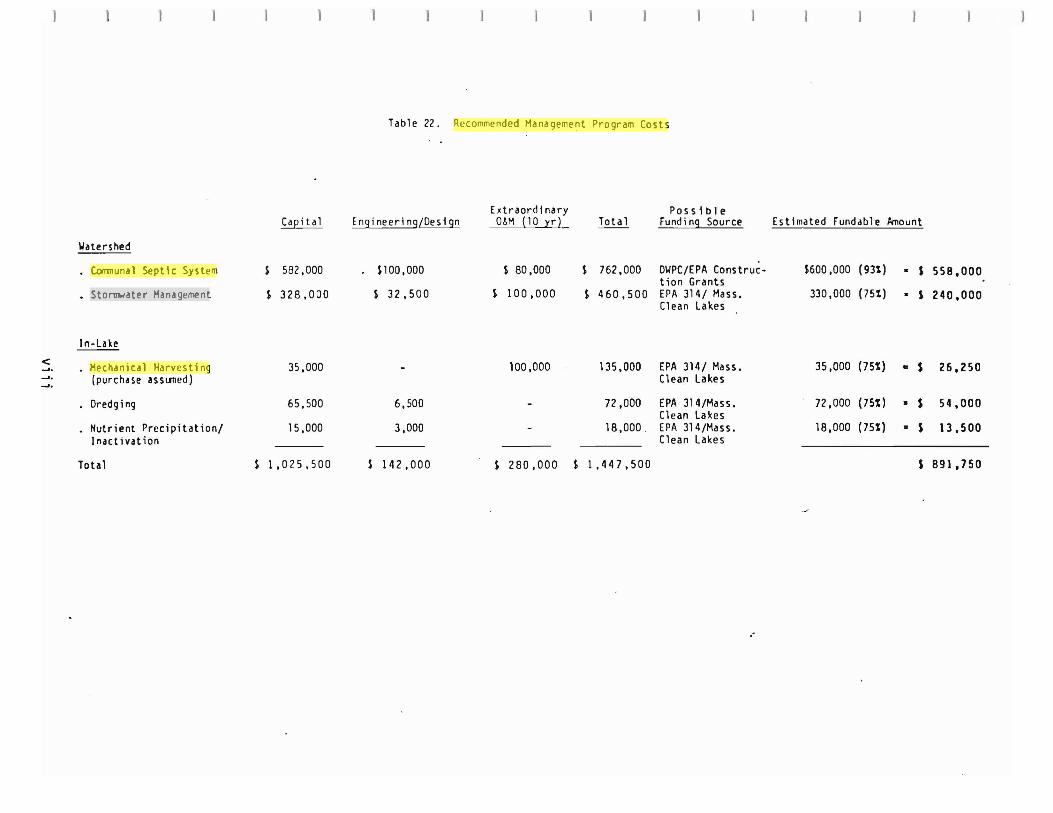
Table 22. Recommended Management Program Costs
Extraordinary Possible Capital Engineering/Design OloM (10 yr) Total Fundi n9 Source Estimated Fundable Amount
Watershed
,.Communal Septic System $ 582,000 $100,000 $ 80,000 $ 762,000 OWPC/EPA Construe- $600,000 (931) S 558,000tion Grants
Stormwater Management $ 328,000 $ 32,500 $ 100,000 $ 460,500 EPA 314/ Mass. 330,000 (75%) • $ 240,000 Clean Lakes
In-Lake
< • Mechanical Harvesting 35,000 - 100,000 135,000 EPA 314/ Mass. 35,000 (751:) ,. S 26,250~.
~,
~. (purchase assumed) Clean Lakes
Oredg i ng 65,500 6,500 - 72 ,DOD EPA 314/Mass. 72 ,000 (751:) = s 54,000 Clean Lakes
Nutrient Precipitation/ 15,000 3,000 - 18,000. EPA 314/Mass. 18,000 (751) ,. S 13,500 Inactivation Clean Lakes
Total $ 1,025,500 $ 142,000 $ 280,000 $ 1,447,500 S 891,750
,"
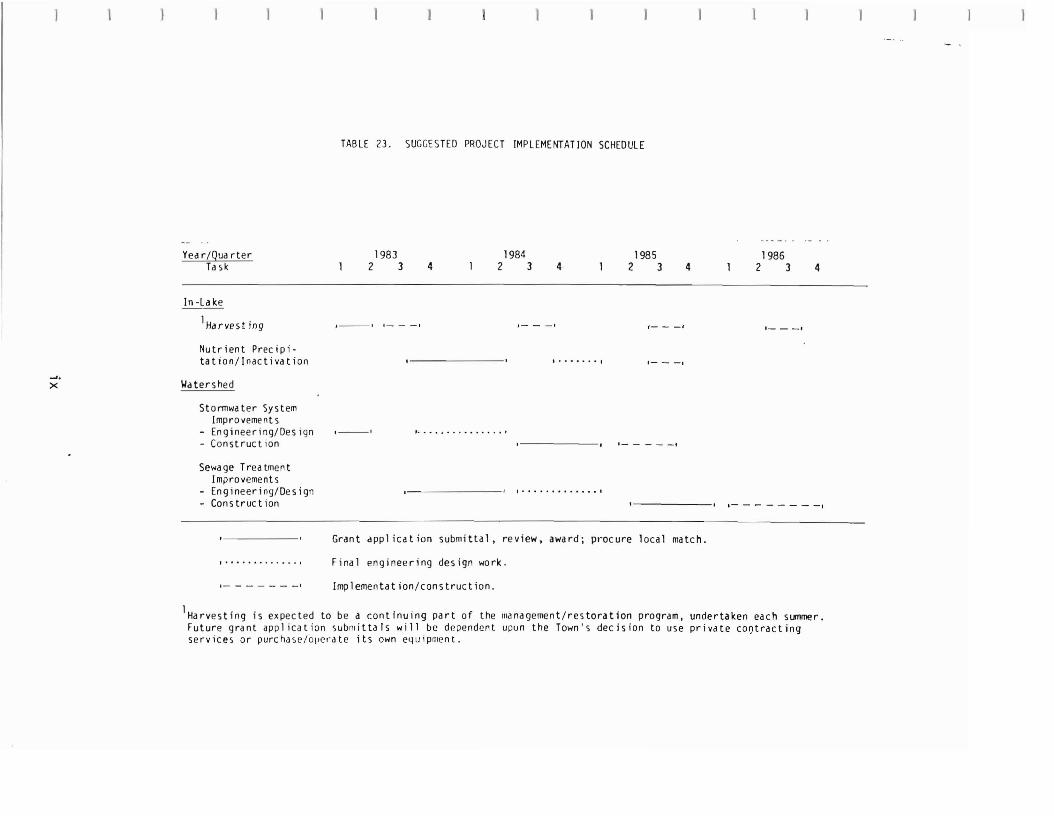
TABLE 23. SUGGESTED PROJECT IMPLEMENTATION SCHEDULE
Year/Qua rter 1983 1984 1985 1986 Ta sk 2 3 4 2 3 4 2 3 4 2 3 4
In -La ke
1Hdrves t jog • 1 1 I , __ I , __ I 1 1
Nutrient Precipitation/Inactivation t. eo ••• 0' 1- -I
-I.
X Wa ters hed
Stormwa ter System Improvements
- Engineering/Design - Construct ion
.---. , ••••••••••• 0 ••• ,
1 ,
Sewage Treatment Improvements
- Engineering/Design - Construct ion
I , .
1- - - - - --I
Grant appl ication submittal, review, award; pt'ocure local match.
. , , Final engineering design work .
1 - - - - __ I Implementation/construction.
lHarvesting is expected to be a continuing part of the lfIanagement/restoration program, undertaken each summer. Future grant appl ication sublflitta Is will be dependent upun the Town's decision to use private cootracting services or purchase/oper"He its own equiplflent.
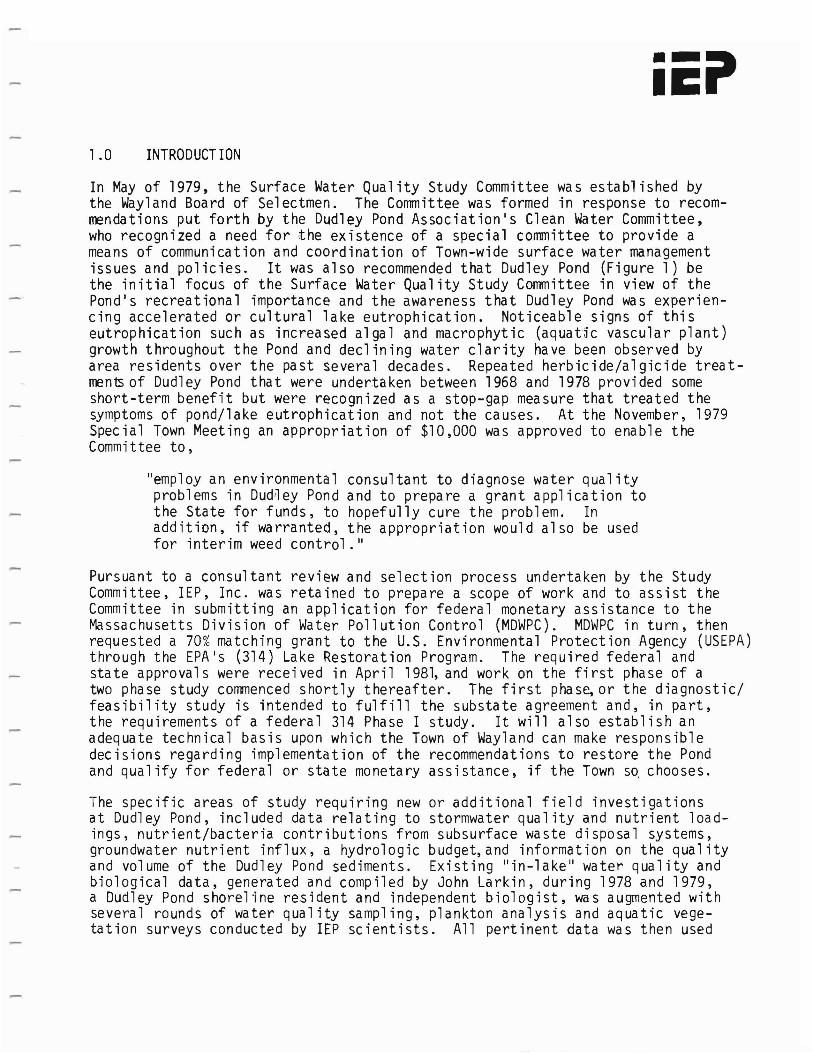
1.0 INTRODUCTION
In May of 1979, the Surface Water Quality Study Committee was established by the Wayland Board of Selectmen. The Committee was formed in response to recommendations put forth by the Dudley Pond Association's Clean Water Committee, who recognized a need for the existence of a special committee to provide a means of communication and coordination of Town-wide surface water management issues and policies. It was also recommended that Dudley Pond (Figure 1) be the initial focus of the Surface Water Quality Study Committee in view of the Pond's recreational importance and the awareness that Dudley Pond was experiencing accelerated or cultural lake eutrophication. Noticeable signs of this eutrophication such as increased algal and macrophytic (aquatic vascular plant) growth throughout the Pond and declining water clarity have been observed by area residents over the past several decades. Repeated herbicide/algicide treatmen~ of Dudley Pond that were undertaken between 1968 and 1978 provided some short-term benefit but were recognized as a stop-gap measure that treated the symptoms of pond/l ake eutrophicat ion and not the causes. At the November, 1979 Special Town Meeting an appropriation of $10,000 was approved to enable the Committee to,
"employ an environmental consultant to diagnose water quality problems in Dud~ey Pond and to prepare a grant application to the State for funds, to hopefully cure the problem. In addition, if warranted, the appropriation would also be used for interim weed control. 1I
Pursuant to a consultant review and selection process undertaken by the Study Committee, IEP, Inc. was retained to prepare a scope of work and to assist the Committee in submitting an application for federal monetary assistance to the Massachusetts Division of Water Pollution Control (MDWPC). MDWPC in turn, then requested a 70% matching grant to the U.S. Environmental Protection Agency (USEPA)through the EPAls (314) Lake Restoration Program. The required federal and state approvals were received in April 1981, and work on the first phase of a two phase study commenced shortly thereafter. The first phas~ or the diagnostic/ feasibility study is intended to fulfill the substate agreement and, in part, the requirements of a federal 314 Phase I study. It will also establish an adequate technical basis upon which the Town of Wayland can make responsible decisions regarding implementation of the recommendations to restore the Pond and qual ify for federal or state monetary assistance, if the Town so, chooses.
The specific areas of study requiring new or additional field investigations at Dudley Pond, included data relating to stormwater quality and nutrient loadings, nutrient/bacteria contributions from subsurface waste disposal systems, groundwater nutrient influx, a hydrologic budget,and information on the quality and volume of the Dudley Pond sediments. Existing lIin-lake" water quality and biological data, generated and compiled by John Larkin, during 1978 and 1979, a Dudley Pond shoreline resident and independent biologist, was augmented with several rounds of water quality sampling, plankton analysis and aquatic vegetation surveys conducted by IEP scientists. All pertinent data was then used
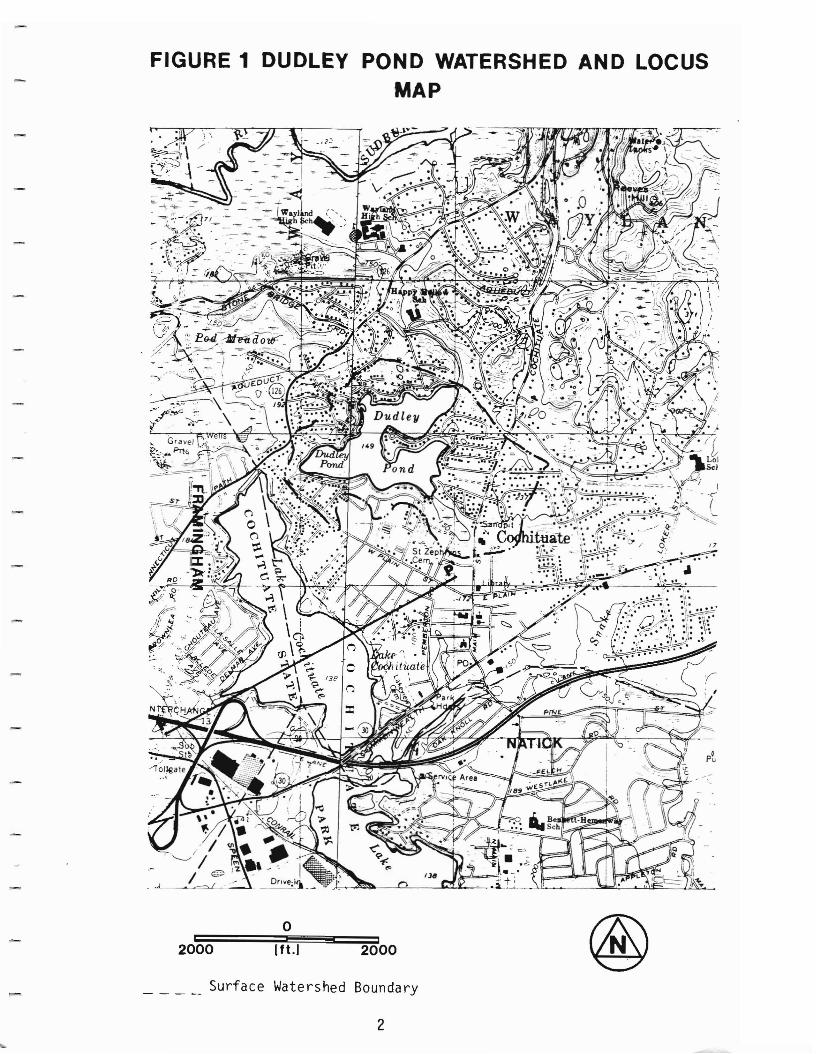
FIGURE 1 DUDLEY POND WATERSHED AND LOCUS MAP
o 20·l;'O:;O===(;:;f~t.~J~ii3:::=:;;2:::;::O'oO
Surface Watershed Boundary
2

to develop a "nutrient budget ll for Dudley Pond. A "nutrient budget" descr"ibes the total annual inflow and outflow of phosphorus and nitrogen, and provides a breakdown of the contributing nutrient sources (i.e., groundwater, sanitary waste disposal systems, stormwater, and other potential nutrient sources).
The feas'ibility study focused upon the evaluation of both practical in-lake and watershed management/restoration strategies and alternatives. Those techniques deemed technically feasible and effective, were evaluated with respect to cost, longevity and environmental effects. The management/restoration alternatives recommended for implementation at Dudley Pond are discussed in detail.
3
...

I-
r
r I
r
r
r
r
,....
2.0 PHYSICAL CHARACTERISTICS OF THE POND AND ITS WATERSHED
2.1 Climate
The 30-year normals of precipitation and temperature recorded at a NOAA weather station located in Framingham are tabulated below:
Monthly Climatic Normals (1941-1970) at. Fr~min~hRm (NOAA Station 19 2975)
Precipitation Temperature(inches) ( oF)
Jan 3.59 26.0 Feb 3.41 27.4 Mar 3.96 36.7 Apr 3.59 48.1 May 3.33 58.6 Jun 3.32 67.8 Jul 3.31 73.1 Aug 3.53 70.9 Sep 3.42 63.4 Oct 2.94 53.2 Nov 4.66 42.5 Dec 4.22 29.7
Mean 3.61 49.8 Total 43.28
As shown, precipitation is very evenly distributed throughout the normal year. Periods of severe drought are rare. Most slJT1l1ertime precipitation is in the form of thunderstorms which yield brief periods of intense rainfall. Much precipitation (-17% annually) is snowfall from late December to early March. As a result, ~unoff is highest in late winter when snowmelt combined with rainfall flows over typlcally frozen soil surfaces.
The "grow ing season II (period free of any temperature of 32°F or below) averages 134 days in length, typically from mid May to late September. This corresponds to the period of peak evapotranspiration.
The prevailing winds are northwesterly in the winter and southwesterly in the summer. The irregular shape and elevated topography surrounding Dudley Pond do not provide a long enough fetch to cause siqnificant wave heiaht.
2.2 Geology and Soils
The qeologic inventory of the Dudley Pond watershed is a compilation of both the reconnaissance geologic mapping done by IEP personnel, and by mapping done in the area by Nelson (1974a, 1974b, 1975). Bedrock geology, surficial geology and soil properties were examined to determine their influence on watershed hydrologic characteristics.
4
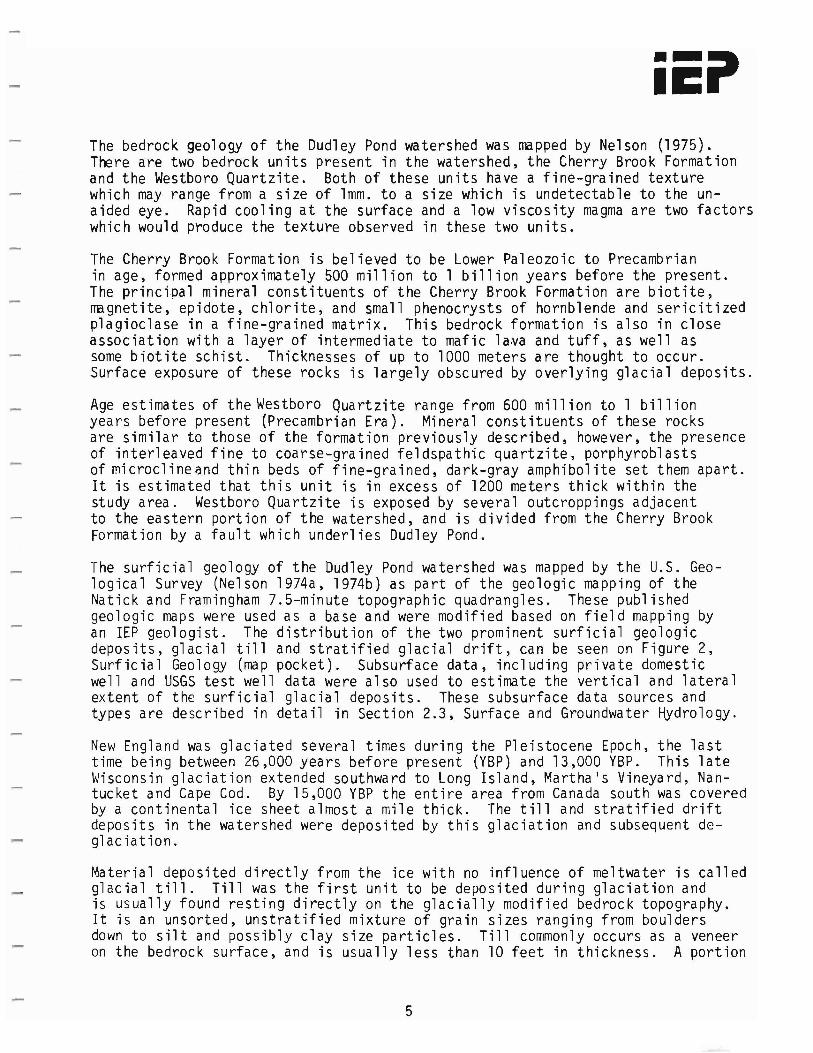
iiCi' The bedrock geology of the Dudley Pond watershed was mapped by Nelson (1975). There are two bedrock units present in the watershed, the Cherry Brook Formation and the Westboro Quartzite. Both of these units have a fine-grained texture which may range from a size of lmm. to a size which is undetectable to the unaided eye. Rapid cooling at the surface and a low viscosity magma are two factors which would produce the texture observed in these two units.
The Cherry Brook Formation is believed to be Lower Paleozoic to Precambrian in age, formed approximately 500 million to 1 billion years before the present. The principal mineral constituents of the Cherry Brook Formation are biotite, magnetite, epidote, chlorite, and small phenocrysts of hornblende and sericitized plagioclase in a fine-grained matrix. This bedrock formation is also in close association with a layer of intermediate to mafic lava and tuff, as well as some biotite schist. Thicknesses of up to 1000 meters are thought to occur. Surface exposure of these rocks is largely obscured by overlying glacial deposits.
Age estimates of the Westboro Quartzite range from 600 mill ion to 1 bill ion years before present (Precambrian Era). Mineral constituents of these rocks are similar to those of the formation previously described, however, the presence of interleaved fine to coarse-grained feldspathic quartzite, porphyroblasts of microclineand thin beds of fine-grained, dark-gray amphibolite set them apart. It is estimated that this unit is in excess of 1200 meters thick within the study area. Westboro Quartzite is exposed by several outcroppings adjacent to the eastern portion of the watershed, and is divided from the Cherry Brook Formation by a fault which underlies Dudley Pond.
The surficial geology of the Dudley Pond watershed was mapped by the U.S. Geological Survey (Nelson 1974a, 1974b) as part of the geologic mapping of the Natick and Framingham 7.5-minute topographic quadrangles. These published geologic maps were used as a base and were modified based on field mapping by an IEP geologist. The distribution of the two prominent surficial geologic deposits, glacial till and stratified glacial drift, can be seen on Figure 2, Surficial Geology (map pocket). Subsurface data, including private domestic well and USGS test well data were also used to estimate the vertical and lateral extent of the surficial glacial deposits. These subsurface data sources and types are described in detail in Section 2.3, Surface and Groundwater Hydrology.
New England was glaciated several times during the Pleistocene Epoch, the last time being between 26,000 years before present (YBP) and 13,000 YBP. This late Wisconsin glaciation extended southward to Long Island, Martha1s Vineyard, Nantucket and Cape Cod. By 15,000 YBP the entire area from Canada south was covered by a continental ice sheet almost a mile thick. The till and stratified drift deposits in the watershed were deposited by this glaciation and subsequent deglaciation.
Material deposited directly from the ice with no influence of meltwater is called glacial till. Till was the first unit to be deposited during glaciation and is usually found resting directly on the glacially modified bedrock topography. It is an unsorted, unstratified mixture of grain sizes ranging from boulders down to silt and possibly clay size particles. Till commonly occurs as a veneer on the bedrock surface, and is usually less than 10 feet in thickness. A portion
5

of the watershed along the eastern boundary located between Route 27 and School Street, is covered by this type of thin till. This is evidenced by the number of bedrock exposures found in the area.
Stratified drift deposits occur in the topographically lower portions of the watershed, filling in the low portions of the glacially scoured bedrock topography. These deposits of stratified sands and gravels were deposited by meltwater streams flowing from the melting glacial ice into the low areas between bedrock "highs. II Due to their deposition by water, which naturally sorts sediments by velocity changes and corresponding bedload capacity, these deposits are well sorted and well stratified. The stratified deposits in the Dudley Pond watershed are a result of meltwater draining from Glacial Lake Charles and Glacial Lake Sudbury.
Glacial lakes formed when meltwaters were dammed up as the glacier began to decay and retreat northward. The lakes formed because the hills to the west, east, and south and the ice front to the north impeded the drainage of meltwater from the area. Ridges in drainage divides to the south and east served as spillways and controlled the levels of the lakes. With further glacial retreat northward, successively lower spillways were uncovered and the lake levels were subsequently lowered. Each successive level represents a stage of the lake. Sands and gravels that were deposited during anyone stage were either graded to the elevation of the spillway or were laid down in the lake. One such deposit occurred during the Cochituate stage (Q1C3), and is located in the southern portions of the watershed. Dudley Pond is a result of a detached ice block which, uponmelting left behind a topographic depression.
Commonly, sands and gravels were deposited in conjunction with the ice front. The northern and eastern sections of the watershed have deposits which are a direct result of this type of glacial action, and are thus associated with ice contact deposits (Qc2).
Swamp deposits are recent (last 10,000 years) sediments overlying the glacial units in areas where the water table is at or near the ground surface. They consist of fine sand, silt and clay with less than 50% organic matter. Areas such as these are found along the periphery of the pond, as ~el1 as mantling other strat ifi ed depos its in the wa tershed. Swamp depos its were formed durinll pbst q1acia1 periods in poorly drained areas.
The soils of the Dudley Pond watershed have been mapped by the USDA Soil Conservation Service. The soils present in the watershed were class ified into hydrologic soils groups based on their hydrologic properties. This classification system was developed by the Soil Conservation Service and is summarized below:
'6
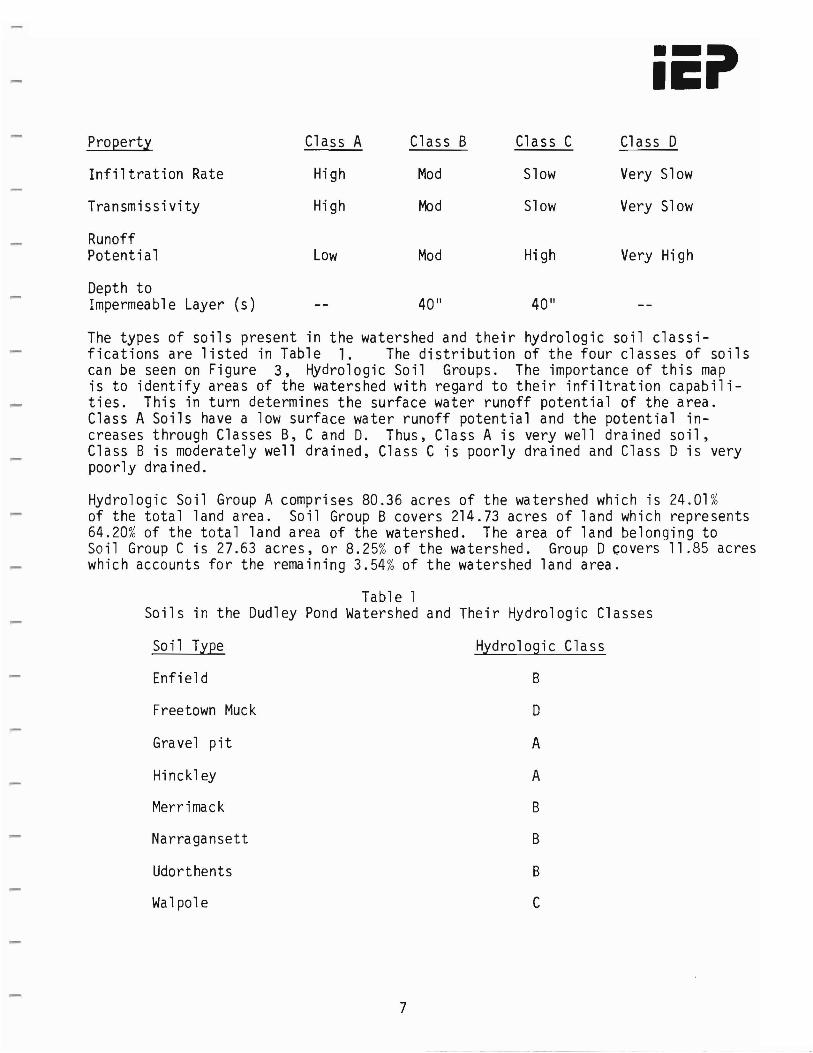
iEi' Property Class A Class B Cl ass C Class D
Infil tration Rate High Mod Slow Very Slow
Transmi ssi vity High Mod Slow Very Slow
Runoff Potential Low Mod High Very High
Depth to Impermeable Layer (s) 40 11 40"
The types of soils present in the watershed and their hydrologic soil classifications are listed in Table 1. The distribution of the four classes of soils can be seen on Figure 3, Hydrologic Soil Groups. The importance of this map is to identify areas of the watershed with regard to their infiltration capabilities. This in turn determines the surface water runoff potential of the area. Class A Soils have a low surface water runoff potential and the potential increases through Classes B, C and D. Thus, Class A is very well drained soil, Class B is moderately well drained, Class C is poorly drained and Class D is very poorly drained.
Hydrologic Soil Group A comprises 80.36 acres of the watershed which is 24.01% of the total land area. Soil Group B covers 214.73 acres of land which represents 64.20% of the total land area of the watershed. The area of land belonging to Soil Group C is 27.63 acres, or 8.25% of the watershed. Group D covers 11.85 acres which accounts for the remaining 3.54% of the watershed land area.
Tab1e 1 Soils in the Dudley Pond Watershed and Their Hydrologic Classes
Soil Type Hydrologic Cla ss
Enfield B
Freetown Muck 0
Gravel pit A
Hinckley A
Merrimack B
Narragansett B
Udorthents B
Walpole C
7
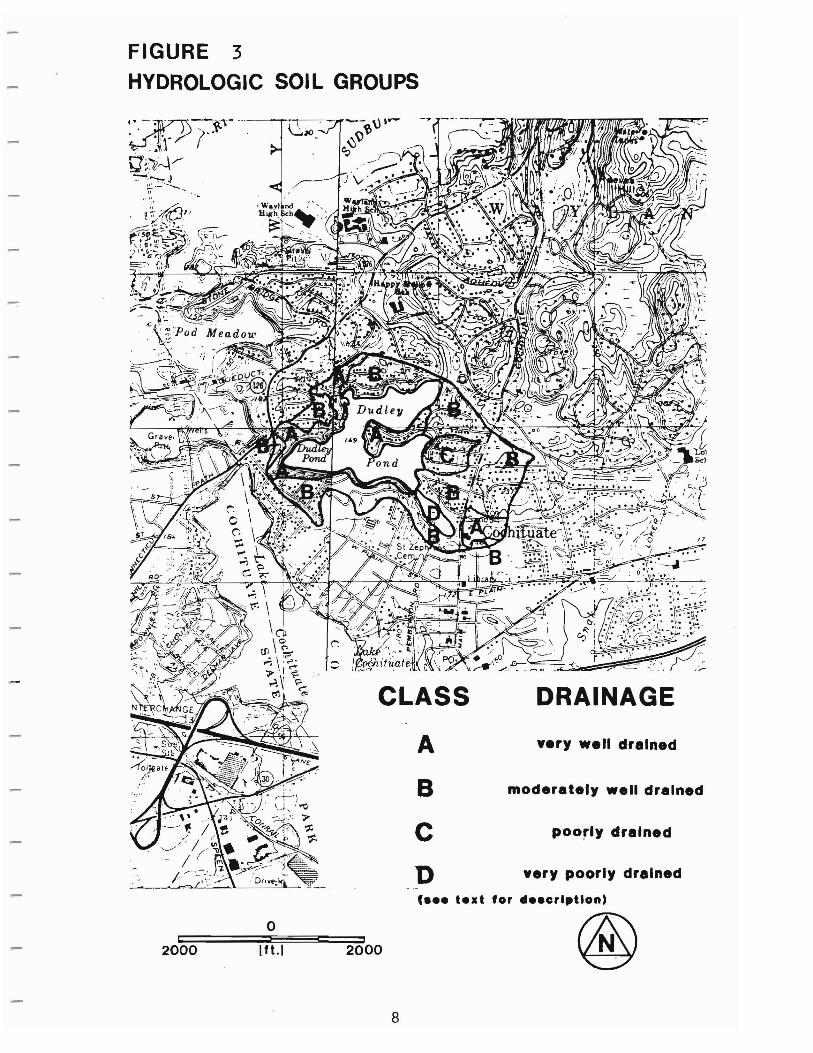
FIGURE 3
HYDROLOGIC SOIL GROUPS
CLASS DRAINAGE
very well drainedA
B moderately well drained
c poorly drained
D very poorly drained
C••• t.xt for ....cr ...Uon)
o
- 2000 Ift.1 @ 8

2.3 Surface and Groundwater Hydrology
The surface water quality of Dudley Pond is, in large part, a result of the surface and groundwater flow patterns into and out of the pond. In the "typica1" drainage basin hydrologic cycle, precipitation falling within the watershed may (1) run off the ground surface to nearby streams, ponds, and wetlands, (2) return to the atmosphere by evaporation and/or plant transpiration, a process that is referred to as "evapotranspiration" or (3) infiltrate to the water table and become part of the groundwater supply. Every drainage basin is unique, in that variable surficial geologic and bedrock conditions dictate the relative importance of surface water and groundwater inflow to the hydrologic budget. Land use is also quite important in dictating the relative importance of surface water versus groundwater inflow. The percentage of dense residential development (160.9 acres or 48%) of the watershed surface area within the Dudley Pond watershed has, because of the extent of impervious surfaces and storm drain systems, increased the relative importance of surface water versus groundwater inflow.
Surface water inflow along naturally occurring stream channels appears to account for only a small amount of the total flow into Dudley Pond. The only tributary to the Pond is an intermittent stream in the southeast corner of the Pond. This stream drains the wooded swamp located between the Pond and Cochituate Road. This stream only flows during major storms and during the winter and spring thaw period. Based on long-term observations of several area residents, flow generally does not occur between May and October, except for brief periods (Surface Water Study Committee, 1979). During the second round of storm sampling on July 19, 1982, minimal flow was observed in the tributary. Flow had ceased completely when the tributary was inspected 48 hours later. No gaging was performed on this stream. The volume of water which enters the Pond along this small channel has been included in the surface runoff component in all calculations (see Section 4.0 - Hydrologic Budget).
Observations made by IEP during the course of this study indicate that the Pond outlet exhibits a similar seasonal flow - no appreciable flow occurs over the semi-circular granite block spillway during the months of May - October. Groundwater seepage does occur beneath the aqueduct, as flow in the outlet stream was observed during June and August of 1981.
The porous and relatively permeable glaci'al sands and gravels which comprise the vast majority of the watershed allow for rapid infiltration of precipitationand little direct runoff (thus the absence of major tributary streams). Direct surface runoff enters Dudley Pond primarily through catch basins, storm drains and other roadway drainage structures.
The volume of groundwater inflow into Dudley Pond is large, relative to surface water inflow. IEP geologists recognized this fact very early in the study and designed a groundwater monitoring network to monitor groundwater/pond interactions. The objectives of the monitoring well network was to determine zones of groundwater inflow and outflow and to estimate rates and quantities of groundwater flow. This is important, especially since the watershed is unsewered (i.e., the contribution or nutrient enriched septic effluent mixing with groundwater could be a significant factor in the overall nutrient budget).
9
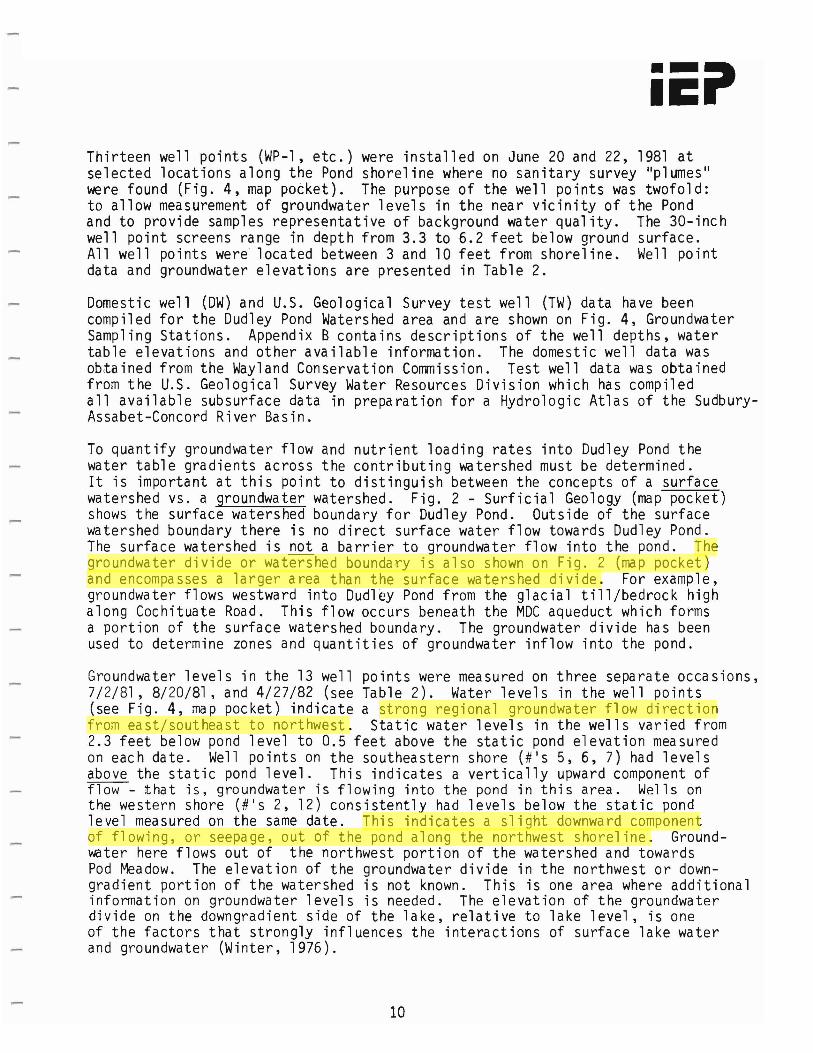
Thirteen well points (WP-l, etc.) were installed on June 20 and 22, 1981 at selected locations along the Pond shoreline where no sanitary survey "pl umes " were found (Fig. 4, map pocket). The purpose of the well points was twofold: to allow measurement of groundwater levels in the near vicinity of the Pond and to provide samples representative of background water quality. The 30-inch well point screens range in depth from 3.3 to 6.2 feet below ground surface. All well points were located between 3 and 10 feet from shoreline. Well point data and groundwater elevations are presented in Table 2.
Domestic well (DW) and U.S. Geological Survey test well (TW) data have been compiled for the Dudley Pond Watershed area and are shown on Fig. 4, Groundwater Sampling Stations. Appendix B contains descriptions of the well depths, water table elevations and other available information. The domestic well data was obtained from the Wayland Conservation Commission. Test well data was obtained from the U.S. Geological Survey Water Resources Division which has compiled all available subsurface data in preparation for a Hydrologic Atlas of the SudburyAssabet-Concord River Basin.
To quantify groundwater flow and nutrient loading rates into Dudley Pond the water table gradients across the contributing watershed must be determined. It is important at this point to distinguish between the concepts of a surface watershed vs. a groundwater watershed. Fig. 2 - Surficial Geology (map pocket) shows the surface watershed boundary for Dudley Pond. Outside of the surface watershed boundary there is no direct surface water flow towards Dudley Pond. The surface watershed is not a barrier to groundwater flow into the pond. The groundwater divide or watershed boundary is also shown on Fig. 2 (map pocket) and encompasses a larger area than the surface watershed divide. For example, groundwater flows westward into Dudley Pond from the glacial till/bedrock high along Cochituate Road. This flow occurs beneath the MDe aqueduct which forms a portion of the surface watershed boundary. The groundwater divide has been used to determine zones and quantities of groundwater inflow into the pond.
Groundwater levels in the 13 well points were measured on three separate occasions, 7/2/81, 8/20/81, and 4/27/82 (see Table 2). Water levels in the well points (see Fig. 4, map pocket) indicate a strong regional groundwater flow direction from east/southeast to northwest. Static water levels in the wells varied from 2.3 feet below pond level to 0.5 feet above the static pond elevation measured on each date. Well points on the southeastern shore (#I S 5, 6, 7) had levels above the static pond level. This indicates a vertically upward component of flow - that is, groundwater is flowing into the pond in this area. Wells on the western shore (#'s 2, 12) consistently had levels below the static pond level measured on the same date. This indicates a slight downward component of flowing, or seepage, out of the pond along the northwest shoreline. Groundwater here flows out of the northwest portion of the watershed and towards Pod Meadow. The elevation of the groundwater divide in the northwest or downgradient portion of the watershed is not known. This is one area where additional infonnation on groundwater levels is needed. The elevation of the groundwater divide on the downgradient side of the lake, relative to lake level, is one of the factors that strongly influences the interactions of surface lake water and groundwater (Winter, 1976).
10
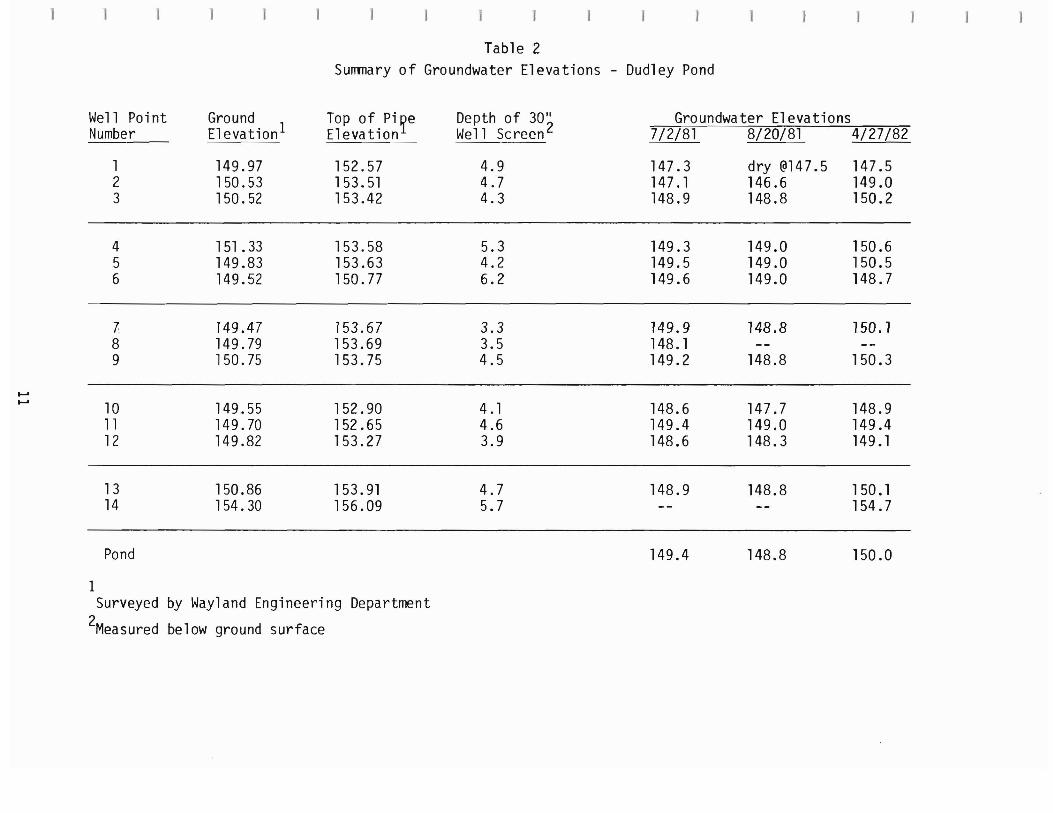
Table 2 Summary of Groundwater Elevations - Dudley Pond
Well Point Number
Ground El evation1 Top of Pi ~e
Elevation Depth of 30 2Well Screen
Groundwater Elevations 7/2/81 8/20/81 4/27/82
1 2 3
149.97 150.53 150.52
152.57 153.51 153.42
4.9 4.7 4.3
147.3 147.1 148.9
dry @14 7.5 146.6 148.8
147.5 149.0 150.2
4 5 6
151 .33 149.83 149.52
153.58 153.63 150.77
5.3 4.2 6.2
149.3 149.5 149.6
149.0 149.0 149.0
150.6 150.5 148.7
7 8 9
149.47 149.79 150.75
153.67 153.69 153.75
3.3 3.5 4.5
149.9 148.1 149.2
148.8
148.8
150.1
150.3
~
~ 10 11 12
149.55 149.70 149.82
152.90 152.65 153.27
4.1 4.6 3.9
148.6 149.4 148.6
147.7 149.0 148.3
148.9 149.4 149.1
13 14
150.86 154.30
153.91 156.09
4.7 5.7
148.9 -
148.8 -
150.1 154.7
Pond 149.4 148.8 150.0
1 Surveyed by Wayland Engineering Department
2Measured below ground surface
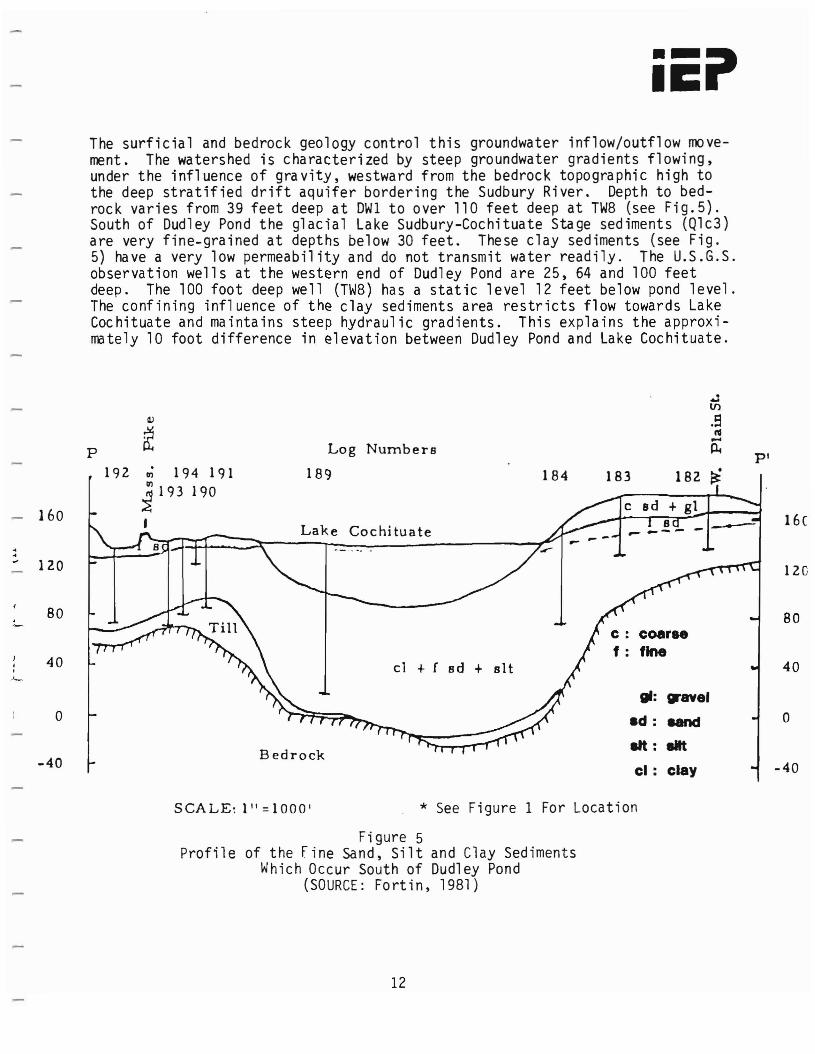
The surficial and bedrock geology control this groundwater inflow/outflow movement. The watershed is characterized by steep groundwater gradients flowing, under the influence of gravity, westward from the bedrock topographic high to the deep stratified drift aquifer bordering the Sudbury River. Depth to bedrock varies from 39 feet deep at DW1 to over 110 feet deep at TW8 (see Fig.5). South of Dudley Pond the glacial Lake Sudbury-Cochituate Stage sediments (Qlc3) are very fine-grained at depths below 30 feet. These clay sediments (see Fig. 5) have a very low permeability and do not transmit water readily. The U.S.G.S. observation wells at the western end of Dudley Pond are 25, 64 and 100 feet deep. The 100 foot deep well (TW8) has a static level 12 feet below pond level. The confining influence of the clay sediments area restricts flow towards Lake Cochituate and maintains steep hydraulic gradients. This explains the approximately 10 foot difference in elevation between Dudley Pond and Lake Cochituate .
.1 t/)
.9 I'll
P Log Numbers -p.. pi
192 ~ 194 191 189 184 183 182 ~ ~ 193 190
160 I 16c Lake Cochituate
120 120
80 80 coarse
f: fineI 40I I cl + f sd + sit 40 ~l_
81: gravel o oad: aand
aIt: alitBedrock
-40 -40
SCALE: I" = 1000 I * See Figure 1 For Location
Figure 5 Profile of the Fine sand, Silt and Clay Sediments
Which Occur South of Dudley Pond (SOURCE: Fortin, 1981)
cl: clay
12
iiCi' 2.4 Land Use/Demography
Human use of Dudley Pond predates historical records, however, soapstone Iridian relics found near the Pond suggest human habitation or encampment as long ago as 3000 years (Larkin, 1979). Certainly, the Pond was used during colonial periods and through the early settlement of the Wayland area, as an informal source of potable water, ice, fish and freshwater clams. In later years (19th century), Dudley Pond was used commercially for ice production and became Boston's first public water supply.
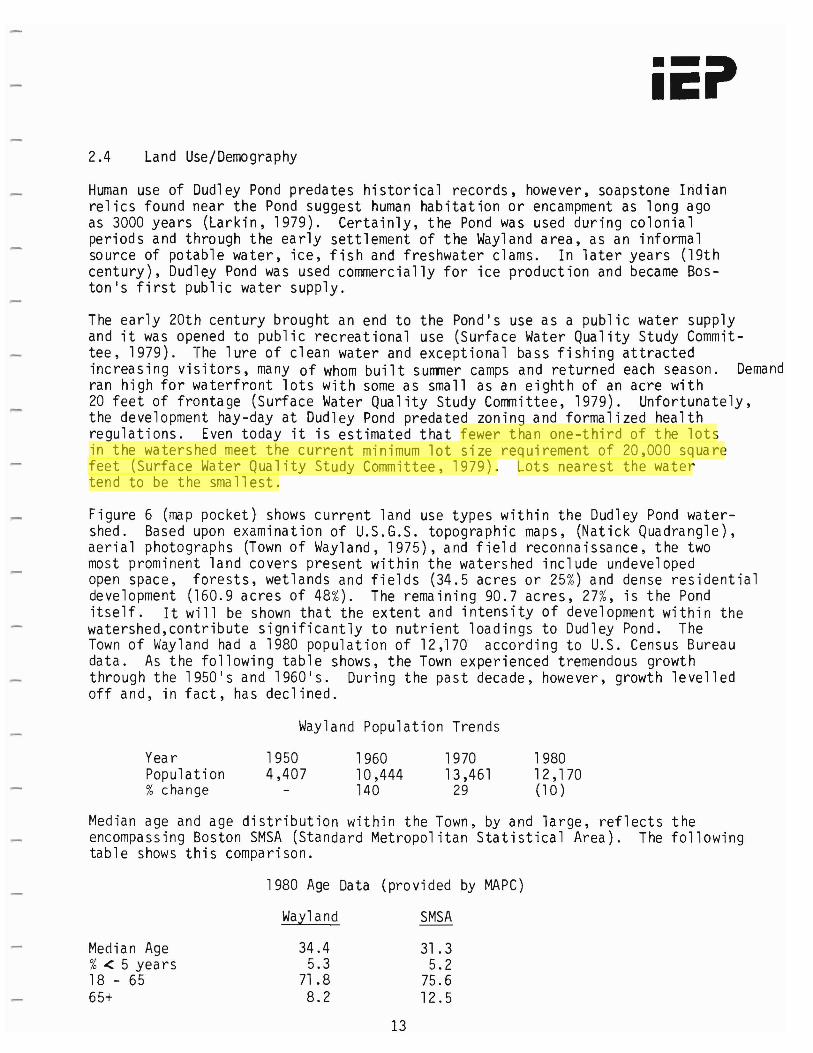
The early 20th century brought an end to the Pond's use as a public water supply and it was opened to public recreational use (Surface Water Quality Study Committee. 1979). The lure of clean water and exceptional bass fishing attracted increasing visitors, many of whom built summer camps and returned each season. Demand ran high for waterfront lots with some as small as an eighth of an acre with 20 feet of frontage (Surface Water Quality Study Committee, 1979). Unfortunately, the development hay-day at Dudley Pond predated zoning and formalized health regulations. Even today it is estimated that fewer than one-third of the lots in the watershed meet the current minimum lot size requirement of 20,000 square feet (Surface Water Quality Study Committee, 1979). Lots nearest the water tend to be the smallest.
Figure 6 (map pocket) shows current land use types within the Dudley Pond watershed. Based upon examination of U.S.G.S. topographic maps. (Natick Quadrangle). aerial photographs (Town of Wayland. 1975). and field reconnaissance. the two most prominent land covers present within the watershed include undeveloped open space. forests. wetlands and fields (34.5 acres or 25%) and dense residential development (160.9 acres of 48%). The remaining 90.7 acres, 27%. is the Pond itself. It will be shown that the extent and intensity of development within the watershed, contribute significantly to nutrient loadings to Dudley Pond. The Town of Wayland had a 1980 population of 12,170 according to U.S. Census Bureau data. As the following table shows. the Town experienced tremendous growth through the 1950's and 1960 1 s. During the past decade. however. growth levelled off and. in fact. has declined.
Wayland Population Trends
Yea r 1950 1960 1970 1980 Population 4,407 10,444 13.461 12,170 % change 140 29 (10)
Median age and age distribution within the Town. by and large. reflects the encompassing Boston SMSA (Standard Metropolitan Statistical Area). The followingtable shows this comparison.
1980 Age Data (provided by MAPC)
Wayland SMSA
Median Age %<: 5 yea rs 18 - 65
34.4 5.3
71.8
31. 3 5.2
75.6 65+ 8.2 12.5
13
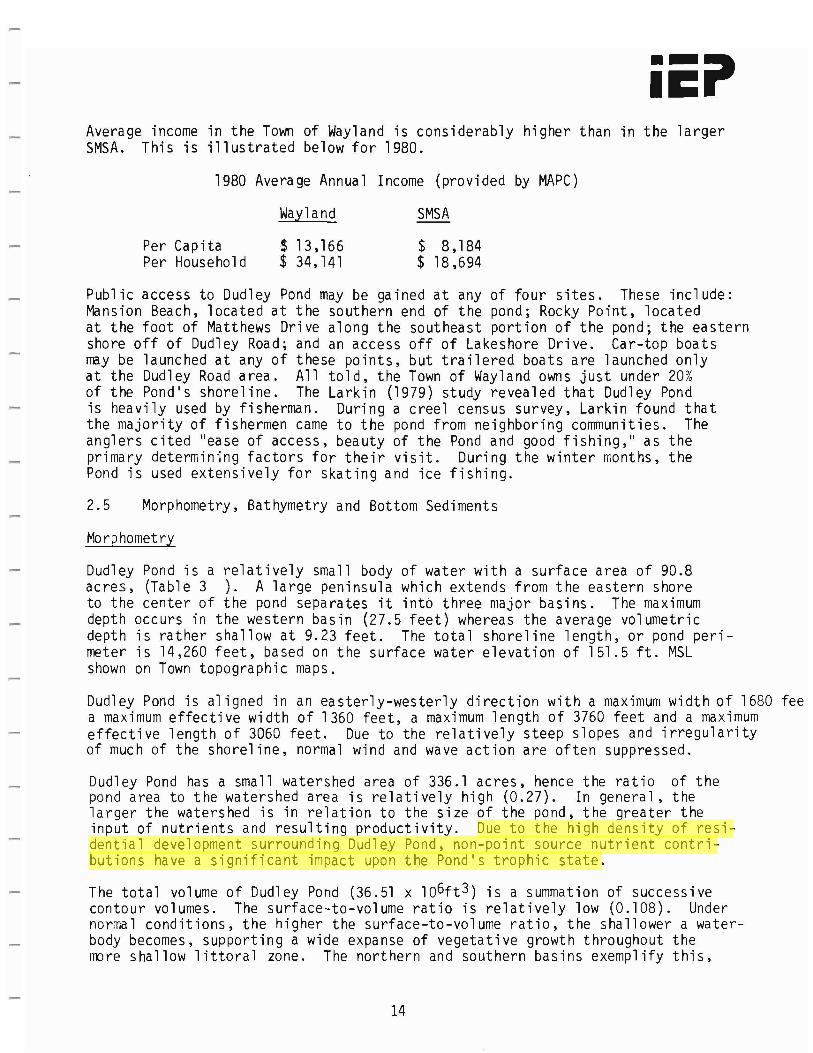
Average income in the Town of Wayland is considerably higher than SMSA. This is illustrated below for 1980.
in the larger
1980 Average Annual Income (provided by MAPC)
Wayland SMSA
Per Capita Per Household
$ 13,166 $ 34,141
$ 8,184 $ 18,694
Public access to Dudley Pond may be gained at any of four sites. These include: Mansion Beach, located at the southern end of the pond; Rocky Point, located at the foot of Matthews Drive along the southeast portion of the pond; the eastern shore off of Dudley Road; and an access off of Lakeshore Drive. Car-top boats may be launched at any of these points, but trailered boats are launched only at the Dudley Road area. All told, the Town of Wayland owns just under 20% of the Pondls shoreline. The Larkin (1979) study revealed that Dudley Pond is heavily used by fisherman. During a creel census survey, Larkin found that the majority of fishermen came to the pond from neighboring communities. The anglers cited "ease of access, beauty of the Pond and good fishing,11 as the primary determining factors for their visit. During the winter months, the Pond is used extensively for skating and ice fishing.
2.5 Morphometry, Bathymetry and Bottom Sediments
Morphometry
Dudley Pond is a relatively small body of water with a surface area of 90.8 acres, (Table 3 ). A large peninsula which extends from the eastern shore to the center of the pond separates it into three major basins. The maximum depth occurs in the western basin (27.5 feet) whereas the average volumetric depth is rather shallow at 9.23 feet. The total shoreline length, or pond perimeter is 14,260 feet, based on the surface water elevation of 151.5 ft. MSL shown on Town topographic maps.
Dudley Pond is aligned in an easterly-westerly direction with a maximum width of 1680 fee a maximum effective width of 1360 feet, a maximum length of 3760 feet and a maximum effective length of 3060 feet. Due to the relatively steep slopes and irregularity of much of the shoreline, normal wind and wave action are often suppressed.
Dudley Pond has a small watershed area of 336.1 acres, hence the ratio of the pond area to the watershed area is relatively high (0.27). In general, the larger the watershed is in relation to the size of the pond, the greater the input of nutrients and resulting productivity. Due to the high density of residential development surrounding Dudley Pond, non-point source nutrient contributions have a significant impact upon the Pondls trophic state.
The total volume of Dudley Pond (36.51 x 106ft3) is a summation of successive contour volumes. The surface-to-volume ratio is relatively low (0.108). Under normal conditions, the higher the surface-to-volume ratio, the shallower a waterbody becomes, supporting a wide expanse of vegetative growth throughout the rrore shallow littoral zone. The northern and southern basins exemplify this,
14
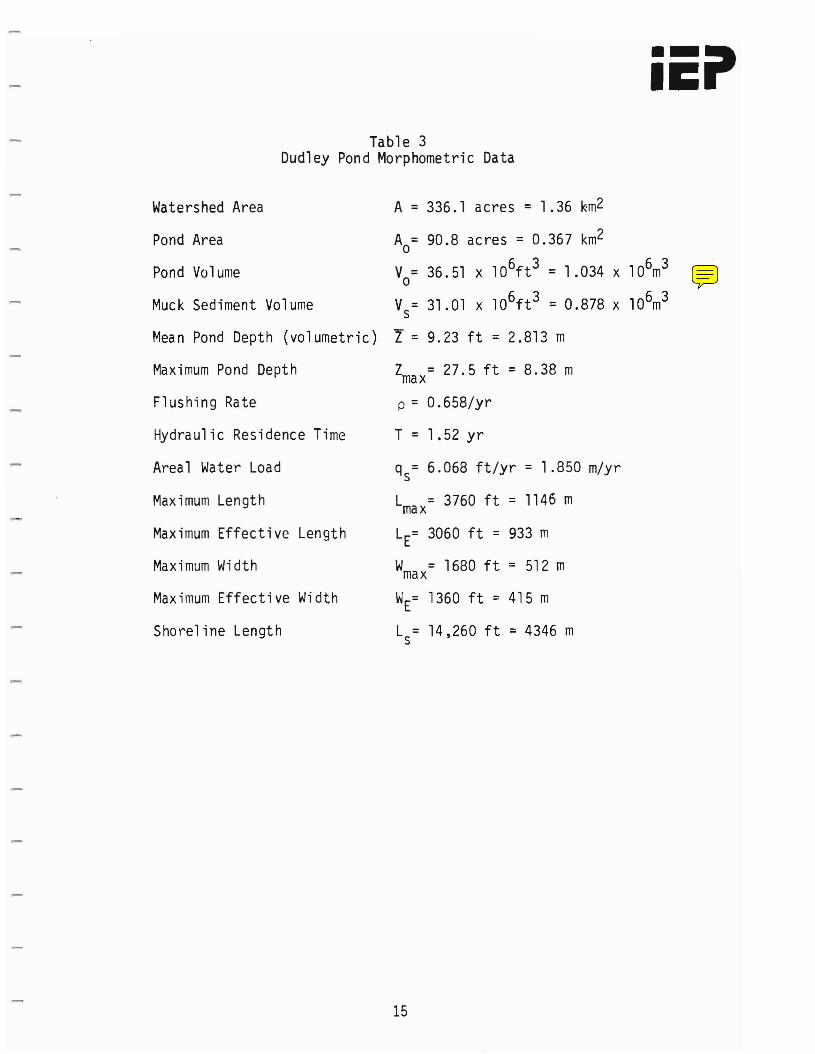
Table 3 Dudley Pond Morphometric Data
Watershed Area
Pond Area
Pond Volume
Muck Sediment Volume
Mean Pond Depth (volumetric)
Maximum Pond Depth
Flushing Rate
Hydraulic Residence Time
Areal Water Load
Maximum Length
Maximum Effective Length
Maximum Width
Maximum Effective Width
Shorel ine Length
A = 336.1 acres = 1.36 ~m2
A = 90.8 acres = 0.367 km2 a
V = 36.51 x 106ft3 = 1.034 x 10⁶m3 o
V = 31.01 x 106ft 3 = 0.878 x 10⁶m3 s
Z = 9.23 ft = 2.813 m
Zmax= 27.5 ft = 8.38 m
p = 0.658/yr
T = 1. 52 yr
qs= 6.068 ft/yr = 1.850 m/yr
L = 3760 ft = 1146 m max
LE= 3060 ft = 933 m
W = 1680 ft = 512 mmax W= 1360 ft = 415 mE L = 14,260 ft = 4346 m s
15

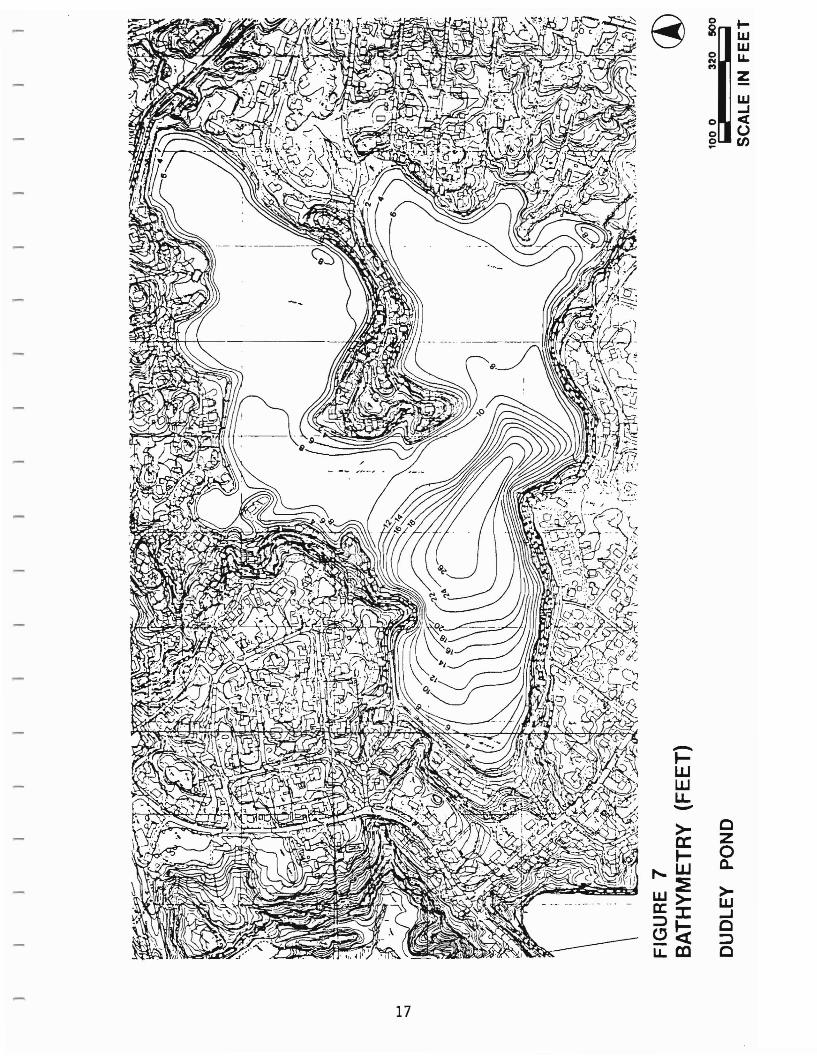
having shallow depths of 7-8 feet and a relatively dense distribution of vegetation. Thus, the present surface-to-volume ratio is significantly influenced by the bathymetric characteristics of the western basin (Figure 7).
Dudley Pond has a very long hydraulic retention time of 1.52 years (the annual stream outflow divided by the pond volume), in comparison to many other Massachusetts ponds and lakes, where the retention time is measured in weeks or several months. In other words, only 0.658 (reciprocal of 1.52) of the total water volume in Dudley Pond is passed through the outlet in one year (flushing rate). The areal water load is the product of all water entering the pond from such sources as precipitation, groundwater and to a lesser extent, stream inflow. The areal water load into Dudley Pond is 6.068 ft/year.
Bathymetry
A bathymetric map, illustrating the bottom contours of Dudley Pond is presented in Figure 7. Depth determinations were conducted by IEP personnel at approximately 125 sampling locations, along 23 transects throughout Dudley Pond on May 5-6, 1981. Water depths were measured utilizing a cloth tape, weighted at the end with a flat metal disc. Dudley Pond bathymetry has been surveyed and mapped on two other occasions, once in 1912 by the Metropolitan Water Works and again in 1978 by Larkin. There appear to be few significant changes in water depths that can be drawn from comparing the three maps.
Dudley Pond is comprisedof three basins, each with a relatively steep shoreline. The deep hole is located in the western basin (27.5 feet), with the northern and southern basins having relatively shallow depths of 7-8 feet. Water depths vary seasonally within Dudley Pond as evidenced by the changes in water levels at the spillway, located in the northern basin. From mid-summer to mid-fall, water levels are generally lower than the crest of the spillway. Due to precipitation in the fall, the water level often rises over the spillway during winter months.
Bottom Sediments
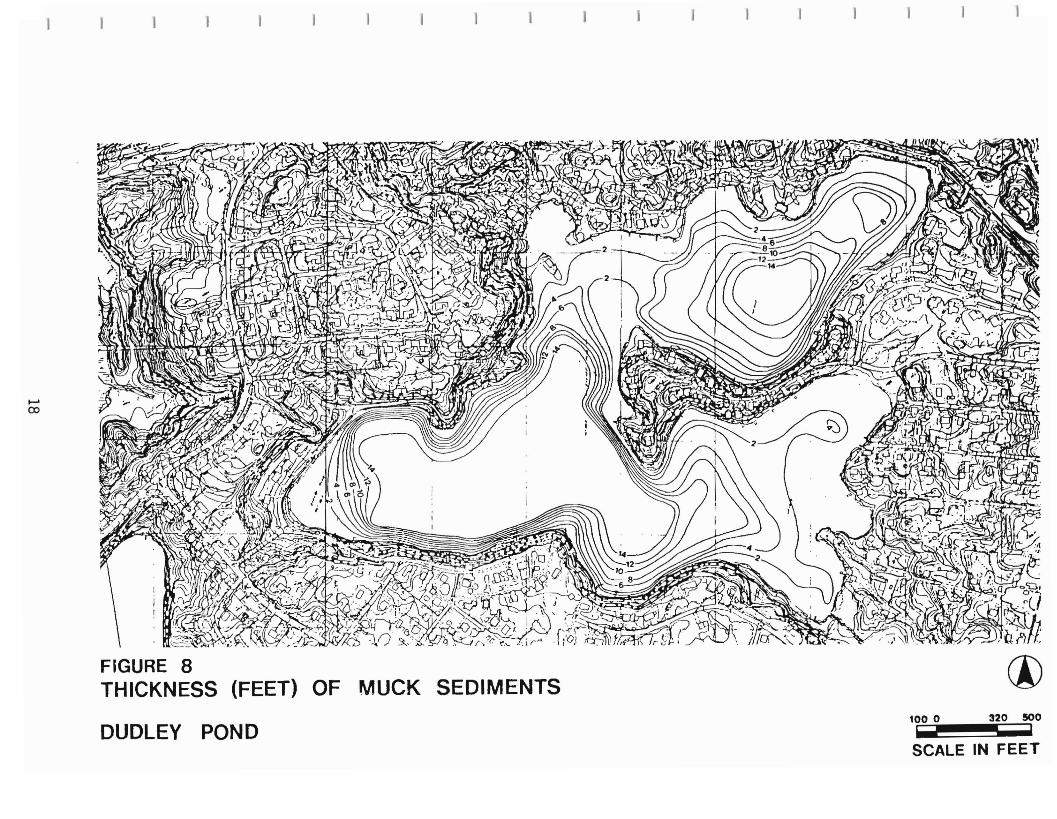
The bottom substrate of Dudley Pond was surveyed on May 5-6, 1981 by IEP personnel. Utilizing six foot lengths of 3/8 inch diameter stainless steel rods, sediment thickness was determined at 125 sampling locations throughout Dudley Pond (Fi gure 8).
Historically, the shoreline substrate of Dudley Pond was primarily composed of sand, with rocks and boulders scattered throughout (Larkin, 1979). It is diffi cult,however, to make quantitative statements regarding changes in bottom type which may have occurred over the years. At the present time, contiguous stretches of sand/fine gravel may still be found adjacent to shoreline residences. Throughout most of the coves and in the deeper water portions of the Pond, the bottom is presently covered by muck and silty/sand sediments as it probably was hundreds of years ago.
16
~
-~ W UJ u..->a: ~
,...W W~0:>=>::I: ~~ u..m
0
~
0 N f'l
0
0 ~
c z 0 ~
>w ...J C =>c
I W W IL.
Z
W -J ex () en
17
~
co
MUCK SEDIMENTS 1000 320 500
DUDLEY POND ! !
SCALE IN FEET

The total vol ullle of "muc k" type sediments which coul d be penetrated with the stai nless steel rods, is approximately 1,148,000 cu.yds. (Table 4). The thickness of the muck sediments was found to vary between 0 and 14 ft. Throughout the deeper central portion of Dudley Pond, muck deposits in excess of 14 ft. were consistently found. Comparing IEP's bathymetric map of Dudley Pond (May 1981) to a similar map prepared by the Metropolitan Water Works from depth soundings taken in 1861, shows that the Pond has not filled in to the extent that one might have expected. Depth soundings from the 1861 survey reveal a maximum water depth of 29 ft. whereas the maximum depth that we recorded was 27.5 ft. Water depths throughout other portions of the Pond appear quite similar between the two surveys based upon a cursory qualitative examination.
Sediment cores were collected from Dudley Pond on May 19,1981. Station 1 was centrally located at a water depth of approximately 24 feet. The two foot long core obtained from Station 1 was sectioned in half, for analyses of the top one foot and 1-2 foot layers. The second core, (station 2) was collected from the southeast cove(Figure 9, Section 3.1).
Analyses of the core samples revealed a high moisture and organic content (Table 5). Upon visual examination, both cores were found to contain an abundance
of poorly decomposed organic material. The inorganic fraction of the core samples was examined with respect to grain size. Station 1 (top 1 foot) can be characterized as a silty-sand with a moderate clay content (20%). A gradation to a higher percentage of silt and a corresponding decrease in fine sand, was found in the 1-2 foot sedi~ent layer also analyzed at station 1.
The total phosphorus concentrations at station 1 were very low, at 49 mg/kg (0-1 ft) and 50 mg/kg (1-2 ft) dry weight. The average total P concentration for grab sediment samples analyzed by the Massachusetts Division of Water Pollution Control (Massachusetts DWPC, unpublished) from 27 different ponds and lakes across the Commonwealth, was 1,268 mg/kg dry-weight. The Kjeldahl nitrogen content of the sediments at station 1 in Dudley Pond was quite high, exceeding 21,000 mg/kg. Massachusetts DWPC reported an average TKN concentration of 7,531 mg/kg dry weight for 27 lake sediment grab samples which they have analyzed. Our findings for the sediment core testing at Dudley Pond (station 1) reveal an unusually low phosphorus content yet high TKN concentration. The iron and arsenic levels detected in sediment core no. 2 were higher than the concentrations reported for station 1. However, the levels for both parameters at the two stations were within normal ranges reported by Massachusetts DWPC. The sediment copper concentrations were uniformly low at both stations. A decrease in the sediment copper level was not evident in the deeper core sample collected between the 1 and 2 foot depth at station 1. The copper levels reported here are substantially lower than the copper concentrations analyzed in two Dudley Pond sediment samples collected by IEP during March 1980. The copper levels in these earlier samples were 120 and 162 mg/kg. The average sedmient copper concentration for 33 lakes sampled by DWPC is 322 mg/kg. In other words, the copper levels found in the sediments of Dudley Pond are not unusually high, despite previous algae control treatments where copper SUlphate was applled.
19
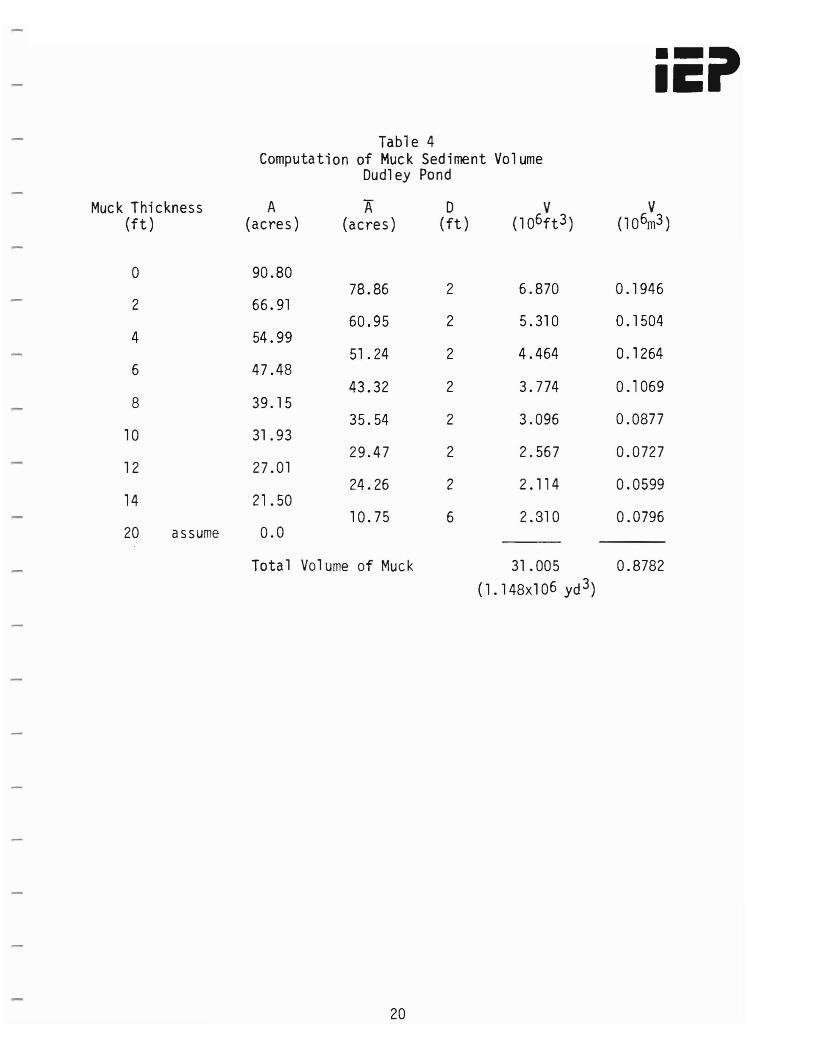
Table 4 Computation of Muck Sediment Volume
Dudley Pond
Muck Thi ckness (ft)
A (acres)
A (acres)
D (ft)
V (l06ft3)
V (106m3)
0
2
4
6
8
10
12
14
20 assume
90.80
66.91
54.99
47.48
39.15
31.93
27.01
21. 50
0.0
78.86
60.95
51.24
43.32
35.54
29.47
24.26
10.75
2
2
2
2
2
2
2
6
6.870
5.310
4.464
3.774
3.096
2.567
2.114
2.310
0.1946
0.1504
0.1264
0.1069
0.0877
0.0727
0.0599
0.0796
Total Volume of Muck 31.005 (1.148xl06 yd 3)
0.8782
20
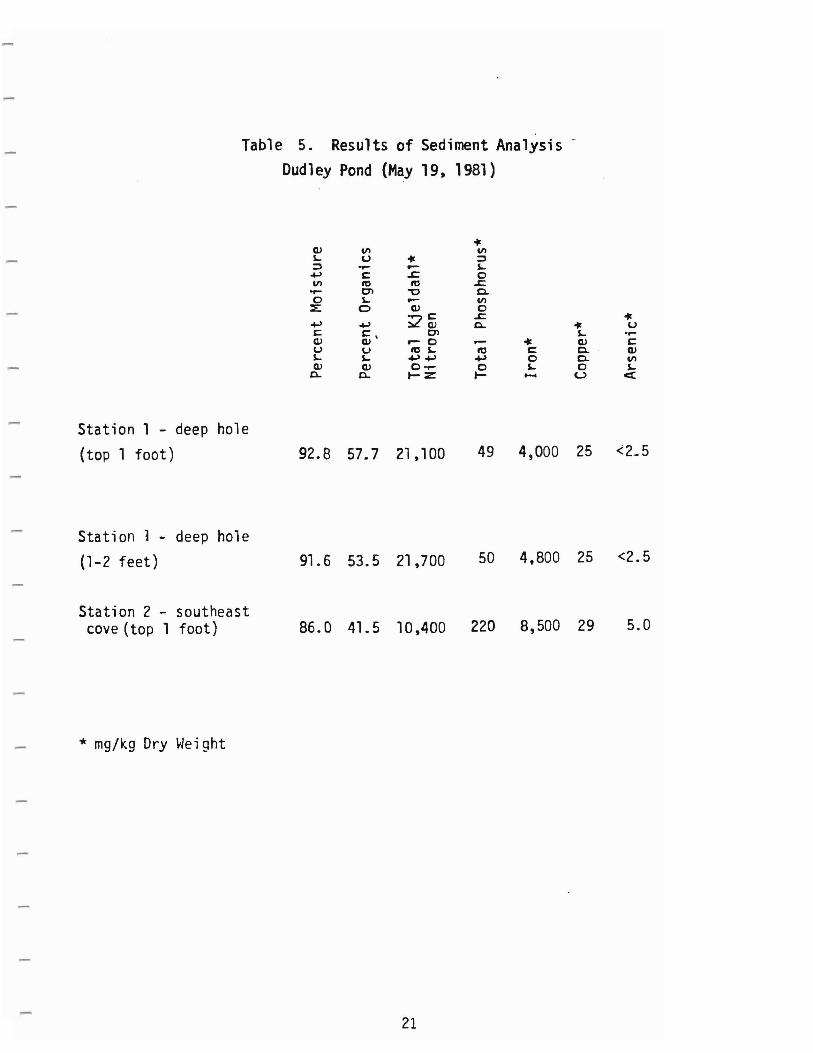
Table 5. Results of Sediment Analysis
DUdley Pond (May 19, 1981)
... cu VI VI 5- U ... ='
~ 5=' 0+-> e -~ 0 VI .c: ~ "' 0'> "0"' c-o 5- VI ~ 0 -cu 0
.c: ... 0+-> 0+-> ;:?~ n. ... u c: e, 0'> 5- .... Cl.J cu .-0 .- cu e•u u 1tl5- Itl c: c- cu 5- 5- 0+-> 0+-> +oJ 0 c- VI Cl.J cu o~ 0 5- 0 5
n. n. t-z t- U ~ -Station 1 - deep hole
(top 1 foot) 92.8 57.7 21,100 49 4,000 25 <2_5
Station 1 - deep hole
(1-2 feet) 91.6 53.5 21,700 50 4.800 25 <2.5
Station 2 - southeast cove (top 1 foot) 86.0 41.5 10,400 220 8,500 29 5.0
* mg/kg Dry Weight
21
-
A portion of the sediment core from station 1 (top 1 foot) was also analyzed for selected metals, ammonia, nitrate and phosphorus, by the U.S. Cooperative Extension Service's Suburban Experiment Station located in Waltham. The objectives of these additional analyses were two-fold. The main purpose was to provide data on the quality of the sediments as related to potential use, marketability and value of the material. The second objective was to obtain information on the presence of potentially toxic metals and other substances that could be released in the event that dredging was recommended as an in-lake restoration or management technique.
The results of the core analyses from station 1 revealed lead, copper, cadmium, arsenic and aluminum concentrations which generally fall between the "low" and "hi gh" ranges for soil s, as determined by Suburban Experiment Stat ion personnel. The data indicate- that plant growth is not likely to be adversely affected due to high metals concentrations, nor do the levels seem high with respect to Massachusetts DWPC's (1978) standards for dredge material disposal. The experiment station recommended amending the Dudley Pond sediments with "two tons of lime/acre, 50 lbs. N/acre, 150 lbs. P205/acre and 125 lbs. K20/acre," if the sediments were to be used for growing crops. The sediment pH was found to be 5.5.
22
iiSi' 3.0 WATER QUALITY AND AQUATIC ECOLOGY
3.1 In-Lake and Tributary
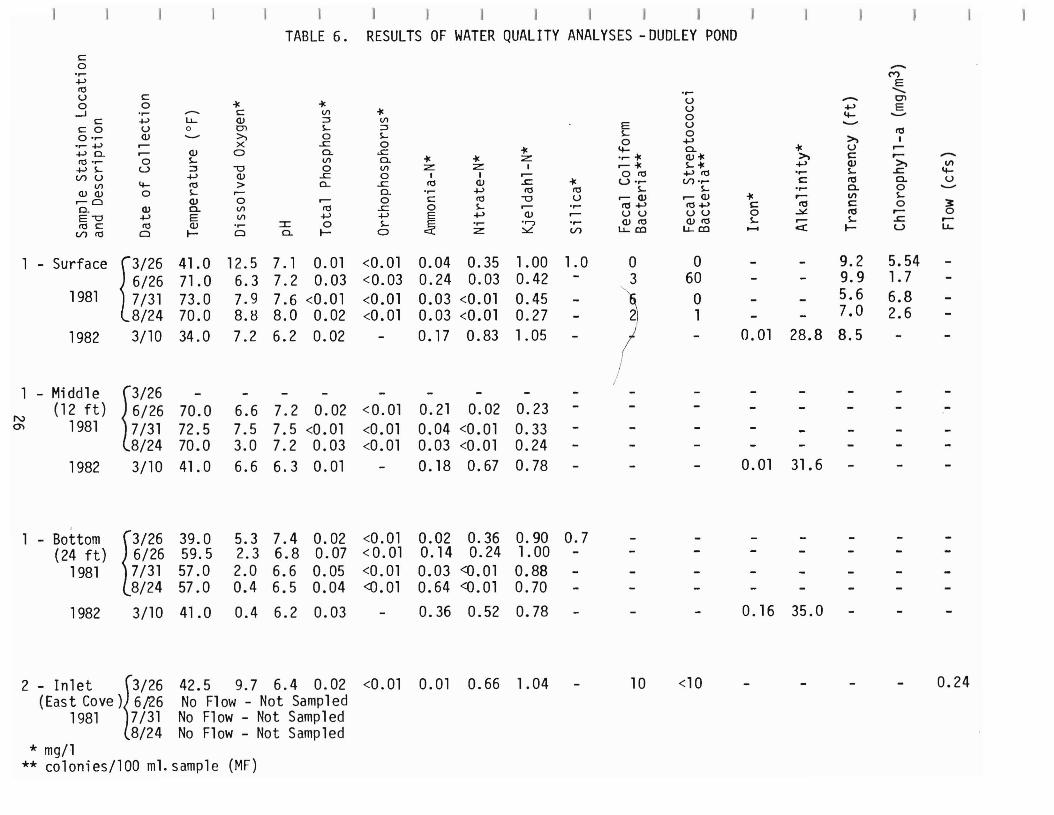
During the spring and summer of 1981, IEP personnel collected four rounds of water samples at Dudley Pond for chemical and bacteriological analyses. Sample station 1 was located at the deep holeof Dudley Pond with 'a maximum water depth of approximately 26 ft (Figure 9). At this station, grab water samples were collected near the surface (1 ft.), mid-depth (12 ft.) and approximately 2 feet above the Pond bottom (24 ft.). Reitzel Associates of Boylston, Massachusetts performed the laboratory analyses. Temperature-oxygen profiles conducted during each of the four sampling rounds (March, June, July, August 1981) and one additional round (March 10, 1982), collected when the Pond was still ice-covered, are graphic~lly presented in Figure 18. The water quality parameters and results for the flve rounds of sampling are shown in Table 6.
Sampl i ng conducted on March 26, 1981, revea led nearly uni form temperatures between the Pond surface and bottom. The oxygen concentrations on March 26th were near saturation at the surface (12.6 mg/l) but declined to 5.5 mg/l at 24 feet. These oxygen readings may have been aberrant however, because a similar temperatureoxygen profile performed in late March 1980 by IEP at Dudley Pond, revealed high concentrations of dissolved oxygen throughout the entire water column.
Both total and orthophosphorus were found in low concentrations at the Pond surface and bottom on March 26,1981. Inorganic nitrogen (ammonia plus nitrate) levels on the other hand, were moderately high, as compared to phosphorus - at both the surface and bottom. The decrease in temperature of 2°F from the Pond surface to a depth of 24 ft., in combination with comparable concentrations of nutrients, indicate that Dudley Pond had undergone spring turn-over prior to our March 26th sample round. As surface water temperatures increased during the summer at Dudley Pond, a thermocline developed between the 15 and 20 foot depths. A relatively small and poorly defined hypolimnion was evident during the summer round between 20 and 24 feet.
The hypolimnion of Dudley Pond does not become truly anaerobic (totally without oxygen) during the summer, although the dissolved oxygen concentration on August 24th was only 0.4 mg/l. A water sample collected near the bottom (24 ft.) on August 24th, revealed elevated ammonia, Kjeldahl nitrogen and total phosphorus concentrations as compared to either the surface or 12 foot samples.
Al~hough some.nutrient release from the sediments apparently does occur at Dudley,thlS release lS probably not so great as to result in excessively high nutrient l~vels pe~sisting th~ou~hout the entire hypolimnion over an extended period of tlme. ThlS hypothesls lS based upon our recorded dissolved oxygen concentration at 20 ft. of 1.1 mg/l on August 24th and the absence of elevated ammonia or nitrate concentrations at 24 ft. on July 31st and only a moderate increase in phosphorus.
-23
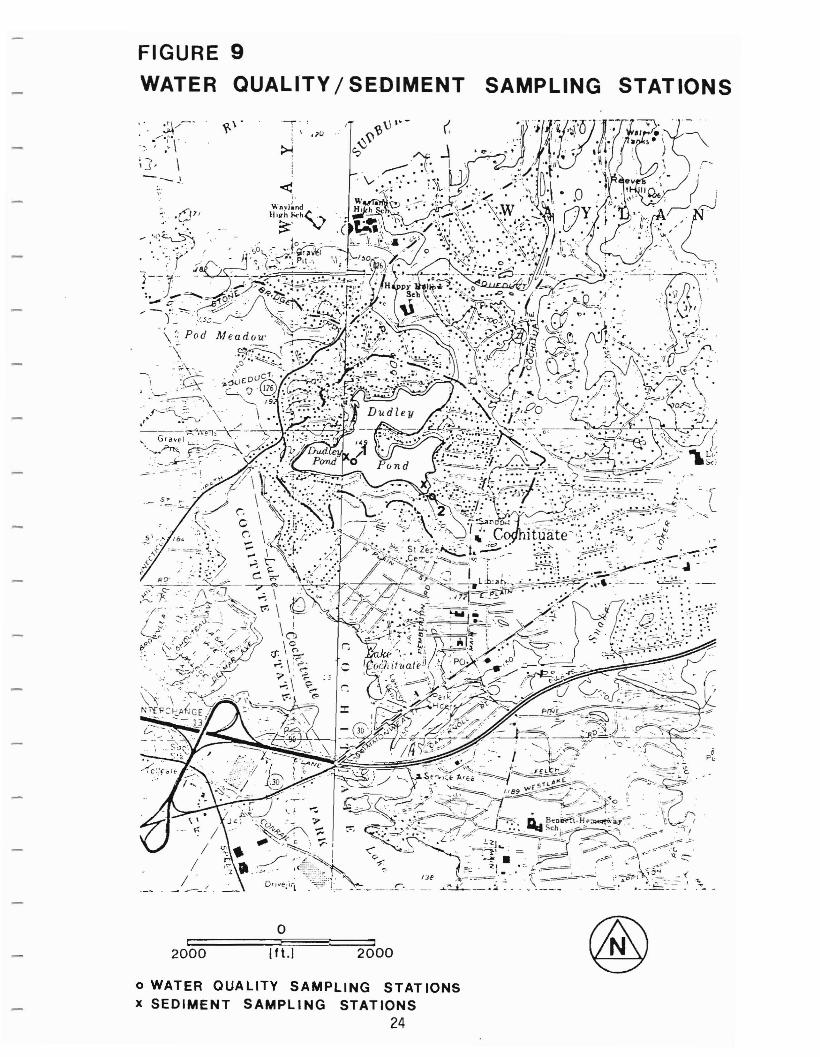
FIGURE 9
WATER QUALITY / SEDIMENT SAMPLING STATIONS
:1.\/--.......... ,.
• I \ .... J "
;}- \
j" - ---_!
o 2000 If 1.1 2000
o WATER QUALITY SAMPLING STAT IONS x SEDIMENT SAMPLING STATIONS
24

FIGURE 10 TEMPERATURE / DISSOLVED OXYGEN PROFILES
~ t-el. w Cl
25 -01
15
20
, I,,,
I, I I I I, I, ,,
I I
\ I \I V t !! / ~ /
."/
..:Y ..:/
...;/.. j'/ _
S
5
-.:: 10
40 50 60 70
TEMPERATURE (FO)
,S II I
\ I
,I ,I
,5 I
\ II
, 10 .- ,,
-- /.' .- , I
I
:::r: , , t-el. 15
I /. ~.
, w ~ ..... /
~~Cl .....- .... ,/' ~
.:~. /.. :;....--~~~
~
, ~~
3 6 9 12
DISSOLVED OXYGEN (mg/I)
-------- 3/26/81 -. _. - 6/26/81 --- 7/30/81 .............. 8/24/81 --- 3/10/82
25
20 / ,, / , ,
I ,
/ /,25
I J I J J I J J
TABLE 6. RESULTS OF WATER QUALITY ANALYSES -DUDLEY POND e -0 ..... M
+-) E ttl u 0 -' e e 0 0·.....
...... +-) +-) 0. ttl·..... +-)~
(/')u VI
<LI<LI r-O 0. E-o ttl e
(/') ttl
e 0 ......
+-) u <LI r-r0
U
40
<LI+-) ttl
0
--I..J... 0 ........ <LI ~ ::::l +-) ttl ~
<LI 0. E <LI ~
~ e <LI en >, X
0
-0 <LI > r0 VI VI ......
0 :::I: 0.
~ VI ::::l ~
0 £ 0. VI 0
£ 0...
rttl
+-) 0 ~
~ VI ::::l ~
0 d:: 0. VI 0
£ 0. 0
£ +-) ~
0
~ Z
I ttl ...... e 0 E
~
~ Z
I <LI
+-) ttl ~
+-) ...... z
~ z
I r.s:::. ttl
-0 r<LI
'r-")
~
~ ttl U ...... r...... (/)
E ~
0 4...... ~
r-~ o ttl u·.....
~ r-<LI ttl+-) UU <LIttl
I..J... co
...... u U 0 u 0
+-) 0. <LI~ ~~
+-) ttl (/') ......
~ r- <LI ttl +-) UU <LIttl
1.1... co
~ e 0 ~ .....
~ >,
+-) ...... e ...... rttl
.:>I:rex:
-+-) 4-->, U e <LI ~ ttl 0. VI e ttl ~
~
......... en E--ttl I
r-r>,
.s:::. 0. 0 ~ 0 r.s:::. u
-VI 4U--3 0 r-I..J...
1 - Surface
1981
1982
{3/266/26 7/31 8/24 3/10
41.0 71.0 73.0 70.0 34.0
12.5 7. 1 O. 01 6.3 7.2 0.03 7.9 7.6 <0.01 8.H 8.0 0.02 7.2 6.2 0.02
<0.01 <0.03 <0.01 <0.01
-
0.04 0.35 0.24 0.03 0.03 <0.01 0.03 <0.01 0.17 0.83
1.00 0.42 0.45 0.27 1.05
1.0 ----
a 3
) f
a 60 a 1 -
----
0.01
----
28.8
9.2 9.9 5.6 7.0 8.5
5.54 1.7 6.8 2.6
N m
- Middle (12 ft)
1981
1982
f/266/26 7/31 8/24 3/10
70.0 72.5 70.0 41. a
6.6 7.2 0.02 7.5 7.5 <0.01 3.0 7.2 0.03 6.6 6.3 O. 01
<0. 01 <0.01 <0.01
-
0.21 0.02 0.04 <0.01 0.03 <0.01 O. 18 0.67
0.23 0.33 0.24 0.78 - - - 0.01 31.6
1 - Bottom (24 ft)
1981
1982
{3/266/26 7/31 8/24
3/10
39.0 59.5 57 .a 57.0
41.0
5.3 2.3 2.0 0.4
0.4
7.4 6.8 6.6 6.5
6.2
0.02 0.07 0.05 0.04
0.03
<0.01 <0.01 <0.01 <0. 01
-
0.02 0.14 0.03 0.64
0.36
0.36 0.24
<0.01 <0. 01
0.52
0.90 1. 00 0.88 0.70
0.78
0.7
- - - 0.16 35.0
2 - Inlet f3/26 42.5 9.7 6.4 0.02 (East Cove) 6126 No Flow - Not Sampled
1981 7/31 No Flow - Not Sampled 8/24 No Flow - Not Sampled
* mg/1** colonies/lOa ml.sample (MF)
<0. 01 0.01 0.66 1.04 10 <10 0.24
The July and August water chemistry data for Dudley Pond reflect low concentrations of biologically available (inorganic) phosphorus and nitrogen throughout the epilimnion. Comparing the ratios of epilimnetic total nitrogen (N) versus total phosphorus (P) during July and August 1981 ,indicates that phosphorus was more often the limiting nutrient. The June 26th and August 24th N to P ratios at a depth of 12 feet however, indicate a time of uncertainty, when either one or both nutrients may have been limiting.
On March 10, 1982 the Pond was still ice covered and a temperature-oxygen profile revealed inverse thermal stratification. The dissolved oxygen concentration at the surface was 7.2 mg/l and declined to 6.2 mg/l at 15 ft. Oxygen measurements taken at 20 and 24 ft., yielded concentrations of 3.8 and 0.4 mg/l, respectively.
Chemical analyses performed on the water samples taken March lOth showed a total phosphorus level of 0.02 mg/l at the surface and 0.03 mg/l at 24 ft. Ammonia nitrogen near the bottom (24 ft.) was approximately two-fold the surface concentration while both nitrate and Kjeldahl nitrogen levels were actually higher at the surface. It was felt that late winter water quality data at Dudley Pond would be one useful method for examining the magnitude of internal nutrient recyc 1i ng. The water chemi stry data presented in Table 6 for March lOth are not indicative of a pond or lake characterized by a high internal phosphorus loading. Further discussion and quantitative estimates of phosphorus recycling at Dudley Pond are presented in section 5.2.
Other parameters analyzed during the 1981 water quality sampling program included: pH, silica, fecal coliform bacteria, fecal streptococci bacteria and iron.
The surface pH during the spring and summer rounds ranged from 7.1 to 8.0. Unlike many other ponds and lakes situated throughout eastern Massachusetts, the surface pH of Dudley Pond remains slightly on the alkaline side of neutral (7.0). The pH of the bottom or hypolimnetic waters was less than the surface readings which is normal for stratified ponds and lakes. Total alkalinity was not a parameter routinely analyzed. However, total alkalinity testing at Dudley reported by the Massachusetts Division of Water Pollution Control (DWPC) on October 2, 1979, revealed a concentration of 35 mg/l at the surface. Alkalinity analyses performed on the samples collected on March 10, 1982, showed a range in alkalinity of 28.8 mg/l at the surface to 35.0 mgl/l near the bottom. Alkalinity levels in this range are associate9 with weakly buffered, soft water ponds and lakes.
Fecal colifo~l and fecal streptococci bacteria analyses at station 1 (surface)exhibited very low densities during all four sampling rounds. This bacteriologic data for Dudley is, however,representative of the central well mixed portion of the Pond and may not reflect localized contamination which enters during storm events or from malfunctioning waste disposal systems. Nevertheless, gross contamination of the Pond from potentially pathogenic bacteria was not evidenced.
The intermittent brook which enters Dudley Pond along the southeastern shoreline, was sampled on March 26th, the only sampling round when flow was observed.
27
iiSi' Total and orthophosphorus concentrations were low, while on the other hand, elevated nitrate and Kjeldahl nitrogen levels were detected. Both fecal and total coliform bacteria counts were very low, well within the permissible Class B, Massachusetts Water Quality Standards currently in effect. (Massachusetts DWPC, 1978).
Comparison with Existing Data
Considerable in-lake water quality and biological data has been gathered at Dudley Pond in recent years, including work performed by Larkin (1979) as well as additional testing conducted by Arnold Green Testing Laboratories in 1978 and IEP Inc. in 1979, which is presented in the Larkin report. Both firms were under contract to the Wayland Board of Health. A baseline survey of Dudley Pond was performed by the Massachusetts Division of Water Pollution Control in October 1979. The most extensive limnological monitoring of Dudley Pond was performed by John Larkin during the summer of 1978. Between May 13th and August 28, 1978, he carried out temperature/oxygen profiles on seven different occasions, ranging in frequency from weekly to monthly. His studies at Dudley Pond also included the physical and chemical analyses of surface and bottom samples for pH, ammonia nitrogen, nitrate nitrogen, total phosphorus, manganese, iron and several additional parameters.
Between May 13th and June 29th 1978, Larkin performed five temperature/oxygen profiles, the results of which show the onset of thermal stratification. On June 29th, a 10°F decline in water temperature between the Pond surface and bottom was recorded, however measurements at intervals between these two depths apparently were not taken. The dissolved oxygen content at 28 ft. on June 29th, was 3.0 mg/l as compared to 11.5 mg/l at the Pond surface. On July 19, 1978, Larkin measured a temperature drop of 20°F from Pond surface to bottom. Between 15 and 20 ft., a 13°F difference in temperature was observed and dissolved oxygen fell from 6.0 mg/l to 3.0 mg/l. Dissolved oxygen concentrations at 25 and 28 ft. were identical at 2.5 mg/l. The last of his temperature/oxygen profiles was performed on August 29, 1978. This profile was very similar to the July 29th series of measurements, however the formation of a thermocline between 15 and 20 ft. was even more pronounced. Larkin1s data show a sharp reduction in dissolved oxygen on August 29th, from 5.0 mg/l at 15 ft. to 1.0 mg/l at 20 ft. Oxygen measurements taken at 25 and 29 ft. revealed concentrations of 1.0 and 0.8 mg/l, respectively.
Comparisons between John Larkins temperature-oxygen data and that taken by IEP, Inc. during 1981 reveal a similar pattern of temperature-oxYgen stratification. During mid to late summer, a well defined thermocline was shown to form between the depths of 15 and 20 ft. Both studies reveal dissolved oxygen concentrations near the bottom of the Pond of 2.0 mg/1 through the end of July, but declining to less than 1.0 mg/l by late August.
Larkin reported an average total phosphorus concentration at Dudley Pond of 0.03 mg/l based upon a composite sample tak81from 28 different locations. No explanation however, is prOVided as to station location or sample depth. On JUly 10, 1978, chemical analyses performed on samples that he collected at the surface and bottom (Table 7) revealed an approximate 10 fold rise in ammonia nitrogen
28
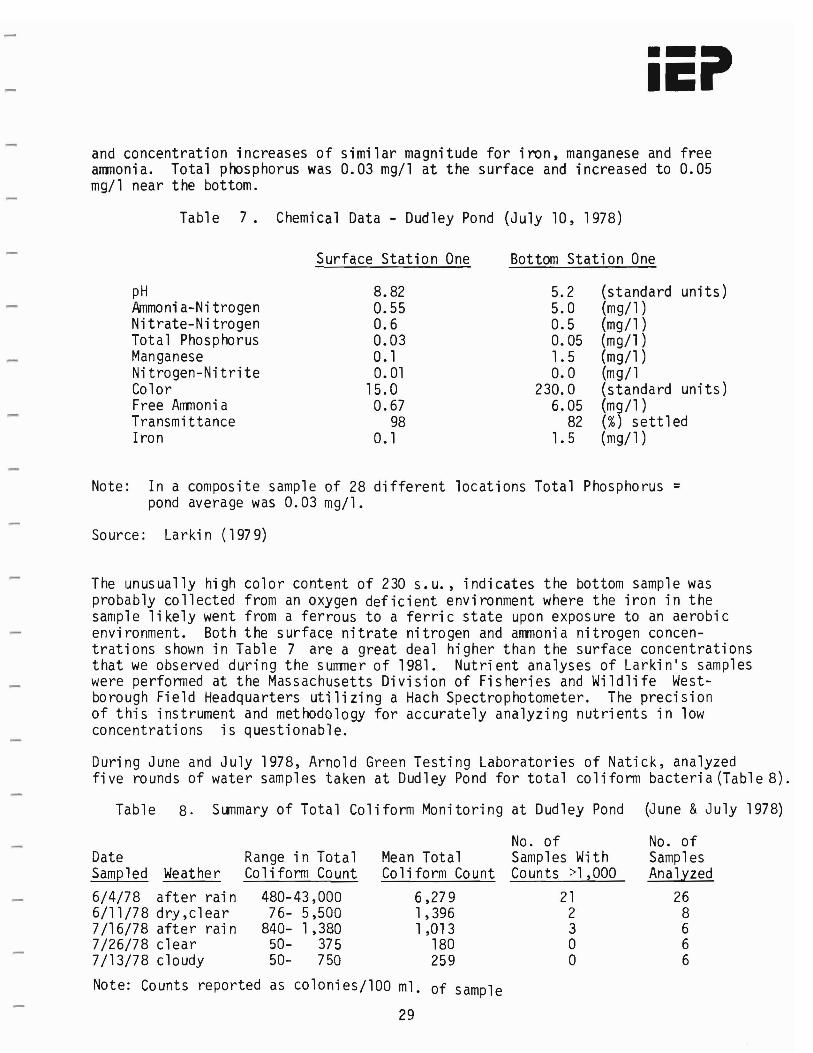
and concentration increases of similar magnitude for iron, manganese and free ammonia. Total phosphorus was 0.03 mg/l at the surface and increased to 0.05 mg/l near the bottom.
Table 7. Chemical Data - Dudley Pond (July 10,1978)
Surface Station One Bottom Station One
pH A/Tlmoni a-Ni trogen Nitrate-Nitrogen Total Phosphorus Manganese Ni trogen-Nitrite Color Free Ammonia Transmittance
8.82 0.55 0.6 0.03 O. 1 0.01
15.0 0.67
98
5.2 5.0 0.5 0.05 1.5 0.0
230.0 6.05
82
(standard units) (mg/l) (mg/l) (mg/l) (mg/l ) (mg/l (standard units) (mg/l) (%) settled
Iron O. 1 1.5 (mg/l)
Note: In a composite sample of 28 different locations Total Phosphorus = pond average was 0.03 mg/l.
Source: Larkin (1979)
The unusually high color content of 230 s.u., indicates the bottom sample was probably collected from an oxygen deficient environment where the iron in the sample likely went from a ferrous to a ferric state upon exposure to an aerobic envi ronment. Both the surface ni trate ni trogen and arrrnoni a nitrogen concentrations shown in Table 7 are a great deal higher than the surface concentrations that we observed during the summer of 1981. Nutrient analyses of Larkin's samples were performed at the Massachusetts Division of Fisheries and Wildlife Westborough Field Headquarters utilizing a Hach Spectrophotometer. The precision of this instrument and methodology for accurately analyzing nutrients in low concentrations is questionable.
During June and July 1978, Arnold Green Testing Laboratories of Natick, analyzed five rounds of water samples taken at Dudley Pond for total colifonn bacteria (Table 8).
Table 8. SlJTImary of Total Coliform Monitoring at Dudley Pond (June & July 1978)
No. of No. of Date Range in Total Mean Total Samples With Samples Sampled Weather Colifonn Count Co 1i form Co unt Counts >1,000 Ana lyzed 6/4/78 after rain 480-43,000 6,279 21 26 6/11/78 dry,clear 76- 5,500 1,396 2 8 7/16/78 after rain 840- 1,380 1,013 3 6 7/26/78 cl ear 50- 375 180 o 6 7/13/78 cloudy 50- 750 259 o 6
Note: Counts reported as colonies/100 ml. of sample
29
iiCi' The Wayland Board of Health initiated the bacteria monitoring program at Dudley Pond in response to occasional high total coliform counts recorded during routine testing of the water performed at Mansion Beach. The data presented in Table 8,reveal very high total coliform counts on June 4,1978, when 26 sampl es were reportedly coll ected "after ra in. II Twenty one of the 26 sampl es exhibited total coliform counts exceeding 1,000 organisms/lOa ml of sample. Further sampling performed on June 11th and June 16th still revealed unusually high coliform counts but well below the values reported for June 4th. The final two rounds of coliform sampling showed total counts well within the Commonwealth's Class B standard.
30
3.2 Groundwater Quality
The water quality of groundwater surrounding Dudley Pond is directly related to the groundwater flow patterns into and out of the pond. Water budget calculations, based on surficial geologic conditions ~nd observed groundwater levels indicate that groundwater inflow (6.Q x 106 ft 3/yr) into the pond is large relative to surface water inflow (0.0 x 106 ft 3/yr). Groundwater sampling has been undertaken in order to quantify the nutrient concentrations in groundwaterentering the pond.
Two complete rounds of water samples were collected on July 2, 1981 and August 20, 1981 from the 13 near-shore well points and 2 domestic bedrock wells in order to evaluate groundwater quality. A third round of 5 samples, from well points #1,2, 3, 4, 10 &14 was taken on April 29,1982. The third round of samples was proposed because of the broad range in total phosphorus concentrations (0.01 0.05 mg/l) found in the first two sample rounds (Table 9).
The thirteen well points and two domestic well sampling locations are shown on Figure 4, Groundwater Samplinq Stations (map pocket). The static water level elevations shown for each date were measured prior to obtaining samples. Samples were obtained from the 2!" well points using either a pitcher pump or peristaltic pump. Wells which were relatively 'loose' and pumped freely were sampled using the pitcher pump. Each well was pumped for a period of 5-10 minutes to purge the well volume and obtain a representative water sample. Even with continued pumping,the water samples obtained were slightly to moderately turbid because of the suspended fine sand, silt, clay,and organic materials present. Every effort was made to obtain as clear a sample as possible. In areas where the wells were screened in relatively impermeable material, pumping using the pitcher pump was not feasible and the peristaltic pump was used. The peristaltic pump is a portable, manually operated suction lift pump with a lift capacity of 30 feet. Samples were obtained by lowering the plastic suction hose to the static water level and slowly pumping. Three to five well volumes were pumped out before a sample was obtained. All samples were kept refrigerated prior to being delivered to the testing laboratory.
The groundwater quality analyses appear to be indicative of both background conditions and of nearby septic system effluent sources. The well points were initially located where septic leachate plumes were estimated to not be discharqinq into the pond during the septic leachate detector survey. Well points #4, 5, 7, 11 had average concentrations of total nitrogen (measured as TKN+N0 3-), ammonia nitrogen,and/or total phosphorus which were substantially greater than the remaining samples:
Wells 4, 5, 7, 11 Remaining Wells
Tota1 Nit roqen Jlmmonia NitrogenTotal Phosphorus l
3.41 0.57 0.08
0.84 0.34 0.03
lnot includinq 7/2/81 samplinq date
31

i~iI Table 9. Results of Groundwater Qual; t.v Ana lvses - Dudlev Pond
Well Total Total Point No.
Date Sampled
Kjeldahl-N mg/l iter
Jlmmonia-N mg/l iter
Nitrate-N mg/l iter
Conduct i vity
Phosphorus mg/l iter
WPl 7/2/81 8/20/81 4/29/82
0.69 0.52 0.67
0.50 0.03 0.57
O.gg 0.00 0.05
295 250 348
0.43 0.01 0.02
WP2 7/2/81 8/20/81 4/29/82
0.45 0.64 0.25
0.29 0.29 0.10
0.00 0.00 0.03
270 250 307
0.21 0.03 0.02
WP3 7/2/81 8/20/81 4/29/82
0.75 1.0 0.81
0.38 0.79 0.14
0.00 0.00 0.14
210 260 276
0.55 0.01 0.02
WP4 7/2/81 8/20/81 4/29/82
0.06 0.14 0.10
0.05 0.11 0.08
0.90 0.90 1. 27
130 115 191
0.09 0.02 0.01
WP5 7/2/81 8/20/81
1.00 1. 40
0.83 0.88
5.00 5.60
400 380
0.36 0.20
(deep) WP6 7/2/81 8/20/81
0.32 0.64
0.30 0.30
0.20 0.00
380 340
0.18 0.16
(shallow) WP7 7/2/81 8/20/81
2.10 2.20
1.84 1. 10
0.00 0.10
380 340
0.15 0.06
WP8 7/2/81 8/20/81
1. 40 0.68
0.14 0.05
0.00 0.10
370 250
0.15 0.02
WP9 7/2/81 8/20/81
0.65 1. 00
0.52 0.56
0.10 0.00
230 200
0.15 0.02
WP10 7/2/81 8/20/81 4/29/82
0.35 0.84 0.24
0.34 0.27 0.17
0.00 0.20 0.03
260 240 318
0.10 0.02 0.02
WPll 7/2/81 8/20/81
0.24 0.34
0.18 0.06
3.30 6.10
360 340
0.04 0.02
WP12 7/2/81 8/20/81
0.50 1. 10
0.46 0.64
0.00 0.10
290 250
0.07 0.10
WP13 7/2/81 8/20/81
0.97 1. 70
0.91 1. 00
0.00 0.00
280 250
0.06 0.14
WP14 4/29/82 0.84 0.35 0.18 2540 0.01
010/1 7/2/81 8/20/81
0.06 0.02
0.05 0.02
3.40 1. 80
290 400
0.01 0.01
OW2 7/2/81 8/20/81
0.06 0.02
0.04 0.02
6.10 1. 60
430 275
0.08 0.01
OW : Domestic Well WP = Well Point
Mean 7/2/81 8/20/81 4/29/82
0.64 0.82 0.48
0.46 0.41 0.23
1. 33 1. 10 0.28
305 276 288 1
663 2
0.18 0.06 0.02
Overall 0.65 0.37 0.90 290 0.09 lnot including WP14 lincluding WP14
32
iiCi' Although the water quality results are not conclusive, wells 4, 5, 7 and 11 are believed to be representative of areas where nearby septic system nutrient sources have affected groundwater quality. Nutrient loadings into the pond were calculated using only the wells which indicate background conditions. Wells 4, 5, 7, and 11 were not included in the computation for groundwater nutrient loading. The elevated nutrient levels found in wells 4, 5, 7, and 11 are accounted for in the nutrient budget as septic system loadings.
Phosphorus
The marked difference in ohosphorus concentrations between the 7/2/81 samolinq round and the final two rounds is a result of the laboratory analytical method. The first round of samples (7/2/81) were not filtered prior to analysis. Thus~ phosphorus adsorbed and mineralized onto the sediment in the sample was included in the analysis. The final two sample rounds were filtered to remove all suspended sediment prior to analysis. The final two sample rounds on 8/20/81 and 4/29/82 show a much lower phosphorus concentration than the first round (0.04 vs. 0.18, respectively). This difference is evidence of the ability of some soils to attenuate phosphorus. Phosphorus is not readily mobile in groundwater. In fact, it is readily attenuated in some soils. Phosphorus can be removed by several mechanisms: rapid removal or sorption, slow mineralization and insolubilization, plant uptake and biological immobilization (Tofflemire and Chen, 1977). Phosphates form insoluble precipitates with iron, aluminum and calcium compounds in soil and then do not move in the soil percolate. The sand and gravel glacial deposits surrounding Dudley Pond have a finite capacity to adsorb and attenuate phosphorus. Sand and gravel outwash soils have been estimated to have phosphorus sorption capacities ranging from 9-20mg P/100g soil (Sawhney and Hill, 1975, Tofflemire and Chen, 1977). Once the total sorption capacity is reached, the phosphorus continues to move through the groundwater system and into the pond.
To estimate the background concentration of phosphorus in groundwater entering the pond only the filtered sample results from 8/2/81 and 4/29/82 were used. Results for wells 4, 5, 7 and 11 were not used. The background phosphorus concentration in the groundwater entering Dudley Pond was calculated to be 0.03mg/l .
Nitrogen
The assumption of no attenuation or uptake of nitrogen in the vicinity of septic systems is not valid, but represents a worst case condition. Many researchers have found qualitative evidence for nitrate uptake by several mechanisms. Soluble nitrate in groundwater emanates from·a leach field by dilution and dispersion. On Long Island, researchers have found that a return to normal background levels of nitrate occurs within 50 to 150 feet of the absorption field (Long Island Regional Planning Board, 1978). Denitrification in freshwater marshes has been found to be responsible for removing 3.5 kg N/hectare (of wetland) per day (Englerand Patrick, 1974). Bartlett, et.al. (1978) found that 90-95% of the nitrate added to wetland soil-water suspensions was reduced to nitrogenous gases. Importantly, their work was conducted in a Massachusetts wetland. The wetland muck soils beneath the stream inlet can be expected to attenuate a considerable amount of nitrate.
33

Location 19 exhibited relatively high levels of nitrate nitrogen and total phosphorus. This area is a shallow cove with seemingly poor water circulation. Thus, any septic system effluent leaching into this area may persist for some time. This area also reflected high background readings of conductivity and fluorescence. This is a common phenomenon associated with large shallow areas in ponds, perhaps caused by windblown particles or algae that may build up in a stagnant area.
Location 21 denotes high values for total Kjeldahl nitrogen, ammonia··nitrogen, conductivity, and total phosphorus. This plume is unique in that it is located at the mouth of the only brook which enters Dudley Pond, in the southeast cove. The brook flowsthrough a swamp in which several nearby residences have septic systems that would leach towards this area. Two groundwater test wells were analyzed at this location which confirm elevated values for the above mentioned parameters. Overall, the high nutrient levels in plume 21 appear to be due to the combination of nutrient leaching from wetland soils, surface runoff from the inlet tributary and possibly the occurrence of faulty septic systems upstream of the inlet.
Locations 24, 25 and 26 are located in close proximity to each other in the far western cove. Elevated counts of bacteria and phosphorus levels were encountered in these areas. Plume 25 revealed total and fecal coliform counts which greatly surpass the Commonwealth's Water Quality Standards for Class B waters. Following a cursory site inspection by William Domey and Gerald Smith, it was concluded that the septic systems at these locations did not indicate any sewage overflow. However, this particular area has very steep banks along the shoreline with sand and gravel glacial deposits which may not allow percolating wastewater sufficient time for bacteriological breakdown or nutrient adsorption.
42
3.4 Stormwater
Nutrients and bacteria can enter waterbodies in a variety of ways, one of which is through a network of surface and underground storm drains and catchbasins. This network removes surface runoff of stormwater from all types of precipitation events throughout the course of a year. In evaluating the sources of both nutri ents and bacteria entering Dudley Pond, one such consideration was the annual loading contributed to the Pond by stormwater. In order to provide the raw data necessary for calculations of nutrient and bacterial loadings to the Pond from specific land areas served by storm drains (section 2.4) a stormwater sampling program was implemented.
The first procedure in the design of a stormwater sampling program is to locate the storm drain outfalls and delineate the drainage area to each outfall. The Dudley Pond drainage basin is an area of diverse land use types which include forested areas, fields, wetlands and dense suburban areas, as seen in Figure 6 (map pocket). Normally.much of the water falling on the surface of the ground during a precipitation event would be absorbed by soils and subsurface deposits, with a low percentage of direct surface runoff which could not be taken up by the ground at that time. However, with the advent of roads, driveways, roofs, and other surfaces impervious to water, the sudden large quantities of water which occur during a storm that cannot be absorbed by the ground must be captured and diverted to a collection system to prevent the potentially severe effects of erosion and flooding. The dense residential development found around the periphery of Dudley Pond necessitates the presence of an effective storm drainage network.
Twelve storm drains with pipes discharging directly into Dudley Pond were identi fied throughout the watershed. Of these 12 sites, four stations were selected for intensive sampling, station nos. 4, 5,8 and 11. It was felt that these four drains would provide a representative cross-section of the stormwater quality entering Dudley Pond, taking into account such factors as land use, hydrogeologic characteristics and surface area served by each drain. Other drains located around the Pond's periphery were also sampled during each of the two storm events. The individual grab samples collected at each station were composited into one sample per station, in proportion to flow. It should be noted that no flow was observed during either storm event at station nos. 1, 2 and 10. The intermittent brook which enters Dudley Pond along its southwestern shoreline did not flow at all during or after the storm of October 1, 1981 and displayed minimal flow during the mid-summer storm event (July 20, 1982).
Considering the budgetary, manpower and time constraints, it was felt that two storms with different duration and intensity characteristics would provide a reasonable overview of stormwater quality entering Dudley Pond. Admittedly, however, monitoring of additional storm events over four seasons would have been desirable, yet it is seldom performed in most diagnostic/feasibility studies given the above constraints. At Dudley Pond, site specific or measured storm~ater quality data was combined with accepted literature values for phosphorus and nitrogen export coefficients to determine total annual loadings. The first storm occurred on October 1 and 2, 1981, was of moderate intensity and was a moderate duration storm which followed a long antecedent dry period. Weather
43

iiEi» Bureau statistics recorded at Bedford for this storm, indicate that the storm started at 3:42 p.m. on October 1, with the rain ending at some time approximately 35 minutes past midnight of October 2. IEP field personnel recorded that precipiation at Dudley Pond actually continued beyond 2:00 a.m. of October 2, and it was not until approximately 11 :30 p.m. on October 1 that first flush conditions were apparent. It is this first flushing of the stormwater removal network which is crucial in sampling. The nutrient build-up and concentrations of bacteria which can occur during periods prior to their removal from the system, can be indicative of problem prone areas which can then be analyzed and assessed, based upon results obtained from these sampling programs. This storm delivered a total of 0.83 inches of rainfall upon its completion, 0.18 inches of which fell on October 1 and the remaining 0.65 inches on October 2 (National Weather Bureau Service, 1982, personal communication). The different characteristics of the two storms is best noted by the fact that on July 20, 1982, the date of the second storm sampling, 1.78 inches of rain fell during its relatively brief duration. The storm had started at 7:30 a.m. July 20, 1982, again preceded beforehand by a long antecedant dry period. The rain ended at Dudley Pond at approximately 9:45 a.m. IEP field personnel recorded that first flush observations were only 37 minutes (8:07 a.m.) after the onset of first rainfall.
The water quality test results, flows and nutrient loadings per unit area, contri buted to Dudley Pond during each of the two storms, are presented in Tables 12 and 13. Total annual phosphorus loadings and their significance to the overall nutrient budget of the Pond are discussed in greater detail in section 5.1.
Compared on a unitized basis (gm/acre), storm drain station nos. 4, 7 and 9 displayed especially high values for total phosphorus during both events. The predominant land-use type in these areas is dense suburban. Concentrations of total phosphorus in both the individual grab samples and composited samples were also high at the other stations that were monitored. Levels of total phosphorus, 4 to 10 times in excess of the generally accepted in-lake permissible concentrations, were the norm, rather than the exception.
Both the total and fecal coliform counts were high at almost all of the sampling stations, exceeding the Commonwealth's Class B guideline of 1,000 colonies/100 ml for total coliform and the 200 colonies/100 ml criteria for fecal coliforms. The high bacteriological densities and loadings were observed during both storms.
Total and fecal coliforms, in addition to fecal streptococci bacteria, were analyzed in the July 20th round of samples. Fecal coliform (FC) to fecal streptococci (FS) ratios were less than 4.4 at station nos. 3, 4, 6 and 8, which according to some researchers, implies animal wastes as the primary contributor to the fecal wastes rather than man. At sites 5, 7 and 12, the FC to FS ratios ranged between 4.8 to 13.2 implying fecal contamination of human origin. The FC to FS ratios for the two grab samples taken at station 12 revealed a wide disparity, rendering an assessment of the bacteriological origin impossible.
Field reconnaissance of the contributory drainage areas to each storm drain did not reveal information that would help to define the origin/sources of the bacteriological contamination. No evidence of septic leachate break-out on the ground surface was apparent. No farms or dense concentrations of livestock
44

Table 12
Phosphorus, Nitrogen, and Fecal Coliform Loading From Stormwater, October 1 and 2, 1981
Station/ Sample
Discharge cfs
Total Phosphorus C LR L
mg/l gm/hr gm/ac
Tota 1 Nitrogen C LR L
mg/l gm/hr .mn/ac
Feca1 Coli form C LR
#/l00 ml . #xl0 6 /hr L
#xl0 6 /ac
3 0.028 0.04 O. 114 0.39 O. 18 0.51 1. 76 <10 0.14 0.48
4A 48 4C 4 mean
0.201 0.802 0.134
0.14 0.25 0.09
2.869 20.441 1.230 8.18 3.15
0.94 0.82 0.75
19.26 67.05 10.25 32.19
. 13.82
130 460
1280
26.7 376.3 175.0 192.7 82.70
SA 58 5C 5 mean
0.007 0.067 0.007
O. 12 0.50 1. 30
0.086 3.415 0.928 1.476 1.72
0.48 0.46 0.25
0.34 3.14 0.18 1. 22 1. 42
420 2420 2300
3.0 165.4 16.4 61.6 71.91
~ <n
6 0.184 1. 70 31.890 65.98 3. 16 59.28 122.65 17700 3321. 9 6872.9
7 0.068 0.70 4.853 25.32 1.05 7.28 37.98 2160 149.8 781.6
8A 88 8C 8 mean
0.669 1.070 0.669
0.25 O. 18 0.09
17.051 19.636 6.138
14.275 2.72
0.84 1.02 0.37
57.29 111. 27 25.24 64.60 12.30
13400 870
7500
9143.9 949.5
5117.8 5070. 1 965.7
9 0.051 0.19 0.988 39.52 0.42 2. 18 87.2 14100 733.5 29340
llA 118 llC 11 mean
0.007 0.167 0.0
0.20 0.06 0.11
0.143 1. 022 0.0 0.388 0.87
2.23 0.34 0.59
1.59 5.79 0.0 2.46 5.51
60000 <10
110000
428.4 0.85 0.0
143.1 320.4
12 0.026 0.10 0.265 0.28 0.49 1. 30 1. 36 1410 37.4 39.03
C = concentration, milligrams/liter LR = loading rate, grams/hour L = total storm loading, grams/acre of drainage area

Table 13
Phosphorus, Nitrogen, and Fecal Coliform Loading From Stormwater, July 20, 1982
Station/ Sample
Discharge cfs
Total Phosphorus C LR L
mg/1 gm/hr gm/ac
Total Nitrogen C LR L
mg/1 gm/hr gm/ac C
#/100 m1
Feca1 Coli form LR
#x10 6 /hr L
#x10 6 /ac
3A 0.033 0.05 0.168 3.45 11.60 2000 67.29 38 0.130 0.02 0.265 8.54 113.18 8000 1060.30 3(Mean) 0.04 0.216 0.202 62.39 58.45 563.80 528.16
4A 0.401 0.35 14.31 7.30 298.44 134000 54782.89 48 0.500 0.80 40.78 7.98 406.78 27000 13763.21 r,
.'
4(Mean) 0.58 27.54 3.21 352.61 41. 11 34273.21 3996.09
5A 0.033 0.20 6.73 6.26 21.06 726000 24425.66 58 0.066 0.10 0.67 8.78 59.08 393000 26444.31 5(Mean) O. 15 3.7 1. 17 40.07 12.90 25434.98 8065.96
6A 0.033 0.20 0.67 5.58 18.77 1452000 48851.32 ~ (J) 68
6(Mean) 0.130 0.50
0.35 5.76 3.21 1.81
7.76 804.38 406.57 228.52
1238000 164081.55 106466.44 59841. 48
7A 0.066 0.65 4.37 3.00 20.18 738000 49658.78 7B O. 130 0.25 3.31 2.86 37.90 274000 36315.31 7(Mean) 0.45 3.84 5.44 29.04 41. 16 42987.05 60929.46
8A 0.133 0.50 6.78 2.00 27.11 TNTC 8B 0.200 0.30 6.11 0.88 1. 79 30000 6117.12 8(Mean) 0.40 6.44 0.33 14.45 0.75
9A 0.013 1. 60 2.12 3.70 4.90 369000 4890.63 9B 0.044 0.40 1. 79 3.77 16.91 22000 986.90 9(Mean) 1.00 1. 95 21. 19 10.90 118.45 2938.77 31934.63
12 0.013 0.55 0.73 0.21 3.62 4.79 1.36 476000 6308.79 1788.40
Wet1 and A 0.011 0.10 0.11 3.88 4.35 10000 112.15 Wetland 8 0.011 0.30 0.33 3.48 4.90 4.13 57000 639.24 Wet1and(Mean) 0.22 0.06 375.70 100.39

are domiciled within the watershed, to the best of our knowledge. Fecal material from pets (largely cats and dogs) and fecal wastes contributed by animals living in the storm drain network are other probable sources of contamination described in the literature.
The storm event of October 1 and 2, 1981 contributed a greater unit/area (gm/ac) loading of phosphorus to Dudley Pond than did the July 20th event. Phosphorus concentrations were not necessarily the highest in those samples collected during the first flush. At many of the sampling stations observed peak flows scoured debris/sediments from the streets and transported this nutrient-laden material to the drains. In this manner, the dilution from increased water flow did not off-set the mass of nutrients carried with the water.
47
3.5 Aquatic Vegetation and Plankton
Dudley Pond has and is experiencing an acceleration of the natural lake aging process known as eutrophication. The most obvious symptom of this problem is the rapid increase of aquatic vegetation and algae throughout the Pond. Most recently, the densities of macrophytes in Dudley Pond have interfered with recreational usage of the Pond. Being an important fishing, boating and swimming resource to the Town of Wayland and surrounding communities, the premature succession of Dudley Pond noted during recent years prompted this diagnostic/ feasability study.
Prior to the 1960 1 s, aquatic plant growth throughout Dudley Pond was reportedly sparse (Larkin, 1979). Gradually, with an increase of nutrients and transition from a sandy substrate to more muck/silt type sediments, waterlilies and other aquatic plants became established in the shallow coves. Through clogging of outboard motors and interference to public bathing, the aquatic vegetation became a serious nuisance to recreationists utilizing Dudley Pond (Larkin, 1979).
The Wayland Department of Parks and Recreation in cooperation with the Massachusetts Department of Environmental Quality Engineering (DEQE) initiated a program of herbicide treatment at Dudley Pond in 1968, to help control the increasing densities of aquatic weeds. Below is a listing of the years treatment(s) occurred and the chemicals applied.
1968 - Reported treatment. No Data. 1970 - 63 gallons of Silvex (Kuron, 245 TP);
140 gallons of Diquat; 504 pounds of Copper Sulfate.
1974 - 26 gallons of Silvex or 0.5 ppm per 13 acres; 43 gallons of Aquathol-K or 0.5 ppm, unspecified areas.
1976 - 840 pounds of Aquazine (Geigy Co.); 14 gallons of Silvex, scattered treatment.
1977 - Reported treatment. No Data. 1978 - 500 pounds of Aquazine. Source: Larkin (1979)
It should be noted that Dudley Pond may have been chemically treated during other years, however, there is no record of such. There may also have been herbicide treatment conducted by private citizens, however, this information has not been recorded (Larkin, 1979).
In 1978, John Larkin, an independent water technologist for the Town of Wayland, performed several vegetation surveys at Dudley Pond. Larkin's surveys and data show widespread marcophytic growth throughout the more shallow northeast and southeast coves of Dudley Pond. Along much of the northern and western shoreline, plant growth was scattered. Virtually no weed growth is indicated on his mapsadjacent to the south/southeastern shoreline of the Pond. Seven species of macrophytes were identified by Larkin. Curly leaf pondweed (PotalTlogetoncrispus was the most widespread, occurring throughout the shallow .
48
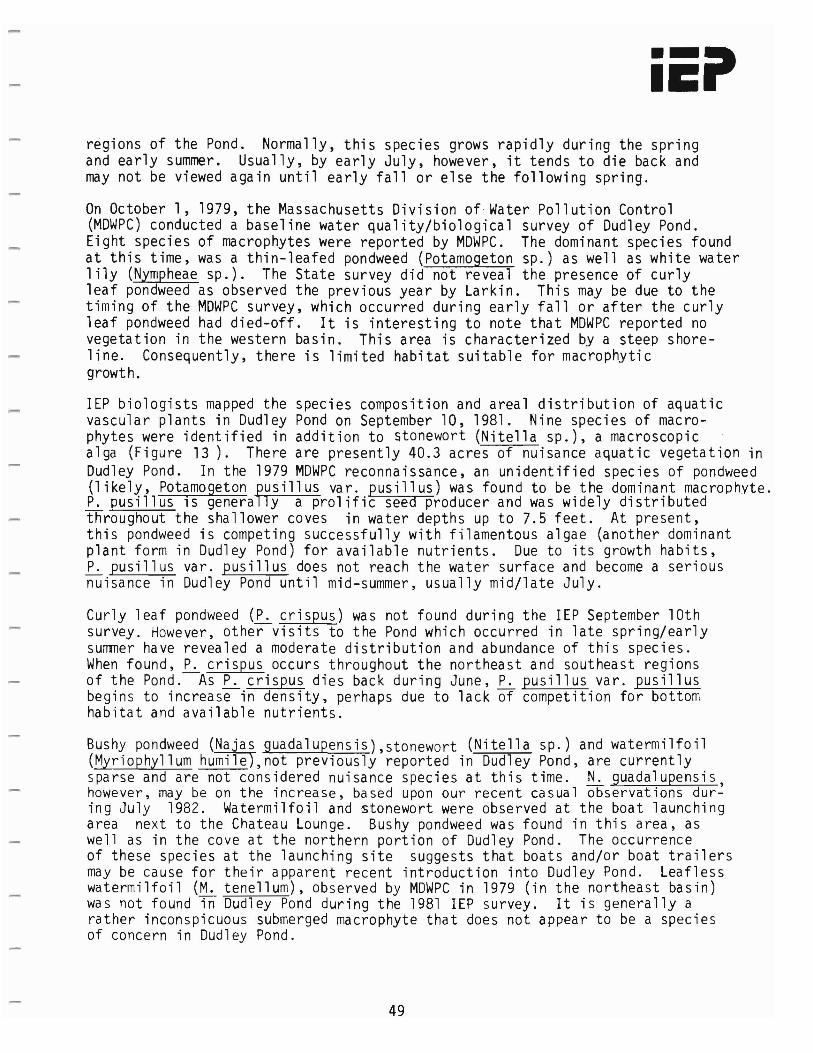
regions of the Pond. Normally, this species grows rapidly during the spring and early summer. Usually, by early July, however, it tends to die back and may not be viewed again until early fall or else the following spring.
On October 1, 1979, the Massachusetts Division of Water Pollution Control (MDWPC) conducted a baseline water quality/biological survey of Dudley Pond. Eight species of macrophytes were reported by MDWPC. The dominant species found at this time, was a thin-leafed pondweed (Potamogeton sp.) as well as white water lily (Nympheae sp.). The State survey did not reveal the presence of curly leaf pondweed as observed the previous year by Larkin. This may be due to the timing of the MDWPC survey, which occurred during early fall or after the curly leaf pondweed had died-off. It is interesting to note that MDWPC reported no vegetation in the western basin. This area is characterized by a steep shoreline. Consequently, there is limited habitat suitable for macrophytic growth.
IEP biologists mapped the species composition and areal distribution of aquatic vascular plants in Dudley Pond on September 10,1981. Nine species of macrophytes were identified in addition to stonewort (Nitella sp.), a macroscopic alga (Figure 13). There are presently 40.3 acres of nuisance aquatic vegetation in Dudley Pond. In the 1979 MDWPC reconnaissance, an unidentified species of pondweed (likely, Potamogeton fUSillus var. pusillus) was found to be the dominant macrophyte. ~ pusillus 1S genera ly a prolific seed producer and was widely distributed throughout the shallower coves in water depths up to 7.5 feet. At present, this pondweed is competing successfully with filamentous algae (another dominant plant form in Dudley Pond) for available nutrients. Due to its growth habits, ~ pusillus var. pusillus does not reach the water surface and become a serious nuisance in Dudley Pond until mid-summer, usually mid/late July.
Curly leaf pondweed (~crispus) was not found during the IEP September lOth survey. However, other visits to the Pond which occurred in late spring/early summer have revealed a moderate distribution and abundance of this species. When found, ~ crispus occurs throughout the northeast and southeast regions of the Pond. As ~ crispus dies back during June, ~ pusillus var. pusillus begins to increase in density, perhaps due to lack of competition for bottom habitat and available nutrients.
Bushy pondweed (Najas guadalupensis),stonewort (Nitella sp.) and watermilfoil (Myriophyllum humile),not previously reported in Dudley Pond, are currently sparse and are not considered nuisance species at this time. ~ guadalupensis,however, may be on the increase, based upon our recent casual observations during July 1982. Watermilfoil and stonewort were observed at the boat launching area next to the Chateau Lounge. Bushy pondweed was found in this area, as well as in the cove at the northern portion of Dudley Pond. The occurrence of these species at the launching site suggests that boats and/or boat trailers may be cause for their apparent recent introduction into Dudley Pond. Leafless watermilfoil (M. tenellum), observed by MDWPC in 1979 (in the northeast basin) was not found m Dudley Pond during the 1981 IEP survey. It is generally a rather inconspicuous submerged macrophyte that does not appear to be a species of concern in Dudley Pond.
49

Winneberger (1982) gives a summation of approximate quantifications of the nitrogen cycle:
Septic-Tank Effluent: 1'V24 lb N/dwelling/yr - Nitrogen Fixation: I'V 2 to ~ 500 lb N/acre/yr (leaching of
fixed nitrogen: few quantifications) Fertilizer Leaching: ~ 0 to ~ 200 lb N/acre/yr
- Rainfall: rv 4 to rv 12.5 lb N/acre/yr (runoff or leaching: few quantifications)
So il Store s: "-/ 4000 to /V 200,000 1b N/acre (red !Jct ion in soil stores from disturbances during the first few yea rs: ,y 80 to ,y 4000 1b N/acre/yr)
Denitrification of Percolates: '\./ 0 to 'V all percolate contents Plant Uptake: few quantifications.
From this table it can be seen that the nitrate loadings from a septic tank are small in comparison with the amounts taken up and stored in soils and nitrogen fixation.
Winneberger's (1982) conclusion regarding nitrogen and septic systems is that lithe nitrogen contributions of septic systems are dwarfed by the uncertainties of quantifications of the nitrogen cycle itself."
Two well points (6, 7) were driven at two depths in the tributary inlet to the pond to determine if any vertical variability in nitrogen groundwater quality exists. The tributary inlet is underlain by 3.5 feet of organic rich sediment. Well point 6 was driven 6.2 feet deep and was screened in sand and gravel. Well point 7 was driven 3.3 feet deep into the muck sediments. Water samples obtained in the muck sediments show significantly higher total Kjeldahl-N and ammonia-N concentrations (2.15 and 1.47 mg/l) than the deeper sand and gravel material (0.48 and 0.30 mg/l). Nitrification, or the conversion of nitrogen containing compounds (in the form of organic and ammonia-nitrogen) to nitrate is inhibited in soils which contain an abundance of oxidizable organics. This occurs in the muck sediments at the tributary inlet. An additional well located in organic soils at another location would have been beneficial.
Following discharge from a septic leaching field the nitrogen compounds are converted to nitrite by Nitrosomas bacteria and from nitrite to nitrate by Nitrobacter spp. Wells such as WP9 are examples of locations where the conversion has not completely occurred. Conversely, WP4 is an example of a location where the distance from the septic leach field was sufficient to allow almost complete conversion of organic and armnonia nitrogen to nitrate nitrogen.
The total nitrogen loading for groundwater entering Dudley Pond was calculated using the previously described representative background wells. The average total nitrogen concentration was determined to be 0.84 mg/l, with TKN=0.67 mg/l and nitrate = 0.17 mg/l. The background nitrate nitrogen concentration of 0.17 mg/l is within cited ranges. Perlmutter and Koch (1972) estimate the natural level of nitrate-N fin groundwater to be less than or equal to 0.20 mg/l.
In summary, the background phosphorus and total nitrogen concentrations for groundwater entering Dudiey Pond are 0.03 mg/l and 0.84 mg/l, respectively.
34
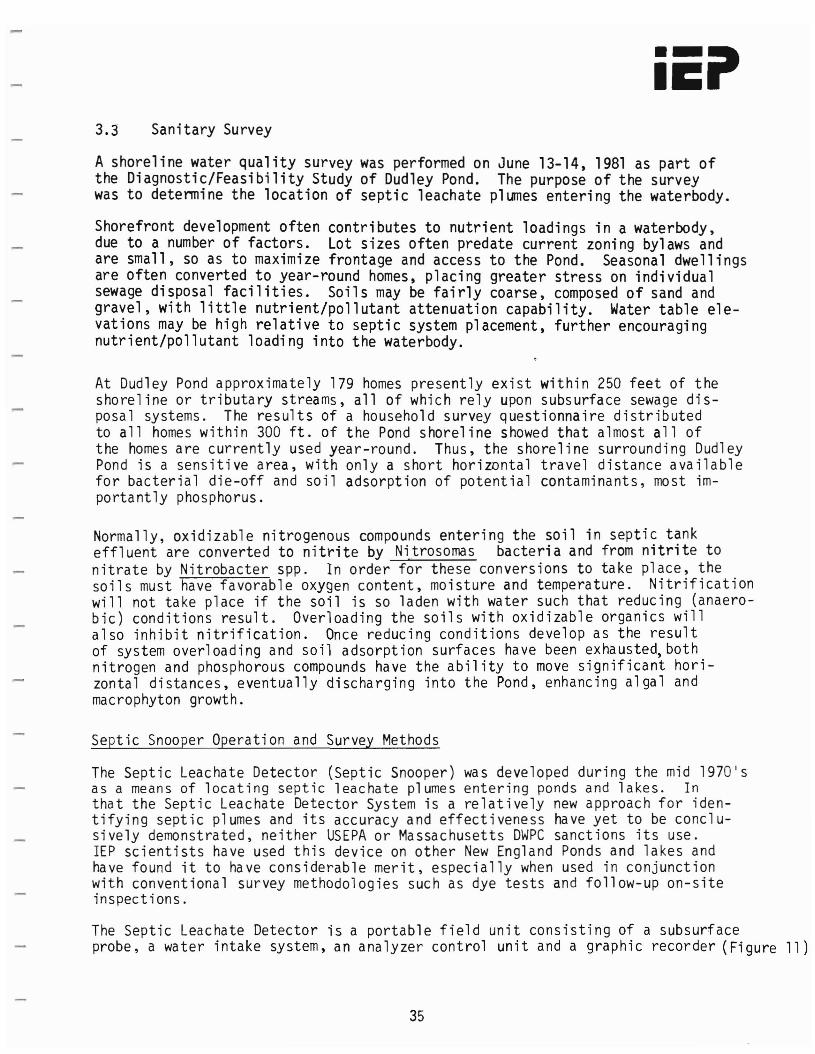
3.3 Sanitary Survey
A shoreline water quality survey was performed on June 13-14, 1981 as part of the Diagnostic/Feasibility Study of Dudley Pond. The purpose of the survey was to determine the location of septic leachate plumes entering the waterbody.
Shorefront development often contributes to nutrient loadings in a waterbody, due to a number of factors. Lot sizes often predate current zoning bylaws and are small, so as to maximize frontage and access to the Pond. Seasonal dwellings are often converted to year-round homes, placing greater stress on individual sewage disposal facilities. Soils may be fairly coarse, composed of sand and gravel, with little nutrient/pollutant attenuation capability. Water table elevations may be high relative to septic system placement, further encouraging nutrient/pollutant loading into the waterbody.
At Dudley Pond approximately 179 homes presently exist within 250 feet of the shoreline or tributary streams, all of which rely upon subsurface sewage disposal systems. The results of a household survey questionnaire distributed to all homes within 300 ft. of the Pond shoreline showed that almost all of the homes are currently used year-round. Thus, the shoreline surrounding Dudley Pond is a sensitive area, with only a short horizontal travel distance available for bacterial die-off and soil adsorption of potential contaminants, most importantly phosphorus.
Normally, oxidizable nitrogenous compounds entering the soil in septic tank effl uent are converted to nitrite by Nitrosornas bacteri a and from nitri te to nitrate by Nitrobacter spp. In order for these conversions to take place, the soils must have favorable oxygen content, moisture and temperature. Nitrification will not take place if the soil is so laden with water such that reducing (anaerobic) conditions result. Overloading the soils with oxidizable organics will also inhibit nitrification. Once reducing conditions develop as the result of system overloading and soil adsorption surfaces have been exhausted,both nitrogen and phosphorous compounds have the ability to move significant horizontal distances, eventually discharging into the Pond, enhancing algal and macrophyton growth.
Septic Snooper Operation and Survey Methods
The Septic Leachate Detector (Septic Snooper) was developed during the mid 1970's as a means of locating septic leachate plumes entering ponds and lakes. In that the Septic Leachate Detector System is a relatively new approach for identifying septic plumes and its accuracy and effectiveness have yet to be conclusively demonstrated, neither USEPA or Massachusetts DWPC sanctions its use. IEP scientists have used this device on other New England Ponds and lakes and have found it to have considerable merit, especially when used in conjunctionwith conventional survey methodologies such as dye tests and follow-up on-site inspections.
The Septic Leachate Detector is a portable field unit consisting of a subsurface probe, a water intake system, an analyzer control unit and a graphic recorder (Figure 11)
35

Figure 11
S EPTle LEACHATE DETECTOR SYSTEM
DISCHARGE AND SAMPLI NG HOSE
,/
ORGANICS PANEL METER
j STRIP CHART -_ ....._...__ ._- RECORDER
STRIP'loo"'''",, I f C",,,MiD ORGAN ICS__ RECORDERPIINEL 11ETER m
VJ l.-...l ", I \ \lUt:0 ·~BSl ~
'" '''LOG,I' COMPUTER .- /
/
CONDUC T IV ITY ~ f MS 1234PROBE AND __ I 1//
/
If 7INORGANICS PANEL METER t I \ / I JOHN BOAT
INORGANICS PANEL METER'
UIORGANICS SPAN/ZERO CONTROL1\ ","m >OLE
PUMP PROBE (INTAKE)
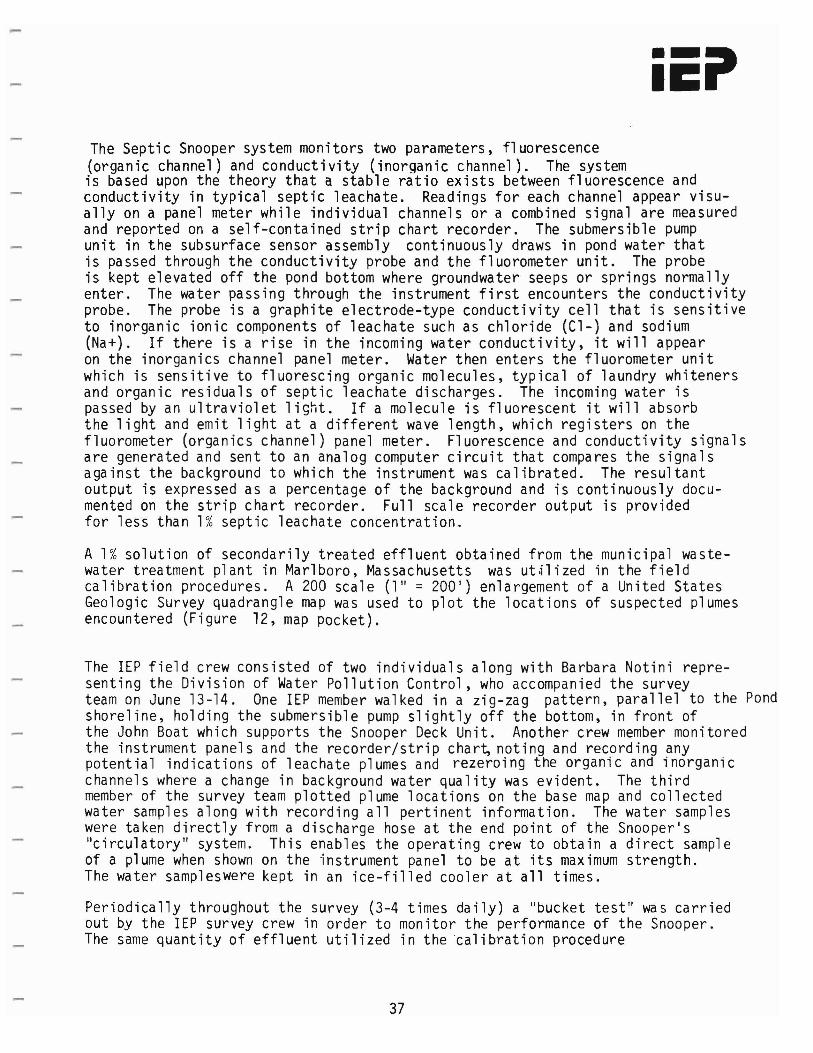
The Septic Snooper system monitors two parameters, fluorescence (organic channel) and conductivity (inorganic channel). The systemis based upon the theory that a stable ratio exists between fluorescence and conductivity in typical septic leachate. Readings for each channel appear visually on a panel meter while individual channels or a combined signal are measured and reported on a self-contained strip chart recorder. The submersible pump unit in the subsurface sensor assembly continuously draws in pond water that is passed through the conductivity probe and the fluorometer unit. The probe is kept elevated off the pond bottom where groundwater seeps or springs normally enter. The water passing through the instrument first encounters the conductivity probe. The probe is a graphite electrode-type conductivity cell that is sensitive to inorganic ionic components of leachate such as chloride (Cl-) and sodium (Na+). If there is a rise in the incoming water conductivity, it will appear on the inorganics channel panel meter. Water then enters the fluorometer unit which is sensitive to fluorescing organic molecules, typical of laundry whiteners and organic residuals of septic leachate discharges. The incoming water is passed by an ultraviolet light. If a molecule is fluorescent it will absorb the light and emit light at a different wave length, which registers on the fluorometer (organics channel) panel meter. Fluorescence and conductivity signals are generated and sent to an analog computer circuit that compares the signals against the background to which the instrument was calibrated. The resultant output is expressed as a percentage of the background and is continuously documented on the strip chart recorder. Full scale recorder output is provided for less than 1% septic leachate concentration.
A 1% solution of secondarily treated effluent obtained from the municipal wastewater treatment plant in Marlboro, Massachusetts was ut~lized in the field calibration procedures. A 200 scale (1" = 200') enlargement of a United States Geologic Survey quadrangle map was used to plot the locations of suspected plumes encountered (Figure 12, map pocket).
The IEP field crew consisted of two individuals along with Barbara Notini representing the Division of Water Pollution Control, who accompanied the survey team on June 13-14. One IEP member walked in a zig-zag pattern, parallel to the Pond shoreline, holding the submersible pump slightly off the bottom, in front of the John Boat which supports the Snooper Deck Unit. Another crew member monitored the instrument panels and the recorder/strip char~ noting and recording anypotential indications of leachate plumes and rezeroing the organic and inorganic channels where a change in background water quality was evident. The third member of the survey team plotted plume locations on the base map and collected water samples along with recording all pertinent information. The water samples were taken directly from a discharge hose at the end point of the Snooper's "circulatory" system. This enables the operating crew to obtain a direct sample of a plume when shown on the instrument panel to be at its maximum strength. The water sampleswere kept in an ice-filled cooler at all times.
Periodically throughout the survey (3-4 times daily) a "bucket test" was carried out by the IEP survey crew in order to monitor the performance of the Snooper. The same quantity of effluent utilized in the calibration procedure
37

w~sadded to a bucket containing five liters of water and the submersible pump. When the effluentwas added, a full scale deflection on both panel meters will indicate the Snooperwas properly functioning.
Upon completion of the field survey the water samples were taken by Barbara Notini to the Massachusetts Division of Water Pollution Control IS Lawrence Experiment Station for analyses.
Results and Discussion
Table 10 presents the results of the water quality analyses of 26 plume samples collected at Dudley Pond. The water samples were analyzed for seven parameters: total coliform bacteria, fecal coliform bacteria, ammonia nitrogen, nitrate nitrogen, total Kjeldahl nitrogen, total phosphorus, and conductivity.
The Massachusetts Division of Water Pollution Control (MDWPC, November 1978) utilizes the following criteria for assessing nitrogen and phosphorus concentrations in their statewide lake classification system (Table 11). Surface or epilimnetic ammonia (NH3) and nitrate nitrogen (N03-N) levels combined of 0- 0.15 mg/l, are assigned a severity point rating of O. On the opposite end of the scale, where ammonia plus nitrate exceeds 0.5 mg/l, the maximum number of severity points (3), is assigned. A similar rating scale is also utilized for total phosphorus. These criteria are utilized as guidelines to assess a pond or lake's trophic state and should not be construed as enforceable minimum or maximum limits.
The MDWPC severity criteria for nitrogen and phosphorus does, however, provide a basis for which to compare water quality results at Dudley Pond with other waterbodies throughout Massachusetts. Figure 12 (map pocket) illustrates the locations of plumes sampled by IEP throughout Dudley Pond. Discussion of each of the 26 plume locations is provided in Appendix A.
At most of the 26 plume sampling stations, ammonia nitrogen (NH3), nitratenitrogen (N03) and total Kjeldahl nitrogen (TKN) levels were comparable to the background sample concentrations and provide little evidence of septic waste inputs. The average concentrations for the seven parameters analyzed in the three background samples (believed to represent thoroughly mixed areas of the pond) are characteristic of a mesotrophic or eutrophic waterbody.
Plume total phosphorus levels fall, in general, within the severity point level of 2; a definite problem, considered unacceptable for lake water quality. This may be due primarily to the nature of the soils that underlie Dudley Pond. Sand and gravel glacial deposits comprise the dominant surficial geology of the Dudley Pond watershed (Qc2, Figure 2). These soil types have a relatively low capacity for attenuating phosphorus. Thus, septic systems that are located close to the water (as the majority are) eventually deplete the available attenuation capacity of the narrow zone of sand and gravel deposits that exist between the septic system and the shoreline. Therefore, in many cases phosphorus mayhave exceeded the adsorption capacity of the soils and leached into the Pond.
38

ii5i1 Table 10. Results of Grab Sample Analyses
Shoreline Water Quality Survey -
TOTAL FECAL TOTAL COLlFO~ COLIFORM
SN1PLE NO, KJELDAHL-N MG/L
ArffiNIA-N MG/L
NITRATE-N MGlL
CONDUCTIVITY MICRQ\1I-()S/CM
TOTAL P MGlL
COLONIES/ 100ML
COLONIES/ 100ML
Plume 1 0.65 0.04 0.2 240 0.06 120 30 Plume 2 1.4 0.08 0.3 240 0.14 160 20 Pl ume 3 0.80 0.07 0.2 240 0.06 80 < 5 Pl ume 4 0.83 0.02 0.2 240 0.10 70 10 Plume 5 0.79 0.05 O. 1 230 0.08 60 10 Plume 6 0.74 0.02 O. 1 240 0.05 20 < 5 Plume 7 0.65 0.01 O. 1 240 0.05 10 5 Plume 8 0.76 0.01 0.2 240 0.07 20 < 5 Plume 9 0.80 0.06 0.2 240 0.05 200 100 Pl ume 10 1. 10 0.02 0.2 240 0.10 4000 120 Pl ume 11 0.80 0.01 0.2 240 0.07 160 100 Plume 12 0.69 0.01 0.2 240 0.05 80 50 Plume 13 0.45 0.01 O. 1 240 0.04 40 15 Plume 14 0.76 0.09 0.3 240 0.06 20 5 Plume 15 0.66 0.01 0.2 240 0.06 100 30 Plume 16 0.50 0.02 0.2 240 0.06 150 60 Plume 17 0.74 0.05 0.2 250 0.09 80 20 Plume 18 0.46 0.06 0.2 240 0.05 200 40 Pl ume 19 0.50 0.04 0.4 240 0.09 60 < 5 Plume 20 0.62 0.01 0.3 240 0.06 90 15 Plume 21 1. 60 0.16 0.2 330 0.13 100 5 Plume 22 0.65 0.03 0.2 240 0.06 10 < 5 Plume 23 0.50 0.10 0.2 240 0.04 50 20 Plume 24 0.70 0.02 0.2 240 0.07 200 120 Plume 25 0.44 0.00 0.2 230 0.05 9500 650 Plume 26 0.41 0.01 0.2 240 0.04 500 200 Mean 0.73 0.04 0.2 243 0.07 618 63 S.D. 0.28 0.04 0.06 18.06 0.03 1968.03 129.55
Background Samples
A 0.71 0.18 0.20 250 0.04 10 5 B 0.74 0.03 0.20 240 0.04 50 20 C 0.65 0.01 0.20 240 0.04 20 < 5
Mean 0.70 0.07 0.20 243 0.04 27 9.16 S.D. 0.05 0.09 0.00 5.77 0.00 20.82 9.46
39

iiEiI
Table 11. MDWPC Lake Classification System Excerpts
Parameter Concentration/Degree of Severity Points
Epilimnetic NH3 + N03-N 0- <0.15 mg/l o 0.15 - 0.3 mg/l 1 0.3 - 0.5 mg/l 2 0.5 mg/l> 3
Epilimnetic total phosphorus o - 0.01 mg/l o 0.01 - 0.05 mg/l 1 0.05 - 0.10 mg/l 2 0.10 mg/l> 3
The severity points may be interpreted as follows:
o = No problem. Considered to be representative of clean water qual ity.
= Slight problem. Borderline case considered to be potentially degrading.
2 = Definite problem. Considered unacceptable for lake water quality.
3 = Severe problem. Undoubtedly causing degradation of the Lake's water quality or some recreational uses.
40

Although MDWPC does not include total and fecal coliform bacteria counts in their lake classification system, the Commonwealth1s Water Quality Standards (1978) for fecal coliform bacteria is 200 colonies/lOa ml. of sample in Class B waters. Prior to 1978, the Massachusetts Water Quality Standards (1971) used total coliform bacteria rather than fecal coliform as the parameter to gage bacterial contamination in Class B waterbodies. The 1971 criteria for total coliform bacteria was 1,000 colonies/l~O ml. Although not presently an enforceable standard, total coliform counts exceeding 1,000 colonies/lOa ml may be interpreted as potentially unsafe for water contact activities. Most plumesamples fall within the Commonwealth's present criteria for fecal coliform and its former (1971) maximum permissable limit based upon the total coliform group.
Background samples A, Band C were collected in the center of each cove, away from the shoreline. These samples represent the water quality in thoroughly mixed portions of Dudley Pond. and were used as a standard for judging other water quality results for plume samples. The background samples exhibited moderate nutrient concentrati ons for all parameters tested with the excepti on of the elevated ammoni a nitrogen levels in background sample A. This sample was taken in the middle of the western cove with a MDWPC severity point classification of 1, indicating a slightproblem. Background sample densities for total and fecal coliform bacteria were all low.
In looking at Figure 12, several plumes that were sampled exhibited higher than normal values for likely indicators of septic leachate. Plumes 1, 2 and 3 showed elevated phosphorus levels and plume 1 had a relatively high total Kjeldahl nitrogen level. Following a site inspection by William Dorney, Wayland Board of Health Agent and Gerald Smith from IEP, there was no visual evidence of failing septic systems. Mr. Dorney noted that at plume 1 the septic system was located close to the pond which may indicate rapid leaching of effluent into Dudley Pond .. At plume location 2, a nearby cesspool was known to be overflowing close to the time of the septic snooper survey. Since that time, this failing system has been corrected. A groundwater test well (no. 2) located at plume 3 confirms the hiqh total phosphoruslevels. These results are further discussed in Section 3.2.
Location 4 also denotes high total phosphorus levels, with a MDWPC classified severity point of 2. A storm drain (#5, Figure 6) was noted near plume 4, which may have contributed to the high levels of total phosphorus, total nitrogen and fecal coliform bacteria from previous flow,
Location 10 exhibited high values for total phosphorus (0.10 mg/l) and very high counts of total coliform bacteria (4000/100 ml). It appears that the total coli form bacteria count may have been influenced by previous flow entering the Pond from storm drain 6 (Figure 6). The drain was found to be discharging at the time of the follow-up field reconnaissance by William Domey and Gerald Smith. At this location there was no apparent source of effluent being emitted from adjacent septic systems.
41
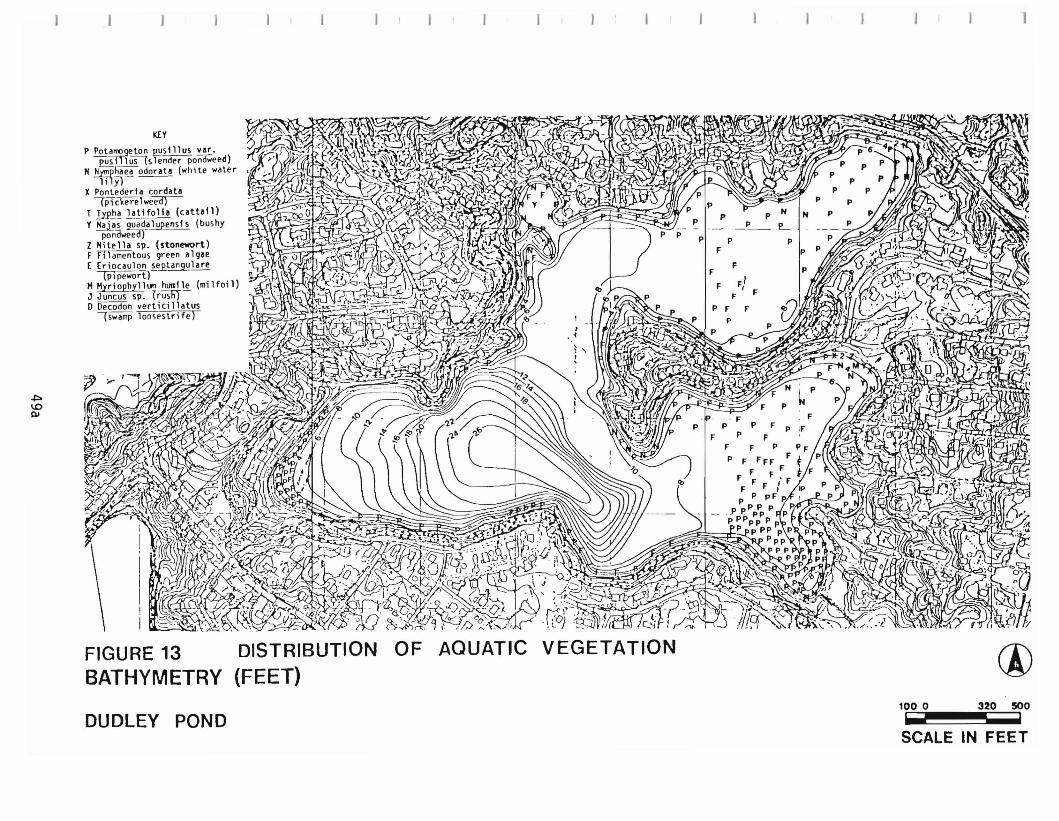
K£Y P Pot~eton ~~!llu~ var.
£iJilll USl~ 1ender por;a;;eed) N ~JP~odorata (white water
111"0- - X Pontederta cordata lPTckerelw~
T !1.P.!'.~ latlfolla (cattail) Y ~s ~_a~en~1s (bu~hy
pondweed) Z Nitella sp. (stonewort) F IT1amentou~ green algae [ Eriocaulon s~tangu1are
\plpewor t)- -1'1 l'1yri ophyll ~ hum!'!.! (m; Hoil) J Juncus sp. {rUSfiT o Decodon verticillatus
(~wamp loo~e~trifel
~ 1.0 QI
____P__ .L
pi p P F
F F
FIF F I F
p F F p
F P
OF AQUATIC @ 100 0 320 500I !DUDLEY POND SCALE IN FEET
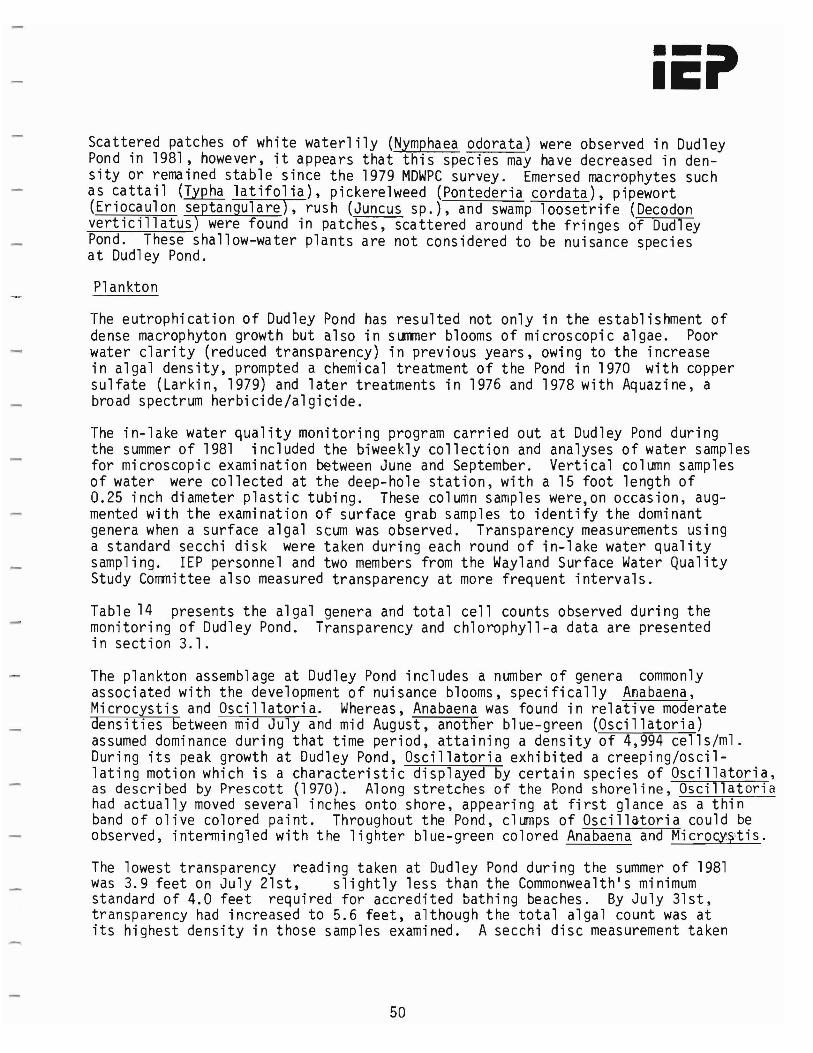
Scattered patches of white waterlily (Nymphaea odorata) were observed in Dudley Pond in 1981, however, it appears that this species may have decreased in density or remained stable since the 1979 MDWPC survey. Emersed macrophytes such as cattail (Typha latifolia), pickerelweed (Pontederia cordata), pipewort (Er;ocaulon se tan ulare), rush (Juncus sp.), and swamp loosetrife (Decodon vert;c;llatus were found in patches, scattered around the fringes of Dudley Pond. These shallow-water plants are not considered to be nuisance species at Dudley Pond.
Pl ankton
The eutrophication of Dudley Pond has resulted not only in the establishment of dense macrophyton growth but also in summer blooms of microscopic algae. Poor water clarity (reduced transparency) in previous years, owing to the increase in algal density, prompted a chem~cal treatment of the Pond in 1970 with copper sulfate (Larkin, 1979) and later treatments in 1976 and 1978 with Aquazine, a broad spectrum herbicide/algicide.
The in-lake water quality monitoring program carried out at Dudley Pond during the summer of 1981 included the biweekly collection and analyses of water samples for microscopic examination between June and September. Vertical column samples of water were collected at the deep-hole station, with a 15 foot length of 0.25 inch diameter plastic tubing. These column samples were,on occasion, augmented with the examination of surface grab samples to identify the dominant genera when a surface algal scum was observed. Transparency measurements using a standard secchi disk were taken during each round of in-lake water quality sampling. IEP personnel and two members from the Wayland Surface Water Quality Study Committee also measured transparency at more frequent intervals.
Table 14 presents the algal genera and total cell counts observed during the monitoring of Dudley Pond. Transparency and chlorophyll-a data are presented in section 3.1.
The plankton assemblage at Dudley Pond includes a number of genera commonly associated with the development of nuisance blooms, specifically Anabaena, Microcystis and Oscillatoria. Whereas, Anabaena was found in relative moderate densities between mid July and mid August, another blue-green (Oscillatoria) assumed dominance during that time period, attaining a density of 4,994 cells/ml. During its peak growth at Dudley Pond, Oscillatoria exhibited a creeping/oscil lating motion which is a characteristic displayed by certain species of Oscillatoria, as described by Prescott (1970). Along stretches of the Rond shoreline, Oscillatoria had actually moved several inches onto shore, appearing at first glance as a thin band of olive colored paint. Throughout the Pond, clumps of Oscillatoria could be observed, intermingled with the lighter blue-green colored Anabaena and Microc;y?,tis.
The lowest transparency reading taken at Dudley Pond during the summer of 1981 was 3.9 feet on July 21st, slightly less than the Commonwealth's minimum standard of 4.0 feet required for accredited bathing beaches. By July 31st, transparency had increased to 5.6 feet, although the total algal count was at its highest density in those samples examined. A secchi disc measurement taken
50

Table 14. Results of Plankton Analyses - Dudley Pond CollJlln Samples, Spring and SlJTlmer 1981
Green Algae 3/26 6/26 7/13 7/31 8/9 8/24 9/9 9/22
Ankistrodesmus Cladophora Coelastrum Mougeotia Scenedesmus Spaerocystis Spirogyra Staurastrum
114 NQ
358 14
258
401 14 57 29 57
171 43 57
57 14
114 29 14
14 29 43
29 14
NQ
100
86
258
129
Blue-Green Algae
Anabaena Coelosphaerium Merismopedia MicrocystisOscillatoria
29 14
929 NQ
343 1944
1073
86 358
4994
258
114 929
57
57
572
114
415
29
57
Flagellates and Protozoa
Actinophrys Dinobryon Mallomonas Pandorina
NQ 129
43
43 14
100
NQ
129 72
286 157 29
186 29
43
Diatoms
Asterionella Diatoma Fragilaria Navicula Pinnularia Tabe 11 ari a
458 29 29 86 14
257
72
86 14
29 57
Total Organisms (Ce 11 s )/ML. 1,803 1,201 3,674 6,840 1,530 729 987 516
NQ = Not Quantitative
51
by Committee members on July 25th revealed a transparency of 5.2 feet with a steady rise to 6.0 feet by August 12th, based upon a series of subsequent Committee readings. Transparency on August 24th had improved to 7.0 feet and according to the Committee members who live on the Pond, water clarity increased thereafter during September and into the fall.
Ch1030phy11-a, a measurement of phytoplankton biomass, ranged between 1.7 and 6.8 mg/111 in the June, July and August sampling rounds. These concentrations for ch10rophy11-a are not especially high, considering that New Hampshire Water Supply and Pollution Control Commission (1981) suggests that, in general, 5 mg/m3 or less of ch10rophy11-a indicates oligotrophic waters and 15 mg/m 3 or more are associated with eutrophic wat~rs. It should be noted that higher levels of ch10rophy11-a would likely have been found in Dudley Pond, had this analysis coincided with the maximum biomass/density of the Osci11atoria bloom.
Existing plankton data collected in previous years at Dudley Pond include numerous counts performed by John Larkin in 1978, the Massachusetts Division of Water Contro1·s Baseline Water Quality Survey (October 1, 1979) and several counts performed by Aquatic Control Technology, Inc., between 1980 and 1982. Larkin observed a spring bloom of diatoms in Dudley Pond, followed by high counts of filamentous (predominantly Spirogyra) and unicellular green algae during ear1y/ mid summer. During August, he observed a dominance of blue-green genera, , specifically Anabaenopsis, Nostoc and Anacystis (Microcystis). Osci11atoria was not reported at Dudley during the time of his study.
During July 1980, several surface grab samples examined by Aquatic Control Technology, Inc. revealed a dominance of Anabaena and also several filaments of Aphanizomenon. MDWPC1s microscopic examination performed on a sample taken on October 1, 1979 displayed a total cell count of 829/ml, with Microcystis, Nostoc and Aphanizomenon identified in this one sample.
52
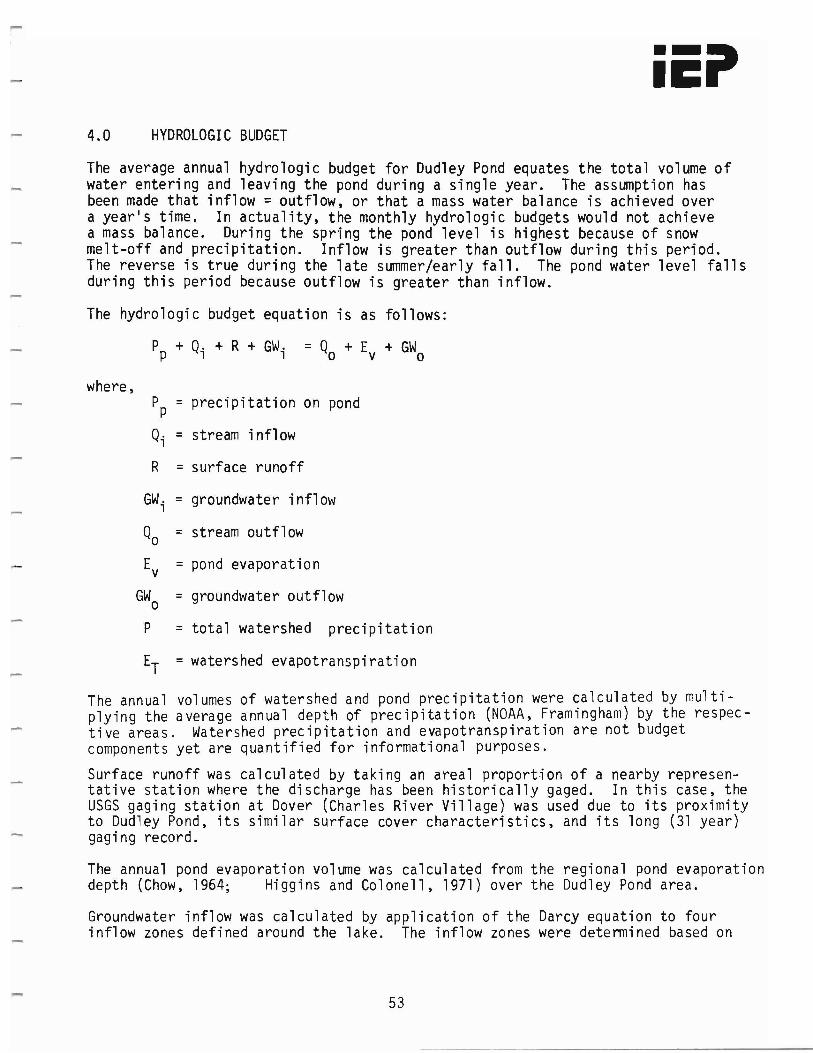
4.0 HYDROLOGIC BUDGET
The average annual hydrologic budget for Dudley Pond equates the total volume of water entering and leaving the pond during a single year. The assumption has been made that inflow = outflow, or that a mass water balance is achieved over a year's time. In actuality, the monthly hydrologic budgets would not achieve a mass balance. During the spring the pond level is highest because of snow melt-off and precipitation. Inflow is greater than outflow during this period. The reverse is true during the late summer/early fall. The pond water level falls during this period because outflow is greater than inflow.
The hydrologic budget equation is as follows:
P + R + GWi = Q + E + GWp + Qi o v o
where, P = precipitation on pondp
Qi = stream inflow
R = surface runoff
= groundwater inflow
stream outflow
pond evaporation
GW o = groundwater outflow
P = total watershed precipitation
ET = watershed evapotranspiration
The annual volumes of watershed and pond precipitation were calculated by multiplying the average annual depth of precipitation (NOAA, Framingham) by the respective areas. Watershed precipitation and evapotranspiration are not budget components yet are quantified for informational purposes.
Surface runoff was calculated by taking an areal proportion of a nearby representative station where the discharge has been historically gaged. In this case, the USGS gaging station at Dover (Charles River Village) was used due to its proximity to Dudley Pond, its similar surface cover characteristics, and its long (31 year) gaging record.
The annual pond evaporation volume was calculated from the regional pond evaporation depth (Chow, 1964; Higgins and Colonell, 1971) over the Dudley Pond area.
Groundwater inflow was calculated by application of the Darcy equation to four inflow zones defined around the lake. The inflow zones were determined based on
53
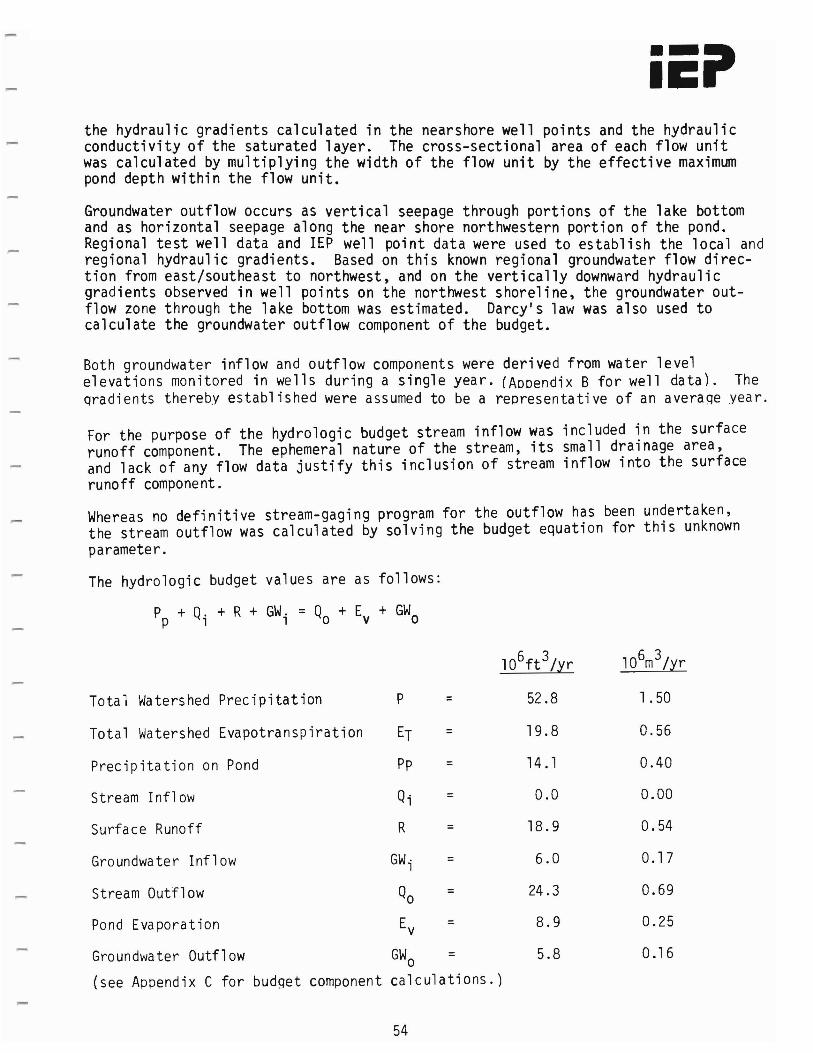
the hydraulic gradients calculated in the nearshore well points and the hydraulic conductivity of the saturated layer. The cross-sectional area of each flow unit was calculated by multiplying the width of the flow unit by the effective maximum pond depth within the flow unit.
Groundwater outflow occurs as vertical seepage through portions of the lake bottom and as horizontal seepage along the near shore northwestern portion of the pond. Regional test well data and rEP well point data were used to establish the local and regional hydraulic gradients. Based on this known regional groundwater flow direction from east/southeast to northwest, and on the vertically downward hydraulic gradients observed in well points on the northwest shoreline, the groundwater outflow zone through the lake bottom was estimated. Darcy's law was also used to calculate the groundwater outflow component of the budget.
Both groundwater inflow and outflow components were derived from water level elevations monitored in wells during a single year. (Aooendix B for well data). The qradients thereby established were assumed to be a representative of an averaqe year.
For the purpose of the hydrologic budget stream inflow was included in the surface runoff component. The ephemeral nature of the stream, its small drainage area, and lack of any flow data justify this inclusion of stream inflow into the surface runoff component.
Whereas no definitive stream-gaging program for the outflow has been undertaken, the stream outflow was calculated by solving the budget equation for this unknown parameter.
The hydrologic budget values are as follows:
P + Q + R + GW i = Q + E + GWp i o v o
106ft3/yr 106m3/yr
::Total Wa ters hed Prec ipitat ion P 52.8 1. 50
Total Watershed Evapotranspiration ET :: 19.8 0.56
Precipitation on Pond Pp :: 14.1 0.40
Stream Inflow Q; = 0.0 0.00
Surface Runoff R :: 18.9 0.54
Groundwater Inflow GW·1 :: 6.0 0.17
Stream Outflow Q = 24.3 0.69 o 0.25Pond Evaporation Ev
:: 8.9
::Groundwater Outflow GWo 5.8 0.16
(see Appendix C for budqet component calculations. )
54

5.0 NUTRIENT BUDGET AND TROPHIC STATE
5.1 External Phosphorus Loadings (Stormwater, Background Groundwater, Septic and Direct Atmospheric)
Table 15 shows the annual phosphorus budget expressed as loadings (kilograms per year entering Dudley Pond) per source. All specified sources are non-point whereas no point sources have been identified within the watershed. The annual loading is used in the modeling procedure to establish trophic status and the determinants of trophic status which include phosphorus concentration in the Pond, transparency, and chlorophyll-a concentration. Further, the effectiveness of watershed management strategies which achieve loading reductions may be gaged by their ability to improve trophic status.
The stormwater runoff component of the budget includes all phosphorus transported to Dudley Pond by runoff via storm drain outlets, streamflow, and direct overland flow. The phosphorus in the runoff water may originate from soils, animal wastes, vegetative litter, the atmosphere, fertilizers, detergents (e.g. car washing), and sometimes from surface pooling of defective septic systems. The stormwater loading to Dudley Pond (Table 16 ) is estimated to be 83.3 kg/yr, or 58% of the total annual loading. Of this, about 49.2 kg/yr are generated by the 65.0 acres tributary to storm drain outlets and about 34.1 kg/yr is contributed by the remaining 180.3 acres of land area within the surface watershed of Dudley Pond.
Storm drain loadings (Table 16 ) were calculated from phosphorus concentrations in samples taken October 1 and 2, 1981 and July 20, 1982 and annual average discharge rates. Loadings from other areas not served by storm drains were derived from land use export coefficients (EPA December, 1980B;CEM, 1977; EPA, June 1980A)which relate land use types to annual unit area loadings independent of runoff rates. Although the two methods are very different from one another, each is believed to be most appropriate for the respective areas on which it is used. Application of the sampling/discharge method to the entire watershed would yield an annual stormwater loading of 166.0 kg/yr whereas the export coefficient method would result in a loading of 48.4 Kg/yr. This variability indicates the probable error associated with both methods. On a unit area basis, areas served by storm drains contribute higher loadings than those not served. This is due to less overland filtering and vegetative uptake of phosphorus in runoff water and to the higher density of development in the areas served by storm drains. Further val idation for using actual measured water qual ity data to compute stormwater loadings for areas served by drains at Dudley Pond, but using EPA export coefficients for areas that are not, became apparent during the stormwater sampling. The intermittent brook which enters Dudley Pond along the southeast shoreline did not flow during or following the October storm sampling event, despite the large area which drains to this brook and wetland system. In reality, there was no contribution of nutrients to Dudley Pond during or immediately following this storm event. For drainage areas such as this, phosphorus exnort coefficients based upon literature values were therefore used.
55
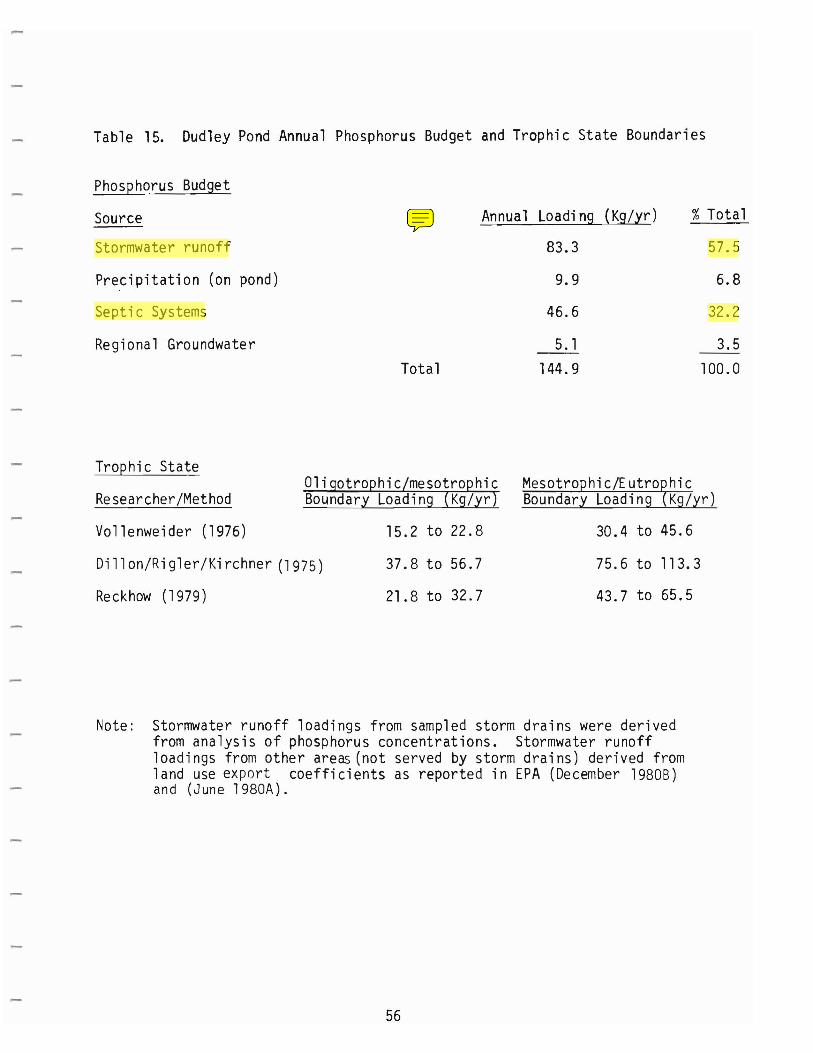
Table 15. Dudley Pond Annual Phosphorus Budget and Trophic State Boundaries
Phosphorus Budget
Source Annual Loading (Kg/yr) %Total
Stormwater runoff 83.3 57.5
Precipitation (on pond) 9.9 6.8
Septic Systems 46.6 32.2
Regional Groundwater 5. 1 3.5 Total 144.9 100.0
Trophic State Mesotro hic/Eutro hic
Researcher/Method Boundary Loading Kg/yr)
Vollenweider (1976) 15.2 to 22.8 30.4 to 45.6
Dillon/Rigler/Kirchner (1975) 37.8 to 56.7 75.6 to 113.3
Reckhow (1979) 21.8 to 32.7 43.7 to 65.5
Note: Stormwater runoff loadings from sampled storm drains were derived from analysis of phosphorus concentrations. Stormwater runoff loadings from other areas (not served by storm drains) derived from land use export coefficients as reported in EPA (December 1980B) and (June 1980A).
56
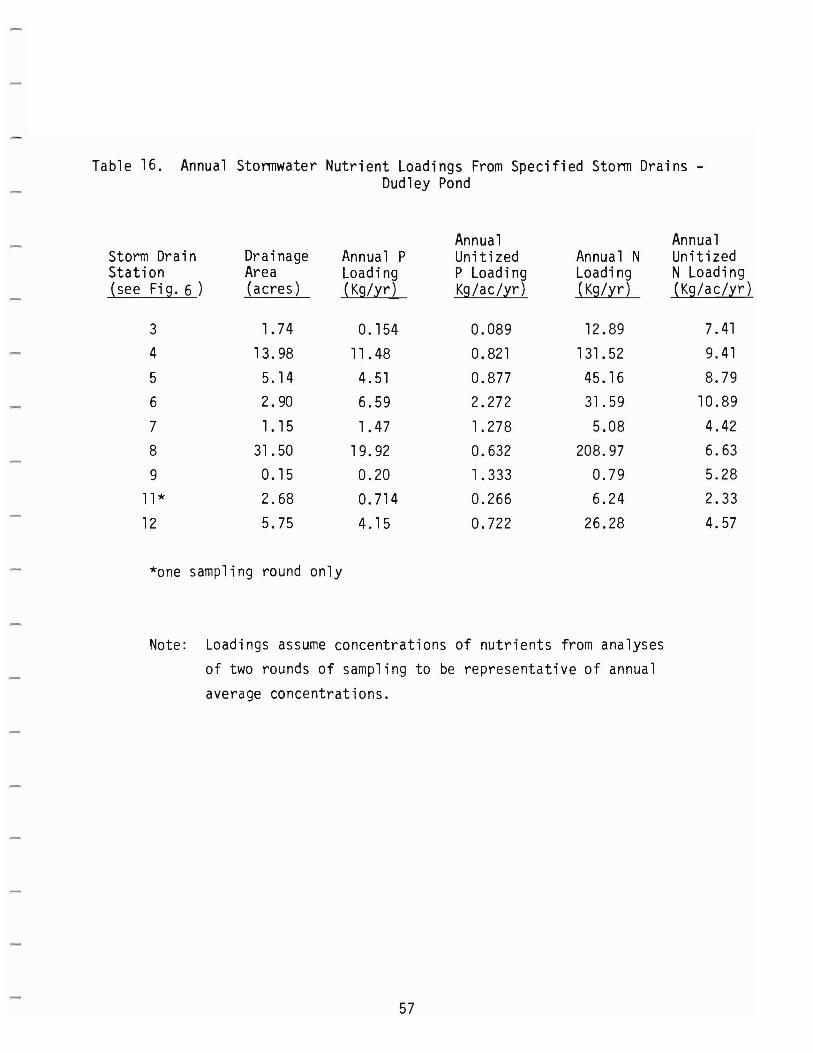
Table 16. Annual Stormwater Nutrient Loadings From Specified Storm Drains Dudley Pond
Annual Annual Storm Drain Station (see Fig. 6 )
Drainage Area (acres)
Annual P Loading (Kg/yr)
Unitized P Loading Kg/ac/yr)
Annual N Loading (Kg/yr)
Unitized N Loading (Kg/ac/yr)
3 1. 74 0.154 0.089 12.89 7.41 4 13.98 11.48 0.821 131. 52 9.41 5 5.14 4.51 0.877 45.16 8.79 6 2.90 6.59 2.272 31. 59 10.89
7 1. 15 1. 47 1.278 5.08 4.42 8 31.50 19.92 0.632 208.97 6.63
9 0.15 0.20 1.333 0.79 5.28 11* 2.68 0.714 0.266 6.24 2.33
12 5.75 4.15 0.722 26.28 4.57
*one sampling round only
Note: Loadings assume concentrations of nutrients from analyses of two rounds of sampling to be representative of annual
average concentrations.
57

Atmospheric precipitation of phosphorus includes that contained in rain and snowfall as well as dry fallout from dust, ash, and smoke, etc. This loading is applied to the area of the Pond only, because the stormwater runoff component of the budget includes precipitation on upland areas. The budgeted precipitation loading was calculated to be 9.9 kg/yr, or 6.8% of the total loading, based on the EPA (December, 1980B)average unit areal loading (0.25 kg/yr) adjusted to the local annual average precipitation (water). This source of phosphorus is presently uncontrollable in the absence of more effective air pollution emission controls.
The phosphorus loading from septic systems is the most difficult component of the budget to quantify accurately, due to the complexity of the mechanisms of soil attenuation of phosphorus and the inability to monitor them. With some variation, soils are very effective in removing (mostly by adsorption) phosphorus from septic leachate. However, an aging system which is close to a pond may, at some point in time, expend all of the soil IS attenuation capacity and become a direct phosphorus loading source to the pond.
A method (CEM, 1977) does exist to model pond-wide septic loadings based on factors such as septic system age, setback and elevation above the water table, system distribution, soil types, population density, phosphorus-using appliance distri bution, and detergent type distribution. The application of this method to Dudley Pond data (from surficial geologic mapping and residents· survey results, Table 17)yielded an annual total septic loading of 86.9 kg/yr with 40 system~ pond-wide within 250 ft. of the shoreline contributing. The CEM method though lacking verification by other researchers, is the most comprehensive septic model yet developed to the best of our knowledge.
The budgeted value of 46.6 kg/yr was also derived from source data distributions in each of the 4 zones established by the residents' survey but the number of contributing systems was determined from the septic leachate detector survey, the assumption being that each detected plume not associated with a storm drain represented a contributing septic system. Despite the possible error in this assumption, the leachate survey represents actual field conditions at Dudley Pond and thus is viewed as more definitive than the theoretical (CEM) method. Currently, the septic system loading is estimated to be 32.2 %of the total annual loading. However, as the shoreline septic systems continue to age, increasingly more of them will contribute to phosphorus loading and the septic component of the budget will increase as a result.
The regional groundwater loading is estimated to be 5.1 kg/yr or 3.5% of the annual total. It was derived from the annual groundwater inflow volume (section 2.3 and 4.0) and phosphorus concentrations as determined from three rounds of water samples taken from well points driven at representative sites around the Pond (see Section 3.2). The phosphorus concentrations used in the budget were from selected well points not subject to potential septic influences.
58

Table 17
DUDLEY POND - HOUSEHOLD SURVEY SUMMARY (l)
(2~ONE 1 ZONE 2 ZONE 3 ZONE 4 TOTAL
1. OCCUPANCY No. of responses 28 22 16 32 98 No. year-round residences 28 21 16 32 97
Avg. Jun-Sep no. people 2.6 2.7 2.75 2.5 2.6 Avg. Oct-May no. people 2.6 2.5 2.62 2.4 2.5
No. summer only residences o 1 o o 1 Avg. no. people o 2.7 o o 0.7
2. FACILITIES No. of responses 28 22 16 32 98
Avg. showers/bathtubs/dwelling 1. 42 1.3 1.25 1.3 1.3 Avg. dishwashers/dwelling 0.65 0.6 0.35 0.6 0.6 Avg. clotheswashers/dwelling 0.8 0.7 0.87 0.8 0.8 Avg. garbage disposal/dwelling 0.15 0.3 0.06 0.3 0.2
3. DETERGENTS No. of responses 12 15 15 27 69 Dishwasher
No. using phosphate 12 11 6 19 48 No. using non-phosphate o 2 3 5 10
Clotheswasher No. using phosphate 8 11 4 13 36 No. using non-phosphate 13 4 11 13 41
4. WASTEWATER DISPOSAL SYSTEMS No. of responses 23 20 16 32 91 No. of cesspools 6 13 12 16 47 No. of septic tanks 17 8 8 13 46 No. of systems (all types)
0-25 ft. from pond 1 o o 2 3 25-50 ft. from pond 6 2 10 50-100 ft. from pond 7 4 11 7 29
100-200 ft. from pond 5 6 2 14 200-300 ft. from pond 2 6 2 9 19
>300 ft. from pond 3 3 5 12 Avg. age of systems (yrs)
0-25 ft. from pond 20 20 25-50 ft. from pond 30 30 20 80 50-100 ft.
100-200 ft. from from
pond pond
25 22
]0 5 20 5
] 8 ] 2] 17
9 5
75.5 60.0
200-300 ft. >300 ft.
from from
pond pond
]7 24
22 27
8 5
] 5 50
2] 23
1 2
75.9 124.7
Avg. years since last pumping 2.1 3.5 6 7 7 7 5.0
(1) Survey questionnaire distributed to all residents within 300 ft. of the Pond shoreline. (2) Zone Locations: Zone 1 (eastern shoreline); Zone 2 (southern shoreline); Zone 3
(northern shoreline) and Zone 4 (western shoreline).
59
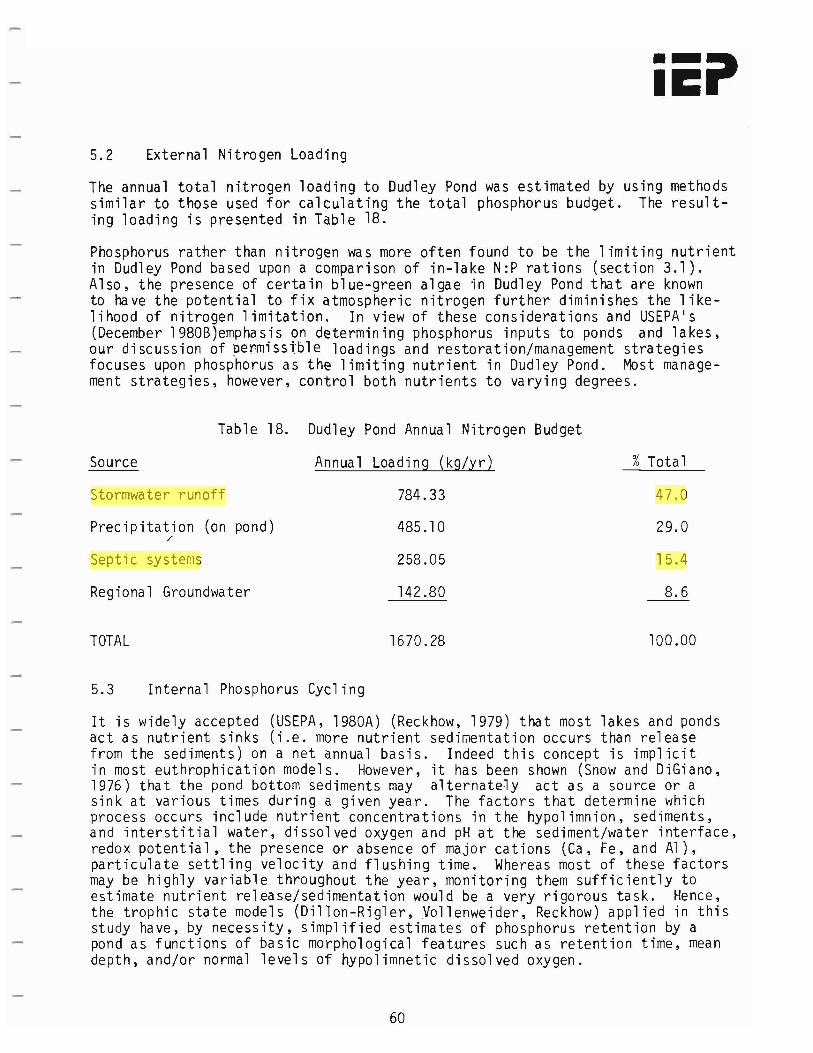
iiEi' 5.2 External Nitrogen Loading
The annual total nitrogen loading to Dudley Pond was estimated by using methods similar to those used for calculating the total phosphorus budget. The resulting loading is presented in Table 18.
Phosphorus rather than nitrogen was more often found to be the limiting nutrient in Dudley Pond based upon a comparison of in-lake N:P rations (section 3.1). Also, the presence of certain blue-green algae in Dudley Pond that are known to have the potential to fix atmospheric nitrogen further diminishes the likelihood of nitrogen limitation. In view of these considerations and USEPA's (December 1980B)emphasis on determining phosphorus inputs to ponds and lakes, our discussion of perrnissi'ble loadings and restoration/management strategies focuses upon phosphorus as the limiting nutrient in Dudley Pond. Most management strategies, however, control both nutrients to varying degrees.
Table 18. Dudley Pond Annual Nitrogen Budget
Source Annual Loading (kg/yr) %Total
Stormwater runoff 784.33 47.0
Precipitation (on pond) 485.10 29.0 /
Septic systems 258.05 15.4
Regional Groundwater 142.80 8.6
TOTAL 1670.28 100.00
5.3 Internal Phosphorus Cycl ing
It is widely accepted (USEPA, 1980A) (Reckhow, 1979) that most lakes and ponds act as nutrient sinks (i.e. more nutrient sedimentation occurs than release from the sediments) on a net annual basis. Indeed this concept is implicit in most euthrophication models. However, it has been shown (Snow and DiGiano, 1976) that the pond bottom sediments may alternately act as a source or a sink at various times during a given year. The factors that determine which process occurs include nutrient concentrations in the hypolimnion, sediments, and interstitial water, dissolved oxygen and pH at the sediment/water interface, redox potential, the presence or absence of major cations (Ca, Fe, and Al), particulate settling velocity and flushing time. Whereas most of these factors may be highly variable throughout the year, monitoring them sufficiently to estimate nutrient release/sedimentation would be a very rigorous task. Hence, the trophic state models (Dillon-Rigler, Vollenweider, Reckhow) applied in this study have, by necessity, simplified estimates of phosphorus retention by a pond as functions of basic morphological features such as retention time, mean depth, and/or normal levels of hypolimnetic dissolved oxygen.
60

iiCiI The Dillon/Rigler/Kirchner formula (Reckhow, 1979) for estimating the annual fraction (R kd ) of the phosphorus loading which is retained by a pond is:
R = 0.426 e (-0.271 T/T) + 0.574 e (-0.00949 i/T)kd
= 0.82 for Dudley Pond
The Larson/Mercier formula (Reckhow, 1979) developed from a data base of northeastern temperate lakes surveyed in the EPA National Eutrophication Survey, calculates the annual retention fraction (Rl m) from flushing time alone:
1R = -----..:::..---:::-~
1m 1 = 1.12 (l/T) 0.49 R - 0.52 for Dudley Pond1m
Thus the results of applying both formulae to Dudley Pond data indicate that between 52% and 82% of the annual total external phosphorus load is retained by the sediments.
Phosphorus which may be recycled to the overlying waters of Dudley Pond, is likely to do so following the fall and spring turn-overs. Our water quality test results at Dudley Pond revealed comparatively low hypolirnnetic concentrations of total phosphorus during July and August (0.05 and 0.04 mg/l, respectively). Further, the small volume of the hypolimnion relative to the entire Pond volume, suggests that internal nutrient release is not an important factor in the overall phosphorus budget. In addition, our late winter (March 10, 1982) sampling results, revealed nearly equal phosphorus concentrations at the Pond surface (0.02 mg/l) and bottom (0.03 mg/l). Internal nutrient recycling following spring turn-over is likely to have ~ greater effect upon nuisance algae and macrophyton growth at Dudley Pond than would fall turn-over because of the increased availability of nutrients when water temperatures are warming, and active plant growth is beginning. The late winter water quality data for Dudley Pond points to external (watershed) nutrient sources as the prime contribution of phosphorus, resulting in the Pond's current euthrophic sta tus.
If phosphorus is released from the sediments during certain periods of a year, these quantities are not considered as loadings and hence are not a part of the phosphorus budget. Trophic status is evaluated in the applied models by comparing predicted loadings to loadings which would yield eutrophic conditions. Whereas the latter, the pond's tolerance for phosphorus input, is computed in part by factors which define the pond's ability to retain phosphorus, the predicted loadings must include only sources which are external to the pond.
61
5.4
iiCiI Permissible Phosphorus Loadings and Trophic State
Essentially, the determination of the trophic status of a pond involves a comparison of the actual total phosphorus loading to a pond with the maximum loading that the waterbody can tolerate before excessive weed and algae growth occurs. The models developed by several researchers provide classification of the pond as oligotrophic, mesotrophic, or eutrophic by making this comparison. Additionally, they demonstrate changes in classification which would result from implementing selected management strategies.
The models developed by Vollenweider (1976), Dillon and Rigler (1975), Dillon and Kirchner (1975) (see Reckhow, 1979), and Reckhow (1979) differ from one another because they were derived from different data bases, i.e. different sets of lakes and ponds varying in geographic region and in morphological characteristics. Reckhow's models have been developed from a large data base of northern temperate lakes and therefore would be quite applicable to Dudley Pond, yet further corroboration of these models is necessary. Vollenweider's model has been widely used yet the data base is not specified. The Di11on-Rig1erKirchner model (see Reckhow, 1979), though developed for a set of Canadian shield lakes, has been frequently used for, and verified (Reckhow 1979) with work on northern temperate lakes. Additionally, it accounts for phosphorus retention by pond sediments. Based on these criteria, this model was selected for analysis of Dudley Pond although existing trophic state limits calculated using the other two (Reckhow and Vollenweider) models are also specified in Table 15 for reference.
All three of these models predict the tolerance of ponds for phosphorus loadings as a function of two basic morphological parameters, mean depth (i) and hydraulic residence (or "flushing") time (T). These parameters have proven to be the primary determinants of loading permissibility. Ponds with shorter flushing times and greater mean depths can tolerate higher phos£horus loadings. Stated another way, trophic status is set by existing values of ~~ T, and loading,yet may be improved by management strategies which increase ~, decrease T, or decrease phosphorus loading.
The results of applying the Dillon-Rig1er-Kirchner model show the existing boundary loading between mesotrophy and eutrophy at Dudley Pond to be between 75.6 and 113.3 kg/yr (Table 15). The other two models show even less of a tolerance. Dudley Pond cannot accept much phosphorus due to its shallow depth (~ = 2.8 m) and slow ( T= 1.52 years) flushing time. The total estimated existing loading (144.9 kg/yr) therefore classifies the Pond as eutrophic.
Figure 14 is a graphical representation of the existing trophic status of Dudley Pond based on the Dillon-Rigler-Kirchner model. It is a plot of loading (grams phosphorus per square meter of pond area per flush after sediment retention) vs. mean depth and shows the zones of oligotrophy, mesotrophy, and eutrophy. The plot of Dudley Pond depicts a low to moderate degree of eutrophication. This figure will be used later in this report for the evaluation of managementstrategies.
62
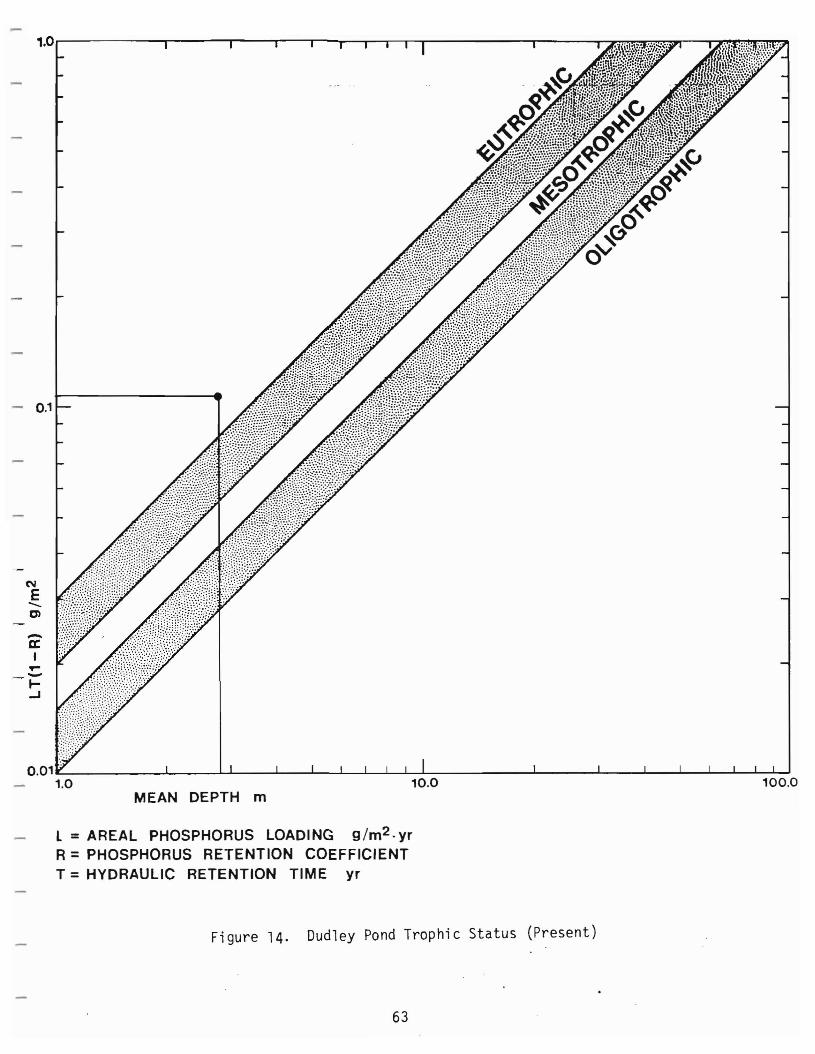
,.0r-----..,----...,...---r----.--,.--........--T1.------.,-----,-~==~-~~~~
- 0.1
N
ECl
-a: I ....-~
..J
0.01~------L-----I-.L...---.l....-....l...----l-...I.......~~...I.......-----L.----....l-----.l.----L-L-....L...-L.....L...J 1.0 10.0 100.0
MEAN DEPTH m
L = AREAL PHOSPHORUS LOADING 9/m2 .yr R =PHOSPHORUS RETENTION COEFFICIENT T = HYDRAULIC RETENTION TIME yr
Figure 14. Dudley Pond Trophic Status (Present)
63
The basis for development of all eutrophication models which relate phosphorus loadings to trophic status is the in-pond phosphorus concentration, taken as an annual average value since the models assume completely mixed, annualized loading conditions. The oligotrophic/mesotrophic boundary condition corresponds to an in-pond phosphorus concentration of between 0.010 and 0.015 mg/l, mesotrophic/eutrophic boundary corresponds to an in-pond boundary of between 0.020 and 0.030 mg/l (EPA, December 1980B). The mean concentration in Dudley Pond from IEP sampling (6/26/81 to 3/10/82) at the surface, middle and bottom is 0.028 mg/l (arithmetric average) which falls into the mesotrophic/eutrophic boundary range.
The summer concentration of chl orophyll-a, and summer secchi di sk transparency are two indicators of trophic status. The oligotrophic/mesotrophic boundary corresponds (EPA December, 1980B)to secchi disk depths in the range of 3 to 5 meters,and to chlorophyll-a concentrations between 0.002 and 0.004 mg/l. The mesotrophic/eutrophic boundary corresponds to secchi disk depths between 1.5 and 2 meters,and chlorophyll-a concentrations between 0.006 and 0.010 mg/l. Several researchers have proposed statistical relationships between these two parameters and lake phosphorus concentrations and annual loadings. The annual budgeted loading for Dudley Pond is 144.9 kg/yr which, by use of the Jones and Bachmann formula (EPA, December, 1980B) ,corresponds to a secchi disk depth of 1.15 meters. The measured secchi disk depth was 1.71 meters in July, 1981. By use of the Carlson formula (EPA, December, 1980B) ,the loading corresponds to a chlorophyll-a concentration of 0.016 mg/l. The sampled chlorophyll a concentration was 0.0068 mg/l in July, 1981. The samples therefore indicate a more mesotrophic status, based on these two parameters than does the annual phosphorus budget. Although the rea sons for thi s di sparity are unknown. severa1 may be hypothesized, They include: (1) abnormally low loadings occurred in 1981, (2) uptake of phosphorus by the sediments is greater than calculated, (3) macrophytic weeds utilize phosphorus that otherwise would be available to algae, (4) the actual annual loadings were less than the budgeted loading, (5) standard error in the statistical formulae or (6) variability in analytical methods.
-All of the analyses performed to date classify Dudley Pond as upper mesotrophic to lower eutrophic. For the purpose of evaluating management strategies, the lower eutrophic condition, as determined by the phosphorus budget, will be assumed.
64
6.0 EVALUATION OF WATERSHED MANAGEMENT STRATEGIES
A sound, comprehensive approach to lake management must consider both in-lake and watershed based techniques for reducing nutrient input and internal cycling as well as effective control of nuisance macrophytes and algae. 1m this section those alternatives that would reduce watershed derived nutrient loadings will be considered.
In Section 5 it was concluded that the greatest nutrient loadina sources to Dudley Pond are septic systems (32% of the phosphorus load) and storm water -runoff (58% of the phosphorus load). In that these two sources are considered controllable, measures to limit them are focused upon here.
6.1 Land Use Regu1ation
A community has, through its various regulatory avenues, the ability to affect such things as land use types and densities, drainage and roadway design, placement, type and sizing of septic systems. Through these various approaches, preventive measures may be implemented in order to avoid future additional nutrient loadings to a valued waterbody. Due, however, to the high intensity of existing development within the Dudley Pond watershed (65%), and extent of publicly (town) owned land (lJ%), there is little opportunity for extensive practical applicationof preventive measures.
Zoning
The foundation of local land use control rests in the zoning bylaw. Through this piece of local legislation, a community sets forth use and intensity requirements throughout the town.
Curren~ly, zoning within the Dudley Pond watershed is predominantly R-20, allowing single family residential uses on minimum lot sizes of 20,000 square feet (S.f.)with a 120 foot minimum frontage requirement. A very small area (approximately 250,000 s.f.) within the northeasterly portion of the watershed is zoned R-30, having a 30,000 s.f. minimum lot size requirement and a 150 foot minimum frontage. Very little, if any, of the R-30 zone within the Dudley Pond watershed is actually developable because of it incorporates only that portion'of the watershed along the M.D.C. aqueduct.
Though current zoning within the watershed does not provide what would be considered environmentally sound area requirements protective of lake water quality, many of the developed lots proximal to the Pond were in existence prior to zoningand do not even meet the current standards. In effect, the nnly practical advantage there would be to increasing lot size requirements in the watershed, and to require that destroyed or unused nonconforming uses meet the increased standards. This, however, would necessitate a change in Section IV.E. of the Wayland Zoning Bylaw which allows rebuilding or restoration of a nonconforming use, regardless of the extent of damage. It is not practical to believe that this would have a significant effect upon Dudley Pond nutrient loadings, even over a 20 or 30 yeartime span.
A zoning change which would provide increased protection for Dudley Pond would be to include it within the Town's Watershed Protection District. The large townowned swamp southeast of the Pond, as well as the outlet brook are currentlyincluded in this district.
65
Furthennore, creation of a Lakefront district that incorporates all land within 300 feet of the Pond,may be advisable insofar as officially promoting sound lake watershed practices, such as use of nonphosphate detergents, minimal lawn fertilization, and the like. However, enforcinq such requlations would not be easy. Probablythe regulations would be more effectively enforced through strengthening the Pond Associat~on.
Subdivision Control Regulations
The Wayland Subdivision Regulations, while fairly standard on first reading, do provide flexibility for the use of innovative drainage schemes. Unfortunately, none have been implemented in the Dudley Pond watershed.
A drainage method that is beinq used more frequently in the Town of Waylandis infiltrating catch basins (Mr. Lewis Bowker, personal communication, September 8, 1982). Such systems have been used successfully elsewhere in Wayland in areas such as Decatur Lane and Bogren Lane, the latter of which is just south of the Dudley Pond watershed. A similar type of infiltrating system has been approved for a seven acre subdivision (Gennaro Road) also just south of the Dudley Pond watershed.
Such a system is preferable to a conventional piped/discharge situation for several reasons relative to lake protection. In an infiltrating catch basin, all sediment sizes are trapped and not allowed to enter the waterbody. In a piped system, typically, only the more coarse sediment fraction (sand and gravel sized particles) is contained within the catch basins and the finer particles (colloids, clay and silt) remain suspended and pass on to the lake where they settle. It is via this finer sediment fraction that the greatest volume of nutrients is transported.
SecoDdly, through infiltration, soil adsorption processes will attenuate nutrients entering the soil system via storm water discharge. Once again, this opportunity would not be provided with a conventional piped/discharge system.
Finally, infiltrating systems will even-out the watershed hydrograph during and following a storm event. Rainfall, instead of being conveyed quickly to a waterbody or watercourse via a series of pipes, would be allowed to move much more slowly through the groundwater system, thereby extending the period over which recharge to the Pond would occur.
Mr. Bowker emphasized the need of oversizing the catch basin sumps and locating such systems in very well drained soils that are typical in most of the Dudley Pond wa ters hed .
Once again, however, due to the intensity of development within the Dudley Pond watershed, there is little opportunity for implementing the use of infiltrating drainage systems through new development. Instead, a more practical approach would be to redesign the systems which do exist in the watershed, accommodatinginfiltration techniques where applicable. This is discussed more fully in Section 6.3.
66
....
Board of Health Regulations
All homes within the Town of Wayland rely upon subsurface sewage disposal systems (cesspools or septic systems) as there is no public sewerage in the Town. Wayland health regulations supercede the State (Title V) requirements in a number of instances t strengthening the minimum standards for system 10cation t design and construction. While this bolstering of the state requirements is admirab1e t it really does not get to the crux of the problem in the Dudley Pond watershed where the average age of the systems is 22 years or older t an estimated 51% are cesspools (most of which are on undersized lots) and there are few buildable lots remaining.
There are several areas where the local health regulations could be changea or added to in order to address the situation found at Dudley Pond. Initial1Yt some form of maintenance program needs to be implemented wherein residents are required or greatly encouraged to have their systems pumped on a regular basis. The Town of Manchester t Massachusetts t for examp1e t owns its own septage pumping and hauling equipment. The equipment is operated by the highway department during off-peak working periods. Service is available to local residents once a year at no charge above what is collected through local taxes. The Manchester Board of Health reports a 60% - 70% voluntary annual participation by local residents.
Another approach would be for the community to contract t on an annual basis t with a septage pumping/hauling company. The contractee would pump or inspect one third of the homeowners' septic systems in a given year. The following year another one third would be serviced and the year after that the final third would be pumped or inspected.
A final means for enforcing septic system maintenance would be for the Town to notify homeowners on a regular basis that their septic system(s) must be cleaned or inspected. Proof that this had been accomplished would come from the hauler who would fill out a short form indicating service performed and conditions encountered.
It is important that t whatever system for maintenance is chosen t it be manageable by local regulatory and administrative departments and fair to local residents while t at the same time being effective. Both the first and the second approach seem to best satisfy these requirements.
Wayland t along with the Town of SudburYt is currently in the process of completing a septage treatment facility. It is reported that a septic system managementplan is being developed. Such a plant it is be1ieved t will include a public education component as well as a monitoring/review process wherein the Board of Health cant through a permit system t keep record of pumping frequency on a house by house basis.
Another consideration for reducing nutrient loadings from residential septic systems would be to allow conversion from discharging to nondischarging (composting t incinerating t dry) toilets. Of the total household sewage load, the toilet (black water) represents approximately 30% of the phosphorus source and 80% of the nitrogen source (Hall, 1975). Removing the black water fraction of household
67

wastewater could, if applied on a large scale and at those homes nearest the Pond, substantially reduce nutrient loadings. Where septic systems proximal to (within 300 feet) the Pond have failed and cannot be replaced meeting state and local specifications, consideration should be given to requiring installation of nondischarging toilets or a nondischarging system.
One final consideration at Dudley Pond would be utilization of town-owned, upland parcels for construction of community septic systems for homes which have poorly operating or failed systems. There appears to be great opportunity for such systems on the east side of the Pond in an area of approximately five acres bounded roughly by Lakeview Road, Main Street, and Curtiss Road. At the southern end of the Pond, two 1.5 acre recreational land parcels may be adopted for community septage. On the west side of the Pond north of Simpson Road, there are mnnerous, small «1/2 acre) isolated town-owned parcels. This option is discussed further in section 6.2.
Wetlands Protection
One of the most useful tools for protecting the quality of surface waters, wetlands and groundwater is the Massachusetts Wetlands Protection Act (MGL Ch. 131,s.40). The Act defines, by vegetative and hydrologic criteria, wetlands and identifies seven values which are to be defended under the Act. The values include water supply (public and private), groundwater, pollution prevention, flood control, storm damage prevention, fisheries, and shellfish. Any activity which is proposed within 100 feet of a wetland may fall under the jurisdiction of the local Conservation Commission. In its regulatory capacity under Ch.131, s.40, the Conservation Commission may require, within reason, that certain runoff quality and quantity criteria are met. Original administration and regulation is the responsibility of the local Conservation Commission. Appeals of local rulings go to the regional DEQE office.
The Massachusetts Wetlands Protection Act is currently being revised. Some feel a weakened set of regulations will result. One way in which a community may ensure that the strength of such a law is not sacrificed, is by passing their own local wetlands legislation. This may take one of two forms - zoning or general bylaw. The zoning route requires that the town have an accurate map of all wetlands falling within the district (such as an overlay protection district). A general bylaw has the advantage of not being keyed to am~p but affects all wetlands, as identified in the field on a case by case basis. It requires a majority town meeting vote for passage, rather than the two-thirds required for the zoning bylaw. Prototypes have been passed in numerous eastern Massachusetts communities and their validity has been repeatedly upheld in the Massachusetts courts.
The major wetland within the Dudley Pond watershed is owned by the Town and designated Conservation Land. This includes a large (-4 acre) wooded swamp/shrub swamp/shallow marsh complex at the southeastern end of the Pond between the Pond and Main Street. Its statutory values include prevention of pollution, flood control and stonn damage prevention. Another small (_! acre) wooded swamp located at the junction of Dudley Road and Bayfield Road is also town-owned.
68
iii' 6.2 Sewage Treatment/Disposal
As has been stated, approximately 32% of the current phosphorus loading to Dudley Pond is a result of subsurface sewage disposal (domestic) within the watershed. Over time, the percentage contribution from this source will increase, as existing systems age and the soil's attenuation capacity is diminished. This subsection examines various options for reducing loadings from this significant source.
Sewering
The standard approach to e1iminatinq problems resu1tinq from septicsystem leachate is construction of a sewage system, complete with collection and central treatment. Implementation of such an alternative could come about in any one of several wayss including: (1) a regional sewerage system; (2) a local system; or (3) a sub10ca1, or district system. The first two of these approaches were considered in the 1978 Facilities Plan prepared for the towns of Sudbury and Wayland by Roy F. Weston, Inc. The Weston report examined connection to the MDC regional systems as well as construction of a local collection and treatment facility. Both options were abandoned in favor of construction of a joint (Sudbury/Wayland) septage treatment facility, due primarily to the high costs, environmental and secondary impacts associated with both of the conventional sewering options. USEPA and Massachusetts DWPC officials apparently concurred with the Weston findings as the septage treatment facility is currently under construction and is expected to be fully operational by spring 1983. Due to this situation, it is not reasonable to believe a regional or local sewering option to be viable.
It would be possible to construct a predominantly gravity fed sewage collection system within the Dudley Pond watershed that would provide a treatment facility just downstream of the Pond's outlet. Such a system could serve most, if not all, of the homes within 200-300 feet of the Pond, thus virtually eliminating the septic systemcontribution to the Pond's nutrient loading. Assuming secondary treatment and individual tie-in charges paid by homeowners, total capital costs for such a system would be approximately $1,115,000s with an annual operation and maintenance cost of $50,000 (Table 19 Co1umns'2 and 3).
There are~ however, several problems in effectuating such a plan. Initially the Massachusetts DWPC has designated the Sudbury River upstream of Wash Brook as lI antidegradation,1I meaning that current DWPC policy would not allow a discharge from a sewage treatment plant to occur at the proposed location. If this were the only viable alternative to significantly reducing nutrient loadings to Dudley Pond, then perhaps the DWPC would waive its policy pending review of an appeal (Robert Kady, personal communications Sept. 28, 1982~
Another problem is the fact that a significant proportion of the groundwater contribution to the Pond would be eliminated as a result of sewering. If it is assumed that approximately 200 homes would be sewered, roughly 50,000 gallons of Pond recharge per day would be removed. This would, in turn, lower the Pond's flushing rate, thereby reducing its permissable loading for any given trophic state. So, in effect, the result of sewering would be the removal of 35 Kg P/yr. rather than 46.6 KaP /yr after taking into account the reduction in permissable loadinqs. Cost effectiveness, in tenns of dollars per Kg P removed over a ten (10) yearperiod, assuming no financing, would tho.refore. be $4,614 (Table 19 , column 7).
69
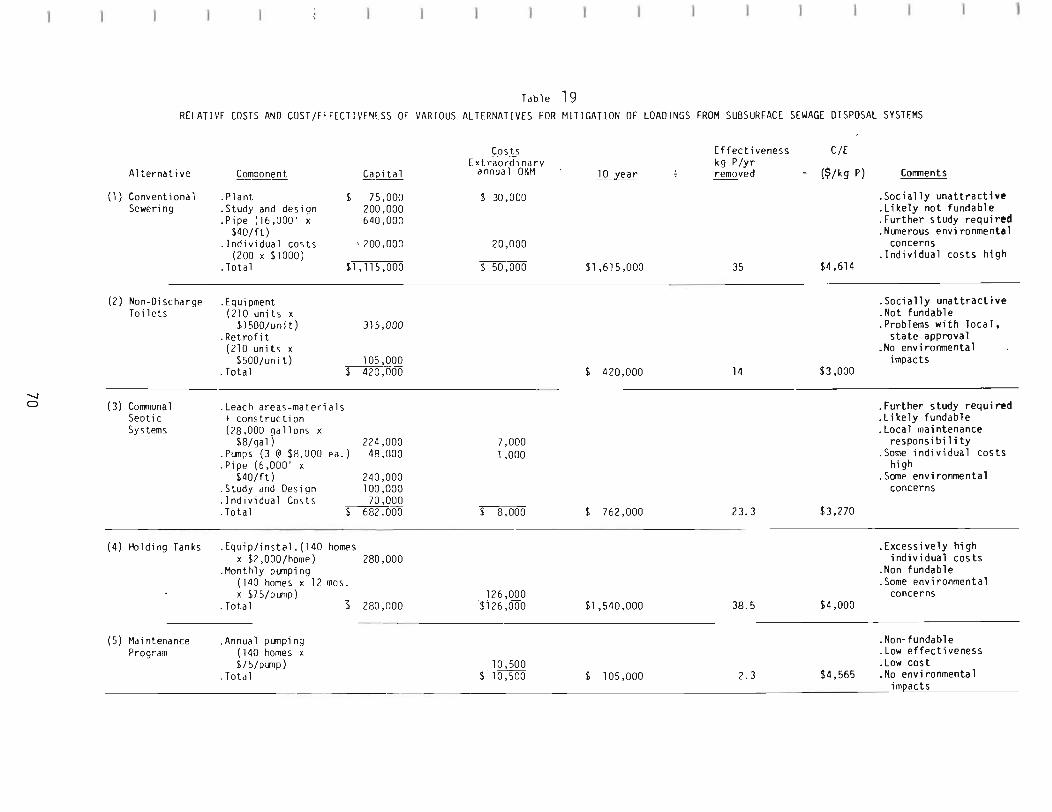
RELATIVE COSTS AND COST/EFFECTIVENESS OF VARIOUS
Table
ALTERNATIVES FOR
19 MITIGATION OF LOADINGS FROM SUBSURFACE SEWAGE DISPOSAL SYSTEMS
A1terna t i ve
(1) Convent i ana 1 Sewering
~~2.Q.I1.e nt
.P1ant
.Study and design
.Pipe (16,000' x $40/ft)
.Individua1 costs (200 x $1000)
· Total
~ita1
$ 75,000 200,000 640.000
'200.000
$1,115,000
Cos ts Ext r~·ordi na rv
annual O&M
$ 30,000
20,000
$50,000
~
$1,615.000
Effecti veness kg P/yr removed
35
"
C/E
($/kg P)
$4,614
Comments
.Socia11y unattractive
.Like1y not fundab1e
. Further study required
.Numerous environmental concerns
.Individua1 costs high
......, a
(2) Non-Discharge Toi lets
(3) Corrrnuna 1 Septic Sys tems
. Equipment (210 units x
$J500/unit) 315,000 · Ret rofi t
(210 units x $500/unit) 105,000
· Tota 1 $ 420.000
.Leach areas-materials + cons truc t ion (28.000 gallons x
$8/9a1) 224.000 .Pumps (3 @ $8,000 ea.) 48.000 .Pipe (6,000' x
$40/ft) 240,000 .Study and Design 100,000 .Individual Costs 70,000 · Total ~ 682.000
7.000 1 .000
r-8.000
$ 420,000
$ 762,000
14
23.3
$3,000
$3,270
.Socia11y unattractive
.Not fundab1e
.Problems with local, state approval
.No environmental impacts
.Further study required
.Like1y fundable
.Local maintenance responsibility
.Some individual costs high
.Some environmental concerns
(4) Holding Tanks .Equiplinsta1. (140 homes x $2.000/home)
· Monthly pUTIpi ng (140 homes x 12 mos. x ~75/pump)
· Total ~
280,000
280,000 _126,000 $126,000 $1,540,000 38.5 $4,000
.Excessively high individual costs
.Non fundable
.Some environmental concerns
(5) Maintenance Program
·Annua 1 pumpi ng (140 homes x ~75/pump)
.Total 10.500
$10,500 $ 105,000 2.3 $4,565
.Non-fundab1e
.Loweffectiveness
.Low cost
.No environmental impacts

The major problem with a central sewerage system relates to its financing and public acceptance. The most likely funding source for such a system would be the USEPA Construction Grants Program, the same source of funding for the septage treatment facility. It is highly unlikely, especially during this period of budget cut-backs, that agency officials would see fit to fund a second sewage treatment facility for the Town of Wayland, particularly when conventional collection and treatment was formerly ruled out as a townwide option. Additional operational concerns relate to management of such a facility, and individual costs associated with tie-in and use.
Environmental problems (see Table 20 ) would include potential aesthetic, visual, odor and water quality impacts in the vicinity of the plant. Increased nutrient, B.O.D., and suspended solids loadings would be anticipated within the unnamed tributary where discharge would occur, and further ,in the Sudbury River. Construction related, short-term impacts would include great potential for inlake siltation and disruption of private property and convenience. Cost burdens on individual homeowners may be enough to force some families to move.
Non-Discharge Toilets
Another potential alternative for significantly reducing lake nutrient loadings is to retrofit all conventional toilet fixtures with non-discharging toilets. As pointed out previously, this could eliminate 30% of the phosphorus and 80% of the nitrogen, sewage-derived inputs to Dudley Pond. Assuming that this were accomplished in the 140 homes closest to the Pond and further assuminq an average of 1.5 toilets per home, this would cost approximately $420,000 (Table 19, column 3), with no extraordinary operation and maintenance fees. Cost effectiveness would be $3,000/Kg P removed ignoring a slight reduction in groundwater recharge to the Pond. Environmental impacts (Table 19) would be limited to inconvenience to homeowners during the retrofitting process, and potential aesthetic and odor problems sometimes associated with improperly operated or poorly functioning non-discharging toilets. If retrofitting were mandated, it may cause enough of a cost burden or social disruption to cause some families to move.
Once again, the .major difficulty with effectuation of such a plan is financing and public acceptability. Because these would be individually owned units, they would not be funded under any existing public program. Furthermore, it is unreasonable to believe that a significant percentage of homeowners would choose to install such an unconventional toilet, even if it were publicly funded.
A more realistic application of the use of nondischarging toilets, would be voluntary and/or regulatory in nature, in conjunction with a comprehensive watershed-wide sewage management program. The underpinnings of such a program would be the application of various appropriate technologies designed to reduce lake nutrient contribution resulting from septic systems. Where the use of public funds may be made and potential nutrient removal rates are high, this would be first priority. Where public funds could not be applied, judicious (yet incrementally effective)regulation by the Board of Health should be applied. Finally, encouragement/promotionby an active Pond Association should be ever present.
71
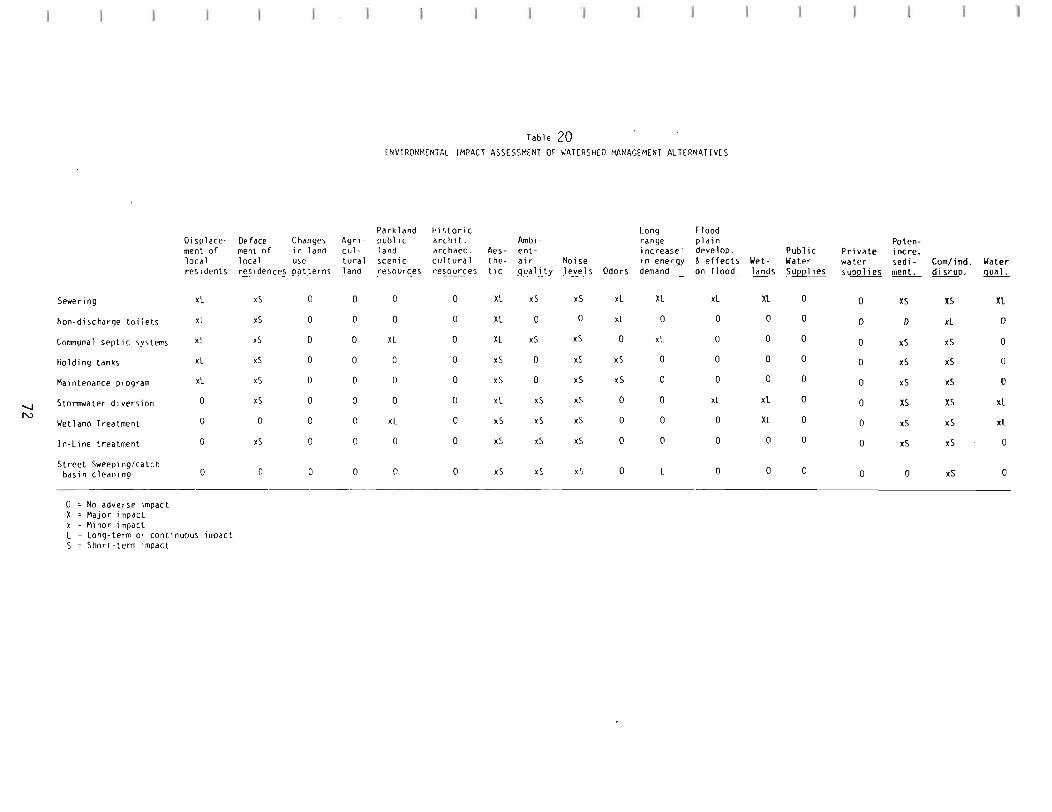
ENVIRONMENTAL IMPACT
hble 20 ASSESSMENT OF WATERSHEO MANAGEMENT ALTERNATIVES
Displacement of local re~ident~
Deface ment of local re~idence~
Change~
inland u~e
Q2.t)ern~
Agricultura 1 .~~
Parkland pub11 c land ~cenic
.!:.e_~E_~r_t;..e~
Hi~toric
archil. archaeo. cul tura 1 .~e_50urces
Ae~-
the!.!.s....
Ambient -air
~ Noi~e
level~ Odor~
Long range increa~e'
in energy dem~
Flood plain develop. & effect~
on flood Wetlands
Public Water Supplie~
Private water ~~
Potenincre. ~edi-
ment. Com/ind. di ~rup .
Water ~
Sewering
Non-di~charge toilet~
Conll1una 1 ~ept i c ~y~ tem~
xL
xl
xl
xS
xS
xS
0
0
0
0
0
0
0
0
XL
0
0
0
XL
XL
XL
xS
0
xS
xS
0
xS
xL
xL
0
XL
0
xL
xL
0
0
xL
0
0
0
0
0
0
0
0
XS
0
xS
XS
xl
xS
XL
0
0
'-J N
Holding tank~
Ma j ntenance program
Stormwater di ver~ion
Wetland Treatment
xl
xL
0
0
xS
xS
xS
0
0
0
0
0
0
0
0
0
0
0
0
xL
0
0
0
0
xS
xS
xL
xS
0
0
xS
xS
xS
xS
xS
xS
xS
xS
0
0
0
0
0
0
0
0
xL
0
0
0
xl
XL
0
0
0
0
0
0
0
0
xS
xS
XS
xS
xS
xS
XS
xS
0
0
xL
xl
In-Line treatment 0 xS 0 0 0 0 xS xS xS 0 0 0 0 0 0 xS xS 0
Street Sweeping/catch ba~in cleanlng 0 0 0 0 0 0 xS xS xS 0 L 0 0 0 0 0 xS 0
o : No adver~e impac t X = Major impact x : Minor impact l : Long-term or continuou~
S = Short-term impact impact
Communal Septic Systems
As mentioned previously, there are numerous upland parcels in town ownership which occur throughout the Dudley Pond watershed. It is estimated that public sites which would be favorable for subsurface sewage disposal, total twelve to fifteen acres. Assuming there would be seven acres available for actual sewage disposal and further allowing approximately 4000 square feet per home for primary leaching and reserve area, the sewage from approximately 70 - 80, three and four bedroom homes could be disposed of in the available acreage.
Unfortunately from a cost perspective, most of the sites which are best suited to sewage disposal are greater than 200 feet from the Pond. If homes proximal to the Pond are to be served, some central collection and pumping would be required.
Ideally, all homes within 200-300 feet of the shoreline would be serviced by such a system. Due, however, to space and distance limitations, there are only two areas within the watershed which seem reasonably suited for such systems. One area, bounded roughly by Lakeview Road and Curtiss Road offers great potential for disposal of sewage from up to 50 homes, based upon existing site testing and the avail able area. While this location was turned down by recent Town Meeting vote for use as an elderly housing project due to concern over additional nutrient loadings to Dudley Pond, the current proposal would call for this area being used as a replacement facility. Homes on the peninsula on Dudley Road and just south of the peninsula along the eastern shoreline, would be served by this area. Sewage from individual homes would flow to existing septic tanks. Septic tank effluent would then go to a piped collection system and be pumped to the disposal area (Figure 15, Site 1). It is estimated that it would take approximately 20 years for phosphorus to begin reaching the Pond from this area.
Another area which would be suited for disposal of septic system leachate is the Schoenfield land, located northwest of the Pond by about 500 feet (Figure 15, Site 2). The site totals approximately seven acres and abuts an additional one or two acres of town-owned land. The Wayland Conservation Commission is currently in the process of purchasing the Schoenfield property. It is estimated that the site could serve between 30 and 40 homes. In that the Schoenfield property is greater than twice the distance from the Pond than the Lakeview Road/ Curtiss Road site is, it is estimated that phosphorus would not reach the Pond from the Schoenfield site for, perhaps, 30-40 years and for that time would effectively remove 100% of the Pond phosphQrus loadings from the homes it would serve. As with the Lakeview Road/Curtiss Road system, a piped collection system with three pumps would be required. Though it is believed that these systems would, for possibly 20 or more years, remove 50% of the septic system loadings to Dudley Pond, concern exists over what would happen following this 20 year period.
The USEPA (l~) has cited precipitation by alum dosing as an effective means of removing phosphorus from septic system leachate. Though several coagulants are cited in the literature as effective in removing phosphorus, alum is the most effective (USEPA, 1980C;Brandes, 1977). In addition to removing phosphorus at rates varying from 75% to 96.3% (USEPA, 1980C;Brandes, 1977), iron ( 63%),coliform ( 80%), protozoa, suspended and colloidal BOD and solids are also removed. At a recommended dosing rate (Al:P=2.0), a total of approximately 16,600 kg/year
73
would be required to be added to the two systems in order to achieve maximum effectiveness. This would result in a 200-300% increase (by weight) over normal sludge accumulation (USEPA, 1980). Alum would be added to each system from a reservoir metered into a holding tank prior to dispersal in the leach field.
Assuming effectuation of these systems, serving 70 homes, all within 200 feet of the Pond, approximately 50% (23.3 kg/yr) of existing septic loadings would be removed until the phosphorus plume reached the shoreline (estimated to be 20 years). After a maximum of 20 years, when aged septic systems would, presumably, comprise a greater percentage of the nutrient loading to the Pond, the phosphorus precipitation system would be activated, continuing to remove between 75% and 96% of the effluent phosphorus.
Table 19 columns 3, 4, and 5, present the costs associated with effectuating the communal septic system alternative. As seen, costed out for a ten year period, total costs would be $762,000, which includes installation of an alum dosing system at each area, as well as monies for operation and maintenance (alum @$.30/kg and $3,000 for annual pumping and energy costs). Cost effectiveness, as measured by dollar per kilogram of phosphorus removed, would be $3270.
Some of the problems associated with conventional sewering are shared by the communal systems alternative. Initially, further detailed study would be required to be eligible for federal/state Construction Grants funding, though this work would only entail a 10% local contribution. Secondly, there would be some nonfundable public and private costs imposed, such as installation of septic tanks by individuals currently served by cesspools (assumed to be 50% or 35 homes), and maintenance, pumping and energy requirements of the systems. Finally, construction would occur prOXimal to the Pond over a distance of approximately 3000 feet of shoreline, posing a potential environmental threat.
One big advantage of pursuing a communal septic systems alternative over that of conventional sewering, is that federal and state funding agencies would likely look more favorably towards putting public monies into an alternative that is consist~nt with the town's current facilities plan, i.e., construction of a septage treatment facility, rather than into an inconsistent option. Furthermore, the project would likely be eligible for I and A (Innovative and Alternative) funding, which includes a 3% incentive public contribution. Through the Construction Grants program, then, this sewage management aspect could quite possibly be funded at the 93% level from non-local sources.
Holding Tanks
It would be possible to install holding tanks in each of the approximately 140 homes within 250 feet of the Pond, thereby eliminating all sewage discharge from these homes. There are numerous problems with this option which make it particularly unattractive.
Initially, this alternative would not be fundable under the 314 program nor under a public sewerage program. Thus, heavy financial burden would be placed on individual property owners. Though the alternative is relatively cost effective, and would remove a high percentage of sewage disposal-derived phosphorus (38.5 kg P/yr. adjusted for reduction in hydrologic budget), individual costs (particularly O&M) render this an impractical option applied watershed-wide. It does make sense if applied on a case by case basis. Such a system is currently in use at the Chateau Restaurant.
74
Maintenance Program
Periodic pumping of a septic system or cesspool is a necessary operation in order to maintain the system's long term viability. Without maintenance pumping, solids move into the leaching area, clogging soil interstices and eventually resulting in system malfunction or failure.
While maintenance pumping is a practice which should be followed on, at least, a once in every three year basis, it is not very effective in reducing nutrient loading. If conducted on an annual basis for a typical family of four, it was estimated that only 2.3% of the nutrient load would be removed (4 persons x 60 gpd/ person x 365 days/yr = 87,600 gpy; 1 pumping/yr = 2,000 gpy ~ 87,600 = 2.3%). Assuming some additional benefit due to a prolonging of attenuation within the septic tank for a period following pumping, promoting aerobic conditions within the leaching area, etc., a 5% removal figure was used yielding 2.3 Kg P/yr for the 140 homes (Table 19, column 6).
75

6.3 Stormwater Runoff
As determined in Section 5, 57.5% (83.3 kg P/yr) of the total annual phosphorus loadings to Dudley Pond is derived from stonmwater runoff. Of this total, 49.2 Kg P/yr. are attributable to existing stormtlater collection/discharge systems within the watershed.
This subsection will focus on means by which nutrient loadings from the structured stormwater collection systems within the watershed may be reduced. Each of the fourteen systems within the watershed are considered separately, as realistic alternatives for each vary. Figure 6 shows each of the various storm drain systems within the watershed. The approach followed below, for recommending stormwater treatment alternatives draws heavily on conclusions made by Wanielista (1978) relative to the effectiveness of various approaches to stonmwater management. Where feasible, use of infiltrating, ponding, or retention techniques is recommended. Both the Wayland Engineering Department and Conservation Commission have encouraged that, where practicable, these techniques be used in developing areas of town (Lew Bowker, March 14, 1983; Ken Moon, October 21, 1982). If application of these techniques is not reasonable, then detention is considered. In three instances, out-of-basin diversion was considered due to the apparent ease with which this could be accomplished. In several structured stormwater catchment areas, and in areas not served by stormwater collection systems, improved street sweeping and street repair has been recommended as the primary improvement alternative. No matter what other systems of stormwater management are proposed, however, it is believed that improved street cleaning with advanced (vacuum-type) equipment and increased catch basin cleaning are needed watershed-wide. Currentl~ streets are swept and catch basins cleaned an average of once per year. The sweeping work has, historically, been done with broom-type equipment which is relatively ineffective at removing fines (silt, clay, colloidal particles) typically associated with carrying the bulk of the nutrient (phosphorus, in particular) load. Source reduction of phosphorus also makes sense from the point of view of reducing concentrations diverted out-of-basin, applied subsurface, or retained/detained by a natural or artificial wetland system. Effectuation of this option is also consistent with recommendations put forth in the recently published MDWPC report on Lake Cochituate, further justifying the cost of purchase/lease of improved street sweeping equipment and increased catch basin cleaning. .
Table 21 and Figure 16 (map pocket) summarize recommended stormwater techniques, including costs and effectiveness, for each catchment area. Street sweeping/catch basin cleaning is assumed basin-wide Vv5 road miles) on a four time/year basis, and assumed to provide 10% nutrient removal effectiveness (Wanielista, 1978) if undertaken with other recommended strategies.
Area 0
Area 0 collects runoff from about a 12 acre area in the southwest portion of the Dudley Pond watershed. The collection system includes approximately 2200 feet of pipe in Castle Gate Road and West Plain Street and approximately 400 feet along Mansion Road. Twelve sets of catch basins occur along this distance. According to untitled field maps provided by the Wayland Engineering Department, the system discharges to the Pond at the end of Mansion Road. IEP personnel were unable to locate the discharge point of this system and therefore it could not be sampled. Given, however, its relative size and the land use types present, it is estimated that Area 0 contributes on the order of 8.7 kg P/yr to Dudley Pond.
76
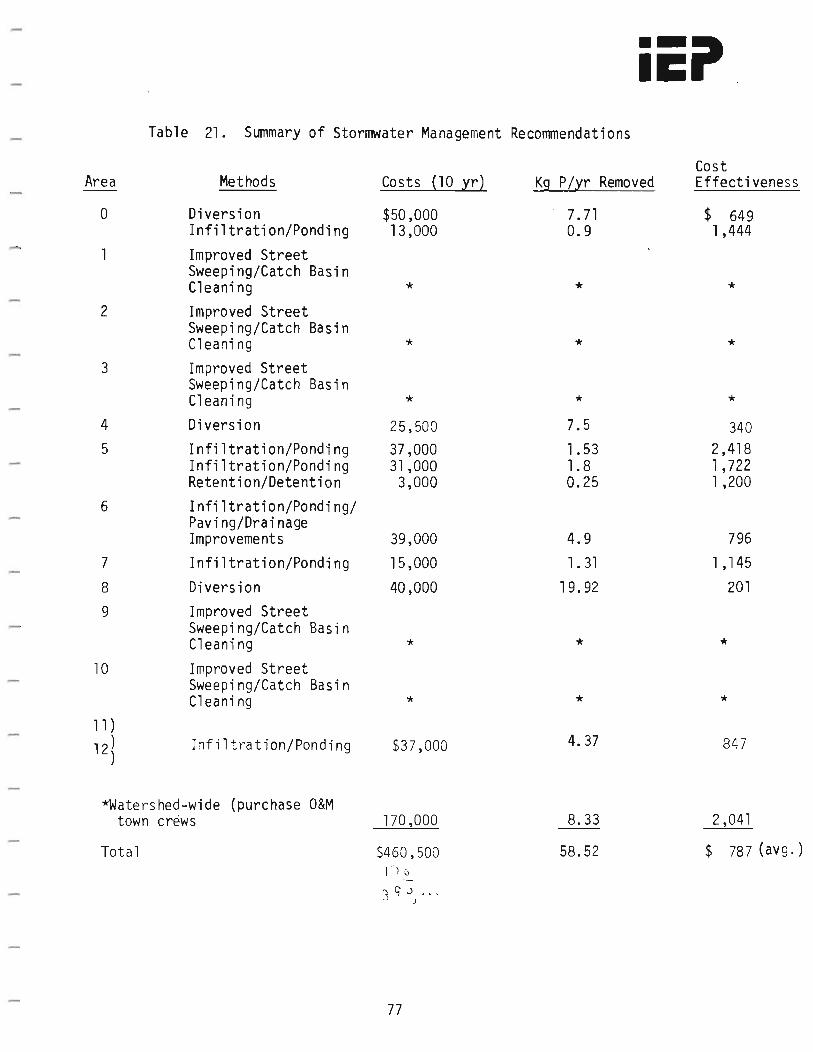
Table 2l. Summary of Stormwater Management Recommendations
Area Methods
a Diversion Infi1tration/Ponding
Improved Street Sweeping/Catch Basin Cleaning
2 Improved Street Sweeping/Catch Basin Cleaning
3 Improved Street Sweeping/Catch Basin Cleaning
4 Diversion 5 Infiltration/Ponding
Infiltration/Ponding Retention/Detention
6 Infiltration/Ponding/ Paving/Drainage Improvements
7 Infiltration/Ponding
8 Di vers i on 9 Improved Street
Sweeping/Catch Basin Cleaning
10 Improved Street Sweeping/Catch Basin Cl eani ng
11)
12) Infiltration/Ponding)
*Watershed-wide (purchase O&M town crews
Total
Costs (10 yr)
$50,000 13,000
*
*
* 25,500 37,000 31 ,000 3,000
39,000 15,000 40,000
*
*
$37,000
170,000
$460,500 I -) u
-3 c; J ."
J
Cost Kg P/yr Removed Effectiveness
7.71 $ 649 0.9 1,444
* *
* *
* * 7.5 340 1.53 2,418 1.8 1,722 0.25 1 ,200
4.9 796 1. 31 1,145
19.92 201
* *
* *
4.37 847
8.33 2,041
58.52 $ 787 (avg. )
77
There are two alternatives considered for better managing storm runoff from Area 0. Initially, the town owns approximately 0.5 acres on the southerly side of the junction of Mansion Road and Lake Shore Drive. There exists an opportunity for using this site for construction of a leaching storm drain/ponding facility for, at least, a portion of the Area °system.
The other option involves diverting a portion of the system out of the basin to a large swamp/marsh complex contiguous to Pod Meadow and eventually discharging to the SUdbury River. This alternative would involve continuing the Castle Gate Road/West Plain Street system northwest approximately 700 feet along West Plain Street, through the intersection with Old Connecticut Path (Route 126). Currently, drainage exists in West Plain Street and an easement to Pod Meadow is already in use. Extending the existing system would involve cuts of up to 11-12 feet over a distance of 800 feet. Assuming a constructed cost of $50/ft., the total diversion would cost $40,000 with no extraordinary O&M. Engineering and design is estimated at $5,000. The effect would be to divert about 10.6 acres of runoff out of the watershed. This would reduce the annual hydrologic inflow by 2.1%, insignificantly affecting permissible phosphorus loadings. Diversion would remove 7.71 Kg P/yr for a cost per Kg P removed over a ten year period of $584.
As a result of comments received from Wayland Town Engineer, Lew Bowker (March 14, 1983) relative to the amount of storm discharge, principally from Natick, already flowing to Pod Meadow via the aforementioned easement, it is further recommended that existing catch basins within West Plain Street be modified so as to allow leaching/infiltration, thereby reducing the proposed increased storm flows to Pod Meadow. The subsurface conditions along West Plain Street are well suited for infiltration. Increased costs for modifying the existing 17 basins are estimated at $5,000, increasing per Kg P removed to $ 649.
The town-owned land on Mansion Street could then be used to provide infiltration via two pits and a dry pond to perhaps, 12,000 cubic feet of storage. Runoff from abbut 1.4 acres would be routed through this system. Assuming a finished cost of $3,000/pair of basins, $4,000 for pond construction and finishing, $500/yr in extraordinary maintenance, and $1,000 for engineering, cost effectiveness over ten years would be $l,300/Kg P removed, assuming removal of 0.9 Kg P/yr.
Area 1
Area 1 consists of approximately 1.81 acres along the southwest portion of the Pond. Collection is provided by a pair of catch basins in Lake Shore Drive, discharging directly to the Pond. During neither of the two storm events which IEP sampled was discharge from this system observed, indicating that infiltration is possibly occurring and/or the catch basin sump is oversized. In either case, the percent contribution from this system is very low. Besides improved/increased street sweeping and catch basin cleaning, no other mitigation measures are recommended.
Area 2
Area 2 collects drainage via one pair of catch basins from approximately 2.85 acres on Lake Shore Drive. As at Area 1, no discharge was found during the two storm events when IEP conducted sampling. Given its relatively small area and, presumably, small nutrient contribution, it is not recommended that design changes be made to the system. Improved/increased street sweeping and catch basin cleaning practices are, however, recommended.
78

Area 3
Area 3 is very similar to Areas 1 and 2 in that it drains a relatively small area (1.74a.), collection is made by a pair of catch basins and discharge is to the Pond. Annual phosphorus loadings attributable to Area 3 total 0.154 Kg., or approximately 0.2% of all stonnwater loadings. Due to its relatively insignificant contribution, no system design changes are recommended.
Area 4
This catchment area occupies approximately 14 acres, including Simpson Road. Area 4 contributes 11.48 Kg P/yr to Dudley Pond, or 13.8% of all stonmwater phosphorus loadings and 7.9% of total phosphorus loadings.
Besides improving street sweeping practices and catch basin cleaning in Area 4, there is no opportunity for improved treatment through infiltration or retention/ detention techniques. There would be, however, the potential for diverting storm runoff from approximately 2/3 of the catchment area. Diverted runoff would be piped out of the basin to Pod Meadow, a distance of approximately 350 feet. Diversion of 10.31 acres (corner of Simpson Road/Emerson Road) would reduce the annual hydrologic budget to the Pond by 2.0%. Costs of this diversion would include piping, easement and erosion control. Estimated phosphorus removed equals 7.5 Kg/yr. Estimated costs total about $23,000 yielding a cost effectiveness of $307/Kg P removed over a ten year period.
Recommendations by Wayland Town Engineer, Lew Bowker (March 14, 1983) include modifying existing catch basins in order to limit diverted water to Pod Meadow. Modifications would consist of providing opportunity for increased infiltration from the existing catch basins. Estimated costs for this work would be $2,500 for modifying the existing eight catch basins. Cost effectiveness would be changed to $340 per Kg P/yr removed.
Area 5
Area 5 contributes approximately 4.51 Kg P/yr to Dudley Pond from a watershed of 5.14 acres encompassing Hawthorne Road. Phosphorus loadings from Area 5 comprise about 4.5% of stormwater loads to Dudley Pond and 3.1% of total phosphorus loadings.
Opportunities for decreasing nutrient contributions from Area 5 include improved street sweeping, catch basin cleaning and ponding. The upper 2.0 acres of the area could be routed through a town-owned parcel south of Richard Road. Infiltration and ponding would be provided, removing an estimated 1.53 Kg P/yr, assuming 90% efficiency (Wanielista, 1978). Estimated costs would include $3,000 for infiltrating basins, $20,000 for piping, $4,000 for pond construction, $500/yr for extraordinary maintenance, and engineering/design of $5,000, yielding a total ten year (nonfinanced) cost of $37,000 and a cost effectiveness of $2,176/Kg P removed.
It is also possible to reroute the middle 2.5 acres of Area 5 through another parcel of town-owned land just north of Lake Shore Drive. Ponding (-15,000 cu.ft.) and infiltration would be provided. Costs would include infiltration basin construction of $3,000, pond construction of $4,000, piping (-300 ft.) of $15,000, extraordinary maintenance of $500/yr, and $4,000 for engineering totalling $31,000 for a ten year period. Assuming 1.8 Kg P removed/yr., cost effectiveness would be $1,722.
79

iiCiI The final O.S acres of Area 5 currently discharges to a small ravine or hollow, prior to entering the Pond. It would be relatively easy to impound about 8,000 cubic feet of storage by construction of an earthen dike with outlet culvert and emergency overflow. The earthen dike would require approximately 100 cubic yards. With compaction the unit cost would be about $6~00/cu.yd. With loaming, seeding, clearing, outlet construction, and engineering, total cost would be approximately $3,000. Effectiveness is difficult to estimate. Mowever, even if it is assumed that it is only SO% effective, cost effectiveness ($3,000 ~ (O.S Kg P/yr x SO% x 10 yrs) would equal $1,200. One disadvantage is that private land would have to be used.
Area 6
Area 6 encompasses a relatively small catcllnent area (2.90 a.), yet yields the highest unitized loading rates (2.27 Kg P/ac/yr) of all the systems. As a result, Area 6 contributes about 6.S9 Kg P/yr to Dudley Pond. This represents 7.9% of all stornlwater phosphorus loadings and 4.5% of total phosphorus input.
The high unitized loadings are quite possibly attributable to the fact that Lake Shore Drive is unpaved throughout this catcllnent area. Catch basins examined showed an abundance of coarse (sand, gravel) materials and an absence of fines. It is believed that, due to the combination of steep slopes and unpaved roads, catch bas.in sumps fill quickly not allowing fine-grained materials to settle.
It is recommended that Lake Shore Drive be paved through Area 6 and that existing catch basins be redesigned oversized with the ability to infiltrate as well as dissipatE! the energy of incoming runoff waters. In addition, it is recommended that an infiltration basin be constructed along the existing easement to the Pond. Such a pond could provide approximately 10,000 cu. ft. of storage.
Costs foY' thi s work i ncl udi ng pavi ng (835 cu.yds x $S/cu.yd. =~$4 ,000), i nfi ltration pits (2 pairs x $3,000/pair = $6,000), additional drainage works ($lS,OOO), maintenance ($500/yr), pond construction ($4,000), and engineering ($7,000) would total approximately $39,000. Due to the limitations of pond and pit sizing relative to the catchment area, a 75% phosphorus removal effectiveness was assumed. ThereforE!, approximately 4.9 Kg P/yr would be removed, yielding a cost effectiveness (10 yr.) of $796/Kg P removed.
Area 7
Area 7 occupies about 1.lS acres at the northern end of Dudley Pond. The drain system cnnsists of approximately 300 feet of pipe and four catch basins in Maiden Lane. Phosphorus loading contribution from Area 7 comprises 1.8% of all stonnwater input and 1.0% of total phosphorus loadings.
Opportunities for decreasing loadings from this system include infiltration or diversion. Costs for diverting out-of-basin, it is estimated, would be about $32,000 for pipe and placemen~ or a cost effectiveness over a ten year period of $2,177/Kg P removed, prior to considering reduction in permissible loadings due to decreased flushing rate.
80

Construction of four leaching pits {$3,000/pair} and an infiltration pond {$4,000}, plus $500!yr maintenan~e would yield a cost effe~t~veness of ~1,~45/Kg P removed, assuming 90% removal (Wanielista,1978). In adgltlOn, the eXlstlng easement thro~gh private property would have to be expanded in order to accommodate the leaching PltS.
Area 8
Area 8 comprises the largest piped storm drain system, by catchment area {31.5 a.}, whichcdischarges directly to Dudley Pond. It also contributes most of any system to Pond phosphorus loadings, 19.92 Kg/yr., or approximately one quarter of all storm runoff loadings and 13.7% of total loadings.
There are several options available for reducing loadings from Area 8. These include out-of-basin diversion, retention/detention, and combinations thereof.
Diversion of all of Area 8 would involve piping through the backyards of five homeowners for a distance of approximately 700 feet. At an estimated cost of $50/ft. for exacavation, materials, installation, backfill, loaming and seeding and $5,000 for engineering, cost effectiveness would be $201 per Kg P removed. The primary difficulty with this alternative is removing about 6.3% of the Pond's total annual inflow, thereby reducing permissable loadings. Increased flood flows downstream would possibly increase. Occasional minor reduction in downstream water quality would also result.
The floodi:'1g concern may be alleviated by the insertion of a baffle in the exist ing discharge pipe to Dudley Pond. The baffle would permit diversion downstream of all runoff produced by minor rain events, and the first inch or so of runoff from major events. When storm flows overtopped the baffle, as in major storm events, runoff would be routed through the pond, as it is currently.
It would be possible to separate Area 8 into two sub-catchment basins - one comprising approximately 10.5 acres in the Bayfield Road Area, and the other, about 21 acres in the Lakeview Drive area. The Bayfield Road system could be diverted with costs similar to those for diverting the whole system. Cost effectiveness would, of course, be lower at about $602/Kg P removed. However this is still relatively cost effective vis-a-vis other alternatives. Reduction in total annual inflow would be about 2.1%.
The remaining 21 acres could be routed through a detention pond to be constructed at the corner of Dudley Road and Bayfield Road combining a portion of Area 8 with a portion of Area 10. The pond would potentially have approximately 50,000 cubic feet of storage and would drain about 25 acres. Costs for pond construction would include purchase of a 0.5 acre lot (vacant and unbuildable), excavation of approximately 1500 cubic yards of material, and provision for an overflow/outlet. Total estimated costs for this work would total about $17,000 ($5,000 for land; $10,000 for excavation, hauling, grading and seeding; and $2,000 for outlet construction). Based upon estimated detention time, approximately 2.4 Kg P/yr would be removed via this system. Cost effectiveness for a ten year period would be $708/Kg P removed.
81
iiEiI Based upon the effectiveness and cost effectiveness of diversion of all of Area 8, it is bel"ieved that this is the best alternative for this system and is therefore reconJTIended. This will result in a reduction of 19.92 Kg P/yr entering Dudley Pond.
Area 9
This catclnent area, located on Dudley Road, is extremely small (0.15 a.) and designed to alleviate a very local drainage.problem. Phosphorus contributions from Area 9 are estimated to total 0.2 Kg/yr.
In the oVI~rall picture, the contribution of Area 9 is extremely small. Expenditures for treatrnent, other than improved street sweeping/catch basin cleaning, for reducing loadings from Area 9 are not justified.
Area 10
Area 10 comprises approximately six acres along the eastern side of the Pond. In part, dra"inage flows through a small wooded swamp at the corner of Dudley and Bayfield Roads. Very little flow was found to be coming from this system during the storms sampled by IEP. Consequently, it is believed that some retention benefit is currently being derived from the existing swamp. Improved street sweeping and catch basin cleaning is the recommended stormwater runoff treatment measure for Area 10.
Area lOA
This systl~ drains the largest area (49.55 a.) of all of the structured storm drain systems within the watershed. It was found to discharge to the Pond after retention/detention provided by a large ( 5.5 a.) swamp/marsh wetland complex. The elevated and restricted outlet of the wetland could be enhanced to provide excellent retention qualities, virtually negating any nutrient contributions from thi s system. Furthennore, it ; s bel i eved that further use coul d be made of thi s natural retention area.
Area 11
Area 11 d~ains 2.68 acres along the southeast portion of the watershed. It contributes approximately 0.7 Kg P/yr, or less than 1% of stonnwater and total phosphorus loads. Its proximity to town-owned land and the large wetland retention area (Area lOA) and its juxtaposition to area 12, deem it practical to reroute this system. Costs for doing this are included in the Area 12 discussion.
Area 12
Area 12 consists of 5.75 acres along the south side of the Pond. The collection system ;s comprised of three catch basins on Knollwood Lane. Discharge is directly to Dudley Pond. Based upon IEP sampling data and modeling results, Area 12 is contributing an estimated 4.15 Kg P/yr to the Pond. This comprises about 5% of all storm loadings and almost 3% of total phosphorus loadings from all sources.
82
Due to the very flat gradient on Knollwood Lane~ it is possible to connect systems 11 and 12~ with ultimate discharge to the wetland retention pond in area lOA or to an infiltration/ponding facility near the corner of Knollwood Lane and Cottage Road. Estimated costs for the former alternative include approximately 1000 feet of pipe at $50/ft.; installation of probably two pairs of catch basins ($2~000/pair); erosion mitigation at the discharge point ($1 ~OOO); and adjustment of the wetland outlet to compensate for increased hydraulic loading ($5~000). The tota'] cost would then be $60~000 providing an estimated 90% phosphorus removal efficiency and a cost effectiveness of $1 ~373/Kg P removed over a ten year period.
The town-owned land at the corner of Knollwood and Cottage does not appear large enough to allow for construction of a leaching facility. Runoff from the approximate 25 acre watershed areas 11 and 12 would be too great to be accommodated by a subsurface leaching facility. An infiltration pond could be constructed on the town-owned land. Retention of the initial inch or so of runoff from areas 11 and 12 appears to be feasible using the approach. Piping costs would be about $20~000 (400 feet x $50/foot); pond construction is estimated at $4~000; and additional catch basins (2 pairs)~ $4~000. Another $2~000 is included for modifications to existing catch basins in 11 and 12 to promote additional infil tration; $2~000 is included for design purposes and $500/yr for extraordinary maintenances~ bringing the total ten year costs to $37~000. Assuming a 90% nutrient removal efficiency~ cost effectiveness would be $847 per Kg P/yr removed.
Other Stormwater Management Options/Recommendations
The discussion~ above~ focused on storm loadings discharged~ via pipes~ directly or indirectly to Dudley Pond. There are~ however~ approximately 130 acres~ or 53% of the watershed not served by stonnwater collection systems. These areas contribute an estimated 34.1 Kg P/yr to the Pond. In that most of this area is developed~ source loading mitigation strategies must focus on correcting inappropriate lawn techniques~ poor erosion control and shoreline maintenance, etc. It is believed that the most appropriate format for addressing these issues is through promotion of a strong lake association and through educational pamphlets/ reminders of best yard/shoreline management practices. Such a project should be spearheaded by the Lake Study Committee and treated as a local in-kind match to 314 implementation funding.
Areas within the watershed where this study has identified poor erosion control practices include the unpaved portion of Lake Shore Drive, exposed road cuts along Lake Shore Drive near the public beach, and the parking area in the cove near the junction of Dudley Road and Bayfield Road. During stonn sampling events~ IEP personnel noted plumes of silt being discharged to the Pond from these areas. In the cases of Lake Shore Drive and the parking area~ paving would, it is believed, alleviate these problems. It would make sense at the parking area to gain,through acquisition or easement, formal public access (boat launching) rights,along with half a dozen or so parking spaces. Perhaps Massachusetts Self Help funds could be sought by the town for acquisition of this area.
83
7.0 EVALUTION OF IN-LAKE MANAGEMENT/RESTORATION ALTERNATIVES
7.1 Herbicide/Algicide Treatment
Chemical treatment of nuisance aquatic vegetation using state and US EPA approved herbi ci dE~S is sti 11 the most common method of weed control, due primarily to its favorable (low) cost, as compared to other management/restoration techniques and the relative simplicity by which it can be accomplished. Prior to the appli cation of any herbicide/algicide in ponds and lakes throughout the Commonwealth, a permit must first be filed with the Massachusetts Department of Environmental Quality Engineering - Waterways Division, and municipal approval must also be obtained from the local Conservation COlTJ11ission. All chemical treatments must be performed by a state/federal certified commercial applicator, licensed to dispense aquatic herbicides.
At Dudley Pond, the development of both macrophyton and algal nuisances during summer dictates that both herbicides and algicides would have to be used or else a broad spectrum herbicide/algicide such as Aquazine could be applied, as it was during 1976 and 1978.
Both herbicides and algicides kill the aquatic plants by either disrupting the normal pattern of cell division or breaking down the cell wall. Herbicide treatment of aquatic plants is considered a "cosmetic or palliative" approach to managing aquatic nuisances by many lake specialists, including US EPA. Following herbicide treatment, the decomposing aquatic plants release the nutrients stored in their tissue~ back into the surrounding water. This sudden pulse of nitrogen and phosphorus may then, in turn, be assimilated by nuisance causing microscopic algae, potentially leading to "bloom conditions."
Another potential drawback of herbicide/algicide treatment is the long term concerns regarding safety of the materials applied. Although any herbicide/algicide to be uSI:d for aquatic plant control must be registered and approved by both the EPA and State Pesticide Board, there have been several chemicals (i.e., silvex and sodium arsenite) that were once thought safe and used, which have since been taken off the market due to their residual/cumulative characteristics and potential adverse effects on non-target organisms. At present, the extensive testing and toxicological data required by EPA prior to product registration and labeling should insure a higher degree of safety than in years past.
Our macrophyton survey conducted during September 1981, revealed approximately 40 acres of aquatic vegetation, predominantly P. pusillus· var. pusillus. Contact herbicides such as Diquat or Aquathol K (dipotassium endofhal) are effective in controlling this particular species of pondweed as well as ~. guadalupensis,which was observed to be on the increase during this past summer. Estimated total treatment costs inclusive of labor and materials are $225 - $275/acre or a total cost of $9,000 - $11,000 for 40 acres. For vascular plant species such as these, annual recurring treatments are likely to be r'equired.
Rather than chemically treating nuisance rooted vegetation alone, DEQE preparedspecifications and provided partial funding for the treatment of Dudley Pond in 1976 with a broad spectrum herbicide/algicide called Aquazine. During the 1976 summer treatment, a total of 840 lbs. of Aquazine was applied to Dudley Pond. Conversations with several Pond residents and casual observations made by IEP
84
personnel show that Aquazine provided very effective control of both the dominant rooted vascular plants and microscopic algae throughout the summer and fall months. Applying current chemical and labor costs to the Aquazine treatment specifications outlined in 1976 yields an estimated total 1982 cost of $6,500.
The Aquazine label allows for its use in ponds only. Though there is no time restrict~on for swimming after treatment, ponds treated with Aquazine are not to be used for irrigation or watering of livestock for 12 months. The slow breakdown and loss of Aquazine from both the water and sediments, seemingly contributes to its effectiveness as a herbicide/algicide, but on the other hand, its residual nature raises justifiable concern with respect to tts long term safety. EPAls current "label restrictions for Aquazine may be an indication of that agency·s uncertainty regarding its long term environmental effects. Should the Town decide to pursue chemical treatment of the weeds and algae in the future at Dudley Pond, we recorrnend further investigation into the toxicological/environmental properties of )\quaz;ne be carried out prior to its use.
If Aquaz"i ne ; s not used, we woul d then anti ci pate the need for both a herbi c; de (Diquat or- Aquathol K) and algicide (copper sulphate) treatment program at DudleyPond. TI,e anticipated annual cost for treating the microscopic algae at Dudley Pond witl, copper sul phate is $1,800 based upon a projected need for two treatments.
In summal~y, herbicide/algicide treatment of nuisance plant growth at Dudley Pond is not rE~commended as a long term restoration technique and is not fundable under the EPA :314 Clean Lake Program guidelines. Future chemical treatments may be considered on an interim basis however, until which time a commitment to implementthe watel~shed management/restoration strategies outlined in this report is forthcoming. Based upon an apparent need to chemically treat approximately one-half (46%) of the total Pond surface area for nuisance weed growth, there is a high probability of increasing the severity of the algal blooms as a result of the herbicidE~ treatment, unless a combined herbicide/algicide such as Aquazine is used. Other methods of controlling nuisance aquatic weeds such as mechanical harvesting and hydro-raking are 1ikely to provide a comparable degree of weed control, with less potential risk of exacerbating existing algal nuisances or creating adverse environmental effects.
85
7.2 Mechanical Harvesting
Mechanical harvesting of nuisance aquatic vegetation has become more widespread as an effective lake management .technique. Today's manufacturers of harvesting equipm~nt offer a variety of different sized machines ranginq in price from approxlmcltely $20,000 - $75,000. Fi nns offeri ng harvesti ng servi ces on a contractual basis have also contributed to the recent increase in the number of ponds and 1akes pursui ng thi s management tool.
Unlike chemical treatments, with harvesting no foreign substances (herbicides) are added to the pond or lake water. During the harvesting operation the cut pl ants ar'e simultaneous ly removed from the waterbody, thereby reduci ng the avail ability of recycled nutrients for potentially troublesome microscopic algae. Harvesting does not usually necessitate temporary restrictions on lake usage for swimming, fishing, etc., as occurs with most herbicide treatments.
On the other hand, mechanical harvesting is generally considered a shortterm management approach, necessitating at least one cutting per summer and often times multiple cuttings, with little promise of achieving a sustained reduction in macrophytic growth from one year to the next.
The EPA n 980B) "Clean Lakes Proaram Guidance Manual." describes mechanical harvesti ng along with other 1ake managffilent/restorati on techni ques. The offi cial position of EPA with respect to harvesting as stated in the manual is, "the. C.te.an LaJ.:eA PMgJta.m c.on6'<'de.M haJr.VeA.ti..n.g to be. a p~ve. appMac.h to .take. ILeAtoJLa..:tij)n. .<.n. mO.6t c.a.6e..6, and the.JLe.noILe. !LaJl.e1.y e.lig'<'b.te. nolL n-<.n.anUa.t a.6.6-<--6.tan.c.e.." Nevertheless, EPA has funded two harvesting programs, one at Lake Bomoseen in Vermont and the other program at a large lake situated in Wisconsin. EPA and other res,earchers do agree,however, that harvesting can aid to long term lake restoration if the amount of nutrients removed in the cut vegetation exceeds the lake's net nutrient income. Harvesting is further recommended for use at ponds and lakes, (as opposed to herbicides) where a serious commitment or progress towards reducing watershed nutrient loadings has been made.
The scope of work for the diagnostic/feasibility study of Dudley Pond did not include measurements of aquatic plant biomass nor analyses of the weeds for their nutrient content. Measurements of Potamogeton biomass were,however, undertaken for the Committee in conjunction with a limited water quality biological sampling program designed to monitor the effectiveness/environmental effects of hydroraking. Based upon measurements from three 1m2 plots, the density of pondweedaveraged 12.5 tons/acre (wet weight) or 11,344 kg/acre. These density estimates taken at Dudley Pond are somewhat below (approximately 30%) the plant biomass data genE'rated by rEP at Morses Pond (November 1980) but are reasonably compar
. able. Assuming plant tissue concentrations of total ,phosphorus and total nitrogen in the Potamogeton collected from Dudley Pond are comparable to the nutrient levels ascertained "in the samples analyzed from r·lorses Pond, allows for an approximation of the nutrients tied up in the Potamogeton at Dudley. This figures out to an estimated 3.3 kg/acre and 44.3 kg/acre of total phosphorus and nitrogen, respectively. Admittedly, there are a m.nber of variab1es which may effect the actual phosphorlls and nitrogen reserve represented by the Potamogeton standing crop at Dudley Pond, but we do believe that data extrapolation and projections of this
86
iiCi' nutrient pool are worthwhile, despite a lack of hard data. Applying the phosphorus and nitrogen estimates above to the entire 40 acres of Potamogeton at Dudley Pond, yields a potential ability to remove an estimated 132 kg of phosphorus and 1,772 kg of nitrogen during a single harvest. The removal projections for phosphorus equate to 91% of the total annual watershed loading. This is not to say that harvesting in itself will restore Dudley Pond, but combined with effective strategi E~S to curb watershed nutri ent loadi ngs, harvesti ng should serve towards retardin9 further eutrophication of the Pond. The long hydraulic retention time of Dudley Pond (1.51 yrs.) and high percentage (46%) of the littoral zone found to SUPPOy't rooted plant growth, suggest that internal nutrient recycling from decomposing plants may be an important loading source.
The majority of rooted vascular plants are capable of utilizing nutrients from either or both the water and bottom sediments. The consensus of the literature (Carpenter, 1980; Hutchinson, 1975) generally supports the thinking that macrophytes dl~aw the bulk of their nutrients from the sediments, assuming both ample sediment and water nutrient concentrations. The point of this discussion is to make it clearly understood that the Dudley Pond sediments, although not excessively rich in phosphorus, will probably support vigorous weed growth for l1\1ny yeats to come despite repetitive annual mechanical harvestings.
Harvesting costs typically range between $350-$400/acre, based upon the 1982 rates quoted by pri vate contractors (Aquati c Contro1 Technology, Inc., September 1982). The above costs do not include trucking and disposal of the harvested plant material. On most harvesting projects undertaken for municipalities, town crews and equipment can efficiently handle this aspect of the work. In those situations whE~re the contractor is also retained to haul the vegetation away from onshore disposal sites, an estimated $50/acre should be added to the unit costs ci ted above.
The growth of f. pus ill us at Dudl ey Pond typi ca lly does not reach the water surface or interfere with swimming and boating, until the latter part of July or early August. Unlike watermilfoil, f. pusillus likely reproduces from seed, as does J1. guadalupensis. The mid to late slll1lT1er growth of these two nuisance plants at Dudley Pond means that one harvest per summer scheduled around the first week of August would provide a reasonable level of control throughout the balance of the swimming season. Based upon a per acre cost of $375, a single harvest of 40 acres would run approximately $15,000. The annual cost of harvesting is more than twice the projected cost of chemical treatment with Aquazine and approximately one-third more expensive than treatment of the vegetation with either Diquat or Aquathol K. Whereas a large scale chemical treatment with either Diquat or Aquathol Kwould almost assuredly necessitate follow-up algae treatments, there may be less of an increase in algal density after harvesting.
The purchase and operation of a mechanical harvester by the Town of Wayland and/ or the Dudley Pond Association is not likely to be a cost effective alternative to using an outside contractor,unless the harvester could also be worked at other Town owned ponds and lakes. The price of a smaller harvester such as
87
7.3
an Aquamarine model H-220 is approximately $35,000 inclusive of the harvester itself, trailer and delivery charges. Estimated annual operating and maintenance costs based upon a 40 acre harvest are projected to run $10,000. Assuming a 10 year life expectancy for the harvester, the combined capital and 0 and M costs are $13,500 per year, nearly equal to the cost of contracting. Direct equipment purchase would become more attractive with respect to cost if the weed infestation expands its current distribution throughout the Pond or as stated previously, if the Town has need for the harvester at other ponds and lakes accessible for public use.
Hydro-Raking
The Hydro-Rake was designed several years ago by Virgilio Construction Company of Pittsfield, Massachusetts. Unlike a mechanical weed harvester, the Hydro-Rake literally rakes the lake bottom with an eight foot wide York Rake attached to a light-weight back-hoe. The back-hoe is mounted on a pontoon barge. Propulsion of the barge is provided by paddle wheels powered by a diesel engine.
The Hydro-Rake will remove aquatic plants, root material and bottom muck to a depth of 12 feet. The maximum lifting capacity of the back-hoe is approximately 600 lbs. with an average rake-full weighing 300-400 lbs. In that the Hydro-Rake has no o~board storage capacity, each rake-full of material must either be deposited directly onshore or else loaded onto a transport barge.
One advantage of the Hydro-Rake as compared to a conventional cutter/harvester is that the Rake removes nuisance aquatic vegetation at the sediment/water interface. The cutting depth on a harvester must constantly be readjusted for changes in bottom contours, which makes it more difficult to constantly maintain the cutter bar just off the bottom. The maximum cutting depth for the harvester is only five feet as compared to a twelve foot working depth for the Hydro-Rake.
Past experience with the Hydro-Rake has shown it to be equally as effective on removing emersed and submerged aquatic vegetation. One thorough raking per summer has provided good control of white waterlilies, spatterdock and other macrophytes possessing a tuberous type of rhizome which the Rake can easilydislodge from the bottom (Aquatic Control Technology, Inc, September 1982). Good carry-over benefit or control of the above macrophytes for one to two yearsfollowing the initial raking has been observed.
On submerged aquatic plants such as those species common ~n Dudley Pond .0:. pusillus and lie guadalupensis) use of the Hydro-Rake 1S less cost effectlve, due to their fine root system which precludes a high percentage of root removal. One raking per summer is likely to be required with little potential of reduced vegetative regrowth during the following year.
The productivity of the Hydro-Rake is slow in comparison to most.mechanical harvesters. Contracting rates for Hydro-Rake weed removal are llkely to run$800$900/acre for submerged macrophytes or more than twice the cost of harvesting.
88
During the operation of the Hydro-Rake there is a temporary increase in water turbidity and suspended solids. Disturbing the Pond bottom may also increase nutrient concentrations within the water column, although preliminary monitoring data collected at Dudley Pond does not show a major change in water quality after hydro-raking.
At Dudley Pond, use of the Hydro-Rake is recommended where either white or yellow waterl i l"i es are predomi nant. The demonstrated effectiveness of the Hydro-Rake on removing these species of vegetation justifies the higher cost, estimated at $1,000 - $1,200/acre. Presently, waterlilies are not a major nuisance at Dudley Pond. The two northern coves adjacent to lake Shore Road and the southeast COVE~ (near the inlet) harbor contain the greatest concentrations of lilies.
7.4 Dredging
Dredging of ponds and lakes may be undertaken to: (1) remove nutrient enriched bottom sE~diments which contribute significantly to internal nutrient recycling; (2) expose a nutrient deficient bottom type such as coarse sand and gravel, which is less conducive to the growth of rooted aquatic plants, or (3) deepen a cove or shore·line which has filled in, to increase water depth for swimming/boating while precluding-light required by aquatic plants.
Measurements of the muck type sediments conducted throughout Dudley Pond, revealed a total sediment volLnne of 1,148,000 cu.yds. laboratory analyses performed on two sediment core samples revealed comparatively low concentrations of total phosphorus, yet moderate to high levels of total Kjeldhal nitrogen. Sectioning of the core obtained from the deep hole area of Dudley Pond and subsequent analyses showed comparable levels of nutrients between the 0-1 ft. and 1-2 ft. sediment depths.
little technical justification can be provided for recommending dredging as the primary ~utrient reduction technique at Dudley Pond. Sediment nutrient recycling and loadings were not found to be a major cause of Dudley Pond's current eutrophic state, although data in this area is lacking. Secondly, nutrient contributions to the water from the bottom sediments are far more likely to be greater in those deeper and anaerobic portions of Dudley Pond ()20 ft) which are beyond the working depth of most conventional hydraulic dredges such as the Mudcat. Furthermore, current external or watershed nutrient loadings have been shown to be highrelative to permissible/targeted loadings. Dredging therefore would not prevent the development of nuisance algal populations until nutrient inputs to the Pond are substantially reduced.
Dredging of the fine grained, low permeability muck se~iments i~ the co~es and along the shoreline of Dudley Pon~ however, could posslbly provl~e for ~ncreased groundwater inflow. Increased water flow and added depth followlng sedlment removal rriay allow for higher annual permissible ~u~rie~t loadings to th~ Pond, which is desirable. Further study and quantlflcatlon of the potentlal benefits that might be derived is needed.
89

Dredging of the Pond's littoral zone or bottom areas currently supporting rooted aquatic vegetation has no assurance of providing long term relief from nuisance conditions unless deepening were to occur beyond the photic zone (approximately 8-9 ft). The dominant submerged macrophytes (f. _pusillus and ~. guadalupensis) were not restricted in their distribution to soft muck type sediments only. Along certain stretches of the Dudley Pond shoreline, the bottom type was predominantly sand, mixed with or covered by a thin layer of muck/silt, yet nuisance densities of these two macrophytes were still observed.
Sediment removal throughout the two western coves and the southeastern cove however, would be desirable to increase present water depths for swimming and boating. These areas are delineated on Figure 17 and the estimated total vol~ne of muck sediments in each cove are provided below:
Area A: 8,706 cu.yds. Area B: 1,524 cu .yds. Area C: 2,957 cu.yds.
Dredging costs vary dramatically depending upon the method of dredging used (hydraulic, dragline or conventional equipment), distance to and construction costs for sediment disposal site~ and geographic locale of the project. Dredging costs for projects conducted by the Army Corps of Engineers throughout the northeastern United States were reported at $4.96/cu.yd. (Peterson, 1979). The Corp of Engineers' cost information seems to be a representative average for the two more recent lake dredging projects conducted here in Massachusetts - Morses Pond, Wellesley and Nuttings Lake, Billerica.
Applying the $4.96/cu.yd figure to the combined total volume of sediment in the three coves at Dudley Pond, equates to an estimated cost of $65,407. This cost ($65,407) may be somewhat low, however, due to the apparent absence of nearby land based sediment containment sites which are required for hydraulic dredging - operations. At Dudley, either a drag-line mounted on a floatation barge or possibly the use of the Hydro-Rake, are likely to be the two most feasible methods by which dredging could be accomplished. This type of operation would, however, require transport barges to move the material to accessible on-shore disposal site(s) and to allow for sediment dewatering/consolidation prior to trucking. The dense residential development found along and behind the shoreline of the northern two coves, in particular, is likely to preclude even temporary containment of the sediment in this area.
The potential disturbance and environmental effects of dredging upon the rest of the Pond could be mitigated by sealing off the mouth of these coves with a semi-penneable siltation curtain. Based upon our survey data, none of these three areas currently provides unique habitat for fisheries or wildlife.
Pl.I11pi ng the water from Dudl ey Pond in order to dredge the 1Htora1 sediments with conventional excavating equipment is feasible using high volume pumps.Based upon a 10 foot drawdown, a time period of two weeks would be required to drop the water level at a PlITlping rate of l4~546 gallons per minute. The abov~ calculation assumes no inflow of water during the period of pumping. EroslOn of the outlet channel and possible downstream flooding are likely to be probl!~ms encountered. A pumping discharge rate of 14,546 gal/min.,
90

FIGURE 17 PROPOSED AREAS OF SEDIMENT REMOVAL AND CURRENT MAJOR TOWN OWNED LAND .PARCE LS
o (
2000 I ft.\ 2000
.1iI POTENTIAL DREDGE SITES
E~ TOWN OWNED PARCEL
91
iiC~ equivalent to 32.4 cfs, is substantially higher than the maximum water discharge through tl1e Pond outl et occurri ng under present conditi ons. The bathymetry of Dudley Pond would likely require cutting/dredging of channel into these coves in order to achieve sufficient dewatering. Excessive muck depths after dewatering may still not support heavy excavating equipment. Dry excavation of the littoral sediments is not recolT1l1ended.
In summary, dredging of these coves would be desirable, especially from the perspective of the lake front property owners who reside in this area. Post dredging conditions are not likely to render a significant improvement to the overall trophic state of the Pond. The expenditure of Town, State or Federal funds for sediment removal in these coves may be difficult to justify, considering that the anticipated benefit will be to the private waterfront property owner, rather than to the general public. Dredging is likely to be quite complex, requiring ~urther engineering design and feasibility. A conservative cost estimate for this work is approximately $65,000, yet considerably higher costs are likely to be realized.
7.5 . Nutrient Precipitation/Inactivation
Nutrient precipitation is a lake restoration/management technique used to remove phosphorus from the water column,thereby limiting the growth of microscopic algae. Nutrient inactivation,on the other hand, is directed at reducing internal phosphorus recycling from the bottom sediment. Both techniques (precipitation and inactivation) involve treatment of the lake, usually with the chemicals aluminum sulfate Ot' sodi urn alllTIinate. For preci pitati on treatments, the chemi ca 1 is typically applied as a liquid slurry upon the water surfaces. During nutrient inactivation treatments the chemical is injected along the lake bottom or hypolimnion, by dispersing the chemical throughweighted hoses attached to the pumpsand surface vessel.
Nutrient precipitation/inactivation treatments are most effective in ponds or lakes where external(watershed) nutrient loadings have been reduced. At DudleyPond, the potential effectiveness and longevity of either a precipitation or inactivation treatment would be greatly enhanced by first curbing watershed nutrient contri but ions, primarily stonnwater and septi c. Preci pitati on/i nacti vati on treatments seem to be equally successful in ponds or lakes, but more so in waterbodies that stratify and are characterized by a long hydraulic retention time (slow flushing). Dudley Pond clearly meets one of these criteria in that its hydraulic retention time is 1.54 years. Dudley also stratifies thennally during summer although the hypolimnion occupies only 4.6% of the total Pond volume. Phosphorus concentrations in the hypolimnion of DUdley Pond are elevated (approximately double) relative to epilimnetic concentrations during sllTImer. Hypolimnetic total phosphorus was found to range between 0.04 mg/l - 0.07 mg/l in the three sampling rounds perfonned durino the summer of 1981. Assuming an average hypolimnetic total phosphorus concentr~tion of 0.05 mg/l, equals a phosphorus mass of 2.4 kg, of which a portion,could potentially be recycled throughout the Pond following fall turnover.
In cornpariison to other eutrophic lakes however, neither the concentration or mass of hypolimnetic phosphorus at Dudley is exceptionally high.
92
iiCi' A combined phosphorus precipitation/inactivation treatment of Dudley Pond is recommended once watershed nutrient contributions have been curbed, especially the stonnwatel" loading component. Phosphorus precipitation and surface application of the chemil:al is suggested over the entire 92 acres of the Pond. Although epilimnetic phosphorus concentrations at DUdley are admittedly low (>0.01 - 0.03 mg/1) alum treatments perfonned elsewhere (i.e., Morses Pond, Wellesley) have demonstrated a remarkabh~ ability to clear the water, through chemical coagulation/precipitation of microscopic algae and suspended organic complexes.
Following a surface (precipitation) treatment, the alum floc which settles to the bottom will continue to adsorb some additional phosphorus that might otherwise be released to the water. Quantifying sediment phosphorus release rates and differentiating between aerobic and anaerobic bottom contributions is extremely difficult. Both sources are recognized, however, as potentially significant contributors.
Throughout the deeper (>20 ft.) stratified porton of Dudley Pond, injection of the chemical at or below the hypolimnion is recommended to help reduce sediment phosphorus release. This area is approximately 19.2 acres or 21% of the Pond surface.
The two chemicals, aluminum sulfate (alum) and sodium aluminate, have been most frequently used in previous phosphorus precipitation/inactivation lake restoration projects. The salts of these chemicals work in three ways: (1) by forming aluminum phosphate; (2) by entrapPing phosphorus containing particles in the water column, and (3) by adsorbing phosphorus to the surface of the aluminum hydroxide (the main chemical product of the precipitation reaction [EPA, 1980Al).
Alum dosage for precipitation treatment is determined through a series of jar tests whereby varying concentrations of the chemical are added to achieve the desired level of phosphorus reduction. In the case of Dudley Pond, dosage would also be based upon the removal of microscopic algae and color causing substances from the water. Dosage determinations of aluminum to bottom sediments (inactivation) are also determined by jar tests with a maximum dose established at that dose above which dissolved alum1num concentration exceeds 50 ug Al/l (Kennedy and Co~ke, 1982). Aluminum solubility is minimal between a pH range of 6 to 8, therefore, a dose of aluminum sulfate sufficient to reduce pH to 6.0 is considered as optimal. The range in pH at Dudley Pond (6.2-8.0) should allow for good floc formation and effective inhibition of phosphorus release in water depths greaterthan 20 feet. Calculations of dosage determined prior to treatment will assess the need for using sodium aluminate in combination with alum to mitigate a severe drop in pH at Dudley given its rather low buffering capacity.
Long term stud~es ~f alumi~um toxicity on aquatic organisms (fish, invertebrates, etc.) and lack1ng 1n the 11terature. Kennedy and Cooke (1982) review the work which has been done and discuss the findings/conclusions of such researchers as Burrow~ (1977)~ ~reeman and Everhart (1973) and Narf (1978). They conclude that a~um1num tOX1C1ty does not appear to be a significant problem, as long as pH 1S controlled and/or RDA (residual dissolved aluminum) is not allowed to reach levels in the area of 50 ug Al/l. In that aluminum is one of the more abundant metals found in the earth's crust, is widely used in water treatment processes and is found in many foods, the potential adverse effects/risks of aluminum on human health, do not appear to be significant.
93
7.6
iiCi' The costs for a precipitation/inactivation treatment of Dudley Pond are difficult to define without first determinina the dosage and possible requirements for adding sodium alllTlinate in combination with alllTl to prevent drastic changes in pH. Prelimina,~ cost data may be drawn however~ from two recent alum precipitation treatments performed in 1981 at Morses Pond in Wellesley and Spi Pond in- Ari ington. Chemical costs for a total surface treatment of Morses Pond (surface area 102 acres, mean depth 7.7 ft.) were about $7~000, while chemical and application costs totaled approximately $10,800 at Spy Pond (Boschetti, personal communication, SE!ptember 1982). Dudley is somewhat smaller in surface area than either Morses or Spy Pond, but its mean depth (9.23 ft.) lies between the other two pond depths. Therefore, the estimated total cost (1982) for a total surface treatment of Dudley Pond is approximately $12,000. The actual cost would be higher than $12,000 however, after allowing for an estimated $2,000 for determining dos,age and the additional $3,000 for the al um required to treat the hypolimnion of Dudley Pond. The total cost inclusive of final design and implementation is therefore estimated to be $18,000.
In summary, a combined phosphorus precipitation/inactivation treatment is recommended at Dudley Pond after the implementation of the stormwater management alternatives. Such a treatment would serve to reduce sediment derived phosphorus from both the shallow aerobic and deeper bottom areas of Dudley Pond. In addition, an immediate short-term improvement in water clarity would be realized with a reasonable potential for attaining lasting benefit for more than one year. The comparative cost is low ($18,OOO)relative to the anticipated benefit.
Aeration/Live Bacteria, Hypolimnetic Withdrawal, Biological Controls/ Substitution and Drawdown
Previous sections of this report have discussed the anticipated effectiveness and costs of those in-lake techniques that are most likely to control nuisance weed and algal populations at Dudley Pond. Other lake restoration/management techniques including those methods listed above, have been applied successfully to other 'I akes across the country. However, based upon Dudl ey Pond I s morphometry, hydrology, aquatic ecology and other factors contributing to its current trophic condition, certain techniques are either not applicable, technically infeasible or simply would not work.
Aeration of ponds and lakes has been used to increase/maintain dissolved oxygenlevels required by fish and to oxidize and lower iron and manganese concentrations in water supply reservoirs. Aeration/destratification systems are designed to provi dE! even mi xi ng throughout the enti re water column, breaki ng down the thenna1 gr'adi ents whi ch may di rectly or i ndi rectly effect water quality between the lake surface and bottom. Hypolimnetic aeration systems provide oxygen to the lake's hypolimnion, but are designed not to destratify the waterbody.
At Dudley Pond, the volume of the oxygen deficient hypolimnion is relatively small as compared to the total water volume of the Pond. Furthermore, oxygen deficits do not persist over an extended time period and nutrient loadings
94

from the sediments are thought to be low relative to watershed contributions. Therefore~, either type of aeration system (destratification or hypolimnetic) is not likely to result in significantly reduced in-lake nutrient concentrations, which in-turn would lead to a decline in nuisance algal blooms.
Aeration in combination with adding live bacteria to Dudley Pond was addressed as a possible management tool in the Larkin (1979) study. Clean-Flo Laboratories, Inc. of hlopkins, Minnesota, markets a multiple inversion aeration system which may be used in combination with chemical additives (Clean-Flo Lake Cleanser) to precipitate phosphorus from the water. Clean-Flo also sells non-pathogenic living bacteria (Clean-Flo Living Organisms). According to the company, the bacteria feeds on the sediments and through digestion of the organic matter, added water depth will result, when used in combination with their aeration system.
Documented case-histories of increased water depths being attained in lakes after the addition of Clean-Flo organisms, are lacking in the literature. The firm could not provide us with names of state or federal officials who had used the Clean-Flo orqanisms and who could attest to its effectiveness in red~cinq sediment volumes. We can understand how aeration in combination with live bacteria would accelerate the decomposition of organic material in sewage lagoons, but the water quality and biological processes on-going at Dudley Pond are certainly not comparable to the gross organic loadings entering a man-made lagoon where the environment can be controlled. One must also question the survival rate of the live bacteria that would be added. Too many unanswered questions and insufficient data preclude thi:s management technique as a viable recommendation for Dudley Pond.
HypolimnE~tic withdrawal could not be achieved at Dudley Pond without plJ11ping water from the Pond. In addition to the capital costs for high volLaTIe pumps, annual operation and maintenance expenditures are likely to be high. Like aeration, this technique is more applicable for use at ponds and lakes with high internal nutrient loadings.
Fall/winter drawdown is becoming a commonly used method of controlling ~uisance vascular plants in recreational ponds and lakes. Lowering the water level of Dudley Pond the necessary eight feet to expose the weed beds to conditions of freezing and drying, is not possible without pumping. A gravity drawdown by means of a siphon, would require running a pipe along the outlet channel some 2,000 feet before the necessary drop in elevation would be reached. Drawdown is not likely to provide for good control of either f. pusillus or !!. guada"lupensi$ owing to their primary mode of reproduction which is from seed. Drawdown would non have any significant benefit with respect to controllingexisting algal populations and could, in fact, exacerbate the existing nuisance by reducl~d competition and nutrient rel ease from decaying macrophytes.
Herbivorous fish such as the grass carp or white amur (Ctenopharyngodon idella) ha ve been shown ta pravi de effect i ve control of certain nu; sance vegeta t ion (Sutton, 1981). Current research concerning the grass carp is most intensive throughout the southern states, in particular, Florida. It is currently illegal
95
to introduce grass carp into the waters of the Commonwealth, although a proposal to introduce a sterile hybrid carp on an experimental basis, is pending before the Division of Fisheries and Wildl ife Advisory Board. Other biological control agents such as fungi and" insects which attack aquatic weeds, are also being researched, however none have yet been investigated sufficiently to allow for their implementation at Dudley Pond. .
Crawford (1979) introduced a program of biological sUbstitution at several Madison County, New York farm ponds. Following lowering and bulldozing of the sediments from these ponds, the macroscopic algae, Chara vulgaris, was introduced . .£. vul gari s rapi dly became domi nant and Crawford observed that its short bushy growth was associated with clear water, less phytoplankton and reduced wind driven turbidity, because of the rhizoidal growth within the substrate.
The introduction of a low profile alga or macrophyte, in order to replace a taller nuisance species of vegetation, would be desirable not only at Dudley Pond, but would also have utility at many other Massachusetts ponds and lakes. To achieve a successful introduction, the existing nuisance macrophytes must first be displaced as was done in Crawford's experiments by draining the ponds and then bulldozing the sediments. At Dudley, lowering the water level cannot eas ily bE~ accompli shed. Adequate removal of the current nui sance macrophytes might be accomplished through hydro-raking, then allowing for the seeding of a test area with Nitella spp. This alga (Nitella spp.) is currently found at Dudley Pond but is sparsely distributed. We do not have the technical data to show that this type of program has a good probability of working, but encourage the Division of Water Pol:lution Control to consider funding research in this area, perhaps using Dudl ey Pond as a test area.
96

8.0 CONCLUSIONS AND RECOMMENDATIONS
8.1 Program Summary and Costs
Dudley Pond is a relatively shallow (mean depth 9.23 ft.), eutrophic Pond characterized by summer blooms of microscopic blue-green algae and a moderate distri bution of submersed vascular plant growth. The watershed is quite small (336.1 acres) re"lative to the surface area of the Pond (90.8 acres), and is situated entirely within the Town of Wayland.
Stonnwatel~ runoff and groundwater provi de the vast majority of water inflow to the Pond. There is but one surface stream or inlet to Dudley Pond, that being an interm"ittent brook which only flows during spring runoff or following major storm events. Dudley Pond has a long hydraulic retention time. of 1.52 yrs., or a slow flushing rate.
Land use \~ithin the watershed is predominantly dense suburban. The Pond shoreline is highly developed with year-round homes, many of which were converted from seasonal dwellings, on small lot sizes of 10,000 sq. ft. or less. Town water service· is provided throughout the watershed, however public sewage disposal is not.
Nutrient 10adings to the Pond are derived largely from stonmwater runoff and leaching of subsurface sewage disposal systems located within 300 ft. of the shoreline. On an annual basis, the total phosphorus loading to Dudley Pond is estimated at 144.9 Kg/yr of which 83.3 Kg (57.5%) and 46.6 Kg (32.2%) are derived from stormwater runoff and septic systems, respectively. The balance of the annual phosphorus load (15 Kg/yr) is contributed through direct precipitation on the Pond surface and ambient groundwater. Internal phosphorus recycling from the Ponds bottom sediments (2.4 Kg/yr) is insignificant as compared to external or watershed derived nutrients.
Targeted phosphorus loadings to restore Dudley Pond to a mesotrophic state and provide suitable transparency (water clarity) throughout the SllT11ller months for water contact re!creation, is estimated at 65-75 Kg/yr. In other words, the present annual phosphorus load to the Pond exceeds the permissible value by a range of 70-80 Kg.
The thrust of the proposed restoration/management program for Dudley Pond, presented in this report, is logically focused in two areas. The first is through watershed management by curbing stormwater and septic inputs of phosphorus. The second is through in-lake restoration/management techniques including nutrient precipitation/inactivation, mechanical weed harvesting and dredging, are also recommended to hasten the recovery of Dudley Pond and to provide control of nuisance aquatic vegetation.
Table 22 , presents and summarizes the recommended management restoration program for Dudley Pond and the estimated costs for final design and implementation. The projected improvement (lowering) in the Pond's trophic status, upon implementation of the septic and stormwater management recommendations, is shown in Figure 18.
97
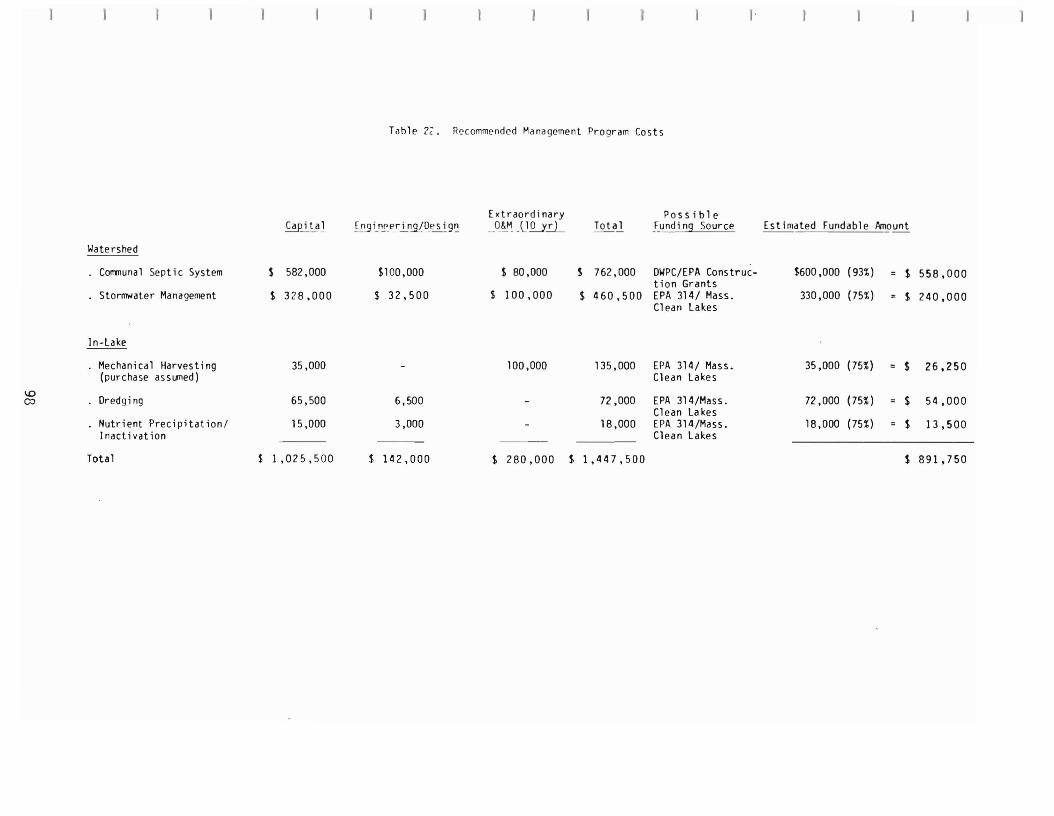
J.
Table 2(. Recommended Management Program Costs
~~J ~i.n~er~~/D~!g':l.
Extraordinary ..O~~ .UQ...i'..!:.L Total
Possible .F.und i ng Source Estimated Fundable Amount
Watershed
Communal Septic System
Stormwater Management
$ 582,000
$ 328.000
$100,000
$ 32,500
$ 80,000
$ 100,000
$ 762,000
$ 460,500
DWPC/EPA Construction Grants EPA 314/ Mass. Cl ean Lakes
$600 ,000 (93%)
330,000 (75%)
= $
= $
558,000
240,000
In-Lake
w ~
Mechanical Harvesting (purchase assumed)
Dredging
Nutrient Precipitation/ Inactivation
35,000
65,500
15,000
-
6,500
3,000
100,000
-
-
135,000
72 ,DOD
18,000
EPA 314/ Mass. Clean Lakes
EPA 314/Mass. Clean Lakes EPA 314/Mass. Clean Lakes
35,000 (75%)
72,000 (75%)
18,000 (75%)
= $
= $
= $
26,250
54,000
13,500
Total $ 1,025,500 $ 142,000 $ 280,000 $ 1,447,500 $ 891,750

...L-_----'-_--'-_...l...----'----'-----'----'
- 0.1
IMPLEMENTATION OF STORMWATER MANAGEMENT ALTERNATIVES
:'l E-Cl -a: I ,..-
0.01 L..- ...JL-.-_---JL-l-_---J_---L_.....L...---L.---L----I.---L ----'
1.0 10.0 MEAN DEPTH m
L = AREAL PHOSPHORUS LOAD1NG g/m2 . yr R = PHOSPHORUS RETENTION COEFFICIENT T = HYDRAULIC RETENTION TIME yr
FIGURE.18 DUDLEY POND TROPHIC STATUS WITH' EFFECTUATION
OF WATERSHED MANAGEMENT CONTROLS
99
100.0
ii:i' 8.2 Project Schedule and Monitoring Program
The extent to which the recommendations contained in this report are implemented will be dependent upon voter approval of funds by the residents of Wayland and continued availability of matching funds through the federal and state programs outlined in Table 22. Recent indications from the Surface Water Quality Study Committee are that a step-wise approach will be followed to secure local matching funds in view of the substantial costs for implementing all of the recommended in-lake and watershed management strategies. At the 1983 Wayland annual spring town meeting, the Study Committee is expected to seek an appropriation of approximately $25,000 to match the 50% implementation grant awarded by the Division of Water Pollution Control under the Massachusetts Clean Lakes Program. The combined town/stat€ funds of $50,000 for fiscal year 1984 have been tentatively targeted for final engineering/design of the stormwater improvements and mechanical harvesting of nuisance weed growth, to be performed by a private contracting firm. Consi derhlg that storm.-Jater was found to contri bute an estimated 57.5% of the annual phosphorus load to the Pond, curbing stormwater inputs has logically been assigned a high priority (Table 23). Weed harvesting planned for this sUl1111er will provide irrlllediate benefit for recreational usage of the Pond and will also enable the Corrrnittee and Town boards/commission an opportunity to observe the harvesting operation first-hand and to evaluate the feasibility of purchasing such equipment.
Engineering design of the communal septic systems will presumably follow in 1984/ 1985. There does not appear to be any significant economic incentive for completing the stormvater septic system engineering design and construction work concurrently, other than consideration for continuing inflation.
The nutri l~nt/preci pita ti on treatment is recommended after the storllMa ter management program has been implemented and the major loading of phosphorus entering Dudl ey Pond reduced. This treatment can proceed, however, before implementation of the corrrnunal septic systems and if summer algal blooms continue to persist in the Pond.
Selective dredging of the coves is desirable and recorrrnended, however, sediment removal w"ill primarily benefit a minority of waterfront residents and will not substantially improve (lower) the trophic state of the~Ppnd. The Town and State must first dec"ide whether or not to spend public funds for work that will have minimal benefit to the general public. An implementation schedule for dredging has therefore not been included in the suggested project implementation schedule.
EPA requi,'ements for the water qual ity monitoring program are specified, in part,in the February 5, 1980 Federal Register, page 7798-9. The requirements call for pre-project, implementation and post-project in-lake rronitoring which includes monthly sampling from September through April and biweekly sampling from May throughAugust for' a one year period. The Division of Water Pollution Control's (November, 1982) Clecln Lakes Program - Rules and Regulations, directs that rr.onitoring be provided during construction phases or in-lake treatments and calls for a three year post-construction or post-implementation monitoring program to evaluate project effectiveness.
100
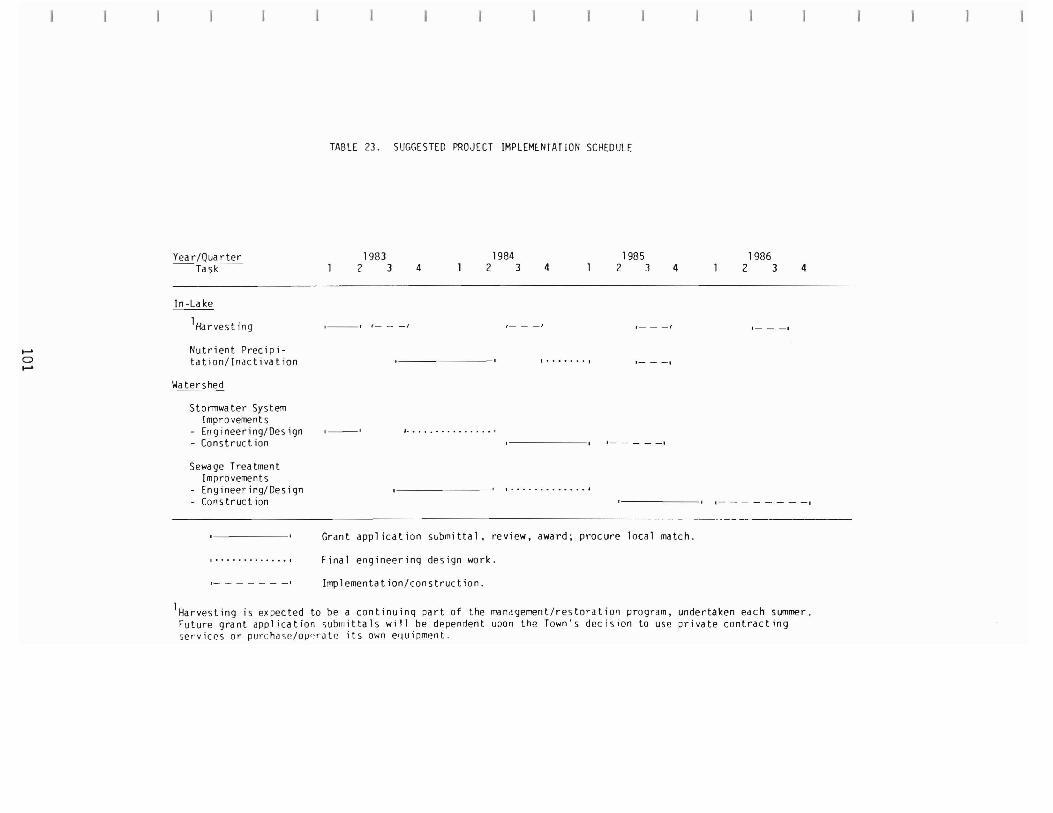
o-
TABLE 23. SUGGESTED PROJECT IMPLEMENTATION SCHEDULE
Yea r/Qua rter 1983 1984 1985 1986 Ta sk 2 3 4 2 3 4 2 3 4 2 3 4
In -La ke
1Harvest ing , , ( t ( I
Nutrient Precipitation/Inactivation , I J- --I
Watershed
Stormwater System Impro vements
- Engineering/Design - Construct ion
,---, I ,
1 __ --I
Sewage Treatment Improvements
- Engineering/Design - Construct ion
1 0 ,
1 - - - - - --1
1 I
Grant app1 ication submittal, review, award; pt"ocure local match.
Final en9ineerin9 design work.
Implementation/construction.
1Harvesting is expected to be a continuin9 part of the management/restoration program, undertaken each summer. Future grant application 'iublilittals will be depennent upon the Town's decision to use private contracting services or purchase/o~~rJte its own equipment.

At Dudley Pond, both a pre and post-harvesting survey of the vascular aquatic plant comnunity is recommended, to evaluate the longevity of benefit provided from the :proposed single cutting/harvest (Table 24). The contractor performing the work should be required to maintain daily records for; the total number of hours worked, number of harvester engine hours, number and location of harvester loads and a rough breakdown of the relative percentage of different weed species removed from each area. This information will assist the Town in evaluating the direct purchase/operation of a mechanical harvester. Daily secchi disc (transparency) measurements should also be taken during the course of the harvesting activity in the central portion of the Pond and in the general area where harvesting is being performed.
Following implementation of the stormwater management strategies, a minimum one year monitoring program is recolTll'lended. This program should include monthly water quality and biological sampling of the Pond in addition to water quality monitoring and flow measurements for a minimum of four storm events of varying duration and intensity. The in-lake program should include the collection of grab water samples at a minimum of three depths at the deep-hole location - each sample to be analyzed for: pH, alkalinity, total phosphorus, nitrogen series and specific conductance. In addition, fecal and total coliform bacteria should be analyzed in the surface sample. Algal identification, counts and chlorophyll-a should be performed on both a surface and column sample. Temperature-dissolved oxygen profiles should be performed during each water quality sampling round with measurements taken at one meter intervals. Transparency should be measured with a secchi disk.
Storm drain outfall area nos. 4, 5, 8, and lOA are recommended for stormwater monitoring after implementation of the recommended improvements. The "first flush" should be sampled and the discharge sampled thereafter at appropriate intervals for a minimum of two hours, or one hour after peak flow, whichever time is shorter. As a minimum, the following parameters should be examined: total phosphorus, ammonia nitrogen, nitrate nitrogen, Kjeldahl nitrogen and total and fecal coliform bacteria. The Division of Water Pollution Control may suggest the inclusion of additional parameters including suspended solids and selected metals.
Implementation of the communal septic system program may not occur for several years. Hydrogeologic and groundwater quality monitoring of the proposed corrununal septic system site is recommended prior to construction to establish ambient conditions. Monitorin'~ should continue for a period of at least two years after the homes are tied-in and usage begins. Again, this monitoring program presented above, is preliminary and subject to reVision, as the Massachusetts Clean Lakes Programrequirements are more fully defined.
102
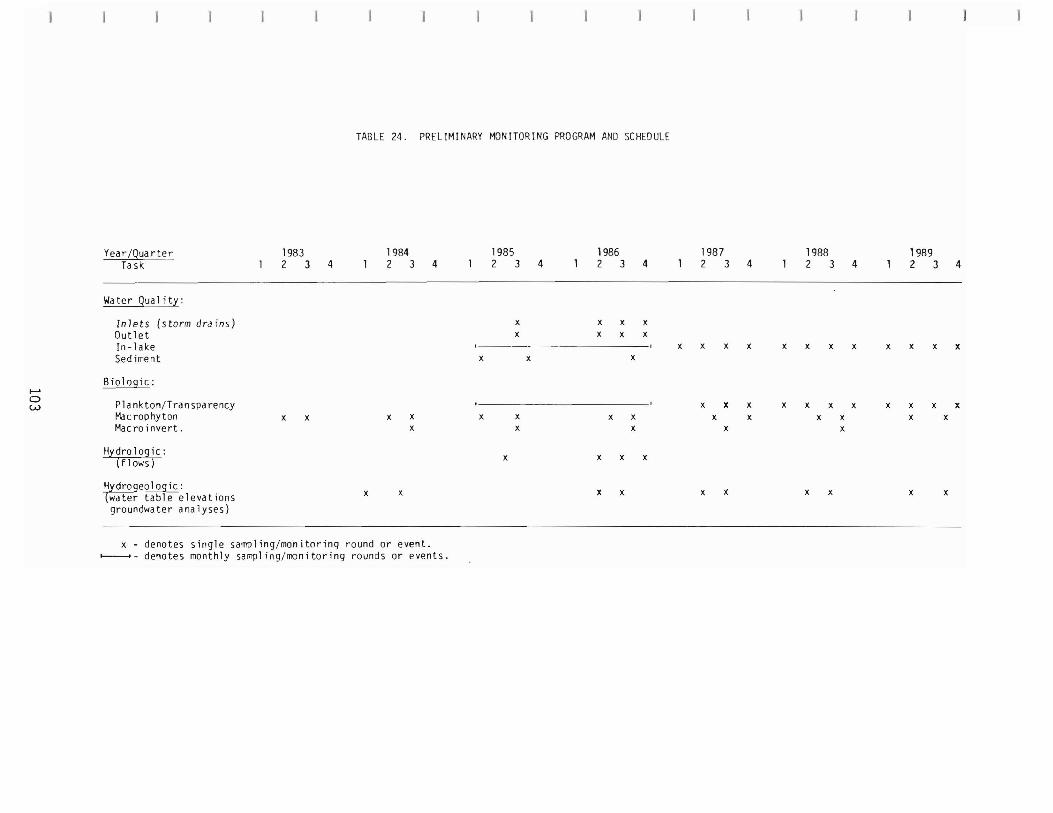
TABLE 24. PRELIMINARY MONITORING PROGRAM AND SCHEDULE
Year/Quarter Ta sk -
I 1983 2 3 4 1
1984 2 3 4 I
1985 2 3 4 1
1986 2 3 4 1
1987 2 3 4 1
1988 2 3 4 1
1989 2 3 4
Water ~:
Inlets (storm drains) Outlet In-lake Sediment x
x x
x
x x
x x
x
x x
x x x x x x x x x x x x
....... 0 w
Biologic:
Plankton/Transparency Macrophyton Mac ro invert.
x x x x x
, x x
x x x
x
x x
x
x
x x
x x x
x x x x
x x x
x x
x
Hydrolo ic: flows) x x x x
~e~~: water table elevations groundwater analyses)
x x x x x x x x x x
x - denotes single sampling/monitoring round or event. ~- denotes monthly sampling/monitoring rounds or events.
The Wayland Surface Water Quality Committee was chartered
by Town Meeting in 1980. Its purpose is to study and evaluate
the various bQQ.j.~_..oL_water -wi.thi.nJ1Le....._.t"O.J~l]1-J and to recommend
and implement programs for their maintenance, restoration and
improvement.
We are presently involved with the restoration of Dudley
Pond. An in-depth evaluation of the pond was conducted by the
engineering firm I.E.P. in 1980 which identified existing prob
lems and made recommendations for appropriate solutions. As a
result, we have sponsored ongoing weed harvesting and hydroraking
(debris and sludge removal) for the past four years. These
in-pond measures will soon be augmented by attacking the source
of the major portion of nutrients which flow into the pon~ and
provide nourishment for the out-of-control weed and algae growth
that will eventually cause the demise of the pond. This will
be accomplished by the construction of a storm water runoff
management system throughout most of the watershed. The instal
lation of collection and leaching structures, plus the paving of
Lakeshore Drive and other unimproved roadways will serve to pre
vent the flow of nutrients to the pond, while at the same time
cause the accumulated stormwater to recharge the groundwater
supply, a secondary but nonetheless important benefit. Care
will be taken to maintain the rural character of the neighborhood;
the roads will Qe-im~oved but not widened; the leaching system-- _.------ ---'-' -.---. _. ------._.#

will be inconspicuous and will rely on gravity rather than
mechanical means to accomplish its purpose.
The well experienced engineering f~rm, Storch Associates,
has been retained to design this facility and supervise its
construction. The cost, approximately $720,000 will be paid
with a 75% matching grant from the State, through the Clean
Lakes Act. The Town's share, about $180,000 is equal to the
amount presently being sought to pave a small portion of
Lakeshore Drive, so the financial benefit to the Town is
obvious. An additional benefit will be the lack of necessity
for abutters to pay betterment costs for road improvements.
We have been assured of funding by the State Department of
Environmental Quality Engineering (DEQE), provided that support
from the neighborhood and the Town is obtained. We have met
with the Conservation Commission, Highway Department, and Road
Commissioners and have received their overwhelming blessings.
Indications of support have also come from the Selectmen and
Finance Committee.
We urge you to voice your support of this program promptly.
An article has been presented to the Town Meeting Warrant
requesting the necessary 25% funding from the Town. Please ask
our Selectmen to get behind this cause, volunteer to help us
if you can, and by all means come to Town Meeting and vote for
our request. Approval by Town Meeting will mean that construc
."
tion can begin in very short order. This project will be of
immeasurable long-term benefit to Dudley Pond and all of its
neighbors. A neighborhood meeting will be scheduled soon
for the purpose of providing more detailed information and
answering questions. Please plan to attend.
Town of Wayland . Surface Water Quality Committee
Tom Belote, Chairman Arlene Pollak John Darack
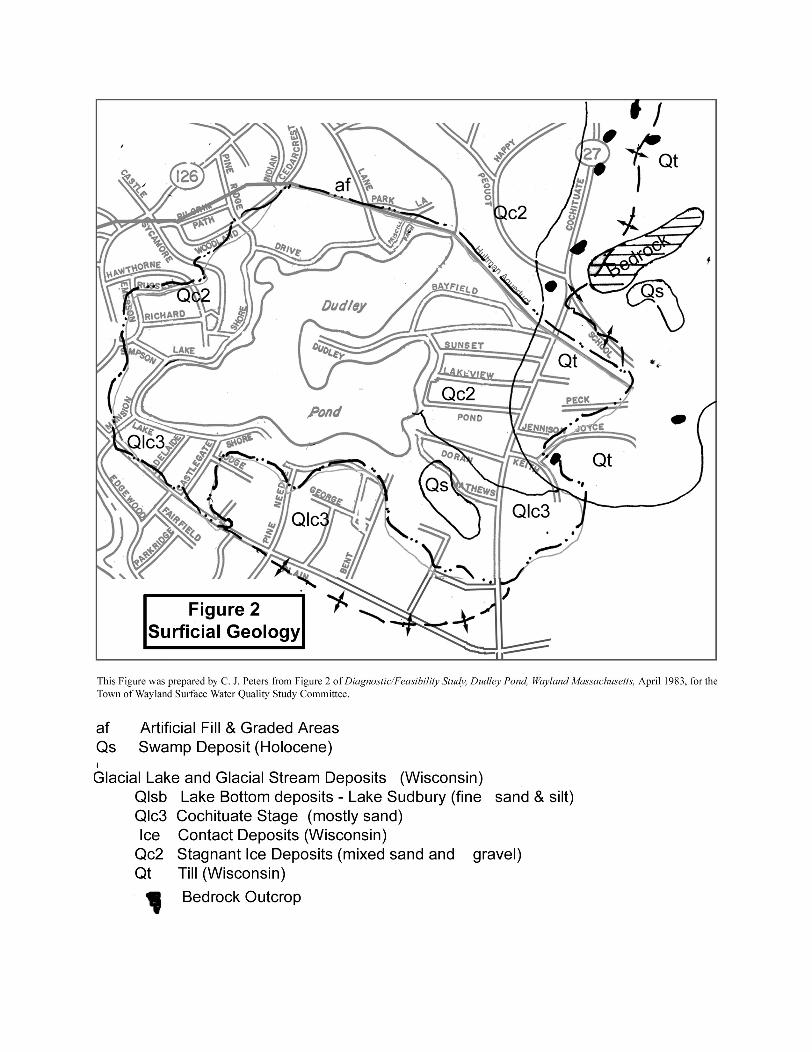
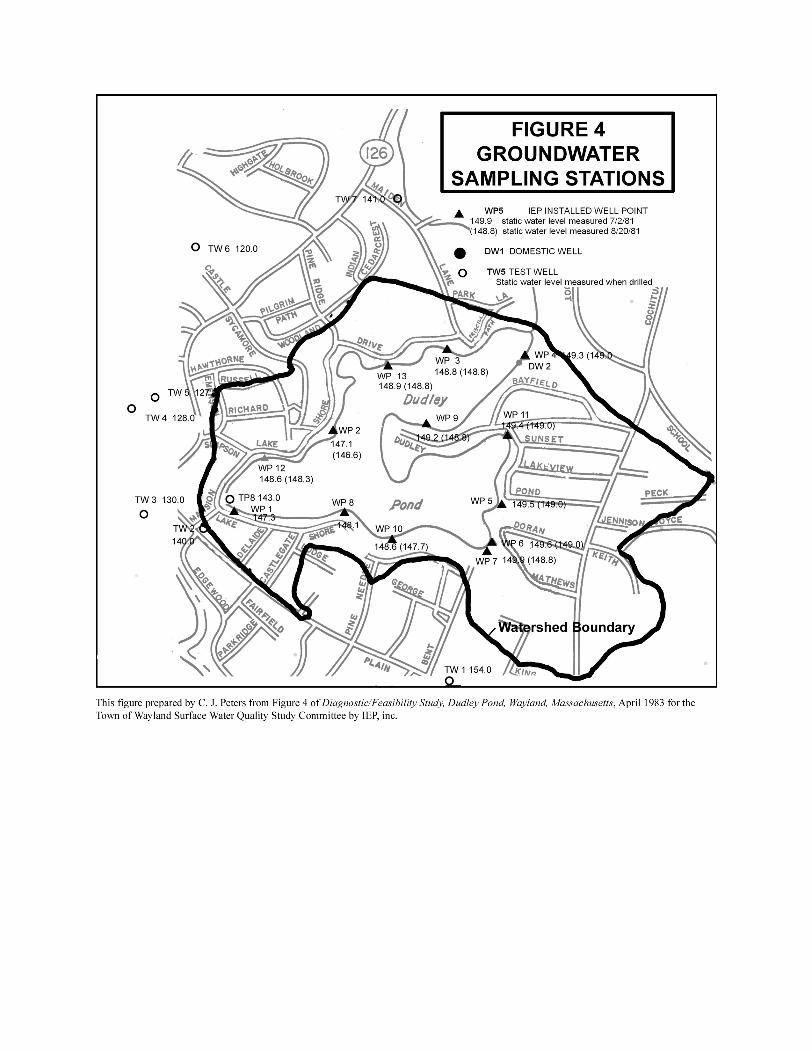
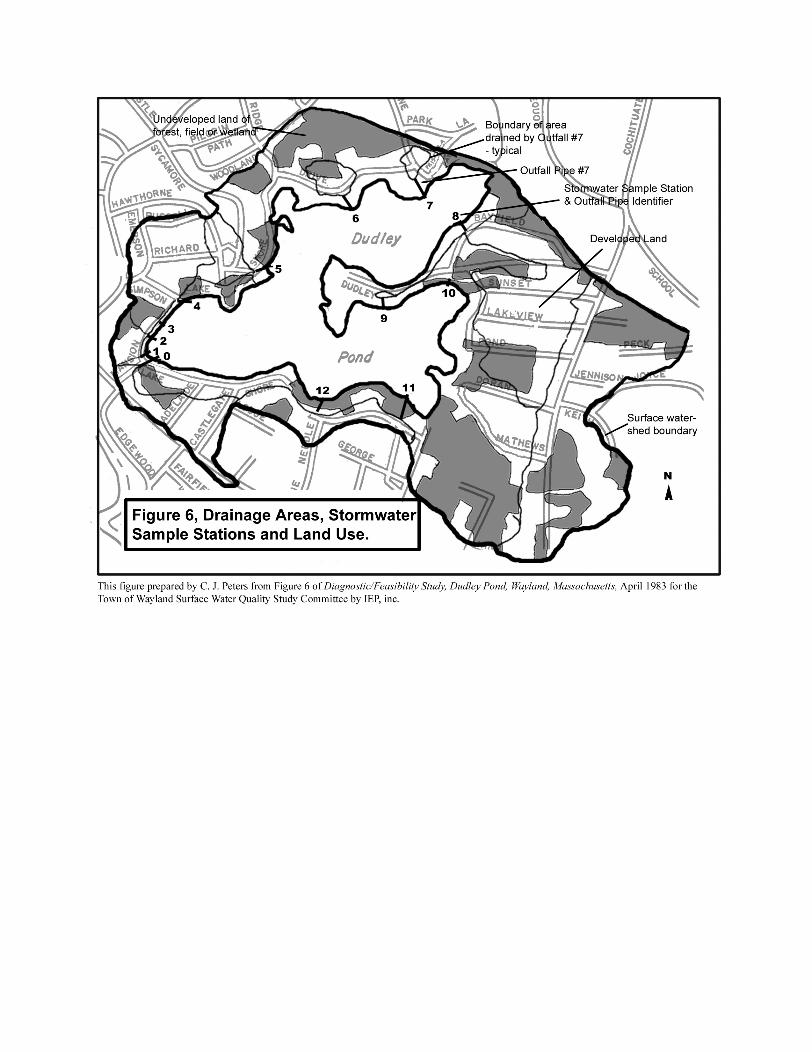
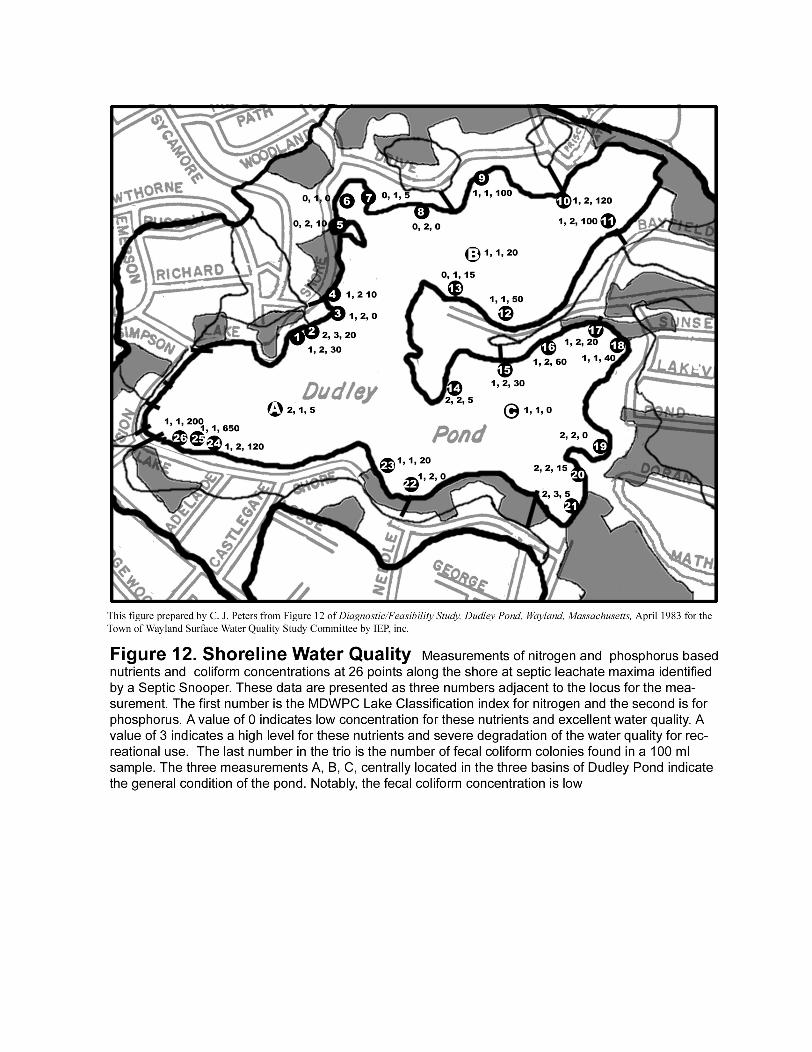

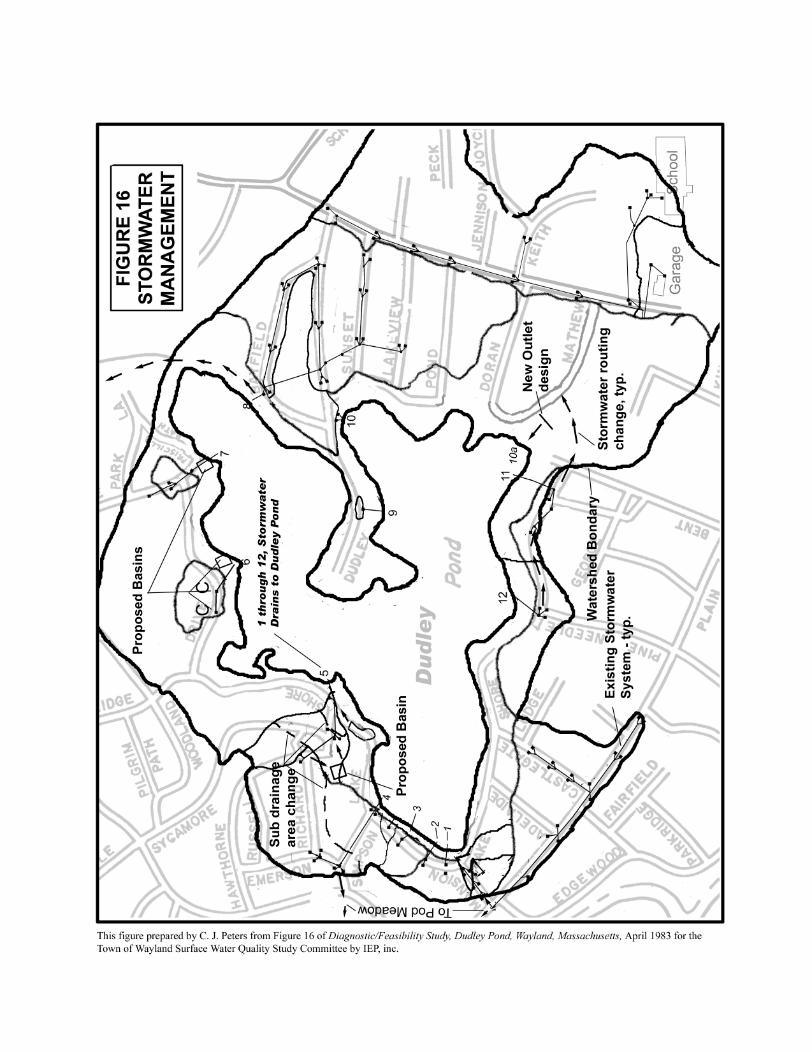

iiSi'
APPENDIX A
Description of Selected Plume Locations
Appendix
Description of Suspected Plume Locations - Shoreline Water Quality Survey Dudley Pond
Survey performed 0 n May 13, 14, 1981 . The following are verbal descriptions of potential leachate plume locations. The plume number, panel meter readout and plume location will be listed.
80 organics channel (flourescence)Pl ume 1; 20 inorganics channel (conductivity)
This sample was taken directly in front of a small grey house with the name R.A. Sullivan on a name plaque. The most distinct portion of'the plume was directly behind the dock opposite the center of the house, approximately one foot lakeward of the railroad tie retaining wall. The plume extended along the length of the house,and cold groundwater seeps could be felt entering from the lake bottom. The Lake bottom fronting the house was cornered with filamentous algae.
80 organicPlume 2: 25 inorganic
This plume was located at the corner of a red house on the water, next to the railroad tie wall which is opposite the brick chimney. The white house next to the red one should also be examined because a less distinct plume extended to the front of this house.
40 organicPlume 3: 40 inorganic
Sampling of plume 3 was performed in front of a set of cement stairs leading into the water at the corner of a rust colored house labeled Campbell. The sample ~"as taken 2.5 feet from shore.
Plum 4: 50 ~rganic. ~~e~ 30 lnorganlc
This plume was sampled one foot from shore, midway between the corner of a brown and yellow house and the chain link fence.
Plume 5: 100 ~rganic. o 1 norgam c
The sample for plume 5 was collected deep in the corner of the cove directly parallel to the Keep Out sign on the penninsula. It was taken 15 feet off shore adjacent to a yellow waterlily weedbed. This plume extended out into the cove.
80 organicPlume 6: 40 inorganic
The collection of sample 6 was performed offshore and between some heavy vine growth and the small dock. The sample was collected closer to the small dock than the vine growth.
Plume 7: 100 organic20
The sample for plume 7 was collected in front of a broken cement retaining wall at the corner of the white cottage. The elevated organic channel readings dropped as we rounded the point of the cove.
P1 ume 8:
This plume was sampled at a rich brown colored house. The plume was most distinct at the corner of a boulder wall next to the dock in front of a very large oak tree. A U" diameter metal pipe in the ground next to the dock was not flowing.
P1 m g. 100 organicu e . ~ inorganic
This plume was located at a house with a cement first floor and a green, painted second floor. The sample was collected in front of the flag pole two feet out from shore.
10 organicPlume 10: 70 inorganic
Plume 1C was sampled directly in front of a 12" diameter cement storm drain exhibiting no flow. The storm drain is located next to R. Kelly's house. This plume extended into the next cone but may have been a result of the 12" storm drain.
Phll11e 11: 10 organi c 60 inorganic
This plume was sampled at a stonn drain located between a large willow tree on ..... shore. This seemed to be a very strong, distinct plume .
Pl e 1r,. -12 organi c urn (.c· lOa inorganic
Sampling of this plume was collected directly in front of cement stains leading to the waters edge next to a dock. The house belongs to a Mr. T. Belote. The plume was not distinct and continued as we moved out of the cove.
Pl 1~l· 40 organi c ume ~. lOa inorganic
Sample 13 was collected four feet from shore next to the dock fronting a fieldstone house. A broad pll.rne extended between pl urnes 21 and 13.
PlLme 14: 10030
This plwne was sampled at the end of the point. A gradual increase on the organics chamnel indicated that this plume was indistinct and possibly a change in background water quality.
40Plume 15 30
Plume 15 was taken at an 8" diameter concrete drain located between a brown house (Pollack's) and a yellow house. There was no flow at the time of sampling, however, disturbed sediment indicated a recent flow.
80Plume 16:: 40
This plune was collected at the waters edge in front of a broken down dock, fronting a yellow home.
100Plume 17:: 100
This sample was collected at an 8" metal stonn drain to the left of the launching ramp at the Chateau restaurant as you approach from the water. There was a small amount of flow from the pipe, apparently draining a wetland upgradient from the pond.
Plume 18: 100 40
This sample was collected in front of the railroad tie barrier supporting the evergreen shrub hedge in front of the Chateau. This appeared to be a rather small, well-defined plume. Both parameters stabilized after mooring from this spot.
100Pl ume 19: 80
Sample 19 was taken approximately 81 to the left of a cement property boundary marker. The house is painted blue on the first floor and brown on the second. The sample was taken near shore in front of a moss-covered boulder. The plume was centralized between the dock and the cement property marker.
50Plume 20: 100
This sample was collected 8" to the left of a dock directly fronting a black lamppole at the waters edge. The house on the lot is white with black trim.
100Plume 21: 100
This sample was taken at the tributary centering the cove. Both panel meters pegged upon entering the small flow out of the brook. The organic material throughout the cove was very deep.
50Pl Lme 22: 100
Sample 22 was collected under the third extension of a dock. The dock is fronted by several cut-off maples and stumps. A redwood staircase extends up the steep slope.
60Pl ume 23: 20
Sample 23 was collected along the shoreline fronting a grey, natural wood house up on the hill. The sample was taken 2.5 feet from shore, 25 feet to the right of a concrete stairway leading up to the house. Aspotlight is located on the shore.
60Pl LITle 24: 30
P1LlTle 24 was located in front of a white house with a white cement retaining wall. The sample was collected next to some floating barrels and directly in front of cement stairs leading to the water.
Plume 25: This sample was collected in front of the same white house mentioned in plume 24 1 s location. It was taken underneath the red pier extending into the water.
80Pl ume 26: 20
This sample was collected on the left side of the dock next to the dock mentioned in pl~le 25. This appeard to be a rather broad, poorly defined plume. The high fluorescence readings extended from the last plume location to Mansion Beach.
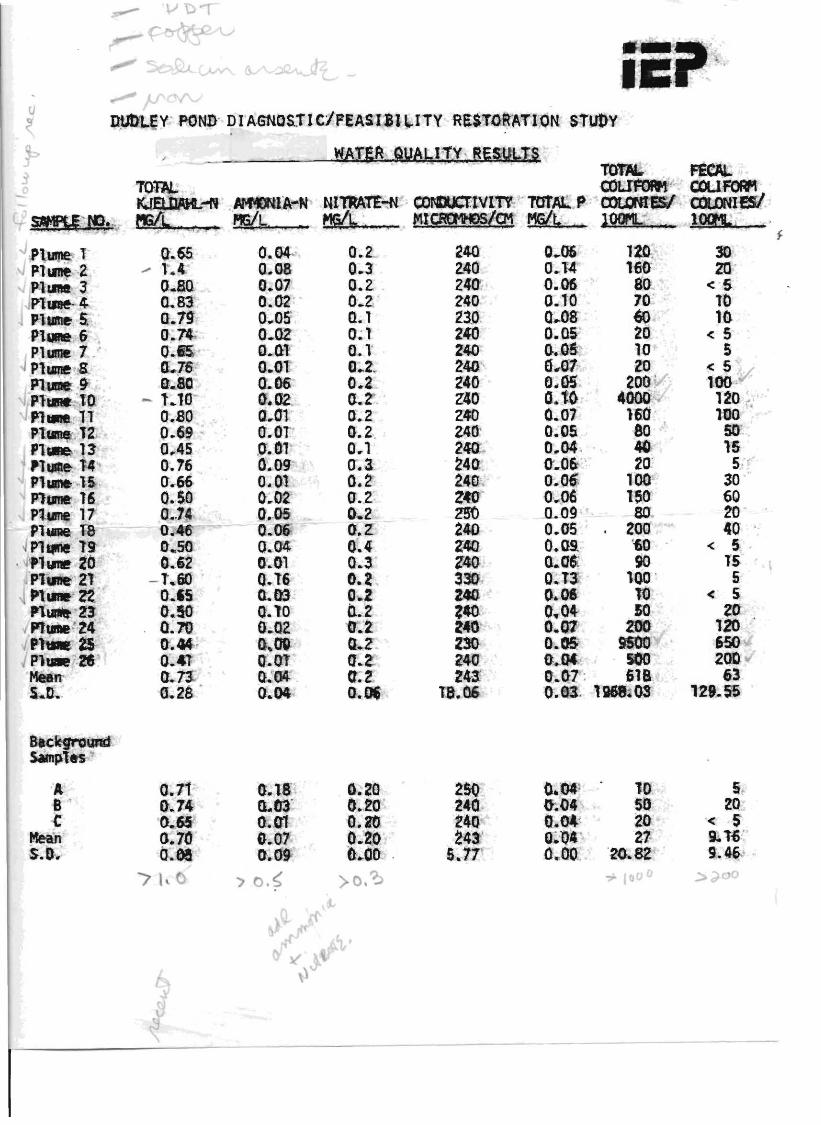
· . tl.1l .%0 2~ 0 5-~. r. O•.to 24 5 20..
() 0.20 240· 26 <BIO 0.:20 . ~4 . 21 9l~.:
0.. ' fl· 00:. . ·5,,11 'ro.82: 9.
"71

APPENDIX B
WELL POINT AND DOMESTIC WELL DATA
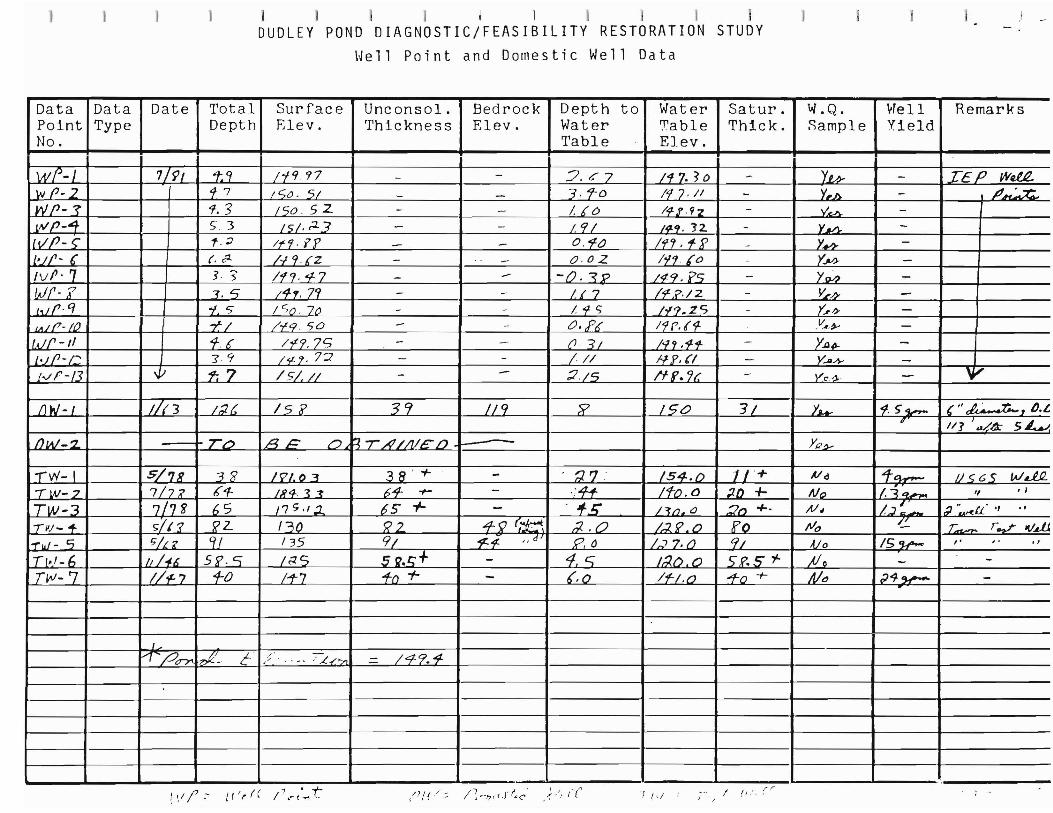
i _I 1 1 I ! ] I J I DUDLEY POND DIAGNOSTIC/FEASIBILITY RESTORATION STUDY
Well Point and Domestic Well Data
Data Point No.
Data Type
Date Total Depth
Sur rac e Elev.
Unconsol. Thickness
Bedrock Elev.
Depth Water Table
to Water r:rable Elev.
Satur. Thick.
W.Q. Sample
Hell Yield
Remarks
wf-I wP-2 WP-3 wP-~
III/{J- (" l'/I'~ C Ivl" 7 llif'- ? 1.1 ('. q ,A/(7-IO
IIAlI' -/1 /.JP-r
1../1'-/3
7/91
W
1:9 1. 7 1. '3 5 3 t·;;)
(. C'
"] '? ,.5
.,. c;
-rl 1-.6 1.9
'f:7
li997 I c:,o. 5/ ISo. 5 Z lsi. ;2.3
H9·1? /..; 9. r:z /1'7· 4-7 /1-1. 71 / So 70 /-Iq. so
Ir'l. 7C; /<1. 'I. 7':1 /.<::/. II
-
-----------
-
--------
--
-
::7. c 7 ].1-0
I. 6 () ! 9/ 0.'10 0·02
-O.":?p
1/7 11'> o.p,( {J. -=51
I II :;'./5
/1 7. 50 117· II /?-J'. 9 '2
14-9. J2. Ii'!, fA' 1-11 1'0
N9. yC; I~.?·/z 1-11.25 19P./9N9,'9-'1H,P, (/ Iff. 'j{.
------
---
-
--
YUr Y,b VLA YUl,.
y~
Y..w Yo/.) v....h-
f-rJ.>
.v.~.~
Y.D~ y.....+
Ye·,).
-----
--------
rEP
'4"
WdR.. /J_:...A;;.
fJ W-I
I?w-'Z
l/f3 /;}(;
Tr->
/5 F
AP I")
39
~ -r A //1/€" /J
/19 :s? /50 "31 '1-..
YP~
.,.. S' ~ (/
("ti.<" • •~, f).1.
1/1 aL~ 5~
-rw-I ,W-7
TW-3 "TV/- -+ I~"/- Cj
11!.I- 6 Tw-7
S/7R 7/7t? 717'i <>/1 '1 r;1/ ?
11 /-t.1:
1/'1-7
"35' 6<1{,S ~2... 9/
59. Cj
1-0
19/. () "J
JR4-. ~ ~
/7 S.r:J..
'-"0 /35
1.:15
/"f7
3 8' + 64 +65 -I)(2 9/ 5 Cl.t;+ +0 i
---
4-9 (,r-. ~.j. "d
--
. ~?'
off
·""x ;;'.0 9.0
4, c:; (,0
/S4.()
Ifo.a /~rJ. 0
/~fJ 0 /,") 7, (J
/:;"0 () /f-I.O
I/'+ ;J.D -I21'> +. f'o Clj
5?S y.. fo -;
A/d
llIo /f/~
;Vo
.vo )/0 Alo
1-Gl.-/. iq_ /.:1 ~ ~
/5 'J-I"
-(}~~
r
JJ<6f:; w~
" ' I
I :; ':.~ti.' ., .,
l:wT r,c rVJj
' . ,. "
--
, -"1~ /?, (/ t ;:.. ".. ;-t./~" /49.4
I I' '. I" (''J I, /1\1 r: I ( I ~ (( /'7,~ f·..."t /'(('; I: --~, (.r 1,(' ~ /. If

APPENDIX C
HYDROLOGIC BUDGET CALCULATIONS

APPENDIX
Hydrologic Budget Calculations
Precipitation
Annual P (NOAA, Framingham) = 43.28 in/yr
P areal volume = 43.28 in) 212 in/ft)(336.1 acres) 43560 ft /acre
P = 5.28 x 107 ft3/yr
Surface Runoff
Charles River average Q = 293 ft 3/sec (USGS HASS4) A = 184 mi 2
Qunitized = 293/184 = 1.59 CSM
Dudl ey Pond Shed A = 336.1 acres Ao=' 90.8 acres R = (336.1-90.8)(1.59)/640 acres/mi 2
= 0.60 ft 3/sec = 1.89 x 107 ft 3/yr
Precipitation on Pond
Pond = 43 in. (90.8 acres)(43560 ft2/acre)(ft/12 in) Pp = 1.41 x 107 ft 3/yr
Pond Evaporation
Central Mass Evaporation = 27 in (Chow) Ev = 27(90.8)(43560)/12 Ev = 8.90 x 106 ft 3/yr
Groundwater Inflow
G~JI = Q = KIA (Darcy's Law)
where, Q = Groundwater Discharge (gallons per day) K = Permeability (gpd/ft2) I = Hydraulic Gradient (ft/ft) A = Cross-sectional area (ft2)

Zone 1: Eastern shoreline
Kl = 400 gpd/ft2 (DWl boring 1-og) 11 = 153.0 - 149.1 = 0032
1200 . Al = (20 1 days) (2400 1 wide) = 48,000 ft 2 (Winter, 1976
Karnauskas, 1978) Ql = 61,440 gpd
Zone 2: Southern shoreline
K2: = 50 gpd/ft2 (TWl boring log) 12' = 154.0 - 149.1 - 0026
1900 - . A2 = (20 1 deep)(2000' width) = 40,000 ft2 Q2 = 5,200 gpd
Zone 3: Northern shoreline
K-:: = 400 gpd/ ft2 (Nelson, 1974) 1; = .0032 (assumed) A3 = (20 1 deep)(1600' wide) = 32,000 ft 2 Q3 = 40,960 gpd
Zone 4: Western shoreline
K4 = 400 gpd/ft2 (based on several test well logs)
14 = .0017 (assumed) A4 = (7.5 1 deep)(3000' wide) (Winter, 1976; Kerfoot, 1981;
Fortin, 1980) 04 = 15,300 gpd
GW 1 = 0t = 01 + 02 + 03 + 04
= 61,440 + 5,200 + 40,960 + 15,300 = 122,900 gpd
122,900 (0.1337)(365) = 6.0 x 106 ft 3/yr
Groundwater Outflow:
Zone 1: Bottom of western half
Kl = 1 gpd/ft2 (Cervione, 1972; for sand & muck sediments)
11 = -0.11 (Well point data; Mcbride, 1975)
Al = ~ (1680)(1280) = 1,075,200 ft2 01 = 118,272 gpd
GWo = 118,272 gpd 118,272(0.1337)(365) = 5.8 x 106 ft 3/yr
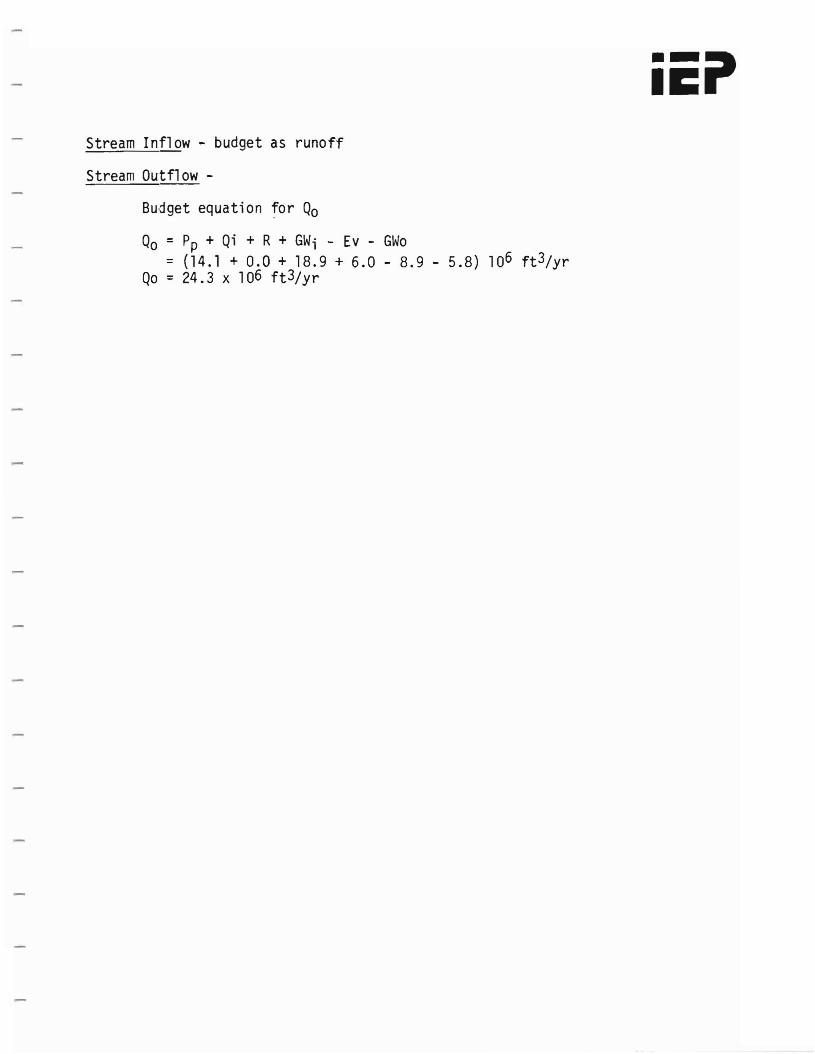
iiSi' Stream Inflow - budget as runoff
Stream Outflow -
Budget equation for Qo
Qo = Pp + Qi + R + GWi - Ev -= (14.1 + 0.0 + 18.9 + 6.0
Qo = 24.3 x 106 ft 3/yr
GWo - 8.9 - 5.8) 106 ft 3/yr
REFERENCES CITED
Aquatic Control Technology. Unpublished survey data and reports, Wayland,Massachusetts.
Aquatic Control Technology, September 1982. Personal Communication.
Bakis, Bryan, September 1982. Engineer, Schofield Brothers, Inc., Framingham, Massachusetts. Personal Communication.
Bowker, Lewis, September 8, 1982. Wayland Town Engineer. Personal Communication.
Bowker, Lewis, March 1983. Wayland Town Engineer. Personal Communication.
Boschetti, Mario, September 1982. Massachusetts Deoartment of Environmental Quality Engineering, Division of Waterways, Boston, Massachusetts. PI:rsonal Communication.
Bartlett, M. S. et al, 1978. Denitrification in Freshwater Wetland Soil: M.S. Thesis, Tufts University, Medford, Massachusetts.
Brandes, Marek, 1977. Effective Phosphorus Removal by Adding Alum to Septic Tanks: Journal Water Pollution Control Federation.
Burrows, S. D., 1977. Aquatic Aluminum: Chemistry, Toxicology and Environmental Prevalence: CRC Critical Reviews in Environmental Control 7:67-216.
Carpenter, S. R., 1980. Enrichment of Lake Wingra, Wisconsin by Submersed Macrophyte Decay: Ecology 61(5).
Center for the Environment and Man, Inc., 1977. Nonpoint Sources: By Type, Location and Quantity: CMRPC 208 Wastewater Management Plan.
Chow, Ven Te, 1964. Handbook of Applied Hydrology: McGraw-Hill, New York, New York.
Conahan, Douglas. Personal Communication. March 23, 1983. Metropolitan Area Pl anni ng Council, Boston, Massachusetts.
Cooke, D. G. and Kennedy, R. H., September 1980. Precipitation and Inactivation of Phosphorus as a Lake Restoration Technique: USEPA Ecological Research Series.
Cooke, D. G. and Kennedy, R. H., 1980. State of the Art Summary of Phosphorus Inactivation as a Lake Restoration Technique: Proceedings of a Workshop at Pacific Grove, California, March 9-12, 1980.
Crawford, S. A., 1979. Farm Pond Restoration Using Chara Vulgaris Vegetation: Hydrobiologia, Vol. 62, No.1.
Dillon, P. J. and Rigler, F. H., 1975. A Simple Method for Predicting the Capacity of a Lake for Development, Based on Lake Trophic Status: Journal Fish. Res. Board Canada No. 31.
Dillon, P. J. and Kirchner, W. B., 1975. Reply to Chapra's Comment: Journal Water Resources Research Vol. 2, No.6.
Domey, William R., March 1982. Letter/Report to the Wayland Board of Health: Field Observations of Dudley Pond Shoreline.
Dudley Pond Association, Clean Water Committee, February 1979. Statement on Dudley Pond.
Engler, R. M. and Patrick, W. H., Jr., 1974. Nitrate Removal From Floodwater Overlying Flooded Soils and Sediments: Journal of Environmental Quality 3(4).
Fortin:, R. L., 1981. The Groundwater Resources of Wayland, Massachusetts: M.S. Thesis, Boston University.
Freeman, R. A. and Everhart, W. H., 1973. Effects of Chemical Variations in Aquatic Environments Vol. II, Toxic Effects of Aqueous Aluminum to Rainbow Trout: EPA-R3-73-0116.
Hall, ~1illard W., 1975. A Conceptual Model of Nutrient Transport in Subsurface Soil Systems in Jewell, W. J. and Swan, R. (1975); Water Pollution Control in Low DensityAreas: University Press of Ne~" England, Hanover, New Hampshire.
Higgins, G. R. and Colonell, J. M., 1971. Hydrologic Factors in the Determination of Watershed Yields: University of Massachusetts, Amherst, Massachusetts.
Hutchinson, Evelyn G., 1975. A Treatise on Limnology - Volume III, Limnological ~otany: John Wiley and Sons, New York, New York.
IEP, Inc., November 1980. Morses Pond Management and Watershed Evaluation Study.
Kady, Robert, September 1982. Engineer, Permits Section, Massachusetts Division of Water Pollution Control, Boston, Massachusetts. Personal Communication.
Kennedy, R. H. and Cooke, D. G., 1982. Control of Lake Phosphorus with Aluminum Sulfate: Dose Determination and Application Techniques: Water Resources Bulletin No.3, Vol. 18, American Water Resources Association.
Larkin, John, 1979. Miscellaneous surveys and quality/biological data for Dudley Pond compiled and presented in: Dudley Pond Information.
Massachusetts Department of Environmental Quality Engineering, November 1982. Clean Lakes Program - Rules and Regulations, General Application and Administration, 1982.

Massachusetts Division of Water Pollution Control, October, 1979. Prel iminary Survey Data and Report: Baseline Water Quality Survey - Dudley Pond.
Massachusetts Division of Water Pollution Control, November 1978. Massachusetts Lake Classification Program, Westborough, Massachusetts.
Massachusetts Division of Water Pollution Control, unpublished. Compilation of
Boston, Massachusetts.
Sediment Analyses and Results for 27 Massachusetts Ponds and Lakes.
Massachusetts Division of Water Pollution Control, 1978. cation for Dredging, Dredged Material Disposal and Boston, Massachusetts.
Water Quality Certifi Filling in Water,
Massachusetts Division of Water Pollution Control, Boston, Massachusetts.
1971. Water Quality Standards,
Massachusetts Division of Water Pollution Control, 1978. Water Quality Standards,
Moon, Kenneth, October 1982. Chairman, Wayland Conservation Commission. Personal Communication.
Narf, R. P., 1978. An Evaluation of Past Aluminum Sulfate Lake Treatments: Present Sediment Aluminum Concentrations and Benthic Insect Renewal: Wisc. Dept. of Nat. Res., Madison, Wisconsin.
National Oceanic and Atmospheric Administration Environmental Data Service, August 1973. Monthly Normals of Temperature, Precipitation, and Heating and Cooling Degree Days 1941-70: Climatography of the United States No. 81 (by state), U.S. Department of Commerce Publication.
National Weather Service Bureau, September 1982. Bedford, Massachusetts. Personal Communication.
Nelson, Arthur E., 1974a. Surficial Geologic Map of the Natick Quadrangle, Middlesex and Norfolk Counties, Massachusetts: USGS Map GQ-11S1.
Nelson. Arthur E., 1974b. Surficial Geologic Map of the Framingham Quadrangle, ~1iddlesex and Norfolk Counties, Massachusetts: USGS Map GQ-1176.
Nelson. Arthur E., 1975. Bedrock Geologic Map of the Natick Quadrangle, Middlesex and Norfolk Counties, Massachusetts: USGS Map GQ-1208.
New Hampshire Water Supply and Pollution Control, 1981. Classification and Priority Listing of New Hampshire Lakes, Concord, New Hampshire.
Perlmutter, N. M. and Koch, Ellis, 1972. Preliminary Hydrogeologic Appraisal of Nitrate in Ground Water of Southern Nassau County, Long Island, NY in Geological Survey Research (1972), U.S. Geological Survey Prof. j)aper 800-B.
iiEi' Peterson, S. A., March 197~. Dredging and Lake Restoration in Lake Restoration:
Proceedings of a NatlOnal Conference, August 22-24, 1978, USEPA,INashington, DC.
presco'lttb' G. W., 1970. How to Know the Freshwater Algae: William C. Brown Co.,)u uque, Iowa.
Reckhow, Kenneth H., 1979. Quantitative Techniques for the Assessment of Lake Quality: EPA-440/5-79-015.
Roy F. Weston, Inc., 1977. 201 Facilities Plan for Septage Disposal Facility.Town of Wayland, Massachusetts.
Roy F. Weston, Inc. 1978. Sewerage Facilities Plan. Town of Wayland,l-1assachusetts.
Sawhney, B. L. and Hill, D. E., 1975. Phosphate Sorption Characteristics of Soils Treated with Domestic Wastewater in Journal of Environmental Qua1ity Vol. 4, No.3.
Skarinka, Richard, September 1982. Engineer, Schofield Brothers, Inc., Framingham, Massachusetts. Personal Communication.
Snow, P. D. and DiGiano, F. A., 1976. Mathematical Modeling of Phosphorus Exchange Between Sediments and Overlying Water in Shallow Eutrophic Lakes: Massachusetts DWPC.
Surface Water Quality Study Committee, 1979. Dudley Pond Information.
Sutton" D. L., December 1981. Aquatic Plant Preferences and Field Conversion Efficiencies of the Hybrid Grass Carp: Annual Report to the Florida Department of Natural Resources.
Tofflemire, T. J. and Chen, M., 1977. Phosphate Removal by Sands and Soils in Land as a Waste Management Alternative: Ann Arbor Science Publishers, Inc., Ann Arbor, Michigan.
U.S. Environmental Protection Agency, June 1980a. Modeling Phosphorus Loading and Lake Response Under Uncertainty: A Manual and Compilation of Export Coefficients: EPA-440/5-80-011.
U.S. Environmental Protection Agency, December 1980b. Clean Lakes Program Guidance Manual: EPA-440/5-81-003.
U.S. Environmental Protection Agency, October 1980c. Design Manual Onsite Wastewater Treatment and Disposal Systems: Office of Research and Development, Cincinnati, Ohio. -
Vollenweider, Richard A., 1976. Advances in Defining Critical Loading Levels For Phosphorus in Lake Eutrophication: Mem. Lst. Ital. Idrobiol. 33:53-83.
Waniel'ista, Mart"in P., 1978. Storrnwater Management Quantity and Quality: Ann Arbor Science Publishers, Inc., Ann Arbor, Michigan.

Winneberger, John 1.,1982. Nitrogen, Public Health and the Environment: Ann Arbor Science Publishers, Inc., Ann Arbor, Michigan.
Winter,1. C., 1976. Numerical Simulation Analysis of the Interact"on of Lakes and Ground Water: U.S. Geological Survey Professional Paper 1001.