1988 report to shareholders
TRANSCRIPT

1988 Report to Shareholders
6
1
1
About the Cover
In keeping with Fluor Daniel's
newly adopted mission statement (page 5), the cover symbolizes the global market to which we provide our engineering, construction and
related services. Linked by technology, experience and
human resources, we serve our clients through a net
work of offices strategically located around the world.
.
Contents
Highlights 2 Letter to Shareholders 5 Mission 6 Operations Report 6 Engineering and
Construction 6 Industrial Sector 7 Process Sector
11 Power Sector 15 Hydrocarbon Sector 19 Government Sector 19 Fluor Constructors
International
20 Natural Resource investments
20 Coal 21 Lead 22 Operating Statistics 24 Financials 24 Management's Discussion
and Analysis
28 Reports of Management and Independent Public
Accountants 29 Consolidated Financial
Statements 46 Reference Information 46 Directors 47 Officers 47 Principal Subsidiaries and
Divisions
48 Stockholders' Reference
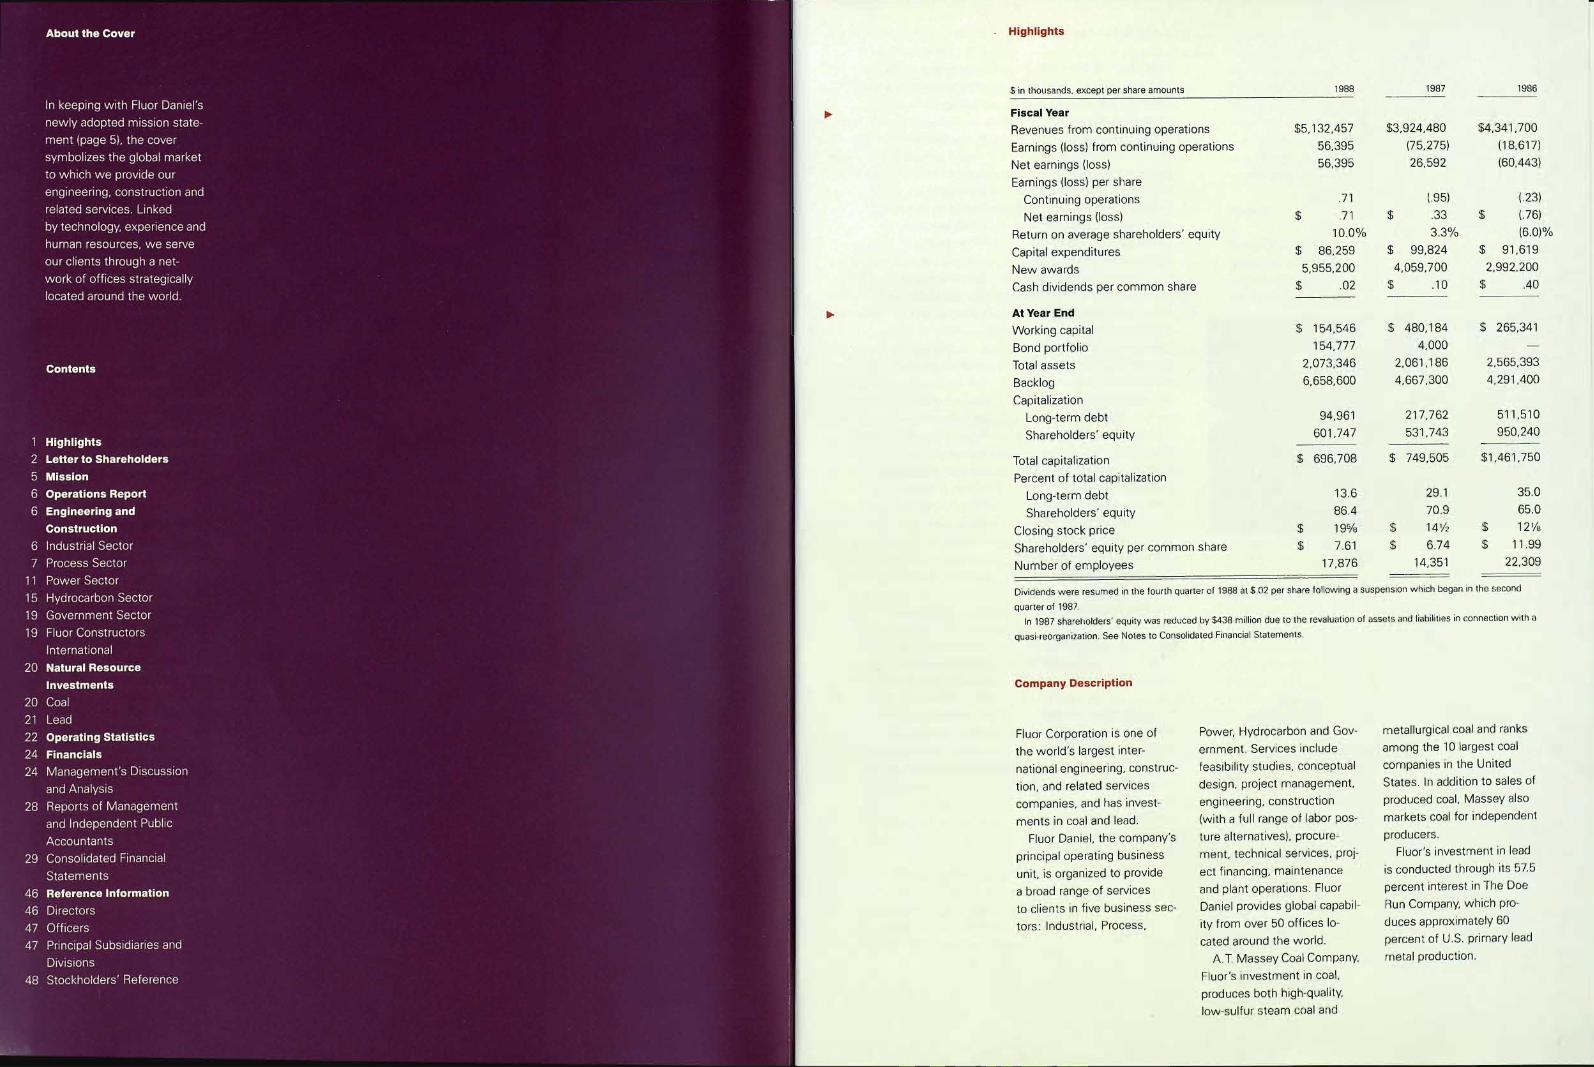
. Highlights
$ in thousands, except per share amounts
Fiscal Year
Revenues from continuing operations
Earnings (loss) from continuing operations
Net earnings (loss)
Earnings (loss) per share
Continuing operations
Net earnings (loss)
Return on average shareholders' equity
Capital expenditures
New awards
Cash dividends per common share
At Year End
VVorking capital
Bond portfolio Total assets
Backlog
Capitalization
Long-term debt
Shareholders' equity
Total capitalization
Percent of total capitalization
Long-term debt
Shareholders' equity
Closing stock price Shareholders' equity per common share
Number of employees
1988 1987 1986
$5,132,457 $3,924,480 $4,341,700
56,395 (75,275) (18,617)
56,395 26,592 (60,443)
.71 (.95) (.23)
.71 .33 (.76)
10.0% 3.3% (6.0)%
$ 86,259 $ 99,824 $ 91,619
5,955,200 4,059,700 2,992,200
$ .02 .10 .40
$ 154,546 $ 480,184 $ 265,341
154,777 4,000
2,073,346 2,061,186 2,565,393
6,658,600 4,667,300 4,291,400
94,961 217,762 511,510
601,747 531,743 950,240
$ 696,708 $ 749,505 $1,461,750
13.6 29.1 35.0
86.4 70.9 65.0
$ 19% $ 141/2 $ 121/2
$ 7.61 $ 6.74 $ 11.99
17,876 14,351 22,309
Dividends were resumed in the fourth quarter of 1988 at $.02 per share following a suspension which began in the second
quarter of 1987.
In 1987 shareholders' equity was reduced by $438 million due to the revaluation of assets and liabilities in connection with aa
quasi-reorganization. See Notes to Consolidated Financial Statements.
Company Description
metallurgical coal and ranksFluor Corporation is one of Power, Hydrocarbon and Gov
the world's largest inter- ernment. Services include among the 10 largest coal
national engineering, construc- feasibility studies, conceptual companies in the United
tion, and related services design, project management, States. In addition to sales of
engineering, construction produced coal, Massey alsocompanies, and has invest
ments in coal and lead. (with a full range of labor pos- markets coal for independent
Fluor Daniel, the company's ture alternatives), procure- producers.
principal operating business ment, technical services, proj- Fluor's investment in lead
is conducted through its 57.5unit, is organized to provide ect financing, maintenance percent interest in The Doea broad range of services and plant operations. Fluor
to clients in five business sec- Daniel provides global capabil- Run Company, which pro
tors: Industrial, Process, ity from over 50 offices lo- duces approximately 60
cated around the world. percent of U.S. primary lead
A.T. Massey Coal Company, metal production.
Fluor's investment in coal,
produces both high-quality,
low-sulfur steam coal and

Letter to Shareholders percentclear indication that 0- We identified niche to offset the cash flow re- In January 1989, Gerald 1\& Letter
Fluor Daniel's globalization acquisitions as a strategy for quirements of our Sugar Land, Glenn, Group President,
Dear Fellow Shareholder: A efforts have taken hold in strengthening and expanding Texas facility lease, thus Marketing and Sales for Fluor Brief
year ago we announced com moving toward our goal of 40 our engineering and construc improving the return on that Daniel was elected to the
pletion of the company's re to 60 percent. tion base. During 1988 twci cash by 300 basis points. Fluor Board of Directors and Carta
structuring program, significant such acquisitions were made, Optimizing the return on our Executive Committee. The
strengthening of our financia) VVe discussed expan for a total investment of ap growing capital resource posi board's membership now
position and a new direction sion of backlog across a wide proximately $50 million. In tion is a continuing financial stands at 16 with nine out
for Fluor Daniel, our core spectrum of industries as an March, Fluor Daniel purchased management challenge. side directors.
engineering and construction important Fluor Daniel objec an interest in SOS Interna
(E&C) business. We said that tive. At year end, backlog was tional, a leading contractor in - 111. We talked about main- Outlook 13rev
Fluor was on the threshold of up 43 percent to $6.7 billion, the multi-billion dollar asbes- taining our strong and healthy
auspicious new beginnings. the highest level in six years tos abatement industry. In financial condition and further Today Fluor Daniel is the most Brief
Those new beginnings are and well balanced among our August, Wright Engineers Ltd. reducing long-term debt. Un diversified, and broadly-based
now fulfilling their promise. five business sectors. The of Vancouver, Canada became, questionably, Fluor Corpora engineering and construction ig
In the past 12 months, impor size and diversity of our back part of Fluor Daniel, expand tion is in excellent financial firm operating anywhere in
tant milestones along Fluor's log bodes well for the future. ing the company's worldwide shape today. Long-term debt the world. Surat
road to attaining its full earn, capabilities in the mining and was reduced to less than Our restructuring is behind
ings potential have been lo We said we would metals industry. Additional $100 million, 13.6 percent of us, we are financially strong, nliCbM0'
achieved. Fluor Daniel, and enhance the value of our serv- E&C niche acquisitions will total capital, and cash re positive momentum is accel
our investments in coal and ices to clients by capitalizing be considered. serves and the bond portfolio erating and the company is Alt!
lead, all reported meaningfa on our industry-leading safety .exceed $300 million. uniquely equipped to take
gains in operating profits. record and three-dimensional We presented plans for advantage of the expanding Lettera
Net earnings for 1988 were engineering design capability improved performance from The progress achieved in capital investment trend cur
$56.4 million, or 71 cents a throughout our worldwide our restructured investments 1988 would not have been rently underway. Surat
share, an increase of 112 per network of more than 50 in coal and lead. A.T. Massey possible without the united' The world is in an acceler
cent over the previous year. offices. The performance of Coal Company reported rec efforts of our employees, ating state of change and
Revenues from continuing Fluor Daniel's operations cen ord operating profits in its management team and board Fluor Daniel will certainly
operations were $5.1 billion, ters in executing projects and first full year following the ,of directors. We are indebted prosper as more and more
up 31 percent from the $3.9 the reaction of our clients restructuring. Doe Run lead also to our shareholders and global markets expand be
billion reported for 1987. While featured in this annual report operations, in which Fluor clients for their confidence, yond previous, expectations.
still a long way from our profit speak for themselves. holds 57.5 percent owner trust and support. These con
objectives, our progress this ship, also had an excellent stituencies are the source of In the U.S. alone, in
past year is reassuring. We responded to our year. Their strategies for the Fluor's strength. dustry after industry is oper-
Improved profitability is just clients' continuing need for a future will be to emphasize ating at maximum productive
one of the objectives estab choice of labor posture by cash flow by remaining low- Director and Management capacity and is extending its
lished a year ago to enhance strengthening the manage cost producers, efficient oper- Changes reach both at home and
shareholder value: ment of Fluor Constructors ators, and market leaders. abroad. Fluor Daniel is cur-
International, Inc. (FCII), In the new year, we depend rently ranked Number 1
We set as a target our union construction arm. We promised to re for leadership on a cadre of among the top 400 U.S. con-,
greater expansion of Fluor Based on FCII's positive con store the dividend as soon as seasoned executives who tractors by Engineering
Daniel's services to diversi tribution to earnings in 1988, operating profits justified ac have ably demonstrated their News-Record Magazine and
fied markets worldwide. New their future looks bright. tion. The dividend has indeed skills. was honored as the nation's
awards for 1988 totaled $6 been resumed, albeit on a safest contractor by The Busi
billion, a 47 percent advance modest scale, and will be ness Roundtable. We are po
over the prior year. The inter monitored and adiusted as sitioned to expand our market
national component of new 'performance warrants. share through a continuing
awards increased from 7 to 24 stream of contract awards
We said effective man= from U.S. clients.
agement of our large working capital position was a priority.
This past year a $155 million
A. David S. Tappan Jr., bond portfolio was established
Chairman and Chief'
Executive Officer (left);
'Leslie G. McCraw.
President (right)
2

88
2
84 85 86 87 88
Q
to. Net Earnings
(Loss)
Per Share
dollars
84 85 86 87 88
110.160
oo
60 . .
300
,60
0
Long-Terrn Debt
dollars in millions
Revenues
by Segment
Lead 3%
Coa115%
E&C 82%
As the United States and Canada combine forces
in what will become the largest economic unit in the world, there is finally an opportunity for Fluor Daniel
clients to compete on that "level playing field" we've always advocated.
10- International tensions
are gradually dissipating in
the Middle East and Asia and
many of these countries will be standing in line demanding
that their economies be mod
ernized. Fluor Daniel's supe
rior reputation is well known
throughout these areas and
we fully expect to be called
upon for our proven skills.
In 1992, the European
Common Market will be
come a community of trading nations operating as a single
economic bloc. Anticipation
of that change is already stim
ulating new work for our European offices, which have 30
years of continuous presence
in that geographic area.
Ir. An increasing number
of governments are embrac
ing free enterprise solutions
to improve their ailing econo
mies. This means more
opportunities for private
investment and increased demand for Fluor Daniel's
services. We have already
established a record of quality performance on projects for the People's Republic of
China, the Soviet Union and
other controlled economies.
Our experience and our reputa
tion for integrity stand us in
good stead as corporate citi
zens of the world.
Going forward into the dec
ade of the 1990s, we will
continue to focus on our core business, engineering and con
struction. VVe will maintain the
high quality of performance
which is our hallmark, while
growing as rapidly as is prudent to keep pace with the
swiftness of change in our global markets.
We will be selective in pursuing projects with the best profit potential; that is, proj
ects which offer either favorable long-term positioning or
immediate strengthening of our backlog and earnings. Our
investments in coal and lead
will be managed opportunisti
cally, taking full advantage
of improving commodity markets.
Our overriding objectives
are to achieve enhanced
value for our shareholders by
delivering superior earnings
growth and return on equity,
and to be the top performer in our industry worldwide.
A
David S. Tappan, Jr.
Chairman and Chief Executive Officer
Leslie G. McCraw President
January 19, 1989
Fluor Daniel Mission
Services and Markets
Principles
Philosophy
As Fluor Daniel employees,
our mission is to assist clients
in attaining a competitive ad
vantage by delivering quality
services of unmatched value.
We provide a complete range
of engineering, construction,
maintenance and related
services to virtually all indus
tries and government.
We service our clients
through a network of offices strategically located around
the world. We globally link technology, experience, hu
man resources and services
in meeting client needs.
To add value to our services,
these principles are
emphasized:
We are client focused.
V We are innovative and flexible
in meeting client needs.
We deliver quality.
And above all, we do every
task safely.
Our philosophy is based upon
ethical conduct, mutual trust
and teamwork. To ensure
continuous improvement, we challenge, test, reevaluate
and continually raise our stan
dards of excellence.
As a service organization,
our success depends upon
the combined capability and
contribution of all employees.
Fluor Daniel is dedicated to
fostering a work environment
which challenges, enriches and rewards each individual.
4 5

Operations Report Engineering and improvement during the year. The foods and consumer Renewed strength in the chemicals, fibers, film, tex-Construction Capital spending increased in products industry remains commodity markets has fueled tiles, plastics, bulk chemicals
most of the markets Fluor active, with a number of signif demand for metals-related and composites. Engineering, construction and Daniel serves and further icant modernization projects. projects such as primary Strong gains were made in related services (E&C), the growth is expected in 1989, In the automotive market we and recycled aluminum prod expanding the geographic company's principal business led by a strong U.S. market. are now focusing on provid ucts. There are select oppor scope of work for existing cliactivity led by Fluor Daniel, The increased diversity in ing maintenance and techni tunities in the steel industry ents. Awards were received delivered significantly im the company's global E&C cal services to existing as well. from international clients for proved results in 1988. Oper business base, expanded facilities. The pulp and paper Activity in the electronics projects in the U.S., as well as ating profit increased to $51 backlog, and positive eco industry grew rapidly in 1988 industry has begun to pick for U.S. customers expanding million, compared with a loss nomic outlook accentuate with several large expansion up. U.S. producers are now overseas. Backlog for the of $49 million in 1987. Rev expectations for 1989 and projects received, as well as focusing on product niches Process Sector now stands enues were up 30 percent to beyond. awards for new grassroots through emphasis on produc at $1.2 billion, or 19 percent $4.2 billion. facilities. Activity in pulp and tivity and efficiency. The trend of the company's total.
Serving clients from over Industrial Sector paper is expected to remain to establish worldwide net- Process Sector clients tend
50 offices worldwide, Fluor strong into 1989, with oppor works of manufacturing and to be technology driven. Daniel provides a broader Among Fluor Daniel's five tunities developing in Europe, supply sources is evident. Evolving research efforts into range of E&C services to business sectors, the Indus- Canada, South America and Significant projects com the prevention and cure of more industries in more geo trial Sector serves the broad- Australia. pleted during the year includ cancer, heart disease and
graphic areas than any com est range of markets, includ- The trend toward client/ ed Phase II of the continuing AIDS have stimulated the petitor. In 1988, building on a ing automotive and general contractor "alliances" contin expansion and modernization biotech, pharmaceutical and
strong tradition of superior manufacturing; electronics; ues. Clients recognize the program for Fort Howard's medical equipment indus
performance, Fluor Daniel heavy industries such as met advantages of shifting fixed paper mill in Savannah, Geor tries. These markets have
adopted a formal statement als and machine tools; pulp costs to variable by contract gia; construction manage generated a steadily growing
of its mission, shown in its and paper; foods and con ing for E&C services pre ment for a major bakery source of projects including aa
entirety on page 5. sumer products; and commer viously performed in-house. facility for the Kitchens of biochemical manufacturing
Increased market penetra cial and justice facility clients. New alliance agreements Sara Lee in Tarboro, North plant in Iowa, for the Bio
tion, a growing base of new New awards in the Indus are being developed while Carolina; a major expansion Products Division of Eastman
clients and improving busi trial Sector were broadly existing relationships are of Kellogg's food processing Kodak; a medical devices
ness conditions pushed new based and rose to $2.4 billion expanding to encompass capabilities at Battle Creek, manufacturing facility in
awards in 1988 to $6 billion, in 1988, nearly double the level broader geographic scope. Michigan; several projects for Northern California for Beck
up 47 percent over the pre achieved last year. Backlog We are currently performing Procter & Gamble, including ton Dickinson; a pharmaceuti
vious year, and the highest for the Industrial Sector work in Europe, Canada, Asia/ two diaper plant upgrades, cals finishing and filling facility
level since 1981. increased to $2.3 billion, Pacific and Saudi Arabia for and a soap plant addition; and for Bristol Myers in Puerto
Backlog rose dramatically representing 35 percent of several U.S.-based clients expansion of a cereal plant in Rico; and an expansion of aa
during the year to $6.7 billion. the company's total. under alliance agreements. China for Heinz. human vaccines plant in Bel-
The backlog is well diversified In general, industrial clients In the commercial market, gium for Smith Kline-RIT.
among the five business today are financially healthy Fluor Daniel continues to Process Sector Stimulated by strong de
sectors Industrial, Process, with strong cash positions, refine its selective marketing V mand and high utilization
Power, Hydrocarbon and having benefited from the strategy where our geographic The Process Sector was one rates of existing manufactur-
Fluor Daniel's Governmentwith a grow economic expansion of the presence or client relation of Fluor Daniel's two fastest ing capacity, the chemicals
Process Sector assisted ing percentage of projects last several years. Capacity ship provides a competitive growing business sectors in industry experienced tremen
in the design and outside the United States. utilization in many of the mar advantage. 1988. Fueled by strong dous growth during 1988. Fur
construction of this Although still recovering kets Fluor Daniel serves is at The experience gained over growth worldwide, new ther influencing this market is
state-of-the-art from the long downturn an all-time high. The lower the last three years in the awards were $1.1 billion, up the trend towards globalization,
biotechnology facility which began in 1981, overall dollar has boosted exports by design and construction of jus sharply from $686 million in
for Biochemie, and
is currently at work on
an expansion project.
The plant, located
market conditions within the E&C industry showed marked
improving U.S. manufactur
ers' competitiveness overseas and consumer spending
at home remains strong.
tice facilities has firmly estab
lished Fluor Daniel in this
growing market.
Engineering and
construction manage
ment was performed by
the Industrial Sector
1987.
The Process Sector pro
vides services to clients in
the fields of biotechnology,
in Kundl, Austria, uses
U.S. technology to
produce a product
These diverse industrial
markets are driven by their
own individual set of eco
on this 141,000 square
foot dehydrated soups
and sauces manu
pharmaceuticals, medical
equipment, fine and specialty
which increases milk nomic and market factors. facturing facility in
production with Asheboro, North Caro
reduced feed require lina, for Knorr Best
ments in dairy cows. Foods Division.

With the help. of
Fluor Daniel's tal
ented people, our
vision for a state-of
the-art paper mill
has become a reality.
They performed an
essential leadership
role, supplying
engineering, design
and construction
expertise.
Fluor Daniel isn't
afraid to explore
new ideas, and
those ideas have
paid off. Enormous
effort, combined
with their cost-con
sciousness and cre
ativity, resulted in
the first two phases
of the project com
ing in well under
budget. Our rela
tionship spans over
a decade. The more
we work with Fluor
Daniel, the better
we seem to work
together.
Fort Howard
Corporation
Industrial
Industrie
Industria
__
lndustri
Industrie
lndustri
np0MblWfleHHOCTb
19'd
Industria
Perusahaan
Fluor Daniel's Indus
trial Sector is providing
Phase Ill engineering,
procurement and
construction services
to Fort Howard at
its Savannah River Mill
in Georgia. The plant
produces paper
towels and tissue prod
ducts from recycled
waste paper,

10. Our partnership
with Fluor Daniel
has been very suc
cessful. Looking
longer term, we
realize the value
Fluor Daniel brings
to the conceptual
phases of a project,
as well as to its
overall commercial
success. Partnering
is more than work
ing as a "team." You
must have mutual
trust and recognize
that both will gain
from the
partnership.
R. F. Crickenberger
Design Manager
Engineering Dept.
E. I. Du Pont de -
Nemours & Company
r
During the year, European
and Japanese clients commit
ted substantial investments to facilities in the U.S.: expansion of a titanium dioxide
facility in Georgia, for Finland
based Kemira; a new photo
conductor manufacturing plant in Virginia, for a subsid
iary of Mitsubishi Kasei Cor
poration, Japan's largest
chemical manufacturer; and photo receptor and toner
plants for Xerox in China.
- U.S. industry continues to
focus on lower operating
costs and greater efficiency.
Many large U.S. companies
have downsized their own
E&C organizations while
developing long-term client/
contractor relationships. Fluor
Daniel's "partnership" with Du Pont, known as the "Delta Division," is considered the
.
standard of the industry for
such agreements.
During 1988, the Delta
Division worked on more than
40 different Du Pont projects worldwide including fibers,
films and a wide range of
chemicals. New operations
were also established in
Kingston, Ontario, and at
Haarlem, in the Netherlands, to provide services for Du
Pont in Canada and Europe.
Growth in the engineered
plastics and advanced com
posites industries was rapid
in 1988. These markets are expected to continue their
7 expansion well into the 1990s
as more applications for new
and advanced products are
developed. Fluor Daniel is
currently working on the huge expansion of GE Plastics'
"Lexan" facility in Burkville, Alabama, and is assisting on a
similar plant to be built in
Spain.
.
Significant projects completed during the year include
one of the world's largest and
most modern industrial waste treatment plants in Kingsport,
Tennessee, for Tennessee
Eastman; a biotech facility for lmmunex in Seattle, Wash
ington; and retrofit of a composites plant in Anaheim,
California, for Ciba-Geigy.
Power Sector
The Power Sector provides aa
full range of engineering and
construction services from project inception through
maintenance primarily to electric and gas utility companies.
Services are also provided to
clients involved with cogener
ation, hydroelectric, privatized
power plants and waste-toenergy. Fluor Daniel is a lead
er in maintenance technology and offers turnkey packages
which can include project financing.
Our position as a leading
supplier of quality services to the power industry was reconfirmed in 1988 through
aggressive marketing and
creative packaging, despite
sluggish demand industry
wide. New awards in 1988 for the Power Sector declined
to $414 million from $917 million in 1987, which included
the $470 million award for the Midland Cogeneration proj
ect. Backlog at year end was
$756 million, or 11 percent of
the company's total.
Process
Bewerking
Procesos
Zit,ki I
7*Ei
Prosesser
Verarbeitung
Pengolahan
06paborka
Elaborazione
Pembuatan
4 In response to
strong market demand
for Du Pont's Stain
mastet'. carpeting, the
schedule to increase
production of this
stain-resistant fiber
was accelerated. Ori
ginally planned to take
two years, Fluor
Daniel's Delta Division,
in cooperation with
Du Pont, completed
design and construction
within seven months
to modify this existing
nylon facility in
Seaford, Delaware.

Responsiveness
is key to Fluor
Daniel's success in
helping TU Electric
maintain a competi
tive edge as a quality,
low cost supplier
of electricity. Their
commitment has re
sulted in higher
plant availability
which directly
affects the cost of
our product.
We see Fluor Daniel's
Craft Certification
Program as a means
to increase the
proficiency of the
craft workers and
to improve pro
ductivity. The TU
project has an on
going safety record
approaching 4 mil
lion manhours that
demonstrates that
quality service can
be attained without
lost time injuries.
That's valué!
4*,T.L. Thompson
Manager of
Support Services
TU Electric
Generating Division
-r
Power
Energie
Energla
_ y
)1,*.-;it
Energi
Energie
'fitt
Tenaga
3Heprmi
Energia
Tenaga
Ongoing mainte
nance services are
being provided by Fluor
Daniel's Power Sector
to TU Electric's
four lignite-fired gener
ating stations, includ
ing the Monticello
Station pictured.
Supplemental mainte
nance services are
provided at an additional
19 gas-fired generating
stations on an as
needed basis.

f
\\
I
:_
Fluor Daniel's
Power Sector is engi
neering and construct
ing a natural gas-fired
combined-cycle cogen
eration facility, includ
ing the conversion of
portions of an incom
plete nuclear power
plant in Midland,
Michigan. The project
for Midland Cogenera
tion Venture, expected
to begin operations in
1990, will be the larg
est cogeneration plant
in America.
Growth in power demand
is continuing to outpace expectations. Yet, despite
unusually high peak power
demand and temporary
power restrictions in many areas this past summer, utilities are reluctant to add new
base-load generating capacity.
New Power Sector awards
include maintenance, modi
fication and engineering for
upgrade and plant life
extension.
Utility clients want to operate their plants longer and
more efficiently which offers expanding opportunities for
the Power Sector. Creative
new programs and contract
ing methods, including per
formance incentives and
alliance agreements, are
being offered to attract new clients. Five years ago we
were providing services to 20 utilities; today we are work
ing for more than 50. A relatively new market for
the Power Sector's services is privatized or independent
power projects. These plants, privately owned and operat
ed, sell the power they gen
erate to utilities. Such projects
provide an alternative to new
plant construction by utilities. VVhile still an emerging
market, we expect continued growth.
The market for new cogeneration facilities to serve
industrial clients is active.
During the year, engineering
continued and construction began on the huge Midland
Cogeneration project in Michi
gan and is currently ahead of schedule and under budget.
Industrial clients are inter
ested in reducing the variability of their plant operating
costs. By building cogenera
tion facilities, they supply
their own steam and electric
ity needs, while selling excess
power to utilities. For example, Power Sector
projects include an 80 MVV,
simple-cycle, gas-fired cogen
eration facility for Harbor Co
generation to provide steam
for enhanced oil recovery in Wilmington, California; and a joint venture with Southern
Electric International for a 50
MW, gas and oil-fired, combined cycle cogeneration
plant for Dexter Corporation
in Connecticut to provide steam to their manufacturing
operations.
International opportunities
for the Power Sector are being closely monitored. Privati
zation of the power industry in the United Kingdom;
changing energy priorities in
Sweden, Norway and Can
ada; and expanding power requirements in the Asia/Pacific
region offer promising markets.
Significant projects completed in 1988 include con
struction of the 160 MW demonstration plant for the Tennessee Valley Authority,
using the new fluidized bed
boiler technology; and engineering, procurement and
construction of a 300 MW co
generation plant at Bakersfield, California, for Sycamore
Cogeneration, a twin of the
nearby Kern River facility suc
cessfully completed by Fluor Daniel in 1985.
A Fluor Daniel's newly
acquired Wright
Engineers and Fluor
Daniel Canada are
teamed to perform
engineering, procure
ment and construction
management on
INCO's mill rationaliza
tion program (top) in
e I
t 4
I
A The Hydrocarbon
Sector is performing
engineering, pro
curement and construc
tion management at
Shell's Stanlow, U.K.
Refinery. The Gas
Tails project (bottom)
is nearing com
pletion, while work
on an Alkylation unit is
approaching 50 per
cent completion.
Hydrocarbon Sector 'V
New awards in the Hydro
carbon Sector more than dou
bled in 1988, to $1.9 billion,
compared with $721 million
in the prior year. Backlog at
year end was $1.9 billion, 29
percent of the company's total. Key to its success is the
full range of services provided to the offshore and produc
tion, pipeline, refining, petro
chemical and mining and
metals markets, several of which were active in 1988. The Hydrocarbon Sector
serves geographically diverse
markets, and is now focusing
on a growing list of opportuni
ties, particularly in the Asia/ Pacific region.
Growth in new awards was due primarily to plant
upgrades and capacity expan
sions. Several petrochemical
and polymer projects were
booked, driven by strong
product demand and low feedstock and energy prices.
Energy-related projects were
also awarded despite lower oil prices. Lower priced gaso
line has increased demand,
with an emphasis on performance, activating refinery octane enhancement projects.
Additionally, over the last sev
eral years oil companies have
emphasized operating effi
ciencies. Other factors stimulating this market are environ
mental issues and safety concerns related to aging U.S.
process plants, many of
which are over 25 years old.
Although the market for new oil and gas production is
currently limited, a few longrange projects continue to
move forward. Some heavy oil projects in California and
Canada are expected to pro
ceed. Fluor Daniel is perform
ing assignments in Alaska,
and is well positioned for both
onshore and offshore workk
when market conditions improve. The company contin
ues to maintain an industry
leading position in this market
because of its size and long
term significance.
There has been a strong
resurgence of mining projects
worldwide. Services are being provided for gold projects
in the U.S., Canada, South
America and Australia. In
1988, Fluor Daniel was
awarded a major portion
of the $1 billion world-class
Escondida Copper project in Northern Chile.
To strengthen the geo
graphical presence and tech
nical skills of the Mining and Metals Division, the company
acquired Wright Engineers
Ltd. in 1988. Based in
Vancouver, Canada, Wright
Engineers is a recognizeda
leader in the design, engi
neering and construction
management of mining and
metals projects. Today, Fluor
Daniel's capabilities in this
market are second to none.
Significant projects com
pleted during 1988 included
the heavy oil upgrader expan
sion and modernization proj
ect for New Grade Energy in
Saskatchewan, Canada; aa
15,000 ton per day gold ore
processing facility in Ridgeway,
South Carolina; a gold ore
processing facility for Billiton
in Chile; metallurgical plants
Sudbury, Ontario. The
project consolidates
three milling and con
centrating operations
to reduce SO2 emis
sions and increase
operating efficiency.
15

Fluor Daniel's
skilled and experi
enced team provided
environmental /per
mitting supPort,
design, engineering,
procurement and
start-up/construc
tion management
support for this
state-of-the-art co
N'..4
generation facility.
An all out effort by
the project team
allowed the facility
to receive approval
from the California
Energy Commission
in a record 14
months. Watson Co
generation Com
pany shares its
pride in this facility
with Fluor Daniel who
helped deliver an
efficient and smooth
running unit.
Daniel C. Reyneveld
Manager, Maintenance
and Engineering
Watson Cogeneration
Company
g
,
r o
47.=
1%.
of,
A
tya»
n
-
I V .
i 4 .41
" tr. 4 ; .mitit,'f waieektel4i =mil-0 mPt. " t'
,j,.. . ' ii ) ' ,,, . .
. ' - - LI
.$ ,.:
,
' Hydrocarbon
Aerdorie
Hidrocarburos
- t
Mitzt(X
Hydiokarboner
1Erdöl
I-I id rokarbon
Yrfleeollopoqbt
Idrocarburi
Hidrokarbaan,
To streamline the,
schedule and minimize
rework in the field,
'Fluor Daniel's Hydro
carbon Sector de
signed this 385 MW
combined-cycle cogen
eration plant on its
3-D computer-eided
design system. The
plant, at ARCO's
Los Angeles Refinery
in Carson, California
js the largest cogenera
tion facility in the
Western U.S.,
,
tit
16 p 17

Flexibility is re
quired in NOAA's
Next Generation Ra
dar (NEXRAD) and
related facilities
program, due to
Federal budget con
siderations and pri
ority changes. Fluor
Daniel has proven
responsive and has
demonstrated their
ability to react
quickly to change.
Most importantly,
Fluor Daniel per
sonnel work coop
eratively and in
close conjunction
with our Govern
ment staff through
out the 45 states,
three territories and
10 foreign countries
where services are
being provided.
Chief, National Oceanic '
and Atmospheric
Administration (NOAA)
Special Engineering
Program Office
and an electrolytic refinery for
the major Olympic Dam mining project at Roxby Downs,
South Australia; and the rebuild of the fire-damaged ace
tic acid plant at Pampa, Texas,
for Hoechst Celanese.
Government Sector.
The Government Sector
provides a full range of engi
neering, procurement, con
.' struction, operations and
maintenance services to gov
ernment clients at all levels. Clients also include non
government organizations in
communications systems,
nuclear fuel cycle work and
environmental services including hazardous waste. In addi
tion, this sector also serves
the aerospace, defense and
transportation industries, as well as acting as an advanced
technology base for all Fluor
Daniel business sectors.
Fiscal 1988 presented
tough marketing challenges.
, Concern over the U.S. federal
budget deficit limited spend
ing levels on existing con
tracts, as well as future
project plans. As a result,
new awards of $154 million
were below the record high of $314 million a year ago.
Despite this difficult environ
ment, the sector expanded its
services and made inroads
into new market areas. Backlog at year end was up 35
percent to $409 million, or six percent of the company's total.
Key awards in 1988 included
a contract to provide engi
neering and construction
management services for the
installation of data networks to connect 850 Bank of Amer
. ica branches throughout California. The information
systems area is targeted as a
significant growth market.
,
The Government Sector
also expanded its environ
mental services to the
potentially huge market for hazardous waste remediation,
disposal and cleanup. The
sector was selected by the Environmental Protection
Agency as a prime contractor
and program manager for the
Alternate Remedial Contract Strategy (ARCS) program,
covering 15 states. With
Superfund-supported projects
now getting underway, a significant market for environ
mental services is rapidly
developing.
Through its FD Services
unit, the sector is increasing operations and maintenance
(O&M) services to government projects such as the
housing maintenance and util
ity operations at the Naval
Weapons Station at Charles
ton, South Carolina.
During the year, the Gov
ernment Sector essentially
completed a nationwide fiber
optic network for U.S. Sprint,
and began the preliminary engineering phase for the
strategically important Hanford VVaste Vitrification
Plant in Washington.
Fluor Constructors International
Fluor Constructors Interna
tional, Inc. (ECU) is the com
pany's union construction arm. Their strategic mission is
to support company projects
in the U.S. by providing union
construction services where
requested by clients.
Government
Staatscontracten
Gobierno
I _ o
Jkfrf
Statsentrepriser
Staatsauft rtige
ko'f
Penerintah
roc3axa3bi
Ntxrt
Governo
p. Pemerintah
The Government Sec
tor is providing engi
neering, architectural
design, construction
management and in
spection services for
approximately 115
new, expanded or
modified weather serv
ice office facilities. Pro
gram management
and construction over- r
view is also being per
formed for 175 Next
Generation Weather
Radar (NEXRAD) facili
ties to be installed at
U.S. and international
locations, such as this
site atop Mount Ash
land in Oregon.
18 19 t.;

11/11/11
The Rawl Facility in
West Virginia is Mas
sey's largest mining
complex producing
over 5 million tons of
coal in 1988. Rawl has
reserves and process
ing capabilities which
enable it to blend
different qualities of coal
to produce both metal
lurgical coal and vary
ing grades of steam
coal. During the year,
two new coal storage
areas, to enhance
blending capabilities,
were added, and the
coal washing circuit
was upgraded.
FCII made a positive contri
bution to operating results in 1988, compared with a significant loss last year. The
improvement is primarily
attributable to a strengthened management team which focused on successful completion of certain fixed-price
contracts, bid in prior years
under extremely competitive conditions, and the continuing
priorities of improved produc
tivity, quality and safety.
During 1988, FCII estab
lished an Eastern Operations
office in Greenville, South
Carolina, and aligned its organ
ization to be more respon
sive to the five business sectors. VVhile the majority of
FCII's work is currently for cli
ents served by the Power
Sector, expanded opportuni
ties for other business sec
tors are anticipated in 1989.
Natural Resource Investments
Coal
'V
A.T. Massey Coal Company,
Fluor's investment in coal,
produces high-quality steam
coal for electric utilities and
metallurgical coal for the steel industry and today ranks
among the 10 largest U.S.
coal companies. In addition to produced coal, Massey also
markets coal for independent
producers.
Massey's results for the
year were outstanding. Operating profits were up 78
percent to $50 million on a 35
percent revenue advance to
$784 million. The profits included a one-time pretax gain
of $7 million from a settlement with the United Mine VVorkers.
Fiscal 1988 was Massey's
first full year of operations since it was partitioned from Shell Oil Company. The parti
tioning resulted in Fluor assuming control of its pro
portionate share of the assets
and retaining the management team. Massey's strategy
continues unchanged. Mar
keting of high-quality, lowsulfur coal to the eastern utility
market is the area of primary
concentration. Emphasis on
technical services and quality
is the key to establishing and
maintaining long-term client
relationships in this market.
A strong focus on productivity
improvements allowed
Massey to enhance operating results and to offer clients
competitive prices.
Steam coal, which is used by utilities for electricity gen
eration, accounts for approximately 86 percent of total
U.S. coal consumption. The
outlook for this important market continues to be favor
able. Growth in demand for
electricity has been strong, particularly in the eastern
United States where Massey
is geographically well positioned. In addition, as the last
of the nuclear plants commissioned in the 1970s come onstream, new electric power generation will be supplied
primarily by coal-fired plants.
Steam coal sales in 1988
were up 18 percent as ex
treme temperatures drove
Doe Run, and its critical elements in
predecessor, won the supply of the
"Supplier of the main raw material
Year" honors from for production of
C&D for three con- our industrial
secutive years. It batteries.
has been our privi
lege, for 35 years, H. Drummond
to deal with a firm Murdoch
that is responsive President and CEO
and consistently C&D Charter Power
provides an excel- Systems
lent product with
quality serviceall
mr; mug
llhiiliIiiiililihiliu
1 111V11111i1hrilf°1:i!pliti 111:11111111111,11111111111111"'"6 \11
11
111 NM ' It 11
-
IT--;ir!
Fluor's portion of
Doe Run lead metal
sales in 1988 was
147,000 tons, up 12
percent from a year
ago. During 1988,
by-product recovery
which reduces the
overall cost of produc
tion was significantly
improved. The mill
shown above pro
duces metals concen
trates for feedstock
to the smelter.
peak energy requirements to
unexpected levels this past summer. The increased
volume more than offset the effect of lower prices from
continued over capacity in the coal industry.
Massey is also the leading
commercial supplier of metallurgical coal in the United
States. A revitalized U.S.
steel industry, as well as
renewed strength worldwide, has increased opportunities
for metallurgical coal sales at
home and abroad. The lower level of the U.S. dollar has
also contributed to increased export sales by making U.S.
produced coal more competitive in the world market.
Lead
The company's investment in lead operations, conducted
through its 57.5 percent inter
est in The Doe Run Company,
experienced dramatic improve
ment in operating results in
1988. Operating profit of $29
million was recorded for the year, compared with a modest
loss in 1987. Completing its
second full year of operations as a restructured company,
Doe Run benefited from strong pricing.
The commodities market enjoyed renewed strength
during 1988 allowing the
operation to achieve marked
improvement in by-product
credits. Moderate tightness in the availability of lead metal
worldwide kept upward pressure on prices, ending the
year at the highest level since
1980. Demand for lead has
been strong in the replace
ment battery market, a pria
mary use for lead, due to the
deteriorating effects of this past summer's extreme
temperatures. Additionally,
the lower dollar has kept
U.S.-produced lead competi
tive by reducing the levels of imported metal.
Improved earnings in 1988
helped fund an aggressive
program for facilities mainte
nance and upgrading. Addi
tionally, Doe Run was able to capitalize on high copper
prices this year by increasing
its production of copper. The
Brushy Creek mill was recom
missioned and converted
entirely to copper production.
Selected high copper-bearing
ore from the company's six
mines is processed through
this facility.
Approximately 75 percent
of Doe Run lead is used in
the production of batteries. As a result, consumption of
lead is closely associated
with the automobile industry,
a reliable long-term market.
Other uses of lead include
load-leveling batteries and
standby power systems for utilities and communications
and computer networks.
Lead prices are expected to
remain relatively strong in
1989, although they may
moderate somewhat if the level of demand experi
enced in 1988 is not sustained.
,40ne of SteIco
el's managem hies
is birkfolittia'jot
quathSiO4*6ftIng this7ph'
',;, rY.16" tion to product
quality, throùih
eir quality assur
ance program,
service "4:49Fstonier
end fair npkricpt
pricing. As ä eSult
of Massey's commit
ment, our relation
ship has matured,
and we are pleased
to have them as
our metallurgical
coal supplier.
.
Peter Baumgartl
Manager
Raw Materials
Stelco Steel
iiiiMiNNArtakiforAr-,.4
?O- 21

Fluor Operating Statistics
$ in thousands/Year ended October 31, 1988 1987 1986 1985 1984
Engineering and Construction Work Performed $4,267,892 $3,370,957 $3,817,200 $3,438,327 $4,458,238
Revenues 4,225,212 3,251,304 3,727,764 3,226,486 3,315,398
Operating Profit (Loss) 50,819 (49,473) (71,152) (106,528) 84,220
New Awards 5,955,200 4,059,700 2,992,200 4,485,300 4,151,300
Backlog $6,658,600 $4,667,300 $4,291,400 $5,114,700 $4,194,200
Employees 15,576 11,993 12,068 14,530 16,353
$ in millions $ 1988 % $ 1987 'Y. $ 1986 % $ 1985 % $ 1984 %
Backlog by Sector and Location Industrial 2,338 35 1,661 36 1,865 44 2,453 48 1,690 40
Process 1,224 19 836 18 610 14 536 11 324 8
Power 756 11 927 20 1,032 24 762 15 - 412 10
Hydrocarbon 1,932 29 940 20 690 16 1,289 25 1,700 40
Government 409 6 303 6 94 2 75 1 1 68 2
Total Backlog 6,659 100 4,667 100 4,291 100 5,115 100 4,194 100
United States 5,298 80 4,039 87 3,587 84 4,072 80 2,838 68
Outside U.S. 1,361 20 628 13 704 16 1,043 20 1,356 32
Total Backlog 6,659 100 4,667 100 4,291 100 5,115 100 4,194 100
$ in thousands/in thousands of short tons Year ended October 31, 1988 1987 1986 1985 1984
Coal*
Revenues $783,719 $580,123 $516,943 $ 475,051 $489,634
Operating Profit (Loss) $ 50,375 $ 28,326 $ 49,310 $(223,038) $ 14,800
Employees 1,232 1,372 3,307 3,571 4,709
Steam Coal Produced 11,078 9,258 9,342 7,795 7,998
Metallurgical Coal Produced 3,980 2,825 2,175 1,730 2,168
Produced Coal Sold 15,025 12,531 11,620 9,528 9,982
Purchased Coal Sold 10,038 5,306 2,522 2,174 1,931
*Amounts through June 1987 represent 50% of Massey's operations, except the number of employees which is 100%. Commencing July
1987, amounts include 100% of the operations of Massey after reflecting the partitioning with Shell Oil. See Notes to Consolidated Financial
Statements.
$ in thousands/in short tons Year ended October 31, 1988 1987 1986 1985 1984
Lead*
Revenues . $123,526 $ 93,053 $ 96,993 $ 74,905 $ 96,669 Operating Profit (Loss) $ 29,022 $ (5,511) $ (26,640) $(187,105) $ (41,460)
Employees 1,068 986 855 957 1,526
Lead Content of Concentrates Produced 139,809 123,888 186,975 172,781 137,618
Lead Metal Sold 146,879 130,753 193,849 177,772 169,080
*Amounts through 1986 represent 100% of domestic lead operations. Commencing in 1987 amounts represent Fluor's 57.5% interest in the
operations of the Doe Run Company. except the number of employees which is 100%. See Notes to Consolidated Financial Statements.
84 85 86 87 88
6
A
Backlog
dollars in billions
84 85 86 87 88
800
60°
40°
200
Coal Revenues*
dollars in millions
84 85 86 87 88
126
100
76
0
26
Lead
Revenues*
dollars in millions
84 85 86 87 88
16
S. International
Backlog
percent of total
84 85 86 87 88
21
84 85 86 87 88
Total
Coal Sold*
millions of
short tons
Purchased
Produced
o
60
Lead Metal
Sold*
thousands of
short tons
84 85 86 87 88
New Awards
dollars in billions
Backlog
by Business
Sector
II. Government 6%
Power 11%
P. Process 19%
Hydrocarbon 29%
Industrial 35%
*Amounts reflect
Fluor's proportionate
share for all periods.
22 23
88

Management's
Discussion and Analysis
Results of Operations
Earnings from continuing op
erations were $56 million in
1988 compared with a loss of
$75 million in 1987 and a loss
of $19 million in 1986. The re
lated earnings per share were
$.71 for 1988 compared with
a loss per share of $.95 and
$.23 in 1987 and 1986, re
spectively. Revenues from
continuing operations in
creased 31(3/0 in 1988 follow
ing a 10% decrease from
1986.
In 1988 the company had
net interest income of $10 million compared with net in
terest expense of $40 million in both 1987 and 1986. In
creased interest income in
1988 compared with 1987
and 1986 is due to substantial
returns on cash and cash
equivalents and the bond
portfolio. Funds invested were provided primarily from
collection of proceeds from sale of the discontinued
metals business. Reduced
interest expense in 1988
compared with 1987 and 1986 reflects lower average
debt outstanding.
Engineering and
Construction V
New contract awards for Engineering and Construction in
creased 47% in 1988 to $6.0 billion compared with $4.1 bil
lion in 1987, and $3.0 billion in
1986. The engineering and
construction industry is expe
riencing the early stages of
a growth cycle as capital
expenditures are increasing in response to record capacity
utilization in many of the
industries served by the com
pany. Improving worldwide business conditions en
hanced the overall 1988 in
crease in new awards as well as contributed to the international component of both
backlog and new awards.
Backlog at October 31, 1988
was $6.7 billion (up 43%)
compared with $4.7 billion
and $4.3 billion at October 31,
1987 and 1986, respectively.
Engineering and Construc
tion had operating profits of $51 million in 1988 compared with a loss of $49 million in 1987 and a loss of $71 million
in 1986. Marketing effective
ness and operational efficiencies continue to improve results as the reorganization
of the segment, finalized in
1987, has enabled expansion
and diversification of engi
neering and construction
services. Improved operating
results also reflect the impact of increasing margins on
orders received over the last
12-18 months. New awards
include more full service contracts, providing mainte
nance, engineering and
technical services as well as project and construction
management. The number of
employees increased 30% in
1988 compared with a slight
reduction in 1987 and a 17%
reduction in 1986.
In August 1988, Wright En
gineers Limited (Wright) was
purchased for consideration
84 85 86 87 88 which, depending on future operating results, could reach
a maximum of approximately
6 $8 million. Wright, based in
Canada, is a world-recognized
leader in the process and de3 tailed design and construction
2 management of gold, copper,
uranium, complex sulfides
and coal projects. o
During 1988, certain ex
cess real estate rental costs
It. Revenues were charged to accrued
dollars in billions lease costs whereas such
costs were charged to oper
ations in 1987 and 1986. The
84 85 86 87 88 1 accrual for such costs was
established in connection
with the company's 1987
quasi-reorganization. Operato ing results for 1987 and 1986
reflect $23 million and $22 AO
million, respectively, of losses
incurred on certain fixed price
construction contracts bid in 1 prior years under extremely
competitive conditions. These
contracts were completed in
tr. Net Interest 1988 without incurring addi-
Income tional overruns.
(Expense)
dollars in millions Coal
In the third quarter of 1987
the company completed a 84 85 86 87 88 partitioning of the assets of
300 Massey Coal Company (Mas
sey). The partitioning resulted 26° in no net gain or loss. Subse200 quent to the partitioning the
0 company has fully consolidated
00 the results of Massey.
60
L
It. Capital
Expenditures
dollars in millions
Revenues and operating
profit from Coal operations
in 1988 were $784 million
and $50 million, respectively,
compared with revenues of $580 million and operating
profit of $28 million in 1987.
Revenues and operating profit
in 1986 were $517 million
and $49 million, respectively.
In 1988, operating results im
proved significantly as lower
costs and higher sales vol
umes of produced coal as
well as additional revenues
from brokered coal sales
more than offset a decline in
steam coal realized prices.
Coal results for 1988 included
$7 million related to a favorable settlement with the United Mine Workers.
Lead
Effective November 1, 1986
the company transferred the
assets of its lead business in
exchange for a 57.5% interest
in a partnership called The
Doe Run Company (Doe
Run). The company propor
tionally consolidates its interest in the results of Doe Run.
Lead operations realized an
operating profit of $29 million
on revenues of $124 million in
1988, compared with an oper
ating loss of $6 million on revenues of $93 million in 1987
and an operating loss of $27
million on revenues of $97
million in 1986. Operations
improved significantly in 1988 compared with 1987 and 1986
due primarily to an increase
in realized prices, higher
sales volumes and lower
operating costs. Operating costs in 1988 were reduced by higher by-product credits
(copper and zinc) as realized
prices for these commodities were up significantly over 1987 and 1986. Operating re
sults in 1987 were affected
by operational inefficiencies
and downtime at the Herculaneum smelter.
The company's consolidated
results of operations in 1988 benefitted from reduced depreciation and amortization
charges due to certain fair
value adjustments effected
through the October 31, 1987
quasi-reorganization. Such ad
justments had no impact on
1987 or 1986 results of
operations.
Discontinued Operations
In 1987 the company initiated
a plan for the divestiture of
the assets of its Metals segment except for the lead op
erations which were retained. As part of the divestiture the company sold its 90% interest in St. Joe Gold Corpora
tion and certain other gold
properties resulting in an after
tax gain of approximately
$248 million. The company
also completed the sale of its zinc operation resulting in an
after tax loss of $15 million.
Metals operations remaining at October 31, 1987 were
written down to their net realizable value resulting in an after tax charge to discontin
ued operations of $122 million. In 1988, the remaining
base metals businesses, ex
cept for Pea Ridge, were sold.
Financials
Balansen
Balances
_
PRAM
Status
Bilanzen
1141,51*)R,
Keuangan
Banaeci,
xli-T-x1111
Bilanci
Kewangan
24 25

Other ket rents for office space to In 1987, capital expenditures Fluor Selected Financial Data
be subleased in the future. In included the repurchase of
In March of 1988, the com addition, certain investments land in Sugar Land, Texas for
pany made an investment, were written down to net $26 million. In millions, except per share amounts 1988 1987 1986 1985 1984
convertible into a controlling
equity interest, in SOS Inter
national (SOS), a leading
contractor in the asbestos
realizable value.
In 1988 and 1987 there is
no significant difference be
tween the effective federal
The long-term debt to cap
italization ratio at October 31,
1988 was 13.6% compared
with 29.1`)/0 and 35.0% at
Operating Results
Revenues from continuing operations $5,132.5 53,924.5 $4,341.7 53,776.4 $3,901.7 Earnings (loss) from continuing operations
abatement industry. Asbestos abatement is a relatively new, fast-growing industry and as such has experienced severe
competition and the normal
start-up and cost risks associated with such an environ
ment. Prior and subsequent
income tax rate on results of
continuing operations and the statutory rate. The difference
between the effective and statutory rates in 1986 is pri
marily due to the recognition
of a nontaxable gain and the
effect of capital gain rates.
October 31, 1987 and 1986,
respectively. The improved
1988 ratio reflects both a re
duction in long-term debt of $123 million, and an increase
in shareholders' equity due to
net earnings. At October 31,
1988, all long-term debt bears
before income taxes 90.9 (126.1) (55.0) (556.2) (34.7) Earnings (loss) from continuing operations 56.4 (75.3) (18.6) (512.8) (23.2) Net earnings (loss) 56.4 26.6 (60.4) (633.3) 1.0
Earnings (loss) per share
Continuing operations .71 (.95) (.23) (6.48) (.29)
Net earnings (loss) $ .71 $ .33 $ (.76) $ (8.01) $ .01
Return on average shareholders' equity 10.0% 3.3% (6.0)% (41.7)% Cash dividends per common share $ .02 $ .10 $ .40 $ .40 $ .60
-to the company's investment. Implementation of State interest at fixed rates. Financial Position SOS experienced losses. ment of Financial Accounting The company has on hand Current assets $ 998.6 51,213.5 5 922.1 51,057.2 $1,025.9 Since the date of investment, Standard 96-"Accounting and access to, sufficient Current liabilities 844.0 733.3 656.8 1,020.7 1,016.4 the company has recognized for Income Taxes," which is sources of funds to meet its
losses of $9 million, including not required until fiscal 1991, anticipated operating, expan- Working capital 154.6 480.2 265.3 36.5 9.5
$2 million of investment am is not expected to have any sion, and capital needs. Sig- Bond portfolio 154.8 4.0
ortization. Management be
lieves the combined strengths
material impact on the
company.
nificant short and long-term
lines of credit are maintained I1
Property, plant and equipment, net 729.8 735.2 1,301.8 1,433.3 2,338.2 Total assets 2,073.3 2,061.2 2,565.4 2,796.4 3,891.6
of Fluor Daniel and SOS will
provide stronger market pres- Financial Position and
with banks which provide
adequate operating liquidity. I' Capitalization
Long-term debt 95.0 217.8 511.5 250.8 716.2
ence and penetration, maxi- Liquidity The Board reinstated cash Shareholders' equity 601.7 531.7 950.2 1,033.9 1,696.4
mizing the profit opportunities dividends in the fourth quar- Total capitalization $ 696.7 5 749.5 51,461.7 51,284.7 $2,412.6 in this emerging market. Working capital at October ter of 1988 and paid a cash Percent of total capitalization
Corporate administrative 31, 1988 was $155 million dividend of $.02 per share in Long-term debt 13.6 29.1 35.0 19.5 29.7 and general expense in compared with $480 million October, 1988. Shareholders' equity 86.4 70.9 65.0 80.5 70.3 creased 36% in 1988 com at October 31, 1987. The Although the company is Shareholders' equity per common share $ 7.61 $ 6.74 $ 11.99 $ 13.06 $ 21.49 pared with 1987 primarily due
to higher insurance costs and
decrease is primarily due to
early retirement of long-term
affected by inflation, its Engi
neering and Construction 1 Common shares outstanding at October 31 79.1 78.9 79.3 79.1 78.9
accrued obligations associated debt, the purchase of a long operations are generally pro- Other Data
with the company's incentive term bond portfolio and the tected by the ability to recov- New awards received during year $5,955.2 $4,059.7 $2,992.2 $4,485.3 $4,151.3
compensation plans. investment in SOS. Working er cost increases through Backlog at October 31 6,658.6 4,667.3 4,291.4 5,114.7 4,194.2
Fourth quarter 1987 results capital at October 31, 1987 price escalation provisions in Capital expenditures 86.3 99.8 91.6 121.2 285.5
included a provision for the included a $450 million most contracts. Coal and Cash provided (utilized) by operating
difference between contract rents and estimated fair mar
receivable from the sale of
gold operations which was
Lead operations produce
commodities which are inter
27
28
Selected Financial
Data
Reports of
activities $ 17.7 $ 57.3 $ (224.2) $ (21.0) $ (63.9)
Number of employees at October 31 17,876 14,351 22,309 26,958 32,153
collected in November 1987.
The company's bond port
nationally traded at prices es
tablished by factors outside
Management and
Independent Public
Accountants
See Management's Discussion and Analysis on pages 24 to 26, Consolidated Statement of Operations on page 29 and Notes to Consolidated
Financial Statements and Quarterly Financial Data for information relating to significant items affecting the results of operations.
folio investment totaled $155 the control of the company. 29 Consolidated Dividends were resumed in the fourth quarter of 1988 at 5.02 per share following a suspension which began in the second quarter of 1987.
million at October 31, 1988. Management believes the Statement of At October 31, 1987, a quasi-reorganization was effected which resulted in a net reduction in shareholders' equity of $438 million. See
The cash flows from these company's substantial coal Operations Notes to Consolidated Financial Statements for additional information.
bonds are scheduled to offset and lead reserves provide a 30 Consolidated
Balance Sheet and match the cash flow obli significant hedge against any 32 Consolidated
gations on the Sugar Land adverse long-term effects of Statement of
facility lease. inflation. 33
Cash Flows
Consolidated Capital expenditures for Statement of
1988 were $86 million com- Shareholders' Equity
pared with $100 million in 34 Notes to
1987 and $92 million in 1986. Consolidated
Financial Statements
43 Segment
Information
45 Quarterly Financial
Data
26 27

Fluor Reports of Management and Independent Public Accountants ig Fluor Consolidated Statement of Operations
Management The company is responsible for preparation of the accompanying consolidated balance sheet and
the related consolidated statements of operations, cash flows and shareholders equity. They have
been prepared in conformity with generally accepted accounting principles, which have been ap
plied on a consistent basis, and management believes that they present fairly the company's consolidated financial position and results of operations. The integrity of the information presented in the financial statements, including estimates and judgments relating to matters not concluded by
fiscal year end, is the responsibility of management. To fulfill this responsibility, an accounting sys
tem and related systems of internal controls, designed to protect the company's assets and prop
erly record transactions and events as they take place, has been developed and maintained. This
system of internal controls is supported by an extensive program of internal audits and tested and
evaluated by the independent public accountants in connection with their annual audit. The Board of Directors pursues its responsibility for financial information and review through an Audit Com
mittee of Directors who are not employees. The internal auditors and the independent public accountants have full and free access to the Committee. Periodically the Committee meets with them without management present to discuss the results of their examinations, the adequacy of
internal accounting controls and the quality of financial reporting.
Independent Public Accountants Board of Directors and Shareholders
Fluor Corporation
We have examined the accompanying consolidated balance sheet of Fluor Corporation at October
31, 1988 and 1987, and the related consolidated statements of operations, cash flows and shareholders' equity for each of the three years in the period ended October 31, 1988. Our examinations
were made in accordance with generally accepted auditing standards and, accordingly, included
such tests of the accounting records and such other auditing procedures as we considered necessary in the circumstances. In 1986 the accounts of Massey Coal Company, a 50% owned joint
venture, were examined by other independent auditors; insofar as our opinion on the consolidated
financial statements related to such assets and operations, which constituted 19% and 11% of consolidated assets and revenues, respectively, it is based solely on their report.
In our opinion, based on our examinations and the report of other independent auditors, the
accompanying consolidated financial statements present fairly the consolidated financial position of
Fluor Corporation at October 31, 1988 and 1987, and the consolidated results of operations and
cash flows for each of the three years in the period ended October 31, 1988, in conformity with
generally accepted accounting principles applied on a consistent basis during the period.
"4-Ai tsu"s"r e di-74"r Orange County, California
December 5, 1988
In thousands, except per share amounts/Year ended October 31, 1988 1987 1986
Revenues
Engineering and construction services
Natural resources $4,225,212
907,245
$3,251,304
673,176
$3,727,764
613,936
Total revenues 5,132,457 3,924,480 4,341,700
Cost of Revenues
Engineering and construction services
Natural resources 4,181,269
827,848 3,298,628
650,886 3,794,757
591,406
Total cost of revenues
Other Income and Expense
Corporate administrative and general expense Interest expense
Interest income Equity in loss of SOS
Provision for sublease losses and write-down of investments
Gain on sale of Irvine facility and common stock of St. Joe
Gold Corporation
5,009,117
32,795
27,259
(37,060)
9,451
3,949,514
24,131
58,304
(18,231)
36,845
4,386,163
32,532
63,185
(23,345)
(61,881)
Total costs and expenses 5,041,562 4,050,563 4,396,654
Earnings (Loss) From Continuing Operations Before Taxes
Income Tax Benefit (Expense) 90,895
(34,500)
(126,083)
50,808 (54,954)
36,337
Earnings (Loss) From Continuing Operations 56,395 (75,275) (18,617)
Discontinued Operations Loss from operations, net of income taxes
Gain (loss) on disposal, net of income taxes
(16,544)
111,254
(17,479)
(24,347)
Earnings (Loss) From Discontinued Operations 94,710 (41,826)
Earnings (Loss) Before Extraordinary Item Tax benefit of net operating loss
56,395 19,435
7,157
(60,443)
Net Earnings (Loss) $ 56,395 $ 26,592 $ (60,443)
Earnings (Loss) Per Share
Continuing operations
Discontinued operations
Extraordinary item
.71 (.95)
1.19
.09
$ (.23)
(.53)
Net Earnings (Loss) Per Share .71 .33 $ (.76)
Shares Used to Calculate Earnings (Loss) Per Share 79,582 79,484 79,248
See Notes to Consolidated Financial Statements.
28 29

Fluor Consolidated Balance Sheet
$ in thousands/At October 31, 1988 1987 1988 1987
Assets Current Assets
Liabilities and Shareholders' Equity Current Liabilities
Cash and cash equivalents
Receivable from sale of St. Joe Gold
Accounts and notes receivable Contract work in progress Inventories
Other current assets
Total current assets
$ 164,580
396,658 337,347
66,580
33,429
998,594
$ 74,642
450,000
353,646
253,742
61,232
20,196
1,213,458 1
Accounts payable
Advance billings on contracts
Accrued salaries and wages and benefit plan liabilities Other accrued liabilities
Current portion of long-term debt Income taxes currently payable
Deferred income taxes
$ 358,061
118,752
71,535
218,856
58,506
18,338
$ 316,251
87,301
69,838
199,959
11,421
17,075
31,429
Investment in Bond Portfolio 154,777 4,000 Total current liabilities 844,048 733,274
Long-Term Debt Due After One Year 94,961 217,762
Property, Plant and Equipment
Land
Buildings and improvements
Machinery and equipment
Mining properties and mineral rights
61,647
79,550
254,037
395,397
61,215
77,111
184,922
406,021
Noncurrent Liabilities Deferred income taxes
Accrued lease costs
Other
Total noncurrent liabilities
79,063
148,792
304,735
532,590
86,160
178,798
313,449
578,407
Construction in progress 14,209 5,885 Contingencies and Commitments
Less accumulated depreciation, depletion and amortization
Net property, plant and equipment
804,840
75,081
729,759
735,154
735,154
Shareholders' Equity Capital Stock
Preferred-authorized 20,000,000 shares without par value, none issued Common-authorized 150,000,000 shares of $.625 par value; issued and
outstanding in 1988-79,051,744 shares and in 1987-78,939,846 shares 49,407 49,337
Other Assets
Investments
Other 94,997
95,219 33,190
75,384
Additional capital Retained earnings (since October 31, 1987)
Unamortized executive stock plan expense
Cumulative translation adjustments
497,907
54,814
(3,117)
2,736
487,435
(4,367)
(662)
-
Total other assets 190,216 108,574 Total shareholders' equity 601,747 531,743
$2,073,346 $2,061,186 $2,073,346 $2,061,186
See Notes to Consolidated Financial Statements.
IN
30.* 31

Fluor Consolidated Statement of Cash Flows
In thousands/Year ended October 31,
Cash Flows From Operating Activities Net income (loss)
Depreciation, depletion and amortization
Deferred income taxes Amortization of accrued lease costs and deferred gains
Provision for sublease losses and write-down of investments
Gain on sale of Irvine facility and St. Joe Gold common stock
Loss (gain) on disposal of discontinued operations
Change in operating working capital
Other, net
Cash provided (utilized) by operating activities
Cash Flows From Investing Activities
Capital expenditures Proceeds from sale of property, plant and equipment
Investment in bond portfolio
Additions to investments Proceeds from sale of discontinued operations, net
Partition of Massey assets Proceeds from facility sale leasebacks and St. Joe Gold
common stock sale
Other, net
Cash provided by investing activities
Cash Flows From Financing Activities Payments of long-term debt
Issuance of debt
Cash dividends paid
Other, net
Cash provided (utilized) by financing activities
Increase (decrease) in cash and cash equivalents
Cash and cash equivalents at beginning of period
Cash and cash equivalents at end of period
See Notes to Consolidated Financial Statements.
1988
$ 56,395
76,000
(49,397)
(37,009)
(43,654)
15,414
17,749
(86,259)
8,960
(150,777)
(69,267)
450,000
3,949
156,606
(81,537)
363
(1,581)
(1,662)
(84,417)
89,938
74,642
$ 164,580
1987
$ 26,592
124,377
62,321
(20,570)
36,845
(215,737)
93,990
(50,482)
57,336
(99,824)
21,738
(4,000)
147,535
108,148
(3,899)
169,698
(250,830)
2,809
(7,927)
7,225
(248,723)
(21,689)
96,331
$ 74,642
Fluor
1986
$ 1(2690:424503)
(35,682)
(23,597)
(61,881)44,997
(225,685)
8,891
(224,150)
(91,619)
24,338
131,000
70,700
20,209
154,628
(106,265)
264,983
(31,701)
(11,866)
115,151
45,629
50,702
$ 96,331
Consolidated Statement of Shareholders' Equity
$ in thousands, except per share amounts Common Year ended October 31, 1986, 1987 and 1988 Stock
Balances at October 31, 1985 $49,462
Net loss
Cash dividends ($.40 per share) Exercise of stock options, net
Amortization of executive stock 67
plan expense
Issuance of restricted stock, net Translation adjustment for the
period
16
Balances at October 31, 1986 49,545
Net earnings
Cash dividends ($.10 per share)
Exercise of stock options, net
Amortization of executive stock 105
plan expense
Repurchase of restricted stock, net
Repurchase of common stock
Translation adjustment for the
period
Quasi-reorganization
Revaluation adjustments, net Transfer to additional capital
(20)
(293)
Balances at October 31, 1987 49,337
Net earnings
Cash dividends ($.02 per share)
Exercise of stock options, net
Amortization of executive stock
180
plan expense
Repurchase of restricted stock, net
Repurchase of common stock
Tax benefit of net operating loss
Translation adjustment for the period
(29)
(81)
Balances at October 31, 1988 $49,407
See Notes to Consolidated Financial Statements.
Additional Capital
$1,069,624
991
230
1,070,845
2,260
(563)
(5,528)
(438,222)
(141,357)
487,435
3,771
(955)
(1,581)
9,237
$ 497,907
$
Retained Earnings (Deficit)
(67,878)
(60,443)
(31,701)
Unamortized Executive
Stock Plan Expense
$(9,429)
Cumulative Translation
Adjustments
$(7,875)
Total
$1,033,904
(60,443)
(31,701)
1,058
3,003
(310)
3,003
(64)
4,483 4,483
(160,022)
26,592
(7,927)
(6,736) (3,392) 950,240
26,592
(7,927)
2,365
1,928 1,928
441 (142)
(5,821)
2,730 2,730
141,357
(438,222)
56,395
(1,581)
(4,367) (662) 531,743
56,395
(1,581)
3,951
326 326
924 (60)
(1,662)
9,237
3,398 3,398
$ 54,814 $(3,117) $ 2,736 $ 601,747
32 33

Fluor Notes to Consolidated Financial Statements
Major Accounting Policies Balance Sheet Revaluation
The consolidated balance sheet at October 31, 1987 was adjusted to fair value in accordance with accounting principles applicable to quasi-reorganizations. See Restructuring.
Principles of Consolidation
The financial statements include the accounts of the company and its subsidiaries. The equity
method of accounting is used for investment ownership ranging from 20% to 50%. Investment ownership of less than 20% is accounted for on the cost method. The company does not con
solidate entities for which control is deemed temporary. The company recognizes 100% of the operations of certain unconsolidated entities which are under effective control. All significant
intercompany transactions of consolidated subsidiaries are eliminated. Certain 1987 and 1986
amounts have been reclassified to conform with the 1988 presentation.
Business Ownership Changes
CoalOn July 10, 1987, the company and two subsidiaries of Shell Oil Company (Shell) completed
a partition of Massey Coal Company (Massey) whereby Shell relinquished 99% of its 50% interest
in Massey for certain of Massey's operating subsidiaries. The partitioning resulted in no net gain
or loss to the company. Prior to the partitioning the company had proportionally consolidated its 50% interest in Massey; subsequently, Massey's operations are fully consolidated to reflect the
company's ownership interest. LeadEffective November 1, 1986 the company and Homestake Mining Company transferred all
of the assets of their respective domestic lead businesses to The Doe Run Company partnership (Doe Run). Certain reclassifications were made to the historical carrying values of the company's
lead operations to reflect the proportional consolidation of the company's 57.5% ownership
interest in the partnership.
Engineering and Construction Contracts
The company recognizes engineering and construction contract revenues using the percentage-of
completion method, primarily based on contract costs incurred to date compared with total esti
mated contract costs, and using hours incurred to date compared with total estimated hours for the construction of certain power plants. Contracts are segmented between engineering and con
struction efforts and, accordingly, gross margin related to each activity is recognized as those sepa
rate services are rendered. Changes to total estimated contract costs or hours and losses, if any,
are recognized in the period they are determined. Revenues recognized in excess of amounts
billed are classified as current assets under contract work in progress. It is anticipated that the incurred costs associated with contract work in progress at October 31, 1988, will be billed and
collected in 1989. Amounts received from clients in excess of revenues recognized to date are
classified as current liabilities under advance billings on contracts.
Depreciation and Amortization
Additions to property, plant and equipment are recorded at cost. Assets other than mining proper
ties and mineral rights are depreciated principally using the straight-line method to amortize the
cost of the assets over their estimated useful lives. Leasehold improvements are amortized over the lives of the respective leases. The excess of cost over net assets of acquired businesses is amortized on the straight-line method, over periods not longer than 40 years.
Exploration and Development
CoalDevelopment costs of specific coal properties, when expected to be significant, are capitalized in mining properties and depleted over the expected economic life of the mine on the units of production method.
Lead--Costs incurred for exploration of minerals are generally expensed as incurred. Development expenditures to bring new mineral properties into production, comprising substantially all surface
mine development and initial underground installations, are capitalized in mining properties and amortized by the straight-line method over periods approximating the economic life of the mine.
Subsequent maintenance and underground development expenditures are generally charged to expense as incurred.
Investment in Bond Portfolio
The company's bond portfolio is carried at amortized cost which approximates market value. At
October 31, 1988, the portfolio has a weighted average interest rate of nearly 11% and maturities ranging from 1989 to 2004.
Income Taxes
Deferred income taxes are provided for items recognized in different periods for financial and tax
reporting purposes. Such timing differences include the use of the completed-contract method of accounting for certain contracts, accelerated depreciation and various accruals.
Earnings (loss) per share
Earnings (loss) per share is based on the weighted average number of common and common
equivalent shares outstanding in each period. Common equivalent shares include the potential dilution from the exercise of stock options when the effect of such options is dilutive.
Inventories
Coal, metals and processed minerals inventories are stated at the lower of cost using the last-in, first-out (LIFO) method or net realizable value. Supplies and other are valued on the average cost method. Inventories comprise: $ in thousands/At October 31, 1988 1987
Coal, metals and processed minerals $34,713 $37,059
Supplies and other 31,867 24,173
$66,580 $61,232
Foreign Currency Translation
The effects of translating foreign subsidiaries' financial statements are recorded as a separate
component of shareholders' equity. Changes in cumulative translation adjustments were as follows: $ in thousands/Year ended October 31, 1988 1987
Balance at beginning of year $ 1662) $13,3921
Translation adjustments 5,149 4,712
Deferred income taxes on translation adjustments 11.751) (1,982)
Balance at end of year $ 2,736 $ 16621
34 35
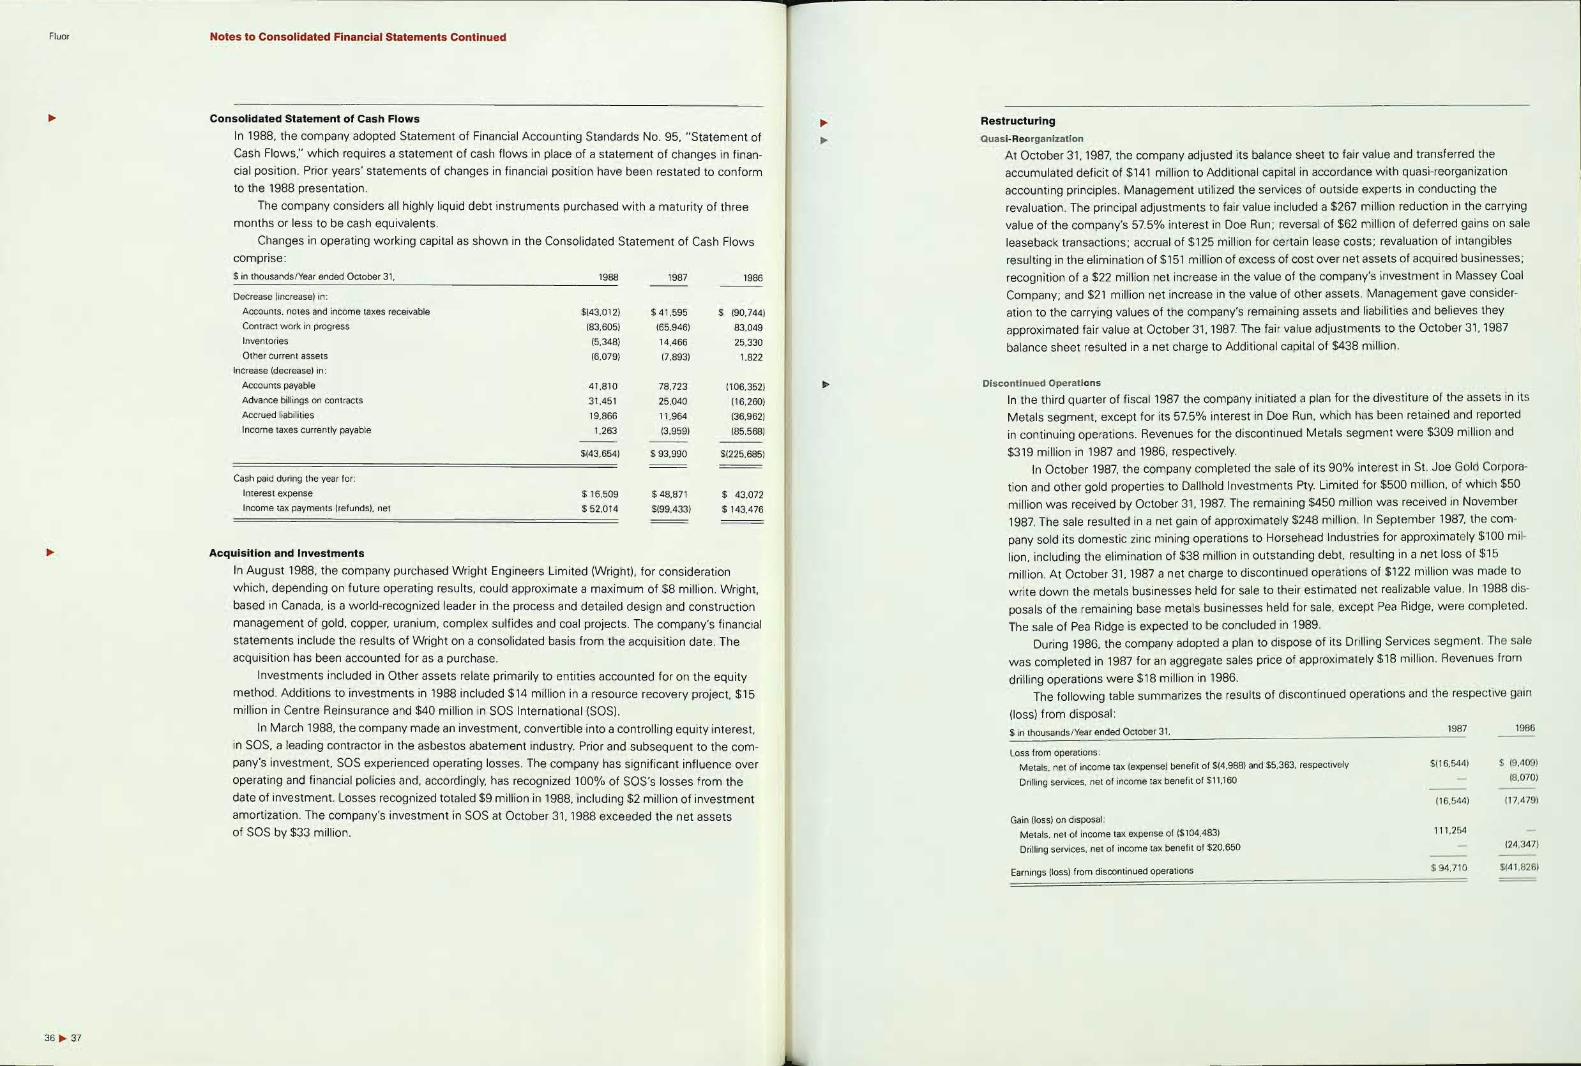
Fluor Notes to Consolidated Financial Statements Continued
Consolidated Statement of Cash Flows In 1988, the company adopted Statement of Financial Accounting Standards No. 95, "Statement of
Cash Flows," which requires a statement of cash flows in place of a statement of changes in financial position. Prior years' statements of changes in financial position have been restated to conform to the 1988 presentation.
The company considers all highly liquid debt instruments purchased with a maturity of three months or less to be cash equivalents.
Changes in operating working capital as shown in the Consolidated Statement of Cash Flows comprise: $ in thousands/Year ended October 31, 1988 1987 1986
Decrease (increase) in:
Accounts, notes and income taxes receivable $(43,012) $ 41,595 $ (90,744)
Contract work in progress (83,605) (65.946) 83,049
Inventories (5,348) 14,466 25,330
Other current assets (6,079) (7,893) 1,822
Increase (decrease) in:
Accounts payable 41,810 78,723 (106,352)
Advance billings on contracts 31.451 25,040 (16,260) Accrued liabilities 19,866 11,964 (36,9621
Income taxes currently payable 1,263 (3,959) (85,5681
$(43,654) $ 93.990 $(225,685)
Cash paid during the year for:
Interest expense $ 16,509 $ 48,871 $ 43,072
Income tax payments (refunds), net $ 52,014 $199,433) $ 143,476
Acquisition and Investments
In August 1988, the company purchased Wright Engineers Limited (Wright), for consideration
which, depending on future operating results, could approximate a maximum of $8 million. Wright,
based in Canada, is a world-recognized leader in the process and detailed design and construction
management of gold, copper, uranium, complex sulfides and coal projects. The company's financial statements include the results of Wright on a consolidated basis from the acquisition date. The acquisition has been accounted for as a purchase.
Investments included in Other assets relate primarily to entities accounted for on the equity method. Additions to investments in 1988 included $14 million in a resource recovery project, $15 million in Centre Reinsurance and $40 million in SOS International (SOS).
In March 1988, the company made an investment, convertible into a controlling equity interest,
in SOS, a leading contractor in the asbestos abatement industry. Prior and subsequent to the com
pany's investment, SOS experienced operating losses. The company has significant influence over operating and financial policies and, accordingly, has recognized 100% of SOS's losses from the
date of investment. Losses recognized totaled $9 million in 1988, including $2 million of investment
amortization. The company's investment in SOS at October 31, 1988 exceeded the net assets of SOS by $33 million.
Restructuring Quasi-Reorganization
At October 31, 1987, the company adjusted its balance sheet to fair value and transferred the
accumulated deficit of $141 million to Additional capital in accordance with quasi-reorganization accounting principles. Management utilized the services of outside experts in conducting the
revaluation. The principal adjustments to fair value included a $267 million reduction in the carrying
value of the company's 57.5% interest in Doe Run; reversal of $62 million of deferred gains on sale
leaseback transactions; accrual of $125 million for certain lease costs; revaluation of intangibles resulting in the elimination of $151 million of excess of cost over net assets of acquired businesses;
recognition of a $22 million net increase in the value of the company's investment in Massey Coal
Company; and $21 million net increase in the value of other assets. Management gave consider
ation to the carrying values of the company's remaining assets and liabilities and believes they
approximated fair value at October 31, 1987. The fair value adjustments to the October 31, 1987
balance sheet resulted in a net charge to Additional capital of $438 million.
Discontinued Operations
In the third quarter of fiscal 1987 the company initiated a plan for the divestiture of the assets in its Metals segment, except for its 57.5% interest in Doe Run, which has been retained and reported in continuing operations. Revenues for the discontinued Metals segment were $309 million and
$319 million in 1987 and 1986, respectively. In October 1987, the company completed the sale of its 90% interest in St. Joe Gold Corpora
tion and other gold properties to Dallhold Investments Pty. Limited for $500 million, of which $50
million was received by October 31, 1987. The remaining $450 million was received in November
1987. The sale resulted in a net gain of approximately $248 million. In September 1987, the com
pany sold its domestic zinc mining operations to Horsehead Industries for approximately $100 mil
lion, including the elimination of $38 million in outstanding debt, resulting in a net loss of $15
million. At October 31, 1987 a net charge to discontinued operations of $122 million was made to
write down the metals businesses held for sale to their estimated net realizable value. In 1988 dis
posals of the remaining base metals businesses held for sale, except Pea Ridge, were completed.
The sale of Pea Ridge is expected to be concluded in 1989. During 1986, the company adopted a plan to dispose of its Drilling Services segment. The sale
was completed in 1987 for an aggregate sales price of approximately $18 million. Revenues from
drilling operations were $18 million in 1986. The following table summarizes the results of discontinued operations and the respective gain
(loss) from disposal:
$ in thousands/Year ended October 31, 1987 1986
Loss from operations:
Metals, net of income tax (expense) benefit of $14,988) and $5,363, respectively $116,544) $ 19.409)
Drilling services, net of income tax benefit of $11,160 18,070)
116.5441 (17,479)
Gain (loss) on disposal:
Metals, net of income tax expense of ($104,483) 111,254
Drilling services, net of income tax benefit of $20,650 (24,347)
Earnings (loss) from discontinued operations $ 94,710 $(41,826)
36

Fluor Notes to Consolidated Financial Statements Continued
Income Taxes The income tax benefit (expense) included in the Consolidated Statement of Operations is as
follows: $ in thousands/Year ended October 31, 1988 1987 1986
Current:
Federal (Includes a charge in lieu of taxes of $7,319 and $7,157 for 1988
and 1987, respectively)
Foreign (Includes a charge in lieu of taxes of $1,918 in 19881
State and local
Total current
Deferred:
Federal
Foreign
State and local
Total deferred
Total income tax benefit (expense)
$169,706)
(8,430)
15,761)
(83,897)
52,961
(3,655)
91
49,397
$134,5001
$ 12,881
(4,718)
(4,505)
3,658
(64,677)
271
2,085
(62,321)
$158,6631
$ 64,333
(18,249)
(8,256)
37,828
29,805
3,208
2,669
35,682
$ 73,510
The income tax benefit (expense) applicable to continuing and discontinued operations
is as follows: $ in thousands/Year ended October 31, 1988 1987 1986
Provision for continuing operations:
Current
Deferred
$ 67,007 (101,507)
$ (17,292)
68,100
$13,781
22,556
Total provision-continuing operations (34,500) 50,808 36,337
Provision for discontinued operations:
Current
Deferred
1150,904)
150,904
20,950
(130,421)
24,047
13,126
Total provision-discontinued operations (109,471) 37,173
Total income tax benefit (expense) $ 134,500) $ 158,6631 $73,510
A reconciliation of statutory federal income tax to the income tax benefit (expense) on the earnings
(loss) from continuing operations follows:
$ in thousands/Year ended October 31,
Statutory federal income tax benefit (expense)
Reductions (increases) in taxes resulting from:
Depletion
Earnings (losses) without tax effect
Effect of foreign tax rates
State and local income taxes
Amortization and write-down of property, plant and equipment
Tax credits
Amortization and write-off of excess of cost over net assets of
acquired businesses
Accruals without tax effect
Capital gain rate differential
Nontaxable gain on sale of St. Joe Gold common stock
Indefinitely reinvested foreign earnings
Other, net
Total income tax benefit (expense)
1988
$130,904)
9,343
(5,955)
13,790)
13,7421
12,206)
1,082
18771
(2921
2,841
$134,5001
1987
$52,955
7,783
2,459
11,259)
(8,650)
2,631
12,087)
15,0941
2,247
(1771
$50,808
1986
$ 25,279
7,218
5,428
(6,840)
11,392)
110,7621
5,178
(2,2841
1,691
11,356
11,087
(7,0001
(2,622)
$ 36,337
The difference between the statutory federal income tax rate and the actual tax rates applicable to discontinued operations is primarily attributable to the effect of foreign taxes, losses without tax
benefit and capital gain rates. The rate difference applicable to the disposal of discontinued operations is primarily attributable to capital gain rates and foreign tax credits.
The deferred income tax benefit (expense) applicable to timing differences from continuing oper
ations are as follows: $ in thousands/Year ended October 31,
Reduction (increase) in deferred tax credits
Accruals not currently reportable for tax purposes
Use of different methods of accounting for construction contracts
Residual tax on undistributed foreign earnings
Deferred gains on property sales
Other, net
Total
1988 1987 1986
$$(51,565) $ 51,565 $$ -(33,964) 10,603 8,623
16,5381 21.841 (4,033)
1,064 (13,477) 14,652
(317) 15,6991 1,011
(10,187) 3,267 2,303
$(101,507) $ 68,100 $22,556
Continuing operations in 1987 were benefitted by $52 million through reductions of deferred tax
credits arising from deferral of the proceeds on disposal of discontinued operations.
United States and foreign earnings (losses) from continuing operations before income taxes are
as follows: $ in thousands/Year ended October 31, 1988 1987 1986
United States $63,843 $1157,8121 $(74,984)
Foreign 27,052 31,729 20,030
Total $90,895 $1126,083) $(54,954)
Residual income taxes have not been provided on approximately $42 million of undistributed earnings of certain foreign subsidiaries at October 31, 1988 because the company intends to reinvest
these earnings indefinitely. A.T. Massey Coal Company, Inc. and its subsidiaries file a separate consolidated tax return and
have available net operating loss carryforwards of $71 million which expire at varying dates through 2000. Utilization of these carryforwards may result in reduction of future tax payments.
The Internal Revenue Service (IRS) has completed its examination of the company's federal
income tax returns for the fiscal years 1977 through 1979 and those of St. Joe Minerals Corporation
through 1981. The company is following the appropriate IRS appeals process in settling certain issues raised by the IRS. Examinations of fiscal years 1980 through 1983 are in process and no
material adjustments have been proposed by the IRS. Management believes that the resolution
of all tax issues will not have a material adverse effect on the company's consolidated financial
position or results of operations. In December 1987, the Financial Accounting Standards Board issued Statement of Financial
Accounting Standard No. 96 "Accounting for Income Taxes." Management believes that implementation, which is not required until 1991, would not have a material effect on the 1988 consol
idated results of operations or financial position of the company.
38 39

Fluor Notes to Consolidated Financial Statements Continued
Retirement Benefits
The company sponsors defined contribution retirement and noncontributory defined benefit pension plans for eligible employees. Contributions to defined contribution retirement plans are based on a percentage of employees compensation. Expense recognized for these plans is primarily re
lated to Engineering and Construction operations and totaled $42 million in 1988, $33 million in
1987 and $36 million in 1986. Contributions to defined benefit pension plans are generally at the
minimum annual amount required by applicable regulations. Payments to retired employees under
these plans, which are primarily related to natural resource operations, are generally based upon length of service and a percentage of qualifying compensation.
Net periodic pension cost for continuing operations defined benefit pension plans includes the
following components: $ in thousands/Year ended October 31, 1988 1987 1986
Service costs-benefits earned during the period $ 3,156 $ 4,064 $ 4,500
Interest cost on projected benefit obligation 5,724 4,922 4,330
Less-income and gain on assets invested (8,683) (5,891) (4,379)
Net periodic pension cost $ 197 $ 3,095 $ 4,451
The following assumptions were used in the determination of net periodic pension cost:
Discount rates 8.0-9.0% Rates of increase in compensation levels 5.0-7.5% Expected long-term rate of return on assets 8.0-9.0%
The following table sets forth the status of the defined benefit plans: $ in thousands/At October 31, 1988 1987
Actuarial present value of benefit obligations:
Vested benefit obligation $ 41,114 $ 43,468
Nonvested benefit obligation 10,507 4,878
Accumulated benefit obligation $ 51,621 $ 48,346
Plan assets at fair values (primarily listed stocks and bonds) $121,271 $107,013
Projected benefit obligation 169,4871 (67,964)
Plan assets in excess of projected benefit obligation 51,784 39,049
Unrecognized net gain (9,703) -Pension asset recognized in the Consolidated Balance Sheet $ 42,081 $ 39,049
All previously unrecognized net gain and asset at implementation were recognized in 1987 in connection with the quasi-reorga
nization and partitioning of Massey.
Excludes the projected benefit obligation and associated plan assets relating to present and former employees of
discontinued operations of $124 million and $111 million at October 31, 1988 and 1987, respectively.
Massey participates in multiemployer defined benefit pension plans for its union employees. Pension expense related to these plans was approximately $.4 million, $1 million and $1 million in the years ended October 31, 1988, 1987 and 1986, respectively.
The company and certain of its subsidiaries provide health care and life insurance benefits for
certain retired employees. The cost of such benefits for continuing operations, which approximated $4 million in 1988 and $3 million in both 1987 and 1986, is expensed when paid.
Long-Term Debt
Long-term debt comprises: $ in thousands/At October 31, 1988 1987
Term loans, 9.3%, due in installments through 2000 $ 40.100 $ 46.800
Eurodollar zero coupon debentures, effective interest rate 14%, due in 1990
net of unamortized discount of $6,511 and $13,802, respectively) 31,176 35,934
Deutsche mark financing, with a currency exchange agreement fixing the repayments in
U.S. dollars at an effective interest rate of 9.5%, due in 1996 28,578 46,879
Serial zero coupon notes, effective interest rate 14.3%, due in installments through 1989
net of unamortized discount of $955 and $3,515, respectively) 18,077 20,437
Notes, effective interest rate 9.7%, due in 1993 16,196 32,210
Swiss Franc financing, with a currency exchange agreement fixing the repayments in U.S.a
dollars at an effective interest rate of 9.3%, due in 1993 15,039 36,173
Other notes and mortgages 4,301 10,750
153,467 229,183
Less: Current portion 58,506 11,421
Long-term debt due after one year $ 94,961 $217,762
Maturities relating to long-term debt are as follows for the years ending: 1990, $31.6 million; 1991, $.3 million; 1992, $.3 million; 1993, $31.4 million; and $31.4 million thereafter.
The company has unsecured committed revolving long-term lines of credit with banks from which it may borrow for general corporate purposes up to a maximum of $285 million, of which
$250 million can convert to four-year term loans. Commitment fees are paid on unused portions of these lines. In addition, at October 31, 1988 the company had $114 million in unused short-term
lines of credit. At October 31, 1988, no amounts were outstanding under these lines.
Borrowings under lines of credit and revolving credit agreements bear interest at prime, rates
based on the London Interbank Offered Rate (LIBOR), domestic certificates of deposit, or other
rates which are mutually acceptable to the banks and the company. All long-term debt (including
current portion) outstanding at October 31, 1988 bears interest at fixed rates.
Stock Plans
The company has four executive stock plans, the 1971 Fluor Stock Option Plan, the 1977 and 1981
Fluor Executive Stock Plans and the 1982 Fluor Executive Stock Option Plan. These plans provide
for grants of nonqualified or incentive options at prices equal to the fair market value of the com
pany's common stock at date of grant.
The 1977 and 1981 Plans also provide for rights to acquire shares under restricted stock agree
ments at $.331/3 per share under the 1977 Plan and at no charge under the 1981 Plan. Upon termi
nation of employment for reasons other than retirement, death or permanent disability of the
recipient, the stock must be returned to the company for the amount, if any, originally paid. At October 31, 1988, a total of 1,417,358 restricted shares had been awarded and a total of 96,232 shares
were available for award as restricted stock.
In addition, the company has the 1979 and 1980 Fluor Stock Appreciation Rights Plans. On
exercise, the holder of the rights receives the excess of market value of the rights on exercise date over the market value of the rights on the grant date. Such market values are equal to the market
value of the company's common stock. Changes in market value are accounted for currently as compensation expense. The company has adopted, subject to shareholder approval, the 1988 Fluor
Executive Stock Plan which provides, among other things, for the granting of up to 3,000,000 addi
tional stock options or stock appreciation rights ("SAR's"). On September 12, 1988, 85,752 SAR's were contingently awarded pursuant to this plan.
40 41

Fluor Notes to Consolidated Financial Statements Continued
Options and stock appreciation rights granted are generally exercisable one year after the date of grant or in installments of 25% per year commencing one year from date of grant. All options expire ten years after date of grant.
The following table summarizes stock option and SAR activity for the two years ended October 31, 1988:
Price Value
Shares Per Share SAR Per Right
Outstanding at October 31, 1986 2,634,890 $11-34 768,799 $13-34 Granted 1,655,369 12-19 826 12
Expired or cancelled (1,125,618) 12-34 (41,1511 12-22 Exercised (285,609) 11-18 (31,980) 13-18
Outstanding at October 31, 1987 2,879,032 11-34 696,494 12-34
Granted 413,704 20-22 363,544 20-22 Expired or cancelled 1231,690) 11-34 169,5971 12-22 Exercised (298,145) 11-22 (107,251) 12-22
Outstanding at October 31, 1988 2,762,901 $11-34 883,190 $12-34
Exercisable at:
October 31, 1987 799,713 $11-34 305,912 $12-34 October 31, 1988 990,315 $11-34 309,650 $12-34 Available for grant at:
October 31, 1987 335,854 299,626 October 31, 1988 154,090 5,679
The company adopted a preferred shares purchase rights plan and, pursuant thereto issued one preferred share purchase right ("Right") on each outstanding share of common stock. The Rights are exercisable only if a person or group acquires, or makes a tender offer for, 20% or more of the company's common stock. When exercisable, each Right entitles its holders to buy Vlooth share of a newly issued preferred stock at an exercise price of $40, subject to certain antidilution adjust
ments. The Board of Directors, at its option, may lower the exercisability threshold from 20% to as low as 10% so long as no person or group then owns more than the lowered amount and may, at any time after the rights have become exercisable, but before there has been an acquisition of 50% or more by any person or group, exchange each then valid right for one new share of common stock. However, the rights do not become exercisable when, as a result of a single purchase, the common stock ownership of a person or group goes from below the exercisability threshold to 85% or more of the amount outstanding.
Also, if at any time after the Rights become exercisable, the company is either involved in a merger or other business combination transaction, or 50% or more of its consolidated assets or earning power is sold, or a person or group acquires 20% or more of the company's common stock, then each Right will entitle its holder to purchase common stock of the company or the acquiring company having a market value of twice the exercise price of the Right.
The Rights, which do not have voting privileges, may be redeemed by the company at a price of $.02 per Right at any time prior to public announcement that a person or group has acquired beneficially 20% or more of the company's common shares. The Rights will also be automatically redeemed under certain circumstances if a majority of shareholders approve the terms of a bid to acquire 100% of the company's common stock which is made by a person or group owning less than 1% of the company's common stock. The Rights expire on November 30, 1997.
Lease Obligations
Total rental expense for continuing operations amounted to $89 million, $84 million and $87 million, in 1988, 1987 and 1986, respectively. The company's lease obligations relate primarily to office
facilities, data processing equipment, equipment used in connection with long-term construction
contracts and other personal property. The company's obligations under noncancellable leases for
minimum rentals offset by cash flows from the bond portfolio are as follows: Cash Flows
Gross from Bond Present $ in thousands/At October 31, 1988 Rentals Portfolio Net Value*
1989
1990
1991
1992
1993
Thereafter
$ 74,484
69,388
61,576
57,947
57,170
328,073
$ 19,275
18,781
20,857
17,785
19,994
247,685
$ 55,209
50,607
40,719
40,162
37,176
80,388
$ 55,209
45,592
33,048
29,366
24,489
39,506
$648,638 $344,377 $304,261 $227,210
The present value of net lease obligations is presented as supplementary information to reflect the impact on future lease
commitments of the time value of money, using a discount rate of 11%.
At October 31, 1988 and 1987, obligations under capital leases of $14 million and $15 million,
respectively, are included in Other noncurrent liabilities.
Contingencies, Commitments and Restrictions
The company is contingently liable for commitments and performance guarantees arising in the
ordinary course of business. Claims arising from engineering and construction contracts have been
made against the company by clients, and the company has made certain claims against clients for costs incurred in excess of current contract provisions. The company's natural resource operations
are affected by federal, state and local laws and regulations regarding environmental protection.
The outcome or timing of current environmental matters or the full impact, if any, of such legislative or regulatory developments on future operations is not currently estimable. In the opinion of
management, finalization of these matters will not have a material adverse effect on the com
pany's consolidated financial position or results of operations.
At October 31, 1988, $140 million of net assets of Doe Run, including $39 million of working capital, have restrictions. Concurrence of the partners is required to transfer assets in the form of
advances, loans or other distributions outside the Partnership.
Operations by Business Segment and Geographic Area The Engineering and Construction segment includes subsidiaries engaged in the design, engineer
ing, procurement, construction, technical services and maintenance of facilities for industrial, com
mercial, utility, natural resource, energy and government clients. Coal segment amounts through
June 1987 represent 50% of Massey's operations. Commencing July 1987 Coal segment amounts include the operations of Massey after the partitioning with Shell Oil. Through 1986, the Lead segment represents 100% of the company's domestic lead operations. Beginning in 1987 the Load
segment represents the company's 57.5% interest in the operations of Doe Run.
Identifiable assets are those tangible and intangible assets used in the operation of each of the
business segments and geographic areas. Corporate assets are principally cash, cash equivalents
and nontrade receivables.
Sales to customers in foreign countries from domestic operations comprise less than 10% of total revenues in each of the last three years. In 1988 and 1987 no single customer accounted for
more than 10% of revenues. Contracts with one major customer accounted for $574 million, or
15%, of Engineering and Construction revenues during 1986.
42 43

Fluor Notes to Consolidated Financial Statements Continued Fluor
Revenues Operating Profit (Loss)
$ in millions 1988 1987 1986 1988 1987 1986
Operations by Business Segment Engineering and Construction $4,225.2 $3,251.3 $3,727.8 $ 50.8 $(49.5) $(71.2)
Coal 783.7 580.1 516.9 50.4 28.3 49.3
Lead 123.6 93.1 97.0 29.0 (5.5) (26.6)
Continuing Operations $5,132.5 $3,924.5 $4,341.7 $130.2 $(26.7) $(48.5)
Depreciation, Depletion Identifiable Assets Capital Expenditures and Amortization
$ in millions 1988 1987 1986 1988 1987 1986 1988 1987 1986
Engineering and Construction $ 886.9 $ 620.4 $ 582.3 $46.8 $37.4 $25.6 $23.9 $ 21.1 $ 21.3
Coal 667.7 657.5 789.8 30.6 25.0 26.9 38.3 39.5 37.3
Lead 159.8 154.6 445.7 8.7 5.1 3.8 10.1 22.9 29.0
Corporate 358.9 621.9 225.5 0.2 0.3 3.7 1.7 1.7
Continuing Operations 2,073.3 2,054.4 2,043.3 86.3 67.5 56.6 76.0 85.2 89.3
Discontinued Operations 6.8 522.1 32.3 35.0 39.2 40.0
$2,073.3 $2,061.2 $2,565.4 $86.3 $99.8 $91.6 $76.0 $124.4 $129.3
Revenues Operating Profit (Loss) Identifiable Assets
$ in millions 1988 1987 1986 1988 1987 1986 1988 1987 1986
Operations by Geographic Area United States $4,444.6 $3,461.9 $3,756.0 $120.1 $(29.0) $148.7) $1,862.1 $1,830.7 $2,062.2
Canada 257.9 220.1 79.0 2.2 1.8 3.2 53.9 61.9 31.5
Middle East 55.1 70.7 91.6 (0.6) (1.6) 0.3 49.2 39.9 59.6
Europe 296.6 99.2 304.9 7.3 (0.11 0.9 74.6 89.5 73.8
Other 78.3 72.6 110.2 1.2 2.2 14.2) 33.5 39.2 338.3
$5,132.5 $3,924.5 $4,341.7 $130.2 $(26.7) $(48.5) $2,073.3 $2,061.2 $2,565.4
The following table reconciles business segment operating profit (loss) with the earnings (loss) from continuing operations before income taxes: $ in millions/Year ended October 31,
Operating profit (loss) from continuing operations
Interest, net
Equity in loss of SOS
Gain on sale of Irvine facility and St. Joe Gold common stock
Provision for future losses on facility subleases and certain investments
Corporate administrative and general expense
Other items, net
Earnings (loss) from continuing operations before income taxes
1988
$130.2
9.8
(9.5)
-(32.8)
(6.8)
$ 90.9
1987
$ (26.7)
(40.1)
(36.8)
(24.1)
1.6
$(126.1)
1986
$148.51
(39.8)
61.9
(32.5)
3.9
$(55.0)
Quarterly Financial Data
unaudited
The following is a summary of the quarterly results of operations: First Second Third Fourth
$ in thousands, except per share amounts Quarter Quarter Quarter Quarter
1988
Revenues from continuing operations $1,039,320 $1,148,466 $1,339,106 $1,605,565 Gross margin 18,875 21,899 30,442 52,124 Earnings before income taxes 16,264 15,654 23,144 35,83340 Net earnings 9,016 10,302 13,444 23,633 Earnings per share $ .11 $ .13 $ .17 $ $ .30
First Second Third Fourth $ in thousands, except per share amounts Quarter Quarter Quarter Quarter
1987
Revenues from continuing operations $ 903,158 $ 898,563$ $ 909,235 $1,213,524 Gross margin (loss) (6,175) (19,913) (5,144) 6,198
Loss from continuing operations before
income taxes (23,384) 136,8241 (21,841) (44,034)
Earnings (loss) from continuing operations 128,5641 (42,944) (27,941) 24,174M
Earnings (loss) from discontinued operations:
Operations (4,754)- (9,681) - (4,981) - 2,872
Disposal
- - 111,254
Extraordinary item -. 7,157
Net earnings (loss) (33,318) (52,625) (32,922) 145,457
Earnings (loss) per share ,
Continuing operations (.36) (.54) (.35) .30
Discontinued operations (.06) 1.12) (.07) 1.43
Extraordinary item - - - .09
Net earnings (loss) $ (.42) $ (.66) $$ (.42) $ 1.82$
la1Fourth quarter 1988 results include $7 million related to a favorable settlement with the United Mine Workers.
mFourth quarter 1987 results include an income tax benefit of $52 million related to cumulative year-to-date operating losses
which was recognized in the fourth quarter due to the gain on disposal of discontinued operations.
44 45

Fluor Directors
David S. Tappan, Jr. Chairman of the Board and Chief Executive Officer (1965)
Caroline L. Ahmanson Chairman Emeritus, Federal Reserve
Bank of San Francisco-12th District
(19851
Hugh K. Coble Group President, Operations, Fluor Daniel, Inc. (1984)
Peter J. Fluor President of Texas Crude, Inc. (1984)
David R Gardner President, University of California
(1988)
Gerald M. Glenn Group President, Marketing and Sales, Fluor Daniel, Inc. (1989)
William R. Grant Chairman of the Board of New York Life International
Investment Inc. (1982)
Robert L. Guyett Senior Vice President and
Chief Financial Officer (1987)
Bobby R. Inman Chairman and CEO of Westmark
Systems, Inc., Admiral U.S. Navy (Retired) (1985)
Vincent L. Kontny President and CEO, Fluor Daniel, Inc.
(1988)
Robert V. Lindsay Chairman, The International Council,
Morgan Guaranty Trust Company of
New York (1982)
E. Morgan Massey President, A.T. Massey Coal
Company. Inc. (1987)
Leslie G. McCraw President (1984)
Buck Mickel Retired, former Vice Chairman of the Board (1977)
Allen E. Puckett Chairman Emeritus of Hughes Aircraft Company (1987)
Louis H. Wilson General, U.S. Marine Corps (Retired)
and former Commandant of the Marine Corps (1979)
Executive Committee
David S. Tappan, Jr., Chairman
Hugh K. Coble
Gerald M. Glenn
Robert L. Guyett
Vincent L. Kontny E. Morgan Massey Leslie G. McCraw P Joseph Trimble (ex officio)
Audit Committee
William R. Grant, Chairman
Peter J. Fluor
David P Gardner
Bobby R. Inman
Louis H. Wilson
Nominating Committee
David S. Tappan, Jr., Chairman
Peter J. Fluor
William R. Grant
Bobby R. Inman
Robert V Lindsay Louis H. Wilson
Organization and Compensation Committee
Louis H. Wilson, Chairman
Caroline L. Ahmanson
William R. Grant
Robert V Lindsay Allen E. Puckett
Officers
Executive Corporate Officers
David S. Tappan, Jr. Chairman of the Board and
Chief Executive Officer (1952)
Leslie G. McCraw President (1975)
Robert L. Guyett Senior Vice President and
Chief Financial Officer (1987)
P. Joseph Trimble Senior Vice President-Law (1972)
Nad A. Peterson Senior Vice President and
Secretary (1967)
Corporate Officers
Charles J. Bradley Vice President-Human Resources and
Administration (1958)
Lawrence N. Fisher Vice President-Corporate Law (1974)
J. Robert Fluor ll Vice President-Corporate Relations
(1967)
William M. Hofacre Vice President-Financial Planning &
Analysis (19841
Larry W. Lineberger Vice President and Controller (1971)
Richard D. Paul Vice President-Financial and
Operational Evaluation (1968)
James O. Rollans Vice President-Corporate
Communications (1982)
William D. Trammell Vice President-Project Finance
(1968)
Fluor Daniel Executive Officers
Vincent L. Kontny President and CEO, Fluor Daniel, Inc.
(1965)
Hugh K. Coble Group President, Operations (1966)
Gerald M. Glenn Group President, Marketing and Sales (1964)
Key Fluor Daniel Operating/ Marketing Executives
Industrial Sector
James C. Stein President (19641
Richard M. Teater Vice President-Marketing (1980)
Process Sector
Paul J. Varello President 11972)
Steven G. Tappan Vice President-Marketing (1977)
Power Sector
Peter S. Van Nort President (19801
Michael J. Epprecht Vice President-Marketing (1979)
Hydrocarbon Sector
Charles R. Oliver President (1970)
Dennis G. Bernhart Vice President-Marketing (1968)
Government Sector
Emil J. Parente President (1978)
Thomas P. Merrick Vice President-Marketing (1984)
Operations Centers
Larry M. Hart President (1967)
International
Charles R. Cox President 119691
Charles P. Pringle Vice President-Marketing (1970)
Asia ,Pacific
James E. Barry President (19761
Richard D. Carano Vice President-Marketing (1970)
Canada
A.B. McArthur President (1975)
Frank J. Vanginhoven Vice President-Marketing 11976)
Europe 'Africa / Middle East
Richard W. Dean President (1967)
Henry C. Van Dyke Vice President-Marketing (1974)
Venture Group
John D. Simpson President 119831
Other Key Operating/Staff Executives
A.T. Massey Coal Company, Inc.
E. Morgan Massey President (1947)
Fluor Constructors International, Inc.
Richard A. Flinton President (1960)
Government Relations
Betty L. Hudson Vice President (1974)
Principal Subsidiaries and Divisions
Engineering and Construction
Fluor Daniel, Inc.
Industrial Sector, Greenville, South
Carolina
Process Sector, Greenville, South
Carolina
Power Sector, Greenville, South
Carolina
Hydrocarbon Sector, Irvine. California
Government Sector, Irvine, California
U.S. Operations Centers Chicago
Greenville Houston
Irvine
Philadelphia
International Operations
Daniel International (Saudi Arabia)
Ltd., Jeddah, Saudi Arabia
Fluor Arabia Limited, Al-Khobar,
Saudi Arabia
Fluor Daniel Australia Limited,
Melbourne, Victoria. Australia
Fluor Daniel Canada. Inc., Calgary,
Alberta, Canada
Wright Engineers Limited, Vancou
ver, British Columbia, Canada
Fluor Daniel B.V, Haarlem, The
Netherlands
Fluor Daniel GmbH, Dusseldorf,
West Germany Fluor Daniel Limited, London,
England
SOS International, South San Francisco,
California
Daniel International Corporation, Greenville, South Carolina
Fluor Constructors International, Inc., Irvine, California
Natural Resource Investments
A.T. Massey Coal Company, Inc
Richmond, Virginia
The Doe Run Company, St. Louis,
Missouri
Years in parentheses indicate the year each director was elected to the Board. Except as otherwise indicated, all offices are of the company.
46 47
Years in parentheses indicate the year each officer or executive joined the company. Except as otherwise indicated, all offices are of the company.

- Fluor Stockholders' Reference Common Stock and Dividend Information
The following table sets forth for the periods indicated the cash dividends paid per share of common stock and the high and low sales prices of such common stock
as reported in the Consolidated Transactions Reporting System.
Form 10-K
A copy of the Form 10-K, which is
filed with the Securities and Exchange Commission is available upon request.
Write to: Vice President and Controller, Fluor Corporation. 3333 Michelson Drive, Irvine, California 92730,1714) 975-2000.
Registrar and Transfer Agent
Security Pacific National Bank, Corpo
rate Services Division, 333 South
Beaudry Avenue, 24th Floor, Los An
geles, California 90017, and Security
Pacific National Trust Company,
2 Rector Street, 9th Floor, New York,
New York 10006. For change of
address, lost dividends, or lost stock
certificates, write or telephone: Security Pacific National Bank, Stock
Transfer Division, Box 3546,
Terminal Annex, Los Angeles,
California 90051, Attn: Shareholder Relations (8001 423-5041.
Independent Public Accountants
Arthur Young & Company, 3200 Park
Center Drive, Costa Mesa, California 92626
Annual Stockholders' Meeting
Annual report and proxy statement are mailed about February 1. Fluor's
annual meeting of stockholders will
be held at 9:00 a.m. on March 14, 1989 at the Meridien Hotel, 4500 MacArthur Boulevard, Newport Beach, California 92660.
Company Contacts
Stockholders may call collect. Stockholder information: Lawrence N. Fisher
1714) 975-6961
Investor Relations:
Lila J. Churney
(714) 975-3909
Fiscal 1988 First Quarter
Second Quarter
Third Quarter
Fourth Quarter
Fiscal 1987 First Quarter
Second Quarter
Third Quarter
Fourth Quarter
Dividends
Per Share
$ -
0.02
$0.02
$0.10
$0.10
Common Stock Information
At December 31, 1988 there were 79,134,524 shares outstanding and
approximately 23,200 stockholders of
record of Fluor's common stock.
Stock Trading
Fluor's stock is traded on the New York, Midwest, Pacific, Amsterdam,
London and Swiss Stock Exchanges.
Common stock domestic trading symbol: FLR.
Price Range
High Low
$1511/4 $111/8
19% 123/4
231/4 173/8
231/4 191/2
$141/4 $11% 161/4 12% 201/4 141/4
21'.1/4 11
Common Stock History Since Going Public in 1950
08/23/57 12/15/61 03/11/63 03/09/64 03/08/65 02/14/66 03/24/66 03/27/67 02/09/68 03/22/68 05 /16 /69
03/06/70 03/05/71 03/10/72 03/12/73 03/11/74 08/13/79 07/18/80
20% Stock Dividend 5% Stock Dividend 5% Stock Dividend 5% Stock Dividend 5% Stock Dividend 5% Stock Dividend
2 for 1 Stock Split1
5% Stock Dividend 5% Stock Dividend
2 for 1 Stock Split1
5% Stock Dividend 5% Stock Dividend 5% Stock Dividend
5% Stock Dividend 5% Stock Dividend
3 for 2 Stock Split 3 for 2 Stock Split 2 for 1 Stock Split
1
48

-