1998 disclosure of environmental issues in the annual ......library: [email protected]...
TRANSCRIPT
University of WollongongResearch Online
University of Wollongong Thesis Collection University of Wollongong Thesis Collections
1998
Disclosure of environmental issues in the annualreports of Australian multi-national corporationsoperating in Papua New Guinea: a legitimacytheory approachSilas Kavale UmaropiUniversity of Wollongong
Research Online is the open access institutional repository for theUniversity of Wollongong. For further information contact the UOWLibrary: [email protected]
Recommended CitationUmaropi, Silas Kavale, Disclosure of environmental issues in the annual reports of Australian multi-national corporations operating inPapua New Guinea: a legitimacy theory approach, Master of Commerce (Hons.) thesis, Department of Accounting and Finance,University of Wollongong, 1998. http://ro.uow.edu.au/theses/2279
DISCLOSURE OF ENVIRONMENTAL ISSUES IN THE ANNUAL REPORTS OF AUSTRALIAN MULTI-NATIONAL CORPORATIONS OPERATING IN PAPUA NEW GUINEA: A
LEGITIMACY THEORY APPROACH.
A thesis submitted in fulfilment of the requirements for the award of the degree of
MASTER OF COMMERCE (HONOURS)
from
UNIVERSITY OF WOLLONGONG
by
SILAS KA VALE UMAROPI
B. Ed (Pacific Adventist University - Papua New Guinea) B. Bus (University of Southern Queensland) M. Com (University ofWollongong)
DEPARTMENT OF ACCOUNTING & FINANCE
1998

ii
I, SILAS KA VALE UMAROPI, certify that this thesis has not been submitted previously as part of the requirements of another degree and that it is the product of my own work.
Signed: _____ _ Silas K . Umaropi
Ill
Acknowledgments
The whole study will not have eventuated without AusAid providing financial
assistance. Therefore I acknowledge with gratitude, AusAid sponsorship .
I wish to extend my sincere thanks to people who contributed in completing this thesis.
My sincere thanks to my supervisor, Associate Professor Michael McCrae for his
guidance, patience, direction and suggestions in the research and the writing of this
thesis. A number of other people have been very helpful from the F acuity of
Commerce: Justin Norris, Maureen Tadd and Ang Ang. Two others helped in the
compiling stage: Joan Phillips for editing and Lalen Simeon for collating this thesis.
Without the Australian companies' providing their annual reports, this study would not
have been possible. Therefore, I wish to thank the appropriate officers of the companies
named in this thesis who consented to, and willingly tendered, their annual reports for
analysis.
Finally, friends from the Wollongong Adventist church and PNG friends (Fitinas, Olis,
Simeons & Opas) who supported and encouraged me along the way. Last, but not the
least is my parents, wife, Mary and children (Lloyd, Lorraine, Tomasi and Brian) who
saw little of dad but were praying, patient, cooperative, supportive and provided much
needed words of encouragement during his trying days. Special thanks to the children
who saw little of dad and had to be content with mum performing dual roles.
IV
Abstract
Since the Ok Tedi lawsuit in 1994 highlighted the environmental degradation issue,
Multinational Corporations (MNCs) operating in Papua New Guniea (PNG) have come
under scrutiny for causing environmental degradation. This scrutiny created animosity
between resource owners and the developers (MNCs), to such an extent that the bitterness
created anxiety about their future among the MN Cs. Various attempts have been made in
PNG to minimise the adverse impacts caused by the MNC operations, however,
environmental degradation continues to be adverse. The PNG government will not arbitrate
in this issue because of its conflict of interests.
The problem of environmental degradation caused by MNCs needs to be exposed to
minimise the adverse impacts. Environmental disclosure to external interested parties is a
possible source of exposure which has not been explored. This is because environmental
accounting is a 'green' area which many countries are just beginning to incorporate and
enforce in their legislation. In addition, there is no law to enforce environmental reporting. It
is currently provided voluntarily (Deegan, 1996). This study investigates the possibility of
engaging environmental disclosure to address the environmental issue in PNG.
The focus in this study is on Australian MNCs because their annual reports are accessible
and Australian MNCs dominate PNG economy. The study seeks to establish whether
Australian MNC in environmentally sensitive industries, currently provide adequate
environmental reports within their financial statements. The disclosure requirement is based
on the Legitimacy theory because the MNCs operate under a social contract with societies

v
and are therefore obliged to legitimise both their presence and their activities. To achieve this
goal, MNCs need to provide environmental reports within their financial statements. MNCs
currently lodge environmental impact plans with every proposal. Despite this lodgement,
environmental degradation persists, therefore they ought to report on the implementation of
their environmental impact plans within their financial statements (Gray, 1990).
This study is patterned after Patten (1992) who studied oil companies following the Valdez
oil spill. Patten noted a sizeable increase in environmental reporting following the incident.
Similarly, a content analysis of the annual reports of Australian MNCs found that
environmental disclosure is higher among MNCs who operate in PNG than those which
only operate in Australia. Increases are noticeable after 1994 which indicates that the Ok
Tedi lawsuit influenced disclosure. It appears that MNCs will only increase their
environmental disclosure when coming under scrutiny.
It would be interesting and informative to analyse all MNCs in PNG because Australian
MNCs are not the only ones operating in the sensitive industries in PNG. Future studies may
undertake such an analysis. In order to maintain a constant surveillance on environmental
degradation, MNCs ought to continually provide environmental information with their annual
financial statements. When MNCs fully disclose their environmental degradation, it is
expected that ethical investors will be powerful enough to exert pressure on MNCs to be
more sustainable in their operations and minimise environmental degradation.
VI
Table of Content
Content
Acknowledgments
Abstract
Table of Content
List of Abbreviations
List of Tables
List of Figures
Chapter 1. Introduction
1.1 Statement of Issue
1.2 Purpose of the Study
1.2.1 Theoretical Framework of this thesis
1.2.2 The Empirical Investigation
1. 3 Contribution of this Study
1.4 Structure of the thesis
Chapter 2. The Role of Multinational Corporations in Papua New Guinea
2. I Introduction
2.2 The Multinational Corporations (MNCs)
2.3 Benefit of Multinational Corporations
2.3 .1 Accessing ofMNCs into PNG
2.3.2 Benefits derived from MNCs
2. 3 .2 .1 Export Revenue
2.3.2.2 Employment
2.3 .2 .3 Economic Growth
2.3.2.4 Debt Servicing
2.3.2.5 Transfer of Technology
2. 3. 3 Ranking of Benefits
2.3.3 .1 PNG's Poor Rating
2.3.3.2 Servicing Accumulated Debt
2 .3.3.3 Export Earnings
2 .3.3.4 Transfer of Technology and Training
Page No:
Ill
IV
VI
XI
XIV
xvn
1
1
5
6
8
10
13
16
16
21
28
28
33
33
35
38
41
43
45
46
46
47
48
vii
2.3.3 .5 Employment
2.4 Adverse Environment Impacts-Inevitable Self Destruction
2.4.1 Environmental Degradation
2.4.1.1 Nicaragun Forest Case
2.4.1.2 Philippine Case
2.4.2 Environmental Degradation caused by MNCs in PNG
and its significance
2.4.2.1 Forestry Industry
2.4.2.2 Mining Industry
2.4.2.2.1 Ok Tedi River-Toxic for
Human and Aquatic life
2.4.2.2.2 Pogera Mine
2. 4. 2. 3 Manufacturing Industry
2 .4 .2.4 Oil and Gas
2.5 Summary
Chapter 3. Environmental Disclosure
3 . 1 Introduction
3 .2 Environmental Management and Reporting
3 .2 . l Environmental Management and Accounting
3 .2.2 Conflicts over Social Disclosure
3 . 2. 3 Environmental Policies, Adoption,
Implementation and monitoring
3.2.4 Hindrance to Environmental Disclosure
3 . 3 Global Developments of Environmental Reporting
3 . 3 .1 Challenges of Environmental Reporting
3 .3 . 2 Where to Report
3. 3 . 3 Separate Reporting
3 .3.4 Factors Contributing to the Surge in Social Accounting
3. 4 Developments in US, UK, and Canada
3 . 4 .1 Survey of Current Reporting
3.4.2 Quality of Environmental Reporting
3.4.3 Benefits of Environmental Disclosure
3 .4. 4 Quality of Disclosure
49
50
51
52
53
54
55
57
59
61
64
66
67
68
68
72
72
74
76
81
82
83
85
86
89
91
92
94
95
97

viii
3.5 Development in Australia 100
3 .5 .1 Current Australian Reporting 10 I
3.5.2 Environmental Management System and reporting 102
3.5.3 Timely Developments 105
3.6 Applications of Environmental Accounting in PNG 107
3.6.1 Problems associated with Environmental Disclosure Legislation 108
3.6.2 Ethical Investors 109
3.6.3 Approach I. Eco-audit 112
3.6.4 Approach 2. Award System 118
3. 7 Summary 120
Chapter 4. Theoretical Support 123
4 .1 Introduction 123
4 .2 Classification of Major Theories 125
4.2.1 Functionalist Paradigm 126
4.2.2 Radical Paradigm 127
4.2.3 Interpretive Paradigm 128
4.2.3.1 Accounting Theory 128
4.2.3.2 Decision Usefulness Theory 131
4.2.3.3 Social Contracting Theory 133
4.2.3.4 Legitimacy Theory 135
4.3 Lack of Agreed Theory Theoretical Respective 144
4.3.1 Proposed Theoretical Framework 145
4.3.2 Basis for Legistimacy Theoretical Selection 146
4.3 .3 Enforcement of Environmental Disclosure 148
4.3.4 Limitations of a Theory to Minimise Adverse Environment Impacts 149
4.4 Summary 150
Chapter 5. Research & Data Collection 153
5 . 1 Introduction 15 3
5. 2 Population of Interest 15 7
5.2.1 Group I - Australian MNCs that operate PNG 160
5.2.2 Group 2 - Australian MNCs that do not operate in PNG 162

ix
5.3 Sampling issues
5 .3 .1 Definitions and Reasons for Sampling
5. 3. 2 Advantages of Sampling
5. 3. 3 Problems (Disadvantages) of sampling
5.3 .4 Reliability and Validity
5 .3 .5 Methods of Sampling Used
5.3.6 Sample ofMNCs
5.4 Data Collection
5. 4 . 1 Period of Study
5. 4 . 2 Contacts for Annual Reports
5.5 Method of Analysis-Content Analysis
5. 5. 1 Classical or Theory Oriented
5.5.2 Units of Analysis
5 .5 .3 Potential of Content Analysis
5 .5 .4 Wide Application
5.5 .5 Benefits & Shortcomings
5.5.6 Application to this Study
5.6 Pilot Study-Instruments of Analysis
5.6.1 Data of Pilot Study
5. 6. 2 Features of Environmental Disclosure
5. 6 . 3 Location of Attributes in Annual Reports
5.6.4 Attribute Analysis
5.6.5 Assertion Analysis
5. 6 . 6 Semantic Analysis
5.7 Summary
Chapter 6. Data Analysis, Results & Discussions
6. l Introduction
6.2 Sample Multinational Corporations
6.2 .1 Sample Response and Number of Annual Reports
6.2 .2 Size of Sample MNCs
6.2.3 Industry
6.2.4 Other Characteristics ofMNCs
6.3 Descriptive Results of the Study
163
164
165
165
166
167
169
170
171
172
176
178
179
184
185
187
188
190
191
191
194
198
207
210
213
216
216
221
221
221
228
229
231

x
6.3 .1 Amount and Pattern of Environmental Disclosure 233
6. 3 .2 Influential Factors for Environmental Disclosure 23 7
6.3 .2.1 Industry and Nature of Operations Influential Disclosure 238
6.3 .2.2 Size Influences Disclosure 241
6.3.2.3 Other Influential Factor 245
6.3.3 Disclosure of Environmental Issues 248
6.3.4 Quantity and Pattern of Environmental Disclosure: PNG v Australia 254
6.4 Hypotheses Testing 258
6. 4. 1 Hypothesis one 261
6.4.2 Hypothesis two 273
6.5 Summary 277
Chapter 7. Summary, Conclusions & Recommendations 281
7. l Introduction 281
7.2 Overview of the Study 282
7 .3 Results of the Analysis and the Hypotheses Testing 287
7.4 Implications 292
7 .5 Conclusions, Suggestions and Limitations 296
Bibliography 302
Appendix - Tables 324

ACF
ACIA
AAS
AASB
AEPA
AICA
AIDAB
ANI
ANZOG
Aus Aid
BAC
BEA
BHP
BPNG
CED
CERES
CICA
CRA
csc CSD
CSIRO
DEC
EATF
EIA
EIRIS
EMAS
EMS
EP
EPA
EQD
XI
List of Abbreviations
Australian Conservation Foundation
Australian Chemical Industry Council
Australian Accounting Standards
Australian Accounting Standards Board
Australian Environment Protection Authority
Australian Institute of Chartered Accountants
Australian International Development and Assistance Bureau
Australian National Industries
Australia, New Zealand Oil & Gas
Australian Aid
Business Advisory Committee
Bureau of Economic Analysis
Broken Hill Proprietary Limited
Bank of Papua New Guinea
Commonwealth Economic Development
Coalition for Environmentally Friendly Economics
Canadian Institute of Chartered Accountants
Conzinc Riotinto Australia Limited
Canadian Security Commission
Corporate Social Disclosure
Commonwealth Scientific and Industrial Research Organisation
Department of Environment and Conservation
Environmental Accounting Task Force
Environment Impact Assessment
Energy Information Resources Inventory Statistics
Environment Management and Audit Scheme
Environment Management System
Environment impact Plan
Environment Protection Authority
Extended Quantity Discussion
ESD
EU
FDI
GDP
GPFR
HDI
IACB
ICAEM
ICAE
ICAEW
ICC
ICME
IFAC
IPA
ISAR
ISO
MEF
MIM
MN Cs
NEC
NSDS
OCED
OTML
PJV
PNG
RGC
RTZ
SARA
SEC
SQD
SWOT
INC
UIG
UKASB
.. XII
Economic Sustainable Development
European Union
Foreign Direct Investment
Gross Domestic Products
General Purpose Financial System
Human Development Index
International Accounting Control Board
International Committee on Economic and Applied Microbiology
International Conference of Agriculture and Economics
Institute of Chartered Accountants in England and Wales
International Chamber of Commerce
International Council of Metal and Environment
International Federation of Accounting Commission
Investment Promotion Authority
International Standards of Accounting and Reporting
International Standards Organisation
Melanesian Environment Foundation
Mount Isa Mines Limited
Multinational Corporations
National Executive Council
National Sustainable Development Strategies
Organisation for Economic Co-operation and Development
Ok Tedi Mining Limited
Pogera Joint Venture
Papua New Guinea
Rensions Goldfields Consolidated Limited
Rio Tinto Zinc Corporations
Super Amendments and Reauthorisation Act
Security Economic Conunission
Short Quantity Disclosure
Strength, Weaknesses, Opportunities and Threats
Transnational Corporations
Urgent Issues Group
United Kingdom Accounting Standards Board

UN CED
UNCTAD
UNCTCD
UNCTC
UNCEP
UNFCCC
USEPA
xiii
United Nations Conference on Economic Development
United Nations Conference of Trade and Development
United Nations Department of Technical Co-operations and
Development
Centre for Transnational Corporations
United Nations Conference of Environment and Development
United Nations Framework Convention on Climatic Changes
United States Environment Protection Authority
xiv
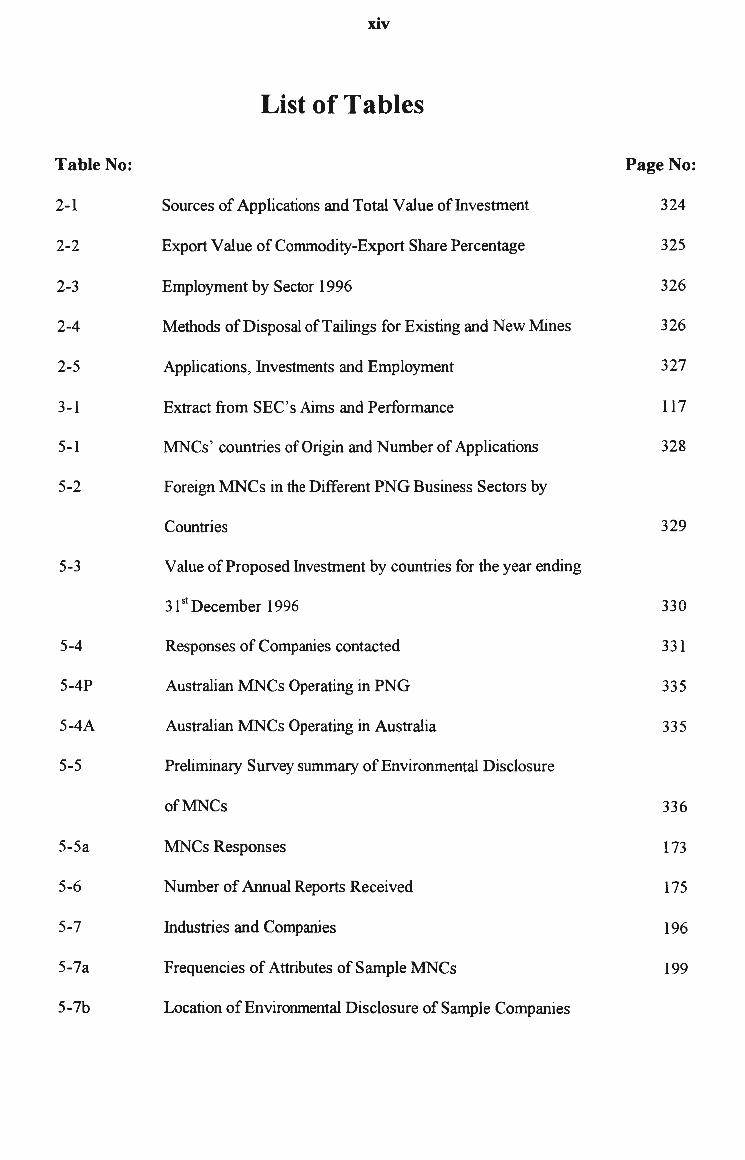
List of Tables
Table No: Page No:
2-1 Sources of Applications and Total Value of Investment 324
2-2 Export Value of Commodity-Export Share Percentage 325
2-3 Employment by Sector 1996 326
2-4 Methods of Disposal of Tailings for Existing and New Mines 326
2-5 Applications, Investments and Employment 327
3-1 Extract from SEC' s Aims and Performance 117
5-1 MNCs' countries of Origin and Number of Applications 328
5-2 Foreign MN Cs in the Different PNG Business Sectors by
Countries 329
5-3 Value of Proposed Investment by countries for the year ending
3 1st December 1996 330
5-4 Responses of Companies contacted 331
5-4P Australian MNCs Operating in PNG 335
5-4A Australian MNCs Operating in Australia 335
5-5 Preliminary Survey summary of Environmental Disclosure
of MN Cs 336
5-5a MNCs Responses 173
5-6 Number of Annual Reports Received 175
5-7 Industries and Companies 196
5-7a Frequencies of Attributes of Sample MN Cs 199
5-7b Location of Environmental Disclosure of Sample Companies

xv
in Pilot Study 209
5-7c Measurement of Disclosure of Sample Companies in the
Pilot Study 211
6-1 Disclosure by Size-Sales, Total Assets and Profitability 337
6-la MNC Size Measured in Sales, Assets and Profits 223
6-2a Sales Distribution among 72 Sample MNCs 225
6-2b Profit Distribution among Sample MNCs 226
6-2c Profit Distribution among Sample MNCs 227
6-3a Number ofMNCs Selected per Industry 229
6-4 Total Disclosure of Environmental Issues and all Sample
Annual Reports 236
6-5 Total Disclosure by Influential Factor-Industry 239
6-6 Total Disclosure by Influential Factor-Size 244
6-7 Environmental Issues and their Location in the Annual Reports 249
6-8 Location of Environmental Issues in the Annual Reports of
Samples 250
6-9 Total Disclosure of Environmental Issues by Sample MNCs 257
6-9a Changes in Disclosure over 1992-1996 in the Number of Pages 276
6-10 Total Environmental Disclosure Before and After Ok Tedi
Lawsuit 265
6-lOa Total Disclosure by MNCs in the Australian Group 267
6-lOb Total Disclosure by MNCs in the PNG Group 269
6-lOc Comparison of Averages Before and After MNCs that
operate in PNG 340

6-lOci
6-lOd
6-11
XVI
Comparison of Averages Before and After ~Cs that
operate in PNG
Average Disclosure by MNCs in the PNG Sample
Comparison of Positive (Good) News and Negative (Bad) News
270
275
342
xvii
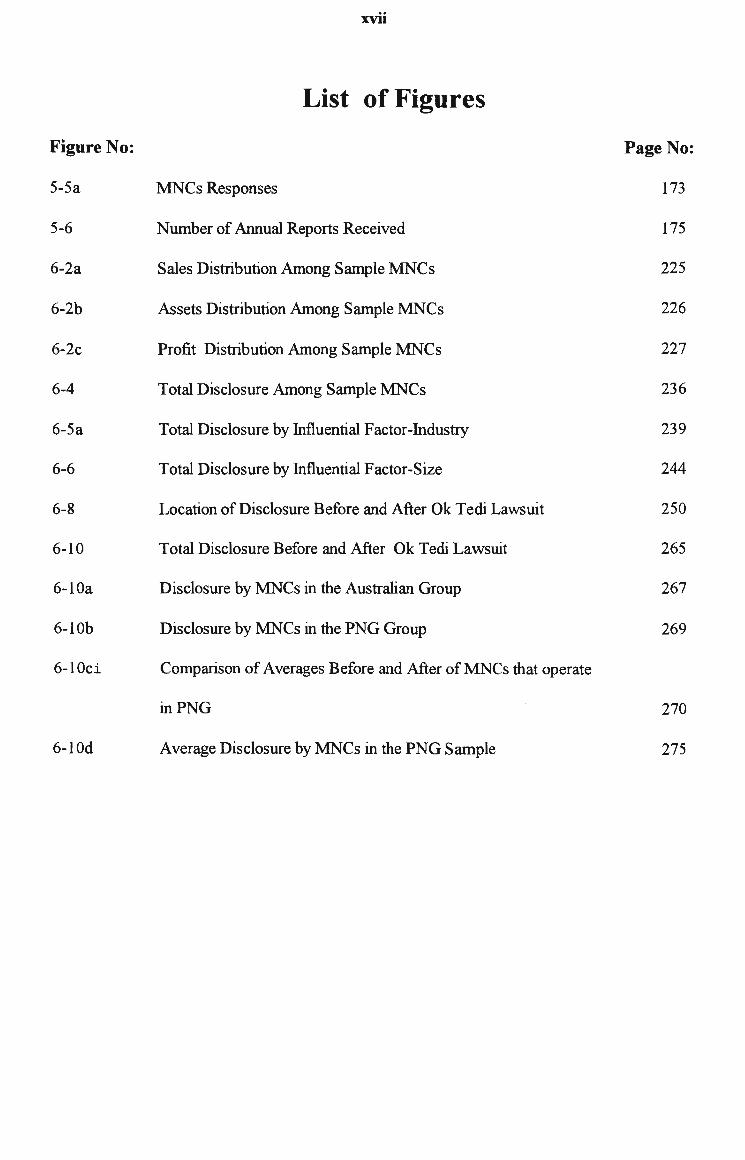
List of Figures
Figure No:
5-5a MNCs Responses
5-6 Number of Annual Reports Received
6-2a Sales Distribution Among Sample MNCs
6-2b Assets Distribution Among Sample MNCs
6-2c Profit Distribution Among Sample MNCs
6-4 Total Disclosure Among Sample MNCs
6-5a Total Disclosure by Influential Factor-Industry
6-6 Total Disclosure by Influential Factor-Size
6-8 Location of Disclosure Before and After Ok Tedi Lawsuit
6-10 Total Disclosure Before and After Ok Tedi Lawsuit
6-1 Oa Disclosure by MN Cs in the Australian Group
6-lOb Disclosure by MNCs in the PNG Group
6-IOci
6-lOd
Comparison of Averages Before and After ofMNCs that operate
inPNG
Average Disclosure by MNCs in the PNG Sample
Page No:
173
175
225
226
227
236
239
244
250
265
267
269
270
275

1
Chapter One
Introduction
1.0 Introduction
Papua New Guinea (PNG) has enjoyed unprecedented levels of economic benefits from
Multi-National Corporations (MNCs). On the other hand, the operations of the MNCs
have also caused widespread adverse environmental impacts. Several recent events have
highlighted the extent of this environmental degradation. The environmental crisis,
caused by mining on Bouganville, raises questions about foreign investments in PNG.
The recent $A3 billion lawsuit against Broken Hill Proprietary Limited (BHP) by the
people of the Western Province of PNG and the deportation of their Melbourne based
lawyer, has focused Australian attention on the problems involved. The extent and
pervasiveness of environmental degradation has resulted in conflicting views on foreign
investments in the country. According to Dunning (1981 ), MNCs are the main channel
for foreign investment in PNG, and as such, are essential for PNG's economic
development. However, objections to their presence are growing, especially after the
experience of the Bouganville crisis.
1.1 Statement of Issue
Environmental issues in PNG connected with MNC operations, became the centre of
focus with the Ok Tedi lawsuit in 1994. However, the issues began much earlier in

2
Bouganville before the Ok Tedi area litigation began. The crisis on Bouganville is alleged
to be caused by environmental degradation from the Paguna mine dumping wastes into
the Kawerong and Jaba rivers. Before its closure, the Paguna mine was dumping 600
million tonnes of waste into the rivers which caused extensive damage to the area
(Young, 1992). The affected villagers, as well as disgruntled landowners, confronted the
mine developer Conzinc Riotinto Australia Limited (CRA). This led to its eventual
closure.
Eaton (1986), traces environmental degradation in the Ok Tedi area as far back as 1984,
when a barge, carrying a shipment of 2700 drums of sodium cyanide up the Fly river,
capsized and sank. This sodium cyanide contaminated the Fly river and affected the
4200 villagers who relied on the river for sustenance. The affected villagers were given
food by the provincial government at the cost of $A417,000 until their source of
sustenance was declared safe. When the Ok Tedi mine started operating, 80 000 tonnes
of tailing were dumped daily into the Fly River. Over the years the mine has been
operating, heavy metal contamination has resulted in the first 70 kms of the river being
virtually 'dead ' (Rosenabum, 1996).
Despite the environmental issues, exposed by the Ok Tedi lawsuit, PNG continues to
experience environmental degradation. A recent report on the Pogera mine' s impact is
just as disturbing. Kennedy (1996), reports that Pogera' s mine waste is dumped into the
Strickland river. Consequently, the levels of zinc, lead and mercury at various sites down
the river are 3 to 3000 times that permitted in Australia. This is despite the project being
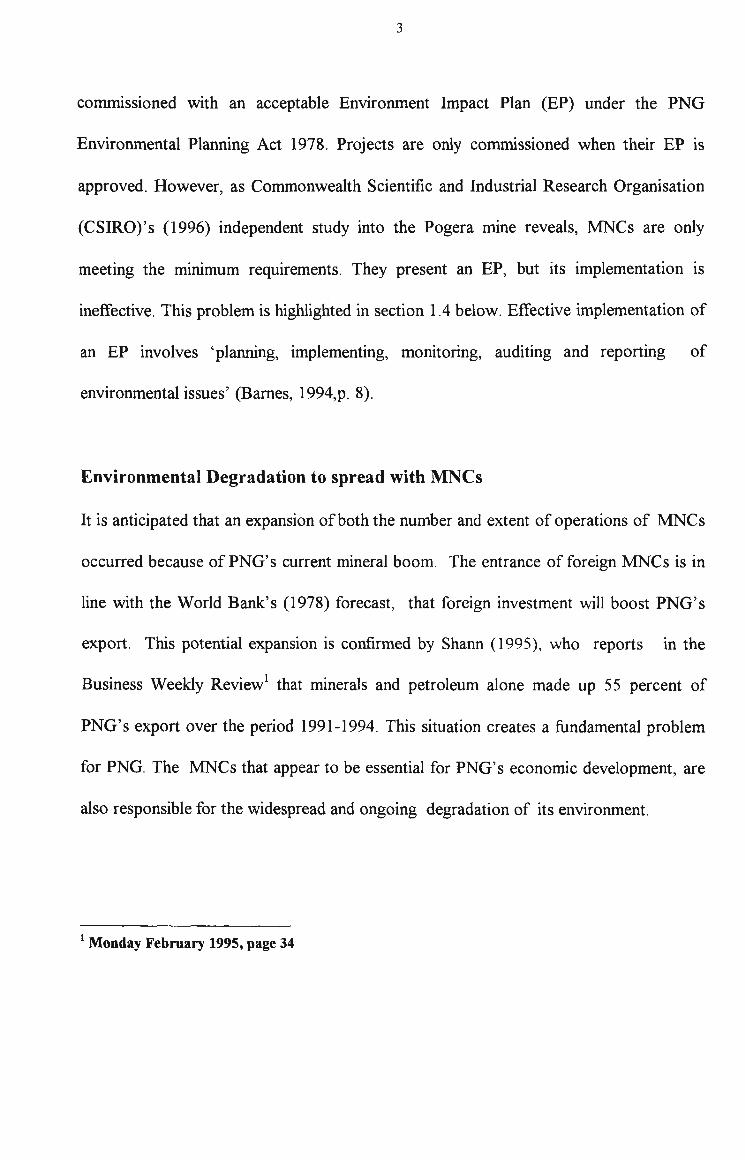
3
commissioned with an acceptable Environment Impact Plan (EP) under the PNG
Environmental Planning Act 1978. Projects are only commissioned when their EP is
approved. However, as Commonwealth Scientific and Industrial Research Organisation
(CSIRO)'s (1996) independent study into the Pogera mine reveals, MNCs are only
meeting the minimum requirements. They present an EP, but its implementation is
ineffective. This problem is highlighted in section 1.4 below. Effective implementation of
an EP involves 'planning, implementing, monitoring, auditing and reporting of
environmental issues' (Barnes, 1994,p. 8).
Environmental Degradation to spread with MNCs
It is anticipated that an expansion of both the number and extent of operations of MNCs
occurred because of PNG' s current mineral boom. The entrance of foreign MN Cs is in
line with the World Bank's (1978) forecast, that foreign investment will boost PNG's
export. This potential expansion is confirmed by Shann (1995), who reports in the
Business Weekly Review1 that minerals and petroleum alone made up 55 percent of
PN G's export over the period 1991-1994. This situation creates a fundamental problem
for PNG. The MNCs that appear to be essential for PNG's economic development, are
also responsible for the widespread and ongoing degradation of its environment.
1 Monday February 1995, page 34

4
A fundamental problem for the PNG government and its society is to attract "MNCs but,
at the same time, monitor and reduce the adverse environmental impacts caused by their
operations. Australian International Development Assistance Bureau AIDAB' s (1990)
assessment of developing countries is that low income countries like PNG can grow
without straining their environment growth or lowering their environment standards to
attract .MNCs. However, the danger is that MNCs can bargain their way into low
income countries. Once inside the country, the host's 'lack of legal and technical
expertise as well as an inadequate political system allows MNCs to continue with
harmful environmental practices' (Tabor and Rosenbaum, 1994, p.3).
The problem is an urgent one. MacPherson ( 1996) advises PNG that the environmental
degradation issue needs to be addressed soon because the country is on the threshold of
a mineral boom. There is an urgency in this advice, especially, if what PNG is
experiencing is the fulfilment of Stanko and Zeller' s (1995) prediction. Their prediction
is that environmental degradation will spread as the MNCs expand their operations.
Although attempts to regulate MNC impacts are starting to appear, they are not very
effective at this stage (1994). The Department of Environment and Conservation (DEC)
currently attempts to enforce the EP requirement as a prerequisite for every proposal and
expects the MNCs to implement them. Since PNG still experiences environmental
degradation after the MNCs lodge their EPs, the lodgement of the EP alone is
insufficient. Furthermore, lack of resources prevents the DEC from effectively policing
it. The DEC is only allocated a budget of K4. 93 million with K53 l, 200 for monitoring
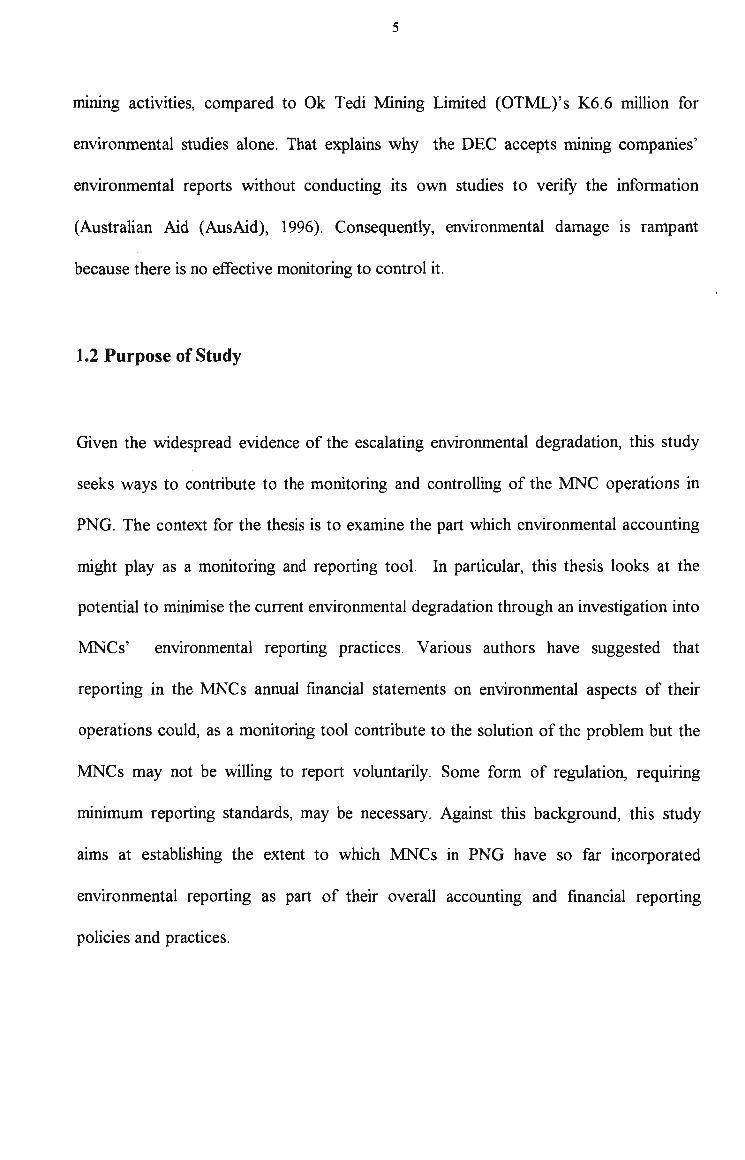
5
mmmg activities, compared to Ok Tedi Mining Limited (OTML)'s K6.6 million for
environmental studies alone. That explains why the DEC accepts mining companies'
environmental reports without conducting its own studies to verify the information
(Australian Aid (AusAid), 1996). Consequently, environmental damage is rampant
because there is no effective monitoring to control it.
1.2 Purpose of Study
Given the widespread evidence of the escalating environmental degradation, this study
seeks ways to contribute to the monitoring and controlling of the MNC operations in
PNG. The context for the thesis is to examine the part which environmental accounting
might play as a monitoring and reporting tool. In particular, this thesis looks at the
potential to minimise the current environmental degradation through an investigation into
MNCs' environmental reporting practices. Various authors have suggested that
reporting in the MNCs annual financial statements on environmental aspects of their
operations could, as a monitoring tool contribute to the solution of the problem but the
MNCs may not be willing to report voluntarily. Some form of regulation, requiring
minimum reporting standards, may be necessary. Against this background, this study
aims at establishing the extent to which MNCs in PNG have so far incorporated
environmental reporting as part of their overall accounting and financial reporting
policies and practices.

6
The specific objectives of this study are (i) to investigate and establish the current
pattern, extent and the degree of environmental disclosure of the MNCs operating in
PNG and (ii) to establish whether critical events, likely to adversely impact on the public
image of ~Cs, are associated with changes in disclosure practices. This research is
built on the premise that adequate disclosure will assist to expose the MNCs' detrimental
activities and that accounting has the potential to address it with environmental
disclosure requirements. The focus is on the environmental accounting practices of the
MNCs, as reflected by their environmental disclosure within their annual reports, and on
the potential of critical events which may adversely impact upon the companies images
to change those reporting practices (Gray et al, 1993).
In Australia, the timing for such a study is appropriate, because the Australian Institute
of Chartered Accountants (AICA, 1998) has noted an increase in public demand for
environmental information and is developing a conceptual framework with guidelines to
assist its members with incorporating environment issues into their accounting records.
These guidelines may further assist/require accountants in MNCs to provide
environmental information for their stockholders.
· 1.2.1 Theoretical Framework of this Thesis
The planned investigation in this study is supported by a framework of Legitimacy
Theory. This theory is particularly appropriate to study the role of critical events in
influencing environmental disclosure by ~Cs, since it suggests that companies will
7
increase their environmental disclosure to legitimate both their existence and their
operations, when confronted by a threat whether perceived or real (Lindblom, 1994).
Previously, legitimacy was only considered in terms of economic performance. As long
as the company was making a profit, all was well. However, as the community' s
understanding of environmental issues increases, its questions are more penetrating,
which forces MNCs to legitimise every move. Every MNC operates under a social
contract with the local community. Whenever a discrepancy of interests emerges, a gap
is created between the two parties concerned. Unless something is done soon, the gap
will widen (Socker & Sethi, 1974) and will result in further confrontation.
With the support of Legitimacy theory, an analysis is conducted on annual reports of
MNCs operating in PNG and Australia to determine the current extent, degree and
pattern of environmental disclosure by MNCs. The analysis covers a five year period
from 1992-1996. The period ( 1992-1996) is selected for study because it encompasses
the critical event of the Ok Tedi lawsuit (1994) . Encompassing the critical event is vital
because the analysis will establish whether the critical event, which is environmentally
related, has any impact on the environmental disclosures of MNCs which operate in
PNG. The Legitimacy theory suggests that such a critical event will pose a threat to the
MNCs and should cause them to react by changing their pattern of operations and
extent of environmental disclosure, in order to minimise the potentially adverse effects
and therefore legitimise their operations.
8
1.2.2 The Empirical Investigation
Much of the environmental accounting literature suggests that the MNC's environmental
disclosure is inadequate (Gray et al, l 995a). This investigation examines the extent and
pattern of environmental disclosure by the MN Cs operating in PNG and the effect of the
critical event. Two propositions are presented as hypotheses for testing whether
environmental disclosure has increased as the result of the critical event and if it has,
whether the increase was pursued after the incident. These hypotheses are:-
Hi. There was no increase in environmental disclosure among Australian MNCs
operating in PNG as the result of the critical event.
H2. If environmental disclosure did increase, it was time and event specific
(Walden & Schwartz, 1997) and did not persist in the subsequent period.
The study is carried out by analysing the content of annual reports of Australian
MNCs operating in PNG for the period 1992-1996. Australian MNCs are isolated for
this analysis from other MNCs operating in PNG because:
1. they dominate in PNG industries,
2. their annual reports are easily accessible, and
3. two of their MNCs (CRA and BHP through the Ok Tedi Mining Limited (OT1\1L)
were involved in the conflicts over environmental issues which was the initial impetus
of this study.
One hundred and twenty Australian MNCs were sampled and contacted for their annual
reports ( 1992-1996). The process began in Australia with a random selection of annual

9
reports of Australian compames. These were sent to PNG for classification and
confirmation. However, these companies could not be traced back to their Holding
companies in Australia. So, MNCs in four sensitive industries, mining, forestry,
manufacturing and oil & gas were sampled instead, using the Australian annual reports
CD file using a double sampling process. Firstly, all Australian MNCs in the four
industries were selected. Secondly, companies were chosen if they operated over the full
period of 1992-1996 to accommodate the period surrounding the lawsuit.
A Content Analysis approach is used to analyse the sample annual reports. This
analytical approach is considered appropriate because inferences can be made to other
l'vlNCs operating in the same industries. If need be, it can be replicated (Krippendorff,
1980). This approach follows Patten' s (1992) pattern where the author investigated the
oil companies' extent of environmental disclosure after the Exxon' s Valdez oil spill in
1989. Walden and Schwartz (1997) also used the same approach to extend Patten's
study for subsequent years. Niskala and Pretes (1994), used the same approach when
they studied Finnish companies' willingness to disclose environmental information.
These three studies analysed reports to determine the quality and quantity of
environmental disclosure. In the same way as Pretes and Niskala, this study analyses
reports to determine the environmental information voluntarily disclosed. It also
investigates the volume of environmental disclosure, especially after the Ok Tedi lawsuit
as did Patten (1992) in the Valdez oil spill. The result for PNG was the same, an increase
in MNCs' environmental disclosures to legitimise their activities which persisted beyond
the critical event.

10
1.3 Contribution of this study
It is expected that this study will make two basic contributions towards environmental
degradation issues in PNG. The first, is a possible solution in addressing the environment
degradation issue. Although various attempts have been made in PNG to address
environmental degradation, the potential role of accounting/environmental disclosure has
not yet been investigated. Evidence of the PNG government ' s concern about
environmental degradation is illustrated by the strong steps it has taken to incorporate
long -term environmental perspective in its approach to national development. In 1991,
PNG's National Executive Council (NEC) endorsed a sustainable development approach
to resource development, and endorsed Agenda 21 at the United Nations Conference on
Environment and Development (UNCED) conference in 1992 when PNG signed the Rio
Declaration. This was followed by the enforcement of the United Nations Framework
Convention on Climatic Change (UNFCCC) in March 1994 in PNG of the UNFCCC,
and in April 1994 by the NEC's endorsement of a National Sustainable Development
Strategy (NSDS). A Steering Committee was created to coordinate the formulation of
the NSDS through a nationwide participatory process.
Evidence of PNG' s environmental commitments can also be found in the comprehensive
system oflaws dealing with natural resources management. PNG's resource management
laws, including its forestry and mining, are generally considered quite advanced
institutional and legislative frameworks. Effective implementation of these frameworks,
however, has proven to be a major hurdle to effective resource management, given a lack

11
of central policy making, coordinating, planning, and project implementation functions
(UNFCCC, 1994). Consequently, unsustainable resource usage with adverse
environmental impacts are being experienced.
This thesis examines the potential role of an accounting approach to environmental
reporting as a tool in the monitoring and regulatory process whereby MNCs must
effectively implement their EPs which includes environmental disclosure. The only other
empirical study on the possible role of environmental accounting to the problem of
environmental degradation in PNG is Bartelmus (1994) . This study emphasised the
interdependence between socioeconomic activities and environmental processes by
calling for an integrated approach for sustainable development. The use of 'Green
Accounting' with its limitations was only highlighted as a national policy strategy. This
thesis is among the first to address the environmental degradation issue (and sustainable
economic development) through an environmental accounting/disclosure approach.
This study is motivated by the possibility of using environmental reporting by Australian
companies on their PNG operations as a form of effectively implementing their EPs for a
sustainable economic development. There are a number of studies on environmental
disclosure for domestic operations by Australian companies, for instance, Guthrie and
Parker (1989, 1990); KMPG (1993, 1994); Coopers and Lybrand (1993); Deegan
(1996); Deegan and Gordon ( 1996); Deegan and Rankin (1996) and F ayers ( 1998), but
all these studies concentrate on disclosure by Australian companies on their Australian
operations where Environment Protection Authority legislation is enforced in every state.

12
As Tabor and Rosenbaum (1994) point out, many less developed countries face similar
problems associated with MNCs. These problems include poor labour conditions,
transfer pricing, corruption, restricted technology transfer and inadequate consumer and
environment protection. Therefore, this study may have applications for other
developing countries which may consider adopting a strategy requmng all foreign
MN Cs to disclose environmental reports to their shareholders in their country of origin.
The second contribution is towards establishing the potential role of critical events to
influence environmental disclosure among Australian companies since 1991 . There is
some evidence that such events may increase responsible disclosure, through their
potential to invoke legitimising reactions by the MN Cs. Deegan and Gordon ( 1996)
analysed Australian MNC annual reports on their Australian operations to see whether
environmental disclosure increased between 1983-1991. The authors used Content
analysis approach to analyse 100 annual reports of 25 out of the 197 selected
companies. These 25 companies were from the top 500 Australian companies by
market capitalisation. The authors found a general increase in disclosure between 1983-
1991 .
The present study investigates whether similar results hold for Australian MNCs
operating in PNG for the more recent period of 1992-1996. The MNC sample in this
study is also from the top 500 Australian companies by market capitalisation. The main
result is that environmental disclosure among Australian companies has also increased
over this period for their PNG operations. While the critical event appears to have at

13
least influenced this result, it may not be the sole factor in this trend since increased
disclosure continued 2 years after the critical event. Environmental disclosure is
expected to improve further when the AICA implements environmental accounting
guidelines based on the conceptual framework being formulated.
1.4 Structure of the thesis
The thesis is structured as follows. The next three chapters: 2, 3 & 4, present the
literature review. Chapter two reviews relevant literature on MNC operations in PNG to
establish whether MNCs in PNG degrade the environment. The review identifies the
MNCs, their operations and any adverse impact their operations have on the
environment. Unless this is established, there is no point in pursuing this line of
investigation any further .
Chapter three outlines a suggested accounting approach as a tool for addressing
environmental degradation established in the previous chapter. This chapter briefly traces
the development of environmental accounting globally through developed countries
whose MNCs operate in PNG. The discussion centres on the relevant application of
current development to this study' s context. While environmental accounting is still in
its infancy, its current development is that the demand for environment reporting is
exceeding supply. Therefore this study' s proposal for MN Cs to disclose environmental
information is timely.

14
Chapter four presents the literature review on the theoretical framework which supports
the propositions in this thesis. While there are several possible theories, legitimacy theory
is considered the most appropriate since this theory emphasises the notion that
companies operate under a societal contract. Whenever there is a threat, whether
genuine or perceived it creates a legitimacy gap between the society and the corporate
entities which the concerned threatened party has to rectify. The literature survey by
Gray et al (1995a) reveals that companies are under immense pressure to be responsible
for their actions. Legitimacy theory argues that companies legitimise their actions with
greater environmental disclosure when threatened.
Chapter five describes the empirical study used to investigate environmental disclosure
and the method used to obtain the data. A sample is drawn from Australian .MNCs which
have operated continuously between 1992-1996 in PNG. It outlines the sample selection
process, the pilot study, and the methods used to extract data on environmental
disclosure from the sampled annual reports. It also describes how the data is analysed to
obtain the results on the extent and pattern of disclosure and the influence of the critical
event on disclosure over time.
Chapter six contains the main analysis of the data. The method of analysis is based on
the format in Patten' s (1992); Niskala and Pretes (1994); and Deegan and Gordon' s
(1996) studies, in analysing annual reports. Their employment of Content Analysis is
also adopted to analyse the data. Attribute analysis is used to identify the different
aspects of environmental issues which are disclosed. The location of these disclosed
15
features within the annual reports is also treated as significant. Semantic analysis is then
used to determine the quantity and quality of disclosure.
Chapter seven presents a summary and the final conclusion of the study. It briefly
presents an overview of the study reiterating the study' s objectives, the theoretical
support, the analysis and the results. It then discusses their implications for the potential
role of environmental accounting as a tool for monitoring and controlling the
environmental impacts ofMNCs operating in PNG. The chapter ends by highlighting the
study' s implications for future research.

16
Chapter Two
The Role of Multinational Corporations in Papua New Guinea
2.1 Introduction
The basic purpose of this chapter is to examine whether MNCs cause any adverse
environmental impact in PNG. Adverse environmental impacts occur despite the
present requirement of an EP for every proposal to minimise impacts. The chapter will
identify and examine issues connected with adverse environmental impact in order to lay
the groundwork or context for this thesis. This study focuses on environmental
disclosure as a potential tool to address environmental impacts caused by MNC
activities. This chapter identifyies the senousness of the problem of adverse
environmental impact by MNCs and indicates that these adverse effects may more than
offset any economic benefits that PNG receives from allowing the MNCs to operate in
the country. If the situation is as serious as the literature on environmental degradation
and empirical studies show, then the disclosure of environmental impacts in the annual
reports ofMNCs becomes a very significant issue.
The objective of this study is to address adverse environmental impacts by MNCs
operating in PNG. These MNCs are invited, in the name of economic development, to
exploit PNG' s natural resources. MN Cs create employment, transfer technology,
produce goods for export, build infrastructure and provide the state with much needed
17
tax revenue. Natural resources however, are being extracted at an unsustainable rate. ' In
the process of extracting and processing of resources, pollution is created and emitted
into the air, water and on land' (Warner, 1996, p.1233).
The roles of the MNCs in PNG are examined in this chapter. Young (1992) alleged that
environmental degradation existed in the Paguna mine before the Ok Tedi incident and is
a contributing factor to the current Bouganville crisis. Environmental destruction is also
prevalent in other industries. Eaton in 1986, reported that reports forests and their
fauna were being destroyed. ' Soil is eroding along the river banks from illegal logging,
from forest clearings and from access roads built in the area. Wildlife is driven away by
noise and air pollution from emissions. Drinking water is contaminated from sawdust,
oil, fuel and toxic preservatives such as arsenic, chromium, boron and dieldrin used for
dipping logs' (Eaton, 1986, p.165).
If these claims can still be substantiated in 1998 and the environmental damage is
significant, then government action is necessary to control them. Environmental
degradation should not be the price for economic development. However, government
actions needs to be cautious because the MNCs were originally invited to develop the
natural resources. They are 'engines of development' and contribute to PNG' s economic
growth. Sham (1995) reported that foreign investments through the MNCs boosted
exports. Petroleum and minerals make up 55 percent of the country's export. Table 2-2
reveals that export earnings from logs and minerals have more than doubled since 1990.
These export earnings reduce the country's debt. Further, MN Cs create employment

18
opportunities (Table 2-3) and ultimately contribute to economic growth (Bank of PNG,
1996).
Hence, Wescott (1992) warns against developing countries launching into complex
actions to control environmental degradation. He cites Thailand' s experience that earned
its label, 'Paper Tiger' . Thailand initiated a complex environmental program it could not
enforce and lack of enforcement led to the Bangkok Chemical Explosion in 1991 . It is
suggested that an enforceable action such as the environmental disclosure requirement
may be more appropriate. This study will show PNG' s need to capitalise on a current
development while enjoying the MNCs' benefits, and at the same time minimise the
adverse environmental impact. A current Environment Accounting Task Force (EATF,
1996) survey reveals that the Australian public is demanding greater environmental
information. Therefore, this study investigates the Australian companies' current
extent, pattern and degree of environmental disclosure to establish whether the current
demand is being met. Where it is deficient, this study suggests that MNCs incorporate
environmental disclosure into their accounting practices. This will add force to the
current demand to address the environmental degradation issue.
Veslinds and Peirce (1983, p.358) draw attention to a more pressmg concern that
'ecology and economy are on a collision course.' In an attempt to increase productivity
to satisfy basic needs, the ecology is being destroyed. At the current rate of productivity,
the environment with its ecology, will be totally ruined unless something is done soon.
Man cannot continue to exhaust nature without giving it time to recuperate and
19
refurbish, or it will lead to eventual self destruction (Goldsmith et al, 1972). That is why
Daly (1992), expressed concern that the current economists (including those in PNG)
operate under the assumption that unlimited economic growth is forever possible.
Economists ignore the biophysical limits and the imbalance in nature caused by the
unsustainable rate of resource usage.
At the current rate of economic development, ecology is traded off for econorruc
development. Although this study is not assessing either economic development or the
ecology, both terms will be defined to clarify their usage here. The Macquarie Dictionary
( 1997) defines ecology as, 'a branch of biology that deals with balanced interrelationship
between organisms and their environment. It can include distribution of people and
institutions and their interdependence' . Economic development is a new, exciting and
challenging branch of broad economics and political economy. It refers to the
minimisation or erasure of unemployment, inequality and poverty through the
development of resources. In this study both economic development and the ecology are
considered because the impact changes both people and wildlife in their respective
environments.
To minimise and control this unsustainable rate of activity, this study focuses on the
MNCs' environmental disclosure. Environmental disclosure ought to reveal the MNCs'
policies to mitigate environmental impact because each MNC is required, under the
Environment Planning Act 1978, to lodge an environmental impact plan for each major
project. Tabor and Rosenbaum (1996), report that MNCs' large financial standing gives
20
them an easy excess into developing countries like PNG. Once inside, the host country's
inadequate political, legal and technical expertise leave much of MNCs' work
unscrutinised. The problem is, their operations are inadequately monitored after the
projects are commissioned. This 'leads to severe consequences such as the destruction to
the environment, poor labour conditions, corruption, transfer pricing, restricted
technology transfer, and inadequate consumer protection' (Tabor and Rosenbaum, 1994,
p.3). Therefore, an analysis of MNCs' environmental disclosure should reveal the
extent of their compliance.
The analysis of adverse effects from MNC operations will proceed in the following
manner:
Section 2 discusses the concept of MNCs. This is necessary since there are several
definitions of MN Cs. A firm or corporate body which is an MN Cs under one definition
may not be considered so under another definition. The analysis then looks at the
categorisation of the MNCs. While the operations ofMNCs in a developing country such
as PNG can have economic benefits, the extent to which these benefits are offset by the
adverse environmental impact of such operations may be determined by the industry
category of individual MNCs. The potential effects vary from industry to industry .
. Consequently, the categorisation of MNCs can increase our understanding of the types
and extent of environmental damage they cause. Most studies into environmental
impacts of MNCs stress the importance or significance of this categorisation (Meyer,
1996). In this section the types and significance of the categorisation which shape the
MNCs objectives and define their roles, as advanced by the literature, are examined.

21
Section 3 highlights the benefits of MNCs. It would be biased if this study only
highlighted the adverse impacts (although that is the focus of this chapter) without
presenting the benefits, even if they are offset by the adverse impacts. MNCs, as
engines of development, earns PNG foreign currency, creates employment, brings about
economic growth, services PNG' s debts and transfers technology. Each of these benefits
will be discussed and ranked according to their order of importance.
Section 4 identifies issues connected with adverse environmental impacts and serves
three purposes. Firstly, the benefits identified in section 3 will be reassessed against the
costs of the MNCs' operations. The second purpose is to assess the significance of
environmental degradation caused by MN Cs in PNG. If the cost is significant, then costs
will offset the benefits of the MNCs. Thirdly, those MNC characteristics which are
associated with the severity of environmental degradation will be identified. Previously,
the MNCs have being defined and certain characteristics highlighted. This section will
correlate the MNC characteristics with their environmental degradation and their
severity to search for any relationships that might exist.
2.2 The Multinational Corporations (MNCs)
This section is devoted to focusing on the MNCs because it is alleged that foreign
companies cause adverse environmental impacts. These impacts are the results of the
MNCs' large operations. As 'Engines of Development', MNCs are invited into the
country with large amounts of capital to develop multi million dollar projects. This

22
raises several issues which this chapter will address. Issues such as, the identity of the
MNCs, their major identifying features, their origins, the types of operations in which
they are involved which it is alleged, are causing adverse impacts, and the benefits for
the country from their operations.
The section begins with the definitions and characteristics of MNCs which will assist
this study to identify a sample of MNCs for the main analysis. The MNCs' country of
origin and their categories are useful for sample selection because this study will
concentrate on Australian MNCs which are involved in four sensitive industries: mining,
petroleum & gas2, and manufacturing. Although only the mining and the forestry
industries are currently under scrutiny over environmental issues, the other two
industries have the potential to degrade. In the concluding section, MNC benefits are
contrasted against the impact their operations have on the country.
Definition of an MNC
There is no single or agreed definition on what an MNC is (Rockbok and Simmons,
1989). Thus various MNC definitions, along with their characteristics are discussed and
contrasted below. This leads to deriving a definition for this thesis with discussions
supporting the derived definition and its use.
An MNC is broadly defined as 'any corporation that controls economic resources in
production or service facilities in two or more countries' (Grub et al, 1986, p.255). This
2 Since Oil and Gas industries are small, they are grouped together as oil & gas in this thesis
23
is a traditional definition presented within the context of the International Accounting
and Control Board (IACB}, which is appropriate for this accounting based study. This
definition has political connotations with an emphasis on control. Several contributing
features enable an MNC to achieve power (control). These includes its size, relative
significance in the countries of operations', the number of geographical locations, and
the extent of foreign, compared to domestic, operations.
However, a better description of an MNC power is that derived by the Harvard
University Multinational Enterprise Project. This definition is: 'that the MNC's control
is linked with their 'invariable size, their operations in a substantial number of countries,
their access to a common pool of human and financial resources, and their widespread
activities, rather than serving as mere exporters or licences of technology' (UN
ST /ECA/190, 1973 ). Size and control appear to be the dominant features of an MNC in
both these definitions.
An MNCs' importance is further emphasised in Dunning's (1993) definition where he
defines an MNC as 'an enterprise that engages in foreign direct investments (FDI) and
owns or controls value adding activities in more than one country' (Dunning, 1993, p.3).
The definition is expanded to include certain MNCs' characteristics. An MNC:
1. owns a number of sizeable subsidiaries or associate companies,
2. informationalises degrees of management or stock ownership,

24
3. gains advantages from governance and influences over economic activities in various
countries,
4 . has a fair share of global assets, revenue and income,
5. operates businesses in a number of countries, and
6. has higher value of its activities internationally.
MNC's ownership and access to resources contributes to its expansion. This is where
the developing countries see MNCs as 'Engines of Development' . This term is defined
below, under benefits from MNCs.
According to the bureau of economic analysis (BEA), an MNC is 10 percent or more
owned by foreigners although MNCs originate as private companies from developed
countries (Grub et al, 1986). A company becomes an MNC when its ownership changes
by 10 percent or more. Although BEA sees ownership as the determining factor, it has
not diverged from the previous definitions because accumulation of resources (assets)
builds up the size of the MNC. Unlike the 10 percent change cited here, this study
considers foreign ownership to have substantial control and external decision making.
In contrast to the definitions given above, a more neutral and generalised definition is
provided by Renwick (1983 , p.56) who defines an MNC as:
'a cluster of corporations of different nationalities that are joined together
by a parent company through bonds of common strategy and draws on a
common pool of financial and human resources . MNC expansion is motivated
by a belief to plan, organise and manage on a global level. Their merger or
acquisition is to maintain stability.'
25
While an MNC's motive for expansion may vary, the instrument is the same. The
expansion is through a common pool of resource and finance where resources are
acquired and accumulated prior to the actual expansion. Renwick (1983) identifies
four common features of .MNCs which include two recurrent features (size and
control) . MNCs:
1. are large in size, activities and turnovers,
2. diversify internationally their investments, production, sales and
bargaining power,
3. increase their sizes through oligopoly, and
4. their global structure strengthens their bargaining power.
These are by no means an exhaustive list of definitions for an MNC. Although MN Cs are
well recognised for their global reach patterns of changing international business, there is
no agreement on a definition of what an MNC is (Rocbok and Simmons, 1989). Various
existing definitions emphasise different features of an MNC. For example, a structural
criteria emphasises transnational operations. Some others emphasise size, including
earnings, while others focus on global moves. Each definition reflects the various nature
of the MNCs and the definition chosen depends on the context of the study. The UN
(1973, p.4) prefers to label an MNC as a 'transnational corporation (TNC)', stressing
the importance of identifying the MNCs' ongms. This is because MNCs come from
developed countries where some operate as private companies, others are government
owned, some are public while the rest are of mixed ownership.
26
Since there is no one agreed definition for an MNC, a combination of four features or
common characteristics will be adopted by this study to identify an MNC. They are size,
structure, resource seeking-accumulation, and foreign ownership, ie an MNC comes
from a developed country. Size is a prominent feature included in nearly all the
definitions above. It is measured by the ownership of resources (assets) or financial size
and magnitude of activities or operational size. It is also measured by annual turnovers
and earnings (sales and profitability) which are also operational size and the number of
its employees. Financial size is vital for this study because MNCs are invited to develop
large projects (such as the mines in PNG) for which the host country does not have
adequate funds. Size will also be a paramount feature as this study will concentrate only
on the top 500 Australian companies.
The second feature is a structural criteria which considers MNCs as transnationals with
a majority of external ownership with establishments in various countries. Through
globalisation, MNCs expand their operations to different countries, including PNG,
seeking for resources to maximise their wealth. (Some of these foreign companies are
invited to invest in large projects because PNG cannot afford to develop them with its
low savings (Bank of PNG, 1996). Strengthened by their global structure, the MNCs
gain excess into different countries (Dunning, 1993) and maintain their presence through
their bargaining powers (Renwick, 1983). An Australian Aid (AusAid, 1994) report,
claims that some of these companies exercise their bargaining powers to the maximum in
the host countries.

27
Thus for the purpose of this study, an MNC will be any large corporation with foreign
ownership (and control), that is involved in large scale operations and whose impact is
intense and potentially adverse. While this may appear too general, four major
(common) features from various definitions are combined. Various studies such as
Trotman and Bradley (1981); Pang (1982); Ferrer and Parker (1987); and Deegan and
Gordon (1996) have noted a correlation between size and disclosure. MNCs have the
means to disclose and as public companies are required to issue annual reports. This
study relies heavily on annual reports for the main analysis which comes from the MNCs.
MNCs' transnational structure enables them to control their operations from their
country of origin. Their international operations are a form of diversification for wealth
maximisation. However, MNCs become the focus of the local community and are
expected to meet social demands. The last two features appear vague because they are
interwoven into the first two. Thus, this thesis will rely more on the first two for the
reasons given above. The other two features will be the focus in the next section. For
example, the accessing of the MN Cs into developing countries will be discussed along
with their underlying reasons for their venture. Resource seekers, it alleged venture
abroad to maximise wealth through acquiring resources (Shapiro, 1996). Finally, foreign
· ownership needs no explanation for all MNCs enter from developed countries.
28
2.3 Benefits of Multinational Corporations
Much of the attention in the literature from economists, political policy makers, political
scientists and academics is devoted to the MNC's size and span of operations as
reflected in the definitions above but little attention is given to their significant role. The
significance of MNCs depends largely on their functions (Jones, 1996) which will be
discussed in this section. The discussion on the function of MN Cs will be in three parts:
accessing of MN Cs into PNG, the benefits they derive and the ranking of these benefits.
Access into a country may be through any of the following: An MNC may acquire an
existing company in the host country, form a partnership with an existing PNG company,
establish a subsidiary, win a government tender, or use some other arrangement. The
benefits they derive from this is determined largely by their access and their goals. For
example, an MNC entering on a tender will complete a project such as an
infrastructure, and retreat leaving the host with long term benefits. Another, acquiring
an existing company, may become a monopoly and earn excessive profits with adverse
impacts. Discussions around information such as access will be provided to set the stage
before the benefits for the period 1992-1996 are discussed and ranked.
2.3.1 Accessing of MN Cs into PNG
The pattern of MNCs access into developing countries has become more varied and
complex. Shapiro (1996) categories and discusses three broad categories as: raw
material seekers, market seekers and cost minimisers. Raw material seekers were the

29
earliest form of rogue MN Cs. They were firms which operated under the mantle of the
UK, Dutch, French and Belgian colonial empires. Their aim was to exploit the raw
materials which could be found overseas. Modern - day counterparts are the mining and
oil companies which are often the first to invest overseas.
Market seekers are an archetype of modern compames that are established
internationally, produce and sell in foreign markets. IBM is an example of an early
market seeker. Other examples such as Coca Cola, Nestle and MacDonalds have been
operating for some time. Their unique feature is that it was a one way investments
spreading out of the US, up until the 1960s when a reverse occurred when others such as
Japan started investing in the US. Japan began seeking markets in the US to counter
restriction on its goods in the US .
Cost minimisers are a recent addition to MNCs. These are MNCs who seek out low
cost countries to establish and produce their goods in order to remain cost competitive in
their own countries and abroad. These countries have capitalised on low cost countries
such as Hong Kong, Taiwan and the Philippines (Shapiro, 1996).
MN Cs seek markets in both developed and less developed countries if there is an actual
or perceived restriction on their exports. They enter the country, produce locally and
thus evade any import restrictions. Market seekers enter through an acquisition of
existing enterprises or through establishing subsidiaries. Sytyk (1982) concluded,
following an interview of 58 Australian company representatives in the Pacific, that

30
MNCs' investment overseas is an economic tool for the investor. The interviewees' main
reason for investing in the Pacific region is to exploit the cheap labour and establish
markets for their products. Dunnings (1993) confirms that it is production and marketing
costs that drive MNCs close to their customers.
By the 1960s cost minimisers were establishing where there was cheap labour. Ferreria et
al ( 1993) cite the example of the MN Cs in the Philippines. They established
manufacturing and assembling enterprises to exploit labour which was considered
'reasonably priced', efficient and comparable with other countries. Renwick (1983)
noted MNCs also use their bargaining powers to gain entrance to exploit opportunities.
Behrman's (1972) taxonomy as adopted by Dunning (1993), classifies MNCs into:
resource seekers, market seekers, efficiency seekers, strategy asset seekers and seekers
of countries with lax legislation. The first three of Behrman's taxonomy is identical to
Shapiro's categorisation. Strategy asset seekers are those who acquire assets of foreign
companies to promote their objectives to exploit specific markets or cost advantages. It
appears that .MNCs in that category are seeking international localities to minimise cost.
Hence, efficiency seekers and strategy asset seekers can be grouped together as market
seekers or cost savers. That leaves those who evade legislation as the only difference in
the two authors' categorisations.
Unfortunately there are some MNCs who seek countries with lax legislation which
Ferreria et al (1993), label as 'colonial masters' . The post war era introduced these

31
MN Cs as the direct successors of the colonial masters because these MNCs come from
countries which had earlier colonised the developing countries such as the Australian
MNCs in PNG, and American MNCs in the Philippines. Both are cited in this study.
These MNCs move to exploit resources and relocate to a lax environment if they are
threatened. Japanese firms enter South East Asia where legislation is lax and avoid
their own stringent regulations. F erreria et al also noted US and Japanese manufacturing
and assembling industries movmg in to utilise the cheap labour besides evading
legislation as cited above.
In PNG some MNCs enter through government arranged contracts. The PNG
government recently awarded a contract to an Italian company to install radar systems at
various airports in the country (Yombon, 1998). Previous examples include the
controversial Sandline contract which led to the overthrow of the last government in
1997. MNCs are also invited on a joint venture basis under PNG's Investment
Promotion Authority (IP A) guidelines (1994). Under this arrangement, Papua New
Guineans plan out a business venture (which requires a large outlay of capital) and seeks
a MNC through IP A. IP A searches, selects and organises the partnership venture.
Whichever way MNCs enter a country, Jones (1996) lists their access for one of these
reasons:
1. overall macro-economic conditions - Fast developing countries will attract more
MN Cs while stagnant economies are staved off. There is also a trade off where fast
32
economic growth m turn, simulates MNC growth while a recession depresses
MNCs growth.
2. attitudes of recipients - receptivity among different countries depends on government
regulations which can promote or inhibit the MNC's presence. Peffermann (1992),
observed a changed attitude and lax standards amongst developing countries
towards :MNCs. Previously, developing countries identified MNCs as reaping
unearned profits and resorting to bank loans to develop their resources. However,
loans are found to be expensive and thus standards, therefore are being lowered to
attract :MNCs ( Peffermann, 1992).
3. liberation of capital - :MN Cs flourish when restrictions such as exchange controls are
relaxed and shrink during periods of tighter control. Shapiro' s (1996, p.2)
observation is that capital moves ' at the pace of light' as MN Cs raise capital in
several markets simultaneously.
4. trade protectionism - especially where there is a choice between export and foreign
direct investment (FDI) . Trade barriers discourage export but encourage FDI.
5. development of communication and transport technology - reduced cost in transport
and the improvements in communication boosts the transnational business activities.
Both developments make control over their international operations easier.
MNCs enter developing countries through these various avenues. Once inside, they
generate benefits but also exploit and create impacts which are at times severe. The next
two sections discuss the benefits which are more than offset by the adverse impacts. The
remainder of the chapter is devoted to the discussion on the impacts ofMNCs.
33
2.3.2 Benefits derived from MNCs
Developing countries lower their standards to attract investors (MNCs) in anticipation of
benefits (Ferreria et al, 1993). Often these benefits are pursued with little or no regard
for the impacts which are at times,' severe. Benefits include export earnings, creation of
employment, economic growth, foreign debt reduction and transfer of technology.
Jenkins (1987, p. l) referred to MNCs as ' engines of development or growth'. This
reference was made in the context of MNCs' having the potential to control excessive
capital in the form of assets. This stock of assets when transferred, is capable of
eliminating poverty and misery in developing countries. Capital availability is important
because countries that export capital are also the homes of MN Cs (Jones, 1996). Large
projects are capital intensive and MNCs move capital around the world quickly with the
use of the electronic media (Shapiro, 1996). Capital thus imported is invested in large
projects to earn export revenue, reduce the host country' s debts, create employment
which in turn reduces unemployment, transfers technology and skills, and ultimately
contributes to economic growth. Each of these benefits is discussed below.
2.3.2.1 Export Revenue
This section discusses revenue from exports. A World bank report ( 1978), painted a
bright picture for export earnings through MNCs in PNG. The report emphasised that

34
MNCs are contributing to PNG's export earnings. This is predicted to continue into the
foreseeable future given the abundant natural resources of the country
Sham (1995) reported in the Business Weekly3 that foreign investments by MNCs has
boosted exports for PNG. Table 2-2 shows the value of export earnings and their export
share. This table depicts investments in minerals, petroleum, agriculture, marine and
forests . Of these, petroleum and minerals earn more than 55 percent of the country's
total exports. Ok Tedi alone provided over 45 percent of the export earnings before
other mines were commissioned. This is one of the contributing factors to the state's
alleged conspiracy to minimise disruptions to Ok Tedi's operations. In a biased move,
the state deported the Fly River landowners' Melbourne lawyer and through negotiation,
settled the case out of court for a reduced sum of $11 million from the original $3 billion.
This solution is understandable when it is considered that major export benefits come
from minerals and log exports, the earnings of which have more than doubled since 1990
(Rosenbaum, 1995).
The state's action in the Ok Tedi case maybe commendable. The mine's closure would
have minimised some of the benefits discussed in this section. Export earning would
certainly be minimised and debt servicing reduced. An immediate effect from closing the
. mine would make thousands of employees, with dependents, unemployed and
compound the underemployment problem.
3 Monday, February Issue page 34

35
2.3.2.2 Employment
During the 1983 Tokyo Round Table Conference, foreign investments (MNCs)4 were
credited with the creation of employment. In a recent IP A ( 1996) report, it was noted
that 858 companies registered with investments valued at K4,384, 120,000 in PNG
between July 1992 and 31st December 1995 (Table 2-4). This investment, created during
the 3.5 years, provided employment for 17,757 Papua New Guineans. Agriculture
employed the highest number followed by forestry and business activities, respectively.
Although mining and petroleum have the highest investment value, they do not employ
as many, because they are both capital intensive industries.
Consequently, there is a serious underemployment of 44 pOOO of the work force
added annually to the PNG labour force. This amount of labour is not fully utilised due
to the high cost of wages. Australian International Development Assistance Bureau
(AID AB, 1989) reported that wages in PNG is rated 2 to 10 times higher than other
developing countries such as Malaysia, Philippines, Indonesia, Western Samoa and Sri
Lanka. Even labour intensive activities such as tourism, are too costly. Hence,
expensive labour costs, arising out of the high wage rate, is hindering ecponomic
development (AIDAB, 1990).
Jarret and Anderson (1989), alleged that the high rate of the minimum wage was
inherited from Australia. Urban wages doubled between 1972-1976 to Australian
4 This thesis equates foreign investments with MN Cs because foreign investments medium are MN Cs
36
contract officers' advantage. Therefore Australians found working in PNG attractive,
because the scale of salaries and wages was higher and allowed them to build up savings
to remit home. Inevitably, PNG wage and salary costs grew out of Australian
consumption standards, instead of local economy and culture (World Bank Report,
1978). While the report is 20 years old, it still highlights the central problem of
unemployment, ie wages are too high and the MNCs cannot employ more labour which
creates the serious underemployment referred to earlier. Those employed by MNCs
from the able work force constitutes only a fraction of the population.
Goodman et al (1987), recommended that PNG should reduce its wage structure
substantially if it is to reduce unemployment and increase productivity. This would mean
that more people will earn money to buy goods and services and improve their standard
of living. The authors argued that PNG' s high wages structure is discouraging
investments. Even its rural wage in 1980 was US$62. 07 per week compared to the
Philippine's US$10.50. This argument still holds 11 years later (1998) .
Despite the high wages some MN Cs do establish themselves in PNG. By December 3 I st
1996, US investments exceeded other developed countries with a large portion of
investment in manufacturing and petroleum. These investments boosted employment
significantly from 25 1 during the second quarter to 13 22 in the third quarter (refer to
Table 2-3 in the appendix p.337). This increase in employment was mostly in the
unskilled and semi-skilled labour force. Some MNCs which are set up in the country

37
seek labour substituting techniques to minimise costs (Goodman, 1987). Occasionally,
MNCs provide some training. However, its significance is minimal because the training is
specific to a particular company's need with little chance of transferring the skill to other
industries (Jenkins, 1987).
The overall impact of investment on employment in PNG has been disappointing despite
the mineral booms experienced in the period. During 1995 OCED meeting in Paris on
foreign investment, trade and employment, it was reported that although foreign
investment surged, employment levels remained constant. Thus PNG is not deriving
maximum benefits, in the area of employment, as it should. Even the high economic
growth did not generate many job opportunities. Millet (1993), paints a gloomy picture
when he claims that by the year 2000, 50 percent of the labour force will be unemployed.
However, for the period concerned (1992-1996) some growth in employment was
experienced in the third quarter of 1996. The main investment which created this growth
was transportation for the Lihir gold mine and the Poreporena freeway.
Despite this disappointing experience of under-employment, employment contributes to
economic development because it reduces unemployment, inequality and poverty.
Employees use their earnings to acquire goods and services and reduce poverty.
Increased employment contributes to increased production for consumption and exports
that lead to economic growth.
38
2.3.2.3 Economic Growth
Economic growth in PNG continues to fluctuate. Economic growth in the 1960s was
rather rapid but stagnated in the 1970s. Growth measured in Gross Domestic Products
(GDP) for this period (1960s) was 6.5 percent while other middle income economies
were experiencing only 5.9 percent growth. PNG's high GDP growth was attributed to
slow growth in the country's population in the 1960s which eventually caught up in the
1970s. As PNG' s population increased, economic growth stagnated causing it eventually
to decline in the 1980s. The Terms of trade deteriorated even though the volume of
exports increased. This deterioration was caused by two factors : First, high wages and
the skilled expatriates mentioned earlier departed with their savings. Second,
consumption continued to increase despite a decline in production, with food import
making up 20 percent of total imports (Jarret and Anderson, 1989). Increased imports
also increased the foreign debt which will be discussed below.
Since independence, economic growth has been fairly modest until the 1980s. The
experience during the 1980s was a mixed one, with a slow start at the beginning of the
decade, moderate in the middle before it deteriorated towards the end of the decade. The
decline was caused by the Bouganville crisis. However, it picked up early in the 1990s
with a prospect of a mineral boom for the decade (AusAid, 1992).
Actual economic growth gradually picked up from a trough in 1985, until it reached an
enormous growth in GDP averaging 12.6 percent for the period. Combined with the

39
expansionary fiscal policy of the period this produced a rapid increase in the real GDP,
per capita of approximately 3 0 percent between 1 990-1993 . Over the 3 years ( 1992-
1994 ), PNG's economy grew by 33 percent from export earnings (Sham 1995). Much
of this growth is attributed to the mineral boom and this is where the :rvfNCs play a
crucial role in the country' s economic development (AusAid, 1995). There was a rapid,
even if short lived expansion in mining and petroleum output, which quickly restored
economic growth that had slumped with the closure of the Paguna mine. Despite this
growth from the mineral boom, there was no economic development in the sense that it
did not alleviate poverty, because of uneven distribution of benefits. Benefits were
mainly diverted towards urban areas and to the resources' owners (BPNG Economic
Bulletin, 1996).
Following the recession caused by Bouganville crisis and the fall in commodity prices,
the resource sector recovered. Initially, it was the development of the Ok Tedi copper
mine, the Pogera gold mine and the Kutubu oil field, followed later by the improved
agricultural commodity prices, including forestry products . Growth peaked at 16 percent
in 1993 but slumped drastically to 3. 1 percent in 1994 with the introduction of stronger
monetary policies which eventually led to the floating of PNG Kina5 (Aus Aid Report,
1996).
Economic development for PNG would be faster if it were not for a number of
constraints besides high wages. AusAid (1992) identifies three constraints which are
5 PNG currency
40
outlined below. The first constraint is the adoption of western laws, institutions and
standards in a country with several hundreds of languages and distinct tribal cultures.
The AusAid Report ( 1992) claims that it is difficult to apply western beliefs and practices
in PNG because they only result in social tension, unrest, and law and order problems.
Experiences elsewhere has shown that it is difficult to achieve economic success without
public security. The second constraint observed is the inappropriate government policies
which over regulates foreign investments. This is further complicated by difficulties in
acquiring land which is highlighted as a serious obstacle to private investment. The third
constraint, which is related to the second is the mentality or the focus on distribution of
wealth rather than the creation of it. This wealth comes from generous foreign
assistance or donations including Australian annual aid. The suggestion is that the PNG
government expenditure needs to be restructured towards supporting growth,
emphasising basic education for all, and promoting efficiency in the public sector to
increase productivity.
It is difficult to conclude that AusAid (1992) identified the constraints that beset
econonuc growth for PNG. There are a number of factors which affected PNG's
economic growth which fluctuated throughout the period. Factors include high wages,
dependence on imports, crises and changes in prices of export goods. Some are
contingencies such as the Paguna crisis (Bouganville) and changes in export commodity
prices. Others such as high wages and heavy dependence on imports, are controllable to
minimise foreign debt.

41
2.3.2.4 Debt Servicing
The most significant benefits from the :MNCs is the repaying of debts from earnings
generated by MNC operations. Domestic debt doubled while external debt tripled
between 1980-1989 with concessional interest rates jumping from 33 to 42 percent.
Public debt was the result of government borrowing to cover shortfalls and to acquire
equities in mineral projects, while the private sector debt, was due to the development of
the Ok Tedi mine. The debt serviced in the same period rose from 19 percent to 40
percent. It was estimated then, that it would require $US 1. 5 billion to cover private
debts to develop Misima, Pogera, Hidden Valley and Lihir gold mines. Towards the later
half of 1980s external debts were repaid, while the government switched to domestic
debt sources. The switch placed pressure on the central bank because it had to reduce
its foreign reserves (AIDAB, 1990).
Fortunately, the mining and oil boom in the early 1980s turned the current account
deficient into a substantial surplus. PNG relies entirely on exports to earn foreign
exchange and the improved prices in agricultural and forestry products also contributed
to the above surplus. However, this surplus was short lived and was quickly depleted
· by imports for Pogera and Kutubu as well as consumer goods from increased
government expenditure. Other mining and oil project debts were also met out of this
surplus. Much of the government's tax earnings and royalties were largely recycled back
into imports (AusAid Report, 1996).

42
Thus the surplus scene drastically changed in the next decade. Wages and salaries
increased by $100 million and the falling agricultural incomes were subsidised by $174
million. Domestic demand increased without any change in real output or export
earnings and had to be met by imports throwing the balance of payment into a deficit of
$2 71 million over 1993-1994. Even the delay in the development of the Lihir gold mine
only exacerbated the deficit problem (AusAid Report, 1996).
It could have been worse, if it was not for improved commodity prices and tightened
fiscal policies. Levies collected from agricultural commodities were used to offset some
of the foreign debts. Thus PNG' s debts were reduced significantly from 1994 onwards.
In the following year, its performance bettered that of the African economies. Foreign
debt decreased from 3 1 percent down to 21 . 9 percent. This was the result of the decline
in debt servicing by MNCs in the mining and petroleum sectors and an increase in
exports. Since 1992, the ratio of PNG' s debt outstanding to current account receipts
improved significantly in comparison to other developing economies. PNG' s debt began
at 140 percent in 1991 and dropped to 70 percent (50 percent reduction) in 1995, while
developing countries began at 130 percent but only experienced a minor decline of 10
percent6. Again, PNG's rapid decline was due to the significant growth in exports from
mining, petroleum and the non-mining sector combined with the decline in the stock of
debt outstanding (BPNG Economic Bulletin March, 1996).
6 Since original data is not available, these percentages are approximations only from a graph

43
However, the balance of payment is expected to remain fragile due to the floating of
the Kina (PNG currency). The floating has other ramifications for the country' s balance
of payments. With a fixed exchange rate the Central bank can determine in advance and
retain enough foreign reserve. That is not possible with a flexible exchange rate which
will fluctuate with demand. The government will need prudent fiscal and monetary
policies to maintain a stable balance of payment position. The main area of concern is
borrowing for consumption7 (AusAid Report, 1996). Reduction or control over heavy
reliance on imports will assist in lowering foreign debt.
2.3.2.5 Transfer of Technology
The last of the major benefits is the transfer of technology. 'Within one generation,
technology has moved from stone age to steel, and in recent years, to the computer age
in many parts of PNG' (AusAid, 1995, p.49). This unprecedented transfer of technology
is through the MNCs in the private sector and is especially evident in the mining and
petroleum industries where computer based technology is operating in remote parts of
the country. The transfer of technology, in some industries, is more advanced than
others. In agriculture, forestry and fishery, technology transfer has an impact on the lives
of the people. Machinery and tools contribute to increased productivity and provides
users with opportunities to develop skills. Jones (1996) disagrees with those authors
who rate the transfer of capital as a priority for developing countries. He rates the
transfer of technology and organisation, entreprenuership and culture, higher than
capital. Jone's reasoning is that those who rate capital as a priority classify all transfers
7 PNG's current outstanding debt is $US2.349 billion (World Bank Debt Table 1998)

44
of resources as finance. However, the MNCs control a package of resources such as
technology, managerial skills, machinery, skills to operate the machinery and manage
finance. Jones argues that capital is more than just money and without the combination
of technology, management and organisational skills, little will change for developing
countries.
The MNCs provide workers with on the job training, in-house training, and scholarships
to tertiary institutions to master the latest technical skills. The mining industry has
committed a lot of resources into setting up the mining school at the University of
Technology in Lae. However, this has little ·effect on the top end of the labour market
because MNCs like Chervon, are still flying experts from outside including the US, on a
rotation basis (AusAid, 1995).
Benefits, both temporal and permanent for a developing country, depends largely on its
priorities. If foreign investments are sought for quick fix/solutions to a problem, then its
benefit will be temporary, alternating with stagnant growth. On the contrary, seeking
MNCs with thorough planning, with sound development strategies, will earn lasting
results. MacPherson (1996), identifies sound development strategies, as lacking in PNG
which deprives the country of maximum benefits. Even those derived trickle down as
ranked below, being hampered by the distribution processes.

45
2.3.3 Ranking of Benefits
The type and the amount of benefits discussed above vary for PNG over the period
observed. Some benefits such as employment is a contentious issue. However, PNG is
deprived of the maximum benefit by its wage policy. Other benefits such as the transfer
of technology, are difficult to assess. Therefore the ranking may not be accurate. Overall
there is little evidence of these benefits because they trickle into the economy in varying
degrees in different parts of the country which also makes ranking problematic. For the
majority of the country, there is little economic development. Since the quality and
quantity of benefits vary, and given these shortcomings, this section ranks the above
benefits based on the discussion in the last section.
Ranking of the above mentioned benefits is artificial because there is no yardstick in
PNG to measure them against. The benefits are not discrete but continuous and overlap
each other. They trickle down in varying degrees into the country. Therefore, the ranking
is arbitrary and generally based on different reports such as AusAid and the United
Nations (UN).
The benefits are compared against the UN Human Development Index (HDI) because
economic development is intended to reduce unemployment, inequality and pov,erty
through foreign investment. Individual benefits from MNCs' operations, discussed in the
last section, are discussed below in a descending order:

46
2.3.3.1 PNG's Poor Rating
Although the period under discussion shows increases in export earnings and a reduction
in PNG debt, its performance against the UN Human Development Index (IIDI) is below
that (126 out of 174) of other countries in the same category. This is due to the
deterioration in social conditions, caused by high population, rural-urban migration
combined with inappropriate government policies. While PNG is endowed with rich
natural resources and is experiencing a mineral boom, the exploitation of these natural
resources only leads to a dualistic economy (AusAid Report, 1996).
Experience from other developing countries show that financial resources are not the
most significant determinants of development. Even the reserves will be quickly
depleted, sending the country back into debt. Hence, the country' s overall economic
performance has been disappointing. MacPherson ( 1996) predicts that although PNG is
rich with natural resources, its people will remain poor. This will lead to widespread
social and political unrest for which the only remedy is an implementation of sound
development strategy, free of corruption (MacPherson, 1996).
2.3.3.2 Servicing Accumulated Debt
Given PNG's poor rating against the HDI, debt servicing is a top priority. Aka (1998)8
warned of further growth to PNG' s outstanding debt, if the country continues to borrow
for consumption, because the main contributing factor is the country' s high import
8Post Courier, Friday August 7, 1998 - internet

47
consumption bill. Aka reveals that PNG' s debt has been in place since independence and
continues to accumulate. The total cumulative debt, to the end of 1997, stands at
$US2.349 billion (World Bank Debt Table, 1998). The current practice of borrowing for
consumption will only widen the deficit gap. It can be argued here that borrowing for
consumption brings much needed goods and services to the people. However, much of
the imported items, including foodstuffs, are non essential and could be substituted
with local produce.
Given this gloomy picture of PNG' s debt, repaying it is the best option. Money has to
come from somewhere to repay because PNG's annual tax revenue is less than K2
billion. Borrowing money to repay creates further debt. One option would be to use
export earnings to repay debts, as seen in 1994, without creating further debt (BPNG
Economic Bulletin, 1996). An extreme alternative would be to take the action which
Romania took in 1980 to ban all imports (Aka, 1998).
2.3.3.3 Export Earnings
However, a total ban will affect industries such as minerals and oil & gas which are
generating revenue from export earnings that eliminate some debt. These industries
import necessary materials. Nonetheless, provisions could be incorporated in a ban to
allow material imports for mineral industries because minerals earn revenue for PNG.
Export earning is ranked as the second most important benefit after debt servicing
48
because debt is serviced out of export earnings. MNCs also pay taxes to the state and
wages to workers to acquire goods and services. The country is resource rich and will
generate more wealth (MacPherson, 1996) but it needs proper management.
2.3.3.4 Transfer of Technology and Training
There are mixed results on the transfer of technology. While there is a rapid transfer of
technology (AusAid, 1995), it is limited. Yet is essential for some of the industries eg
mining, where the latest equipment is used. On the down side, is the question of
transferring the skills gained in one industry into another.
The root of PNG' s development problem lies in the lack of training and employment for
its people (MacPherson, 1996). According to the Australian Conservation Foundation
(ACF, 1996) human resource development is a key area, however, its lack of
development is disappointing and creates social problems. Local participation
(employment) is necessary to promote sustainable development and will come only after
its citizens gain further education and training. Employment plays a dual role of
contributing to the country's output and is also a medium for distributing goods and
services.
Under the dualistic economy, wages are the only personal earnings which can pay for
goods and services and raise the standard of living. Although wages earned is the only
personal wealth gained from the l\1NCs, collectively wages reduces unemployment,
49
poverty and increases goods and services. However, only a few in the country are
employed despite the mineral booms and consequently, PNG's HDI performance is poor.
Even those employed are in the unskilled or semi skilled area. Those employed by the
mines provide cheap labour. Lihir gold mine became the world's cheapest gold producer
@ $US 245 per ounce, compared to the general average of $US 250 (Davis, 1993).
BHP is also reaping benefits from cheap labour at OTW.., where the cost of producing
copper is just 40 US cents per lb compared to 70 cents per lb in other mines (Malik,
1988). There is transfer of technology but it is limited to the privileged few with some
education. PNG has only a 52 percent literacy rate (AusAid Report, 1996). Hence,
employment would be the fourth ranked benefit of the MNCs discussed above
(MacPherson, 1996).
2.3.3.5 Employment
Whether the MNCs provide much employment is a contentious issue. Although the FDI,
through the MNCs, are credited with creating employment, the OCED {1995), meeting
in Paris, revealed that although the FDI increased, employment remained constant.
PNG' s rate of job creation in the same period was disappointing, despite experiencing a
mineral boom. PNG experienced a sharp increase of open unemployment from 2.0
percent to 7. 3 percent (Marsden, 1993).
Both oil & gas are capital intensive and the opportunities for employment are minimal.
Employment in the manufacturing industry is restrained by the high wages problem

50
which is inhibiting its growth. That leaves the country with employment opportunities in
areas outside those named. Those opportunities need to be explored, but that is outside
the realm of this study. Employment will raise the standard of living and promote social
development. However, as discussed in the last section, increase in employment will
reduce unemployment, poverty and earn more goods and services if wage rates are
lowered. They are currently too high and costly. The AusAid report (1992), suggests
that the lowering of wages will increase employment and lower the unemployment rate.
Increased employment will increase production and employees can acquire more goods
and services. Such acquisition reduces inequality and minimises poverty.
If the MNCs involvement in PNG only results in benefits, as discussed above, then
PNG's indiscriminate acceptance of MNCs is commendable. Unfortunately, this is not
the case. MNC activities leave impacts on the country which are at times adverse and
more than offset the benefits discussed above. This aspect is taken up in the section
below.
2.4 Adverse Environmental Impacts= Inevitable Self Destruction
Although MNCs have created opportunities for employment, produced goods for
export, and earned PNG foreign reserves to offset its debts, their impacts have been
considerable. This is because ill-managed economics and ecology are jncompatible and
the unsustainable rate of resource usage will eventually lead to self destruction (Veslinds
and Peirce, 1988).
51
This section compares the costs of environmental degradation with indiscriminate
allowances for MNCs operating in PNG with the benefits derived for the host. The
section begins with a definition of environmental degradation. This is followed by two
examples of MNCs causing environmental degradation in Nicaragua and the Philippines
before considering PNG' s situation. Significance and severity of environmental
degradation are identified in each case to determine whether there is any link between the
MNCs' characteristics and environmental degradation.
2.4.1 Environmental Degradation
A definition of 'environment' is needed before identifying environmental degradation.
Environment is 'the aggregate of the physical factors of the surroundings of human
beings, including the land, waters, atmosphere, climate, sound, odour, taste, the
biological factors of animal and plants and the social factor of anaesthetics' (CCH
Macquarie Dictionary of Business 1993, p.203). Environment covers physical, social and
biological factors . Therefore, damages to any of these constitutes environmental
degradation.
These two examples are noted here briefly to illustrate that adverse environmental impact
in developing countries is commonly caused by MNCs. Only two examples involving
MNCs in environmental sensitive industries, which are considered in this thesis, are cited
below. Forestry, mining and manufacturing are the industries concerned.
52
2.4.1.1 Nicaraguan Forest case
The two examples of MNCs causing environmen~al degradation are from Nicaragua and
the Philippines. Nicaragua had a large portion of the world's remaining tropical forests
on the ancestral land of indigenous people. A trilateral agreement was formed between
the landowners, their government and foreign owned timber companies to develop the
timber commercially. This agreement was to minimise the environmental problem
because previously there 'was unrestrained commercial harvesting of valuable timber and
stripping of forest lands at an alarming rate'. Experience among the indigenous Sumo
people of Nicaragua shows that large scale commercial logging degrades environment,
destroys the ecosystem and dispossess the indigenous people of their lands (Anaya and
Crider, 1996, p.347).
This occurred despite the Nicaraguan government entrusting the job of environment
protection, administration, regulating and development of the country' s resources to the
Ministry of Environment and Natural Resources. However, like PNG, their Ministry of
Forest Services lacked resources (finance and manpower) to monitor commercial
operations compounded by an unstable government which led to the environmental
degradation reported above (Anaya and Cridder, 1996). Thus the Nicaraguan forest
experience parallels that of PNG as discussed below. The common contributing factor is
the lack of resources to effectively enforce local legislation.
53
2.4.1.2 Philippine's Case
Philippine's problems, caused by manufacturing, mining and forestry were more serious.
The country's lax legislation and the indiscriminate allowing entry of MN Cs'
contributed to the severe consequences, including death. The Philippine government
created a favourable investment climate with lax restrictions and consequently
experienced severe environmental degradation. Its reasonably priced labour was
exploited fully by manufacturing and assembling industries from the US, Japan and Hong
Kong. These manufacturing industries caused so much air pollution that the Philippines
had the highest negative impacts with 20 percent of morbidity and a wide spread of lung
related diseases and deaths (Ferreria et al, 1993).
The manufacturing industry was followed by mining and logging companies. Commercial
logging and mining degraded the landscape while toxic industrial wastes polluted the
rivers and seas. So much so, it was reported at the Earth Summit in Rio de Janeiro
( 1992), that the cost of reafforestation and rehabilitating their rivers to support life again
would cost US$500 million (Ferreria et al, 1993).
The above examples from the Philippines and Nicaragua suggests, inter alia, that
indiscriminate allowances given to MNCs under a lax atmosphere is a recipe for
environmental degradation. Both examples above show sources/causes and types of
environmental degradation similar to PNG's which this study is assessing. PNG also
promotes commercial logging and mining giving favourable terms to MNCs. These
54
l\1NCs come from Canada and Malaysia besides Australia, and unless action is taken
soon, PNG will experience a similar environmental impact to Nicaragua and the
Philippines. A Japanese Federation of Bar Association' s recent study entitled, Export of
Japanese Pollution and Environment Destruction, blames the environmental
deterioration on the result of despoliation and improvishment caused by foreign
exploitation (Ferreria et al, 1993). Therefore, to mitigate further destruction, this
research analyses four industries to substantiate the claim that MNCs degrade the
environment and investigates ways of controlling them.
2.4.2 Environmental Degradation caused by MNCs in PNG and its
Significance
Environmental degradation is a common feature of MNCs, especially among raw
material seekers, as revealed by the Nicaraguan (Anaya and Cridder, 1996) or the
Philippines (F erreria et al, 1993) experiences. This analysis would be able to produce
significant results if the assessment was conducted on an industry by industry basis for
every industry. However, the available literature on environmental damages in PNG is
limited to the environmentally sensitive industries. Thus this research focuses only on
mining, forestry, oil & gas and manufacturing industries.
Although AIDAB (1990) advises that developing countries can experience economic
growth without straining their environment, PNG is currently experiencing adverse
impacts caused by the MNCs. The MNCs in mining, forestry and oil & gas are raw

55
material seekers which also exploit cheap labour as pointed out among the benefits
above. The manufacturing industry is establishing itself in PNG to avoid trade barriers.
For instance, an Australian canned meat supplier, is canning the same brands of canned
meat in PNG which the company previously supplied from its cannery in Australia.
This section discusses the adverse environmental impacts on an industry by industry basis
of the four industries selected. The adverse impact and the magnitude vary among
industries. What is discussed here is compiled from available information.
2.4.2.1 Forestry
Impact from logging is severe, however the report is brief because MN Cs in the logging
industries are mainly Malaysian for which there is insufficient information, to make any
comments except of a general and brief nature. This thesis concentrates on Australian
MNCs, for which there is adequate information.
Globally, rainforests are reported to be 'disappearing at the rate of 45,000 square feet
per second and an estimated 100 species of wildlife disappear daily. This loss
· supersedes all previous losses' (Beder 1993, p.187). Sensing the danger of forest
extinction, both the Indonesian and Philippine governments placed restrictions on
logging. Consequently, log prices leaped by 200 percent on the Japanese and South
Korean markets. It was to exploit this price increase that attracted Malaysian logging
companies into PNG.
56
These logging companies have been known to log indiscriminately throughout PNG' s
forests . Although 'there is a severe loss of aquatic life, the destruction of the tropical
rainforest habitat is equally disastrous because it contains some of the world's rarest
species of flora and fauna' (Solnes, 1995, p.54). Reid (1995, p.4) reports a UN
environment protection 'estimate of as many as 30 million species in the biosphere. Of
these 1.5 million have never being described and up to 2.5 percent may face extinction' .
'PNG is among those who have the world's last pristine tropical forests with a rich bio
diversity of flora and fauna. It has the fifth largest remaining tract of rain forest with
unique and diverse plants, wildlife and its ecosystem is being destroyed' (Greenpeace
International Pacific Campaign, 1996, p.21). This exploitation leaves its impact on the
forests and wildlife, the environment and the people.
Environmental degradation from logging has the worse effects of all MNC activities.
Besides destroying the forests and its rich wildlife, illegal logging, the clearing of areas of
forest for access and road construction have destroyed the area by causing soil erosion
even along the river banks. Wildlife is driven away by noise and air is polluted from
emissions. Such logging affects the people who rely on the forests for their livelihood as
well as destroying the landscape. Indigenous people have been displaced because their
hunting grounds have being disturbed and the wildlife driven away by the logging
activities. Fertile land for gardening is destroyed by new roads being built for logging
access and erosion occurs along the roads. In some places, the source of domestic fuel is
being reduced by logging companies which do not practice reafforestation. This is partly
due to the deficiency of the forestry legislation which does not have any reafforestation
57
requirement for logging companies. 'Drinking water is contaminated from the sawdust,
oil, fuel and toxic preservatives such as arsenic, chromium, boron and dieldrin used for
dipping logs' (Eaton, 1986, p.166).
From this brief discussion, it is noted that logging impacts on both people as well as
fauna and flora. Logging operations drive out species even to extinction and displaces
people whose livelihood is affected. Therefore, there can be no better contribution to
preserve the resources of PNG than to draft a policy to monitor (Greenpeace
International, 1996) and control degradation. This study suggests environmental
disclosure is one way to enforce the compliance of such a policy.
2.4.2.2 Mining Industry
Environmental degradation caused by mining is one of the adverse effects of the MN Cs.
The environmental issue first surfaced from the mining operations on Bouganiville. The
flow-on effect affected the Ok Tedi and even the Pogera mines. This section discusses
the general impacts and makes specific references to the Ok Tedi and Pogera mines. It
also points out that this thesis considers the Australian MNCs failure to implement
ICME principles as a loophole that the MNCs exploit.
Like the mmmg industry, raw material seekers also exploit and degrade the
environment. A 'typical mine development in PNG results in forests logged, roads,
tunnels/pits built and tonnes of mined rocks/dirt dumped into rivers used for drinking and

58
washing, as well as obstructing boats/canoe transports. Poison from heavy metal released
from mining activities such as cyanide, poses risks to people, animals and plants'
(Rosenbaum, 1995, p.37). Consequently, notable disasters have occurred in PNG from
MNC operations. For instance, the Paguna mine on Bouganville (PNG) was dumping
600 million tonnes of tailings into the Kaverong and Jaba Rivers before the mine closed.
This dumping destroyed aquatic life and affected villagers along both rivers and is
believed to be a contributing factor to the current Bouganville crisis (Young, 1992).
Similar environmental degradation has been experienced at other mines such as the Ok
Tedi. Eaton (1986), traces the pollution in the Fly River area back to the period before
the mine began dumping its tailings. Pollution began when a barge carrying a
consignment of 2700 sodium cyanide capsized at the mouth of the Fly River in 1984.
The sodium cyanide spill affected both marine life and those who rely on it. The killing of
1500 fish was reported around the site and there was an unsubstantiated report of some
villagers dying from eating poisoned fish. This incident affected 4,200 people who
relied on the river for sustenance. Their source of fish and other protein was polluted.
Therefore, the villagers were fed by the provincial government at the cost of $A417,000
until the area was declared safe. Three weeks after the barge capsized, there was another
cyanide spill near the mine. Dead turtles were seen floating around the site of the spill
(Eaton, 1986).
When the Ok Tedi Mining Limited (OTML) began its operations, it impacted on the
environment adversely. ACF's (1996) report reveals that OTML's impact was severe

59
on the Fly River system. So severe was it that the first 70 kilometres of the river is
considered virtually 'dead' from the dumping. OTML drew severe criticism from the
International Water Tribunal (1993) for dumping its tailings into the Fly River. OTML
was also warned to cease operation unless it builds a dam and treats its waste.
Rosenbaum ( 1993) reports OTML did not comply even though its own research
confirmed the reduction in fish biomass. Its impact on both the aquatic and terrestrial
ecosystem is indisputable. However, the company denies that its mining operations have
adversely affected the Fly River estuary.
2.4.2.2.1 Ok Tedi River-Toxic for Human and Aquatic Life
OTML' s claim that its activities were not degrading the environment was refuted by
Kreye and Castell (1991) after conducting a series of ecological tests . Lutz Castell, a
scientist from the Stanberg Institute (Germany) compared samples from fourteen
different sites along the river before the mine was opened and again after the mine
opened in 1990. He found concentration of iron, manganese, zinc, and lead content to be
200 times greater than that of arsenic and the turbidity is about 100 times greater.
Copper content alone was 1000 times higher than before the mine was opened.
Castell then compared the Ok Tedi river to the Rhine River (Germany) at the height of
the Rhine's pollution period. The following is a comparison of the degradation of Ok
Tedi with the Rhine river:
1. Zinc level was 20 times higher,
60
2. Cadmium was 10 times higher,
3. Copper was 170 times higher and
4. Lead was 50 times higher.
He concluded that the arsenic content alone constituted the entire Ok Tedi river too
toxic for human and aquatic life. Concentrations exceed the maximum for drinking and
for aquatic life from three to thirteen times. Castell also noted that limits for copper in
the rivers were four times higher than limits permitted by the European Community"
Directive. As one senior mining officer confided to Castell and Kreye, mining in this
form would not be allowed in either Australia, US or any of the western world
(Castelland Kreyer, 1991). This is a serious revelation but the mine continues to operate
and degrade.
To deflect the negative reactions from Castell ' s report, OT.ML management claimed that
the height of Ok Tedi and Fly rivers will return to pre-mining levels within 20 years of
the mine' s closure and nature will recuperate. With a mine life of 30 years, this
represents 50 years of disruption (Rosenbaum and Krokerberger, 1993). Recovery of
fish stock will depend on continuous reproduction in the flooded wetlands to recuperate.
Nevertheless, these wetlands are in danger of being contaminated by the copper so the
fish face a grave danger of extinction (Rosenbaum, 1995) and may not recuperate and
return to pre-mining levels.

61
The destruction caused by the dumping into the Fly river system raises the question of
how seriously Australian Ecological Sustainable Development (ESD) Recommendation
63, is actually applied by Australian MNCs. This ESD recommendation requires:
'that Australian Mining Companies with operations Overseas endeavour to
operate to at least Australian practices and standards of environmental
management, in a manner which respects local environmental values and
cultures and provide appropriate returns to the economy in which they operate '.
ICME Principles
The ACF believes that BHP which is a member of ICME, should apply the charter's
environmental principles. ICME principles require mining companies to :
1. meet all applicable environmental laws to protect and minimise environmental risks
2. review the effects of each activity to reduce adverse effects
3. employ risk management strategies in handling and disposing of wastes
4. conduct regular reviews and act on results (ICME Charter).
If these requirements were conscientiously implemented, then the above problems
would be minimal.
2.4.2.2.2 Pogera Mine
Environmental destruction is not confined to the Fly River alone. The Maiapam
Strictland rivers are also affected. While OTML is causing environmental destruction
along Fly River, similar problems are being encountered in Enga. Simultaneous Ok

62
Tedi is pumping 80 000 tonnes daily into Fly river while the Pogera Joint Venture (PN)
which involves two Australian companies (Mount Isa Mines Ltd and Rennson
Goldfields) releases 11 000 tonnes of tailings daily into the Pogera river which
eventually comes out to the Papuan Gulf into the Torres Strait Islands. Along with rock
waste are heavy metals, ferro-cyanide complexes, arsenic and jarosite.
'The company's monitoring system is infrequent so that it is not impossible to detect
accidental discharges of cyanide, heavy metals or alkaline. At various sites downstream,
the zinc, lead and mercury presence is 3-3000 times the Australian or even PNG
standards' (Rosenbaum, 1996, p.18). Under the 'Responsible Care' principle of the
Australian Chemical Industry Council (ACIC), waste should be monitored at the point of
discharge. It should be done frequently enough to detect and rectify the problem within
hours of any poisonous discharge (Rosenbaum et al, 1995).
Present reports of the Pogera mine highlight its adverse impact with fatal consequences.
For instance, the Sydney based Mineral Policy Institute has recently detailed up to 13 3
unusual deaths reported by local administrators around the Pogera mine zone between
1991-1993 . Locals believe these deaths were caused by the contamination of water and
riverside gardens, despite claims by PJV of establishing an 'excellent environmental
· protection' . 'Dr. John Konga confirmed a death at Sopas Adventist Hospital which he
believes could have been caused by arsenic poisoning (Kennedy, 1996, p.22). The
question is whether PN's excellent environmental protection' and arsenic poisoning
from contamination are compatible. A recent Commonwealth Scientific and Industries
Research Organisation (CSIRO, 1996) study, on the environmental impact by the Pogera

63
mine noted that PJV was merely complying with regulations. There was no extra effort
to exceed the minimum requirement.
Following these reports, the ACF and several other Australian Non Government
Organisations (NGOs) are reported to have called for an inquiry into PJV's operation.
This was to review the tailing management, independent oversight of the mine's
pollution monitoring, mitigation of environmental impacts and fair compensation to the
affected communities. The PNG government was silent because of a conflict of interest.
The state cannot be an independent arbiter when it holds equity in large projects which
leaves the country open for exploitation (Rosenbaum and Krokerberger, 1993). Like Ok
Tedi, this call by the NGOs had a minimal effect, if any.
Despite the above cited problems at Paguna, Pogera and the Fly river from mme
dumping, only two mines (Pogera and Tolukuma) are currently practicing a limited
amount of backfill while the rest continue to dump tailings either in the sea or river
systems (Table 2-4). Current mine disposal causes adverse impacts and affects many
communities. Damage from riverine disposal spreads beyond the mine sites (AusAid
Report, 1996). Ignoring the impacts to correct later will be both disastrous and
expensive as the Philippine's experienced shows (F erreria et al, 1993). Worse still are the
fatal consequences which are irreversible. This is where highlighting the adverse impacts,
shown in this study, is vital to support a call for immediate action.
64
Australian MNCs Pledge Environmental Care in Asia
Although the Saulwick Poll conducted in March 1994, indicated that the majority (2: 1
or 57 percent to 33 percent) of Australians believe that environmental protection has a
higher priority than economic growth (Rosenbaum, 1995), Australian MNCs engaged in
large projects in PNG do not have the clean records they claim elsewhere. A survey
sponsored by the Prince of Wales Business Leaders Forum (1994) studied activities of
Australian MNCs in Asia. Eighty percent indicated that they would be as careful as, or
more careful, about environment in Asia than in Australia. If Australians rate
environment protection as a high priority and MNCs are extra careful in Asia, then the
Australian MNCs need to demonstrate that claim in PNG. Alternatively, if they disclose
their overseas operations truthfully in their annual reports, their shareholders might
influence them to act honourably which is the intention underlying this study.
2.4.2.3 Manufacturing
There have been recommendations that PNG should become involved in downstream
processing in order to diversify its sources of revenue, as well as minimise the foreign
exploitations, such as transfer pricing. Presently, PNG relies heavily on the export of
primary products which are subject to world price fluctuations . These have been
countered by the establishment of several major projects such as the veneer factory
because the allegation of price transfer is forest related. The impacts are yet to surface
and, what follows below does not contain any environmental degradation reports.
65
In contrast to the MNCs in the other three industries which are raw material seekers,
MN Cs in manufacturing industries are out to minimise the cost of transport and evade
trade restrictions. This is evidenced by the same overseas suppliers establishing
manufacturing plants in PNG, as cited earlier in the meat cannery example.
While the focus is on the current controversial industries-logging and mining, oil & gas,
manufacturing industries can also pollute the environment as shown in the Philippine's
experience above. Manufacturing industry degrades the environment, especially the
marine life from factory waste disposals. Fortunately the manufacturing industry in PNG
is very small, mostly to meet local market needs with minimal environmental effects but
there is no empirical work available to support or refute this. Areas of manufacturing
industry include food processing, beverages, tobacco and timber. It has not shown much
growth since independence and the high wage structure is blamed for its dismal
performance (AusAid Report, 1995).
This is likely to change with the establishment of major projects such as fish canneries in
Lae, Wewak and Madang; a meat cannery Port Moresby, Lae and Madang; a cement
factory in Lae and the Jant Chips Mill in Madang. Work has begun on oil and LPG
refineries planned for the Central Province. Between 1992-1995, I 07 applications were
received for manufacturing. This is the third largest applications received by an industry
in the period (Table 2-5). As these and other projects in other industries are established,
environmental impact will be inevitable. Rather than take a reactive approach, the
government should take a cautionary approach to ensure environmental plans are
66
incorporated in the proposals to prevent environmental impacts. Both manufacturing and
oil & gas are included here because they have the potential to degrade. It is a proactive
approach to mitigate an envisaged environmental degradation as reviewed in other
developing countries.
2.4.2.4 Oil & Gas
The current focus on environment issues is focussed on the mining and forest industries
but oil extraction can be just as destructive because land is cleared for drilling and the
laying of pipes to transport crude oil down to the Papuan Gulf Clearing activities
destroy flora and fauna. In recent years, more gas and oil wells have been commissioned.
Although some oil fields are already producing crude oil and gas, there are a few minor
complaints on environmental damage. This does not mean that the MNCs involved are
innocent, because there are possibilities of oil spills and gas fires, but their nature of
extracting is such that it does not require much excavating, therefore, there is little waste
for dumping. However, it is too early to draw any conclusion on environmental impact of
this industry because the limited studies referred to above were done when concerns
were raised on environmental damage in the forestry and mining industries.
Such adverse impacts caused by MNCs should provoke public outcry or protest but they
have not. A lot has to do with lax regulations by the government for the MNCs entry and
operations because MNCs are embraced as engines of development. The state has a
conflict of interest and cannot arbitrate in issues affecting large projects where its
67
interests are at risk. Further, these projects not only have state investments but earn the
state much needed revenue, reduce unemployment and give a host of other benefits. Only
a few concerns were raised by those directly affected . at different times and in different
locations. Those who protest are parties who are concerned about guarding their
resources more than their environment. This study is a subtle approach which the state
can implement to ensure MNCs practise sustainable usage or resources and minimise
impacts.
2.5 Summary
This chapter discussed the concept of what MN Cs are and their main features of identity.
Their categories of entry were also observed. MNC oper'ations were also covered in an
attempt to identify the adverse impacts which MNCs are causing and contrasted these
against the benefits derived. It is established from the literature that environmental
degradation is severe in the forests and mining industries. The mining industry is causing
fatal impacts. Although there are some benefits from MNCs, they are offset by their
adverse impact. Having established that MNCs cause adverse impacts, the next step is to
ascertain whether these impacts should be disclosed in their annual reports to expose
, them. This is considered next in chapter 3.
68
Chapter Three
Environmental Disclosure
3.1 Introduction
The literature, reviewed in chapter 2, established that MNCs in PNG have an adverse
environmental impact. Although MNCs bring benefits to PNG, the adverse impacts they
have more than offset these benefits. Since the general context of this study is to seek
ways to monitor and control the adverse impacts of MN Cs, in this chapter it is proposed
that MNCs incorporate environmental disclosure in their annual reports. The
environmental reporting will act as the medium of exposure to interested parties such as
shareholders, ethical investors, environmentalists, employees, customers and others who
read annual reports, the adverse impacts that the MNCs have. Such exposure may exert
pressure on the MNCs to reduce unethical practices and thus minimise the adverse
impacts. This chapter reviews the literature on environmental disclosure in annual
reports and suggests two approaches to promote environmental disclosure among the
Australian MNCs in PNG.
Purpose of Chapter
After a review of the adverse impacts caused by MNC operations in PNG, the next step
is to seek for possible solutions. If the current rate of resource usage continous and the
environmental degradation is unchecked, no sustainable development will be possible in
the future. PNG is currently facing an impending disaster. The trend needs to change
before PNG reaches the point of self destruction as Goldsmith et al (1972) predicted.

69
This is the main argument behind the accounting proposal to control any adverse
impact. Other forms of control cannot be effectively policed, as was pointed out in the
previous chapter.
Structure of the Chapter
The chapter commences with a definition of environmental accounting. While there
are various definitions of accounting, for the purpose of this thesis, Gray et al ' s (1993)
definition will be adopted. This is because there are no guidelines from the state or the
accounting profession on what should be included under social reporting (including
environmental accounting). What is currently reported in annual reports is voluntary and
largely depends on the discretion of the management. Gray et al' s definition is wide and
embraces all expected features of environmental disclosure in this thesis.
The rest of the section is organised as follows : Section 2 establishes the groundrules for
environmental management and reporting. Environmental management is defined to set
the boundaries of the topic discussed. Environment policies, adoption, implementing and
monitoring against possible conflicts/hindrance and legislation.
· Sections 3 discusses global development of environmental disclosure because it is a
global issue. This study observes global developments to learn how different countries
approach the issue. Some countries are advanced in their handling of the issue while
others are still discussing possible approaches to implement its, including green
accounting. There are differences in what constitutes green accounting due to
70
disagreements on what to report because as pointed out above, there are no accepted
guidelines. Therefore various countries have approached the issue differently.
An extended observation is carried out on developed countries such as the US, UK and
Canada in section 4. These countries are chosen because their MNCs operate in PNG
and they (especially the US) are advanced in developing various strategies and legislation
to address the environmental issue. The main benefit of studying these is to establish
how they handle environmental issues. Such knowledge will assist this study to formulate
practicable solution(s). Companies from Europe including the UK are reacting to
environmental issues pro-actively (Kestigan, 1991). The section also covers the
challenges of motivating MNCs to disclose fully . There will be better cooperation
provided, it is thought, if the MNCs are informed about the benefits of environmental
disclosure.
Discussion on developments in the US, UK and Canada will represent those of the
developed countries. This is necessary because these countries have developed
environment management and reporting systems which will become models for this
study. Environmental disclosure in these countries should be reflected by their MNCs in
PNG. Throughout the analysis of the developments, constant reference will be made to
its application among the Australian MNCs in PNG to address its environmental
problems.
71
Australia is considered separately from the other developed countries m section 5
because the focus of this study centres around Australian MNCs in PNG. Already
pressure is mounting on Australian MNCs to incorporate and report on environmental
issues. Currently environmental reporting is voluntary in Australia, but that is likely to
change. The Australian commonwealth government has introduced green accounting and
a professional body is preparing a conceptual framework along with guidelines to assist
their members meet the demand. Developments in Australia ought to influence their
MNC's disclosures. Such developments will assist this thesis in assessing the viability of
the proposed environment reporting to remedy adverse environmental impacts
experienced in PNG.
In the final section ( 6), the need for environment reporting in PNG is emphasised as the
basis for recommending an accounting solution. Although it is a timely study, this section
warns of dangers of overreacting or taking drastic actions because it will compound
rather than alleviate the current problems. Eco-audit and an Award system are
recommended to promote environmental reporting among MNCs. In this chapter, two
hypotheses will be incorporated which this study will test in the main analysis (chapter
6). The hypotheses test the current disclosure trend among Australian MNCs to
substantiate the suggestion of environmental disclosure as a strategy to address the
environmental issues in PNG.
72
3.2 Environmental Management and Reporting
This section commences with definitions of environmental management and accounting
in order to establish a groundwork. To report on environmental impacts, the
environment must be first managed because adverse impacts are the results of unchecked
economic activities. Problems like ozone layer depletion, soil erosion, water and air
pollution, loss of wildlife and deforestation are evidences of an imbalance among the
economic sub-systems. This section then discusses conflicts over social disclosure,
environmental policy development, adoption/implementation and monitoring, and
concludes by noting perceived hindrances that prevent environmental disclosure.
3.2.1 Environmental Management & Accounting
In order to rectify the problems listed above and restore the balance among the economic
sub-systems, corporate managers have to fully incorporate concerns for the natural
environment into the decisions they make. This is possible if they work within a
framework of decision making which is both economically successful and
environmentally sustainable. Sustainable strategies generate more revenue while
minimising costs which are crucial to restoring a balance between ecosystems and
economic systems (Warner, 1996).
Gray et al ( 1993, pp. 6-7) define environmental management to include 'a range of
responses by companies to environmental issues in reviewing their environmental
73
position, developing and implementing policies and strategies to improve that position
and in changing management systems to ensure ongoing improvement and effective
management' . The functions covered under the environmental management are
environmental reviews, policy and objective development, life cycle assessment,
standards-BS7750, eco-audit, ISO, regulations compliance, environmental assessment,
waste minimisation and research & development in cleaner technologies. Environmental
reporting is possible when environment management is sound and where the above areas
are accounted for because environmental accounting is a product of environmental
management. Hence, management can thoroughly report to interested parties if it
manages its environment.
The early literature like Mobley (1970), and Estes (1972), emphasised the need to
account for all costs of a corporation's activities. They argued that reporting only
activities with monetary value is narrow and is an inadequate measure of an entity's
impact on the society since it ignores the social factors . This is based on the grounds
that each firm is under a social contract with the community and that its activities are
constrained by concern for the welfare of the community (Ramanathan, 1976). A
corporation is accountable not only to its owners but to many other interested groups as
well (Bedford, 1973; Medawar, 1976). Despite this sound rationale for reporting, it is
only within the last five years that accounting for the environment has become
prominent. It is now taking a centre stage in the world-wide accounting profession
where environmental accounting is now seen as an essential element in an organisation's
environmental response (Gray, 1993).
74
3.2.2 Conflict over Social Disclosure Legislature
There is one setback to progress where accounting is taking a centre stage. This setback
results from conflicting views on legislature for social disclosure. While there is high
public demand for environmental information, there is some reluctance on the part of
accountants to disclose (AICA, 1998). There is some degree of uncertainty among
accountants over their roles and duties in reporting environment performance. This
uncertainty is due partly to the lack of logically derived concepts to use in reporting
(AICA, 1998). This prompts some to favour government legislating a standard set of
minimum disclosure requirements (Gray et al 1987, 1988 and Gray 1991), but others
like Parker (1986, 1991) claim that accounting standards contain enough requirements
and further legislation is unnecessary.
The call for legislation is further supported by Tilt' s ( 1994 ), evidence. Ninety-two
percent of respondents, the majority of whom are environmental groups, felt further
legislation is necessary. They maintain that current disclosure is deficient. Their argument
is that more legislation will increase environmental disclosure. These groups are key
users of environmental reports and argue that standards are needed to ensure companies
disclose relevant information. To give an environmental report credibility, the report
ought to be audited. (Eco-audit is one approach recommended in the final section.)
Although political solutions are not always the best, in the absence of legislation
polluting firms will continue to pollute and destroy the environment (Chapman and
75
Barker, 1991). Given the environmental impact in chapter 2, environmental disclosure
legislation is necessary to encourage sustainable development. The proposals of the
Eco-audit and the Award system are to promote the overall objective of minimising
environmental impact through disclosure. Eco-audit ensures compliance and full
disclosure while the award system both challenges all to make an effort and rewards
those who exert extra effort because current accounting requirements caters only for
extractive industries only under AAS 7 and AASB I 022. Since there are different types
of industries, each should be guided by specific disclosure codes. Better still, the
requirements should be standardised to avoid creating loopholes. Especially, when there
is significant resistance to developing legal requirement for financial accounting and
reporting (Gray et al,1993).
It is anticipated that the above conflict over environmental reporting will be solved
with the guidelines or standards which the AICA ( 1998) is developing to facilitate the
measurement, reporting and auditing of an environmental performance report . Unlike the
other accounting standards, which were derived from a piecemeal approach,
environmental reporting guidelines are being developed more systematically. A
conceptual framework is being developed which will provide guidance on the roles and
duties of accountants of environmental reports (AICA, 1998). With such provision of
guidelines, more and better environmental reports are anticipated.

76
3.2.3 Environmental policies, adoption, implementation and monitoring
The counter argument to legislation is that fewer probing questions will be raised if more
information is disclosed as RTZ experienced in their 1996 annual meeting cited below.
Such full disclosure is possible if MNCs conduct regular environmental impact
assessment, (EIA). However, before an EIA can be carried out, an EP must be
implemented. The assumption here is that the MNCs in PNG are not implementing their
EPs because if they do, then the adverse impacts would be minimal. There are various
stages of implementing EPs.
Elkington (1989) has an expanded set of steps known as the 'ten steps to environmental
excellence' . The ten steps are:
1. Develop and publish an environmental policy
2. Prepare an action programme
3. Arrange organisation and staffing including board representation
4. Allocate adequate resources to implement policies
5. Invest in environmental science and technology to overcome obsolescence and/or
inefficiency
6. Educate and train personnel
7. Monitor, audit and report to shareholders
8. Monitor the evolution of the green agenda
9. Contribute to environmental programmes and

77
10. Help build bridges between the various interests9 to maintain good
relationship
Gray et al ' s ( 1993) summarised implementation and management of EP into six stages.
These are:
MNCs first need to assess the impact of their activities. This, MNCs would have done
before they lodged their development proposals.
1. Their assessment should contain policy statements and guidelines of how the impacts
will be monitored.
2. Then develop behavioural objectives to implement their respective plans of action. It
will only succeed if environmental plans are approved by the entity's board and
everyone is actively involved. Key personnel who must be active participants are the
Chief Finance Officer and an environmental board member who will lead out.
3. Implement the plans by delegating responsibilities to different officers
4. Regularly carry out an environmental impact assessment
5. Disclose reports of assessments carried out in 5. to the public. To give such report
credibility engage auditors to certify them.
Both approaches of implementing EPs outlined above begin with policies emerging from
likely impact of corporate activities. That is what an EP should be, a proactive strategy
to contain the impact. Most MNCs develop basic policies and add to it depending on the
demand of the society they are in. Their level of commitment varies with the local
9 Source: The Green Capitalists as adapted by Gray et al 1993, 44
78
environment which creates inconsistencies. Very few accept world standards for fear of
committing themselves too much. As one company official admitted, 'they do not know
what environmental standards are applied by their subsidiaries' (Gray et al, 1993).
Three separate surveys10 reveal that up to the end of the last decade, less then 40 percent
of companies disclosed environmental policies. The UNCTC survey of 222 world wide
companies revealed only 39 percent had environment policies. Roberts (1991) surveyed
110 European companies and found only 30 percent had environmental policies. Of the
670 UK company reports analysed, only 5 percent had environment policies. Therefore
there is a need to promote environmental policies as a proactive approach to minimise
environmental impacts because policies have to be in place for implementation to take
place.
Adopting and implementing policies are only a beginning. These policies ought to be
regularly monitored to ensure their effectiveness. This is because 'all aspects of a
company's operations, from accounting and purchasing, to product design,
manufacturing, sales and marketing and distribution, will have an impact on the
environment' (Business-in-the-environment, 199la). Therefore each company should
embark on environmental policies that permeate all its operations. This promotes good
public relation (PR) from the outset.
16 All from Roberts (1991) Company reporting and UNCTC papers

79
Of those who implement policies, there are certain constrains which cause deficiencies in
reporting. The main ones are environmental costs and concern. These become the major
ingredients in the enterprises' investment decisions. It was revealed in an earlier,
(environmental accounting), survey by Nikolai, Bazley and Brummett (197 6) that
accounting systems identify and emphasise costs more than the benefits, thus
discouraging the adoption of environment accounting. Since then a lot of investment is
going into improving environmental accounting. The current message is that benefits are
exceeding costs, so much that those who invest in environmental accounting are
excelling over their opponents (Eco T ec, 1991).
Cost is a minor issue if environmental aspects in an investment proposal are considered.
Environmental costs include regulations for clean up with allowances for waste disposal,
and controls. Many of these cannot be ignored because they can add up to crippling a
business even when only a PR is affected. Even banks consider environmental issues as
part of their collateral (Houldin, 1993). This can be contrasted with benefits such as
savings on litigation charges if environmental impact is accurately assessed. Equally
important are non-financial benefits such as the protection of habitat, the ecosystem and
the MNC's good reputation.
Disclosure requirements of environmental information began with information on the
potential hazardous chemicals under Seveso Directive (1974). The focus has since widen
to include fauna and flora (Woods, 1994). This is due to demand from a wide range of
interested groups. The focus of reporting widens to include such issues as movement of
80
waste, vehicle emissions, protecting the ozone layer, hazardous waste incinerators, trade
in endangered species and climate change (Gamble, Hsu, Jackson and Tollerson, 1996).
Catering for such a wide range of interested parties compounds the enterprises' dilemma,
but it does not mean they are insurmountable.
The Intergovernmental Working Group of Experts on International Standards of
Accounting and Reporting (ISAR) have all addressed the wide range of environmental
issues and conclude that environmental disclosures are important to both internal and
external users (Gamble et al, 1996). This confirms Anderson and Frankie's (1980)
discovery that firms which disclose social information out perform those which do not.
That is why it will be in the MNCs best interest to produce environmental reports,
unfortunately not everyone perceives these internal benefits.
Gilkson ( 1995) classifies benefits into four main areas. Environmental reporting :
1. will improve an entity's PR and enable it to gain market advantage~
2. will get a corporation into the practice of disclosing & makes it easier for it to adapt
because some countries require compulsory disclosure;
3. changes attitudes to use/misuse of natural resources to promote sustainable
development which eventually leads to~
4. environmental excellence where businesses become efficient because pollution
equates to wastefulness.

81
Other industrial benefits are discussed below from the expenence of developed
countries which implement environmental disclosure. Prior to this, a brief mentions of
factors that hinder current environmental disclosure.
3.2.4 Hindrance to Environmental Disclosure
Environmental reports up to this point (1995), has been the corporation's privileged
document (Gilkinson, 1995). This present study is suggesting they should face public
exposure. Once corporations start disclosing, 'increasingly sophisticated and better
informed customers will start asking probing questions', says New Zealand's
environment minister-Simon Upton (1995). This is illustrated by RTZ's Annual General
Meeting in London May 1996. Shareholders walked out when the Chairman, Derek
Birkin barred further questions from the floor about environmental activists attempting
to storm the podium over 'RTZ's crime against the planet '. The Chairman then used the
proxy votes of 3 54 million shares out of 3 5 5 million to quash campaigns for extended
. 11 questions .
Until recently, very few companies made environmental disclosures. Bebbington and
Walter ( 1993) highlight two main reasons for this. First, only certain aspects of social
disclosure are demanded by legislation. That is why, although social disclosure laws urge
corporations to disclose, not everyone complies (Epstain and Freeman, 1994 ). Secondly,
since social disclosure is voluntary, only a few shareholders demand it. The percentage of
shareholders demanding environmental reports have since increased as Tilt' s (1994)
11 Land Rights News Vol. 2, No. 39, July 1996, p. 8

82
survey shows. The Environment Accounting Task Force (EATF) found that only 25
percent of Australian MNCs currently disclose environmental information although two
thirds of users seek it (AICA, 1998). The difference is a surplus demand for
environmental information against a shortage of reporting.
It now appears that the social disclosure requirement will expand to encompass
environmental disclosure whereby environmental information will no longer remain the
company's privileged document. The environmental reporting requirement covers a wide
area with compensating benefits. Since it is a global issue, the next sections will discuss
approaches in other countries in order to adopt appropriate strategies in PNG.
3.3 Global Developments of Environmental Reporting
Environmental disclosure guidelines are being developed (AICA, 1998) as a result of the
increasing demand for environment reports (EATF, 1996). Those industries who respond
to the demand are benefiting. The cotton industry (mentioned below) illustrates that
responding to social issues (including environmental) earns the entrepreneur financial
rewards. This section briefly traces the development of environmental reporting on a
global scale which will eventually encourage, if not challenged Australian MNCs to
overcome their reluctance to report environmental issues. General environmental
reporting developments on a global scale will be discussed in an attempt to learn from
their experiences. This study is attempting an inductive approach. It is useful to
compare developments of environmental issues reporting in developed countries such as

83
the US, UK and Canada, before concentrating on developments in Australia highlights
the need for an environmental disclosure requirement.
3.3.1 Challenges of Environment Reporting
According to the ICAE (1992), environmental issues pose three major challenges to the
development of environmental accounting. There is, first of all, a need to integrate
scientific and technical environmental information with financial information in matters of
expenditure, liabilities, asset valuation and future profitability. Next, is the question of
where to place environmental information in the annual report. A third related issue is
whether the current accounting policies are sufficiently distinctive to require separate
disclosure.
Integration of Environment and Finance Information
Vint en ( 1993) argues that traditional accountancy will only make substantial
contributions to green accounting when its assumptions and boundaries are defined. As
an example, the author cites the Going Concern concept which implies continuity for the
organisation over an indefinite period. Therefore threats of environmental impacts
caused by pollution against an organisation which is meant to continue indefinitely is not
traditionally catered for. Vinten (1993) presents two alternatives solutions. The first
alternative is to incorporate environmental information in the traditional accounting

84
framework. Such incorporation does not require much change. Therefore this approach
is likely to be adopted. The alternative approach is to consider the environmental issue
important enough to disclose it separately. The Asia-Pacific leading gold miner, Placer
Pacific ( 1997) claims to be the first mining company to provide such a separate
environmental report . Extra cost is required to integrate scientific and technical
environment information with financial information. Vintem ( 1993 ), prefers the later
approach although it is costly because key environmental information gets reported in
the accounts which are scrutinised by most readers in annual reports. The author adds
that it is unfortunate that most companies treat key environmental information as
common news and place it in the least sought places of annual reports. Worst still,
material information is omitted and the public is deprived of essential information.
These three problems the ICAE ( 1992) highlighted are being addressed by AICA. AICA
( 1998) is developing a conceptual framework, to provide guidelines for disclosing
environmental disclosure. These guidelines will enable correct classification and
reporting. AICA is beginning with a conceptual framework because previous standards
were developed in a piecemeal manner (AICA). When these guidelines are in place, then
it will be easier to report environmental information. The next concern is what to report
as accountants will have guidance and direction on where to report it .
85
3.3.2 Where to report
Although Corporate Social Disclosure (CSD) has been the subject of research to
address various issues, there is little coherence in the results. While the guidelines are
being developed, there is no agreement on what to report. Gray et al (1995) blame the
inconsistency on the fact that the subject is not enshrined like the Companies Act.
There is no legislature requiring environmental disclosure. That is why CSD is either
voluntarily reported in the annual reports or reported elsewhere by a third party. Even
the provision of guidelines by the accounting profession, such as the AICA, does not
guarantee complete environmental disclosure because CSD is voluntary.
In the meantime two approaches are being used in Europe to report environmental
impacts. The first is the eco balance sheet approach developed in Austria and Germany
(Jasch, 1993; Jorgensen, 1993). This approach traces all inputs and outputs including
emissions and wastes. It is proving very useful for internal management as well as
external accountability and transparency (Gray et al, 1993). The second approach is
based on the value added system which deducts an estimated environmental value lost
(Gray and Symon, 1992b). This was developed by a Dutch company which attempted to
integrate financial and environmental reporting. The concern here though, is the accuracy
and validity of the measurement of value lost. These two approaches might work for
manufacturing entities in PNG but would be difficult for other industries such as mining.
86
Irrespective of approaches employed for treating environment information, annual
reports are the principal source of financial information for interested parties (Neimark,
1992; Hines, 1988). Therefore it should contain all relevant information for the
interested parties so they do not have to seek other sources. After all, an annual report
ought to disclose all information as the General Purpose Financial Report (GPFR)
should. This is because all forms of data reaching the public can be considered as part of
accountability- discharge activity (Zeghal and Ahmed, 1990).
3.3.3 Separate Reporting
Roberts ( 1991 ), points out from the two European approaches that most sensitive
sectors needs honest disclosure. While annual reports are 'One stop shop' for all
integrated information, environmental issues are best reported on a site by site basis
(Owen, 1994). Although it is costly, it will project the genuine position of the
organisation. This practice also satisfies individuals who may be interested in single
projects or sites. There is also a potential clean up cost by the owner or occupier of the
contaminated site in reporting on a site by site basis. (The clean up cost applies in the
US.) This is irrespective of whether the occupant caused it or not (Resource
Management Act 1991, ss. 322(b)(iii)). Clean up cost is best illustrated by the Love
cove case of New York. When Incidental Oil acquired the Hooker Corporation, it
became liable for a $250 million clean up bill from Hooker's operation. The cleanup cost
only surfaced after the take over.
87
Where a corporation like Incidental Oil is required to meet the clean up cost, investors
see potential liabilities. This constitutes uncertainty because their investment faces a risk.
Investors will naturally be interested in anything that increases their return while
minimising potential risks. An item that causes investors to revise their investment is said
to be of information content (Gonededs, Dopuch and Penman, 1976). Although
environmental information is information content as Incidental Oil experienced,
companies either omit it or report it in the least sought places in the annual reports .
Part of the reason for such company action is that practical accounting has a narrow
view. It consists of compliance and control with a focus on prescribed rules about
organisational activities (Williams, 1987). Thus reports reflect only compliance and
controls. The underlying reason in reporting should be to provide information for
decision making that also satisfies accountability to all parties. That is why Rawls (1971)
argues that voluntary self-interest reporting will not achieve optimal outcomes. His
argument is that accounting is a moral discourse based on social justice.
The social justice concept is further developed by Chen ( I 97 5) who includes the
concept of stewardship. He contends that a firm's management is not only the steward
for its owners but also of employees, customers and society as a whole. Therefore any
information that impacts on other entities or society ought to be reported. Bean and
F etig ( 1971) who were among the first to suggest that accounting should measure and
report the impact as well as the cost of pollution.
88
How to get every MNCs Ticking
To entice those MNCs who are not complying with environmental reporting
requirements, the European Union (EU) has introduced an Eco-Management and
Auditing Scheme Logo. This logo will be awarded only to those who exceed the
established standards and excel in their economic management. The logo is a prestigious
symbol of environmental excellence and those who attain these awards will display them
_on their premises (Willits and Mitl, 1996).
A major component of the European Union's (EU) Environmental Management and
Audit Scheme (EMAS) adopted in 1993, requires companies to make information about
their environmental performance available to the public. This information is to be in a
concise and comprehensible form. Furthermore, it must be externally verified (Barnes,
1994). EMAS began as a voluntary action to progressively improve environmental
performance and provide information to the public. Unfortunately, corporations could
not see the benefits of complying and were sceptical over its use. Since then EMAS has
become an enforced regulation. The companies are now required to prepare and
present externally audited reports (Barnes, 1994). The Eco-Management and Audit
Scheme Logo is still being awarded to those who excel in their reporting. It is one of the
contributing factors to the recent surge in social accounting.
89
3.3.4.Factors contributing to the Surge in Social Accounting
While various attempts are made to encourage reporting, four factors contributed to the
surge of the social accounting in the 1990s. Gray et al ( 1993) attribute the surge to :
1. The concern about greed of entrepreneurs. It was reasoned that accounting should
not be a tool for assisting greedy entrepreneurs but rather hold them accountable.
2. A rise in public interest and awareness among academics to develop social
accounting. For instance, there should be research to seek solutions for problems
such as those raised by Vintem (1993) .
3. A surge of alternative/unsustainable economic activities. The previous chapter (2)
covered unsustainable rates of resource usage.
4. The launching of environmental accounting has seen a corresponding increase in
regulations on disclosure of environmental issues .
EATF (1996) and Trevor and Frost (1998) have confirmed that there is surplus demand
for environmental reporting. However, the urge to supply environmental information is
minimal or lacking (AICA, 1998). This creates a problem on how to get all MNCs to
disclose environmental information without legislation. The Financial Sector Working
Group of the Advisory committee on Business and the Environment's report (February,
1993) shows that the public is not satisfied with the lack of development. Public
pressure is gaining momentum to force corporate bodies to report environmental
information. There is a desire among the public to make all compames publish
environmental reports. Such a development would mean standards and legislation may

90
also be necessary (Owen, 1994). The Business Advisory Committee Report (BAC,
1993) recommends that accountancy and insolvency professionals should provide
guidance and input into developing legislation/regulation on environmental issues
affecting accounting matters.
The BAC recommendation is timely because the increase in environmental awareness is
pressuring organisations to account publicly for their activities and their impact on the
environment. To promote environmental disclosure, eco audit and the award system as
used in Europe seem effective in responding to current public demand. An
environmental audit is a monitoring technique used to ensure corporations comply with
environmental protection legislation. It also ensures that what is reported is objective.
Goodfellow and Willis (1991, p.44) define environmental audit as 'a management tool
comprising a systematic, documented, periodic and objective evaluation of how
environmental organisations, management and equipment are performing.'
Goodfellow & Willis' definition of environmental audit is adopted by the International
Chamber of Commerce (ICC) working party (ICC, 1989). The objectives of
environmental audit is to help safeguard the environment by :
( 1) facilitating management control of environmental Policies and
(2) assessing compliance against company policies, which would include meeting
regulatory requirements. The reports can also be attested to verify its contents. Both
eco-audit and the award system will be adopted in PN G from this section and are

91
discussed in the last section of this chapter. This will be preceded by a discussion on
developments in other developed countries besides Australia.
It can be deduced from the global development that there is a public outcry is for greater
environmental information. Various attempts to response to this public demand is beset
by three vital questions: what to report (Content), where to report (venue of disclosure),
and how to report (standards and guidelines) ICAE (1992). These issues are being
addressed by different countries using different approaches. This thesis proceeds next to
analysis developments in the US, UK and Canada with the intention of adapting some of
their strategies to contain their MNCs.
3.4 Development in the US, UK and Canada
Developments of environmental disclosure in the US, UK and Canada are important
because there are MNCs from these countries among those causing adverse impacts in
PNG. For example, Placer Pacific is a Canadian company operating in a joint venture
with 2 Australian companies in the Pogera mine. While two approaches ( eco-audit and
award system) are selected from those used in Europe, environmental disclosure concept
must be sold to the MNCs in PNG to get quality environmental reports from them. The
emphasis here is on the benefits of environmental reporting to draw both quality and
quantity of reporting from the MNCs in PNG. This section discusses factors which
increase environmental reporting in the developed countries in order to adopt them in

92
PNG. The conclusion is that PNG cannot adopt all of the developed countries strategies
because it cannot afford to do so.
3.4.1 Survey of Current Reporting
The large surveys were carried out by Roberts (1990, 1991); UN (1992, 1993); and Gray
(1993) to keep abreast of global developments, reveal diverse results. These surveys
found that voluntary reporting is predominantly the practice of large l\1NCs.
Approximately 50 percent of large corporations disclose voluntarily but the percentage
decreases with size of l\1NCs. Currently environmental disclosure is by large companies
only (size effect),mainly for PR reasons with low quality reportage. For example,
Robert's (1991) survey disclosed that the majority of large companies' environmental
disclosures were mainly descriptive. Only 40 percent produced quantified reports.
There will be closer probing under 'Public has the Right to Know' if information is not
voluntarily disclosed. A company official reported that the political climate is changing
and unless they begin now, it will be a more painful exercise later (Gray et al, 1993).
Therefore, it will be to the corporation's advantage to voluntarily disclose environmental
information because legislation is being drafted.
The Tenth UN session (1992), survey of the World's largest companies reveals a strong
reluctance among large corporations to reveal environmental issues. The survey found
86 percent disclosing environmental data only, 40 percent provided environment related

93
financial data, 19 percent provided quantitative information on emissions and only 3
percent disclosed information on contingent liability. This survey contradicts earlier
discussions that environmental disclosure has size effect because even the world' s largest
conglomerates are reluctance to reveal environment information which might jeopardise
their own operation and survival.
In another survey, KPMG Peat Marwick (1992) specifically surveyed environmental
reporting practices of the top 100 companies in the US, UK and Canada. They found US
companies provide considerable more financial data then those of UK or Canada. This
is due to US companies being subjected to SEC regulations S-K relating to disclosure of
cost and expenditure figures . No country beside US uses its SEC to enforce standardised
requirements. The other two countries were not subjected to such regulations, therefore
their companies' voluntary disclosure was deficient.
Evidence from the UK' s reveals that the continuance to rely on voluntary disclosure may
prove inadequate. First evidence comes from surveys conducted by Tonking (1991) and
Kirkman and Hope (1992). These surveys found reports of medium listed and large
unlisted companies to be patchy. Only large listed companies fully disclosed
environmental issues. This confirms KPMG Peat Marwick (1992)' s survey result. A
further study by Tonking (1993) noted that although the number of organisations
addressing environmental issues is slowly increasing, the quality of disclosure in
providing specific details shows little improvement. Most UK disclosures were narrative
94
with only few producing systematic performance reports (Owen et al, 1992, and Gray
and Owen, 1993).
3.4.2 Quality of Environment Reporting
The UN survey (UN 1992a) of222 transnational corporations, found MNCs to be aware
of environmental issues but their disclosures were mainly qualitative, and partial. This
made it difficult to make comparisons. While the report format was familiar, its quality
was poor and inconsistent. The KPMG (1992) survey, found US companies had more
quantitative data on environmental issues and considerable more financial data than
Canadian or UK companies. Only a quarter of MNCs set targets to improve their
performance. There is little evidence in all three countries (US, UK and Canada) of
environmental auditing. This raises questions about the quality of information content. A
general conclusion, with some exceptions is that environmental reporting is still in its
infancy, even among leading nations such as US, UK and Canada (KPMG, 1992).
Such findings of deficient environmental disclosure provide further evidence for studies
such Roberts (1990, 1991); UN (1992, 1993); and Gray (1993), all of which noted that
the disclosure was mainly patchy and descriptive. These findings also complement
Tonking (1991); and Kirkman and Hope (1992). Most UK company reports were
narrative with only a few producing systematic performance reports (Gray and Owen
1993, Owen et al, 1992).
95
Although increasing number of MNCs are disclosing environmental impact reports, they
are unsystematic and are reported on an ad hoc basis (Fayers, 1998). Most lack
independent attestation (ICAE, 1994). They are largely narrative and lack integration
with the main accounts. The quality of disclosure mainly concerns the accountant.
Environmental information ought to be disclosed under the principle of user pay, where
environmental legislation impacts on organisations with financial consequences.
Poor quality of environmental information may be attributed to the cost factor. It was
pointed out, in an earlier section (3.2.3) that extra effort of incorporating environment
reporting incurs costs. Therefore unless there is a monetary reward to offset the cost
incurred, there will not be any extra effort. After all, there is no legislation to enforce
disclosure. To induce environmental accounting will require some tangible incentives.
Section 3 .4.3 suggests that there is benefit in implementing/complying with
environmental reporting. The inducement here is that an environmental management
system has its advantages. So far the emphasis has been on the disadvantages. Therefore
the next section discusses the advantages.
3.4.3. Benefits of Environmental Disclosure
Environmental disclosure does not only beget a good PR but also increases financial
returns. Relationship between social disclosure, performance and economic performance
is best described by Alexander and Buchholz (1978, p.479) as 'being socially aware and
concerned, enabling management to run a superior company making it an attractive
96
investment.' That is, those who disclose ought to outperform those who do not. This
contradicts the commonly held view that extra expenditure of improving working
conditions and/ or of collecting data on environmental issues, recording and reporting
them incurs costs, which reduce profits.
One industry that gained from complying with environmental disclosure is the cotton
industry. The cotton industry was labour intensive with a very low return and was a less
attractive investment. It was argued that a cleanup and new equipment costs would be
unafordable. This was maintained until a US Supreme Court Decision (AMII v
Donavan, 1981) allowed the Occupational Safety and Health Administration (OSHA) to
enforce a stricter standard for reducing dust emissions from cotton in the workplace.
Schmidt (1985), maintained, that decision was a turning point in the cotton industry
because it had a major economic impact on it . Since the verdict, the industry has been
modernised into a capital intensive industry and has since become efficient. The cotton
industry experience reveals that firms with new equipment and the latest technology
appear to be stronger financially. This experience may never have eventuated if there had
been no strict enforcement on dust reduction. There is therefore a relationship between
environmental requirements compliance and economic benefits.
There are also other benefits besides efficient operations for complying with
environmental record keeping and reporting requirements. Compliance can improve the
company's ability to manage environmental issues effectively. There is also the security
and assurance of less litigation with civil and criminal liabilities. This results from
97
complying with requirements to promote a sustainable economic growth and a safer
community (Coopers & Lybrand 1993). Ok Tedi's $3 billion lawsuit, would have been
avoided had OTML complied with environmental requirements. UNCTC's Ninth
Session (1992), found German and Swiss companies had a high level of environmental
disclosure. They were able to keep track of the high level of expenditure as well as
avoid the tight scrutiny in their annual general meeting from concerned shareholders.
3.4.4 Quality of Disclosure
Where the costs are material, they need to be disclosed separately (ICAE, 1994)12. The
later argument is expressed in the UK Accounting Standards Board's (UK.SB) 1991
exposure draft that requires an item to be presented separately if it is significant
(material) enough, to influence stewardship decision. SEC release 6835, requires
management to disclose any environmental problem of known potential significance that
is likely to have a material effect. Both UKASB ( 1991 ), and SEC release 683 5, deal
with the question of disclosing what is 'material' . Current accounting standards AASB
I 031 and AAS 5 define materiality as 'a piece of information, if omitted or misstated, has
the potential of adversely affecting decision about the allocation of scarce resources
made by users of financial report or the discharge of accountability by the management
or governing body of entity.' The attempt here is not to deprive any decision maker by
the lack of, or misstatement of information. This will ensure that all interested parties
receive ample information to make well informed decisions.
12 ICAE Environmental Research Group 1994, p. 73.

98
The Canadian Institute of Chartered accountants (CICA, 1993) recommends that new
recognition, measurement and disclosure standards for environment costs should be
included in a separate section of the CICA handbook. This will ensure that there are
clear guidelines to follow in preparing reports. There will be guidelines on measurement
to determine materiality of items for disclosure. Their Australian counterpart (AICA) has
already embarked on the preparation of guidelines for measurement, recording and
reporting of environmental information. However, the question still remains, whether the
guidelines will improve environmental disclosure, because the whole process is a vicious
circle of regulation, litigation and community reaction which leads to further regulation.
While the accounting profession is developing its guidelines to improve reporting,
investors are becoming wary of bad environmental practises because it increases
liabilities and risks that soak up profits (Coopers & Lybrand, 1993). Others, such as
employees, suppliers and even consumers are also interested in how environmental issues
are being handled. Bad environmental practices have in some instances prompted action
from groups such as environmentalists who work to minimise environmental
degradation.
Tilt ( 1994) presents the first empirical evidence about the community lobby or pressure
groups' influence on corporate social disclosure. The literature he surveyed of US and
UK origin, shows that most of the pressure groups are environmentalists who are very
effective. Of their effectiveness, an executive was quoted as saying, 'environmentalists
99
are becoming more penetrating in their analysis and more skilled to change conditions
they think should be improved' . So much so that 'when the environmental lobbyist
speaks, the company bosses tremble' (The Economist 1990, p. 90).
Tilt ( 1994 ), distinguishes pressure groups in the US as lobbyists a1mmg to create
legislation while those in Europe as publicisers of issues. Pressure groups are rare in
Papua New Guinea. Any form of lobbying is done by Australian NGOs like Aid/Watch
or the ACF. There is therefore a need to establish local pressure groups. The partnership
between ACF and l\1EF (chapter 2) bridges the gap to enforce environmental disclosure
requirements in member countries.
Pressure groups are vital in the US because concerns and actions by various groups has
led to the establishment of the US Environment Protection Authority (USEP A). Under
the USEP A, record keeping, reporting and disclosure requirements have become a
fundamental part of environment management. For this reason, the USEP A has
increased its regulatory activities for developing rules for recording and reporting. In
some industries, the issuing of certificates is used to promote effective and continuous
checks. Coopers & Lybrand (1993) report that the USEPA's attitude is changing. It is
now committing all its resources into enforcing record keeping and reporting violations.
Some form of enforcement is essential as the US surveys show. Since the USEP A
authorities use the S-K rules, their reporting has quality disclosure and is better than that
in the UK which relies on voluntary reporting. US disclosure has both qualitative and
100
quantitative information. It would be excellent to legislate for environmental disclosure
in PNG but there is the risk of driving away the MNCs and they are important to
developing the resources in the country. Therefore, it would be better to work along
with developments in Australia whose MNCs are studied here. Their current
developments are analysed next.
Size affects environmental disclosure. Large corporations disclose more. These MNCs
come from developed countries, as referred to earlier, it is appropriate therefore that any
developments among them be observed. These developments are more advanced in
some countries than others, however the common sentiment is that the need for greater
disclosure of environmental information is becoming evident. The process will be faster if
every stockholder is provided with environmental information of the adverse impacts
from MNCs' operations.
3.5 Development in Australia
Australia is currently responding to public demand to incorporate environmental
disclosure in company annual reports (AICA, 1998). It is a flow on effect. Kahill and
Kane ( 1994) claim that environmental management initiatives are exploding worldwide
as a response to demand for disclosure. However, Australian current environmental
reporting is deficient (Deegan and Gordon, 1996) despite every state having
environmental laws enforced by the Environment Protection Authority (EPA). This
section discusses recent developments like the AICA' s conceptual framework and
101
guidelines, and the public demand for environmental information which the Australian
.MNCs should address in PNG to minimise the current adverse impacts there.
3.5.1 Current Australian Reporting
While quality of environmental disclosure is improving in the above countries (section
3. 4 ), it is not the same for Australia. Current environmental reporting by Australian
accountants is deficient. However, if there is any increase, then it is not related to
industry, nature of operation or size - measured by total sales or assets. Evidence from
Deegan and Gordon ( 1996) suggests that environmental disclosure is self-laudatory.
These reports appear in the chairman's or the managing director' s reports and are mainly
qualitative.
This is due to lack of support for the provision of environment information in financial
statements. A survey conducted by (Deegan, Geddes and Staunton, 1996) shows that
there is only marginal support for environmental disclosure. It appears that accountants
consider environmental issues to be irrelevant to investors. This attitude may stem from
lack of guidelines on how to treat environment issues but this is soon to change, when
the AICA (1998) develops the conceptual framework and guidelines for environment
management systems and reporting, which will be imposed on the accountant.
The AICA' s (1998) effort in developing guidelines complements the Australian
government's adoption of green accounting. While some are debating the introduction of
102
green accounting, Australia is one of those countries busy implementing it to achieve
sustainable development (Atkinson, 1995). It was unveiled when the environment
minister announced the incorporation of green accounting with an injection of $3. 5
million into the project. Green accounts are to be developed according to UN
specifications over a period of four years in Australia (Wallis, 1995).
3.5.2 Environment Management System and Reporting
Green accounting will begin with the national government and permeate into the private
sector of the economy. Therefore Wilmshurt and Frost (1998), urge accountants to play
a leading role in successfully implementing environment management system into the
traditional accounting function. So far, various accounting practices have already been
adopted. These include: accounting for energy usage; rehabilitation or restoration;
production costs; cost of legal requirements; contingent liabilities, and waste
management. Despite the adoption of these practices, the information is not distinctly
categorised and reported externally. The authors claim that important environment
information is lost within the total information reported.
Unless the environmental considerations mentioned above are incorporated into both the
accounting and financial systems, they will prevent environmental advancement (Gray et
al, 1993). Essential prerequisites of 'greener' management and accounting systems are
not in place. This delay is caused by the lack of what Elkington, Knight and Hailes

103
(1991) term, the language of finance. The language of finance has not developed fast
enough to keep pace with the environmental pressures.
Despite the lack of a finance language, some improvements in reporting have been
observed among Australian firms. A survey by Coopers and Lybrand ( 1992), found 21
percent of the companies in Australia disclose environmental issues compared to 52
percent in US and only 14 percent in UK. While Australian environment reporting may
be 7 precent higher than UK, Australia has lagged behind its many overseas counterparts
(Kestigan 1991). These studies are obviously out dated. Since then various experimental
approaches have been carried out to incorporate environmental factors within the
financial framework (Gray et al, 1993). EATF ( 1996) reported that almost 25 percent of
Australian MNCs now disclose environment information (AICA, 1998). Thus Australian
MNCs have improved by 4 percent over the 4 years as compared to Coopers & Lybrand
(1992) survey.
However, evidence from Deegan and Gordon ( 1996) suggests that little has improved.
Environmental reports appear in the Chairman's or Managing Director's report. They
are mostly qualitative and self-laudatory. Current environmental reporting by Australian
accountants is still deficient. This deficiency in environment reporting may explain why
we have environmental problem in PNG: the majority of the MNCs come from Australia
and they are not currently providing environment information about their operations in
PNG. It appears that voluntary accounting disclosure will not solve environmental
problems because not everyone discloses, as shown by the studies above. The industries
104
may need to be informed about the advantages of environment reporting or regulated
because environment disclosure will be less objective in an unregulated environment.
Deficiency is partly due to the accounting profession treating environmental issues
lightly. This was evidenced in Deegan, Geddes and Stauton's (1996) survey which
suggests that accountants give only a marginal support for environmental disclosure.
Based on these studies, this study proposes its two hypotheses: that Environmental
Reporting for Australian MN Cs has not increased since 1991 (H1) and if there was any
increase it was time and event specific (Walden and Schwartz, 1997), therefore it will
not persist, hypothesis 2 (lb).
For Corrigan (1998), the current environment accounting is centred on environmental
reporting and scarcely touches performance and measurement. The author is reflecting
on a recent International Federation of Accountants (IF AC)' s study-Environment
Management in Organisation: The Role of Management Accountant. The contention is
the notion that management accountants should take a leading role to promote
sustainable development. The outcome was that four major elements were adopted from
the Society of Canadian Management Accountants. They are: cost accounting, financial
management, risk assessment, and information systems. The adoption posses a challenge
for management accountants to incorporate these four elements to be eco-e:fficient,
incorporate environment considerations into financial decisions, identify environment
related risks and financial liabilities and develop an information system which will enable
greater quality of reporting.
105
3.5.3 Timely Developments
Experience from the developed countries reveals that the policing of environmental
requirements follows a vicious circle (Coopers & Lybrand, 1993). While it may appear
hopeless for developing countries with limited resources to act on any requirement, each
litigation and community reaction leads to enacting new regulations to strengthen weak
areas. It is considered here that MNCs should be made to disclose environmental
information. This relates to two developments. Firstly, the public/shareholders' demand
for environmental reports from their companies (Placer Dome, 1997). Some
shareholders of Australian :MNCs live outside PNG. Therefore requiring environment
reporting is in line with company owners (shareholders) calls. It seems timely to
incorporate the environmental disclosure requirement with the recent upsurge in the
publics' demands for environmental disclosure.
Steve Schueth, who is the president of Calvert Distributors Inc, Bethesda MD., a mutual
fund that only invests in responsible companies commented that MNCs are beginning to
realise that the more they tell the public, the greater respect they earn from it. When
environmental information reaches the investors through the accounting disclosure, they
will redirect their investments. This will eventually impact on businesses and force them
to become 'green' . After all, adopting best environment practices is cost effective and
increases profitability (McCafferty, 1996).

106
Already businesses are improving their accounting disclosures. They are doing better at
accounting for environmental liability by both recording and disclosing them. A survey
by Price Waterhouse ( 1994) reveals a remarkable change over two years. Seventy
percent of the respondents with significant environmental involvement reported
disclosing it in their financial statements compared to a survey completed two years
earlier where 62 percent with known environmental involvement did not disclose them
(McCafferty, 1996).
Secondly, the Australian accounting profession is developing guidelines to meet public
demand for environmen~ reporting. AICA is developing guidelines to guide the
preparation and the presentation of environment reports (AICA, 1998). This is where
environmental accounting will become a reality. However, coercion does not work
because environmental problems are social problems (Ludwig et al' s, 1993 ). This is a
rational argument because many of these problems are caused by human greed to deplete
resources for wealth maximisation. Meyer (1979) warned about problems that cause
irreversible damages. No amount of expost analysis will solve the problem.
Vogel (1993) directs a wammg at the accounting profession that environmental
legislation will soon affect the profession. The ramifications may be severe, especially
for those ignoring environmental legislation. It will affect the reliability of their financial
reports. Information like product improvement, waste reduction and other innovative
environmental disclosure can be a showcase to attract investors (Krueze et al, 1996).
Besides, disclosing environmental policies, practices and obligations are required to

107
satisfy its full disclosure requirement. The main issue is how to incorporate the above
developments into MNC operations in PNG. This is addressed next.
Studies on the development of environmental disclosure in Australia reveal a mixed
result. Even though Deegan and Gordon (1996) observed some improvements between
1983-1991, Fayers' (1998) assessment is that environmental disclosure is still self
laudatory. So much so that, Fayers concludes that environmental disclosure currently is a
'greenwash' . Nonetheless this thesis envisages an improvement in line with the current
global development. The AICA is already preparing a conceptual framework and
guidelines for its members' use to meet the current demand for environmental disclosure
in Australia.
3.6 Application in PNG
This section draws the relevant materials together from the discussion of various
environmental disclosure developments. It considers the advantages and disadvantages of
applying the concepts or approaches of environmental disclosure to address the
environmental issues in PNG. The chapter then concludes with the application of the
two approaches from the European developments: the eco-audit and the award system,
to promote environmental disclosure among Australian MNCs in PNG.

108
3.6.1 Problems Associated with Environmental Disclosure Legislation
Environmental consciousness has been rising since 1972 with greater pressure from
developed countries (Caimcross, 1992). This may be because developed countries have
better technology to employ in environmental management. They also have legislation
which regulates and minimises environmental impact. In complete contrast, ' a developing
country cannot legislate because legislation 1s too cumbersome to manage, time
consuming and costly to enforce. Government intervention therefore, is necessary
because the voluntary action by .MNCs is neither realistic, nor fair ' (Cairness, 1992,
p.17).
However, Wescott (1992) advises against government invention even though it may be
necessary. The author further discourages authorities, in particular those from
developing countries from launching complex programs to protect the environment.
Such complex legislation impairs more than solves the problems. Wescott specifies
three pitfalls devising complex legislature in developing countries to address'
environmental issues:
1. Since the programs are complex, there is no flexibility and hence there is no
uniformity in enforcement in the related industry, country or even in the region. PNG
faces this problem in the mining industry where each mine operates under separate
agreement. This was discussed in chapter 2.
2. There is no rigorous enforcement. Since arrangements vary, major acts cannot be
enforced. Some requirements may even be inappropriate. For instance, Thailand's

109
extensive environmental program was not enforceable. Accordingly it was labelled,
'Paper Tiger'. Lack of enforcement eventually led to the Bangkok Chemical
Explosion in 1991 .
3. If there is no uniformity and enforcement on comparues, then there is also no
consensus among regulators, agencies and enforcers of regulations. Eventually the
legislation loses it effectiveness and those who enforce it become powerless. The
forestry industry in PNG faced this problem where forest legislation was ineffective
and even the leaders were involved in corrupt deals (Barnett Commission, 1987).
When local legislation becomes ineffective, there is the danger of borrowing 'ready
made kit' programs to solve local problems. KPMG (1992) warns developing countries
to be wary less they fall into a trap like Taiwan. Taiwan borrowed USEP A programs to
combat hazardous waste sites. Unfortunately USEP A programs were not only
ineffective but were costly to administer.
3.6.2 Ethical Investors
It is not within the scope of this study to propose legislation but rather encourage the
provision of environmental disclosure through the accounting profession. Therefore the
above discussion is focussed only on developments of environmental reporting. This
study capitalises on EATF a ( 1996) study which found a mounting demand for
environmental information by interested parties in Australia. Disclosure of
environmental information is intended to expose MNC activities and direct pressure

llO
from ethical investors to MNCs to minimise the adverse impacts currently experienced
inPNG.
However, Perkes et al (1992), who studied UK ethical investors argues that annual
reports do not provide ethically related information. Ethical investors claim that the
contents of annual reports are too general . This is because ethical investors voice their
concern over degradation based on information they receive from annual reports (Perkes
et al, 1992). Those who seek funds while upholding environmental codes, will have
access to ethical funds . Social or ethical funds were first launched in 1970s in US around
the time environmental issues emerged. Within the last ten years it has reached $50
billion (Chastain, 1983). This boosted an upsurge in environmental issues in the 1980s
and greatly influences investment decisions up to $US 400 billion (Bromige and Partners,
1989).
Perkes et al (1992) are supported by Ratte et al (1991) that 10 out of 12 ethical
investors base their decisions on annual reports. Unless these ethical investors are
adequately informed, they can make wrong decisions. Perkes et al (1992) expressed
concern over annual reports containing very little information for ethical investors. As a
remedy, the authors suggest legislation to improve this deficiency. Their argument was
that ethical investors when combined will be a powerful force to correct environment
degradation.
111
A counter argument based on a EIRIS (1989) study, calls ethical investors, hypocrites.
EIRIS claims that ethical investors live a double life. They profess to be ethical in some
areas, while investing in others. This must be why Ratte et al (1991) claim only 1 O out
of 12 base their decisions on annual reports (Perkes et al, 1992). On the surface it is
difficult to judge unless the claims are empirically tested. Wiseman (1982) and
Rockness ( 1985) advise caution is needed this area. Their study found that those who
make the most noise are the poorest environment performers.
Hollingworth (1998) presents a more balanced view on ethical investors. The researcher
observed that environmentally conscious investment is moving into the financial stream.
They have two objectives: 'To invest their money in a manner which will contribute to a
sustainable environment and society as well as earn a good return. Ethical investors
stress that their funds are not charity funds . Hence they will not lose money in ethical
investments' (Hollingworth, 1998, pp.28-29). Their earning will be reinvested into other
ethical investments of lower returns so they should earn appropriate returns.
For PNG, ethical investors may be the country's hope for a while yet, to raise concerns
about MNCs unethical practices and reduce their impacts. To this end Australian MNCs
will be required to implement EP including environmental disclosure within their annual
reports through the use of the two approaches used in Europe: Eco-Audit and the
Award System. Each one is discussed below.

112
3.6.3 APPROACH 1: Eco- Audit
This section discusses Eco-Audit which is the first approach this study proposes to
address the environment issue in PNG. It coincides with environmental auditing which is
becoming a 'buzz' word of the 1990s (Welford, 1994). MNCs need to keep records for
regular monitoring after they implement an EP to see how effectively they are achieving
their objectives. (This study will not deal with setting up environmental accounting. It is
confined to disclosure). Results of regular monitoring and assessment will be reported in
the annual reports. It shows corporations commitments and will be the tool to improve
the environment.
Environmental audit is defined by the Conference of the British Industry ( 1990) as
'the systematic examination of the interactions between any business operations and its
surroundings. This includes all emissions to air, land and water; legal constrains; the
effects on the neighbouring community; landscape and ecology; and the public's
perception of the operating company in the local area. Environmental audit does not
stop at compliance with legislation but a total strategic approach to the organisation's
activities' (Gray et al, p.96). Eco audit encompasses an effective implementation of an
EP. It begins with an environment policy with targets under an environment management
system. This system is monitored, and its reports verified independently before it is
presented.
113
Environmental audit is a major component of environmental management. While the
terminology is borrowed from traditional accounting, different knowledge, experiences,
laws and approaches are needed for an environmental audit. Major components are
environment impact assessment (EIA), environmental survey, environmental review,
monitoring and surveillance, environmental investigation, the eco-audit and BS7750 as
well as the independent attestation. Other forms of audits are compliance, site, waste,
activity, process, safety, quality, takeover/merger audit and energy (Gray et al, 1993).
Of these, EIA is the major process. Fuller (1991, p.12) defines EIA as 'an essential
process that seeks to identify and predict the impacts of a new development on the
environment in order to mitigate them where possible and to monitor the actual impacts'.
Fuller adds a reminder that the environment is not a one off issue with a single solution
for all problems. Therefore it needs a continuous assessment (audit) and monitoring of all
aspects of the organisation in order to achieve its goals.
To be effective, a company initially undertakes a SWOT (Strength, Weakness,
Opportunities and Threats) audit which will reveal strengths, weaknesses, opportunities
and threats highlighting the areas to concentrate on (Gray et al, 1993). For those who
do not wish to loose trade secrets, new legislation is being passed in US which gives
privileged cover for the audited environment management information. Australia may
wish to adopt it for their companies. Cover is also provided for the auditor, but such
cover can only be retained if the status is maintained. If there is any weakness or
problem, it must be fixed to claim privilege cover (Rosemarin and Ballesteros, 1995).
114
Any organisation that ignores its environmental audit does so at its own risk because a
good audit will help a company become efficient (Gray et al, 1993). A thorough
environmental audit begins with a simple survey of the organisation. Such a preliminary
survey will also reveal the organisation's strengths, weaknesses, opportunities and
threats. Often this will require external expert assistance although many prefer to do it
in-house while others use both. Drawing a flow diagram of the organisation with its
activities will highlight inputs, operations and outputs. This survey will reveal leakages,
refuses, emissions and repeat sites. These results will assist corporations to develop a
monitoring and surveillance service to minimise impacts and meet the requirements of
both existing and potential legislation.
While the recommendation of this study is for MNCs to incorporate environmental
impact plans into their accounting system, it would not be complete without an eco
audit. To ensure that such reports have credibility, they ought to be audited by
independent auditors and if possible published separately. Excellent examples of separate
verified reports from developed countries are, the Caird Group and British Airways.
Both British companies published audited environmental reports, British Airways
provided its report
as a supplementary booklet with the annual report. The airline even admitted that it was
lagging behind best practice and pledged to continuously monitor their operations to
improve (British Airways Environmental Review, 1991 ).
115
Most striking is Norway's largest Industrial Group Novsk Hydro, which began
publishing comprehensive environmental reports to correct its image following some
adverse publicity. The corporation published a comprehensive report of all its activities
in Norway and worldwide. It was the first company to do so and it was more than a PR
exercise. These reports were thorough with emissions targets and their framework of
operations. The disclosure contained both good and bad reports (Thomas, 1990)13.
Both British Airways and Norsk Hydro were rewarded with Environmental Reporting
Awards in March 1992 for their innovative reporting. This was to encourage the self
reporting these companies demonstrated. Four criteria were used in the selection of an
awardee:
1. The corporation has reliable information well communicated in the report,
2. The information is easily accessible by the public,
3. The aims are achievable because they are practical, and
4. The process of the company activities promote sustainability
Various methods are being developed to accommodate environmental accounting into
annual reports. These annual reports are independently attested through environmental
audit.
Environment legislation varies between countries and corporations respond accordingly.
A survey for the Ninth UN ( 1991) session, examined 20 German and Swiss companies
which were mainly chemical, pharmaceutical, metal and mining industries. It revealed a
high level of quantified environmental disclosure. Their reasons were:
13 Financial Times October 20

116
1. Their environmental expenditure was high and will continue to be so. Therefore they
need to keep a record of them and disclose them.
2. Publishing environmental information reduces the number of environmental questions
raised by stockholders.
Interestingly, their subsidiaries from Brazil had less in their environmental reports and
these were of a lower quality. This is expected from a developing country where there
are lax environmental laws as indicated earlier. MNCs in PNG may behave in the same
way. However, this will be discussed in chapter 6. Much depends on environmental
disclosure requirement and its enforcement.
Environmental reporting may be compulsory regulated, industry prompted, voluntary or
even self generated. The Body shop took a lead in UK, voluntarily disclosing by
publishing 'Another year in our lives ' with their annual report detailing actions, activities
and steps taken in environment management in 1990. Two years later (1992) Body shop
published a comprehensive report of environmental performance with independent
attestation. Progressive information of targets were included. It provided a better
perspective of actions towards sustainable environmental management without
legislation. However, the Body shop is unique, because voluntary or self reporting is
usually deficient, causing adverse impacts as repeated on several occasions chapter 2.
Within the Australian context, few like the State Electricity Commission of Victoria
(Annual Report 1990/1) have excellent targets and performance reports on Dust

117
emission, water intake, salt discharge and carbon dioxide emissions (Table 3-1 ). Table 3-
1 below shows the Victorian State Electricity Commission's target for each of the above
and the organisation's aims to improve in each area. Annual performance is compared
against the targets and necessary adjustments are made. This example should be
adopted by the mines in PNG to control their disposals of wastes including hazardous
chemicals. They can set targets and work to improve on their past and reduce the
impacts.
Table 3-1. Extract from SEC's aims & Performance Environment: Target Actual Target Actual
1990/1 1990/1 1991/2 1994/5
Dust (g/cuM) <0.11 0.10 0.10 0.09
Water intake from Latrobe catchment 3.8 2.9 3.0 3.0 (Ml/GWh)
Salt discharge in Latrobe river 0.950 0.092 0.920 0.850 (UGWh)
C02 emissions 42.0 43.3 42.0 42.0 (MUannum)
Source: State Electricity Commission of Victoria Annual Report 1990/91 as adapted by Gray et al 1993, p.245.
Although the benefits of efficiency, avoidance of litigation, community safety, healthy
financial position are ample reasons to encourage anyone to try, there will always be
some who will only comply with the basic minimum. The example of PJV was cited in
the last chapter, as revealed by CSIRO ( 1996), show that MN Cs stay within the
minimum legal requirement. The Dutch experience reveals that the passing of laws and
issuing of operating licences are not enough to protect the environment (Huzing and

118
Dekker, 1992). Corporations need to be persuaded to incorporate environmental issues
as part of their objectives and activities. MN Cs act after they evaluate moves, in the light
of cost versus benefit analysis. So environmental management has to be presented as a
means of accruing benefits to the organisation. Awards can be used for attempts in
environmental management schemes. This will prompt further actions by the organisation
in managing environment better. The next approach, which is the award system
discussed below, entices those who will not be persuaded by the general benefits.
3.6.4 APPROACH 2: Award System
This section discusses the award system because the above advantages will not mean
much those MNCs who are only 'transiting' in developing countries. Other incentives
are necessary to encourage them to disclose environmental issues. One effective system
used by British Airways and Norsk Hydro is the award system. New Zealand is also
using the award system effectively. An award is issued to a corporation if it:
1. has a comprehensive environmental policies in place,
2. expresses commitment to comply with legal and statutory requirements,
3. presents performance measures and trends and importantly,
· 4. discloses audited reports of actual consistent implementation of their policies from
(1) like British Airways and Norsk Hydro.
A survey of UK corporations revealed that although regulations are a concern, damage
to public perception was the most feared threat, registering 93. 6 percent of responses

119
(Ghobadian et al, 1987). Good reputation can be ruined overnight but, it will cost more
to rebuild. Corporations comply with regulations mainly out of fear for PR damage and
not because the legislation is strict. The majority of businesses in UK, for example, find
existing legislation 'toothless' . Since the EP requirement in PNG is ineffective, some
incentives for self regulation like an award system may be effective. It may even be
better therefore to expose the MNCs' environmental degradation to make them work to
guard their PR. Better accounting and disclosure are just part of the solution. It is
difficult to determine what to disclose (Mulcahy, 1995). Determining the problem, the
extent of damage and preventing it from recurrence, will contribute to better disclosure.
In the absence of environmental legislation, disclosure is voluntary. Unfortunately,
voluntary disclosure is not effective, as pointed out earlier. Since studies like Deegan and
Gordon ( 1996) reveal that voluntary environmental reporting is brief, mainly qualitative
and self-laudatory; an award system may encourage more constructive reporting. This
study does not specify any particular type of award. However, each industry can issue an
award for excellence. A prestigious logo was used in Europe (Willitis and Mitl, 1996)
while a simple award was issued to British Airways and Norsk Hydro. Companies in
each industry can compete for a prestigious award which will build them a good PR.
PNG needs MNCs to develop the resources and stimulate economic growth but their
operations need to be controlled to minimise their impacts.
120
3.7 Summary
Since only a few countries have legislation on environmental accounting, this does not
mean that PNG does not require environmental disclosure. However, this study notes
Westcott's (1992) advice against launching into complex environmental protection from
scratch which proves ineffective. Already PNG is enforcing the requirement for an EP
to be lodged with proposals, an addendum can include a clause which requires a
disclosure of their EP in their annual reports. All they are required to do here is to
implement their EP, audit and report it. This audited report is to be incorporated in their
annual report. This can be further enforced by the PNG stock exchange where public
companies are required to include environmental disclosures in their annual reports to be
listed.
Already .l\1NCs are producing annual reports, and it should not be a problem to add
environmental disclosure to them. Just leaving it there is inadequate. It may only result in
qualitative and patchy reports, as noted by Fry and Hock (1976) . They studied 135 firms
in 15 different industries and noted a negative relationship between social disclosure and
social performance. The authors found firms with poor images make the longest social
disclosure only in order to deflect attention. They disclosed more, partly to legitimise
their activities but more to deflect attention from the real issues.
On the contrary, less profitable firms rationalised by focusing on external causes which
were beyond their control for their results (Frazier, 1983). Since the focus here is on the
121
environmental impact caused by MNC operations, the latter group will present a better
picture. They will be able to disclose what was beyond their control after eliminating
controllable causes. Since the emphasis is on activities, impacts and targets, such
requirements will be useful to carry out a site by site audit and disclose the results in their
annual reports, especially where the PNG government has entered into individual
arrangements for different developers .
However, no solution is without problems and this solution is no exception. The analysis
of past corporate disclosure reveals critical problems. Lessem (1977) classifies these
problems into three categories. Firstly, whatever is disclosed concentrates only on
conventional areas like the environment. Second, disclosures are defensive in that what
is disclosed are those which favour them (self laudatory and deflectory). Third,
disclosures are too general and qualitative. They are not specific and therefore are not
useful for decision making. Since this study is capitalising on Australian companies and
their development of green accounting, PNG is not able to develop guidelines on the
types of disclosure because it will depend on the guidelines the Australian Institute of
Chartered Accountants and the Certified Practising Accountants provide for their
members. It will be better developed in Australia than any PNG attempt because
Australia has the money and the expertise to develop a suitable system of surveillance.
PNG' s problem will be enforcing it.
Investment Promotion Authority is the key office to enforce it. The same office enforces
EP requirements and with the registrar of companies can ensure MNCs comply when
122
they lodge their annual reports. The Registrar of companies, Anthony Beven, reported in
the PNG's IPA Trade and Business News Update (November 1996), that twelve
companies have been successfully prosecuted for failing to lodge their annual returns.
Convictions were also entered against forty-six directors and secretaries of those
compames. These defaulting companies and their directors were fined K25,850. In
addition, any company that did not comply with the companies act will be deregistered.
While the fine might not be crippling because developing countries need to be cautious,
it is a step closer to enforcing disclosure requirement. Alternative policing is through the
PNG stock exchange, where those companies wishing to be listed, will have to include
environment information in their annual reports.
Since the impacts are severe, there is a need to minimise them. Stanko and Zeller (I 995)
suggest that environmental issues will continue to plague society as industrialisation and
technology advances with hazardous waste emissions into the air, land and water unless
some action is taken soon to minimise their effects. The next step is to support
environmental disclosure with a theoretical framework as a means of minimising adverse
impact. Chapter 4 looks at a possible theoretical framework which support this study.
4.1 Introduction
123
Chapter Four
Theoretical Support
Chapter three recommends MNCs to account for environmental impacts and include
them in their financial reports. This is based on the Legitimacy theory that environmental
disclosure is reactive to factors such as social, economic or political. Corporate
disclosure appears to be an act of legitimation (Cooper, 1980). This chapter discusses
Legitimacy theory as a theoretical framework to support the accounting approach to
monitor, control and minimise environmental impacts caused by MNCs in PNG.
Purpose of this chapter
The purpose of this chapter is to present the theoretical framework which supports the
approach to examining the environmental disclosure issues that is adopted in this thesis.
From the 1970s, researchers have explored different options for promoting
environmental accounting. However the relative appeal of these options often depends
upon the theoretical perspective taken to substantiate their research. Within an
accounting context, a theory often performs two roles. It may help to explain an
observed relationship. Then, from this observed explanatory relationship, it may provide
a basis for both generalisation and future prediction (Watts and Zimmerman, 1986).
124
The Theoretical perspective supporting the empirical analysis in this thesis is provided by
the Legitimacy theory. Legitimacy theory treats corporate disclosure as a reaction by
corporations to social, economic or political factors which appear to threaten the
organisation in some way. Under the Legitimacy theory, environmental disclosure can
therefore, be largely seen as attempts by corporations to minimise the impact on the
reputation, financial standing or shareholder value (Cooper, 1980). The major elements
of potential threat, defensive response and legitimation are particularly appropriate for
the impact of specific environmentally-related events on the patterns of environmental
disclosure by MNCs over time. In particular, we wish to investigate the potential impact
of significant events which may be perceived by MN Cs as threatening their legitimacy in
some way.
A researcher collects data to initiate, refute or support theories adopted. However, a
collection of data is meaningless unless a theory explains the relationship among them.
Only then will any observations make sense. May ( 1993) elaborates further that a
theory or the ability to interpret and understand any research resulting within a
conceptual framework is evidence of a discipline that aims to systematically study a
phenomena. Ullmanm (1985) blames inconsistencies that occur in studies between social
performance, social disclosure and economic performance on the lack of an appropriate
theory, inappropriate definitions and deficiencies in the empirical data base.
125
Structure of the chapter
The structure of the chapter is as follows. Section 2 discusses paradigms and their
related theories before choosing legitimacy theory. The main theories which have been
used to support environmental accounting can be classified according to a general
paradigm. Three paradigms are identified here. They are the Functionalist, Radical and
Interpretive paradigms. These paradigms represent the fundamental models or schemes
that are used to organise questions and provide guidance in seeking solutions on
environmental accounting issues (Babbie, 1986). Since legitimacy theory is commonly
placed within the Interpretive paradigm, a short explanation is given here, prior to
further discussion.
Section 3 examines Legitimacy theory in greater detail and specifically looks at its
relevance to a study of the environmental disclosure patterns contained in the financial
reports of Australian MNCs operating in PNG. The limitations of Legitimacy theory are
also identified.
4.2 Classification of Major Theories
Different theories come under a few maJor paradigms which contain sets of major
theories. The three paradigms considered here are: functionalist, radical and interpretive.
Their classifications are briefly discussed below. This study then settles on Matthews'
(1987) classification, which is the result of research and debate, among a number of
researchers as shown below. It also has paradigms which are relevant to this study. Out

126
of the three paradigms, theories under interpretive paradigm are explored further,
because they relate to various aspects of social disclosure. The focus will be centred on
Legitimacy theory which provides the framework for this study.
Functionalists, Radical and Interpretive Paradigms
Social accounting has become the focus for a number of researchers such as Burrell and
Morgan (1979); Hooper and Powell (1985); Chua (1986); Matthews (1984, 1986); Gray
et al ( 1988); Goia and Pitre (1990); Laughlin (1990); Puxty (1986, 1991 ); and Parker
( 1986a, 1991). This list is not exhaustive but shows the amount of recent research that
has been carried out in the area. The paradigms classified below are a product of this
research. Although Chua ( 1990) acknowledges researchers experienced difficulties, a
number of theories have been deduced from these studies. In enhancing accounting
research further Matthew (1987) classified major theories into three paradigms:
functionalist, radical and the interpretive. Each one is briefly outlined below.
4.2.1 Functionalist Paradigm
Studies such as Gray (1992); Hooper and Powell (1985); Cooper and Sherer (1984);
Tinker (1980); and Cooper (1980) use the functionalist theoretical framework on which
to base their work to suit the neo-classical economics or classical management theories
of Taylor and Fayol. Neo-classical theory describes utility and profit maximising
behaviour of firms and individuals.
127
Neo-classical theory has become the mainstream of economic thinking. Its key feature is
that all decisions are motivated by a desire to maximise utility for individuals and profits
for the entrepreneurs. Emphasis is on individuals as either consumers or entrepreneurs.
Keim (1978) contends that neo-classical theory is consistent with corporations
maximising their wealth although MNC activities are influenced by the society's norms.
The relevance of the paradigm to this study is that, corporations desiring to maximise the
utility often drives them to use unsustainable means to achieve their aims.
4.2.2 Radical Paradigm
The Radical paradigm suggests that society reflects the basic organising principles and
institutional structures like the capitalist. The dominant theory here is Political Economy
Accounting. This theory rejects market related solutions contending that the structure of
society shapes all that goes on within (Cooper 1980; Tinker 1980). Cooper and Sherer
(1984) are of the opinion that social environments have political and economic structures
with their own inherent conflicts which are changing. As Commonwealth Economic
Developemnt (CED, 1971) reports, contracts between society and businesses have
changed substantially. Businesses are no longer confined to just producing goods,
services and employment to raise the standard of living. They are now required to
broaden their responsibilities to provide a quality of life. MN Cs are not achieving this in
PNG, otherwise their actions would have produced only minimal harmful impacts
(discussed in chapter 2).
128
4.2.3 Interpretive Paradigm
While the previous two paradigms concentrate on the structured world and institutions,
the Interpretive paradigm recognises the existence of societies and human nature as
paramount. This paradigm appears to be humane which may be an appropriate paradigm
to address the adverse impact on environment in PNG. Gray et al (1987) consider this
paradigm as a middle of the road approach because current capitalist structure is
accepted without any comment on its desirability. This paradigm also recognises the
interaction between institutions and societies and their impacts. Embedded in this
paradigm are theories such as Accountability, Decision Usefulness, Social Contracting
and Legitimacy. Each of those briefly described below because each contributes to the
CSD, of which Environment is a part. A greater emphasis is placed on Legitimacy
theory because the proposition is that the legitimacy theory supports this study.
4.2.3.1 Accountability Theory
CC Macquarie Dictionary ( 1997), defines accountability as the obligation to provide
certain information or perform certain functions as dictated or implied by law or an
agreement. In the accounting context accountability carries the responsibility to provide
information to enable users to make an informed decision. Accountability is related to
Agency Theory where the steward comes under obligation to account for resources he
manages. Under this arrangement, the stewards render an audited account for their
actions.

129
In the context of this study, the agents are the MNCs while the principals are the
shareholders to whom the MNCs are to account for their operations including reporting
environmental degradation. They have a duty to supply information and shareholders
have a right to receive it. Such development increases the organisation' s transparency
which can be painful, because it causes conflict with external parties (Gray, 1992).
Deegan and Rankin ( 1996) explored the question of accountability in their study entitled,
'Do Australian companies report environmental news objectively (as stewards)?' . They
investigated prosecuted companies to establish whether they account for their
misdemeanours to the public. Their study investigated annual reports of 20 companies
prosecuted by the NSW and Victorian Environmental Protection Authority (EPA). Only
15 provided any environmental information even after prosecution. Of the 15, only 2
made brief references to the prosecutions. The prosecution may not have been effective
enough to prompt any disclosure from the rest, or else they were protecting their
companies' PR not reporting the prosecution. Over all, reporting was not objective, the
MNCs were not being made accountable to their principals who had the right to the
information.
Since accountability theory holds that corporations are responsible for their actions, this
implies that MNCs should disclose objectively. Their responsibility extends beyond
social contract to compliance with corporate legislation which becomes the core reason
for social reporting (Gray et al, 1992). This theory therefore blends in well with this
study. MNCs are urged to report objectively on their operations in PNG to their
130
Australian shareholders which should expose their environmental impacts. Such
exposure will hold them accountable because, as Deegan and Rankin ( 1996) noted,
accountability for environmental information is lacking among Australian MNC.
There are some corporations which will not disclose even if they are aware of exposures.
A Price Waterhouse (1992) survey, found 62 percent of its 236 respondents with no
written records of known exposures. Therefore, they will not be discovered until the
issues come to light. Those who are not disclosing environmental issues are keeping
investors in the dark until there is a clear financial liability. Such companies are not
honest stewards, depriving their shareholders of material information for decision only
delaying cumulative liability. Their investors will be in for an unpleasant surprise (Anand,
1993).
Traditionally, corporations were only accountable to shareholders and their immediate
society. This has since expanded as an aspect of legitimacy. As Estes (1976) and Abt
(1977) observed, social accountability, including environmental issues, are extending out
to reach external parties. Thus, reporting to external parties can be unpleasant but there
is a duty to supply information. Since corporations receive power from society to
operate, they are accountable for their actions to the source of power (Benston, 1982).
Despite this possible unpleasantness, accountability can knit parties into a closer social
relationship and increase the openness and transparency of organisations. Besides
providing useful information to external parties for decision making, such openness
creates trust and minimises confrontation.

131
4.2.3.2 Decision Usefulness Theory
MNCs' management reports to shareholders will enable them to make informed
decisions. Chambers (1955) was the first to highlight the importance of an information
providing system. Such a system was to assist decision makers to both make future
decisions and review past decisions. His proposition was that a system was necessary to
channel all logical discourse of relevant information. Shareholders who will benefit from
such a system include customers, employees, both current and potential shareholders,
creditors and even state authorities such as the revenue department. This is based on
voluntary disclosure which may be only self laudatory (Gutherine and Parker 1989,
1990; Hine 1991; and ICAEM 1992). Since voluntary disclosure is deficient, compulsory
disclosure is necessary to meet the needs of other interested parties.
However, on the international level, there is still no single code, rules or even self
regulating practices covering global business activities despite OECD guidelines,
International Chamber of Commerce Environmental Guidelines for World Industry
(1989); World Bank's Legal framework for FDI (1992); Agenda 21 (1992); Haynes
1993). This is how the MNCs escape censure without providing ample information on
the impact of their operations on the environment. Although they must be accountable,
there is no legal enforcement to deter them deflecting from the real issues. Where there is
legislation, their disclosure in compliance, will be exhaustive.

132
There is a danger though that corporations can escape by disclosing just enough to avoid
confrontation. This is implied in Mintzberg's (1983) conclusion. After reviewing societal
demand for disclosure, Mintzberg concluded that 'it pays to be good but not too good'.
Although the accounting profession requires the disclosure of all material information
whose omission will affect decisions, there is the danger of emphasising positive
environment information to deflect attention from the main issue. Major issues include
environmental policies and practices which are important to shareholders but are
currently not adequately disclosed (Ernst and Young, 1978).
Whether environmental issues are being disclosed is the aim of Ernst and Young (1978)
who analysed 645 Forbes 500 Corporations' 1991 annual reports. Observed disclosure
was as follows :
- 477 companies (74 percent) did not disclose environmental issues,
- 58 companies (9 percent) disclosed environmental issues only in letters to
shareholders, and
- 110 companies ( 1 7 percent) provided environmental issues but in varying
degrees in the footnotes .
Those who did provide information were in the following industries: energy; steel;
chemical; paper; pulp and utilities. The rest did not. This is defeating the purpose of
decision usefulness which should be the paramount reason for disclosure. Although the
study lacks a theoretical base, it still raises non-economic and non-financial issues in
organisations to make reporting more informative (Arrington, 1990; Cooper and Sherer,
133
1984). This study relies heavily on (ethical) shareholders to influence MNCs to minimise
the environmental degradation. Such a decision is not possible unless the :MNCs account
fully to shareholders, because only fully informed shareholders will make value
judgements.
4.2.3.3 Social Contracting Theory
Social Contracting Theory is based on the notion that companies are under a social
contract with society to perform duties within the bounds of justice (Matthews, 1987).
Therefore they are obliged to disclose their operations to the community. As Shocker
and Sethi (1974) explain, every organisation, including businesses, operate in societies
via a social contract . They elaborate further that the growth of any organisation depends
largely on fulfilling their obligations which emerge out of either expressed or implied
contracts.
While businesses are engaged in these contracts, society is demanding that social issues
be addressed. Tinker and Niemark (1987) predict that such demands will increase as
people become aware of the consequences of business activities. The Greenpeace
movement is cited later in the chapter as an example of this increased awareness. Until
recently, profit was the main focus of any economic activity with everything else
becoming secondary. Today, whenever the public is dissatisfied with an organisation, it
exerts pressure until the organisation meets their expectation or face the full force of the
law (Post, 1978). Therefore corporations have to adapt to both legal and social

134
environments (Patten (1992). Heard and Bolce (1981) suggest that public policy appears
to be the only solution to address this problem. They cite the passing of more than 100
pieces of legislation between 1965-1980 as their evidence of what society is doing to
solve social problems.
Corporations' response to society's demand is the provision of an environmental report
but the amount of disclosure varies with society's demands or pressures. It is partly due
to the problem of quantifying social issues. Unlike economic activity, social issues cannot
be easily quantified and harnessed into the market system. The best corporations can do,
is to provide a complete coverage to legitimise its actions. The Exxon Valdez oil spill
1989 demonstrates this aspect. Following the spill Exxon devoted 3.5 pages covering
the spill and another 2.5 pages covered social issues resulting from the spill. This
contrasted greatly with the previous year's report which allocated only 0. 6 of a page for
social reporting. Such extensive coverage was fulfilling its social and legal obligation
because the effect of the spill was far reaching. Business Week (1989) reported that the
vote to open up the Artie National Wildlife Refuge to oil exploration was deferred
indefinitely after the spill. In addition, plans to expand offshore drilling in California and
Florida were also laid aside.
Patten (1992) traced the effect of the Valdez spill on oil companies' disclosures. He
studied 21 out of the 23 publicly listed oil companies of Fortune 500's disclosure
following the spill. He noted through content analysis that their average environmental
disclosure increased from 0.61 page to 1.90 pages. While the study is limited, it
illustrates legitimising. Legitimacy theory states that where there is a threat (both genuine

135
and perceived) to a firm's future, it will induce greater social disclosure to legitimise its
actions. Legitimising is the process of making one's action(s) appear legitimate or
socially acceptable.
4.2.3.4 Legitimacy Theory
Legitimacy Theory is defined by Lindblom (1994, p.2) as 'a condition or status which
exists when an organisation's value system is congruent with the value system of the
larger social system of which the entity is a part. When a disparity, actual or potential,
exists between the two value systems, there is a threat to the organisation's legitimacy.'
Lindblom suggests four approaches to correcting any threat to an organisation's
legitimacy. If the threat arises out of corporate failure to perform, then the relevant
approach is to inform the public about company activities and performance. Where there
is misconception among the public, public awareness campaigns and the provision of
information will address the problem. A subtle and manipulative approach is where the
organisation deflects public attention from the issue. This is a common approach seen in
Australian company annual reports analysed by Deegan (1996). The reports were self
laudatory because of fear of reprisal from those affected if negative impacts are
disclosed. The final approach involves the organisation seeking to change external
expectation where these external expectations are considered unrealistic.

136
A literature survey by Gray et al ( 1995), reveals that the first three approaches are
common, while only a minority of organisations utilise the final approach. Corporations
are under immense pressure from concerned parties to improve their performances.
However, it was also noted in the same review that environmental disclosure has been
employed to deflect attention from real issues when the MNCs come under scrutiny.
The anticipation is that the deflectory use of legitimacy will cease among MNCs when
AICA' s guidelines are implemented. Such guidelines will ensure uniformity and
consistency to enable comparisons to be made with other annual reports.
Social disclosure can be employed in each of the four approaches to legitimise
corporate operations and narrow the legitimacy gap. This study aims to utilise this aspect
of legitimacy theory by suggesting that all MNCs include environmental reports with
their annual reports to legitimise their operations. Each project is commissioned with an
acceptable EP in PNG. Therefore, an adverse environmental impact reveals a disparity
between their value system as depicted by their activities and that of the society they
operate in.
Under its social obligation, legitimacy theory is concerned with negotiations between
organisations and societies to rectify situations (Gray et al, 1995b ). Hogner (1982);
Guthrie and Parker ( 1989); and Patten ( 1992) view legitimacy as a mediative theory
between concerned parties. Mediation comes when corporations disclose to legitimise
or mediate with society so that their operations are acceptable. Alternatively, MNCs
have to alter their performance to minimise the adverse impacts of their operations. This
137
mediative role makes legitimacy theory more appropriate for this study because :MNCs'
increased environmental disclosure is based on legitimisation.
Legitimacy is succinctly expressly as a societal perception of a corporate behaviour
rather than an abstract measure of a corporate rightness. Because legitimacy measures
society's attitude towards corporate behaviour based on society' s cultural norms
(Suchman, 1995). Thus, the key factors to manage, which change over time, are the
corporate image and the societal expectation because society's judgement is based on
their perception of what the corporate image is (Nesa et al, 1997).
According to Sethi (1979, 1978, 1977 and 1975) legitimacy problems arise when there
is disparity between societal expectation and the corporate image. Sethi terms the
disparity as a 'legitimacy gap' and alleges that the gap exists with varying width, because
the gap is continuous rather than discrete. This gap is created when there are changes to
the two key factors named in the last paragraph: societal expectation of the corporations
(corporate image) and the corporate behaviour. Firstly, changes in societal expectations
without any changes in the corporate behaviour will create and widen the legitimacy gap.
Miles and Cameron (1982) cite the example of tobacco companies in the US during the
1970s. When the American public became aware of the consequences of smoking, the
societal perception changed dramatically against the tobacco companies without any
changes in the corporate behaviour.
138
Secondly, the legitimacy gap may also widen if a new piece of information about a
corporation's behaviour becomes available to the public, especially when the
information creates a disparity about the corporate image. This gap may be created
either accidentally or through exposure by some lobby group. This study aims to utilise
this second cause of creating a legitimacy gap by requiring MNCs to include
environmental information within their annual reports. It is anticipated that such
disclosure will expose unsustainable practises to create a legitimacy gap (Nasi et al,
1997). A continuous widening would damage the corporate image. Therefore, businesses
would strive to narrow this gap, desirably through correcting their behaviour.
Sethi (1978) proposes four possible strategies which are identical to Lindblom's (1994)
to narrow the legitimacy gap. The first proposal is to change public perception through
education and information without changing performance. The second approach is to
change societal expectation of corporate performance through education and
information. If the production of information and education do not work, then
corporations ought to change the symbols used to describe business performance under
a third approach to suit public perception. Finally, if the three approaches fail, then the
corporate bodies have to change their business performance to meet societal expectation
and thus bridge the legitimacy gap. This is illustrated by BHP during the 1800s (Guthrie
and Parker, 1990).
Guthrie and Parker (1990) studied BHP's disclosure practise between 1885-1985 to
assess whether social disclosure is a reaction to environmental pressure to narrow the

139
legitimacy gap. Pressure could be economtc, social or political. BHP disclosed
community involvement, energy, human resource, its products and others. These
disclosures were compared with major corporate events to test their proposition that the
disclosure was prompted by existing pressures at the time of reporting. Their conclusion
was that although BHP's peak disclosure levels match periods of significant corporate
events, there was not enough evidence to support legitimacy theory (Guthrie and Parker,
1990). Unlike the current self-laudatory disclosures, bad news such a strikes were
reported and others omitted such as the board of inquiry into lead poisoning in 1892 and
the earlier case of fibrosis of the lung.
Closer analysis of their disclosure reveals that human resources and community
involvement were the focus of BHP's disclosure then. Of the 212 social issues reported
by Gutherine and Parker, (1990) there are 105 to human resource issues, followed by 83
issues of community involvement. The period under study was riddled with strikes. The
most bitter industrial dispute in Australia was in 1892 which lasted 18 weeks (Bailey,
1968). Because strikes were a regular occurrence, they appeared in the reports even
though strikes are bad news. It appears that BHP disclosed strikes to show that
concerns are being acted on and/or to justify the financial results of that period because
- legitimacy, until recently, was considered only in terms of economic performance
(Patten, 1992).
While Gutherine and Par~er' s conclusion is that evidence does not support legitimacy,
there is some indication that it does. Much like the Exxon disclosure above, major events

140
of the time influenced disclosure. High human resource disclosure appears to be
influenced by strikes, unions and workers forcing management to legitimise its actions in
an attempt to quell further disputes. Cadenhead (1970), sees disclosure being influenced
by circumstantial variables and the management's immediate objectives. Contingency
theory complements the legitimacy theory when management chooses accounting
methods which are influenced by the immediate environment including uncertainty
(Thomas, 1981).
Preston and Post (1975) allege that social disclosure is a response to the changing
perceptions of corporations. Until recently, legitimacy was only considered from an
economic perspective. As long as the corporation is making profit, its actions are
legitimate. This resulted in adverse consequences. Unfortunately MNCs in PNG still
interpret their actions as legitimate because they are making profits with cheap raw
materials while degrading the environment. Cheap labour and environment degradation
were both discussed in chapter 2. Therefore, if MNCs can disclose more, then exposure
will minimise degradation.
Both BHP and Exxon (cited above) disclosed more to deflect and/or counteract
imminent opposition. In the same BHP reports from 1885-1985 there were only 8
reports of environmental disclosure. This suggests that environment was not a prominent
issue then, otherwise lead poisoning or the fibrosis would have been disclosed in greater
detail including any preventative measures taken. There was no social pressure then on
environmental issues. Therefore environmental reporting was inconsistent and only
141
picked up in the 1970s when oil, mmmg and steel industries were attacked by
conservatists. Trotman (1979) examined a segment of the above period (1967-1977) and
reported that Australian corporations' environmental disclosure increased over that
period. The author's explanation was that companies were attempting to avoid
confrontation with lobby groups when coming under the spot light.
Legitimacy theory is gaining support in the area of morality because it means corporate
bodies will be responsible for their operations. Since this has gained prominence,
understanding corporate legitimacy may be essential for management, especially in the
light of social/economic changes (Sutton, 1993). Legitimacy has to do with the way
power is perceived because of its political and economic implications. An action is right,
legitimate or acceptable if it conforms to some moral principle. While shareholders
perceive legitimacy differently, businesses are permitted to maximise profit as long as
their actions do not conflict with society norms.
Community Expectations & Reactions
Hagner (1982); Lehmna (1983); and Lindblom (1983) hold the view that corporations
disclose to legitimise their existence and their activities. This legitimising is necessary
because corporate operations influence society. Ullman (1976); Lehman (1983); Guthrie
and Parker (1990); and Gray et al (1995) support the above view because business
operations and reporting do influence, and are being influenced by, the local society.
Hurst (1970) argues that institutions which use power to accomplish their objectives
must be accountable for its actions.
142
Where corporations lack accountability, increasingly environment lobby groups will
influence businesses to be more responsible. Environmental lobby groups have swelled
as society's understanding of corporate activities increased. Their impacts have adversely
affected business performance (Cooper & Lybrand, 1993). This is in direct fulfilment of
Tinker and Niemark' s (1987) prediction mentioned earlier. The best example is the
Greenpeace movement. It started with 3000 members in 1985 and tripled to 9000 in
three years. By 1991, its membership exploded to 97000. This is due to the change in
society's perception of what is a MNCs' legitimate and appropriate behaviour.
Greenpeace lobbys and exerts pressure on the various green issues such as the forestry
policy in PNG as discussed in chapter 2.
While there are allegations of external lobby group pressures on corporations for social
issues, only a few studies have examined them. Tilt (1994) investigated these pressure
groups' influences on social disclosure and noted that most pressure groups are engaged
in lobbying either directly or indirectly through government bodies. Of those lobby
groups who responded, 92 percent indicated that legislation is necessary. Fifty-four
percent of respondents acted against companies which do not disclose. So much so that
it is claimed, lobbies are mostly on the offensive approach. (The Economist, 1990).
Tilt's (1994) study is the first and primarily exploratory study on pressure from lobby
groups and the author did not seek to find how pressure was exerted. However, it did
establish that lobby groups analyse annual reports for information on corporate activities.
Thus lobby action supports the view that societal pressure contributes to greater social

143
disclosure and that current circumstances do influence disclosure through pressure
groups. Since lobby groups analyse annual reports, it is essential that :JMNCs are required
to disclose environment information to legitimise their actions.
Since the focus on environmental management is mounting, sensitive industries need to
take extra care. Various organisation have gone as far as producing manuals as guides
for their employees to be aware of and conform to guidelines. Examples of these
organisations include Australian Manufacturing Council, The Institute of Engineers of
Australia and the Chamber of Manufacturers. Although they have guidelines, these
organisation have yet to translate them into environmental disclosure (Deegan and
Gordon, 1996). Irrespective of pressures, corporations should account to shareholders
for their actions and the aim of this study is to achieve this by requiring :JMNCs to report
environmental issues.
Summary of the paradigms
All three paradigms acknowledge the presence of external pressure which influences
corporations' decisions to disclose social information. Gray and Perks ( 1982) assert that
society has certain expectations of corporate responsibility under the current social
contract. Both the society and the corporations have values and expect each other to
operate within their respective boundaries. Any deviation creates a legitimacy gap and
the deviating party acts to legitimise its actions. Sethi (1978) suggests four approaches
to bridging the gap. Gray et al (1987) and Gray (1991) see society directly influencing
accounting policies of companies by holding them accountable. This study adopts the

144
suggestion that accounting may be examined as a 'Legitimating institution' (Cooper,
1980; Guthrie and Parker, 1989). This is a recent attempt to recognise the role of
accounting in organisation, and society to link actions and values. Cooper (1980)
suggests that accounting may be viewed as a means of legitimising to current social,
economic and political pressure for sustenance.
Tinker et al ( 1991) views social accounting as a reflection of social conflicts between the
MNCs and society. This conflict occurs between corporations and others such as
environmentalists, employees, consumers, women and other minority groups when the
congruence in their values is upset (Tilt, 1994). Such conflicts create a legitimacy gap
which needs to be narrowed. Narrowing the legitimacy gap can be achieved through one
of the four approaches Lindblom (1994) or Sethi (1978) presented. The appropriate
approach will depend on the cause of the gap.
4.3 Lack of Agreed Theoretical Perspective
There are inequalities in the society-corporation relationship. Consequently this is
reflected in corporate attitudes. Under social contracting theory, comparues should
perform within the bounds of social justice (Matthews, 1987). Most often they do not
and Legitimacy theory corrects this shortfall. Legitimacy does not only fulfil the social
obligation of disclosing information but it exceeds to legitimise corporate actions. Such a
feature is relevant for this analysis because the current study investigates the sample
MNCs annual reports for their current degree and pattern of disclosure. This section
145
reviews the selection criteria for legitimacy theory, its enforcement, its suitability in PNG
and concludes by highlighting the limitations of legitimacy theory to minimise the
adverse environmental impacts in the country.
4.3.1 Proposed Theoretical Framework
Overall research in CSD has fluctuated as researchers enter and leave the field (Parker,
1986). Preston (1983) and Ullmann (1985) attribute this fluctuations to firstly, a lack of
theoretical perceptive which should be at the centre of serious research. Secondly, the
lack of systematic reporting makes traditional positive research difficult and even attracts
doubts as a legitimate area of study (Gray et al 1987, 1988, 1991; Parker, 1986, 1991).
After analysing 13 years ofUK social reporting, Gray et al (1995) concluded that CSR is
a complex activity. They argue that the proactive and reactive arguments of Guthrie and
Parker are too simplistic. There is no one theory which can adequately or fully explain it.
Gray et al ( 1993) allege that this subject has become more political. Within the subject of
social reporting they see two different research approaches emerging. What follows in
the next two paragraphs is derived from their exposition. One approach is to take CSD
as an addendum to mainstream accounting and pursue research as a conventional
accounting field. The problem with this approach is that the focus is narrow and carters
only for the financial community.
146
The alternative approach places environment and social reporting at the centre of
organisation and society dialogue (Preston, 1975, 1981 and 1983). This approach is
relevant, given that the legitimacy gap is created by conflict between the corporations
and societies. While conventional accounting considers this as too ambitious, it has
enhanced public' s understanding of CSD without theorising in the society-organisation
relationship (Puxty, 1986, 1991; Tinker et al, 1991).
Gray et al (1987, 1988) argue that there is a core mainstream research which can be
theoritical without the theorising process affecting other forms of CSD. This is through
self reporting whether required by legislation or as part of a code of practice. The reports
can be released through the annual reports. Their focus is on organisation-society
interaction in areas of social concern such as natural environment, employees,
communities, customers and other social areas. Such self reporting is voluntary, it does
not solve the social problem. Therefore the problem perpetuates. Some attempts are
being made to investigate them empirically.
4.3.2 Basis for Legitimacy Theory Selection
All forms of disclosure or reporting promote decision making. Therefore accountability
seems to be the theory applied when corporations disclose as a gesture of accounting for
their past actions. However, management can be selective in reporting to promote their
ends by applying the Contingency theory. Unless shareholders obtain the correct
information, wrong decisions are inevitable and that is defeating the purpose of
147
accountability. For this reason accountability theory is eliminated because management
can be selective.
As pointed out earlier adverse impacts perpetuate despite current voluntary reporting.
Voluntary reporting to interested parties does not minimise impacts. Current reports are
self laudatory to deflect the attention of the recipients. Thus external pressure is
necessary to enforce societal contracts. This is where legitimacy theory becomes
appropriate for PNG. Corporate bodies are held responsible for their actions and are
required to legitimise both their existence and their activities. There is a legitimacy gap
that needs bridging wherever MNCs perceive an imminent threat or PR damage, they
will increase environmental disclosure. Since the impacts are adverse in PNG and the
corporations image is marred, they need to change their performances rather than inform
to educate. It is on this basis that the legitimacy theory is recommended to support this
research.
Social contracting theory will not work in PNG because the existence of social contracts
between MNCs and the society in PNG are non existing. If some exist, they are vague,
therefore they cannot be enforced. This is due firstly to ignorance because of the low
rate of literacy (57 percent) (AusAid, 1996). Secondly, local communities do not
participate in decision making and thirdly, there is conflict of interest on the part of the
state. Each of these have been discussed in chapter 2.

148
Stewardship theory is a possibility, but has a narrow approach in that it is accountable
only to the immediate entrepreneur or principal who has entrusted resources to the
agent. Unless they are ethical, entrepreneurs measure success in economic and not social
terms as pointed out earlier.
4.3.3 Enforcement of Environmental Disclosure
Of major concern is the lack of environmental information because its disclosure is
voluntary. As Deegan and Gordon (1996) concluded, in an unregulated environment,
management will be less objective in environmental disclosure. While annual reports as a
'one stop shop' ought to cater for all needs, they do not contain adequate information
for shareholders. Therefore interested parties are not able to make useful decisions
without adequate and appropriate information especially in relation to sustainable
development.
Analysis of annual reports (chapter 6) will reveal the current quality and quantity of
environmental reports among Australian MNCs under voluntary disclosure. Given the
above deficiency in voluntary reporting and the adverse impact, the only solution for
PNG is to require compulsory environmental disclosure. This will enable shareholders in
the MNC's country of origin to exert pressure on the lMNC to legitimise its operations.
They can only do this if they know what is demanded of them. MN Cs ought therefore to
be held accountable to disclose all social issues via environmental accounting.
149
They can only do this if they know what is demanded of them. MN Cs ought therefore to
be held accountable to disclose all social issues via environmental accounting.
They ought to legitimise both their existence and their operations to the shareholders.
Although this theory is also subjected to, or influenced by, management applying the
contingency theory, PNG has a standards for comparison. This standard is the EP
requirement which MNCs lodge with every proposal. They have to be accepted before
projects are commissioned therefore, MNCs have to legitimise any deviations from their
EPs. It is at this point that the external pressure can be applied to force the MNCs into
acting strictly within the EP proposal.
4.3.4. Limitations of a theory to minimise adverse environmental
impacts
Having proposed the Legitimacy theory, this study acknowledges that post-modern
social scientists even attack attempts to use a theoretical framework. They argue for
example, that you cannot use a theoretical framework to solve a carbon dioxide problem
(Green, 1992; Jaeger, 1993). They recommend strategies that stress caution, reversibility
and plausible hypothesis because even the best theory does not work. While this is true,
much depends on the strategies used and their timing. The climate is now right for
change because demand for environmental information is increasing globally (discussed
in chapter 3). It is during this time of global demand that it is suggested that MNCs
disclose environmental information using guidelines being developed by AICA.
150
Timing for this change is also appropriate in Australia. The commonwealth government
has already introduced green accounting under the directives of the UN. Even a
professional body such as the AICA is preparing its members to supply their service of
providing environmental reports. ACIA has developed a framework and guidelines to
assist the preparation of environmental reports. Thus the suggestion of introducing
compulsory environmental disclosure is timely to minimise the adverse environmental
impacts now experienced in PNG.
4.4 Summary
Environmental issues are a new development in the organisation-society hegemony and
legitimacy offers better disclosure in this area. It may be only marginal in some countries
but in other countries the development in environmental issues are advanced. What is
still vague is whether researchers can do more in CSD and create opportunities to
develop a counter hegemony. No single theory is able to explain fully the complexity of
CSD (Gray, Kouhy and Lavers, 1995).
Although Gray, Kouhy and Lavers (I 995) point out that no single theory is adequate,
Legitimacy theory is appropriate in that it is ensuring EPs are implemented by requiring
MNCs to legitimise deviations from their EPs. The assumption here is that MNCs are
not implementing their EPs. Legitimacy theory will support this study in its attempt to
minimise adverse environmental impacts.
151
The survey by Ernst and Young ( 1978) suggests an increase in social responsibility
accounting. Among other influential factors, Preston ( 1981 ), lists social pressure and
management objectives as influencing social disclosure. The author argues that firms
facing risks are more likely to disclose to reduce risk. So will large firms, especially those
under pressure. The most important factor is the management objective because
disclosure affects an organisations future. Since the Ok Tedi lawsuit, those MNCs in the
sensitive industries have come under scrutiny with risks of confrontation. Therefore they
are more likely to disclose for legitimacy.
Environmental issues are now becoming dominant and the public are demanding
corporations disclose there activities. Every corporate activity is coming under heavy
scrutiny especially after the disasters named earlier. Faced with the dichotomy of
corporations pursuing to maximise profits and society's need for a balanced ecosystem, a
corporation has to legitimise both their presence and activities through disclosure. While
using discretion management attempts to balance the various conflicting demands of the
stockholders. Often parties such as lobby groups wield power with their demands and it
is the most powerful that prevails. Nonetheless, management is under obligation to
disclose information on its activities. Since anything disclosed affects the corporate
future, management is selective in its disclosure. To ensure that adequate and
appropriate disclosure is practised, eco-audit will be necessary. Then to encourage
everyone to make an attempt, an award system may be adopted as a complementary
approach. It is hoped that both approaches will enable MNCs to disclosure
environmental accounts in full . This disclosed information will enable stockholders to

152
make informed decisions towards sustainable resource development. The next chapter
investigates into the current extent, pattern and degree of environmental disclosure of
Australian :MNCs operating in PNG.

153
Chapter Five.
Research Method and Data Collection
5.1 Introduction
This chapter presents the research methods and the actual data collection process for
the empirical section of this study. A major purpose of this empirical investigation is to
collect information from the MNCs' financial reports over five consecutive years to
study their disclosure trends and any influence of significant events which occurred
during that period in their disclosures. The section below, defines for this study the
population, discusses the methods used to collect the sample of MNCs, collection of
data from the sample and discusses the method of analysis. Both the instruments and the
methods for analysis are trialed in a pilot study using some of the data collected before
the main analysis begins.
This chapter discusses the research methods employed to observe the current
environmental disclosure in the MNCs' annual reports. The chapter begins by
identifying and isolating Australian MNCs as the population for this study from other
· MNCs that operate in PNG, followed by the sampling of Australian MNCs, justifying
the selection of an analysis method and the eventual collection of the data. Data in the
form of annual reports will be collected from the selected sample MNCs for the period,
1992-1996. The contents of these annual reports are examined for the degree, pattern
and extent of their current environmental disclosure through the use of content analysis.

154
This chapter concludes with a pilot study trialing content analysis to refine the
techniques to be used on the main analysis.
The approach taken to achieve the above objectives is to investigate a sample of
Australian "MNCs' annual reports. These annual reports will be analysed for their
different attributes and their quantity of environmental disclosure. The attributes
include: environmental regulations; company policies; conservation; environmental
expenditure; awards; recycling; EIA and, environmental audits and litigation. Their
presence will confirm the existence of an environmental reporting. Disclosure of
environmental features will be quantified, using a word count. The quantity of the annual
disclosure will enable this study to observe any trends and establish whether there is
adequate disclosure among the four selected industries to address environment issues.
A sample of the l\llNCs is selected from an identified population of Australian "MNCs
whose annual reports for 1992-1996 are collected, for the above analysis. This
investigation will establish their current reporting practices. Information disclosed in
these annual reports should contain details of their operations, their current impacts and
expose any practises that are detrimental to the environment. Since five years of the
MNCs annual reports will be analysed in this study, they are likely to depict disclosure
trends. These reports should also reveal any changes in reporting prompted by the recent
scrutiny on the mining industry (Placer Dome Annual Report, 1993).

155
Structure of the Chapter
In this section the following issues are considered: identification and definition of a
population of interest; attributes of interest in the population that is appropriate to this
study; sampling techniques to be used; contact and responses of those MN Cs sampled;
information collected from the respondent MNCs and, a pilot study to trial the
instrument of analysis.
Section 5.2 identifies and defines the population of interest. The allegations of MNCs
degrading the environment in PNG did not identify the MNCs, nor their country of
origin. MNCs in PNG come from a number of countries including Australia, the US, the
UK, Malaysia, China, and others (refer to Table 2-1 in the appendix) . From this group
of l'vtNCs, Australian MNCs are isolated for this study. The rest of the section explains
the reasons for making this choice and identifies the relevant attributes of the
population. From this population of Australian MNCs, 2 samples are selected. One
sample operates in PNG, the other does not. The choice of Australian MNCs is largely
based on the accessibility of their annual reports which will be analysed to attain the
study objectives.
A second group ofMNCs, which do not operate in PNG, is selected as a control group
for comparison with those that operate in PNG. These MNCs are involved in the same
four industries, namely: mining; forestry; manufacturing, and oil & gas. Both samples
are selected through different methods.

156
The selection methods will be discussed in section 5.3 . Only certain industries are
implicated in degrading the environment. The types of sampling used in this study are
discussed along with their advantages and disadvantages. This section also discusses
how the Australian MNCs, operating in the four sensitive industries (mining, forestry, oil
& gas and manufacturing) were chosen. The main reason for their choice was that they
are alleged to be degrading the environment in PNG.
Section 5 .4 discusses data collection methods from the sample of Australian MN Cs
operating in PNG and in Australia. The data collected are from the MNCs' annual
reports for the five years, 1992-1996. The MNCs chosen for the sample were
contacted through the mail, requesting annual reports for the relevant period.
Section 5. 5 reviews the content analysis used to analyse the annual reports for the
degree, the extent, and the quantity of environmental disclosure to address the current
environmental degradation issue. Content analysis is a well established method of
analysis. Three phases (attribute, assertion & semantic) of content analysis will be carried
out to trial the instruments (tables) of analysis and tabulate their results. Attribute
analysis identifies the features of environmental disclosure to establish whether MNCs
disclosure environmental information. Assertion analysis notes the location of their
disclosure. Although the literature is not clear on the issue of location of reports (Gray,
Kouhy and Lavers, 1995), this study identifies their locations throughout the annual
reports. The final phase of the analysis is semantic which quantifies the quantity of
157
disclosure. Section 5. 6 summanes the chapter highlighting the time constraints on
seeking additional data.
5.2 Population of Interest
This section discusses the clustering and the selection of a population for this study.
From the 3 7 different countries represented by those MN Cs operating in PNG,
Australian MNCs are chosen for this study using the three criteria listed below. Two
groups of Australian MNCs were contacted in order to collect the required data. One
group is comprised of those which operate in PNG, the other group which does not,
are selected as a control group. Unlike Niskala and Pretes (1995) and Gamble et al
(1996) who chose nine industries for their study, Australian MNCs in only four
industries (mining, forestry, oil & gas and manufacturing) are selected by this study,
because these industries are alleged to be environmentally sensitive in PNG.
Population
The IP A Certification (1996), reports that MN Cs in PNG come from a number of
developed countries. MNCs, operating in PNG during the period 1992-1996, originate
in 37 different countries (Table 5-1). Many of these MNCs invest in large projects. The
main investors, based on the number of MNC investments (Table 5-2) and monetary
value of their investments (Table 5-3) are: Australia, Malaysia, the US, UK, Singapore,
NZ and China.

158
This study focuses only on Australian MNCs. Three important criteria used in selecting
the Australian population are:-
1. Since the testing of the hypotheses involves the analysis of annual reports, MN Cs of
other countries are omitted because their annual reports are not easily obtainable.
There is a form of purposive sampling practised here, as was applied by Niskala and
Pretes (1995) when they discarded from their sample companies without annual
reports. Purposive sampling isolates Australian MNCs from other MNCs for this
study (sampling is discussed in the next section). Australian MNCs are chosen
because they posses the desired characteristics of accessible annual reports for
analysis (Sproull 1988).
2. Besides Australian MNCs' annual reports being readily accessible for analysis,
Australian MNCs are chosen because of their dominancy in the PNG economy. They
are found in every industry in the country. However, this study concentrates only on
four industries that are alleged to be environmentally sensitive in PNG.
3. Finally, both Conzinc Riotinto Australia Limited (CRA) which operated the Paguna
mine before it closed (1989) and BHP (OTML) are Australian MNCs. Both are at
the centre of the debate over environmental issues in PNG. The Paguna mine ceased
operation when compensation demands for environmental destruction were not
resolved (Young, 1992). This underlying cause of the crisis was later confirmed by
the Australian Parliamentarian Delegation to Bouganville during April 18-22, 1994.
The Bouganville Revolutionary Army (BRA) leader, Francis Ona demanded inter
alia, greater environmental protection (Commonwealth of Australia 1994). Both the
Paguna and the Ok Tedi conflicts stirred up antagonism among resource owners

159
against the :MNCs and created anxiety among all the MNCs in the country. This
situation was the motivation for this study, namely: to investigate an accounting
aspect to address the issue of environmental degradation for the mutual benefit for
all the parties.
The population for this study is therefore defined as being all those MNCs in the top
500 Australian companies by market capitalisation that operate in PNG. Wallace (1991)
rates population, from which a sample is selected, as the most important determinant for
valid results. The author reasoned that a sample will represents the population if the
population has homogenous characteristics. The sampling method must be one that will
ensure that the sample represents the population. The sampling frame, however, is the
population of MN Cs in the four environmental sensitive industries. McDaniel and Gates
( 1993) define a sampling frame as the list or a group of population elements from which
units to be sampled are selected. Unlike Deegan and Gordon (1996), not every company
in the top 500 is analysed. The focus is only on those companies in environmental
sensitive industries.
Sampling from the Australian MNCs is narrowed down to those MNCs in just four
environmentally sensitive industries. Of these, forestry and mining are two
environmentally sensitive industries which are reported (chapter 2), to have adverse
impacts on the environment. Two others (petroleum hereto classified as oil & gas) and
manufacturing are included. The oil & gas industry is included because of its extractive
nature, which like mining, degrades the environment. Manufacturing is included,

160
contrary to the AusAid report ( 1996), which rates it as small, because of a number of
large projects just commissioned (a meat cannery in Port Moresby, a cement factory in
Lae, fish and meat canneries in Lae and Madang, timber chips at Madang) and others
about to be commissioned (a veneer factory in Daru, an oil refinery in Port Moresby, and
a tuna cannery in Wewak). The manufacturing industry discharges wastes from its
production into rivers, seas and air which pollute the environment (Elston, 1995). Two
groups of samples are drawn from these four environmentally sensitive industries.
5.2.1 Group I-Australian MNCs which operate in PNG
The first group of Australian MNCs are those which operate in PNG. Issues affecting or
involving Australian mining companies operating abroad is not a new issue. Durkin
(1995), investigated human rights violation allegations involving Australian mining
companies in Indonesia. The author concluded that Australian MNCs were operating
consistently with the MNCs in Australia. However, two Australian MNCs have been
alleged to cause adverse environmental impacts in PNG. They are CRA in Paguna
(Bouganville), now closed, and BHP in the Ok Tedi mine. Young (1992) traces the
current Bouganville crisis back to the Paguna mine's environmental degradation. The
Ok Tedi case has been given a detailed coverage in chapter 2. Mining operation, by its
very nature, has significant impact on its surrounding communities and the ecosystem
(Rosenbaum, 1995).
161
Besides the mining impacts briefly described above, the logging industry is just as
destructive. From 1992-1996, the Australian Conservation Foundation (ACF) has been
exposing environmental impacts by logging (and mining) MNCs in PNG. Logs are
clearfelled and sprayed with preservative chemicals before being floated down the rivers
to seaports for loading. In addition, bark peelings are also dumped in the river with
preservatives which block local river transportation. Besides the destruction and
extinction of wildlife and blocking the river transport, Rosebaum (1998) reports the
chemical spray from logging operations affecting the food chain, which local
communities depend upon, in the Fly river area. Although it is not known the exact
impact this is having on the area, there are reports of birth deformities, beach erosion,
discolouration of and malodour of sago, inexplicable diseases and death among crabs and
fish along the Fly river.
Inclusion of the oil & gas and manufacturing industries is necessary because their nature
of operations makes environmental degradation inevitable. For instance, oil & gas is an
extractive industry like mining. The only difference is that excavation is limited to
clearing land for drilling but in mining, it is much more extensive. Nevertheless, wild life
is destroyed in clearing land for drilling for oil & gas.
The manufacturing industry is just as destructive. Although the AusAid (1996) report
classified the manufacturing industry in PNG as small, Table 2-5 shows that this industry
received the third largest number of applications with sizeable investments and
employment opportunities. The manufacturing industry appears to be expanding and it

162
will have a greater impact on the environment. Elston (1995), reports that rubbish from
factories, thrown into the canals, finds its way into the rivers, lakes and seas turning them
into cesspools. Worse still, are the refuse and wastes, including poisonous chemicals,
washed out into lakes, rivers and seas from factories. These foreign matters destroy
marine life much like the mining waste disposals. Whilst it can be argued that emissions
from the transport and energy industries also pollute the air, it is nothing compared to
the volume that flows from the chimneys of manufacturing industries operating 24 hours
a day.
5.2.2 Group 2- Australian MNCs who do not operate in PNG
Another group of Australian MNCs which do not operate in PNG were chosen as a
control group to avoid making inferences about Australian :MNCs based solely on the
sample selected from those under scrutiny. This second (control) sample of Australian
MNCs were picked at random from the four targeted industries with an inclusion of
some representing the service industry. Inclusion of the service industry MN Cs should
assist in confirming or refuting the arguments that environmental issues are industry
related (Niskala and Pretes, 1995). The inclusion will also ensure there is consistency in
environmental reporting among Australian MNCs. This (control) sample of MNCs not
operating in PNG is chosen to provide a disclosure benchmark against which to compare
the disclosure practices of the sample ofMNCs which do operate in PNG. As Ferraria et
al ( 1995) reported, some :MN Cs seek countries with lax legislation to practise what they
cannot practise in Australia. This control group will enable the study to determine

163
whether Australian MNCs are consistently and environmentally careful m their
operations as claimed for Indonesia (Durkin, 1995).
Comparing the results from the two groups will enable this study to establish
1. whether disclosure practises have improved in Australia since Deegan ( 1996) noted
it lagging behind other developed countries,
2. whether Australian MNCs operating in PNG are reporting consistently, as their
counterparts in Australia and those in Indonesia (Durkin, 1995). Disclosure from
abroad will affirm or refute allegations raised by other studies such as Ferreria et al
(1993) that MNCs take advantage of lax environmental rules in developing
countries, and
3. whether the 0Tl\.1L lawsuit and its subsequent scrutiny in PNG has any impact on
Australian MNCs' disclosure practises.
Since a population is now identified, sampling issues are discussed next, in order to
select the sample of MNCs. Whatever type of sampling is used, samples will be
restricted to the four environmentally sensitive industries plus some taken from the
service industry to maintain consistency of reporting.
5.3 Sampling Issues
This study requires the collection of information from sample annual reports of :MN Cs
operating both in PNG and Australia for analysis. This section looks at five important

164
issues connected with selecting samples from the population of Australian MNCs for the
collection of annual reports. The issues to be discussed in this section are: definition and
reasons for sampling; advantages of sampling techniques; problems in sampling;
reliability and validity of samples; methods of sampling used in this study, and selection
of the sample MN Cs.
5.3.1 Definition and reasons for sampling
Sampling is the process of selecting adequate subjects (single members) into a sample so
that it will enable the study to draw a valid conclusion about the population from which
the sample group is drawn. This is because the sample choice depends on the purpose of
the study, desired conclusion, reliability and accuracy of outcome (Wallace, 1991). In
addition, the selection and the analysis of a sample is less time consuming, more
economical and provides more informative details (Sarantakos, 1997).
Sampling is undertaken because although a survey of the total relevant population is
necessary for complete validity of results, it is usually not possible or too expensive. A
complete coverage of all MNCs is not possible. This is because not all MNCs are
implicated in causing environmental degradation and not all annual reports are accessible.
Environmental degradation is alleged to be industry related. Therefore, sampling is
necessary where a saturation survey is not possible. Sproull (1988, p.107) defines
saturation survey as ' involving the study of the whole population' . Since a saturation
survey is not possible, the MNCs will be sampled using the methods discussed below.

165
5.3.2 Advantages of Sampling
Chaudhary ( 1991) adds other advantages to those presented by Sarantakos above:
Sampling:
1. obtains the maximum information with minimum cost in time, money and energy.
This is by far the most important aim of sampling. It is also efficient.
2. enables an accurate measurement of values of parameters, precision of estimation and
the degree of reliability of estimates to be found.
3 . is the only method of enquiry especially when the population is infinite and the
research requires representation.
4. is the only choice when testing involves destruction. This is applied in testing quality
of products on the production lines.
5. enables researchers to estimate sampling errors through various methods of sampling
theory.
5.3.3. Problems (Disadvantages) of sampling
Despite sampling being economical and informative, it requires time in planning,
programming and its administration. Even then, the results may not be as valid as
saturation surveys. In applying sampling principles, samples need to be selected
systematically and objectively. Subjects need to be independent and identifiable; once
chosen, they cannot be discarded. This is to keep all subjects so that they all have an
166
equal chance of being chosen and to keep a complete list, especially when samples are
selected based on a sound criteria (Sarantakos, 1997).
5.3.4 Reliability and Validity
Reliability and validity depends on valid sampling. That is why sampling based on a
sound criteria is essential. Inferences will be made if the selection is reliable and the
sample is acquired through a valid sampling process. A result is valid if the process
measures what is required. The result is reliable if the same result is consistently
attained when the process is repeated. Reliability is confirmed if consistency is
maintained where measurement is replicated (Elinson, 1963). Elinson ( 1963) and
Graziano ( 1996) each listed four types of validity. Elinson lists construct, consensual,
criterion and predictive while Graziano lists statistical, construct, external and internal
validity. While they are all important, for the purpose of this study, external and internal
validity are considered vital for making inferences. External validity depends on internal
validity. Inferences cannot be made unless it is certain that what is intended is measured
and that, under replication, the same result will be attained. This is possible if the two
tests of random selection listed below (Tai, 1978) are satisfied and the sample is
representative.
167
5.3.5 Methods of Sampling Used
Random sampling results are representative provided two conditions are met:
1. every subject in the population is independent and the selection of one does not
influence the selection of others.
2. each subject has an equal chance of being selected for the sample.
When these conditions are met, sampling becomes more representative and reliable
(Tai, 1978).
Selection of subjects for this study began with a cluster sampling where Australian
MNCs are isolated into a cluster from the other MNCs operating in PNG. Cluster
sampling is used where a researcher divides the population into clusters and samples out
clusters for study. It is a variation of random sampling. However, not all Australian
MNCs in the Australian MNC cluster are studied as a cluster sampling should be
(Hartmen and Hedblom, 1979). Only companies in four industries are selected under
multi-stage clustering. Clustering, in stage one, groups MNCs into a homogenous group
of all Australian MNCs with an equal opportunity of being selected. The second stage
clustering secures a heterogenous cluster of Australian MNCs in the four sensitive
industries under observation which increases the economic efficiency of the sampling.
This is essential in research where cost and time are important determinant of sampling
method(s) (Tai, 1978).

168
Only those in the four industries were selected through purposive sampling for the
actual sample of those which operate in PNG. Purposive sampling requires the arbitrary
selection of samples in pursuit of desired characteristics (Sproull, 1988) Desired
characteristics for this study are:
1. only MNCs in the four sensitive industries,
2. those who operated continuously over the specified period of 1992-1996, and
3. have a complete set of annual reports for the period.
This sampling is modelled after Niskala and Pretes (1995), who used a double sampling
by first selecting nine industries using UN guidelines and categorisations (1992). In the
second move, they selected the top 100 firms based on sales. After eliminating
purposively those firms which did not publish annual reports, 7 5 firms (both listed and
unlisted) were selected for their analysis.
Random, and a variation of random sampling, are used in this study. The second
(control) group of Australian MN Cs were chosen under random sampling. This
capitalises on the strength of random sampling where the MN Cs in the top 500 have an
equal chance of selection and hence, will be representative of the Australian MNCs.
However, complete listing is rarely possible which is a limitation of random sampling
(Tai, 1978).

169
5.3.6 Sample MNCs
Actual sampling began with a list of all Australian companies operating in PNG. This
list of companies was obtained from the IP A register which ensures a fair representation
of all Australian MN Cs in PNG. Sampling must be representative in order to draw valid
inferences on the population of Australian MNCs (Sproull, 1988). Of these Australian
f\.1NCs in PNG, only those in the four named industries were targeted and purposively
sampled in the first group which results in double sampling.
The choice of only Australian MNCs in this study may appear as biased but it was done
for the reasons stated above. The action was necessary to narrow down choices of the
desired subjects, ie, to include those in the four industries with both the potential to
degrade the environment (oil & gas and manufacturing) and those degrading by their
very nature of extractive operations (mining and forestry) . All Australian MNCs in those
industries are listed and are independent. This gives every subject a fair chance of being
selected. Then, to avoid further bias, Australian f\.1NCs in mining, forestry,
manufacturing and oil & gas were randomly selected into the second group. The process
may be replicated if necessary.
The only exceptions were those MNCs which did not have complete annual reports for
the period, 1992-1996. These were discarded in the same way as Niskala and Pretes
(1995). These authors analysed the annual reports of Finnish MNCs but discarded those
with incomplete annual reports, arguing that a full set of reports is essential. The
170
discarding in this selection may violate the first condition of random sampling where full
listing is required for full representation (Sarantakos, 1995). However, it is unfair to
compare quantity of disclosure between MNCs which provide five years annual reports
with those that only provide some of the required annual reports. Those with five year
reports will display a much greater disclosure than those with less. Furthermore, where
there is incomplete information, trends may not develop and changes will not be
observed. Such inaccurate comparisons will contribute to wrong conclusions and
inaccurate inferences.
Eventually a total of 120 MNCs were chosen for the study. Due to an error, one
company was wrongly identified as being involved in two industries. This was not
discovered until the responses were received, therefore Table 5-4 has only 119 MNCs.
While the MN Cs in the second (control) group (Table 5-4A) were selected randomly,
those in the first group (Table 5-4P) were chosen purposively to incorporate the
objectives of the study. The next section proceeds with the collection of data from both
groups of chosen MNCs. Data in the form of annual reports will be collected from
both groups for analysis.
5.4 Data Collection
To ensure that the MNCs are actually disclosing their operations fully, the collection and
analysis of annual reports is necessary. This section discusses the collection of annual
171
reports from both groups of Australian MNCs in the industries named. The discussion
begins with the period of study, MNCs contacts, their responses and data collection.
5.4.1 Period of Study
The period covered by this study is 1992-1996. There are two main reasons for starting
in 1992. Firstly, in a similar study Deegan and Gordon (1996), analysed Australian MNC
annual reports up to and including 1991 to assess whether there was an increase in
environmental reporting. Therefore, by commencing in 1992, assessment of
environmental disclosure by Australian companies will be further extended. Secondly,
this study begins around the approximate time (1992) when environmental issue were
emerging in PNG (Young, 1992). Even the Ok Tedi lawsuit which went to court in
1994, only did so, when earlier negotiations with BHP failed. The environmental
degradation in the Fly River area began much earlier than this when a barge carrying
sodium cyanide capsized in 1984 (Eaton, 1986) but the period, beginning in 1992 and
ending in 1996, encloses the consequent lawsuit. Therefore, the effect of the lawsuit will
be observed by comparing the years before (1992-1993) and after 1994 (1995-1996),
the year in which the two writs were issued in the Melbourne supreme court against
BHP.
172
5.4.2 Contact for Annual Reports
Individual MNCs were contacted with a formal written request for copies of annual
reports. The request letter explained the reason for the research. It was planned that
where responses were not sufficient or were below 50 per cent from the first contact,
then second and third follow up contacts will be made as Deegan and Gordon did
(1996). If some annual reports were out of print, especially for 1992-1993, then the
accounting and finance department collection at the University of Wollongong will be
searched and the necessary copies borrowed.
However, the overall response from the MNCs contacted was very good (Figure 5.5a).
This figure is based on Table 5-5 (appendix) which has the results of an initial check on
the total sample to determine whether there was ample environmental disclosure to
warrant a content analysis. Responses from Table 5-5 are summarised into Table 5-Sa14.
Response of MN Cs
Out of the 120 contacted, 95 MNCs responded with a total of 394 annual reports which
gives a 79 percent response rate (Table 5-4). However, only 347 annual reports were
useful because the other 4 7 were either for 1997 or 1991 or earlier years. A number of
MNCs sent in an incomplete set of reports for various reasons. One, for example,
became a public company in 1994. Two (Bridgestone and Caltex) only submitted 1996
reports with explanations that they did not include environmental reports in their annual
reports prior to 1995. This is considered an honest admission. It appears here that
14 Table with lower case letters (a, b, c etc) are summaries from another in the thesis.
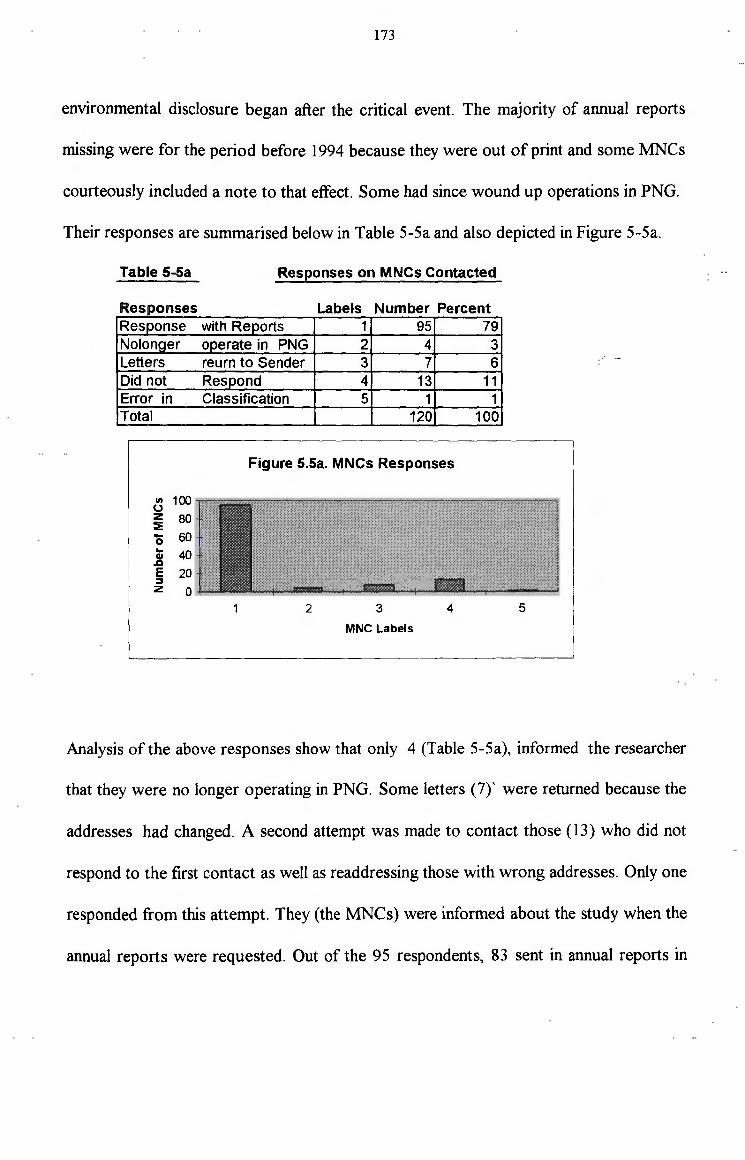
173
environmental disclosure began after the critical event. The majority of annual reports
missing were for the period before 1994 because they were out of print and some MNCs
courteously included a note to that effect. Some had since wound up operations in PNG.
Their responses are summarised below in Table 5-5a and also depicted in Figure 5-5a.
Table 5-Sa
Responses Response Nolonger Letters Did not Error in Total
Ill 100 0 z 80 :E 0 60 ... 1: 40 e 20 :::s z 0
Responses on MNCs Contacted
Labels Number Percent with Reports 1 95 79 operate in PNG 2 4 3 reurn to Sender 3 7 6 Respond 4 13 11 Classification 5 1 1
120 100
Figure 5.5a. MNCs Responses
2 3 4 5
MNC Labels
Analysis of the above responses show that only 4 (Table 5-5a), informed the researcher
that they were no longer operating in PNG. Some letters (7)' were returned because the
addresses had changed. A second attempt was made to contact those ( 13) who did not
respond to the first contact as well as readdressing those with wrong addresses. Only one
responded from this attempt. They (the MNCs) were informed about the study when the
annual reports were requested. Out of the 95 respondents, 83 sent in annual reports in

174
the proportion shown in Table 5-6 and by figure 5-6 below. This table (5-6) lists the
number of companies which submitted annual reports from 5 each down to only 1 each.
Sample
Finally seventy-two MNCs with 3 or more annual reports were selected for the sample.
Discarding those ( 11) with less than 3 reports conflicts with the sound selection criteria
of Sarantakos (1995), who opposes this practice. The author argues that the omission
influences decisions, and that all subjects should be included once they come under the
cluster. However, since this study compares the period before and after the lawsuit,
comparisons will not be complete if some reports are not available. Without those annual
reports, inferences will not be statistically reliable, because they will be based on an
incomplete sets of annual reports. Like Patten (1992), who omitted two of the 23 oil
companies observed after the Valdez oil spill because they did not have annual reports,
respondents with less than three reports were discarded.
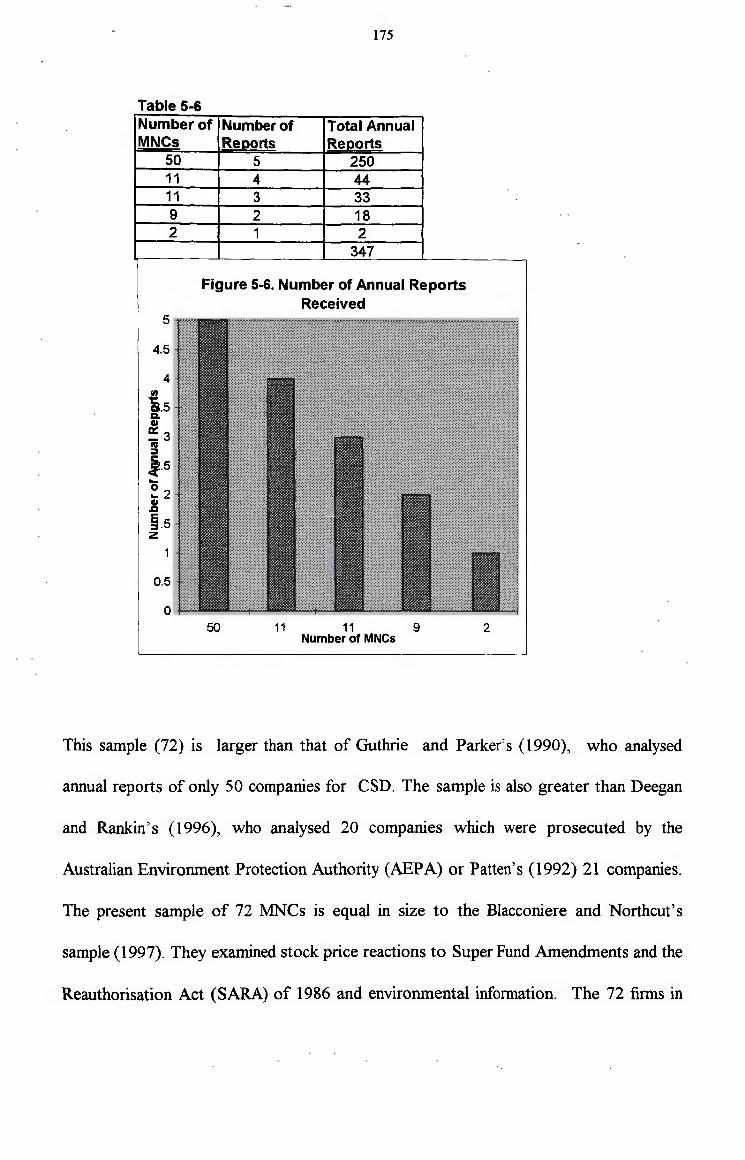
Table 5-6 Number of Number of MNCs Re orts
50 5 11 4 11 3 9 2 2 1
175
Total Annual 'Re orts
250 44 33 18 2
347
Figure 5-6. Number of Annual Reports Received
5
4.5
4 en i.s c. GI
~3 IV ::;,
j.s ~2 GI .a §.5 z
50 11 11 9 Number of MNCs
2
This sample (72) is larger than that of Guthrie and Parker's (1990), who analysed
annual reports of only 50 companies for CSD. The sample is also greater than Deegan
and Rankin's (1996), who analysed 20 companies which were prosecuted by the
Australian Environment Protection Authority (AEPA) or Patten's (1992) 21 companies.
The present sample of 72 MNCs is equal in size to the Blacconiere and Northcut's
sample (1997). They examined stock price reactions to Super Fund Amendments and the
Reauthorisation Act (SARA) of 1986 and environmental information. The 72 firms in

176
their sample were chemical and allied products, whose data from 1992 onwards was
available on the Research Centre-NYSE/AMEX.15
The annual reports collected will now be analysed for their degree, extent and pattern of
environmental disclosure. The selection of Content analysis is discussed below. The
discussion (below) looks at the definition content analysis, its history of evolvement as a
research technique, how it works, its operational contribution, a literature review of its
application and its advantages as a research method.
5.5 Method of Analysis - Content Analysis
Content analysis is chosen as the appropriate technique because it is an established
method and its results can be replicated. This method is widely used in social disclosure
analysis. It will be employed to analyse the MNCs' current environmental disclosure.
Examples of studies that employed content analysis to analyse annual reports include
Gutherie and Parker 1990; Patten 1992; Niskala and Pretes 1995; Hackston and Milne
1996; Deegan 1996; and Deegan and Gordon 1996.
15 The result also supports the claim that investors seek environment news in annual reports. Blacconniere and Northcut found companies with extensive environment reports have less negative reaction than those with less. Extensive reporting by MNCs was interpreted by investors as a sign of management handling the company's exposure to environmental regulatory costs. While the study is US oriented, it is consistent with Tilt (1994) that investors actually seek out environment news in annual reports. Therefore this study analysis the annual reports of MN Cs to observe the extent and pattern of environment reporting.
177
Content analysis is defined by Berelson (1952, 14), as 'a research technique for an
objective, systematic and quantitative description of manifested content of
communication' . It is a technique which aims to improve the quality of the inference( s) a
researcher makes based on analysing a form of communication. This form of
communication can be verbal, written or even pictorial. The analysis involves a
systematic and objective identifying of characteristics in specific parts of those
communications (Carney, 1961).
To Krippendorff (1980) content analysis is a. research technique for making replicable
and valid inferences from data to their context. It is a research tool that provides
knowledge, new insights and a representation of facts . Weber (1988), further adds that
content analysis is a method of codifying text into categories based on a selected criteria.
The above definitions focus on content. Chaudhary (1991, p.87), adds a definition on
the actual process-analysis. The author defines analysis as 'a measure taken to search for
patterns or relationships among the data group' .
Thus, content analysis is defined in this study, as a technique which will systematically
analyse annual reports with an objective of determining the quality and quantity of
environmental disclosure. This analysis will search through MNCs' annual reports for
features of environmental information to establish patterns of the extent and the degree
of environmental disclosure. Features of environmental reports located will be codified
into units of analysis to enable comparisons to be made between groups of MNCs,

178
industries and previous studies. This will provide the basis for proposing an accounting
solution for the current environmental impacts being experienced in PNG.
5.5.1 Classical or Theory Oriented
Content analysis can be either classical or theory oriented. Classical content analysis
inductively uses word count frequency from a descriptive manifest. Its sample is selected
through multistage sampling. In contrast, theoretical content analysis unities on theme
as a measure from a purposively selected sample, and makes comparisons indirectly,
based on a theoretical framework. Of the two, classical content analysis is objective and
possesses greater validity than theoretical content analysis.
This study integrates features of both classical and theoretical forms . Words are used as
a unit of measure on a purposively selected sample. Word count is conducted on the
content of annual reports manifest, however, its basis is the legitimacy theory
framework. This is based on Carney's (1972) assertion that the theoretical framework of
reference sets the standards or norms and the logic of inference.
Content analysis is useful for hypotheses testing and making inferences (Krippendorff,
1980). Making an inference is the major purpose of content analysis. Cause and effect
analysis of communication content leads to inferences and these inferences may be direct
or indirect. A direct inference may be drawn by relating changes to specific event(s)
which may have influenced the changes. An indirect inference requires a longer chain of
179
events and changes. Content analysis' other potentials are discussed in the next
section.
5.5.2 Unit of Analysis
It is essential to settle on a unit of analysis, having justified the use of content analysis.
Unit of analysis refers to the level of aggregation of data to focus on in the issue: Unit of
analysis varies and depends largely on the type of study. Gray, Kouhy and Lavers
(1995) list three preferred units of analysis as words, sentences, and pages of report . All
three: word, sentence, page count or a combination of them have been used by different
studies. For instance, Ernst and Ernst (1976) and Deegan and Gordon (1996) used word
count in their analysis; Hackston and Milne (1996) and Buhr ( 1998) employed sentence
count while Guthrie and Parker (1990); Patten (1992); PMPG (1994) and Niskala and
Pretes (1995) expressed the amount of disclosure in the number of pages. This study
employs a combination of all three.
This study searches for attributes of environmental disclosure and counts the number of
words used to describe them. A common number of words per line and number of lines
per page, will be determined to calculate the total number of words to a page. This total
word count will be used to determine the number of pages of environmental disclosure.
Final results will be expressed in the number of pages (as did Patten, 1992) although
only the number of pages are equated. Expressing them as page numbers will enable
comparisons between the two groups and other previous studies.
180
Previous Application of the three units of Analysis
The three units of analysis were employed by a number of studies to determine the extent
of social disclosure. A few, with similar characteristics to this study are summarised
below. The summary commences with those which unitised with a word count and
concludes with a page count. It appears from these studies that word count is the most
used.
Word Count
Several studies including Ernst and Ernst 1976; Ng (1985); Zeghal and Ahmed (1990);
Deegan and Rankin ( 1996), and Deegan and Gordon (1996) used word count to
determine the quantity of disclosure. Ernst and Ernst (1976) merely counted the
number of times an event was recorded. This study, similarly counts the number of
words used to describe a feature of environmental information reported. Zeghal and
Ahmed (1990) conducted an exploratory study analysing annual reports along with
advertisements and company brochures for 1981-1982. Their word count analysis
revealed that banks and petroleum companies disclosed more social information in
advertisements and brochures than in annual reports. This implies that the choice of a
medium depends on the target (Zeghal and Ahmed, 1990).
Deegan and Rankin (1996) used a word count to analyse 20 prosecuted companies'
reports for the disclosure of their prosecution. The authors maintain that their use of a
word count was not for precision but to study systematic variations in a company's
disclosure. The authors were observing for an increase in environmental disclosure
181
following the companies' prosecution. To counter the argument that a word count is a
crude approach, the total word count will be equated to pages based on Ng's counter
arguments (presented below). These arguments make word count comparable with the
page and sentence count.
While a number of researchers use page and sentence count, Ng (1985) prefers to use
word count. The author points out that there three problems with sentence counts:
1. problem of various print sizes cause content to be spread differently in addition to
content differences between pages,
2. some report pages contain pictures, some have columns and shorter sentences and
the actual
3. size of the annual reports also vary.
There is consistency between studies that use the word count method. For instance,
Deegan and Rankin's (1996) negative mean disclosure of 5.55 words is consistent with
Deegan and Gordon's (1996) mean of 5.7 words. This negative report is from 6
companies which disclosed a total negative reports of 133 words. Their word count
analysis revealed that those companies in sensitive industries disclosed more, with a
· positive mean of 180 words, compared to only 5. 7 words for negative disclosure from
14 companies. They surveyed a sample of 197 companies from 50 industries. The
negative mean in both studies is consistent, even though the later study analysed a large
sample of companies, which could have easily influenced the mean.

182
Those who oppose word count question the subjective choosing of words which disclose
environmental information. Hackston and Milne ( 1996) claim that the word count is
subjective. However, Ng (1985) and other word count proponents standardise the
word count in their analysis. Their opponents argue that sentence count is superior,
because it eliminates the standardising problem (Hackston and Milne, 1996). This
study' s choice of word count is to ensure thoroughness with the use of the smallest unit.
Every word which describes an environmental report will be counted to make the
analysis comprehensive.
Sentence Count
Sentence count as a content analysis unit is less popular than word count. Only two are
summarised here. Hackston & Milne (1996) analysed 47 companies in the top 500 by
market capitalisation using a sentence count. They opposed a word count because it is
subjective and requires an extra step to standardise. Unlike other studies, Buhr (1998)
conducted a case study of Falconbridge's mining and smelting of nickel at Sudbury
(Ontario-Canada) . The objective of the analysis was to assess the company's response to
the state legislation on lowering sulphur emissions and how it disclosed its responses in
its annual reports. The author, in this case study, analysed annual reports using the
sentence count which found technology being reflected as the driving force of
disclosure. Over time, company discussion covered legislature and the change in
technology, corresponding to a decrease in economic cost, which ultimately reduced
sulphur emissions.
183
Page Count
Other researchers have opted for a page count. It is easy to determine pages of
environmental disclosure while the previous units eventually conclude in pages of
reports. However, quality of disclosure may not be accurately determined because the
emphasis is on the amount of disclosure. This is not the issue here, but it is note worthy
that studies on corporate social disclosure (CSD) have employed page count.
Guthrie and Parker (1990) used page count in their analysis of CSD. They studied the
social impact disclosure of the 50 largest corporations by market capitalisation in the US,
UK and Australia. Their weighted average social disclosure was 1.26 pages, 0.89 of a
page and 0. 70 of a page respectively for the three countries. Thus the US had the most
while Australian corporations disclosed the least.
Patten (1992), who examined the effect ofExxon's Valdez oil spill in the Alaskan gulf in
1989, recorded his findings in the number of pages. His study was based on Preston and
Post's (1985), legitimacy theory. Patten analysed 21 of the 23 public traded oil
companies. General disclosure increased from 0. 61 page ( 1988) to 1. 90 pages in 1989
after the spill. Exxon made substantial disclosures from 0.60 of a page in 1988 to 6.0
pages in 1989. This disclosure provides evidence that Exxon was legitimising to deflect
publicity (Patten, 1992). Patten's study has two corresponding similarities with this
study. Firstly, this study was the result of a critical event, much like Patten' s oil spill
incident. Secondly, both studies are based on Legitimacy theories.
184
Given the wide application of content analysis in sociology and because its features and
methods is well established, it is used here for the analysis. Content analysis is objective
and systematic in its application. The studies this thesis is modelling, also used content
analysis, which ensures consistency. The results can be replicated where necessary.
The main body of analysis will be preceded by a pilot study of 50 annual reports from 10
MNCs which operate in PNG. This is to both rehearse the analysis approach and test the
effectiveness of the analytical instruments to ensure they accomplish their intended
purposes (construct validity). The pilot study will also test the suitability of the
instruments. Any necessary reconstruction or amendments will be made before the actual
analysis. This will allow any deficiencies or problems which emerge to be rectified
before the main analysis is begun.
5.5.3 Potential of Content Analysis
Content analysis has the potential to ensure that all relevant material is collected from
the analysis. It commences with a check on content manifest (Attribute Analysis) for
analysis. Content analysis is useful when:
1. an analysis of voluminous and complicated source material is required and where
reliability is important. Only content analysis can extract relevant data from such a
volume (Carney, 1961), and
2. where a writer's language is intensively analysed.
It is a form of analysis and extraction of communication with intentions to draw
inferences.

185
Content analysis has an important role as an investigative tool because it is capable of:
1. accepting large unstructured symbolic communication as data, and
2. analysing unobserved phenomena through the medium of data connected with
the phenomena (Camey, 1961).
5.5.4 Wide Application
Content analysis has been used in a wide range of sociological studies such as: Patten
1992~ Niskala and Pretes 1995; Hackston and Milne 1996; Deegan 1996; Deegan and
Gordon I 996; and Deegan and Rankin 1996. These studies are classified according to
their unitizing method. Some use word count while others use page count.
Paten (I 992) analysed the content of 21 oil companies' annual reports for environmental
disclosure following the Valdez oil spill in Alaska. Hackston & Milne (1996) analysed
and compared the development of environmental disclosure in New Zealand to other
developed countries. Deegan and Rankin (1996) investigated annual reports of
prosecuted companies to establish whether their prosecution by the EPA in Victoria and
NSW were disclosed. Others, like Guthrie and Parker ( 1990) analysed Australian
companies' social disclosure to monitor improvements in reporting.
In each case content analysis was employed with a specific objective. The authors
systematically conducted their analysis and recorded their results in various units of
measure. Eventually, results were quantified and inferences made on the population
186
which provided the samples. Similarly this current study' s objective is to determine the
extent, degree and pattern of current environmental disclosure. The study systematically
sampled MNCs whose annual reports are analysed for environmental content. Features
reported are quantified to determine the quality and quantity of disclosure. Based on
the results thus derived, inferences will be made from the :MNCs disclosures in the
respective industries from which the sample is drawn.
Reasons for adopting content analysis
There are several reasons why content analysis is used here. Its features of:
1. objective measurement- it will measure the quantity of environmental disclosure
because environmental features can be unitized,
2. systematic analysis - it will process disclosure systematically to determine the degree,
pattern and trend of current environmental disclosure,
3. quantifying the results- the amount of disclosure will be quantified, and
4. making inferences- inferences will be made to the population of MNCs from the
results to address the environment issue.
Content analysis accommodates individual objectives. Patten ( 1992), analysed to observe
oil companies legitimising their existence. Deegan and Rankin (1996), observed for
honesty among those prosecuted companies in revealing their prosecution to interested
parties. Hackston and Milne (1996) compared the New Zealand experience or
development of environmental disclosure with other countries. These authors
systematically analysed for environmental attributes. The features were unitized using

187
words, sentences or pages. Their results were quantified and the results inferred on the
population from which the samples were taken.
Content analysis is a popular technique in social disclosure analysis. Although there are
objections (listed below), there are no alternative technique(s) presented by those who
object to its use. Their main argument against content analysis is that it is subjective.
However, the benefits of content analysis outweighs its weaknesses. Therefore content
analysis will remain in use until a better approach is found.
5.5.5 Benefits of Content analysis
Content analysis is widely used by researchers because of its benefits:
1. A researcher is assured of obtaining the objective because it requires an objective
collection of information from a secondary source,
2. the study can be checked or be replicated,
3. different studies can be conducted once the researcher is familiar with the technique
(wide application), and
4. can draw different kinds of conclusions depending on the criteria used (Carney,
1972).
Objections to the use of content analysis
Content analysis is not without its shortcomings. Its alleged shortcomings include:

188
1. It lacks the rigour of other methods. That is why more than one form is used here to
compensate for this. However, a better alternative method has yet to be found.
2. It does not ensure absolute objectivity although it is more objective than
impressionistic approaches. Much depends on objectives and whether benefits can
be balanced with costs.
3. Content analysis obtains the best results, which compensates for the hard labour
involved, ie it is tedious (Carney, 1972).
5.5.6 Application of content analysis to this study
Although content analysis is tedious and lacks rigour, this study uses content analysis for
its empirical section, based on the above discussions of content analysis ' wide
application, its potential and advantages. Janis' (1965) classification of attributes and
assertion analysis, as part of semantic content analysis, will be applied to the analysis of
the annual reports.
Janis16 (1965) defines Semantic content analysis as a procedure which classifies signs
according to their meaning. That is, counting the number of times the word 'recycling'
is referred to in an annual report, irrespective of the words used in making the reference.
There are three types of semantic content analysis :
a. designations analysis -provides the frequency with which certain objects, persons
or things are referred to. This is subject matter analysis.
16 The full text of her work is in Italian in the book, Language of Politics as edited by Lasswell et al
189
b. attribution analysis-provides the frequency with which certain characterisations
are referred to.
c. assertion analysis-provides the frequency with which certain objects are
characterised in a particular way -thematic analysis.
Of a possible three types of semantic content analysis, attribution and assertion analysis
are adapted for this study. The attribution analysis is adapted here because it will
identify the attributes of environmental reporting in the annual reports. It is used firstly to
identify the characteristics of environmental disclosure to establish their presence, these
are then grouped into classes. Assertion analysis then records the characterisation and
placements of the attributes identified under attribute analysis.
In the context of this study, assertion analysis affirms the disclosure of attributes cited in
attribute analysis. The affirmation of disclosure is conducted in the different groups and
in different sections of the report . Since the attributes are sought in different locations
under particular groupings, there is a form of designation analysis where the frequency of
attributes disclosed is analysed. The attributes are the subject matter and the study
objective is to systematically identify and quantify them. In the final phase, semantic
analysis quantifies the attributes disclosed to determine the quantity of environment
disclosure.
In summary, all three applications of content analysis have restricted definitions (Janis,
1965) and are used here only as content analysis technique. The attribute analysis

190
establishes the existence of environmental features . It does not analyse attribution theory
studies in the widest sense, for cause and effect. Assertion analysis proceeds then to
affirm the presence of environmental attributes (and does not analyse assertion theory) in
different locations while semantic analysis quantifies the total disclosure. Neither does
semantic analysis analyse for the philosophical problem of truth.
Although content analysis is widely employed in corporate social disclosure research,
Gray et al ( l 995b) argues that it is less common in more conventional areas of
accounting research. However, since this analysis of annual reports includes financial
accounts, the approach is appropriate. It ' s usage here is especially relevant because this
study aims at assessing the MNCs' motives, attitudes or values on environmental
issues. The method has wide application and the literature reviewed above have all
engaged in content analysis.
5.6 Pilot Study
This section discusses the pilot study and its results . The pilot study involves the
application of the three phases of content analysis: attribute, assertion and semantic. The
section begins with a statement on the instruments of analysis, and the sample for the
pilot study before beginning the attributes analysis. Assertion and semantic analysis
follow on in sequence of the environmental disclosure to affirm the attributes and
quantify the pilot study sample disclosure.
191
Instruments
The instruments of analysis will be tables to record results of the annual reports analysed.
Tables will be constructed to record the MNCs responses and their respective industry
classification. On completion of the pilot analysis, tables (Table 5-6a to 5-6c) will record
the results. Tabulated data are easier to comprehend and graphs give a convenient
visual impact.
5.6.1 Sample Data for Pilot Study
The sampling frame of the pilot study will be confined to the MNCs who operate in
PNG. MNCs in the pilot study constitute approximately 13.89 percent of the total
sample of Australian MNCs from the four industries. Attributes or features of
environmental disclosure, extent and quantity of disclosure found in the pilot analysis will
resemble those in the main analysis.
5.6.2 Features of Environmental Disclosure in annual reports
The presence of features in annual reports is deemed as environmental disclosure. After
establishing which instruments and data to analyse, the next step is to consider what to
search for in the annual reports. Those studies named above, had different objectives and
sought different features of social reporting. Even their classifications of environmental
features are different.
192
Guthrie and Parker ( 1989) sought environment, energy, human resources, products,
community involvement and others. Environment was a minor component of social
disclosure at that time. However, Gamble et al's (1996) recent study was more
environment oriented. They sought data under short quantitative discussion (SQD) and
extended quantitative discussion (EQD). Under the former class was information on
environmental policy, legal compliance and restrictions, changes in environmental
regulations, operating and capital expenditure and environmental impact on other
activities. Under EQD were items such as future plans for improvements and costs,
environmental oriented assets, and environmental audits.
Niskala and Pretes (1995) also analysed voluntary disclosure of environmental
information by Finnish companies. However, their emphasis was the entities'
environmental policies and the features sought come under two groups: environmental
policy and finance, and environmental protection activities . The first group (policy and
finance) has policy activities and financial information which are classified in the same
manner as Gamble et al (1996) . The second group (environmental protection) had items
such as pollution, wastes, recycling, safety, products and energy saving.
The Association of Certified Chartered Accountants (ACCA)' s disclosure requirement is
much more comprehensive than those used above. While offering annual awards, the
ACCA requires a detailed criteria for environmental reporting. This includes 'details of
environment policies, environment management statements (EMS), auditing, setting
targets, legal compliance, material inputs, energy consumption, water consumption,

193
wastes, emissions, environment expenditure and liabilities and benefits of environment
policies' (Deegan, 1996, p.130). This is not an exhaustive list but shows those seeking
guidance on how to improve their environmental reporting.
Any one of the above studies ' features and classification could be adopted for this
analysis. However, Wiseman' s (1982) classification is adopted here for two reasons.
First, the classes of features are broader than Guthrie ' s and Parker's (1990). Second,
they neatly classify the main areas even though they are not as comprehensive as the
ACCA's. The ACCA has an extensive list because there is an award on offer.
Environmental disclosure is voluntary in Australia and there is no incentive to demand
very much, especially while the practice is in its infancy.
Patten (1992), who adopted Wiseman' s (1982) classification, was analysing
environmental disclosure following Exxon' s Valdez ' s oil spill to study changes in
reporting following a critical event. This study sought to analyse the possible impact on
MNCs' environmental reporting following the Ok Tedi lawsuit. Therefore, Wiseman's
(1982) classification, as adapted by Patten (1992), is adopted here. Listed below are
Wiseman' s classification.
A company will be deemed to have environmental disclosure if its annual report contains
any of the following :
1. Discussion of any environmental regulation or requirement which will impact on their
operations or activities.
2. Outline of Company's environmental policy or concern for environment
194
3 . Efforts to conserve nature including setting targets for achievements
4. Environment related Expenditure
5. Awards received by the company or any issued to its employees to promote
environmental care
6. Recycling Effort
7. Litigation for environmental degradation
8. Environmental Audit Program in place or planned
5.6.3 Locations of attributes or features of environment
In previos sections the concern was how and what to analyse, this section is concerned
with the attributes placement in annual reports. Location analysis becomes necessary
because accessibility to information is essential. As Deegan and Rankin (1996) reported,
73 .3 percent of their (67 percent) respondents actually seek out environmental
information because they rate them as material for their investment decisions. Investors
ought to be able to access relevant environment information, read, understand, compare
and make well informed decisions. Unless they can access them, wrong decisions will
result because not everyone has the time, education (as in PNG) or the expertise to
retrieve the information that is glossed over in annual reports.
Thus the location of a news item is significant because it determines the accessibility of
information. Kirkman and Hope (1992) argue that location is important and list these
four reasons for their stand:

195
1. information is more likely to be read if it is included in the chairman's statement
because it is ranked higher than and important than those elsewhere,
2. reporting on a separate page indicates that the issue is prominent enough to stand
alone,
3. its inclusion in the auditor's report shows it is verified or independently attested to,
hence it can be trusted, and
4. having an item under the director's report or the annual review is incorporating it in
the mainstream for emphasis.
Gray, Kouhy and Laver (1995) contend that the locations of information is insignificant.
They allege that it is only speculation that information in one location is better accessed
than other locations. There is nothing definite in the literature on this point. There is a
need for further empirical work to substantiate both claims.
Meanwhile, this thesis adopts Kirkrnan's and Hope's view that location is important
for the reasons given above. This is because the current study aims to expose
environmental degradation practices in order to mitigate them. The study is not soliciting
for one location for all environmental information. Rather it is arguing that information
is better accessed if its location is easily accessible because important material may be
missed if it is located in a poorly accessible spot. This analysis will only assess the
quantity of information disclosed under the different locations and categories because
richness of data might be lost by imposing all into a location (Guthrie and Parker, 1990).

196
The list of locations for environment information presented in Table 5-7b, column I is
adopted from Niskala and Pretes' research (1995). The analysis will seek the above
named features in these locations and quantify them. Since all disclosure will be
quantified and tabulated, it is necessary to test out instruments of measurement. The next
section conducts the actual pilot study with the ten sample companies.
A pilot study trialed the instruments using content analysis. Attribute analysis used to
analyse the ten sample companies' (Table 5-7) fifty annual reports, for features of
environmental disclosure. Table 5-7 contains the 10 MN Cs whose selection criteria
appears below for the pilot study.
Table 5-7 Industries and Companies
Forestry Mining Manufacturing Petroleum
&Gas
Bora I Placer Pacific Coca Cola NZOG
Howard Smith Placer Dome Anrnotts Command
ANI MIM

197
Sample
A sample of Australian MN Cs which operate in PNG is selected (Table 5-7) subjectively
for the pilot study based on two criteria:
1. Companies must have been in PNG before the 1994 Ok Tedi lawsuit and for the full
5 years from 1992 to 1996. This will enable this study to determine MNCs' disclosure
practices and the effect of the lawsuit.
2. Companies must have a full sets of (5) annual reports to enable complete coverage.
The analysis seeks for a number of environmental attributes disclosed in the annual
reports. Attribute analysis will then be followed by assertion analysis which affirms
their location of disclosure and assesses their frequency. Each mention of a feature will
be counted and tabulated, their frequencies calculated and expressed as percentages.
Unlike Japan which is regulated to produce a 'Business Report' (Yamagami and
Kokubu 1991 ), Australian companies disclose them voluntarily. Therefore, semantic
analysis will determine the quantity disclosure which largely depends on the MNCs'
willingness to disclose.
Results of the pilot study analysis is recorded in tables 5-7a to 5-7c. Table 5-7a contains
the features of environmental reports while Table 5-7b records the location of the
features and the Table (5-7c) gives the total disclosure. The three analysis are discussed
separately below, although at times, they are covered together under the three phase of
content analysis: Attribute, Assertion and Semantic.

198
5.6.4 Attribute Analysis
Attribute analysis involves the identifying features of environment issues which are
reported in the financial statements. They are classified into major groups for easier
management. Table 5-7a contains the major environmental attributes as classified by
Wiseman (1982) which are sought in the 50 annual reports. Each attribute is discussed
separately going from left to right (Table 5-7a) except for the first two. These are
combined because company policies reflect and accommodate regulations.
Environment Regulations and MNC policies-
Every industry appears to be aware of, and complies with environment regulations to
some extent, by incorporating them into its company policies (Table 5-7a, column 2). All
four industries have environmental policies varying between industries from 4 7 percent
for forestry to 80 percent for mining (Table 5-7a, column 3). A number of companies
have also achieved ISO 9200 Quality Accreditation. The Oil & Gas industry boasts of
making the environment a priority through pro-active self regulation. This industry even
pledges to 'work in advance of government standards' (Command Annual Report 1993,
p.20); however, their disclosure is low (Table 5-7c). Their pledge appears to be self
laudatory.
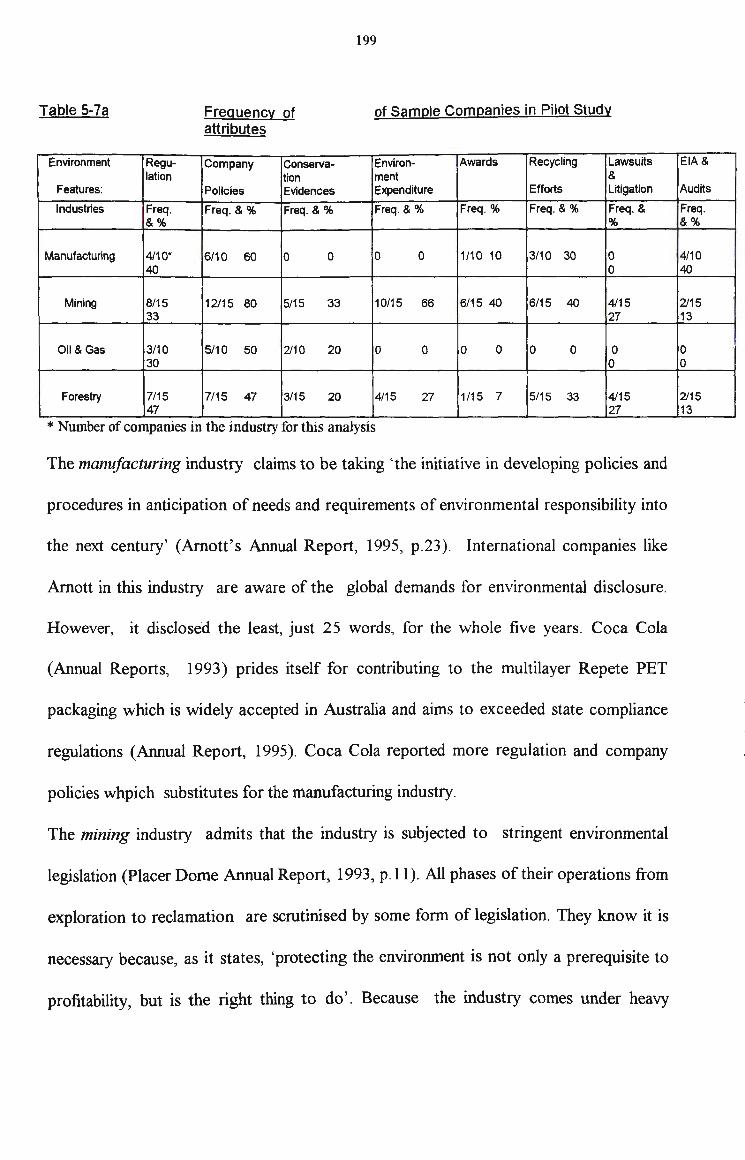
199
Table 5-7a Frequency of attributes
of Sample Companies in Pilot Study
Environment Regu- Company Conserva- Environ- Awards Recycling Lawsuits lation ti on ment &
Features: Policies Evidences Expenditure Efforts Litigation
Industries Freq. Freq. & % Freq. & % Freq. & % Freq. % Freq. & % Freq. & &% %
Manufacturing 4/10* 6/10 60 0 0 0 0 1/10 10 3/10 30 0 40 0
Mining 8/15 12/15 80 5/15 33 10/15 66 6/15 40 6/15 40 4/15 33 27
I
Oil & Gas 3/10 5/10 50 2/10 20 0 0 0 0 0 0 0 30 0
Forestry 7/15 7/15 47 3/15 20 .4/15 27 1/15 7 5/15 33 4/15 47 27
* Number of companies in the industry for this analysis
The manufacturing industry claims to be taking 'the initiative in developing policies and
procedures in anticipation of needs and requirements of environmental responsibility into
the next century' (Arnott ' s Annual Report, 1995, p.23). International companies like
Arnott in this industry are aware of the global demands for environmental disclosure.
However, it disclosed the least, just 25 words, for the whole five years. Coca Cola
(Annual Reports, 1993) prides itself for contributing to the multilayer Repete PET
packaging which is widely accepted in Australia and aims to exceeded state compliance
regulations (Annual Report, 1995). Coca Cola reported more regulation and company
policies whpich substitutes for the manufacturing industry.
The mining industry admits that the industry is subjected to stringent environmental
legislation (Placer Dome Annual Report, 1993, p.11 ). All phases of their operations from
exploration to reclamation are scrutinised by some form of legislation. They know it is
necessary because, as it states, 'protecting the environment is not only a prerequisite to
profitability, but is the right thing to do' . Because the industry comes under heavy
EIA&
Audits
Freq. &%
4/10 40
2/15 13
0 0
2115 13

200
scrutiny, mining recorded the highest disclosure in all attributes, except environmental
audit, where manufacturing leads (Table 5-7a). Based on attributes alone, mmmg
disclosure is extensive while under scrutiny. The other three industries, while pledging to
exceeded the state regulations, were only making self-laudatory remarks.
The Forestry industry professes to commit itself to strict compliance with environmental
regulation. It claims to meet 'both the spirit and the letter of the law' as well as
community expectations (Boral Annual Report, 1996, p.9). This, it implements by
harvesting timber on a sustainable yield basis, unlike those cited in the literature review
(chapter 2). The industry justly states that caring for the environment is not only a social
responsibility but an essential part of business practice. Unfortunately forestry's good
record was tarnished in 1994 when Boral was charged $85, 000 for breaching health,
safety and environmental legislation (Annual Report, 1995).
Conservation & Restoration-
Only three industries have made provisions for restoration and conservation. These are
mining, oil & gas and forestry (Table 5-7a, column 4). Every mining company has a
restoration and rehabilitation provision in its notes. A possible reason for greater
disclosure here, is the legislation which requires a separate disclosure of restoration
obligations to be recognised as a liability in the financial reports (Urgent Issues Group
(UIG)Abstract 4, 1995). However, it was noted on the overall disclosure, that in 1995,
the quantity of disclosure was the highest. Therefore greater disclosure is not only in
compliance to UIG abstract 4 requirement. It is also attributed to the scrutiny reported
201
by (Placer Dome Annual Report, 1994). As cited earlier, this was one year subsequent
to OTML facing ligation charges. Although there are fluctuations over the five year
period, with the exception of 1993, disclosure after 1994 exceeds 1000 words or 2 pages
(Table 5-7c).
Even though Oil & Gas reported cooperating with the department of conservation as
early as 1994, reports of provisions for restorations only appeared after 1995 (New
Zealand Oil & Gas (NZOG) Annual Report, 1994). This corresponds to the total
disclosure in Table 5-7 c which has a high increase after 1995 . This again supports an
earlier claim that critical events have an impact on environmental reporting.
Forestry treats site management and beautification (Bora! Annual Report, 1992) as a
priority. Major forestry reports of conservation is water treatment and recycling for
reuse. A conservation effort involves recycling water through ponds and storage dams to
conserve the local habitat (Boral Annual Report, 1996).
Environmental Expenditure-
Only mining and forestry industries register some environmental expenditure. In 1995
Placer Dome Inc estimated its environmental expenditure to be $92 million. Of this, $4
million was spent on Pogera and Misima mines to improve tailing discharges to minimise
environmental risks. Therefore, those who operate the Pogera mine deny that discharges
are causing health hazards. They maintain the discharges are not even toxic to fish . As

202
revealed by the literature review (Chapter 2), the DEC does not have the resources to
verify assertions with its own EIA and is therefore forced to accept the MNC reports at
face value. Since the MNCs environmental expenditure is sizeable, the reports should be
reliable except for incidents such as Marcopper mines with its waste leakage and it
consequent enormous legal liability.
Marcopper Mine in the Philippines was charged $43 million for tailing leakage. This
incident along with the Goldfields mi~ng company lawsuit, the Kidston water release
(Placer Dome Annual Report, 1993) and even Pogera (CSIRO, 1996) caution against
hasty conclusions. The Marcopper incident occurred despite Placer Dome Inc receiving
a number of awards just a year earlier (Annual Reports, 1992). An independent report 17
by CSIRO obtained from Placer Pacific recommends that PN should monitor for
impacts because PN's current environmental management and monitoring program is
'narrowly focussed on compliance monitoring and reporting18' (CSIRO 1996, pp. ES·5,
10). This is confirmed by RGC's (Annual Report 1993, p.11) admittance that NC's
monitoring 'confirms that levels of trace metal remain within compliance limits' set by
the PNG government. They are merely complying with DEC requirements.
17 A letter of Request was sent to BHP for a copy of the independent report on Ok Tedi which was to be released late 1997. The company did submit their annual reports but did not respond to the request for the independent report. Its non response was taken as negative or abstaining as with request for annual reports. 18 Emphasis is added
203
Neither the oil & gas, nor manufacturing industries recorded any environmental
expenditure to indicate any attempt has been made to minimise degradation. Oil & gas
companies did not add any further reports under the other features. This poses some
questions about their earlier pledges.
Environmental expenditure for forestry is incurred in the construction and operation of
converting wastes to energy projects, soil decontamination, flue gas desulphurisation
(Australian National Industries (ANI) Report, 1996). Unfortunately, heavy expenditure
led to the company making losses which has eventually led to the industry's scaling
down its operations. Consequently, environmental reports declined in 1996 (Table 5-
7 c ).
Awards
The mining industry dominates the awards tally while the manufacturing and forestry
industries only received one each. All Awards are for environmental excellence outside
Australia and PNG. Three mining awards were awarded to Placer Dome (Annual
Report, 1992) in Canada, and one each in the US and the Philippines. The
manujacturing industry award was a Green award for outstanding environment efforts in
Indonesia (Coca Cola Annual Report, 1996). The same company's plants in Brisbane
and Perth were only commended by Australian authorities for their conservation in waste
water recycling and reuse. Australian companies' pledges to be more careful in Asia has
borne fruit. Forestry's award for container care was issued by the US from the state of
Washington in July 1996 (ANI Annual Report, 1996).

204
It appears that extra effort is made where the environmental legislation is stringent. As
Gray et al ( 1996) noted, the country of ownership and the country of domicile have
significant influence on disclosure. These companies must have done well to earn the
awards in these countries where environment legislature is well established. Only two
local awards: Osborne's Premier award (Placer Pacific Annual Report, 1995) and an
employee award (Placer Pacific Annual Report, 1994) were reported.
Recycling
Under recycling, the manufacturing and forestry industries should excel because their
products are recyclable. On the contrary, the mining industry leads from practising
reclamation. Reclamation includes the conversion of water to energy, soil
decontamination, waste water treatment, coal beneficiation and flue gas desulphurisation.
The manufacturing industry only records the recycling of water (Coca Cola's Annual
Report, 1996).
Waste recycling efforts by the forestry industry is due to the development of
environmental engineering, which is advanced in Europe, compared to the US,
Australia or Asia (ANI annual report, 1994). This is in compliance with strict European
guidelines on land, air and water pollution (ANI annual report, 1993). The underlying
support is public demand for a cleaner environment which is forcing European
governments and businesses to be environmentally aware.
While most mines recycle water, MIM (Annual Report, 1992) applies ISA1\1ELT
technology to recycling copper and lead in Mount Isa. Lead is also recycled in the UK by

205
MIM which is considered the best in the world. The recycling process is to improve the
quality of the air. New baghouse filtering systems have also reduced emissions into the
air considerably. The mining industry, especially MIM (Annual reports, 1995), prides
itself on having the world's best environmental measures at the zinc-lead-silver mine at
the McArthur river-Northern Territory, Australia.
Litigation & Lawsuits-
Only mining and forestry registered lawsuits. Interesting enough, they are the two
industries with the most publicity over environmental degradation according to the
literature review. Their total disclosure exceeds the other two industries. As mentioned
earlier mining has come under stringent regulations (Placer Dome Annual Report, 1993).
This scrutiny may have been the result of the different lawsuits being reported. Even the
Mabo decision is causing a lot of anxiety among the mining companies in Australia as
does Ok Tedi in PNG. While Placer Pacific (Annual Report, 1996) is defending some
minor claims, Placer Dome (Annual Report, 1996) faces a large liability of $104 million
for its group of companies. Of this, $43 million is for the Marcopper mine.
Boral's (forestry) litigation charge of $85 000 is for a 'small number of prosecutions for
breaching occupational health, safety and environmental legislation' (Boral Annual
Report 1995, p.42) . The mining industry is given a much heavier penalty. Marcopper
mine for example was fined $43 million in 1996 for the accidental release of tailing. The
Ok Tedi case, which prompted this study, faced a $3 billion lawsuit in 1994. Overall,
Australian mining companies operating abroad came under scrutiny in 1995 (Pacific
206
Placer, 1995). The industry was aware of the problems because Placer Dome (Annual
Report, 1992, p.9) predicted that 'mining is and will be a far more sensitive, complex,
difficult and demanding business than it has been in the past' . This constitutes further
evidence of scrutiny because of the industry's sensitive nature.
Audits & EIA
Audit as a control mechanism should assist to improve environment disclosure. The
manufacturing industry leads convincingly in this attribute because one of them (Coca
Cola Amatil) as an international company maintains its credibility for its international
franchise industry. It claims to boost its environmental management program with
rotating audits radiating from Australia out internationally and promotes an intensive
personnel training program to encourage employees to be environment conscious (Coca
Cola Annual Reports, 1996).
The mining and forestry annual reports mention audits briefly. Mining integrates in a
single audit: safety, quality and environmental standards (MIM Annual Report, 1996).
This is incorporated into advanced risk management techniques. Annual audits are also
conducted (Placer Pacific Annual Report, 1993). The forestry industry shows the benefit
of auditing which reduced its legal liabilities substantially by its improvements in
management practices (Boral Annual Report, 1992). Boral's example should promote
environmental auditing for good management among MNCs.
There is an indication that the MNCs report on environment issues. These are noted in
the attributes reported. However, not MNC did so. This is shown by the number of 'Os'

207
in columns 4-9. Some only featured selected issues, omitting others. Assertion analysis in
the next section will identify locations based on the argument that location influences
access to information.
5.6.5 Assertion Analysis
Assertion analysis classifies the attributes located in the annual reports into categories.
Only major locations such as the chairman's report, annual review, financial statements,
future review, notes to the accounts and separate reports are discussed. Where
appropriate, new major locations will be added and those considered irrelevant will be
deleted in the main analysis.
While attribute analysis identifies the features, assertion analysis affirms their disclosure
by identifying their location in the annual reports. This analysis proposes that location is
significant. Environmental reports appeared in all sections for both forestry and mining
companies as anticipated, except in a separate report (Table 5-7b, columns 3&5). Table
5-7b has a list of possible locations in the first column and expresses the pilot study
result in percentages. Frequency results reveal the locations of environmental reporting.
Both forestry and mining industries disclosed more, as was anticipated. Oil & gas
reported only in three sites while manufacturing featured reports in only two locations.
Within the chairman's reports are the highlights of the year and plans for future projects
and the impact of regulations. The chairman's report summarises the whole report with
emphasis on the highlights except for the mining, whose report is fairly spread out in
208
(Table 5-7b ). The annual report section contains the bulk of the disclosure because it
presents the last twelve months operational review. The annual report elaborates on the
Chairman's brief summary while Future Review deals with regulations, policies, targets,
developments and training which are a repetition of what is already covered under a
Chairman's report. Therefore the Future Review section is omitted in the main analysis,
to avoid a double count. Annual report section should be omitted for the repetition
except its disclosure includes those items not covered by the major categories. The major
categories should retain consistency with previous studies. Reports in the actual
financial statements (accounts) are brief since the financial statements contain
consolidated accounts with notes to the accounts presented elaborating on them. Items
in the notes are mainly litigation charges and provisions for restoration or reclamation.
In summary, environmental reports appear in three main locations. Firstly, they may
appear together with appropriate headings. This is the best disclosure method because
everything is together in one place and easy to locate. However, only few companies
such as Pacific Placer have a separate 0. 5 page, full page or 2 pages for all
environmental information. The second form of presentation is providing environmental
information on a site by site basis with pictorial presentation of activities and places. This
approach has its merits. It gives interested parties easy access for analysing projects of
special concern to them. Different projects are subjected to certain risks such as
political, currency or other related risks. Therefore, each one should be considered
individually.

209
The third form lumps all environment information under one heading 'health, safety and
environment' . This creates problems in isolating and quantifying environment
information. While health and safety are related to the environment, the combination
constitutes social reporting. This study has a narrow focus on environmental
degradation. Therefore the environment related information will be isolated from the
rest. There is also a fourth form, one that scatters environment information
indiscriminately anywhere in the report. Only a fervent searcher will locate these items. It
is not the intention of this study to pass judgement on the best location for reporting
environment information.
Thus far, attribute and assertion analysis have located the features and identify their
locations only. Semantic analysis actually quantifies the disclosure. Common measures
used in semantic analysis are word count, sentence count or page count of the
environmental reporting. This study uses word count to quantify the environmental
features reported.
Table 5-7b. Location of Environmental Disclosure of Sample Companies for Pilot Study
Industries: Manufacturing Mining Oil & Gas Forestry
Possible Locations Frequency % Frequency % Frequency % Frequency %
Within Chairman's
Report: 2110 20 7/15 47 2110 20 5/15 33
Within Annual
Report: 4/10 40 6/15 40 6/10 60 12115 80
Future Review:
0 0 7/15 47 6/10 60 3/15 20
Financial
Statements 0 0 5/15 33 0 0 4/15 27
Notes to Accounts: 0 0 6/15 40 0 0 4/15 27
Separate Report: 0 0 0 0 0 0 0 0
210
5.6.6 Semantic Analysis
The final phase of content analysis quantifies the actual environmental disclosure of the
pilot study. Of the three units, the pilot analysis results are expressed in word count.
Quantified disclosure per site is summed up for each company and totalled for each
industry. Final disclosures are expressed as total words per industry, and per annum.
The total disclosure will assess each industry' s disclosure level and annual disclosure will
assist in the evaluation of the critical event's impact.
Word count (Table 5-7 c) reveals each industry' s quantity of disclosure by word count of
environmental disclosure per industry and per annum. Total disclosure is also equated
into page equivalents. Each page is equal to 576 words (refer to next page). Therefore,
the number of pages is complementary to total disclosure. For example, the
manufacturing industry has the least disclosure because compames did not disclose
enough. One company disclosed only one paragraph of 25 words in one year' s annual
report for the five years observed. Therefore their total is the least. The oil & gas
industry made brief self praise references about compliance to the requirements without
any accidents, ie reporting more good news boosts their total. Their annual reports are
the thinnest of the sample, 40 pages or less. Both manufacturing and oil & gas reported
on average less than a page, 0. 18 and 0 .26 of a page respectively (Table 5-7 c, column
8).
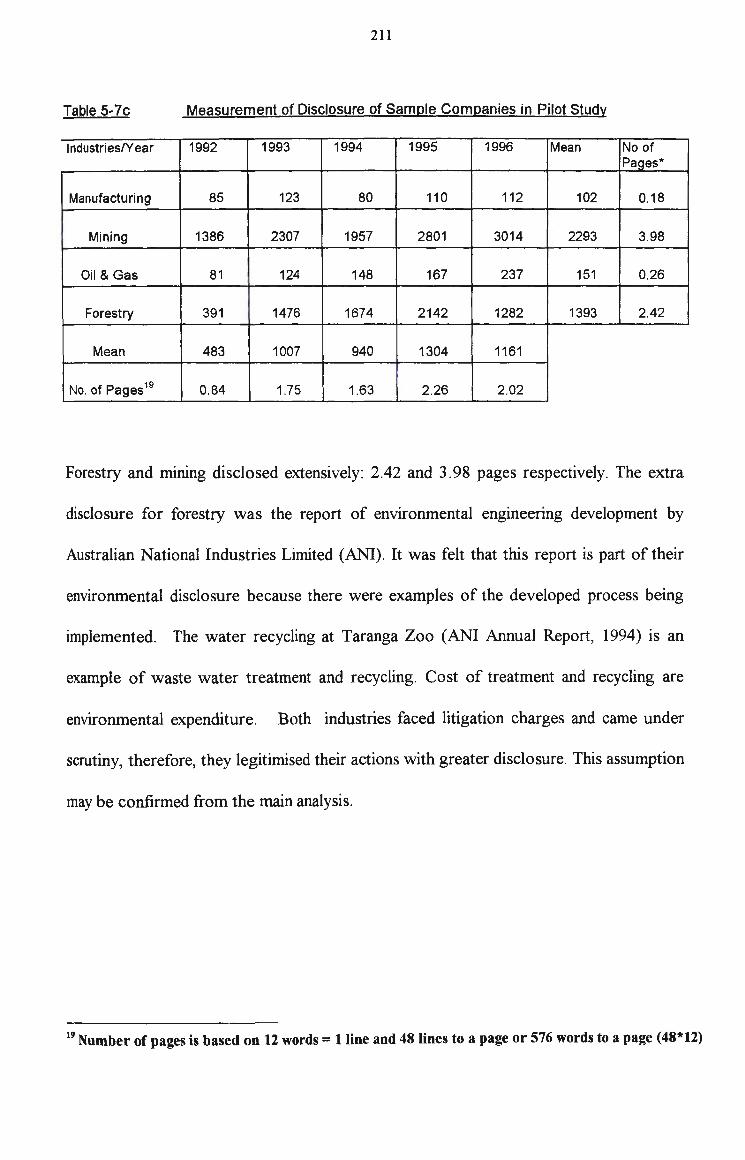
211
Table 5-7c Measurement of Disclosure of Sample Companies in Pilot Study
Industries/Year 1992 1993 1994 1995 1996 Mean No of Paa es*
Manufacturing 85 123 80 110 112 102 0.18
Mining 1386 2307 1957 2801 3014 2293 3.98
Oil & Gas 81 '
124 148 167 237 151 0.26
Forestry 391 1476 1674 2142 1282 1393 2.42 '1
Mean 483 II 1007 I 940 1304 1161
I No. of Pages 19 0.84 I 1.75 1.63 2.26 I 2.02
Forestry and mining disclosed extensively: 2.42 and 3.98 pages respectively. The extra
disclosure for forestry was the report of environmental engineering development by
Australian National Industries Limited (ANI). It was felt that this report is part of their
environmental disclosure because there were examples of the developed process being
implemented. The water recycling at Taranga Zoo (ANI Annual Report, 1994) is an
example of waste water treatment and recycling. Cost of treatment and recycling are
environmental expenditure. Both industries faced litigation charges and came under
scrutiny, therefore, they legitimised their actions with greater disclosure. This assumption
may be confirmed from the main analysis.
19 Number of pages is based on 12 words= 1 line and 48 lines to a page or 576 words to a page (48*12)
212
Data Collection
In order to test the relevant hypotheses given in chapter 3, and to provide descriptive
statistical results about financial disclosure and disclosure trends over the period, the
following information is collected from the pilot study:
1. the amount of environmental disclosure in each sample for each year as measured by:
(I) 1 =yes and O=no indicator (Table 5-5), to see whether environmental matters
were raised or not; (2) attributes of environmental disclosure (Table 5-7a); (3)
location of environmental attributes (Table 5-7b) and 4) quantity of environmental
disclosure in total words (Table 5-7 c) were all obtained through content analysis,
2. environmental disclosure by industry and per annum (Table 5-7c),
This information will be incremented from the main analysis in the next chapter to
test two hypotheses.
The pilot study concludes that of the four industries, namely mmmg, forestry,
manufacturing, oil & gas, two industries (mining and forestry) alleged to degrade the
environment have legitimised their existence by a high level of environmental reporting.
This appears in Table 5-7c, column 8. Both industries disclosed in two pages while the
other two (manufacturing and oil & gas) did not even disclose as much as 0.5 of a page.
It is noted that an increase that exceeded two pages began in 1995, after the critical
event. The main analysis of the remainding annual reports will commence with the above
background from the pilot study.
213
5.7 Summary
In conclusion, the purpose of this chapter to discuss the research methods. The chapter
identified those Australian MNCs out of the 3 7 countries represented in PNG and
through multistage and random sampling, selected two groups of MNCs which were
operating both in Australia and PNG. Companies were restricted to those in mining,
forestry, manufacturing and oil & gas. These sample companies were contacted and
responded favourably with their annual reports. Ten companies were chosen out of the
respondents whose annual reports were trialed in a pilot study. Three phases of content
analysis was used to analyse the result of the sample MNC annual reports. The results
suggests that those, alleged to be causing adverse impacts, disclosed more in legitimising
their operations. Conclusions, and inferences are premature until the main analysis is
completed.
All forms of environment disclosure will contribute to determining the adequacy of
disclosure. The final outcome of the analysis will be expressed in both annual average
words and average pages of disclosure per industry per annum. These average annual
disclosures will enable this study to observe the trends. An industry average will either
confirm or deny whether environmental disclosure is industry related. From the quantity
of annual environmental disclosure, it will be established whether the companies are
willing to objectively disclose environment information. Where this has happened, it can
be deduced that environment disclosure by the MNCs has increased. If there is

214
insufficient disclosure, then it will be necessary to propose ways of effectively
promoting the need for greater environmental disclosure.
Limitations
Originally it was planned to interview lobby groups such as Australian Conservation
Foundation (ACF), Melanesian Environment Foundation (MEF) and Greenpeace; state
departments such as DEC and IP A; Accounting bodies CPA and ICA as well as the
participating MNCs about the practicality of enforcing environmental disclosure.
Unfortunately, time constraints prevented this. However, some were contacted such as
the ACIA, CPA, and the Australian Green Party Senator: Bob Brown. For Lobby
groups, their views are sufficiently expressed in the literature reviewed. AICA provided
a discussion paper (Booklet) outlining its efforts to prepare its members to satisfy the
increasing public demand for environmental information (AICA, 1998). AICA is
preparing a conceptual framework and guidelines to meet environmental accounting
demand. It is difficult to determine what the CPA is planning because they responded
with one conference paper presented by Roger Burrit on environmental disclosure. There
is no mention of future developments, unlike their counterpart, the AICA.
A contact with ACF (Melbourne Office) provided copies of environmental impact
studies conducted on mines in PNG. There were guidelines developed by ACF for all
Australian companies overseas. These are attempts to assist MNCs to develop resources
in a sustainable manner for the mutual benefits for both the developer and the host
country.

215
The Australian Green Party Senator, Bob Brown was contacted for the Green's view on
environmental disclosure. His reply contains the Greens' stand on MNCs. They are
currently opposing Multinational Agreements on Investments (MAI) by MNCs. Their
argument is that MAI will benefit MNCs which, in their view, promotes human rights
violation and environmental degradation. This argument supplements ACF' s as presented
by Rosenbaum ( 1996), that MN Cs target developing countries for their operations. Once
inside, they exploit the weaknesses.
The next chapter will conduct the main analysis and discuss the results of the main
analysis. The hypotheses formulated will also be tested based on the results of the main
analysis. The main analysis is a replica of the pilot study but will not show details. Only
descriptive results will be derived and discussed with their implications.

216
Chapter Six
Data Analysis, Results & Discussion
6.1 Introduction
The purpose of this chapter is to analyse the annual reports collected from the sample of
:MNCs, tabulate the results obtained, and discuss them. The analysis seeks to determine
the extent, pattern and quantity of current environmental disclosure of the MNCs in the
four environmentally sensitive industries: forestry, manufacturing, mining and oil & gas.
Although Guthrie and Parker (1990) and Deegan (1996) earlier noted environmental
reporting among Australian companies to be deficient and lagging behind other
developed countries, Deegan and Gordon (1996) noted some improvements in the
period of 1983-1991. This study will note, in part, what has happened since that period
to the Australian companies concerned. Deficiency in environmental reporting is partly
due to lack of interest and action in Australia over environmental disclosure, in
complete contrast to increased government and public calls for additional disclosure in
other parts of the world (Gibson and Guthrie 1995).
This chapter will :
1. analyse the sample MNCs' annual reports for current environment disclosure. The
analysis seeks features such as environment regulations, company environment
policies, conservation efforts, including targets, training, environment expenditure,

217
awards, recycling, litigation, and audits. These features will reveal the extent,
patterns, and trends of the current MN Cs environmental disclosure practices.
2. tabulate the descriptive results of the above analysis. Results of the analysis include
the identification of the features mention in (I), affirming their location and
quantifying them into the number of words used. The number of words used in
reporting the above named features will be counted and tabulated. Their descriptive
data (median, mean and standard deviations) will also be computed where
appropriate and compiled.
1 3. test the two hypotheses formulated and discuss their results. Descriptive results
complied with (2) will be used in testing the hypotheses and results discussed in
relation to the objectives of the study. Inferences will be made, based on the results
of the tests.
This analysis is intended to establish the current extent of MNCs' environmental
disclosure from their operations that impact on the environment. The analysis will also
enable the investigation to observe whether MNCs characteristics such as industry, size
and their operation have any influence on the extent of their disclosure. Any trends and
changes, along with their causes will be noted. All this is built around the premise that
accounting disclosure has a positive role to contribute in the environmental degradation
debate.

218
This chapter deals with the descriptive results of the study. Tabulated summaries of the
main analysis are used to compile the descriptive information that will enable hypotheses
testing and inferencing. This section contains the description of the three phases of
content analysis (attribute, assertion and semantic) used for this analysis. The rest of this
section outlines the chapter' s specific aims and its overall structure.
Method of Analysis
Content analysis is defined (chapter 5) as a research technique for making both replicable
analysis and valid inferences from data to context (Krippendorf, 1980). It is popular,
with wide application in sociology (Adams et al, 1998), however, four criteria must be
complied with for its effectiveness (Guthrie and Gibson, 1995):
1. analytical characteristics must be clearly and operationally defined,
2. categories must be objectively defined so there is no ambiguity in
classification,
3. information must be quantitative, ie choices must be made in ways of
quantifying them, and
4. it needs a reliable coder given the weaknesses it has, eg. arbitrariness.
There are three phases of content analysis these are, attribute, assertion and semantic.
Attribute analysis establishes the presence of the environmental features reported.
Assertion analysis then affirms their locations and categorises the features into
Wiseman's (1982) classification. Location is rated as significant because the information
content accessibility may be influenced by its location. Semantic analysis quantifies the

219
environmental disclosure. The quantity of the environmental disclosure is determined by
an actual word count of environmental information.
The analysis identifies features of environmental reports such as company environmental
policies, recurrent or non-recurrent expenditure, training programs, rehabilitation
programs, awards and litigation information, notes their locations and quantifies the
features for each industry and for each year. Total disclosure will enable this study to
determine if the MNCs' disclosures are adequate to address the environmental issues. If
their disclosures are deficient, then the accounting proposal (chapter 2) will be applicable
and effective. Where there is adequate environmental disclosure addressing adverse
environmental impact, then alternative solution( s) need to be explored to address the
environment degradation issue.
Specific Aims of the Chapter
The specific aims of this chapter are:
1. To conduct the main analysis using three phases (attribute, assertion and sematic)
of content analysis.
2. To summarise the descriptive results of the analysis in 1 (above) into tables. These
tables will be concurrently completed during the analysis.
3. To discuss the results of the aims in 1 and 2 which are the central themes of the
chapter.
4. To test the two hypotheses using descriptive summaries of the analysis completed in
2 (above).
220
5. To discuss the results in relations to the ultimate objective of the study. The
ultimate aim is to determine whether Australian MNCs are adequately addressing the
environmental impact issue in their accounting records and practises.
Structure of the Chapter
To achieve the above specific rums, the structure of this chapter proceeds in the
following manner. The next section (2) provides a brief description of sample MNCs
contacted and their responses. The description of MNC characteristics includes their
industries, their operational and financial size, general characteristics, and their
disclosure. This provides the background information for the main analysis.
Section 3 presents the descriptive information collected from the analysis. Section 5.4.2
records the number of respondents either with or without reports. This section draws
out the actual amount and pattern of environmental information, factors that influence its
disclosure and the location of the environmental issues reported . Other information
necessary for analysis are: actual disclosure by different companies, industries, and years
in the period observed. The section concludes with a comparison of disclosure quantity
and the pattern ofMNCs' disclosure of the two groups.
Two hypotheses are tested in section 4. Hypothesis testing is based on the information
derived from the analysis in section 3. Hypothesis 1 will need the disclosure figures
from 1995-1996 to compare with 1992-1994. Since the lawsuit was filed in May, which
is close to the balance day, 1994 is included with 1992-1993 . There will have to be

221
greater disclosure after 1994 to reject the hypothesis. A similar hypothesis testing
approach will be used to test hypothesis 2 while pursuing the ultimate aim of assessing
the extent, degree and pattern of overall disclosure. The exception will be that specific
information will be required for each hypothesis which will come from appropriate data
collected and tabled earlier in section 2.
The final section (5) summarises the analysis and the results obtained. Where there is a
lack, or a minimal amount, of environmental disclosure, accounting proposals ought to
be suggested to address the environmental impact issue. This is not feasible if an
increased environmental disclosure is matched by an increased environmental
degradation. A different approach is then needed to be taken to solve the environmental
impact issue. There is also the limitation that only four environmentally sensitive
industries are studied here and these may not be adequate to make any valid inferences to
other industries.
6.2 Sample Multinational Corporations (MNCs)
This section provides the background information to the descriptive data collected by
describing the sample MNCs responses, their operational and financial size, their general
characteristics and the industries they represent. Their general characteristics includes
capital structure, parent/subsidiary status, their operations and ranking.

222
6.2.1 Sample Responses and Number of Annual Reports Received
Requests for annual reports were mailed to one hundred and twenty companies. As
outlined in section 5.4, the response from the sample MNCs was good. Of these MNCs,
95 responded to the request for their annual reports. Table 5-4 (appendix) presents the
actual responses of the contacts. Of the 95 respondents, 83 submitted annual reports
(figure 5-5a), however only 72 :MNCs were purposively selected. These 72 MNCs had
three or more annual reports in sequence and operated from 1992-1996 continuously.
The total of annual reports for analysis is 347. These annual reports are analysed and
summarised in the next section (6.3).
6.2.2 Size of Sample MNCs
The sample MNCs are in the top 500 Australian companies by market capitalisation
(Shareholder Huntley, 1997) with 36 in the top 100 Australian companies. The overall
size of the sample is measured in operational size (sales and profit) and financial size
(assets) as presented in Table 6-1 (appendices). Sales, assets and profitability have been
categorised into ranges (Table 6-la) to determine whether any relationship exists
between size and environmental disclosure. All size measures are 5 year averages. The
study analyses for the extent and pattern of disclosure over a 5 year period because
observations over an extended period are more reliable (Hackston and Milne, 1996).
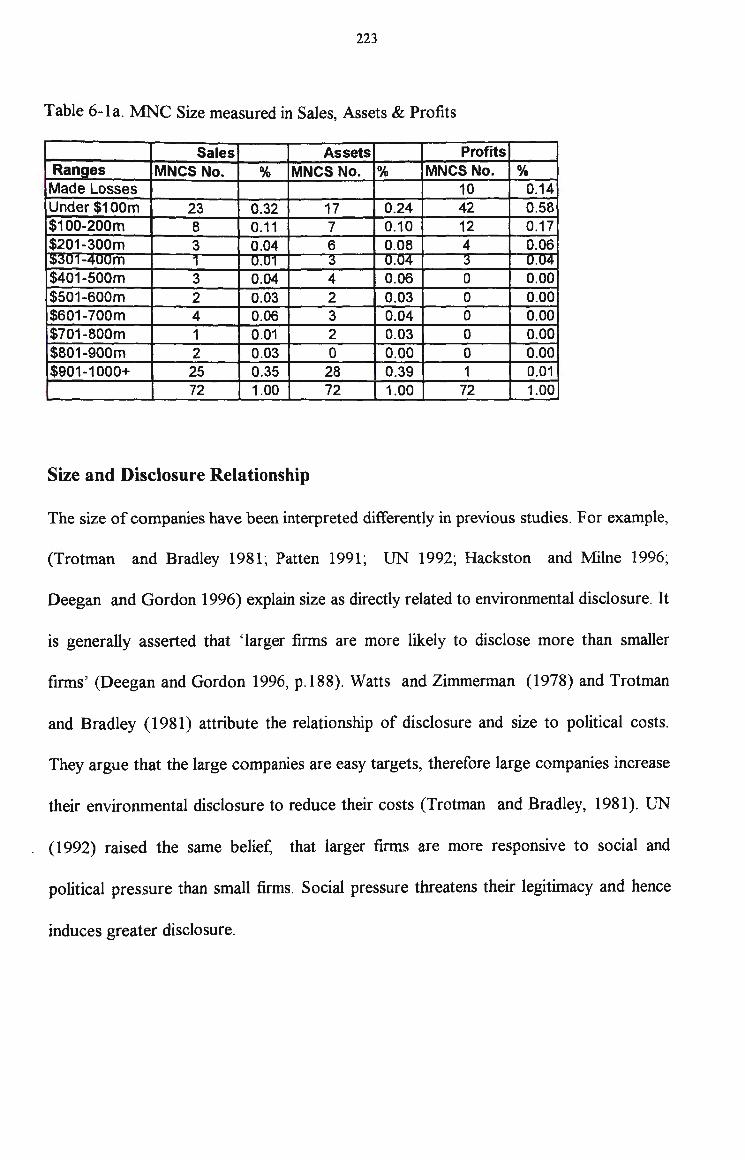
223
Table 6-la. MNC Size measured in Sales Assets & Profits '
Sales Assets Profits Ranges MNCS No. % MNCS No. % MNCS No. %
Made Losses 10 0.14 Under $100m 23 ' 0.32 17 0.24 42 0.58 1
$100-200m 8 0.11 7 0.10 12 0.17 $201-300m 3 0.04 6 0.08 4 0.06 I ;i>,jU ·1-400 m 1 U.O'T ;j U.04 ;j 0.U4
$401-SOOm 3 0.04 4 0.06 0 0.00 $501-600m 2 0.03 2 0.03 0 0.00 $601-700m 4 0.06 3 0.04 0 0.00 $701-800m 1 0.01 2 0.03 0 0.00 $801-900m 2 0.03 0 0.00 0 0.00 $901-1000+ 25 0.35 28 0.39 1 0.01
72 1.00 72 1.00 72 1.00 ,
Size and Disclosure Relationship
The size of companies have been interpreted differently in previous studies. For example,
(Trotman and Bradley 1981; Patten 1991; UN 1992; Hackston and Milne 1996;
Deegan and Gordon 1996) explain size as directly related to environmental disclosure. It
is generally asserted that 'larger firms are more likely to disclose more than smaller
firms' (Deegan and Gordon 1996, p.188). Watts and Zimmerman (1978) and Trotman
and Bradley ( 1981) attribute the relationship of disclosure and size to political costs.
They argue that the large companies are easy targets, therefore large companies increase
their environmental disclosure to reduce their costs (Trotman and Bradley, 1981 ). UN
(1992) raised the same belief, that larger firms are more responsive to social and
political pressure than small firms. Social pressure threatens their legitimacy and hence
induces greater disclosure.

224
Size differences among the participants is vague since the sample MNCs are all large in
the top 500 Australian companies. That is why, 3 features (sales size, assets size and
profits size) of the sample are considered individually in Tables 6-2a to 6-2c. These
Tables are extracted and modified from Table 6-la. An interesting feature emanating
from the analysis is that both sales and assets display a bimodal distribution with two
modes.
Table 6-2a depicts the sales distribution. Of the sample, 32 percent made less than
$1 OOm sales while another 3 5 percent made sales in excess of $900m. This leaves 3 3
percent between the two extremes. Figure 6-2a presents it graphically below.
In a similar formation of distribution, 24 percent of the sample own assets of less than
$100m while another 39 percent had assets greater than $900m as depicted in figure 6-
2b. The rest, 37 percent are spread between $100m to $900m. They approximately
correspond to the sales ' measures and popularity because sales range distribution pattern
partly correlates with assets distribution range with some differences. As anticipated of
large MNCs, there are more in the top bracket owning assets worth more than $900.

225
Table 6-2a Sales Distribution among the 72 Sample MNCs No of MNCs Perctage
23 32 8 11 3 4 1 1 3 4 2 3 4 6 1 1 2 3
't 25 35
35
30
25
Ill
~ 20 Ill -c GI !:! 15 GI a.
10
5
0
Figure 6-2a. Sales Distribution among Sample MN Cs
23 8 3 3 2 4 2 25
Number of MNCs
Despite the differences, three distinct groups of lMNCs emerge from the sales and asset
distribution from what is generally the top 500 Australian companies by market
capitalisation. There is one group at each end of the range while the third group is
loosely spread between them. Data in Table 6-1 does not show any distribution pattern
or distinction between the MNCs. Only as the data is reorganised into ranges, does the
distribution pattern emerge and ranks the MNCs into their appropriate positions by
sales, assets or profit size (figures 6-2a-to 6-2c).
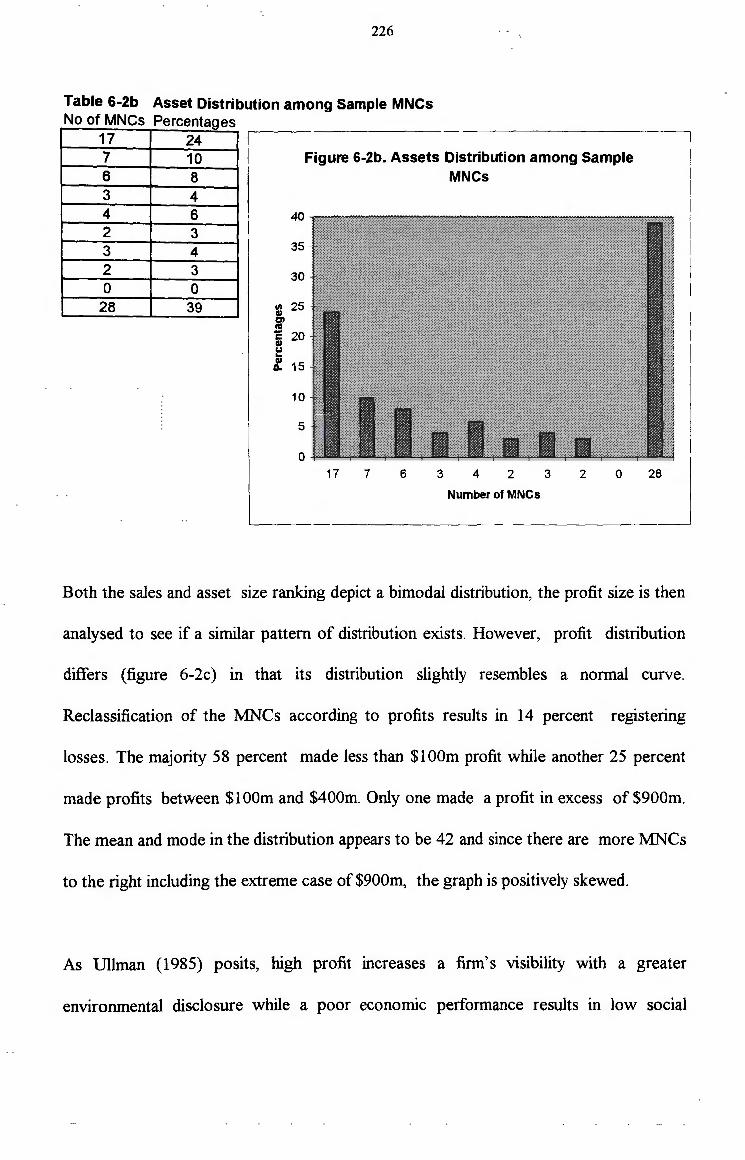
226
Table 6-2b Asset Distribution among Sample MNCs No of MNCs Percentages
17 24 7 10 6 8 3 4 4 6 40 2 3 3 4 35
2 3 30 0 0
28 39 = 25 Cl Ill c 20 GI u ~ GI
15 D.
10
5
0
Figure 6-2b. Assets Distribution among Sample MN Cs
17 7 6 3 4 2 3 2 0 28
Number of MNCs
Both the sales and asset size ranking depict a bimodal distribution, the profit size is then
analysed to see if a similar pattern of distribution exists. However, profit distribution
differs (figure 6-2c) in that its distribution slightly resembles a normal curve.
Reclassification of the 'MNCs according to profits results in 14 percent registering
losses. The majority 58 percent made less than $100m profit while another 25 percent
made profits between $1 OOm and $400m. Only one made a profit in excess of $900m.
The mean and mode in the distribution appears to be 42 and since there are more MNCs
to the right including the extreme case of $900m, the graph is positively skewed.
As Ullman (1985) posits, high profit increases a firm's visibility with a greater
environmental disclosure while a poor econonuc performance results in low social

227
disclosure. This suggests that environmental disclosure is related to company
profitability. The argument is sound because corporations have a single social
responsibility in business to direct all their resources to activities designed to maximise
profits (Freeman 1962). However, there are weaknesses with profit as a measure of size
as discussed in section 6.3.2. For example, profit is subjected to management
manipulation.
Table 6-2c Profit Distribution among Sample MNCs No of MNCs Percentages
10 14 42 58 12 16 4 6 3 4 0 0 0 0 0 0 0 0 0 0 1 1
.--~~~~~~~~~~~~~~~~~~~~~----,
Figure 6-2c. Profitability Distribution among Sample MNCs
1 0 42 12 4 3 0 0 0 0 0
No. of MNCs
There is conflicting empirical evidence on the relationship between profitability and
corporate social disclosure (CSD). Some studies allege a relationship exists between
profitability and CSD, while others fail to establish such a relationship. Vance (1975), as
cited by Abbot and Mouson (1979), alleged that profitability is inversely linked to
228
disclosure. However, this is only in the short run and the evidence is based on a 1974
study which was a disaster year for the stock market. Bowen and Haire (1976), and
Preston (1978), who used return on equity to examine the relationship empirically
provide results that support the existence of a relationship between disclosure and
profitability. Brown and Haire who surveyed 82 US food companies noted that those
who disclosed environmental information earned a higher return with a mean of 14.3
percent. Those who did not, only earned on average, 9.1 percent. Roberts (1992), also
found a positive relationship between lagged profit and CSD while Patten (1991 ), who
also used multi measures, including lagged profit, failed to establish this relationship.
Patten is supported by other studies (Davey, 1982; Ng 1985; and Cowen et al, 1987).
However, the results of the latter two studies are thought to be caused by small samples
and are being re-examined (Guthrie and Matthews, 1985).
Since there is conflicting empirical evidence as cited above on the relationship between
profitability and environmental disclosure, the focus remains with sales and asset sizes.
The discussion will return to sizes in section 6.3 .3, following a discussion of the
industries the sample MNCs represent and other MNCs' characteristics.
6.2.3 Industry
As outlined in chapter 2, this study is confined to only four environmentally sensitive
industries: forestry, manufacturing, mining and oil & gas. Both mining and forestry are
alleged to degrade the environment by the nature of their operations while the other two
have the potential to degrade. An exception are the MNCs from the service industry
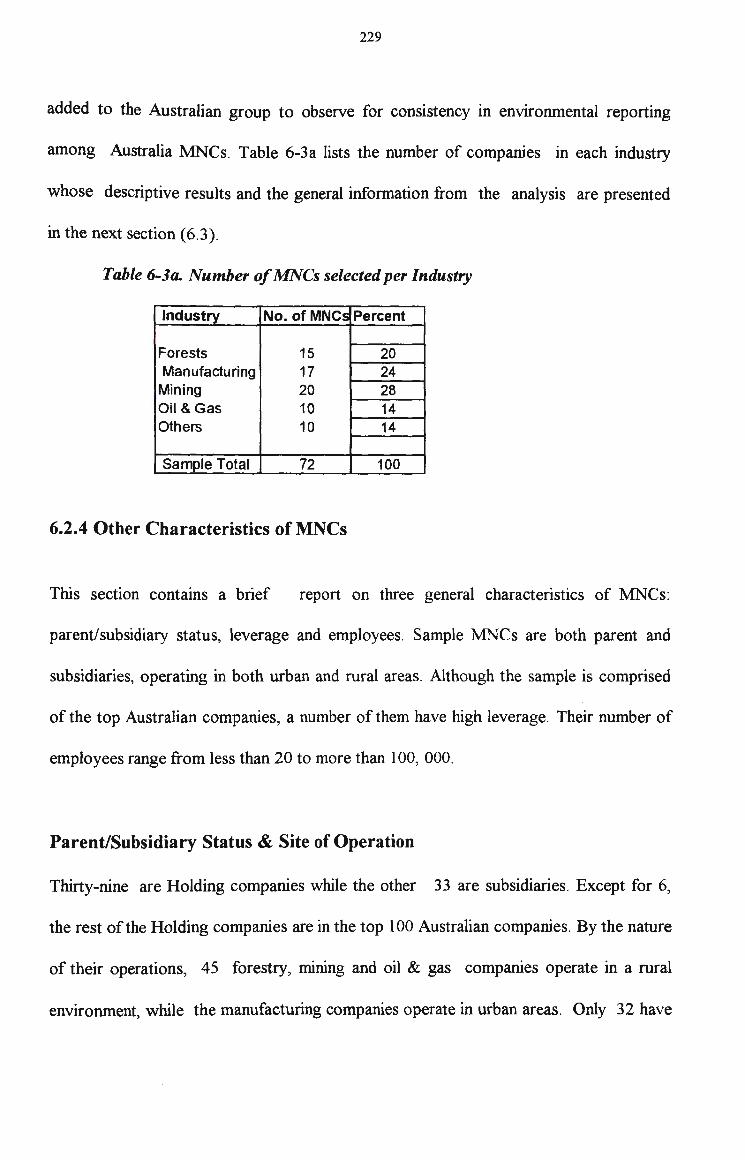
229
added to the Australian group to observe for consistency in environmental reporting
among Australia MNCs. Table 6-3a lists the number of companies in each industry
whose descriptive results and the general information from the analysis are presented
in the next section (6.3).
Table 6-3a. Number of MN Cs selected per Industry
Industry No. of MNCs Percent
Forests 15 20 Manufacturing 17 24 Mining ' 20 28 Oil & Gas 10 14 Others 10 14
Sample Total 72 100
6.2.4 Other Characteristics of MN Cs
This section contains a brief report on three general characteristics of MNCs:
parent/subsidiary status, leverage and employees. Sample MNCs are both parent and
subsidiaries, operating in both urban and rural areas. Although the sample is comprised
of the top Australian companies, a number of them have high leverage. Their number of
employees range from less than 20 to more than I 00, 000.
Parent/Subsidiary Status & Site of Operation
Thirty-nine are Holding companies while the other 33 are subsidiaries. Except for 6,
the rest of the Holding companies are in the top 100 Australian companies. By the nature
of their operations, 45 forestry, mining and oil & gas companies operate in a rural
environment, while the manufacturing companies operate in urban areas. Only 32 have
230
environmental committees or have representatives on environmental boards such as the
Australian Environment Protection Authority (AEPA). This may shed some light on the
pattern, extent and quantity of their environmental disclosure although these
characteristics are not discussed in relation to environmental disclosure.
Level of Leverage
The rate of leverage and the number of employees are the other two features of the
l\ANCs noted. Even though the sample is ranked in the top 500 Australian companies by
market capitalisation, their leverage pattern is delicate. Only 3 percent have a low
leverage ofless than 10 percent. The majority, consisting of 87 percent, rely on external
debts ranging from I 0 to 50 percent, another 7 percent exceeds 50 percent leverage. It
is not the intention of this study to discuss what is an appropriate leverage, only to note
what the MNCs' leverage levels are. Neither will disclosure analysis be correlated to
leverage.
Number of Employees
Apparently, 50 percent of the sample employ less than 1000 employees. The lowest
being only 16 by an oil & gas company. The highest is a retail company which employs
· 148,000 followed by a mining company which employs 49,000. Creation of employment
as a benefit of MNCs has been discussed in chapter 2. This section only reflects on the
employment numbers in the sample MNCs.

231
A brief review on these characteristics of MNCs is given in passing but is not meant to
be associated with the pattern of the sample's disclosures. Separate studies into each
characteristic is necessary to observe their influence on disclosure. For instance,
employers were mentioned in the last chapter as lobbying for environmental friendly
employers. Given the restricted time frame for this analysis, only two characteristics,
industry and operations, and size of companies have been associated with disclosure.
These characteristics are isolated above and are discussed as influencing disclosure
below.
6.3 Descriptive Results of the study
This section presents the descriptive data collected from the analysis of the sample of 72
MNCs who operated between 1992-1996 in PNG and Australia. The content analysis
contains two major sections, in line with the objectives of the study. The first major
section (6.3) presents the descriptive statistics related to the amount of environmental
disclosure issued and the impact of the MNC operations as reported in their annual
reports over the 5 year period. The next major section (6.4) is based on section 6.3 and
reports the results of analysing the pattern of disclosure, results of hypotheses testing and
the potential influence of significant events on the .MN Cs pattern of disclosure.
Descriptive statistical results of the empirical survey are divided into four summaries.
The first contains the report on the total amount and the pattern of environmental
disclosure within MNCs annual reports. The analysis describes the total environmental

232
disclosure by the sample MNCs, their averages and pattern of environmental disclosure.
The pattern of environmental disclosure is described by the average disclosures and their
dispersion.
The second describes two characteristics of MNCs identified in the literature as
potentially influencing environmental disclosure. These are the nature of operation/type
of industry and the size of MNCs. For each factor, its total disclosure, average
disclosure and its dispersion are recorded in order to draw any significant differences in
their disclosures.
The third gives the total disclosure of environmental issues, affirms their location within
the annual reports and analyses the characteristics of the MNCs that may influence
disclosure patterns. Such a breakdown forms a matrix with many cells. Ideally, every
cell and its interdependencies should be analysed for an exhaustive description of results.
However, insufficient data in some cells prevents an exhaustive analysis. Consequently,
the analysis will concentrate only on areas where there is ample data in order to make
statistically meaningful inferences.
The fourth summary compares and contrasts the results of the disclosure quantity and
pattern between the :MNCs that operate in PNG and those that operate in Australia. The
purpose of including an Australian group is to provide a control group to compare with
those operating in PNG.
233
6.3.1 Amount and Pattern of Environmental Disclosure
Content analysis as outlined in section 5. 4 determines the total amount and pattern of
environmental disclosure for part 1. This analysis is conducted in three stages using:
attribute, assertion and sematic analysis (Janis, 1965). Environment features are
identified under attribute analysis and categorised into Wiseman' s (1982), classification
(stage one). Assertion analysis follows on (stage two) to affirm the location of the
classes before quantifying them in the third stage (semantic analysis) through a word
count of environmental attributes per company, per industry and per annum. This is
intended to provide the total environmental disclosure for the sample .MNCs, their
average disclosure, dispersion and their pattern. The pattern of disclosure will be
deduced from their average disclosure and its dispersion.
Total Disclosure
Of the four units of quantifying environment attributes reported, this study selects
word count to ensure that the quantification of environment information is thorough.
The choice is not necessarily for accuracy because there is the likelihood of committing
errors of omission m usmg the smallest unit of the four possible counts for
quantification.
Word count disclosure of each individual MNC in the sample is shown in Table 6-1. It
was observed that the quantity of disclosure among the 72 sample .MNCs varied from a
minimum of 19 to the maximum of 5276 words. Since the range (19 - 5276) is wide,

234
total disclosure is classified into an interval of 1000 words range (column 1 of Table 6-4)
for a convenient analysis. Total disclosure, mean, standard deviation and an average page
for the five year period (1992-1996) are computed and tabled in columns 2-5 . Mean
disclosure is derived by dividing total disclosure by 5, which is the number of years in
the period.
Finally, an average page disclosure is calculated for comparison with other studies.
Average page is determined by dividing the average number of words by 576 words.
(The rest of the formula is given under the graph (figure 6-4a) .) The average pages
range from 1.83 to 6.94 pages. It was found that the highest range of greater than 5000
words had the lowest average pages because there is only one MNC in that sample
which provided more than 5000 words (5276) of environmental information. Thus NA
appears in the standard deviation column of that response size.
Standard deviations were also calculated to observe the pattern of the dispersions from
the mean. Since the quantity of disclosure varied, the standard deviation dispersed
accordingly, in the group. However, deviations were narrow or minimal. The highest
dispersion is 280.46 words from a mean of 3756 words and the lowest is only 70.17
words from a mean of 2500.8. This suggests that the disclosure in this range varied
little. A general observation is that disclosures above 3000 words have a lower
dispersion rate. Because the group is small, variability is minimal.

235
It appears from table 6-4, and figure 6-4a in particular, that there are two groups of
respondents. One group discloses below 3000 words and another group discloses above
3000 words. Each group has a mode (bimodal), those below 3000 have a 1001-2000
words range while the second group have a 4001-5000 range. Despite this observed
bimodal distribution, the majority of the response size are between 1001-2000 and
2001-3000 words which are equated to 6.94 and 6.52 pages, respectively.
The overall mean of the whole sample is 2460. 7 words which is equated to 4.27 pages.
An average of 4.27 pages is higher than any of the other studies on Australian MNCs
environmental disclosure. This growth appears to be associated with the remarkable
growth in the early 1990s which Gray et al ( 1995) observed, especially among
environmentally sensitive industries (Deegan and Gordon, 1996). Guthrie and Parker
(1990) who studied 50 Australian companies observed a low percentage increase
compared to the US and UK. The US had the highest disclosure of 1.26 pages compared
to Australia's 0.70 page.
Although Patten (1992) found Exxon reporting 6.0 pages of environmental information
following the Valdez's oil spill in 1989, this is an exception. Exxon was legitimising its
existence which was under threat following the spill (Patten, 1992). Exxon's report
appeared in two parts: a 3.5 pages report on the Valdez incident and another 2.5 pages
on other environmental issues. Further, Exxon's high disclosure represents just one
company's environmental disclosure whereas the 4.27 pages represents an average of 72
MN Cs. Irrespective of these differences, 2 industries (mining and forestry) in this sample

236
came under scrutiny and the concerned compames may have increased their
environmental reporting to legitimise their existence and operations. Where the increase
is attributed to
this, the high disclosure of 4. 2 7 pages will provide evidence of legitimation.
Table 6-4 Total Disclosure of Environmental Issues for all Sample Annual Reports by Amount of Disclosure (Word Count)
Size of Total Mean for Standard Average Responses Disclosure 5 years Deviation Pages
1000< 9943 1988.6 251.47 3.45 1001-2000 19980 3996.0 273.76 6.94 2001-3000 18783 3756.6 280.46 6.52 3001-4000 7335 1467.0 154.86 2.55 4001-5000 12504 2500.8 70.17 4.34 5000> 5276 1055.2 NA 1.83
Overall 2460.7 4.27
Figure 6-4. Total Disclosure of Environment Issues by Sample Companies
20000
;:::- 18000 c 5 16000 0 "E 14000
!. 12000 GI 10000 .. ::::r Ill
8000 ..2 u Ill 6000 c ! 4000 ~ 2000
0 1000< 1001-
2000 2001-3000
3001-4000
Range of Responses
4001-5000
5000>
Avg page is based on: I line=12 words and 48 lines per page. Therefore 1 page=576 words ( 48*12)

237
6.3.2 Influential Factors for Environmental Disclosure
The literature reviewed on environmental disclosure reveals that different factors
influence environmental disclosure. Niskala and Pretes (1995) for example, observed
Finnish companies for voluntary environmental disclosure. Their study observed that
overall environmental disclosure increased by 20 percent over a 5 year period. Notable
increases were among oil, forests and energy industries. Energy companies' disclosures
doubled over the observed period. Thus the authors concluded, that environmental
disclosure is industry related, because increased disclosure was more prevalent in some
industries than others.
Patten ( 1992) was prompted by the Valdez oil spill to observe environmental disclosure
among oil companies. The author investigated the effect of the spill on the companies in
the industry. The annual reports of 21 oil companies analysed revealed that disclosure
increased after the spill. As cited earlier, Exxon increased its disclosure by 10 times
from 0.6 page in 1988 to 6.0 pages in 1989. A strong relationship was noted between
social disclosure and the legitimacy theory where the oil companies increased their
disclosure to deflect the environmental issue and reduce what Miles (1987) calls
· exposure. Exxon devoted 3. 5 out of the 6 pages to report on the oil spill incident alone,
this appears to have been an attempt to legitimise and/or deflect attention from the
exposure (spill). This leads to the conclusion that the nature of the operation and the
resultant external pressure influences environmental disclosure, thereby prompting
comparues to deflect exposure and legitimise their operations. This 1s also being
238
observed in PNG with the mining and forestry industries which disclose more only
when they come under scrutiny for environmental damages.
6.3.2.1 Industry & Nature of Operations Influence Disclosure
Industries, and the nature of their operations are related, in that the type of industry
determines the nature of its operation. For instance, the Valdez incident brought all
major oil companies under the spotlight because they all transport oil and have the
potential to spill it causing environmental damages. The mining and oil & gas industries'
nature of operation is extractive. As such, they are bound by the same or similar
requirements, eg the UIG 1995 Release, for all extractive industries discussed earlier. In
the current study both mining and forestry industries came under scrutiny, not because
they are extractive industries but because of their alleged destructive nature of
operations.
UIG ( 1995), cited above, requires disclosure of restoration and rehabilitation with
reclamation commitment and contingencies. UIG Abstract 4 contains the requirement
called: Disclosure of Accounting Policies for Restoration Obligations in the Extractive
industries. The requirement is for companies to disclose the amount of restoration
obligations recognised as liability, and the accounting method applied to recognise it.
Schedule 5 of the corporations law, also requires companies to disclose within the notes
any material liabilities. In compliance, all the extractive industries among the Australian
sample disclosed more environment information with averages greater than I 000 words.
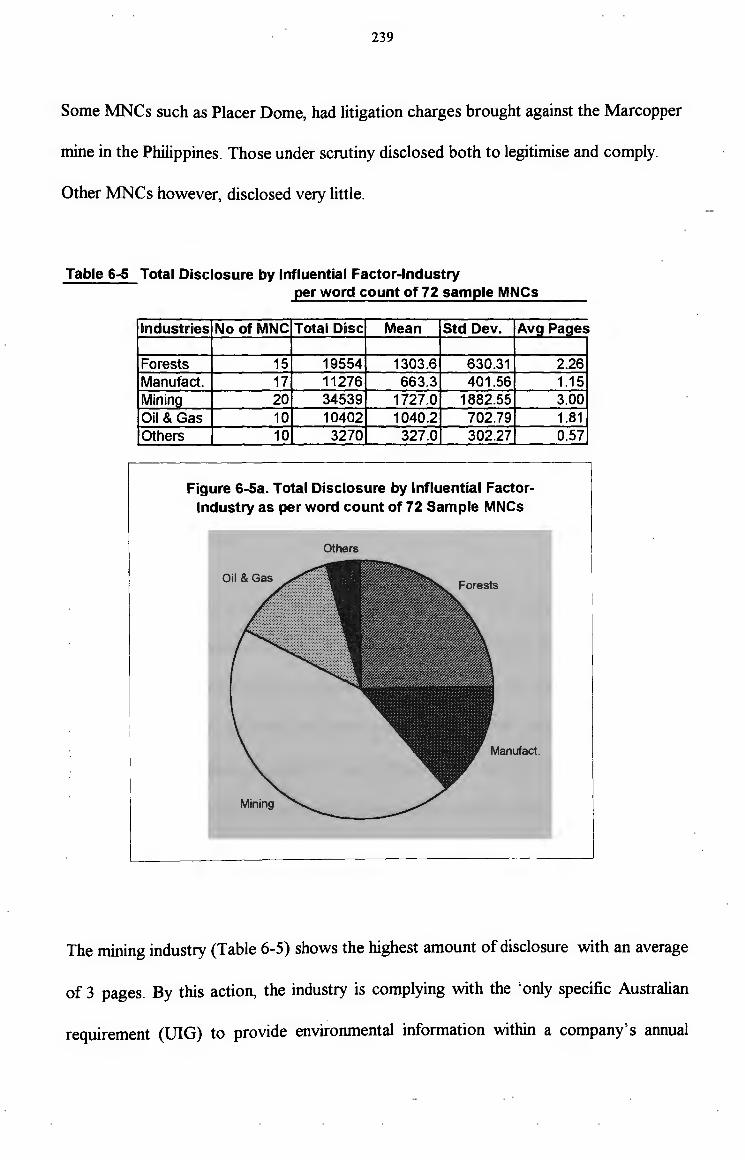
239
Some MNCs such as Placer Dome, had litigation charges brought against the Marcopper
mine in the Philippines. Those under scrutiny disclosed both to legitimise and comply.
Other MNCs however, disclosed very little.
Table 6-5 Total Disclosure by Influential Factor-Industry per word count of 72 sample MNCs
Industries No of MNC Total Disc Mean Std Dev. Ava Paaes
Forests 15 19554 1303.6 630.31 Manufact. 17 11276 663.3 401.56 Minina 20 34539 1727.0 1882.55 Oil & Gas 10 10402 1040.2 702.79 others 10 3270 327.0 302.27
Figur:e 6-5a. Total Disclosure by Influential FactorIndustry as per word count of 72 Sample MNCs
Others
2.26 1.15 3.00 1.81 0.57
The mining industry (Table 6-5) shows the highest amount of disclosure with an average
of 3 pages. By this action, the industry is complying with the 'only specific Australian
requirement (UIG) to provide environmental information within a company's annual
240
report' (Deegan, 1996). This is represented by the largest sector of the pie graph in
figure 6-5a. Their mean word average is 1726 with a wide dispersion (standard
deviation) of 1882.55 words. This high dispersion is due to variations in reporting,
where some reported more than others.
The forestry industry has the second highest mean of 1303.6, with a standard deviation
of 630.31 words in the sample. It also has the second highest average of 2.26 pages
of reporting over the period. This is because it is an industry that is alleged to be causing
environmental degradation in PNG. While it is not an extractive industry like mining,
the industry is still alleged to be causing environmental damage by its activities of
harvesting logs. Table 6-5 shows those companies under scrutiny disclose more,
followed by those with potential to degrade while the 'others' group disclosed the least.
The oil & gas has an industry average of nearly 2 pages ( 1. 81 pages) which supports
the argument that extractive industries disclose their liabilities and their method of
determining their liabilities. The manufacturing industry discloses the lowest average of
the group. The least industrial disclosure average is from the 'others' group although
they have the same number of subjects as oil & gas. Their industry average is only 0.57
page. This is consistent with other Australian studies that show environmental disclosure
is industry related. Those in the sensitive industries disclose more.
Total disclosure, as influenced by an industry, is contained in Table 6-5. Unlike Table 6-
4, the mean is calculated by dividing the industry total disclosure by the number of
industrial representatives in the sample (Table 6-3a) to determine an industrial average.

241
The industrial average is indicative of each industry's quantity of environmental
disclosure. Industry is just one of two influential factors for environmental disclosure.
The next section observes size as another influential factor for disclosure.
6.3.2.2 Size influences Disclosure
Sales made, assets owned or even number of workers employed are some of the ways of
measuring size (Tilt, 1997). Deegan and Gordon (1996) noted that environmental
disclosure is a feature of large public companies where size is the determinant factor.
Size has been consistently associated with environmental disclosure by studies such as,
Kelly 1979, 1981; Trotman and Bradley 1981 ; Pang 1982; and Cowen, Ferreri and
Parker 1987.
Although size was discussed at length under organisational, financial and operational
levels (section 2); content analysis was not conducted under each of these size measures
directly. However, from the list of characteristics (Table 6-2) of sample MNCs, Tables 6-
2a - 6-2c were constructed showing operational size (sales made and profits earned) and
financial size (assets owned). Data for size, as an influential factor, is drawn from both
Tables 6-2 and 6-2a. Table 6-2 provides disclosure per sample MNC while Table 6-2a
enables grouping.
Whilst the size of the MN Cs in the sample has been measured by both operational and
financial sizes in Table 6-2a, Table 6-6 is based only on operational size. Data for
operational size (Table 6-6 and Figure 6-6) are derived from Table 6-2a, columns 1 and
242
2 and its accompanying discussion. MNCs are categorised into three groups or ranges:
less than $1 OOm, greater than $1 OOm but less than $900m and greater than $900m.
Operational size includes sales made and profit earned by the MNCs in the sample,
however, only sales made is selected here. There are two main reasons for this choice.
First, disclosure by MNCs as measured by size will enable this study to be compared
with Deegan and Gordon (1996) which is a secondary objective of this study. This study
begins in 1992 to extend the investigation where Deegan and Gordon ended their study.
Their study assessed whether environmental disclosure has increased among Australian
companies. The authors used sales as a measure for size. The choice of sales here is to
enhance consistency and comparability. Further, Niskala and Pretes (1995) who studied
voluntary environmental disclosure also used sales as their measure for size. These
authors choose Finnish companies who were ranked in the top 100, based on sales
made. Therefore, the choice of sales as a measure of size is consistent with previous
studies.
Second, profit is not chosen as an influential factor because it has several weaknesses.
Profit is not an accurate measure for size since it is subjected to manipulation as pointed
out above. Profit is not internally valid, therefore it is not an objective measure of
operational size. Using Table 6-2 as an example, a number ofMNCs made losses and the
majority (58 percent) made less than $100m profit although they are large with
diversified operations and own huge assets. Only one made in excess of $900m profit.
243
Thus, size by profit will not produce any significant differences as most MNCs made less
profit and there is not much dispersion to indicate a correct profit distribution.
Total environmental disclosure in this sample of the MNCs increased with their
operational size. Under a normal distribution, the middle range (more than $1 OOm and
less than $900m ) should contain the bulk of the population and display greater
disclosure. On the contrary, disclosure depicts size. The mean, standard deviation and
the average pages also increased with their size. (Average pages are determined as in
other tables; mean is divided by the number of words (576) to a page) . Standard
deviation in each range varied in proportion to the disclosure size. Such a result is
consistent with studies named above as well as others like Trotman and Bradley ( 1981 ),
Cowen et al (1987); UN (1992); and Kirkman and Hope (1992) that environmental
disclosure is a feature of large firms . Those in the top group disclosed more, although
the dispersion is high among them.
Organisationally, MNCs are large and are easily visible in their operations and
consequently become easy targets. Affected MNCs react to reduce political costs by
increasing their environmental reports. Trotman and Bradley ( 1981) noted a relationship
between size and disclosure where large firms disclosed more than the small ones to
legitimise their existence.

244
Table 6-6 Total Disclosure by Influential Factor:Size per word count of sample (72) MNCs
Operational Size Total Disclosure Standard I Ranae Disclosure Mean Deviation
$0 to $100m 17379 789.95 842.35 $101m to $900m 23689 911.12 1095.2 $901m + 37962 1581.7 1485.5
Average Page
1.37 1.58 2.75
Figure 6-6. Total Disclosure by Influential Factor: Size
$901m +
Ill DI c ca 0::: $101m to $900m
:s en $Oto $100m
0 5000 10000 15000 20000 25000 30000 35000 40000
Total Disclosure (Word Count)
Financial size, measured in assets owned, is not used here for two reasons. First, the
studies named above observed environmental disclosure in relation to sales made rather
than assets owned. This is not to deny that assets owned was not used as a measure of
size. Deegan and Hallam ( 1991) used sales made, assets owned and profits earned as
measures of size and found them to be highly correlated. Second, assets owned has a
similar pattern of distribution (Table 6-2a, column 4& 5) observed by means of sales
made and this is likely to result in a similar disclosure pattern. Like sales distribution,
three ranges exist: there are 24 companies (33 percent) in the lower end with assets
worth less than $200 million, a second group of 20 companies (28 percent) with assets

245
worth between $200 million and $900 million and the last group of 28 companies (39
percent) own assets worth more than $900 million. The bulk of the MNCs fit into the
category of sales greater than $900m. This disclosure pattern in figure 6-6 correlates
with the sales made (figure 6-2a) and assets owned (figure 6-2b) disclosure patterns
where those with higher sales or more assets disclosed more.
6.3.2.3 Other Influential Factors
From the discussion in the forgone paragraphs, it is concluded that the major influential
factors can be summarised as size, and nature of operation/industries. There are other
factors such as regulatory requirements and pressure from lobby groups which
influence environmental disclosure. Although both of these factors do influence
environmental disclosure in PNG, they are not investigated for two reasons. First, this
study is an accounting approach to the environmental issues which both the legislature
and lobbyists are battling with in PNG. PNG has environmental legislation, such as the
Environment Planning Act 1978, which does not seem to be containing the problem of
environmental degradation. That is why the PNG environmental lobby groups are
exerting pressure on MNCs to make the legislation work.
Second, environmental lobbyists reports are self complied and not empirical. As such,
they may be biased. Two lobby groups working in PNG are the Australian Conservation
Foundation (ACF), and Greenpeace International. Greenpeace International contributed
towards the environmental issue by drawing up the PNG Forest policy. ACF's reports
246
centre on environmental impact focussing on the Fly River and the Pogera mine.
Although their efforts have been effective, they are time and event specific. This study
suggests that accounting as a long term approach to address the problems is a more
effective approach to the total problem.
There are a number of other 'minority' lobby groups whose influence induces greater
environmental disclosure. In one pioneer local empirical study on the role of lobbyist in
environmental disclosure, Tilt ( 1994) discovered that environmental lobby groups
actively seek information from companies' annual reports. Backed up with information
extracted from different companies annual reports, they lobby for improvements in
environmental issues. Employees lobby for clean, safe and innovative companies thus
compelling companies to legitimise with greater pressure on environmental disclosure.
Even customers pursue producers with environmental credentials (Coopers & Lybrand,
1993). Coopers and Lybrand also note investors 'becoming wary of bad environmental
practices' because it creates liabilities and reduces their profits.
Contrary to coerced disclosure, some comparues provide voluntary environmental
information (Deegan, 1996). Of 197 companies from 50 industries which Deegan
studied, 71 firms (36 percent) provide environment information voluntarily. Companies
in Australia disclose environment information without legislation. The problem is that
their voluntary environmental disclosure is too general and predominantly qualitative in
the interest of the providers (Table 6-11).

247
Regulatory requirements for companies to provide an environmental report amends what
is generally qualitative environmental disclosure (Deegan, 1996). Several countries have
legislation on environmental disclosure. Among the US ' s initiatives is the Superfund
Amendments and Reauthorisation Act (SARA) which requires all companies to report all
emissions. Along with that, is the Organisation of Economic Cooperation and
Development's (OCED) current preparation of a guidance document for governments
considering the establishment of national pollutant inventories. In the UK an environment
Business forum has been established with a membership of more than 200 companies.
Member companies are urged to provide an environment performance report. The
Canadian Securities Commission (CSC) requires public companies in Canada to report
on both current and future financial and operational effects of environmental protection
requirements.
Regulatory influence is not as developed in PNG or Australia, as Deegan (1996)
observed, as in Canada, the US, UK or Germany. However, their representative MNCs
in PNG ought to implement the regulatory requirements that they are subjected to in
Australia. This will eventuate when these :MNCs operations are effectively policed by
PNG's DEC. The restraint is that PNG's own environmental legislation must be
effectively policed before the DEC can enforce any external legislation.
248
6.3.3 Disclosure of Environmental Issues
This section identifies the mam issues reported and notes their locations. Using
Wiseman's (1982) classifications, the following environmental issues are discussed:
environmental regulations, company environmental policies, conservation or
rehabilitation, environmental expenditure, awards, recycling, litigation or lawsuit, eco
audit and environmental committee representation. Although Roberts ( 1991) has
similar classifications, of environmental issues, Wiseman (1982) categorises the main
environmental issues MNCs address. Less frequently addressed issues which are
omitted in the above list, include employee training to be environmentally friendly,
sponsoring community members to tertiary institutions, and conducting short courses.
For example, courses on how to response to an accidental oil spill .
The main environmental issues are sought in the following locations of annual reports:
tables of content, separate pages, mission statements, chairmans' reports, annual
reviews, health, safety and environment, financial statements and notes, and separate
reports. Such a break down forms a matrix with many cells (Table 6-7). Ideally every
cell should be analysed along with their interdependencies for an exhaustive analysis.
However, there is insufficient data to complete every cell and time constraints prevents
such a comprehensive analysis. Therefore this thesis will not attempt to do a
comprehensive analysis of all cells.

249
Table 6-7 Environmental Issues & their Location in the Annual Reports Statutory Company Conservation Environment Litigation Waste & Awards/
Issues> Regulations Policies Rehabilitation Expenditure Lawsuits Recycling Eco-audit Locations: I
Table of '
Content Mission
Statement Separate
Page Annua'I '
Review Health ,Safety & Environment
Financial Statements
& Notes Separate
Report
The nearest attempt to analyse these issues is in Table 5-la and Table 5-lb for the
location of environmental reports. Both of these tables were constructed and complied
during a pilot study. What is common to both tables is that only mining and forestry
disclose some features of the above issues in the various named locations, except for
the issuing of separate reports. The information collected in Table 5-la & 5-lb was
expressed as percentages and as a word count. Even then, many cells are still blank.
Consequently, there is incomplete information and this analysis will only comment on
areas where there are data on location and environmental issues based on Table 6-8.
Table 6-8 which appears on the next page has a word count of environmental
disclosure in the different locations of MNC annual reports. The mean, standard
deviation and an average page count are computed from the observed disclosure.
Figure 6-8 is constructed based on data from Table 6-8 . (Column 2 has numbers
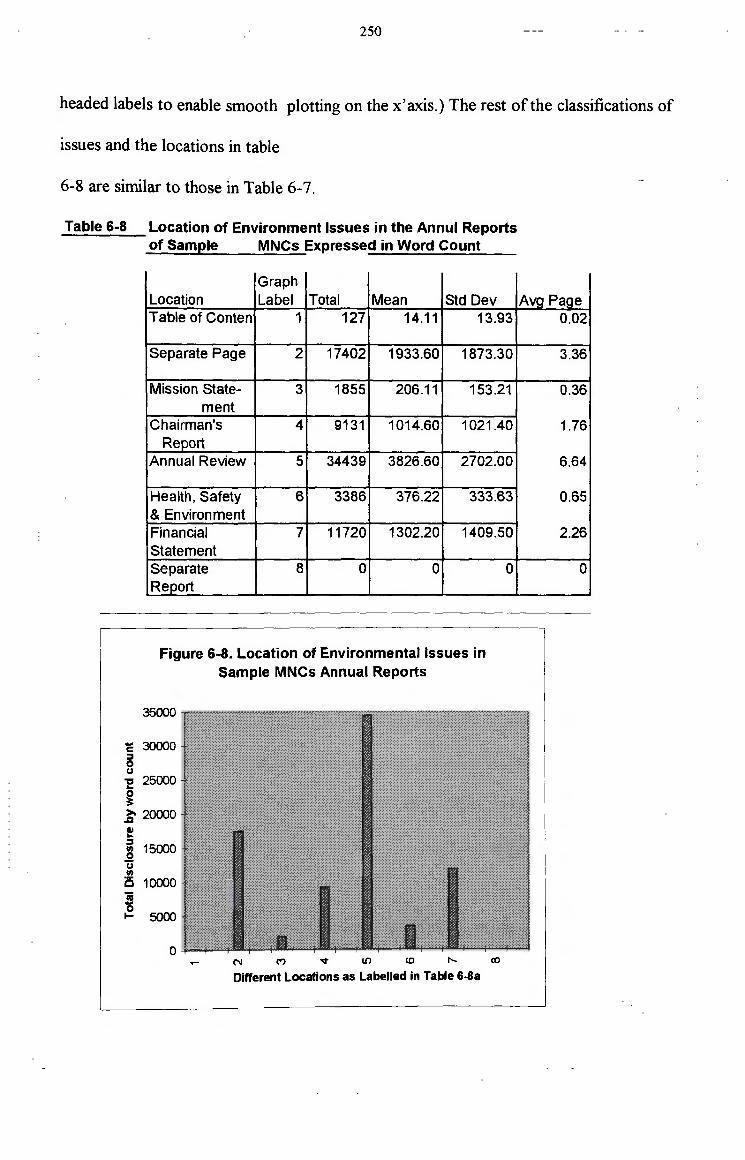
250
headed labels to enable smooth plotting on the x' axis.) The rest of the classifications of
issues and the locations in table
6-8 are similar to those in Table 6-7.
Table 6-8 Location of Environment Issues in the Annul Reports
-c :ll 0 u
"Cl .. 0 ~
of Sample MNCs Expressed in Word Count
Graph Location Label Total Mean Std Dev Table of Conten 1 127 14.11 13.93
Separate Page 2 17402 1933.60 1873.30 '
Mission State- 3 1855 206.11 153.21 ment
Chairman's 4 9131 1014.60 1021.40 Report
Annual Review 5 34439 3826.60 2702.00
Health, Safety 6 3386 376.22 333.63 & Environment I
Financial 7 11720 1302.20 1409.50 Statement Separate 8 0 a 0 Report
Figure 6-8. Location of Environmental Issues in Sample MNCs Annual Reports
30000
25000
~ 20000 QI .. :ll
15000 Ill 0 u Ill
l5 10000 ii 0 ~ 5000
0 N <"> 'V l{) (0 r-.. co Different Locations as Labelled in Table 6...!la
Avg Page 0.02
3.36
0.36
1.76
6.64
0.65
2.26
0

251
Unlike Finland (Niskala and Pretes, 1995), the prov1s1on of separate environment
reports is not practised in Australia (Deegan, 1996). Thus the separate report is
eliminated from possible locations. Separate environmental reports is an indication
that the issue is very important for it to stand alone (Kirkman and Hope, 1992). Only
one of the sample MNC (Burns Philip - manufacturing industry) claims to issue
separate environmental reports on request. However, the company only dispatched
their environmental policy leaflet when requested. Only one mining company (Placer
Pacific) issued a separate report in 1997 called' Towards Sustainability'.
Placer Pacific Ltd ( 1997) became the first company to issue a separate environmental
report in response to the public' s demand for sustainable economic development.
According to their managing director, theirs is the first in Australia and in the global
mining sector. The report was compiled to meet the current stockholders' demand for
sustainable and collaborated business operations (Placer Pacific, 1997). Although the
report is presented subsequent to the Ok Tedi lawsuit, it is outside this study's time
frame (1992-1996). The Ok Tedi case may have instigated its compilation because the
company's executives claim that it was to meet public demand, another form of
legitimisation.
Actual environmental disclosure appears mainly in financial statements and notes to the
accounts, separate pages, within annual reviews and under the chairman's reports.
Extractive industries report on their conservation/rehabilitation efforts and liabilities in

252
the financial statements and the accompanying notes. These notes contain litigation
liabilities, provision for restoration and reclaimation as stipulated by the UIG 1995
Release. Disclosure in the :financial statements has a mean of 1302.2 words with a
substantial dispersion of 1409.5 words from the mean.
The rest of the disclosure appears on separate pages, under the chairman's report and
under the annual review. Separate page reporting appears to be the best of the three
options with everything together and therefore easy to locate. Unfortunately, not every
MNC presents environment reports in separate sections. What is presented separately
is easy to quantify and that is why it has the second largest quantity of disclosure after
the annual review. This is in complete contrast to Niskala and Pretes (1995) where
Finnish companies presented less than one page of separate page reports.
Within the chairman's reports are the highlights of the year. Items discussed there
include regulations with their impacts on their organisations. Future projections also
appear in this section. Their successes are highlighted with greater emphasis on profits
made, awards received, and projects commissioned. The problems reported are
quickly deflected by comments such as, 'the incident will not have any material impact
on the operation of the company' . Positive disclosure outweighs negative disclosure
(Table 6-11 ). Table 6-11 analysed for positive as against negative disclosure and found
positive disclosure dominating among the sampled MNCs. Since this section is a brief
review, total disclosure, mean, standard deviation, and average page are lower than the
above named disclosure locations.

253
The annual review presents a substantial amount of environmental reporting. Since it
covers a wide range of issues, total disclosure is the highest. The mean is high and so is
the dispersion. The average page is the highest of all locations. However, there is a
down side to the annual review disclosures. That is, repetition of information because
it reviews the whole of the year's activities.
Still other MNCs present their report on a site by site basis, summarised under
environment, health and safety or just scattered throughout the PR. Site by site
presentation has its merits. It meets the individual shareholder's needs, although an
overall picture of the entity is essential. Individual projects are also subjected to
different risks, such as political, financial (currency) and even social which will prompt
disclosure. What is not separated is lumped together under Health, Safety and
Environment. The combination constitutes social disclosure and creates problems in
quantifying environmental disclosure. Only those relating to the environment are
extracted from such sections. In contrast, some environmental reports are scattered
throughout the annual reports which only diligent searchers will locate.
This section would have been more exhaustive if it classified environmental issues
observed under MNC characteristics. This did not eventuate due to insufficient data.
Part of the discrepancy is due to the conflict in imposing environmental issues
disclosed into sections. Guthrie and Matthew (1985) and Guthrie and Parker (1989,
1990) argued that such grouping loose their richness. Those who propose
sectionalising like Kirkman and Hope ( 1992) argue that placing them in certain
254
locations gives status, accessibility and fully integrates environmental issues with the
rest of the reports. Despite this difference of opinion, results obtained in this section
will now be used in the next section (6.3.4) to contrast the two groups in the sample.
6.3.4 Environmental Disclosure: Quantity & Pattern of MN Cs
operating in PNG v Australia
The final section compares and contrasts the quantity and pattern of environmental
disclosure between the MNCs that operate in Australia and those which operate in
PNG. Both groups are represented in the mining, forestry, manufacturing and oil & gas
industries. The Australian sample has an extra group of MN Cs from tertiary industry
to compare for consistency in reporting among the Australian MNCs.
The mining and forestry industries, which are alleged to be degrading the environment
in PNG, provide the most environmental information. They disclosed on average more
than 3 pages of environment information (rounding off for forestry) in the Australian
sample. The rest of the discussion on the quantity of environmental disclosure is based
on Table 6-9. This table contains total disclosure measured per industry, per annum,
with an extension to include averages and standard deviations. Mean disclosure is
equated into the number of papers for comparison.
The PNG sample of mining and forestry's mean disclosure were 4868.8 and 2191.6
words with standard deviations of 1542.2 and 547.99 respectively. The Australian
255
sample of mining and forestry ' s means were 203 9 and 1 719 words with standard
deviations of 768.62 and 673 .9, in that order. Dispersion among the Australian group
is lower, which may be attributed, to the Environment Protection Authority (EPA) laws
in every state, and the UIG requirements which ensure consistency. The forestry
industry in PNG disclosed the lowest among mining and forestry groups.
The mining industry in PNG reported an average of 8.45 pages compared to 3.54 in
Australia. Of the four industries, environmental reporting among the mining industry
varied the most with a standard deviation of 1542.2 words. Wide dispersion is caused
by some MNCs like Placer Dome reporting more than other companies. MNCs in
PNG came under scrutiny (Baral Annual Report, 1994 ), and therefore, reported more
to legitimise their existence and their operations.
Oil & gas and manufacturing m the PNG sample have potential to degrade the
environment yet they did not disclose as much as mmmg or forestry . This was
anticipated as the focus was mainly on these two sensitive industries. Oil & gas
companies operating in Australia reported more, with a mean of 1211 words and a
standard deviation of 568 . 71 while their counterparts in PNG had a mean disclosure of
869.4 and a standard deviation of 845 .55 . Oil & gas in PNG is an extractive industry
subjected to the UIG 1995 requirements, referred to earlier, and ought to report more.
However, it has not faced any major crisis in PNG as its forestry and mining industries
have. Secondly, the oil & gas industry has only a few oil fields in PNG with a few
MNCs involved.
256
Interestingly, the manufacturing industry in PNG exceeded oil & gas with its mean
word disclosure of 1313 .2 and a standard deviation of 499.35. As pointed out earlier,
this industry is rated as small by the AusAid Report (1996), however, it is expanding
with a number of major projects either just or about to be commissioned (1998). In
contrast, the Australian sample's manufacturing MNCs had a lower mean of 942 and
standard deviation of 165 words. Contrasting them, based on the number of pages, the
sample in PNG disclosed more in 2.28 pages while those in Australia disclosed only
1.64 pages. Those in PNG vary more by dispersion than those in Australia. The
amount of disclosure with their mean, standard deviation and average pages, actually
reflect the their sensitivity towards the environmental issue, beginning with mining
down to 'others' (Table 6-9).
Finally, the MNCs in the 'others' group only reported a little more than a page of
environmental disclosure. While they are only among the Australian sample, their
quantity of disclosure is consistent with Kelly' s ( 1981) study, where the author noted
those in the primary and secondary industries disclosed more environmental information
compared to the tertiary industries. Nonetheless they had some social disclosure as they
are consumer driven industries with some impact on the environment. These total
disclosed information from the three industries discussed will enable the testing of
hypotheses in the next section (6 .4).
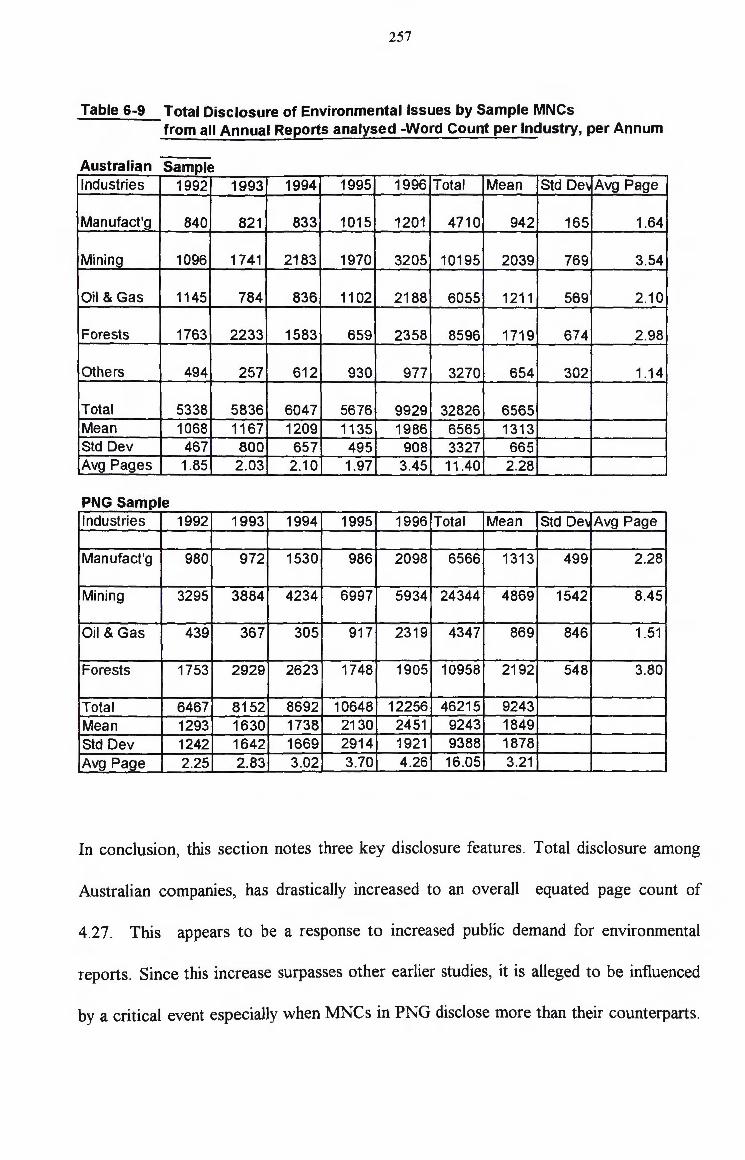
257
Table 6-9 Total Disclosure of Environmental Issues by Sample MNCs from all Annual Reports analysed -Word Count per Industry, per Annum
Australian Sample Industries 1992 1993 1994 1995 1996 Total Mean Std De1 Avg Page
Manufact'g 840 821 833 1015 1201 4710 942 165 1.64
Mining 1096 1741 2183 1970 3205 10195 2039 769 3.54
Oil &Gas 1145 784 836 1102 2188 6055 1211 569 2.10
Forests 1763 2233 1583 659 2358 8596 1719 674 2.98
Others 494 257 612 930 977 3270 654 302 1.1 4 I
Total 5338 5836 6047 5676 9929 32826 6565 Mean 1068 1167 1209 1135 1986 6565 1313 Std Dev 467 800 657 495 908 3327 665 Avg Pages 1.85 2.03 2.10 1.97 3.45 11 .40 2.28
PNG Sample Industries 1992 1993 1994 1995 1996 Total Mean Std De\ Avg Page
Manufact'g 980 972 1530 986 2098 6566 1313 499 2.28
Mining 3295 3884 4234 6997 5934 24344 4869 1542 8.45
Oil & Gas 439 367 305 917 2319 4347 869 846 1.51 I
Forests 1753 2929 2623 1748 1905 10958 2192 548 3.80
Total 6467 8152 8692 10648 12256 46215 9243 Mean 1293 1630 1738 2130 2451 9243 1849 Std Dev 1242 1642 1669 2914 1921 9388 1878 Avg Page 2.25 2.83 3.02 3.70 4.26 16.05 3.21
In conclusion, this section notes three key disclosure features . Total disclosure among
Australian companies, has drastically increased to an overall equated page count of
4.27. This appears to be a response to increased public demand for environmental
reports. Since this increase surpasses other earlier studies, it is alleged to be influenced
by a critical event especially when MNCs in PNG disclose more than their counterparts.
258
Two key factors (size and industry) influenced this increase. Although environmental
issues were sought against locations, insufficient data prevents a complete matrices
analysis. Analysis of available data shows that MN Cs in PNG disclose a greater quantity.
Overall disclosure is summarised into descriptive results to test the two hypotheses
before any valid inferences are made.
6.4 Testing Hypotheses
Section 6.3 exammes the results of the overall level and pattern of environmental
disclosure among the sample. The analysis then looks at the potential influence which
characteristics of MNCs such as, operational size and the type of industry with the
MNCs' particular nature of operation might have on the amount and pattern of
disclosure. A comparison of quantity and pattern of environmental disclosure is made
between the MNCs that operate in PNG with those in Australia. The analysis continues
in this section to consider the potential variation in the amount and pattern of disclosure
over tim~. The section begins with the critical event by presenting and analysing the
results of the two hypotheses tested to observe whether the critical event has any
influence on environmental disclosure.
Time frame, Critical event & Disclosure
The time period is the same, 1992-1996. This period is significant because it contains a
specific critical event that could be expected to significantly influence the amount and
pattern of environmental disclosure of the MNCs. The event is the Ok Tedi lawsuit in

259
which people of the Western Province sued OTNIL (BHP), for a sum of $3 billion for
environmental damages caused by the Ok Tedi mine. This dispute was settled out of
court for only $11 million in 1996 with the PNG government's intervention.
Other studies, such as Patten (1992) and Andrew (1994), indicate that critical incidents
like the OTML lawsuit induced significant changes in environmental disclosure
behaviour among the MN Cs. Patten ( 1992) observed that oil companies increased their
environmental disclosure after the Valdez spilt oil in Alaska, March 1989. Exxon, whose
vessel spilt the oil, increased its environmental disclosure ten times from 0.6 page in
1988 to 6.0 pages in 1989. Other oil companies also increased their environmental
disclosure although they were not the offenders, in this instance. Subsequent
development from this incident is the Valdez principles which promotes greater
environmental disclosure.
Andrew ( 1994), reports that the deadly methylisocyanate gas leak at Union Carbide's
Bhopal plant (India) has greatly changed the behaviour of chemical industries towards
the public. This incident eventually led to the requirement for increased disclosure about
the presence and the release of toxic chemicals. It began with the SARA as the first US
piece of legislation for the chemical industry. Since the critical event, the chemical
industry has changed its attitude towards environmental disclosure.
260
Testing the 2 Hypotheses
The general context of this study is to develop ways and find strategies to monitor and
control the environmental degradation caused by the MNCs in PNG. It can be shown
that
this can be achieved through the use of environmental accounting as a potential tool for
monitoring and controlling environmental degradation. The MNCs' current accounting
practises, as reflected by their environmental disclosures are investigated to establish the
extent, the degree and pattern of current disclosure to which Australian MNCs, in
particular those operating in PNG, have incorporated environmental reporting as part of
their overall accounting and financial reporting practices. This analysis is intended to
observe whether the observed results in the above studies are replicated in PNG as the
result of the Ok Tedi lawsuit. Observation thus far (section 6.3), is that MNCs in PNG
are disclosing more, despite deficiencies in enforcing environmental legislation.
The purpose of the analysis is to see whether the critical event is associated with the
pattern of disclosure in the immediate years before and after the critical event. Two
issues are analysed here. The first is whether the critical event is associated with a
statistically significant increase in the average levels of environmental disclosure. The
second issue is whether the increase was persistent or whether the increase only occurred
in the year following the event then reverted back to its former average levels of
disclosure.

261
Hypotheses I and 2 are formulated to test these issues. To achieve this, the results from
section 6.3 will be utilised for testing the two hypotheses. For the sake of clarity, each
hypothesis will be restated for testing. Both hypotheses are given in the form of null
hypotheses to permit testing for the statistical significance of any observed differences in
average disclosure by the application of the appropriate t-test.
6.4.1 The First Hypothesis is stated as follows: Hypothesis 1:
H1:Environmental disclosure did not increase among the Australian MNCs
following the Ok Tedi lawsuit but rather remained constant over the period of
1992-96.
This hypothesis centres around the Ok Tedi lawsuit of 1994. Two writs were filed by
the villagers along the Fly river against OT.ML (BHP) for environmental damages in the
Melbourne Supreme Court. This hypothesis observes whether a major environmentally
related event such as a lawsuit have any effect on the MNCs accounting practices and in
particular on their environmental disclosure. If the lawsuit has any effect, MNCs will
disclose more as a result. This is based on Legitimacy theory which states, that when an
entity is under threat, whether genuine or perceived, the organisation will increase their
social disclosure to legitimise both their existence and their activities (Lindblom, 1983).
The assumption here is that the sampled l\1NCs practice reporting environmental
information. This was observed by Deegan and Gordon (1996). An alternative to the
262
hypothesis above is that the disclosure will not increase but remain constant throughout
the observed period.
Hypothesis 1 is formulated in this manner to assess the MNCs' environmental reporting.
PNG has environmental legislation such as, the Environmental Planning Act 1978,
which is implemented by requiring every new project to present an environment impact
plan. This plan is to outline how the project's impact on the environment will be
mitigated. Projects are not commissioned unless their impact plans are acceptable.
However, due to lack of effective enforcement a continuous environmental degradation
is still experienced, despite the MNCs lodging acceptable impact plans. Effective
enforcement will ensure these impact plans are implemented, impacts monitored
throughout the project's life span and reported on a regular (annual) basis, in the MNCs'
annual reports.
The perpetuating problem is that the environment is being degraded as the result of
MNC activities. For instance, typical mining requires the construction of access roads
that destroys flora and fauna. Once the mine begins operation, wastes are disposed of
into waterways, blocking river transport, as well as polluting clean water used for
drinking and washing (Rosenbaum, 1996).
It was alleged that the Ok Tedi Mining Limited caused environmental damages in the Fly
river area which resulted in the lawsuit. Therefore this hypothesis seeks to examine the
environmental disclosure both before and after the incident to note the effect of the

263
critical incident on the MNCs environment reporting. Data in Tables 6-5, 6-10, 6-lO(a)
& 6-1 O(b ), with their accompanying figures (graphs), will be used to test hypothesis 1.
Table 6-10 contains the totals of environmental disclosure for the whole (72) sample of
MNCs. Data in this table was compiled from environmental issues, reported by MNCs,
to determine whether their total environmental disclosure over the period has increased,
especially after the critical event. Besides reporting their total disclosure, their mean and
standard deviation are also computed and included in the table. This descriptive statistics
will assist in observing variations in the total disclosure.
Data presented in Table 6-1 Oc, shows an increase in environmental reporting among the
two MNC groups after 1994. This table contains the individual MNC's pattern and level
of environmental disclosure for the period. Some consistently report environmental
information while others commenced reporting after the critical event. Those who were
in the practise of reporting before the incident, increased their level of disclosure.
Overall disclosure increased from 11 624 words in 1992, to 23 080 words in 1996. This
increase is shown below, both in words (Table 6-10) and in a graph (figure 6-10).
While those MNCs Australia only reached a maximum of 9997 words [Table 6-lO(a)] in
1996, those which operate in PNG exceed this total with an upper limit of 13083 words
[Table 6-lO(b)]. Their averages are rather small (161 to 321 words) because a number
of the MN Cs either did not disclose or provided a minimal environmental report. There
was even a slight decline between 1993 and 1994. However in 1995, disclosure
increased by 25 percent. This increase has been highlighted several times already in this

264
chapter. Fourteen "MNCs from both groups which did not provide any environmental
report during 1992-1994, provided environmental reports during 1995-1996 (Table 6-
10c appendix p.354). Many of those who did report prior to the incident began reporting
some environment information. Due to these changes, the average disclosure and
standard deviation fluctuated accordingly, between 200 and 350 words. This set of data
will enable the observation of total disclosure, their mean and standard deviations, both
before and after the critical event (The Ok Tedi lawsuit) which may have influenced the
MNCs' environmental reporting. The overall pattern of disclosure shows a consistent
increase until 1995 after which it escalated by 35 percent20. Even the bars in Figure 6-10
depict this change.
lO (23080-17091)/17091

265
Table 6-10 Total Environmental Disclosure Before and After Ok Tedi Lawsuit (word count of sample MNC disclosure)
Period: Total Disc Mean Disc Std Dev
1992 1993 1994 1995 1996 11624 13760 15687 17091 23080 161.44 191.11 190.18 237.38 320.97 219.23 315.82 255.41 320.44 343.14
Figure 6-10. Total Disclosure before and after Ok Tedi Lawsuit (word count of MNC disclosure)
1992 1993 1994 1995 1996
Period:1992-1996
Two other tables [ 6-10( a) & 6-1 O(b)] , are constructed from Table 6-1 0, separating the
MNCs operating in each country to compare and contrast the level and pattern of each
group's disclosure. Separate disclosure will first of all make possible the critical event's
influence on the MNCs which are all Australian. OTML, which was sued, is an
Australian company. Second, it will assist in observing the effect of the lawsuit on the
MNCs in PNG. Table 6-lO(a) and the accompanying figure represents the sample of
MNCs that operate in Australia. Their disclosure shows a gradual increase from 1992-
1994 but a decline in 1995 before picking up again in 1996. Variations (Standard
Deviation) remains steady in the 200s except in 1995 when it dropped by 6 percent.
Increases observed were 8 percent between 1992-1993 (153 .1-140.6)/140.6, and only

266
0.76 percent between 1993-1994 before dipping by 6 percent in 1995. This decline was
preceded by a major boost of 77 percent21 in 1996, the highest average disclosure for
the period.
It appears here that the escalation in the environmental reporting during 1996 among the
sample MNCs operating in Australia is associated with occurrences surrounding the
critical event. The initial occurrence is the issuing of writs in the Melbourne Supreme
Court in 1994. This writ was based on ACF' s published report in 1993 22. Disclosure, as
reported above, increased between 1992-1994 but declined in 199 5. This decline was
short lived as the ACF stepped up its efforts by forming an allegiance with Melanesian
Environment Foundation (.MEF) to serve PNG, the Solomon Islands and Vanuatu.
During the period of litigation, the ACF along with other concerned groups such as the
Uniting Church, Community Aid Abroad and the Friends of Earth joined forces in a well
published protest at the 1995 BHP annual meeting. The huge escalation in Australian
MNCs environment reports is noted in the very next year-1996 which may have come
as a result of publicity on the protests of the Ok Tedi disaster.
21 All percentage changes expressed here are based on the averages. 22 The sequence of events are taken from Rosenbaum & Krokerberg 1996, Habitat.
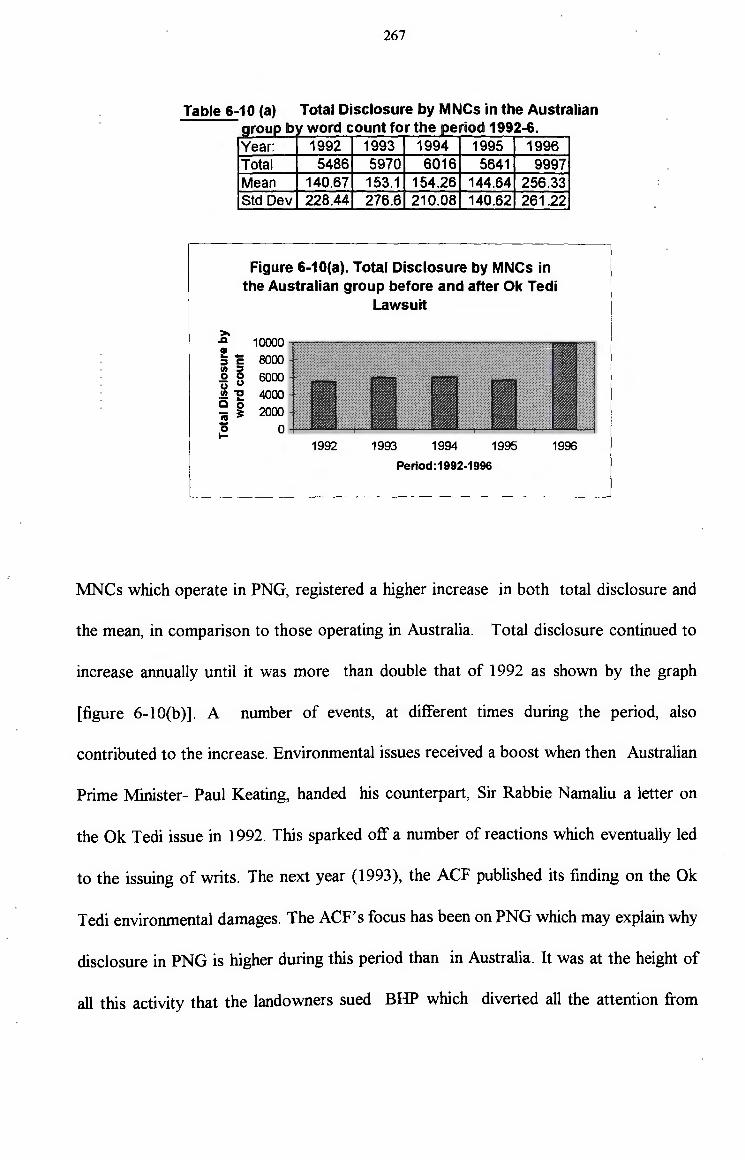
267
Table 6-10 (a) Total Disclosure by MNCs in the Australian d h aroup b·11 wor countfor t e period 1992-6.
Year: 1992 1993 1994 1995 1996 Total 5486 5970 6016 5641 9997 Mean 140.67 153.1 154.26 144.64 256.33 Std Dev 228.44 276.6 210.08 140.62 261.22
Figure 6-10(a). Total Disclosure by MNCs in the Australian group before and after Ok Tedi
Lawsuit
"" .'1 10000 GI ... - 8000 ::s c Ill ::s 0 0 6000 u u Ill "O 4000 i5 0 iii 31: 2000 - 0 0 I-
1992 1993 1994 1995 1996 Period:1992-1996
MNCs which operate in PNG, registered a higher increase in both total disclosure and
the mean, in comparison to those operating in Australia. Total disclosure continued to
increase annually until it was more than double that of 1992 as shown by the graph
[figure 6-1 O(b)]. A number of events, at different times during the period, also
contributed to the increase. Environmental issues received a boost when then Australian
Prime Minister- Paul Keating, handed his counterpart, Sir Rabbie Namaliu a letter on
the Ok Tedi issue in 1992. This sparked off a number of reactions which eventually led
to the issuing of writs. The next year (1993), the ACF published its finding on the Ok
Tedi environmental damages. The ACF's focus has been on PNG which may explain why
disclosure in PNG is higher during this period than in Australia. It was at the height of
all this activity that the landowners sued BHP which diverted all the attention from

268
PNG to Australia. Jwo writs _were issued in the following year (1994) based on
environmental reports.
What attracted most attention in PNG during 1995 was the deportation of the Fly river
landowners' Melbourne based lawyer. It was alleged that the government acted for
BHP to save OTML because the state is a shareholder and the mine is the major
source of state revenue. These events appear to have influenced the average
environmental disclosure during that period.
The possibility that the critical event was associated with an increase in total average
disclosure is tested by comparing the average disclosure by the MNCs in PNG for the
years prior to the event, 1992-1994 with the average disclosure by the same 3 3
companies for the two years (1995-1996) subsequent to the event. The year 1994 is
grouped with the years prior to the event because the writs were issued close to the end
of the financial year 1993-1994.
Since there are differences in average disclosures, a simple paired t-test for independence
was conducted with a null hypothesis that there is no major differences in the means
between the two periods: before and after. If there were any differences, they were
caused by a sampling error. The t-tests was conducted based on the total .NINCs'
disclosure in Table 6-lO(c) (appendix p.354) comparing the 1992-1994 with the 1995-
1996 means. The analysis in this table[ 6-lO(c)] shows the result of carrying out at-test
on the difference between the sample mean of the two periods, before and after the
critical event.
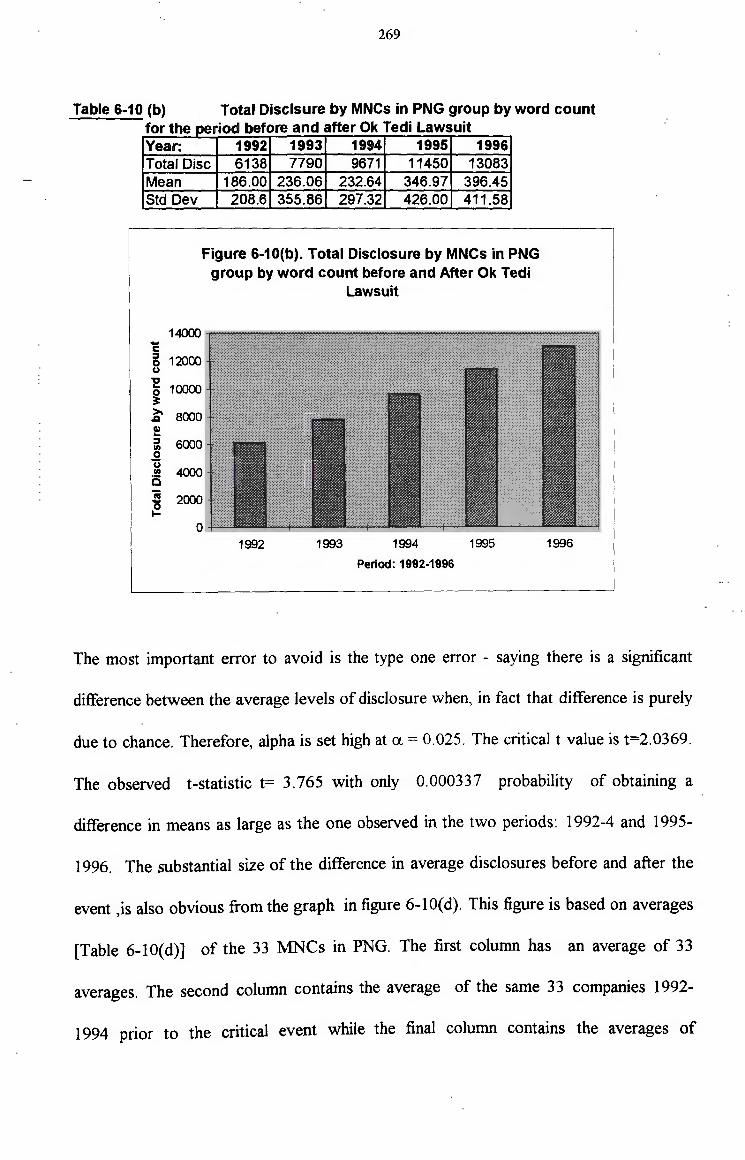
269
Table 6-10 (b) Total Disclsure by MNCs in PNG group by word count f or the oeriod before and after Ok Tedi Lawsuit Year: 1992 1993 1994 1995 1996 Total Disc 6138 7790 9671 11450 13083 Mean 186.00 236.06 232.64 346.97 396.45 Std Dev 208.6 355.86 297.32 426.00, 411.58
F'igure 6-10(b). Total Disclosure by MNCs in PNG group by word count before and After Ok Tedi
Lawsuit
-c :I 0 u -g ... ~ >. .Q
II) ... :I Ill 0 u Ill
i5 ii 0 ~
14000
12000
10000
8000
6000
4000
2000
0 1992 1993 1994
Period: 1992-1996
1995 1996
The most important error to avoid is the type one error - saying there is a significant
difference between the average levels of disclosure when, in fact that difference is purely
due to chance. Therefore, alpha is set high at a= 0.025. The critical t value is t=2.0369.
The observed t-statistic t== 3.765 with only 0.000337 probability of obtaining a
difference in means as large as the one observed in the two periods: 1992-4 and 1995-
1996. The substantial size of the difference in average disclosures before and after the
event ,is also obvious from the graph in figure 6-10( d). This figure is based on averages
[Table 6-lO(d)] of the 33 .MNCs in PNG. The first column has an average of 33
averages. The second column contains the average of the same 33 companies 1992-
1994 prior to the critical event while the final column contains the averages of

270
subsequent period 1995-1996. The later period's disclosure is greater surpassing earlier
years and even the total for the five year period. This graph is consistent with figures 6-
10, 6-lO(a) and 6-lO(b) where the later years show a higher disclosure.
Table 6-10 ( (ci) Comparison of Averages Before and After of MNCs that operate in PNG
Period: Total:92-6 Before:92-4 After:95-6 Avera es: 276.62 218.23 372.71
Figure 6-10(ci). Comparison of Averges Before and After of MNCs that operate in
Total:92-6 Before:92-4
Period in Years
After:95-6
If p < 0.025, then the null hypothesis that the difference is not due to sampling error is
rejected. Alternatively, if the p>0.025, then it is accepted that the null hypothesis and
the difference is due to sampling error. To establish whether the sample mean difference
is significant, a level of significance is set at a= 0.025. The test assumes a 97.5 percent
confidence interval, ie it will accept a 2.5 percent chance of error. However, a level of
confidence such as this (p<0.025) does not provide an absolute statement about the
accuracy of the null hypothesis. This is because there is the possibility of making a type
I, or type 2 error in any decision. Type 1 error occurs if the null hypothesis is rejected
271
when it should be accepted. This study is content with a 2. 5 percent chance of erring in
this decision. A lower level of significance would be better, because it minimises the
chances of committing a type 1 error.
However, the process of lowering a type 1 error increases the chance of committing a
type 2 error (Levin and Fox, 1997). The two errors are inversely related. A type 2 error
is committed when the null hypothesis is accepted when it should be rejected. One
possible solution for a type 2 error is to increase the sample. However, the current
sample of 72 MNCs is already statistically large. Whichever decision is made, it can
never be certain that it will not be wrong because the decision is based on a sample and
the population mean is unknown. The priority is determining which error is more
serious, since type 1 and 2 errors are inversely related. Therefore, the 2.5 percent chance
of error 1 is accepted in this case.
The difference in the two groups' means is sizeable, so that it is reasonable to assert
that the difference is more than a sampling error. There are increases in environmental
reporting in the period following the lawsuit, as depicted in Table 6-lO(c) which results
in varied averages and standard deviations of both groups. Consequently, the null
hypothesis is rejected.
Implications and relationship with other studies
The increase in environmental disclosure becomes apparent among the MNCs under
scrutiny the following Ok Tedi lawsuit. Unlike Walden and Schwartz (1997), who
272
noted that oil companies environmental reports which were 'time and event specific',
MNCs in this sample, continued to report greater amounts of environmental information
into the second year after the lawsuit. Walden and Schwartz's (1997) work extended
on Patten's (1992) observations on the Valdez's oil spill in Alaska. Patten noted that
environmental disclosure increased following the oil spill in 1989. However, Walden and
Schwartz (1997), observed total disclosure was lower in 1990 compared to 1989,
although Exxon's annual reports still had two sections: one focussing on the spill and
the other on general disclosure. Therefore, they concluded that Exxon increased its
environmental disclosure to deflect attention when their vessel (Valdez) spilt oil.
Environmental disclosure increased with the specific event (oil spill) which was only
temporary (time specific), because disclosure declined just one year later.
The current study's analysis notes that despite a slight decline in 1995, generally there
was an increase in environmental reporting. There was a 75 percent increase among
MNCs operating in Australia between 1995-1996 after a 6 percent decline over 1994-
1995. This general increase fulfils one aim of this study which is to observe if
environmental disclosure among Australian companies has improved since Deegan and
Gordon (1996) noted an increase from 1983-1991. By commencing in 1992, it extends
Deegan and Gordon's study to observe current developments among Australian
companies' environmental disclosure. This result confirms that environmental disclosure
among Australian companies is increasing. Therefore, it can be deduced, that surveyed
reports contradict the first hypothesis. Australian companies in this study, are
increasingly disclosing environmental reports voluntarily. Such increases are consistent

273
with Niskala and Pretes (1995) report that comparues do provide voluntary
environmental disclosure.
Hence, the hypothesis is rejected. Australian MNCs operating in PNG are no different to
those which operate elsewhere. They are responding to the public' s demand for
environmental reports. Hypothesis 2 is related to hypothesis I and will be tested after the
first hypothesis' rejection, that is, environmental reporting increased after 1994. Since
the disclosure did increase and hypothesis 1 is rejected, this hypothesis needs testing.
The question then is whether this significant increase in average disclosure after the
critical event, is limited to just 1 year following the event or whether it persists over a
longer period. This proposition is investigated in hypothesis 2 which puts the
proposition of persistence in disclosure in a negative form.
6.4.2 The Second Hypothesis restated reads: Hypothesis 2
H2: There is no difference in the average levels of disclosure for MNCs operating in
PNG for the years 1995 & 1996.
This hypothesis will be tested using Tables 6-IO(a) to 6-IO(e). From each table, only the
differences in averages will be analysed and discussed in relation to hypothesis 2. The
overall average in Table 6-10 shows an increase of 3 5 percent between 1995 and 1996.
This is a 10 percent rise over 1994-1995 after a 0.5 percent decrease in 1993/4. Because
274
the decline over 1994-1995 is very small, it is not noticeable in the graph (figure 6-10).
There is a gentle slope in the graph from 1992-1995 in figure 6-10 before the slope
becomes steeper from 1995-1996. A similar pattern of disclosure is seen in figure 6-
1 O(a). Although the average disclosure between 1992-1994 showed increases, there was
a decline between 1994-199 5 of 6 percent [ ( 144. 64-154. 64)/154. 64] . Then there was an
enormous increase of 77 percent [(256.33-144.64)/144.64] between 1995-1996. This
increase is distinct in figure 6-10( a) where the bar representing 1996 is the tallest in the
histogram. The rest of the years between 1992-1995 show a similar quantity of
disclosure average with the bars in the histogram showing similar heights.
While the Australian sample depicts a sharp increase in 1996, mentioned above, the PNG
sample shows the rise earlier in 1995 (Table 6-lOe). Figure 6-10( e) shows the
increases more distinctly. The average disclosure fluctuated slightly over 1992-1994.
The amount of average disclosure increased by 27 percent from 1992 to 1993 . This was
short lived, as it decreased by 1 percent in the following year 1994. However, average
disclosure was heightened by over 198 percent in 1995. This is evidenced by the sudden
rise on the graph (figure 6-10( e) and the range between 1994 and 1995. This was the
year after the critical event which brought all mining companies under scrutiny (Baral
Annual Report, 1994). The increase was maintained into the second year (1996), after
the critical incident, unlike Walden and Schwartz's (1997) observation in the Exxon's
environmental disclosure following the Valdez incident.
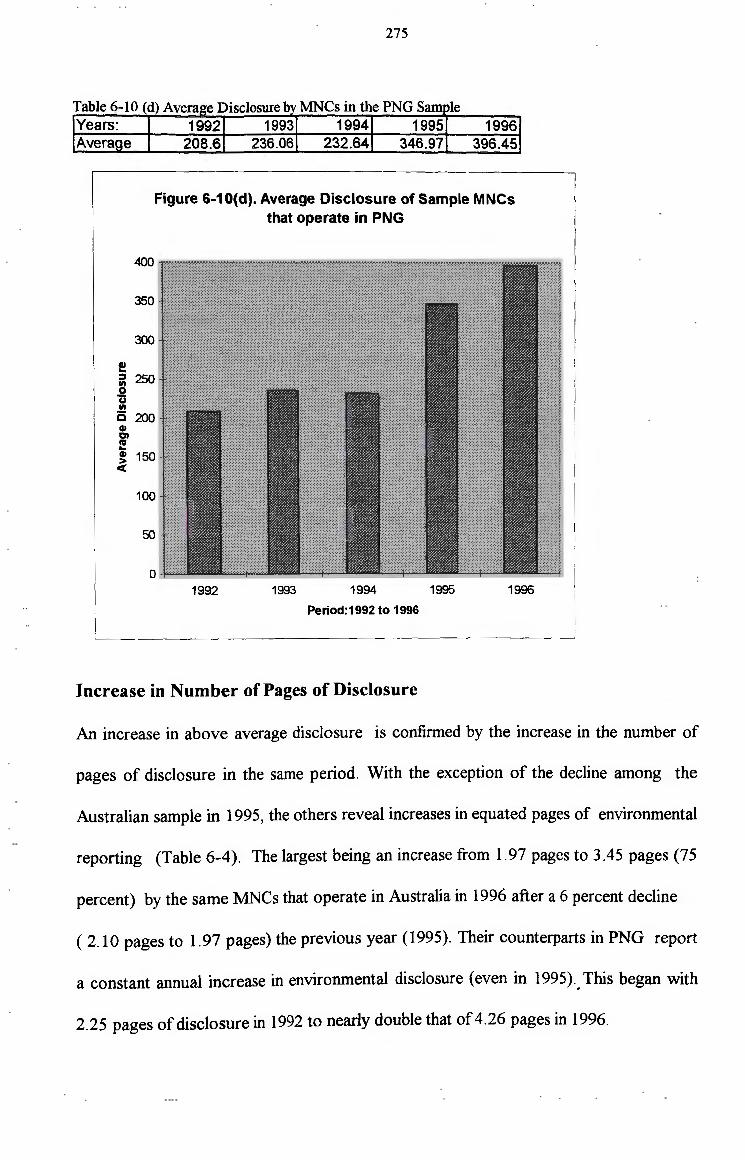
275
Table 6-10 (d) Avera e Disclosure b MNCs in the PNG Sam le Years: 1992 1993 1994 1995 1996 Avera e 208.6 236.06 232.64 346.97 396.45
Figure 6-10(d). Average Disclosure of Sample MNCs that operate in PNG
400
350
300
! ii: 250 0 u Ill
Q 200 GI QI ftl .. ~ 150 C(
100
50
0 1992 1993 1994
Period:1992 to 1996
Increase in Number of Pages of Disclosure
1995 1996
An increase in above average disclosure is confirmed by the increase in the number of
pages of disclosure in the same period. With the exception of the decline among the
Australian sample in 1995, the others reveal increases in equated pages of environmental
reporting (Table 6-4). The largest being an increase from 1.97 pages to 3.45 pages (75
percent) by the same MN Cs that operate in Australia in 1996 after a 6 percent decline
( 2.10 pages to 1.97 pages) the previous year (1995). Their counterparts in PNG report
a constant annual increase in environmental disclosure (even in 1995) .. This began with
2.25 pages of disclosure in 1992 to nearly double that of 4.26 pages in 1996.
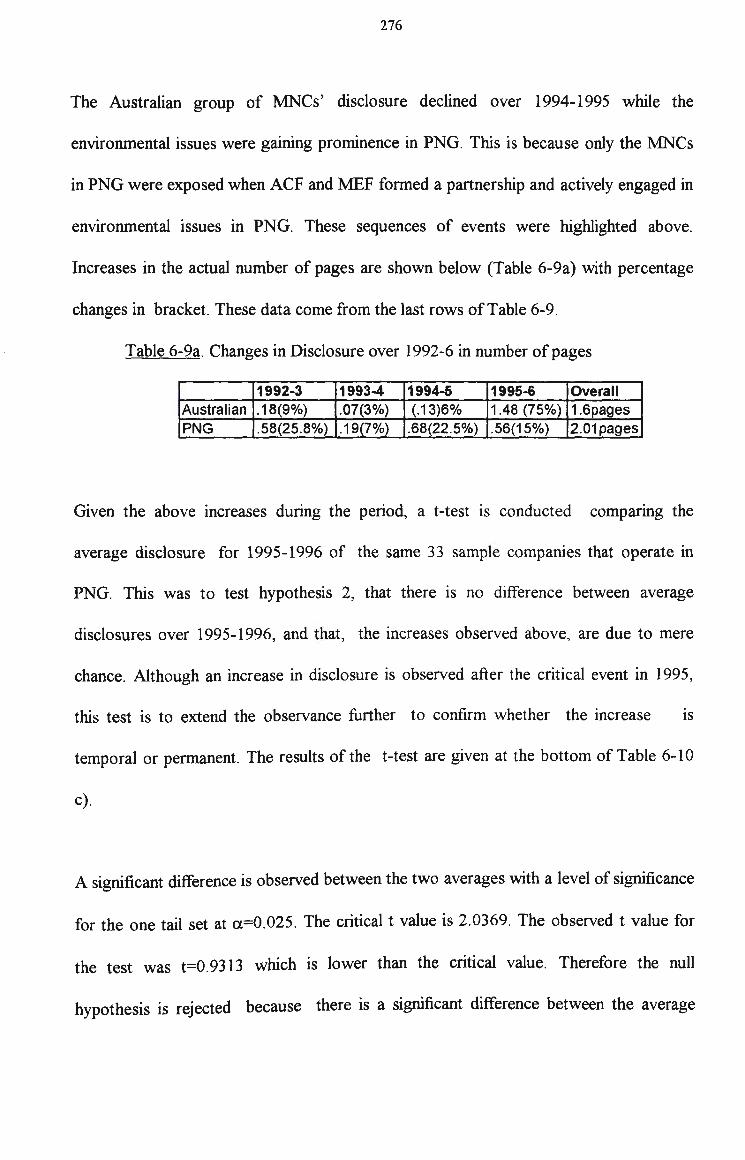
276
The Australian group of MNCs' disclosure declined over 1994-1995 while the
environmental issues were gaining prominence in PNG. This is because only the MNCs
in PNG were exposed when ACF and :MEF formed a partnership and actively engaged in
environmental issues in PNG. These sequences of events were highlighted above.
Increases in the actual number of pages are shown below (Table 6-9a) with percentage
changes in bracket. These data come from the last rows of Table 6-9.
Table 6-9a. Changes in Disclosure over 1992-6 in number of pages
1992-3 11993-4 1994-5 1995-6 Overall Australian ' .18(9%) '1.07(3%) (.13)6% 1.48 (75%) 1.6pages PNG .58(25.8%) I .19(7%) .68(22.5%) .56(15%) 2.01pages
Given the above increases during the period, a t-test is conducted comparing the
average disclosure for 1995-1996 of the same 33 sample companies that operate in
PNG. This was to test hypothesis 2, that there is no difference between average
disclosures over 1995-1996, and that, the increases observed above, are due to mere
chance. Although an increase in disclosure is observed after the critical event in 1995,
this test is to extend the observance further to confirm whether the increase is
temporal or permanent. The results of the t-test are given at the bottom of Table 6-10
c) .
A significant difference is observed between the two averages with a level of significance
for the one tail set at a.=0.025 . The critical t value is 2.0369. The observed t value for
the test was t=O. 9313 which is lower than the critical value. Therefore the null
hypothesis is rejected because there is a significant difference between the average

277
disclosure of the years 1995 and 1996. The actual probability of obtaining a different
mean as those observed in the two years is 0.179325 . This also confirms the sizeable
difference in the average disclosure of the two means both in Table 6-10( e) and the
figure 6-10( e ).
Thus the increase in the average disclosure observed immediately following the critical
event is not temporary but appears to persist into the second year (1996). It is not only
confined to the critical event but persisted longer. Analysis into the subsequent years by
another study is necessary to see how long it persisted. It is sufficient to conclude
here, that critical events do influence environmental disclosure. This is consistent with
studies like Patten's (1992). However, unlike other studies (Walden and Schwartz,
1997) which noticed a decline just after a critical event, this study observed the increased
associated with a critical event to persist longer. This persistence appears to be
associated with an increase m public demand for environment information from
companies (ET AF, 1996).
6.5 Summary
Overseas comparues provide fairly high levels of both positive and negative
environmental information although they do not all have mandatory requirements
(Deegan, 1996). For example, the Emergency Planning and Community Right-to-Know
Act (EPCRA) introduced in 1986 in the US, has prompted many companies to provide

278
environment information voluntarily. It is argued that if the companies do not, voluntary
organisations will (Cahill and Kane, 1994).
Many now rate the environment as the number one challenge for business. It is the issue
of the 1990s (Bryson, 1993). The author proposes that it makes good sense to both
business and government to preserve the environment. A recent Roper Poll (I 993)
shows 78 percent of Americans rate environment as a serious issue. It was only 56
percent four years previously and it was not even thought of, a decade ago. The
Accounting profession is developing different schemes in keeping with the changes. For
example, introducing the ACCA's Environmental Reporting Award Scheme in Australia
(Gray et al, 1996) to reward those who are making the effort. Companies operate under
a social contract either expressed or implied with societies, therefore the public
expresses concerns where it sees a need to protect the ecosystem. There is a need for a
cooperative effort on the part of all parties.
Australian environmental disclosure is minimal, ad hoc, unsystematic, subjective and
predominantly self-laudatory. So much so that it is termed, 'greenwash' (Fayers, 1998).
This may be due to what Beder ( 1997) claims is a counteraction from some corporations
on the growing 'green' concern. Resistants companies counter by:
a. using specialised public relations to promote corporate agenda,
b. create artificial grass root support by corporations,
c. introduce laws to deter public involvement, and
d. fund conservative think-tank to oppose environment regulations
279
However, this study observed an increase in environmental reporting among Australian
companies. While this increase has been influenced by a critical event, increased
disclosure persisted in the subsequent years. Such result is consistent with Niskala and
Pretes (1995) and Deegan and Gordon (1996) that companies do disclose voluntarily.
This appears to be the general trend with the environment becoming a global issue of the
1990s.
Environmental impact in PNG is largely influenced by foreign demand for natural
resources. It is considered a strong driving force behind the over-exploitation and
underpricing of both renewable and non-renewable resources (Bartelmus, 1994). There
are concerns over why MNCs are not adopting the sustainable development approach in
the extraction of resources even though their countries of origin have environment
legislation for this. As proposed in chapter 3 an environmental audit would be useful,
given the current extent and pattern environmental disclosure by the Australian MNCs.
The challenge for PNG is to solve is the task of incorporating sustainable development
into the accounting arena. Environmental issues have shed light on economic realities as
portrayed by accounting. This is increased by the societal demands on businesses to be
· 'greener'. However, the present accounting has narrow focussing only on costs, reflected
by external markets. Costs that have major social and economic implications are not
considered. Consequently, the MNCs produce qualitative reports to legitimise their
existence in the country. Therefore, accounting information is at best incomplete and
consequently misleading (Hibbit, 1994). Despite this, environmental disclosure is

280
important because employees prefer companies with a 'green' image, banks use 'green'
image as 'collateral' and even consumer lobbyists influence disclosure (Tilt, 1997). Most
importantly, the impacts need to be minimised for a sustainable development of
resources.
281
Chapter 7
Summary, Conclusions & Recommendations
7.1 Introduction
In this final chapter, the study is drawn together and conclusions are reached based on
the study objectives. The chapter begins with an overview of the whole thesis. This is
followed by a review of the analysis and the results obtained. Subsequently, the
implications of the results, with regards to the role of MNCs in the economic
development of PNG, their environmental impacts, and an accounting approach to
address the environmental issues are discussed. It is suggested in conclusion, that MNCs
incorporate environmental accounting into their accounting system. This is to ensure
MNCs implement their environmental plans, monitor, control and report on them in
their annual reports because environmental accounting has the potential to expose and
address the environmental impacts.
The purpose of this chapter is to review the study and summarise the discussions on the
results from the analysis on the degree, extent and pattern of current environmental
disclosure among Australian I\1N'Cs operating in PNG. The study begins with an
objective of exploring the possibility of using an accounting approach to address the
adverse environmental impacts caused by MNCs' activities in PNG. Findings are
discussed in this context and conclusions drawn with suggestions for further studies.

282
For the above purpose, section I presents briefly an overview of the study including a
summary of the results from the analysis of annual reports. This is followed by the
results of hypotheses testing.
Section 2 discusses the implications of the results derived from both the analysis and the
hypotheses testing.
Conclusions are drawn in section 3 with limitations and suggestions for environmental
impact plans to be incorporated into MNCs' accounting records. MNCs can then
monitor, control and report on them annually. Suggestions for further studies
concludes this section.
7 .2 Overview of the Study
This section restates the issue, its objectives and the theoretical framework that supports
it. It then presents the formulated propositions and the steps taken to test them. A brief
mention is made of the period that study covers to set the study' s time frame.
The environmental degradation issue has revived and rivals that of the 1970s. The issue,
which began as a domestic concern in the 60s (Waincymer, 1998) has now become a
global issue during this decade the 1990s that especially confronts the MNCs. In
particular, environmental costs and investment concerns have entered into the corporate
circles. Since the environmental issue has been elevated to this position of importance,
283
appropriate financial reporting of environmental costs and concerns must be addressed
(Gamble et al, 1996). Corporations must provide detailed disclosure on their
environmental issues.
Context of the study
There are various attempts being made to address the environmental degradation issue
elsewhere, but little has been done to address the degrading of the environment by
MNCs in developing countries (through an accounting approach) . The general context of
this study is to explore in general, possible ways to monitor and control the alleged
environmental degradation caused by MNCs operating in developing countries like PNG.
In particular, the study considered environmental accounting as a potential tool to
monitor, control and reduce environmental degradation now experienced. An
accounting approach is taken because unless the environmental considerations are
incorporated into the corporate accounting and financial system, they will prevent
environmental advancement (Gray et al, 1993).
It is a delicate issue, especially in PNG, which relies heavily on foreign MNCs to
develop its resources with little supporting legislation and poor policing to curb
environmental degradation. Further, the PNG government constantly faces a conflict of
interest because it has equity in large projects that modify and degrade the environment.
That is why the state cannot arbitrate independently between affected communities and
the alleged foreign MNCs.
284
Study objectives
This study has three specific objectives in the above accounting context. They are:
1. to investigate and establish the current extent, degree and pattern of environmental
disclosure in the recent years by Australian MNCs operating both in PNG and
Australia,
2. to observe whether firm characteristics like size or the type of industry they operate
in and their nature of operation has any influence on their environmental disclosure,
and
3. to examine whether critical events that impact on MNC's image do influence
environmental disclosure.
Theoretical Support
The specific objectives are formulated basing on Legitimacy Theory, which is the
framework for this study. Legitimacy theory posits that when there is a threat, whether
genuine or perceived, corporations will immediately react to legitimise both their
existence and actions (Lindblom, 1994). This will result in companies increasing their
environmental disclosure. Legitimacy theory is applied because this study assesses the
impacts of a critical event (the Ok Tedi lawsuit) on the current extent, pattern and degree
of environmental disclosure over time. An annual report analysis tests the legitimacy
theory following the critical event.

285
Propositions for Testing
In order to test whether MNCs are legitimising their operations, two hypotheses were
proposed for testing. Since the objective is to investigate the MNCs' current pattern,
degree and level of environmental disclosure, the first proposition is that environmental
disclosure did not increase.
This first proposition was tested by analysing environmental disclosure of Australian
MNCs which operate in Australia and PNG continuously between 1992-1996. Any
increased environmental reporting will be the legitimisation of the MNCs actions.
Legitimacy is necessary when a disparity between societal expectation and the corporate
image arises (Sethi, 1978, 1979). The conflict between OTML and the affected local
communities is one example where societal expectation is based on corporate image
(Nasis et al, 1997). The analysis reveals that environmental disclosure among Australian
MNCs in PNG increased more after the critical event. Since the mining companies in
PNG came under scrutiny (Boral Annual Report, 1994), their increased environment
reports legitimises both their existence and operations.
The second proposition is an extension of the first where the increased environmental
disclosure is observed over an extended period after the critical event to see if the
increased disclosure persisted. It was noted that two years after the critical event,
environmental disclosure continued to increase, unlike the oil companies whose
environmental disclosure declined just one year after Valdez experience (Wal den and
Schwartz, 1997).

286
Annual Reports for analysis
To support the suggestion for an accounting approach to address the environment issue
in PNG, it needs to be established that the current accounting information provided by
:MNCs for their shareholders is inadequate. A sample of Australian companies operating
in PNG and Australia are selected for this study. These sample :rvfNCs are from the top
500 Australian companies by market capitalisation. Their annual reports were analysed
using content analysis to determine their degree, extent and pattern of environmental
disclosure based on their current disclosure patterns. Annual Reports are chosen for
this analysis because:
1. they are easily accessible,
2. they are essential part of company's public image, portraying what management plans
to reveal to the outside world,
3. they represent a surrogate measure of the company' s priorities and the attention
management gives to various issues, and
4. annual reports are a reasonable surrogate to corporate social performance (Nasi et al,
1997).
The prime reason for using annual reports is that the analysis of annual reports will
enable the testing of the hypotheses. These hypotheses are based on quantity of
environmental disclosure as contained in the annual reports. This is consistent with
other studies (Ernst and Ernst 1978; Patten 1992; Niskala and Pretes 1995; Deegan and
Gordon 1996- and a number of others), that have used annual reports for their analysis '
of social disclosure.
287
7.3 Results of the Analysis and the Hypotheses Testing
The analysis of the annual report was to satisfy the above three specific study objectives.
This section briefly reviews the analysis of the annual reports under the three objectives
and their results.
Cu"ent extent, degree and pattern of Environmental Disclosure
The current extent and degree of environmental disclosure was determined by semantic
analysis. The disclosure among MNCs show a mixed pattern. Thirteen percent of the
MN Cs reported in less than 1000 words with lowest being only 19 words for the whole
period. Fifty-two percent disclosed environment reports in greater than 1000 but less
than 3000 words. This leaves 37 percent disclosing more than 3000 words of
environment information. Total disclosure was further investigated to determine
whether the characteristics of the sample MNCs have any influence on the total
disclosure.
Influence of MNC characteristics on Environmental Disclosure
Empirical findings tentatively attribute environment disclosure to be related to company
size, industry and nature of operations, the MNCs' country of origin and the country the
MNCs report to have a significant effect on its reporting (Gray et al, 1995). The same
authors allege that environmental reporting does not relate to profit and without
regulations, general CSD will continue to fluctuate. This study focuses on just two
characteristics of :MN Cs from those named above: size and the industry effect. Country
288
of origin is not considered because the sample MNCs are all Australian. However,
reporting back to their head office is linked in the environmental disclosure requirement.
Since the sample :MNCs are all in the top 500 Australian compames by market
capitalisation, they are all the same size (large). Therefore, they have to be reclassified
using operational, financial or organisational size to distinguish size variations of the
sample MNCs. Of these, sales as part of operational size, is selected for the
reclassification. This is to maintain consistency with other studies which analysed for
social disclosure such as Trotman and Bradley (1981 ); Cowen et al (1987); Patten
(1992); Niskala and Pretes (1995); Deegan and Gordon (1996). Industry effect is also
chosen for the same reason and is consistent with the above studies plus Freedman and
Jaggi (1988); Roberts (1990); and Zeghal and Ahmed (1990).
Influence of Critical Events on Environmental Disclosure
The result of the analysis shows Australian mining companies operating in PNG disclose
more than those in Australia especially after the lawsuit. This arises because mining
companies have come under the public scrutiny and consequently the industry is
attempting to correct its image through increased disclosure. Increased disclosure after a
critical event suggests the presence of legitimacy theory. Since the environmental
disclosure increased after a critical event, it appears to confirm that companies increase
their disclosure to guard their image.

289
This is consistent with Patten (1992), who observed an increase in environmental
disclosure following the Valdez spilling oil in Alaska. Exxon, who owned the vessel
Valdez, increased its environmental disclosure ten (10) times from 0.6 page before the
incident to 6.0 pages after the spill. The observation also noted that of the other oil
companies in the US Fortune 500, significantly increased their environmental disclosure.
Influential Characteristics of MN Cs
The characteristics of MNCs also influences environmental disclosure. Two influential
characteristics of companies are considered which may have influenced environmental
disclosure among the sample Australian MN Cs. They are the size of the companies and
the type of industries they are in.
Size Effect
The quantity of disclosure by size was measured for the sample MNCs and found it to
be consistent with studies named earlier. The result graphically shown in figure 6-5
reveals that larger firms disclosed more. Environmental disclosure increases with size
where the operationally larger MNCs disclosed more and disclosure falls as the size of
MNCs decrease. This is because larger firms are visible in both their existence and
operation. Therefore they become easy targets and are subjected to scrutiny (Cowen et
al, 1987; Trotman and Bradley, 1981 ).

290
Industry Effect
Two industries (mining and forestry) which are alleged to be degrading the environment
in PNG disclose more environment information than manufacturing and oil & gas.
Although the mining industry was targeted by various environmental groups following
the lawsuit, their scrutiny affects all those whose nature of operation modifies the
environment (Hackston and Milne, 1996). This explains why mining companies, unlike
Exxon (Walden and Schwartz, 1997), in both Australia and PNG, as well as oil & gas
companies in Australia disclosed more, persisting into the second year after the lawsuit.
Their extractive operations involve large clearing, extracting and dumping into water
ways. Their impact on the environment is adverse as discussed in chapter 2. Niskala and
Pretes' (1995) study support the argument that environmental disclosure is industry
related. The authors found certain industries (energy, forestry, oil) disclosed more even
under a voluntary disclosure.
Hypotheses Test Results
Within the context of this study, a close scrutiny was applied to the mining MNCs'
activities. Their image is somewhat distorted because all mining companies are
considered to be the environment degraders. The scrutiny began when landowners in the
Fly river region brought a lawsuit against OTML in 1994 for environmental damages
caused by Ok Tedi mine. Although environment degradation began earlier (Young,
1992), it was the writ issued in the supreme court in Melbourne against BHP (who is a
major shareholder ofOTML) that exposed the adverse impacts in PNG.
291
In pursuing the objective of assessing the degree and extent of environmental disclosure
along with the assessment on the effect of the critical event, two hypotheses were
formulated and tested. Hypothesis one: H1 : Environmental disclosure did not increase
among Australian MNCs operating in PNG following the lawsuit, but remained
constant between 1992-1996. This hypothesis tests for the general increase and the
effect of the lawsuit showed that environmental reporting increased after 1994. The five
year period (1992-1996) was divided into two: the period before the lawsuit (1992-
1994) and after the lawsuit (1995-1996). Both groups' averages were calculated and it
is noted that increases before the critical event is less than those after the lawsuit. The
differences in disclosure results in different means which at-test of independence found
to be unrelated to a sampling error. It was a rigorous test (a.=0.025) with the t value at
2.0369. The observed t value was 3.765 with a 0.00037 probability of achieving a
difference as those observed among the two periods.
Annual increases measured in number of pages also shows a continuous increase each
year for MNCs in PNG. Those operating in Australia experienced a decline in 1995
although it increased the following year. There was a genuine difference between the two
groups' disclosures as observed by their means. Therefore, the hypothesis which was set
at null: that environment disclosure did not increase among Australian MNCs following
Ok Tedi lawsuit, was rejected.
Given the above increased disclosure, further observation was necessary to determine
whether the increased disclosure was temporary as the Exxon's spill example (Walden

292
and Schwartz, 1997) or permanent among the Australian MNCs in PNG. This inquiry
was hypothesised as: Ib..There is no difference in the average levels of disclosure for
MNCs in PNG between 1995 and 1996. A second rigorous t-test was conducted on the
means of 1995 and 1996 with the same test with a =0.025 and the critical t value
t=3 .0369. The observed t value was (0.9313) lower than the critical value. While there
was a high probability (p=0.1793) of attaining it, however, the t value was low. There
was a significant difference between the two years as a result of pressure from society
with disclosure persisting into the second year, which led to the rejection of the second
hypothesis.
7. 4 Implications
The overall analysis of annual reports suggests that environmental disclosure is
increasing among the Australian companies. The increase appears to be influenced by the
publicity of the critical event during the period of study (Rosenabum and Krockerberg,
1996). For example, in 1992 studies were carried out by ACF in the Ok Tedi area which
appears to influence the increases in environment reporting by .IMNCs in PNG. The
findings of environment degradation by Ok Tedi were published in 1993 which stirred up
protests and compensation negotiation in 1994 which eventually led to the issuing of the
writ. This corresponds with the high disclosure in PNG during 1994-1995.
When the focus is directed at those in Australia, the .IMNCs reporting environment issues
increased in 1995-1996. Two related events contributed to this increase. First, a well

293
publicised protest was held at BHP's annual meeting over the environmental issue
affecting the Ok Tedi region in 1995. Second, a resolution was passed (early in 1996)
supporting Melanesian peoples' draft on codes of conduct for Australian companies in
Melanesia during the Consultation for Mining and Indigenous People's Conference held
in London23. Both CRA' s involvement in Bouganville and BHP' s involvement in the Fly
River region were condemned. Such publicity appears to have influenced the increased
disclosure in Australia for 1996.
Increased disclosure also demonstrates the application of legitimacy theory which this
study draws on to explain the underlying reason for the increased disclosure. The mining
industry is employing Lindblom's (1994) third approach of legitimacy theory to correct a
threat against its existence. The other 3 approaches are discussed in chapter 4.
Lindblom' s third approach is a subtle and manipulative approach which involves the
promoting of good news to deflect any contentious issue. Negative news will only be
disclosed if there is a likelihood of the message leaking out to the public and/ or the
chance of facing external liability increases (Li et al, 1997). This is a common approach
among Australian companies (Deegan, 1996).
Deegan and Gordon ( 1996) noted environmental reporting increased between 1983 and
1991. This study extends the observation from 1992-1996. Therefore, the establishment
that environmental reporting among Australian companies has increased since 1992
fulfils this objective. However, it contradicts Fayers (1998) who claims that Australian
23 Land Rights News, 1996.
294
environmental disclosure is minimal, ad hoc, unsystematic, subjective and predominantly
self-laudatory. Fayers terms the current environment reporting as 'greenwash' . Since
this study did not test for quality of disclosure, it cannot make quality assessment. Its test
for quantity is consistent with Deegan and Gordon (1996). If the increase is influenced
by the critical event, then the increase will decline like Exxon' s experience. However,
analysis of the subsequent period following the critical event reveals that disclosure
continues to increase two years subsequent to the critical event to 1996.
Disclosure and Unregulated Economy
Increase in environmental disclosure surrounding the Ok Tedi lawsuit appears to
correspond with the scrutiny. Although this is only an observation, it appears consistent
with the literature that :JMNCs are reluctant to disclosure more in an unregulated
economy. The implication is, there is a need to regulate an environmental disclosure to
bring out accountability and transparency among :JMNCs. This is because an essential
factor in conventional accounting is that environmental degradation is due to the
restriction current accounting practice places on accounting. It accounts only for
monetary items at the exclusion of non monetary. Accounting has an important role as a
strategy to monitor and control environmental disclosure when the non-financial
reporting is promoted. It will be more informative because non-financial accounting is a
more powerful form of discharging environmental accountability (Gray et al, 1993).
Companies will only increase their environmental disclosure when forced to by critical
event. For instance, Patten's (1992) observation cited above shows how a critical event

295
(the oil spill) prompted an increased in environmental disclosure although it was only
event and time specific (Walden and Schwartz, 1997). The Ok Tedi lawsuit impacts
more as does the chemical industry after the Union Carbide's Bhopal incident. The
entire chemical industry has been conducted differently as a result of the Bhopal incident
(Wood, 1994). The chemical industry maintained their increased disclosure was partly
due to a number of pieces of legislation passed subsequent to the incident.
The current approach of legislating whenever a critical incident occurs is a reactive
approach. Whenever a crisis is experienced, those concerned react to counter it,
preventing any legislation being proposed. If that strategy persists, then regulators need
to prosecute more to induce greater care and increase environmental reporting.
However, critical events may be fatal, such as those around the Pogera mine where the
impact of the mine have allegedly caused deaths (Kennedy, 1996). Any subsequent
legislation may be too late and the impacts may even be adverse while awaiting for a
critical event to prompt action. Regulators need to analysis the causes of critical events
and legislate to deter any recurrence.
The more powerful the shareholders, the more companies have to adapt (Roberts, 1992)
because the current demand for greater environmental disclosure is increasing. The
pressure on corporations for environmental disclosure is considerable and still growing.
Such demand places MNCs under close scrutiny in their environmental dealings and
saves them litigation, liabilities as well as damaged public image (Gray et al, 1993). A
number of organisations are already implementing it for their own good.
296
7.5 Conclusion, Limitations & Suggestions
The general conclusions drawn in this section are based on the study objectives. Two
suggestions are presented which could supplement the current PNG Environment
Planning Act 1978, and the Environment impact Plan. However, the suggestions are
subjected to several limitations.
Environmental disclosure which was reported as an increase in the above analysis is an
important part of ' green' accounting. It will require firms to be more open and frank
about their operations. The role of Environmental Accounting can be used as a strategy
for monitoring environmental disclosure which will force the MNCs to increase their
environmental reporting. This is because 'green' accounting has a potential to control,
monitor and mitigate environmental degradation.
PNG (Developing country) context
Within the context of PNG, MNCs are 'engines of economic development or growth'
(Jenkins, 1987). That is, MNCs bring into the country much needed capital to develop
its resources, create job opportunities and 'eliminate poverty' . Sham (1995) reports that
evidence in PNG shows that the MNCs' transfer of capital into PNG has boosted
exports and earned foreign earnings. However, conflict arises when the MNC operations
cause adverse impacts on the environment.
297
Environmental degradation is a common feature especially among raw material seekers
(Anay and Cridder, 1996) because they modify the environment they operate in
(Hackston and Milne, 1996). Unsustainable logging destroys fauna, and rare species of
bio-diversity of flora (Greenpeace International, 1996). Drinking water is contaminated
from sawdust, oil, fuel and toxic preservatives such as arsenic, chromium, boron and
dieldrin used for dipping logs (Eaton, 1986). Mine development results in forests
logged, roads and tunnels built with tonnes of mined dirt dumped into rivers used for
drinking and washing and obstructs river transportation (Rosenbaum, 1995).
Such degradation creates animosity between foreign companies and local communities.
Those affected may even gain enough external support to apply pressure on the MNC
and sue it (like Ok Tedi mine) or disrupt operations (Paguna mine). Since the MNCs
bring benefits in creating employment, transfer technology, earn export earnings and
service debt; conflicts ought to be avoided. However, the problem of degradation cannot
be ignored as it affects many communities in the country.
Suggested Approaches
Environmental degradation is avoidable if the MNCs implement their EPs effectively.
Each project has an EP drawn up before the project is commissioned and all it needs is
implementation, regular monitoring and reporting. It appears that EPs are not
implemented effectively since policing them is lacking in PNG. This study approaches
the environmental degradation issue from an accounting perspective. The suggestion is

298
for all l\1NCs to incorporate their EPs into their accounting records, maintain their
bookkeeping, conduct regular EIA and include these reports in their annual financial
statements.
The study itself is timely. The AICA is currently developing the accounting language in
Australia to accommodate the public demand for environmental reporting (EAFT, 1996).
The suggestion of incorporating environmental impact plans into corporate accounting
records will require a conceptual framework and the guidelines being developed by
AICA. Therefore the focus of this study is to investigate whether MN Cs are currently
incorporating environmental concerns into their accounting records to address
environmental degradation and provide detailed disclosure on environmental issues to
meet current public demand. This is because although major projects in PNG are
required to lodge environmental impact plans before they are commissioned, the country
still experiences environmental degradation. It appears that there are limited attempts to
implement environmental impact plan into accounting records because environmental
reporting, although it increased compared to Deegan and Gordon ( 1996), was prompted
more by the critical event as observed.
Environmental accounting is being implemented in different countries. The Australian
Institute of Chartered Accountant (AICA) is drawing up a conceptual framework with
guidelines to assist its members to implement it in Australia. This study proposes two
approaches as part of the environment accounting strategy:
1. conduct an eco-audit to ensure that EPs are implemented. An eco-audit will also
ensure that the environment report in the financial statements are reliable. US Single
299
Audit Act (SAA) requires independent attestation of environment reports to ensure
that EPA requirements are adhered to (Freedman, 1998). Proponents of SAA claim
that voluntary disclosure does not provide meaningful environment information
(Sutton and Arnold, 1998).
2. use an environment excellence award to reward those who make the effort as well as
challenge others. Both approaches are meant to be used concurrently to address and
mitigate environmental issues.
The next question is policing because the EPs are not effectively implemented as
required by the Environment Planning Act 1978. Lack of effective implementation is due
to the DEC's lack of resources to enforce it. There are two offices that can police it.
First is the company registrar's office which requires all companies to lodge their annual
reports. This office can ensure that environmental disclosure is part of every annual
report. Second is the PNG stock exchange which can require environmental disclosure as
a requirement for listing. While it may be argued that only large corporations will comply
with the stock exchange requirement, the current environment degradation is already size
related. Therefore it will at least minimise the extensive environment damages now
prevalent with large projects in PNG.
This study suggests that environmental impact plans be incorporated into the MNCs'
accounting records. This can be implemented during the period of operation. It will
mutually benefit the MNCs and the host country. Host country(ies) will experience a
sustainable economic growth while the MNCs save in liability charges. As Anand (1993)
300
warns, many investors may have an unpleasant surprise when their litigation charges
catch up with them.
Limitations and Further Research
The above conclusions are subject to several limitations. Firstly, the study is confined to
only four industries and inferences may not be valid for other industries. This is
especially so when the environmental disclosure is industry related. It is suggested that
other studies be conducted into other industries for comparison. Even the annual
reports analysed are all of Australian companies. This raises the question about making
inferences to other :MNCs in PNG. An alternative study may seek to analyse :MNCs in
the same (four) industries which originate from other developed countries to determine
if:MNCs from other countries are complying with their own environmental laws.
Secondly, validity may be affected by errors in categorising of environment features,
inaccurate coding and omissions in quantifying actual disclosure. This is because content
analysis, although widely employed is subjective.
Thirdly, addressing environmental issue raises further questions about the governance of
:MNCs that operate in a multilateral context. :MNCs' boundary of operations is 'non
existing', therefore no single country is able to effectively regulate their activities (UN,
1991).
This does not mean the issue can be ignored because developing countries like PNG will
continue to experience adverse impacts from the :MNCs operations. The suggestion of

301
incorporating EP is not stringent, yet it is timely, when environment issue is being
addressed globally. Given the potential accounting has, environmental impact will be
able to monitor and control to mitigate its impact.
302
Bibliography
Abbot, W.F. and Muson, R.J., 1979. "On the measurement of Corporate Social
response, Self reported Disclosures as a method of measuring corporate
social involvement", Academy of Management Journal, Vol. 22, No.3, pp. 501-
515 .
ACF, 1996. "No More Ok Tedis", Australian Habitat, Vol. 24, No. 1, p. 7
Adam, C.A., Hills, Wan-Ying, & Roberts, C.B. 1998. "Corporate Social Reporting
Practices in Western Europe: Legitimising Corporate Behaviour?", British
Accounting Journal, Vol.30, pp. 1-21.
Aeppel, T., 1993. "Firms reveal more about details of environmental effort but still
don't tell all," The Wall Street Journal, December 13 .
AIDAB, 1990. AIDAB and water development: Section Review/Satish Chandra et
al, Australian Government Publication Services, Canberra.
Anand, V., 1993 . "New Pollution Charge could Haunt Investors," Pensions &
Investments, Vol. 21, No. 15, pp. 20.
Anaya, S. James and Crider, S. Todd., 1996. "Indigenous Peoples, The
Environment, and Commercial Forestry in Developing Countries: The Case
of Awas Tingni, Nicaragua," Human Rights Quarterly, No. 18, pp. 345-367.
Arnold, P.J., 1990. "The State and Political Theory in Corporate Social Disclosure
Research: a Response to Guthrie and Parker," Advances in Public Interest
Accounting, Vol. 3, pp. 177-181.
Arrington, E . 1990. "International Tyranny and the public interest : the quest
for the holy grail and the quality oflife," Advances in Public Interest Accounting,
Vol. 3, p. 16.
Asher, A, 1994. "A Guideline for Global Business", Paper presented at the
International Conference on Fairplay in Global Business, New Dehli,
14-15 February, 1994.
Atkinson, G., 1995. "Debate on Green Accounting," Environment, Vol. 37, No.
8,p.43

303
AusAid, 1996. The Economy of Papua New Guinea, AusAid, Canberra.
Bachand, Robert, 1995. "Reporting on Environmental Performance, " Government
Finance Review, Vol. 11, No. 3, pp. 57-58, June Issue.
Barbie, Earl., 1995. The Practice of Social Research, Wadsworth Pub. London.
Barcus, F .E ., 1959. Communications Content: Analysis of the Research, 1900-1958,
Thesis, University of Illinois.
Barnes, Pamela., 1994. "A New Approach to Protecting the Environment: The
European Union' s Environmental Management and Audit Regulation,"
Environment Management & Health, an International Journal, Vol. 3, No. 3,
8-12.
Barnet, R .J. and Muller, RE., 1974. Global Reach-The Power ofMNC, Simon &
Schuster, New York.
Bartelmus, P ., 1994. "Green Accounting for a National Strategy of Sustainable
Development-The case study of Papua New Guinea," Ambio, Vol. 23, No. 8,
pp. 509-514.
Beder, S., 1993 . The nature of Sustainable Development, Scribe Publishers,
Newham.
Behrman, J. N., 1972. The Role of International Companies in Latin America: Autos
& Petro-chemicals, Lexington Books, Lexington MA.
Belkaoui, A., 1976. "The Impact of the Disclosure of the Environmental Effects of
Organisational; Behaviour of Market," Financial Management, Winter,
pp. 6-31 .
Belkauoi, A., 1984. Socio-Economic Accounting, Quorum Books, Connecticut.
Bell, S ., 1995 . The Environment-A Fly in the Ointment, Chain Reaction, No. 73/74,
pp. 30-33.
Benjamin, J.J ., and Stanga, K . G., 1977. "Difference in Disclosure needs of major
users of financial statements," Accounting and Business Research, Summer,
pp. 1887-192.
Benson, George J. , 1982. "Accounting and Corporate Accountability", Accounting,
Organisation and Society, Vol. 7, No. 2, pp. 87-105.

304
Berelson, B.R., 1952. Content Analysis in Communication Research, Free Press.
Bhagwati, J.N., 1978. "Anatomy and Consequences ofExchange Control Regime,"
Studies in International Studies Relations, Vol. I, No.10, New York, National
Bureau of Economics Research.
BHP 1994 Annual Report
Birchard, Bill., 1993 . The Right to Know, CFO. Vol. 9, No. 11, pp. 28-38, November
Issue
Blacconiere, W. G and Patten, 1994. Environmental Disclosure, regulatory costs and
changes in firm value, Journal of Accounting and Economics, Vol. 18, no.3, pp.
357-377.
Blacconiere, W. G. and Northcut, W.D., 1997. "Environment Information and
Market Reactions to Environmental Legislation," Journal of Accounting,
Auditing and Finance, Vol. 12, No. 2, pp. 149-178 (Spring 1997).
Bogard, William., 1989. The Bhopal Tragedy: Language, Logic and Politics
in the production of a hazard 4.
Boral Annual Report, 1995
Boral Annual Report, 1996
BPNG, 1996. Quarterly Economic Bulletin, March Issue, Vol.24, No. I, pp. 28-36.
Bromby, Robin., 1990. "The Bouganville Horror," Pacific Island Monthly, Vol. 60,
No. 2, pp. 23-25 (February Issue.
Brouthers, L.E., Werner, S. and Wilkinson, T.J., 1996. "The Aggregate Impact of
Firm's FDI Strategies on the Trade Balances of Host Countries," Journal of
International Business Studies, (Second Quarter), Vol. 27, No. 2, pp. 359-372.
Bryson, J.E., 1993 . "Protecting Environment is Everybody's Job," Executive
Speech,Vol.7, No. 4, pp. 29-30.
Buckley, Ralf., 1992. "Sustainability in Mining," Environment Management and
Health, Vol. 3, No. 3, pp. 23-26.
Buhr, Nola., 1998. "Environmental Performance, Legislation and Annual Report
Disclosure: The case of Acid Rain and Falconbride," Accounting,
Auditing and Accountability, Vol. 11, No. 2, pp. 163-190.

305
Burchell, S., Club, C. and Hopwood, A., 1985 . "Accounting in its Social Context :
Towards a history of value added in the United Kingdom," Accounting,
Organisation and Society, pp. 381-413 .
Burrell, G. and Morgan, G., 1979. Sociological Paradigms and Organisational
Analysis, Heinemann, London.
Burrit, R.L. and Gibson, K., 1993. "Who controls the World Heritage Listed
Asset?" Environmental Planning Journal, Vol. 10, No. 4, pp. 278-290.
Cadenhead, G . M ., 1970. "Differences in Circumstances: Facts or Fantasy?"
Abacus, Vol.6, No. 1, pp. 71-80.
Cairncross, Frances., 1992. "UNCED, Environmentalism and Beyond," Columbia
Journal of World Business, Vol. 27. No. 3&4, pp. 13-24.
Camey, T.F., 1972. Content Analysis: A technique for systematic inference from
communication, Batsford Ltd, London.
Castell, Lutz., and Kreye, Otto., 1991. Environmental Damages in the Western
Province of PNG by Ok Tedi Mine
CCH Macquarie Dictionary, 1993 . The CCH Macquarie Dictionary of
Business, CCH Australia Limited, North Ryde.
CED, 1971 . Research and Policy Committee of the Committee for Economic
Development
Champion, Dean J., 1970. Basic Statistics for Social Research, Harper & Row
Publisher, London.
Chaudhary, C.M., 1991. Research Methodology, RBSA Publishers, Jaipur.
Chua, F. C., 1990. "Externalities: One of the Most Difficult Aspects of Social
Accounting," Discussion Paper No. 104, Department of Accounting, Massey
University, Palmerston North, NZ, January.
Clemencon, Raymond., 1997. "Economic Intergration and the Environment in
Southeast Asia: Securing gains from open markets while preventing further
environmental Degradation," Journal of Environment & Development, Vol. 6,
No. 3, pp. 317-333 (September Issue).
Co~moner, B ., 1972. The Closing Circle: Confronting the Environmental Crisis,
306
Cape, London.
Condren, Ally., 1996. "Miners Accused ofMoral Breaches," The Australian,
Monday, September 23, p. 17.
Confederation of British Industry,1990. "Narrowing the Gap: Environmental
Auditing Guidelines for Business", CBI, London.
Cooper, D .J., 1980. "Discussion of Towards a Political Economy of
Accounting," Accounting, Organisation and Society, Vol. 5, No. 1, pp. 161-166.
Cooper, D . J. and Sherer, M.J., 1984. "The value of Corporate accounting
reports: arguments for a political economy of accounting," Accounting,
Organisation and Society, Vol.9, No. 3-4, pp. 207-232.
Coppers and Lybrand Deloitte, 1992. Industrial Briefing, February 1992.
Coppers and Lybrand, 1993 . Business and the Environment: An Executive Guide
Corrigan, John., 1998. "Assessing Costs and benefits - What role to play?, " The
Accountant, pp. 24-26.(May Issue)
CSIRO, 1996. Pogera Joint Venture: Review of Riverine Impacts, CSIRO
Environmental Projects Office.
Daly, H . and Cobb, J. , 1989. For the Common Good, Beacon Press, Boston.
Daly, H .E., 1991 . Steady-State Economics, San Francisco, CA ISiand Press.
Davis, Ben., 1993 . "Opening up the Resources Trove," Asiamoney, PNG
Supplement, pp .11-14
Deegan, C. and Gordon, B., 1996. "A Study of the Environmental Disclosure
Practices of Australian Corporations," Accounting and Business Research
Vol. 26, No. 3, pp. 187-199.
Deegan, C. and Rankin, M ., 1996. "Do Australian Companies Report
Environmental News Objectively? An Analysis of Environmental Disclosure
by Firms Prosecuted Successfully Environmental Protection Authority,"
Accounting, Auditing and Accountability, Vol. 9, No. 2, pp. 50-67.
Deegan, C ., Geddes,S . and Stauton, J., 1996. "A Survey of Australian
Accountants' Attitudes on Environment Reporting," Accounting
Forum, Vol. 19, No. 4, pp. 399-412.

307
Deegan, Craig., 1996. "Environmental Reporting for Australian Corporations: An
Analysis of Australian and Overseas Environmental Reporting,"
Environment and Planning Law Journal, Vol. 13, No.2, pp. 120-132.
Dierkes, M. and Preston L.E., 1977. "Corporate social accounting and reporting for
the physical environment: a critical review and implementation proposal, "
Accounting, Organisation and Society, Vol. 2, No. 1, pp. 3-22.
Dunning, John H., 1993 . Multinational Enterprises and the Global Economy,
Addison-Wesley Pub, New York.
Durkin, Peter., 1995. "Scrutiny of Australian Companies operating in Asia, Is there
a need for Greater Home Government Appraisal?," Australian Environment Law
News, Issue No. 4, pp. 51-59
Eagle, A. M., 1993 . "Personal Communication Manger, Environment and Logistics,
OTML, Tabubil," Paper prepared in response to ACF request, 7/9/93 .
Eaton, Peter., 1986. "Overseas Development: Papua New Guinea," Environmental
Planning Law Journal, pp. 165-167,June Issue.
Eatwell, J., Milgate, M. and Norman, P., 1989. The New Palsgrave Economic
Development, W.W. Norton, New York.
Economist, The., 1990. "Seeing Green Light," Vol, 317, No. 7594, pp. 127-141.
Elison, Jack. 1963 . Methods of Sociomedical Research Handbook of Sociology ( ed)
Howard Freeman, Sol Levine and Leo G. Reeder, Prentice Hall, Eaglewood
Cliffs.
Elkington, John, 1987. The Green Capitalists-Industry's Search for Environmental
Excellence, Victor Gollancz Ltd, London.
Elston, Kylie., 1995. "Women and Environment= Action," Habitat, Vol. 23 , No. 1,
pp.8-10.
Environmental Reporting and Record Keeping Requirements (second edition) 1992.
Government Institute Incorporation, Maryland.
Epstein, M. J. and Freedman, M., 1994. "Social Disclosure and the
Individual Investor," Accounting, Auditing & Accountability Journal, Vol. 7,
No. 4, pp. 94-109.

308
Ernst, and Ernst, 1978. Social Responsibility Disclosure: 1977 Survey
(Cleveland, OH: Ernst & Ernst, 1978).
Estes, R . 1976. Corporate Social Accounting, John Wiley & Sons, NY.
Fayers, C. 1998. "Environment Reporting and Changing Corporate
Environment performance," Accounting Forum, Vol. 22, pp. 74-94.
Ferraria, A.J., Batalia, C.R. and Magallanes, N.G.,1993 . "Investments and TNCs in
the Philippines Towards Balanced Local and Regional Development,"
Regional Development Dialogue, Vol. 14, No. 4, pp.67-82, Winter Issue.
Firth, M. 1978. "A study of the consensus of the perceived important of disclosure of
individual items in corporate annual reports," The International Journal of
Accounting Education and Research, Vol. 14, No. 1, Fall, pp. 57-70.
Firth, M. 1979. "The impact of size, stock market listing and auditors on voluntary
disclosure in corporate annual reports," Accounting and Business Research,
Autumn pp. 237-280.
Energy Development Annual Report, 1996.
Firth, M ., 1979. "The Impact of Size, Stock market listing and auditors on
voluntary disclosure in corporate annual reports," Accounting and Business
Research, Autumn pp. 237-280.
Firth, M., 1984. "The extent of voluntary disclosure in corporate annual reports
and its association with security risk measures," Applied Economics, Vol. 16, pp.
269-277.
Fowler, S., 1991. "CEO Perspective: Implications for Corporate Investment,"
Business Council Bulletin, January/February, pp. 28-30.
Freedman, M. 1998, "Social Disclosure, Attestation and the Single Audit Act,"
Critical Perspective on Accounting, Vol. 9, No. 2, pp. 201-204.
Freeman, A. M. , 1984. "The Sign and Size of Option Value," Land Economics, Vol.
60, pp. 1-13
Gamble, G. 0., K. Hsu., Jackson, C., and Tollerson, C.D., 1996. "Environmental
Disclosures in Annual Reports: An International Perspective," The International
Journal of Accounting, Vol. 31, No. 3, pp. 293-331.

309
Gamble, George 0., Hsu, Kathy, Jackson, Cynthia and Tollerson, Cynthia D., 1996.
"Environment Disclosures in annual reports : An International Perspective," The
international Journal of Accounting, Vol. 31, No.3, pp. 293-331 .
Ghobadian, Abby and Viney, Howard., 1995 . "Influence of Environmental Issues in
Strategic Analysis and Choice," Management Decision, Vol. 33 No.
10, pp. 46-58.
Gibson, R. and Guthrie, J., 1995. "Recent Environmental Disclosure in Annual
Reports of Australian Public and Private Sector Organisation," Accounting
Forum, Vol. 19, No. 2-3, pp. 19-35.
Gilkinson, B., 1995. "An Annual Report Saying 'We Care", Chartered Accountant
Journal, Vol. 74, No. 10, pp. 8-17 (November).
Gioia, D.A. and Pitre, E., 1990. "Multiparadigm Perspective on Theory Building,"
Academy of Management Review, Vol. 15, No. 4, pp. 584-602.
Gray, R .H., and Perks, B., 1982. "How Desirable is Social Accounting?,"
Accountancy, April pp. 101-102.
Gray, R. H ., Babbington, J. and Walters, D ., 1993 . Accounting for the Environment,
Paul Chapman Publishers, London.
Gray, R. H., Owen, D.L. and Maunders, K.T.,1987. Corporate social Reporting,
Accounting and Accountability, Prentice-Hall, Hemel Hemstead.
Gray, R.H., Owen, D.L. and Maunders, K.T., 1988. "Corporate Social Reporting:
Emerging trends in Accountability and the social contract," Accounting, Auditing
and Accountability Journal, Vol. 1, No. 1, pp.6-20.
Gray, R.H., Owen, D.L. and Maunders, K.T., 1991. "Accountability, Corporate
Social Reporting and the external social audits," Advances in Public Interest
Accounting, Vol. 4, pp. 1-21.
Gray, R., 1991. "Accounting and Environmentalism: An Exploration of the
challenge of gently accounting for accountability, transparency and
sustainability," paper presented at the annual conference of the British
Accounting Association, Salford -April.
Gray, R., Koughy, R. and Lavers L. 1995a. "Corporate Social and Environmental
310
Reporting-A Review of the Literature and Longitudinal study of UK Disclosure,"
Accounting, Auditing and Accountability Journal, Vol. 8, No. 2, pp. 44-77.
Gray, R .H ., 1992. "Accounting and Environmentalism: an exploration of the
challenge of gently accounting for accountability, transparency and
sustainability," Accounting, Organisation and Society, Vol. 17, No. 5, pp. 399-
426.
Gray, R.H., 1994. "Social and Environmental Accounting, Accountability and
Reporting: New Wine in Old Skin or Silk from Sow's Ears?," Accounting
Forum, pp. 4-30, March 1994.
Gray, R .H., Kouchy, R. and Lavers, S., 1995b. "Constructing a research database
of social and environmental reporting by UK: A Methodological note,"
Accounting, Auditing and Accountability Journal, Vol. 8, No. 2, pp. 78-101.
Graziano, A.M. and Raulin, M.L. , 1997. Research Methods-A Process of Inquiry
(3rd edition) Longman, New York.
Green, C., 1992. "Economics and Greenhouse Effects," Climatic Changes, No.
23, pp. 265-291.
Greenpeace International, 1996. "PNG's Disappearing Forest," Habitat, Vol.24, No.
4, page 21, August Issue.
Guthrie, J. and Parker, L., 1989. "Corporate Social Reporting. A rebuttal of
Legitimacy Theory," Accounting and Business Research, Vol. 9, No. 76,
pp. 345-352
Guthrie, J. and Parker, L., 1990. "Corporate Social Disclosure Practise: A
Comparative International Analysis," Advances in Public Interest
Accounting, Vol. 3, pp. 159-176.
Guthrie, J.E. and Matthews, M.R., "Corporate Social Accounting in Australasia,"
Research in Corporate Social Performance and Policy, Vol. 7, pp. 251-277.
Hackston, David, Milne, Markus J., 1996. "Some Determinants of Social and
environmental disclosure in New Zealand companies," Accounting, Auditing and
Accountability Journal, Vol. 9, No. 20, pp. 77-107.
Heard, J .E . and Boice, W.J., 1981. "The Political Significance of Corporate

311
Social Reporting in USA," Accounting, Organisation and Society,
Vol.6, No. 3, pp. 247-254.
Herman, J.J. and Hedblom, J.H., 1979. Methods for the Social Sciences-A
Handbook for Students and Non-Specialists, Greenwood Press, Connecticut.
Hiambohm, W., 1989. "Landowners Resort to Sabotage in Paguna," Pacific Island
Monthly, Vol. 59, No. 13, pp. 16-19 (January Issue).
Hine, A., 1991. "The wider issues," Certified Accountant, April pp. 38-42.
Hogner, R.H., 1982. "Corporate Social Reporting: Eight Decades of Development at
US Steel," Research in Corporate Performance and Policy, pp. 243-250.
Hollingworth, Sarah., 1998. "Green Investing-A growing concern?," The
Accountant, ' pp. 28-30 (May issue)
Holsti, 0 . R., 1969. Content Analysis for the Social Sciences and
Humanities, Reading MA, Addison-Wesley Publication.
Hooper, J. and Powell, A. 1985 . "Making sense of research into organisational and
social aspects of management accounting: A review of its underlying
assumptions," Journal of management studies, Vol. 22, No. 5, pp. 429-465 .
Huntley's Shareholders, The handbook of Australian Public Companies,
(13thedition) Ian Huntley Pty Ltd, Sydney.
Huzing, Ard and Dekker, H.Carel., 1992. "The Environmental Issue on the Dutch
Political Market," Accounting, Organisation and Society, Vol. 17, No. 5, pp.
427-448.
Hymer, Stephen., 1976. The Multinational Corporation and the Law of Uneven
Development (Thesis).
AICA 1998. The impact of Environmental Matters on the Accounting Profession:
Discussion Paper, !CA-Sydney.
International Chamber of Commerce, 1989. Environmental Auditing, ICC Paris
ICI 1991 . The Policy on the Environment
Iorere, Denys., 1997. Government faces tax losses: IFA, PNG National News
(Internet).
IP A Certification Reports, 1996. Quarter Ending 31/03/96, 30/06/96 & 30/09/96.
312
Irvine, S., 1989. "Consuming Fashions? The Limits of Green Consumerism," The
Ecologist, Vol.19, No. 3, pp. 88-93 .
Jackson, R . T., 1993. "Cracked Pot or Copper Bottom Investment? The
Development of the Ok Tedi Project 1982-1991," a personal view, Melanesian
Study Centre, James Cook University ofNorth Queensland.
Jaeger, C. C., 1993 . "Theoretical Perspective on the consequences of climate
change." Paper presented at the 88th annual meeting of the American
Sociological Association, Miami.
Janis, I.L., 1965. "The problem of validating content analysis" (pp. 55-82) in H.D.
Lasswell et al (eds) Language of Politics, Cambridge :MIT Press.
Jara, Mayda., 1994. "Environmental Legislation in Developing Countries: Some
Parameters and Constraints," Ecology and Law Quarterly, Vol. 12, No. 4, pp.
997-1034.
Kahill, L.B. and Kane, R.W., 1994. "Corporate Environmental Performance
Expectations in the 1990s: More than just Compliance," Total Quality
Environment Management, Summer 1994, pp. 409-420.
Kennedy, Danny., 1996. "The Wasteful Legacy of PNG Mining," Habitat, Vol. 24,
No. p. 22, August Issue.
Kestigan, M., 1991. "The Greening of Accountancy," The Australian Accountant,
September Issue, pp. 20-28.
Kintzele, M.L., Kintzele, P.L. and Kwiatkowski, V.E., 1994. "Environmental
Liabilities Disclosed in Corporate Annual Reports," Internal Auditing, Spring,
pp. 21-25 .
KMPG, 1992. Environmental Reporting: A survey of the top 100 companies in the
US, UK, Canada, KPMG Peat Marwick, London.
KMPG, 1993 . International Survey of Environmental Reporting
KPMG Peat Marwick, 1992.National Environmental Unit, Environmental
Reporting, A Survey of the top I 00 companies in the US, UK and Canada,
KPMG Peat Marwick, London.
Krippendorff, Klaus., 1980. Content Analysis-An Introduction to its Methodology,
313
Sage Publications, Beverley Hills-London.
Krueze, J.G., Newell, G. and Newell, Stephen., 1996. "Environmental
Contamination: Disclosing Liability Assets-Impairments," National Public
Accountant, Vol. 37, No. 6, pp. 32-36 June issue.
Laidlaws, A.F.,1992. Cooperatives in the Year 2000, An Asian Regional Studies
Paper
Land Rights News, 1996. Alarm over World Mining Destruction, Vol. 2, No.
39, July p. 8.
Laughlin, R. C., 1990. "Field study in Accounting: A case for middle range
thinking," unpublished working paper, Adelaide Accounting research Meeting,
The Flinders University of SA, Adelaide.
Laughlin, R. C., 1995 . "Methodological Themes: Empirical research in Accounting:
Alternative approaches and a case for middle range thinking," Accounting,
Auditing and Accountability, Vol. 8, No. 1, pp. 63-87.
Lehman, C., 1983 . "Stalemate in Corporate Social Responsibility Research,
American Accounting Association Public Interest Section," Working Paper.
Levin, J. and Fox, J.A., 1997. Elementary Statistics in Social Research,
Longman, New York.
Li, Y., Richardson, G.D. and Thornton, D.B., 1997. "Corporate Disclosure of
Environmental Liability Information: Theory and Evidence," Contemporary
Accounting Research, Vol. 14, No. 3, pp. 435-474.
Lindblom, C. K., 1983 . "The Concept of Organisational Legitimacy and its
Implications for Corporate Social responsibility Disclosure," Working
Paper No.7, Public Interest Section, AAA.
Ludwig, D. R., Hilbrom, R. and Walters, C. , 1993. "Uncertainty, Resource
exploitation and conservation: Lessons from History" . Science 260, p. 17.
MacArthur, J.B., 1988. "An analysis of the content of corporate submissions on
Proposed Accounting Standards in the United Kingdom," Accounting & Business
Research No. 71, pp. 213-226.
MacEachen, D., 1995. "Mining Companies and the Defence ofNature," Chain

314
Reaction No. 73/74, pp. 18-23 .
MacPherson, S., 1996. "Social Work and Economic Development," International
Social Work, Vol. 39, No. 1, pp. 55-67.
Malik, Michael., 1988. "Moving the Mountains: Time to start Exploiting a huge
PNG Copper Find," Far Eastern Economic Review, Vol. 141 , No. 30, p. 90,
July Issue.
Marsden, K., 1993 . "Employment Strategies in Papua New Guinea: An
International Perspective," International Labour Review, Vol. 132, No. 2, pp.
229-244.
Masaki, Hisane., 1995 . "Acid Rain," Japan Times Weekly Information, Vol. 35,
No. 28, p.17.
Matthews, M. R., 1984. "A Suggested Classification for Social Accounting
Research," Journal of Accounting and Public Policy, Vol.3, pp. 199-221.
Matthews, M. R ., 1985 . "The case for Social Accounting," Accounting Forum, Vol.
8, No. 3, pp.29-49
Matthews, M. R ., 1987. "The Implementation of the Interpretive Paradigm:
Philosophical bases Underlying Social Accounting," Accounting
Forum, Vol. 10, No. 3, pp. 23-37.
Matthews, M. R .,' 1993 .Social Responsible Accounting, Chapman and Hall, London.
Maurer, J.G., Shulman, J.M., Rawe, M. L. and Becherer, R. C. , 1995. Encyclopedia
of Business (A-I Vol. 1) Detroit, Gale Research Publishers .
May, Tim., 1993 . Social Research : Issues, Methods and Process, Open University
Press, Philadelphia.
Mccafferty, J., 1996. "A New Disclosure." CFO, Vol. 12, No. 2, p. 12, February
Issue.
Meyers, H.W., 1996. "Human Rights and MNCs," Human Rights Quarterly, Vol. 18,
No. 2, pp. 368-397 (May)
Milbrath, L.W., 1989. Envisioning a Sustainable Society, State University
Miller, T., 1994. "How Green is your company," Financial Forum, December 8.
Ministry ofForests, 1991. National Forests Policy, Hohola, PNG.

315
Mintzberg, H., 1983. An Emerging Strategy of 'Direct Research' in Van Maanan, J.
( ed) Qualitative Methodology, Sage Publication, Beverley Hills, CA, pp. 105-
116.
Mulchy, Colleen., 1995 . "CPA Pollution Draft offers Relief on Liability
Accounting," National Underwriters (Property, Casualty, Risk & Benefits), Vol.
99, No. 4, pp. 3, 15 .
Murphy, J. L. 1997. Major Companies of Far East and Australia in 1996/7, Vol. 3, :
Australia, New Zealand and PNG, Graham & Whiteside, London.
Nasi, Juha., Nasi, Salame., Nelson, Phillips and Zyglidopoulos, Stelios. 1997. "The
Evolution of corporate social responsiveness," Business & Society, Vol. 36, No.
3, pp. 296-321 (September Issue).
Naysnerski, Wendy and Tientenberg., 1992. "Private Enforcement of Federal
Environmental Law," Land and Economics, Vol. 68, No. I, pp. 28-48 .
Ness, Karen E. and Mirza, AM., 1991. "Corporate Social Disclosure: A note on the
test of Agency Theory," British Accounting Review, Vol. 23, No. 3, pp. 211-
217.
Ng, D.S., 1978. "An information Economics Analysis ofFinancial Reporting and
External Auditing," The Accounting Review, October, pp. 910-920.
Ng, L.W., 1985 . "Social Responsibility Disclosure of Selected New Zealand
companies in 1981, 1982 & 1983 ." Occasional Paper No. 54, Massey
University, Palmerston North.
Oxford Reference 1990. A Concise Dictionary of Business, Oxford University
Press, Oxford.
Pacific Placer Limited Annual Report, 1995
Parker, Colin (ed)., 1997. Accounting Handbook, Volume 1., Prentice Hall, Sydney.
Parker, L.D., 1986. "Polemical themes in Social Accounting: A scenario for standard
setting," Advances in Public Interest Accounting, Vol. 1, pp. 67-93 .
Parker, L.D., 1991. "External social accountability: Adventures in a maleficent
world" Advances in Public Interest Accounting, Vol. 4, pp. 23-34. '
Patten, S.M., 1992. "Intra-Industry Environmental Disclosure in Response to
316
Alaska Oil Spill: A note for Legitimacy Theory," Accounting, Organisation and
Society, Vol. 15, No. 5, pp. 471-475 .
Perkes, R.W., Rawlinson, D. and Ingram L., 1992. "An Exploration of Ethical
Investment in the UK," British Accounting Review, Vol.24, No. I, pp. 3-66.
Pfeffermann, Guy., 1992. "Facilitating Foreign Investments: Some dos and donts",
Finance & Development, Vol. 29, No. 1, pp. 46 & 47, March Issue.
Placer Dome Annual Report, 1992
Placer Dome Annual Report, 1993
Potier, N ., 1990. "OfMines and Mine: Modernity and its Malcontents in PNG,"
Ethology, Vol. 35, No. I, pp. 1-16.
Post, J.E., 1978. "Research on Patterns of Corporate Response to Social Change,"
Research in Corporate Social Performance and Policy, pp. 18-19.
Preston, L. E., 1981 . "Research on corporate social reporting: directions for
development," Accounting, Organisation and Society, Vol.6, No.3, pp.
255-263 .
Preston, L. E. and Post, J.E., 1975. Private Management and Public Policy,
Eaglewood Cliffs, NY., Prentice-Hall.
Preston, L. E., 1975. "Corporate and Society: the search for a paradigm, " Journal of
Economic Literature, July, pp. 434-453 .
Preston, L. E., 1983. Book Review: Teaching Materials in Business and Society,
California Management Review, Vol.25, Spring, pp. 158-173 .
Price Waterhouse, 1994. Progress on the Environmental Challenge: A Survey of
Corporate America's Accounting and Management.
Puxty, A. G., 1986.Social Accounting as immanent legitimation: a critique of a
technist ideology, Advances in Public Interest Accounting, Vol. I, pp. 95-112.
Puxty, A. G., 1991. Social Accountability and Universal pragmatics, Advances in
Public Interest Accounting, Vol. 4, pp. 35-46.
Reid, David., 1995. Sustainable Development-An Introductory Guide,
Earthscan, North Carolina.
RGC Annual Report 1993

317
Robert, C. B., 1991.Envirorunental Disclosure: a note on reporting in Mainland
Europe, Accounting, Auditing and Accountability Journal, Vol. 4, No. 3, pp. 62-
71.
Robert, R .,1992. Determinants of Corporate Social Responsibility Disclosure: An
Application of Stockholder Theory, Accounting, Organisation and Society,
Vol. 17, No. 6, pp. 595-612.
Root, Franklin., 1990. International Investment & Trade (sixth edition) Cincinnati,
Ohio: Southwestern.
Rosemarin, Carey S. and Ballesteros, Gary W. , 1995. "Speaking Out: The
Limitations of State Envirorunental Audit Privilege Statutes," Environment
Today, Vol. 6, No. 3, p. 10,
Rosenbaum, R. (ed) 1995. Principles for the Envirorunental Management of
Australian Mining Companies Operating in Papua New Guinea, ACF,
Melbourne.
Rosenbaum, R. 1993. "Ok Tedi-Undermining PNG's Future," Habitat Australia,
Vol. 21, No. 4, pp. 38-46, November Issue.
Rosenbaum, R. and Krockenberger, M., 1993 . Report on the Impacts of the Ok Tedi
Mine in Papua New Guinea, ACF, Melbourne.
Royston, M .G., 1979. Pollution Prevention Pays, Pergamon Press, Oxford.
Rubenstein, Daniel Blake., 1992. "Bridging the gap between Green Accounting and
Black Ink," Accounting, Organisation and Society, Vol. 17, No. 5, pp. 501-
508.
Rubins, Nick., 1991. "Environmental Auditing," Multinational Business, No. 2,
pp.18-26.
Sakaran, Uma., 1992. Research Methods for Business-A Skill Building
Approach (2nd Edition), John Wiley & Sons Inc, Brisbane.
Sarantakos, S., 1993. Social Research, MacMillian Education Australian,
Australian Pty Ltd, South Melbourne.
Schmidheiny, S., 1992. Changing the Course, MIT Press, NY.
Schofield, Michael., 1969. Social Research, Heinemann Educational Books, London.
318
Selltiz,, C., Writsman, L.J. and Cook, S.W., 1976. Research Methods in Social
Relations, Holt, Rinehart and Winston, New York.
Shapiro, Allan C., 1996. Multinational Financial Management (Fifth Edition),
Prentice-Hall International, Inc., New Jersy.
Shocker, A. D. and Sethi, S.P., 1974. "An Approach to Incorporating Social
Preference in Developing Corporate Action Strategies," in Sethi , S.P. (ed), The
Unstable Ground: Corporate Social Policy in a Dynamic Society, pp. 67-80,
Melville.
Solnes, Peter., 1995. "The Last Rainforest," Pacific Island Monthly, Vol. 65, No.
10, pp. 52-60 (October Issue).
Spicier, B.H., 1978. "Accounting for Corporate Social Performance: Some
Problems and Issues," Journal of Contemporary Business, Winter,
pp. 151-167.
Spicier, B.H. 1980. "The Relationship between Pollution Control Records and
Financial Indicators Revisited: Further comments," The Accounting Review
(January 1980), pp 178-185.
Sporule, N.L., 1988. Handbook of Research Methods: A Guide for Practitioners and
Students in the Social Sciences, London, The Scarecrow Press Inc.
Stanko, Brian and Zeller, Thomas L., 1995. "Environmental Liability in
Reporting," Business Economics Review, Vol. 41, No.2, pp. 19-23, Jan-Mar
Issue.
Steger, U., 1990. The Greening of the Boardroom, How European Companies are
Dealing with Environmental Issues, Business and Society Issue.
Stevens, K., 1995. "Law on Environment Side," Australian Financial Review, August
8, 1995.
Steven, W.P., 1979. Market Reaction to Corporate Social Performance-A Doctoral
Dissertation, University of Illinios, UMI Dissertation Information Service,
Michigan.
Stone, P.J., Dunphy, D. C., Smith, M.S. and Ogilive D.M., 1966. The general
inquirer: A computer approach to content analysis, Cambridge: MIT Press.

319
Sullivan, M.E. and Hughes, P.J., 1987. "The Application of Environmental
Legislation to Cultural Resource Management in Papua New Guinea,"
Environmental and Planning Law Journal, Vol. 4, No. 4, pp. 272-279
(December).
Sutton, B . (ed) 1993.The Legitimacy Corporation-Essential Readings in
Business Ethics and Corporate Governance, Oxford (UK) Blackwell Business
Publishers.
Sytyk, S., 1982. Private Australian Investments in the Pacific Basin 1945-2000, A
Masters Thesis UOW.
Tabor, A. and Rosenbaum, H., 1994. Guidelines for Global Business- A Discussion,
ACF, Melbourne.
Tai, Simeon W., 1978. Social Science Statistics-Its Elements and Applications,
Goodyear Publications, California.
Tawali, Kumalau., 1996. "Should we open every mine," Habitat, Vol. 24, No. 4, p. 22
Teoh, H.Y. and Thong, G., 1984. "Another look at corporate social responsibility
and reporting, an empirical study in a developing country," Accounting,
Organisation and Society, Vol. 9, No. 2, pp. 189-206.
Thomas, A.P., 1986. "The Contingency Theory of Corporate Reporting: Some
Empirical Evidence," Accounting, Organisation and Society, Vol. 11, No. 3, pp.
253-270.
Tilley, Kate., 1995 . "BHP Ltd-Pollution Dispute Continues," Business
Insurance, May 1995, p. 55 .
Tilly, Kate., 1995. "BHP LTD Pollution Dispute Continues," Business Insurance,
Vol. 29, No. 19, pp. 55-56.
Tilt, Carol., 1994. "The Influence ofExternal Pressure Groups on Corporate Social
Disclosure: Some Empirical Evidence," Accounting, Auditing and
Accountability Journal, Vol. 7, No. 4, pp. 47-72.
Tilt, C. A., 1997. "Environmental Policies ofMajor Companies: Australian
Evidence," British Accounting Review, Vol. 29, pp. 367-394.
Tinker, A. M. and Niemark, M., 1987. "The Role of Annual Reports in Gender and
320
Class Contradictions at General Motors: 1917-1976," Accounting, Organisation
and Society, pp . 65-88 .
Tinker, A. M., 1991. "The Accountant as Partisan," Accounting, Organisation and
Society, Vol. 16, No. 3, pp. 297-310.
Tinker, A. M., Lehman, C. and Neimark, M., 1991. "Corporate Social Reporting:
falling down the hole in the middle of the road," Accounting, Auditing and
Accountability Journal, Vol. 4, No. 1, pp. 28-54.
Tinker, A. M., Merino, B.D. and Neimark, M.D., 1982. "The Normative
Origins of Positive Theories: Ideology and Accounting Thought,"
Accounting, Organisation and Society, Vol. 7, No . 2, pp . 167-200.
Tinker, A.M., 1980. "Towards a Political Economy of Accounting: An
Empirical illustration of the Cambridge Controversies," Accounting,
Organisation and Society, Vol. 5, No. 1, pp. 147-160.
Todaro, M. P., 1994. Economic Development, Longman, London.
Tonkin, D . J. and Skerratt, L.C.L., 1992. Financial Reporting 1991-2: A survey
of UK Reporting Practice, ICAEW, London.
Tonkin, D .J. and Skerratt, L.C.L., 1991. Financial Reporting 1990-91: A survey
of UK Reporting Practice, ICAEW, London.
Tran, Huong-Thuy, 1994. A Case Study of Social Responsibility Accounting in
Local Government Reporting, Masters of Commerce (Hons) Thesis, UOW.
Trotman, K. T ., 1979. "Social Responsibility Disclosures by Australian
Companies," Chartered Accountant, March pp. 24-28.
Trotman, K. T. and Bradley, G. W., 1981. "Association between Social
Responsibility Disclosure and Characteristics of Companies," Accounting,
Organisation and Society, Vol. 6, No. 4, pp. 355-362.
Turvey, Nigel D. 1994 Afforestation and Rehabilitation oflmpera Grassland in
South East: Identification of Priorities for Research, Education, Training and
Extension, ACIAR , Canberra.
Ullman, A. E., 1985. "Data in Search of a Theory: A Critical Examination of the
321
Relationship among Social Performance, Social Disclosure and Economic
Performance of US Firms," Academy of Management Review, Vol. 10, No.3, pp.
540-557.
Ullman, A.E., 1976. "The Corporate Environmental Accounting System: A
Management tool for fighting environmental degradation," Accounting,
Organisation and Society, Vol. 1, No. 1, pp. 71-19.
UN, 1992. United Nations Centre for Transnational Corporations,
International Testing, UNCTC, NY.
UN, 1993. United Nations Centre for Transnational Corporations,
International Testing, UNCTC, NY.
UNCTC, (United Nations Commissions on Transnationals Corporations) 1992.
Intergovernmental Working Group of Experts on International Standards of
Accounting and Reporting, Environmental Disclosure: International Survey of
Corporate Reporting Practices, Economic and Social Council, EiC
10/ AC.3/1992/3.
United Nations Commission on Transnational Corporations,. Intergovernment
Working Group of Experts on International Standards of Accounting and
Reporting, Accounting for Environment Protection Measures, Economic and
Social Council (1991), E/C.10/AC.3/1991/5 .
United Nations Commission on Transnational Corporations. Intergovernment
Working Group of Experts on International Standards of Accounting and
Reporting, Environmental Disclosures: International Survey of Corporate
Reporting Practices, Economic and Social Council (1992), E/C10/AC3/1992/3.
Veslinds, P. A. and Peirce, J. Jeffrey., 1983. Environmental Pollution and
Control (end edition), Mann Arbor Science Publisher, Michigan.
Vinod, Busjeet. 1990. Foreign Investment from Less Developed Countries: A
Strategic Profile Dissertation, UMI Dissertation Services
Vinten, Gerald., 1993. "The Environment: A Legal, Business and Accountancy
Perspective," Management Decision, Vol. 31, No. 4, pp.17-25
Vogel, Allen H., 1993. "Accountants Beware: Environmental Regulation may affect
322
you." Secured Lender, Vol. 49, No. 4, pp. 46 & 68, Jul/Aug Issue.
Waincymer, Jeff, 1998. "International Economic Law and the Interface
between Trade and Environmental Regulation," Journal of International Trade
and Economic Development, Vol. 7, No. 1, pp. 3-38.
Wallace, Wanda A., 1991 . Accounting Research Methods, Do the facts speak for
themselves, Irwin Pub., Boston MA.
Wallis, R. , 1995 . "ABS to develop Green Accounting," Search Vol. 26, No . 5, p. 132.
Walter, RS. and Blake, D.H., 1992. The Politics of Global Economic
Relations, 170 (4th edition).
Warner, Malcolm (ed) 1996. International Encyclopedia of Business and
Management, Routeledge Publishers, London.
WCED,(World Commission on Environment and Development), 1987. Our
Common Future, New York, Oxford University.
Web, RP., 1988. Basic content analysis, Sage University Paper series on
Quantitative Application in the social science, series No.4, pp. 355-362.
Webb, Leslie., 1996. "Sustaining the Pace of Growth," Pulp and Paper
International, Vol. 38, No. 4, pp. 46-50 (April) .
Welford, R. , 1994. "Improving Corporate Environmental Performance,"
Environmental Management & Health, Vol.5, No. 2, pp. 6-10.
Wescott, William F., 1992. "Environmental Technology Corporation: A Quid Pro
Quo of TNC and Developing Countries," Columbia Journal of World
Business, Vol. 27, No. 3-4, pp. 144-153, Fall and Winter
Willits, S .D. and Metil, M. G., 1996. "Roles for CP As in Clients Eco-Audit,"
Pennsylvania CPA Journal, Vol. 67, No.5, pp. 26-31 , December Issue.
Wilmshurst, Trevor and Frost, Geoff, 1998. "Environmental Accounting-A
Growing concern?," The Accountant, pp. 20-23 (May Issue).
Wiseman, J., 1982. "An Evaluation of Environmental Disclosure made in Corporate
Annual Reports," Accounting, Organisations and Society, pp. 53-63 .
Wood, A 1994. " 10 Years after Bhopal," Chemical Week, Vol. 155, No. 22,
pp. 25-30.

323
Woodside Annual Report 1993
World Bank Report 1989. "Wilderness Destruction Threatens Development,"
Paci.fie Island Monthly, Vol. 59, No. 16, pp. 38-9 (April/May Issue).
Yamagami, Tatsundo and Kokubu, Katsuhiko,. 1991. "A note of Corporate Social
Disclosure in Japan," Accounting, Auditing and Accountability Journal, Vol. 4,
No. 4, pp . 32-39.
Young, 0. R., 1992b. "International Environmental Governance: Building
Institutions in anarchical Society in science and Sustainability:" Selected Papers
on IIASA' s 20 Anniversary, The International Institute for Applied Systems
Analysis, pp. 345-268 .
Zegal, D. and Ahmed, S. A., 1990. "Comparison of Social Responsibility
Information Disclosure Media used by Canadian Firms," Accounting, Auditing
and Accountability Journal, Vol. 3, pp. 38-53 .
Zimmerman, J. L. and Watts, R. L., 1986. Positive Accounting Theory,
Prentice-Hall Inc., New Jersy.
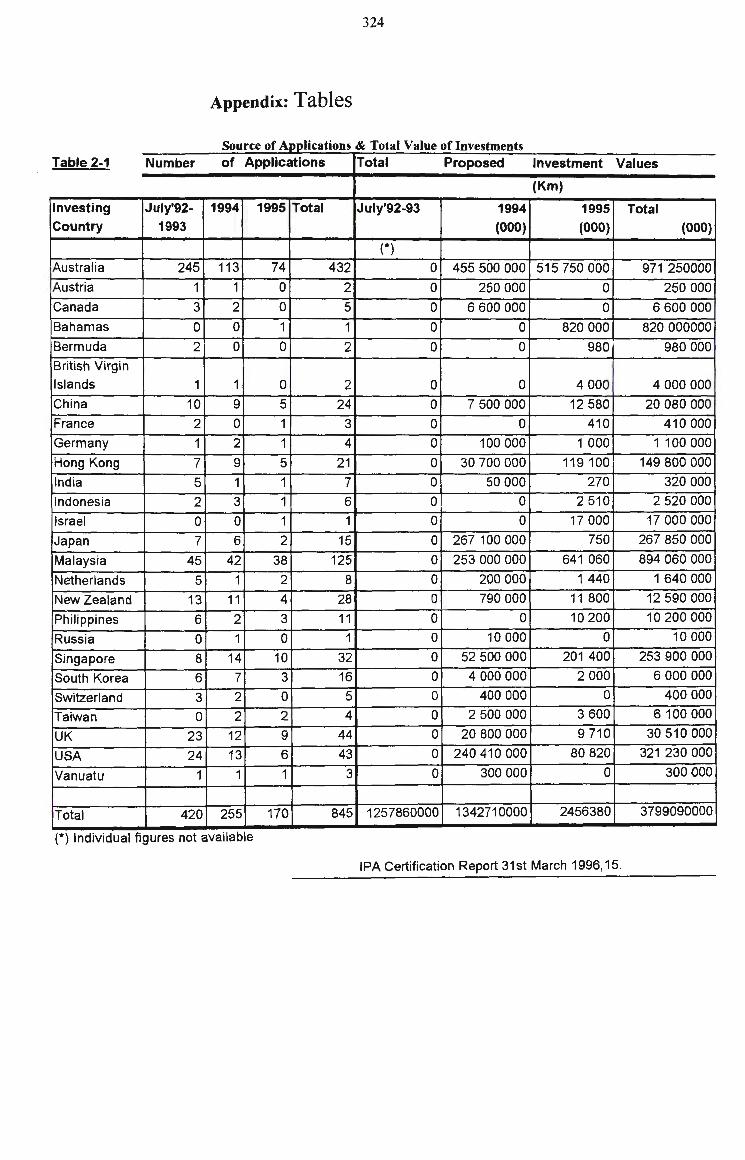
324
Appendix: Tables
r Source of Ann 1cations & Total Value of Investments Table 2-1 Number of Applications Total Proposed Investment Values
(Km)
Investing July'92- 1994 1995 Total July'92-93 1994 1995 Total Country 1993 (000) (000) (000)
(*)
Australia 245 , 113 74 432 0 455 500 000 515 750 000 , 971 250000
Austria 1 1 0 2 ' I 0 250 000 0 250 000
Canada 3 2 0 5 0 6 600 000 0 6 600 000
'Bahamas 0 0 1 1 0 0 820 000 820 000000
'Bermuda 2 0 0 2 0 0 980 980 000
British Virgin
Islands 1 1 0 2 0 0 4 000 4 000 000
China 10 9 5 24 0 7 500 000 12 580 20 080 000
France 2 0 1 3 0 0 410 410 000
Germany 1 2 1 4 0 100 000 1 000 1 100 000
Hong Kong 7 9 5 21 0 30 700 000 119 100 149 800 000
India 5 1 1 7 0 50 000 270 320 000
Indonesia 2 3 1 6 0 0 2 510 2 520 000
Israel 0 0 1 1 0 0 17 000 17 000 000
Japan 7 6 2 15 0 267 100 000 750 267 850 000
Malaysia 45 42 38 125 0 253 000 000 641 060 894 060 000
Netherlands 5 1 2 8 0 200 000 1 440 1 640 000
New Zealand 13 11 4 28 0 790 000 11 800 12 590 000
Philippines 6 2 3 11 0 0 10 200 10 200 000
Russia 0 1 0 1 0 10 000 0 10 000
Singapore 8 14 10 32 0 52 500 000 201 400 253 900 000
South Korea 6 7 3 16 0 4 000 000 2 000 6 000 000
Switzerland 3 2 0 5 0 400 000 0 400 000
Taiwan 0 2: 2 4 0 2 500 000 3 600 6 100 000
UK 23 12 9 44 0 20 800 000 9 710 30 510 000
USA 24 13 6 43 0 240 410 000 80 820 321 230 000
Vanuatu 1 1 1 3 0 300 000 0 300 000
Total 420 255 170 845 1257860000 1342710000 2456380 3799090000
(*) Individual figures not available
IPA Certification Report 31st March 1996, 15.

325
Table 2-2. Export Value of Commoditv <Km) Export Share Percenta2e (%)
Commodity 1991 1992 1993 1994' 1995 1991 1992 1993 1994 1995
Minerals & Oli 1,005 1,372 1,768 1,783 2,435 72.3 73.6 69.9 67.0 71.7 Gold 667 746 682 702 840 48.0 40.0 27.0 26.4 24.7 Copper 324 314 ; 256 , 367 755 23.3 16.8 10.1 13.8 22.2 Silver 15 11 12 10 13 1.0 0.6 0.5 0.4 0.4 Oil 0 301 818 703 828 0.0 16.2 32.4 26.4 24.4
'
Agriculture 205 224 270 375 498 14.7 12 10.7 14.1 14.7 ' 1Coffee 80 68 101 205 215 5.7 3.7 4 7.7 6.3 Cocoa 34 34 33 29 48 2.4 1.8 1.3 1.1 1.4 Copra 5 12 1 14 15 27 0.4 0.61 0.6 0.6 0.8 Copra Oil 13 24 20 20 30 0.9 1.3 0.8 0.8 0.9 Palm Oil 53 64 79 78 142 3.8 3.4 3.1 2.9 4.2 Rubber 2 2 3 3 4 0.1 0.1 0.1 0.1 0.1 Tea 5 7 71 4 5 0.4 0.4 0.3 0.2 0.2 Other 14 13 14 21 27 1.0 0.7 0.5 0.8 0.8
Forestry 90 148 410 494 ' 450 6.5 8 16.2 18.6 13.2
Logs 81 1401 400 483 437 5.8 7.5 15.8 18.1 12.9 Other 9 8 10 11 13 0.6 ' 0.41 0.4 0.4 0.4
I
Marine 10 9 8 11 14 0.7 0.5 0.3 0.4 0.4
Re-Export 80 110 71 0 0 5.8 5.9 2.8 0 0
Total 1,391 1,863 2,527 2,663 3,397 100 100 100 100 100
Adapted from AusAid Report 1996, 128-129.
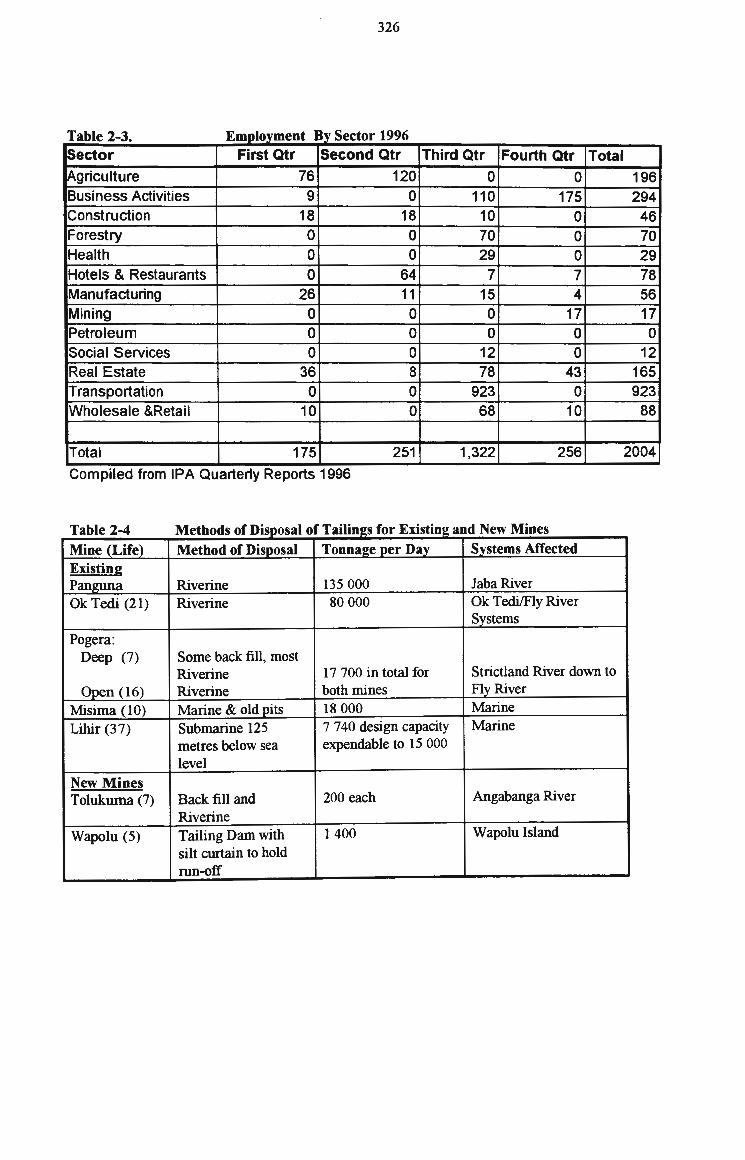
326
T bl 2 a e -3. E molovment B S iv ector 199 6 Sector First Qtr Second Qtr Third Qtr Fourth Qtr Total !Agriculture 76 120 0 0 196 Business Activities 9 0 110 175 294 Construction 18 18 10 0 46 Forestry 0 0 70 0 70 Health 0 0 29 0 29 Hotels & Restaurants 0 64 7 7 78 Manufacturing 26 11 15 4 56 Mining 0 0 0 17 17 Petroleum 0 0 0 0 0 Social Services 0 0 12 0 12 Real Estate 36 8 78 43 165 Transportation 0 0 923 0 923 Wholesale &Retail 10 0 68 10 88
Total 175 251 1,322 256 2004
Compiled from IPA Quarterly Reports 1996
T bl 2-4 a e M h d fD' et o so ISPOS al fT T t E .. 0 a1 m2s or x1stm2 an dN M' ew mes
Mine (Life) Method of Disoosal Tonna2e per Dav Svstems Affected Existing Panl!lllla Riverine 135 000 Jaba River
Ok Tedi (21) Riverine 80 000 Ok Tedi/Fly River Systems
Pogera: Deep (7) Some back fill, most
Riverine 17 700 in total for Strictland River down to
Open (16) Riverine both mines Fly River
Misima (10) Marine & old oits 18 000 Marine
Lihir (37) Submarine 125 7 7 40 design capacity Marine
metres below sea expendable to 15 000
level New Mines Tolukuma (7) Back fill and 200 each Angabanga River
Riverine Wapolu (5) Tailing Dam with 1400 Wapolu Island
silt curtain to hold run-off
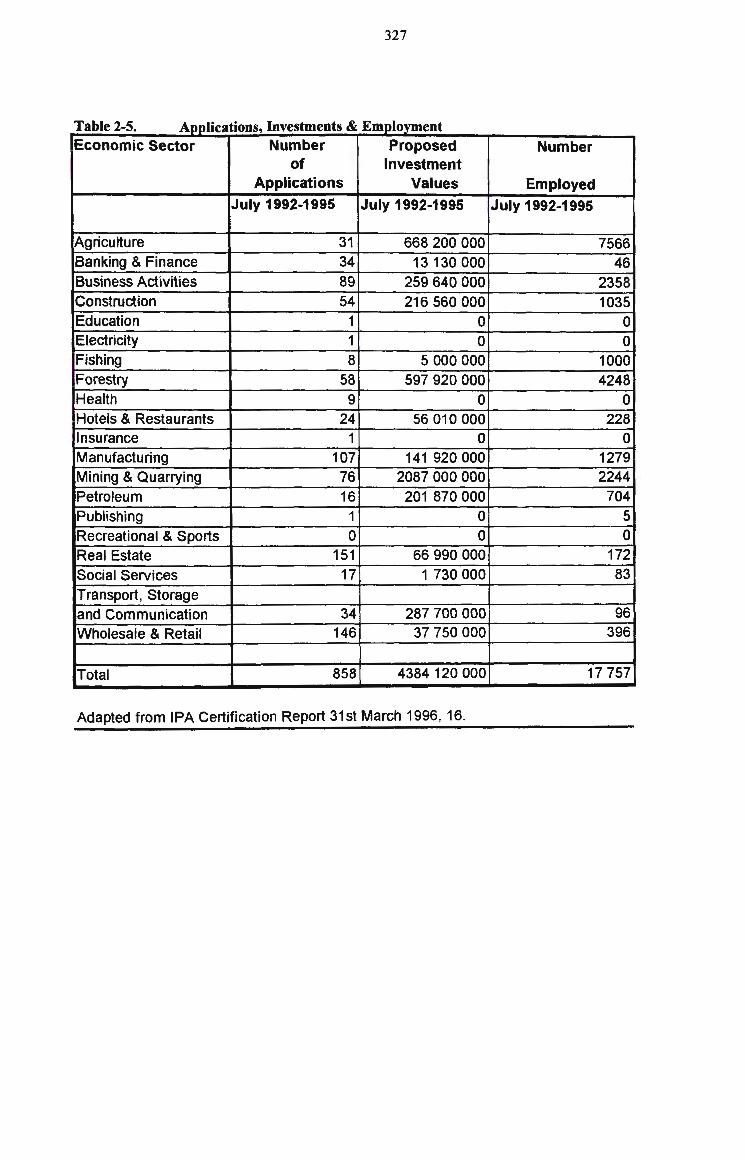
327
T bl 2 5 a e - . Aoolicatlons, In vestments &E moovment Economic Sector Number Pro,posed Number
of Investment Applications Values Employed
July 1992-1995 July 1992-1995 July 1992-1995
Agriculture 31 668 200 000 7566 Banking & Finance 34 13 130 000 46
1
Business Activities 89 259 640 000 2358 Construction 54 216 560 000 1035 Education 1 0 0 Electricity 1 0 0 Fishing 8 5 000 000 1000 Forestry 58 597 920 000 4248 Health 9 0 0 Hotels & Restaurants 24 56 010 000 228 Insurance 1 0 0 Manufacturing 107 141 920 000 1279 Mining & Quarrying 76 2087 000 000 2244
Petroleum 16 201870000 704
Publishing 1 0 5 Recreational & Sports 0 0 0
Real Estate 151 66 990 000 172
Social Services 17 1 730 000 83
Transport, Storage and Communication 34 287 700 000 96
Wholesale & Retail 146 37 750 000 396
Total 858 4384 120 000 17 757
Adapted from IPA Certification Report 31st March 1996, 16.

328
Table 5-1. MN Cs Country of Origin & Number of Applications Accepted to 0 . PNG 1oerate m
Investing Country Jul-93 1994 1995 1996 Total
Australia 245 113 74 72 504
Austria 1 1 0 0 2 Canada 3 2 0 2 7 Bahamas 0 0 1 1 2 Bermuda 2 0 0 1 3 British Virgin Islands 1 1 0 0 2 China 10 9 5 6 30
' Cook Islands 1 0 0 0 1 Denmark 0 0 1 0 1 Fiji 1 0 0 0 1 Finland 0 0 0 1 1
. France 2 1 0 1· 1 4 Germany 1 2 1 0 4 Hong Kong 7 9 5 6 27 India 5 1 1 5 12 Indonesia 3 2 1 2 8
Italy 2 0 0 1 3
Israel 0 0 1 1 · 2
!Japan 7 6 2 1 16
Liechtenstein 2 0 0 0 2
Malayan 2 0 0 0 2 Malaysia 45 42 38 20 145
New Zealand 13 11 4 3 31
Netherlands 5 1 2 1 9
Pakistan 0 1 0 2 3
Philippines 6 2 3 4 15
Russia 0 1 0 0 1
Singapore 8 14 10 8 40
Slovenia 0 1 0 0 1
South Korea 6 7 3 2 24
Sri Lanka 1 0 0 1 2
Switzerland 3 2 0 0 5
Taiwan 0 2 2 2 6
Tanzania 1 0 0 0 1
United Kingdom 23 12 9 10 58
USA 24 13 6 12 55
Vanuatu 1 1 1 1 4
TOTALS: 430 257 171 87'1 945
IPA Report 31st March 1996, Table 15
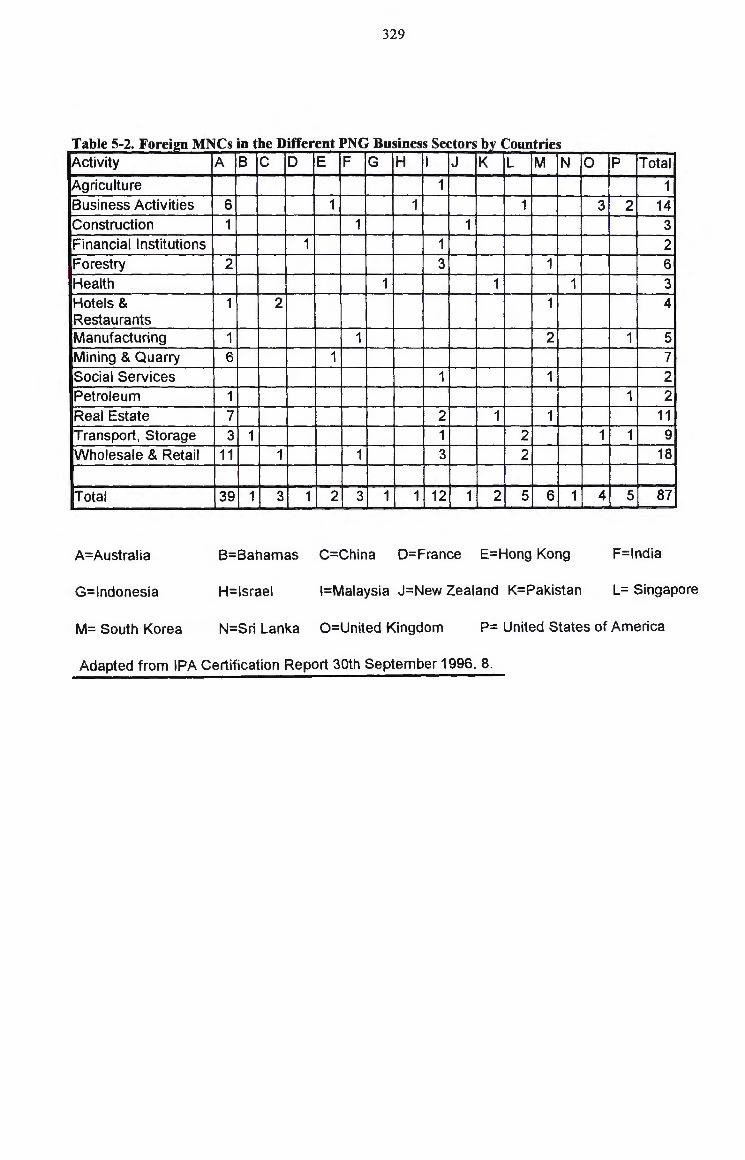
329
T bl 5 2 F a e - . orei!!ll MNC . h D"ff SID t e 1 erent PNGB . usmess s ectors by Countries Activity A B c D E F G H I J K L M N 0 p Total
Agriculture 1 1 Business Activities 6 I 1 1 1 3 2 14 Construction 1 1 I 1 3 Financial Institutions I 1 1 2 Forestry 2 3 1 6 Health 1 1 I 1 3 Hotels & 1 2 1 4 Restaurants '
Manufactur,ing 1 1 2 1 5 Mining & Quarry 6 1 7 Social Services 1 1 2 Petroleum 1
I ' 1 2 '
Real Estate 7 ' 2 1 1 11 Transport, Storage 3 1 1 2 1 1 9
Wholesale & Retail 11 1 1 3 2 18
Total 39 1 3 1 2 3 1 1 12 1 2 5 6 1 4 5 87
A=Australia B=Bahamas C=China D=France E=Hong Kong F=lndia
G=lndonesia H=lsrael !=Malaysia J=New Zealand K=Pakistan L= Singapore
M= South Korea N=Sri Lanka O=United Kingdom P= United States of America
Adapted from IPA Certification Report 30th September 1996, 8.

330
Tb a le 5-3. Value of Prooose di b ct' t b d' nvestment 1y oun nes or t e year en m2 31 st December, 1996. Country First Qtr Second Qtr Third Qtr Fourth Qtr Total
Australia 5 110 000 29 372 109 325100 586 105 503 953 465 086 648 Bahamas 0 0 820 000 000 0 820 000 000 Belgium 0 0 0 5 100 000 5 100 000 British Virgin Is. 0 0 0 190 190 000
000 Canada 0 5 000 000 0 0 1 318 500 China 0 105 727 328 19 000 000 18 430 000 143 157 328 France 0 0 0 0 0 Hong Kong 0 1 200 000 0 0 1 200 000 India 0 0 1 175 000 0 1 175 000 Indonesia 0 0 72 515 0 72 515 Italy 0 600 000 0 0 600 000 Japan 0 0 0 0 0 Malaysia 11 880 11 800 000 158 653 000 0 5 640 000
000 Netherlands 0 0 0 0 0 New Zealand 0 100 000 300 000 60 000 460 000
1Pakistan 0 0 2 000 000 0 2 000 000
Philippine 1 250 000 0 0 319 800 1 569 800
Singapore 300 000 20 217 157 3 780 000 4 154 000 28 451 157
South Korea 0 510 000 127 747 000 627 350 128 884 350
·Taiwan 0 0 0 0 0
United Kingdom 350 000 156 000 577 772 30 000 1273772
USA 0 500 000 13 300 000 325 900 000 339700000
Vanuatu 1 300 000 80 000 0 0 1 380 000
Total 20 190 175 262 594 1472 205 873 467 273 603 1 482 172 422 000
I
Compiled from IPA Quarterly Reports 1996

331
Table 5-4 Responses of Companies Contacted
Companies No. P/N * Reports for these Years: 1=Rep O=N-. Rep .
Australian MNCs c - 1992 1993 1994 1995 1996 Acacia Resources 1 ' N -Address 0 0 0 0 0' Adelaide Brighton 2 p * 1 11 1 1 1,
Allgas Energy Ltd 3 N * 0 fl 1 1 1 Amalgamated 4 N * 1 0 0 1 1 Holdings Amcor Limited 5 N * 1 1 1 1 1 Ampolex Limited 6 p * 0 1 1 1 1 Arnotts Limited 7 p * 0 1 1 1 1 Ashton Mining 8N * 1 1 1 1 1 Astro Mining NL 9P * 0 0 0 1 1 Auridim 10 p * 1 1 1 1 1 Consolidated Aurora Gold Mine 11 N * 0 1 1 1 1 , Auspine Limited 12 N - I
Australian Chemical 13 p -Australian Gas Light 14 N * 1 1 1 1 1 Australian Gold 15 N * Resou Australian National 16 'P * 1 1 1 1 1 Ind Beach Petroleum NL 17 p -Address 0 0 0 0 0
Biota Holdings 18 N * 1 1 1 1 1 Limited Baral Limited 19 p * 1 1 1 1 1
Bouganville Copper 20 p * 1 0 0 0 1
Brambles Industries 21 N * 1 1 1 1 1
Bridge Oil Limited 22 p -Address Bridgstone Limited 23 N * 0 0 0 1 1
BHP Limited 24 p * 1 1 1 1 1
Buderim Ginger Ltd 25 p * 1 1 1 1 1
Burns Philp & Co. 26 N * 1! 1 1 1 1 Ltd Caltex Australia Ltd 27 p * 0 0 0 0 1
Camelot Resources 28 p -Carpenters Pacific 29 p -Res Choiseul 30 N * 1 1 1 11 1 Investments Coca Cola Amatail 31 p * 1 1 1 1 1
Command 32 p * 1 1 1 1 1
Petroleum
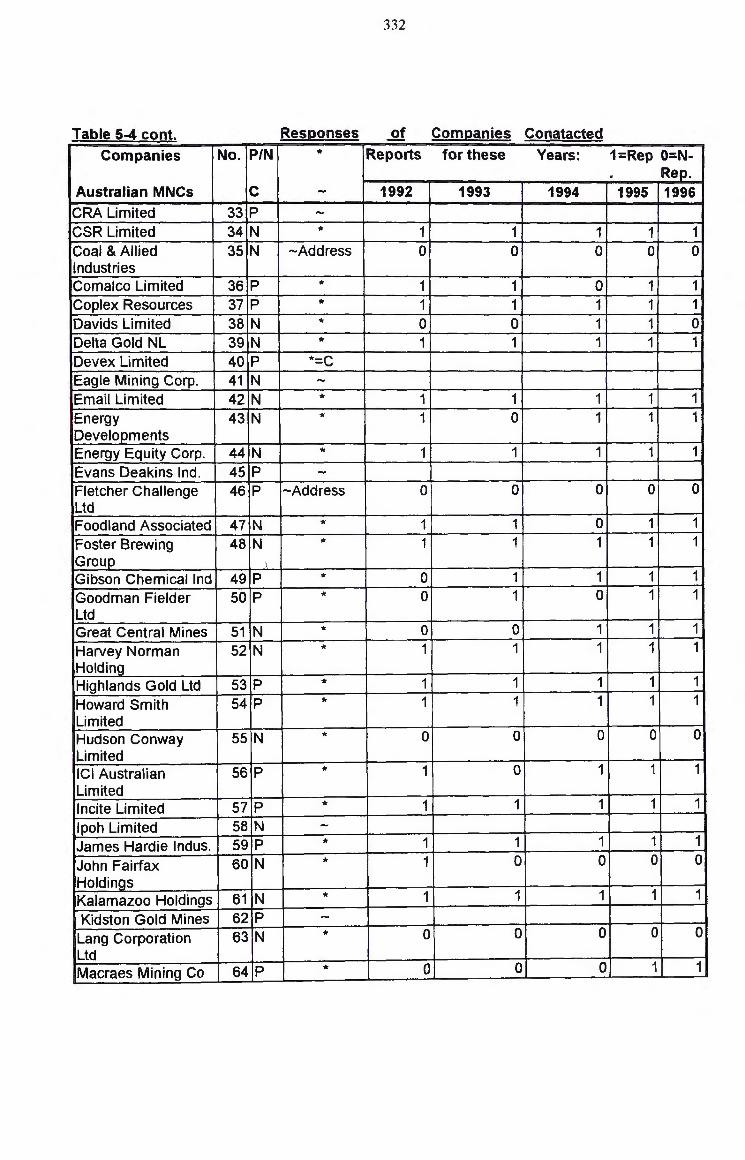
332
Table 5-4 cont . Resoonses of Comoanies Conatacted
Companies No. PINI "' Reports for these Years: 1=Rep O=N-. Rep .
Australian MNCs c - 1992 1993 1994 1995 1996 CRA Limited 33 p -CSR Limited 34 N "' 1 1 1 1 1 Coal & Allied 35 N -Address 0 0 0 0 0 Industries Comalco Limited 36 p "' 1 1 0 1 1 Coplex Resources 37 p * 1 1 1 1 1 Davids Limited 38 N * 0 0 1 1 0 Delta Gold NL 39 N * 1 1 1 1 1 Devex Limited 40 p *=C Eagle Mining Corp. 41 N -Email Limited 42 N * 1 1 1 1 1 Energy 43 N "' 1 0 1 1 1 Developments Energy Equity Corp. 44 N * 1 1 1 1 1 Evans Deakins Ind. 45 p -Fletcher Challenge 46 p -Address 0 0 0 0 0 Ltd Foodland Associated 47 N * 1 1 0 1 1
Foster Brewing 48 N * 1 1 1 1 1 Group .1
Gibson Chemical Ind 49 p * 0 1 1 1 1
Goodman Fielder 50 Ip * 0 1 0 1 1
Ltd Great Central Mines 51 N * 0 0 1 1 1
Harvey Norman 52 N * 1 1 1 1 1 1 Holdina Highlands Gold Ltd 53 p * 1 1 1 1 1
Howard Smith 54 p * 1 1 : 1 1 1 Limited Hudson Conway 55 N * 0 0 0 0 0 Limited ICI Australian I 56 p * 1 0 1 1 1
Limited Incite Limited 57 p * 1 1 1 1 1
lpoh Limited 58 N -James Hardie Indus. 59 p * 1 1 1 1 1
John Fairfax 60 N * 1 0 0 0 0 Holdings Kalamazoo Holdings 61 N * 1 1 1 1 1
Kidston Gold Mines 62 p -Lang Corporation 63 N * 0 0 0 0 0
Ltd '
Macraes Mining Co 64 p * 0 0 0 1 1

333
Table 5-4 cont . Resoonses of Comoanies Conatacted
Companies No. P/N * Reports for these Years: 1=Rep O=N· . Rep .
Australian MNCs c - 1992 1993 1994 1995 1996 Manettas Limited 65 p -Metal Corporation Ltd 66 N *Misun. 0 0 0 0 0 Metal Manufacturers 67 N -Mildara Blass Limited 68 p *=C 0 0 0 0 0 MIM Holdings Ltd 69 p * 1 1 1 1 1 Mulpha Australian 70 p *=C 0 0 0 0 0 Ltd National Foods 71 N * 1 1 1 0 1 Limited National 72 N * 1 1 1 1 1 Consolidation National Can 73 N -Industries Newcrest Mining Ltd 74 p -Niugini Mining 75 p -Limited '
Normady Poseidon 76 p I *=C 0 0 0 0 0 Ltd Novus Petroleum Ltd 77 N * 0 0 0 1, 1 NZ Oil and Gas Ltd 78 p * 1 1 1, 1 1 Oil Search 79 p -Pacific BBA Limited 80 N * 1 1 1 1 1 Pacific Dunlop Ltd 81 p * 1 1 1 1 1
Petroz NL 82 N * 0 0 1 1 1
Pioneer International 83 N * 1 1 1 1 1 Placer Dome Inc. 84 p * 1 1 1 1 1 Placer Pacific 85 p * 1 1 1 1 1 Limited
. Poseidon Gold 86 p *=C 0 01 0 0 0 Limited P&O Containers 87 p * 0 0 0 1 1 Qantas Airways Ltd 88 N * 0 0 1 1 1
QNI Limited 89 N * 0 1 1 1 1 Queensland Metal 90 N * 1 1 1 1 1 Ind. I
QUF Industries Ltd 91 N * 1 1 1 1 1 Ramsgate Resources 92 p * 1 1 1, 1 1
Rension Goldfields 93 p * 1 1 1 1 1
Resolute Samantha 94 N * 1 1 1 1 1
Rhodes Mining NL 95 p * 1 1 1 1 1
Ross Mining Limited 96 N * 0 0 1 1 1
Rothmans Holdings 97 p * 1 1' 1 1 1 ' SA Brewery 98 N * 1 1 0 0 0
Samantha Gold NL 99 N * 1 1 1 1 1

334
Table 5-4 cont . Responses of Companies Contacted
Companies ' No. P/N * Reports for these Years: 1=Rep. O=N-Rep.
Australian MNCs c - 1992 1993 1994 1995 1996 Sagasco Resources 100 p * 1 1 1 1 Santos Limited 101 p * 1 1 1 1 Savage Resources 102 N * 1 1 1 1 Siddon Ramset Ltd 103 N * 1 1 1 1 Skilled Engineering 104 N * 0 0 1 1 Ltd Sonic Healthcare Ltd 105 N * 1 1 1 1 Southcorp Holdings 106 N * 0 0 1 1 Spicers Paper 107 N * (1989-91) 0 0 0 0 Limited Tap Oil NL 108 N -Thankral Holdings 109 N * 0 0 1 1 Ltd Ticor Limited 110 N * 0 0 1 1 Union Mining NL 111 p *Website 0 o' 0 0 United Construction 112 N * 0 0 0 1 Valdora Minerals NL 113 ,p -Addrress 0 0 0 0 Village Roadshow 114 N -Ltd W.D. & H.O. WHM 115 p * 1 1 1 1 Westfarmers Limited 116 p * 0 1 1 1 Wiluna Mines Ltd 117 p -Woodside Petroleum 118 N * 1 1 1 1 Colesmayer 119 N * 0 0 0 0
P=Companies that operate in PNG *= Companies which responded to letters sent out N=Companies which do not operate in PNG -=Companies which did not respond C=Companies that ceased operations -Address = letter returned to sender their
in PNG *Website = companies provided website address only
1 1 1 1 1
1 1 0
1
1 0 1 0
1 1
1 0
1 =An Annual Report received for that year Total Exgected Annual Regorts 119x5
O=No Annual Report received for that year 1992-1996 Actually Received 347 0.583 0.58 1992-1997 Actually Received 394
95 companies responded 0.798 0.80
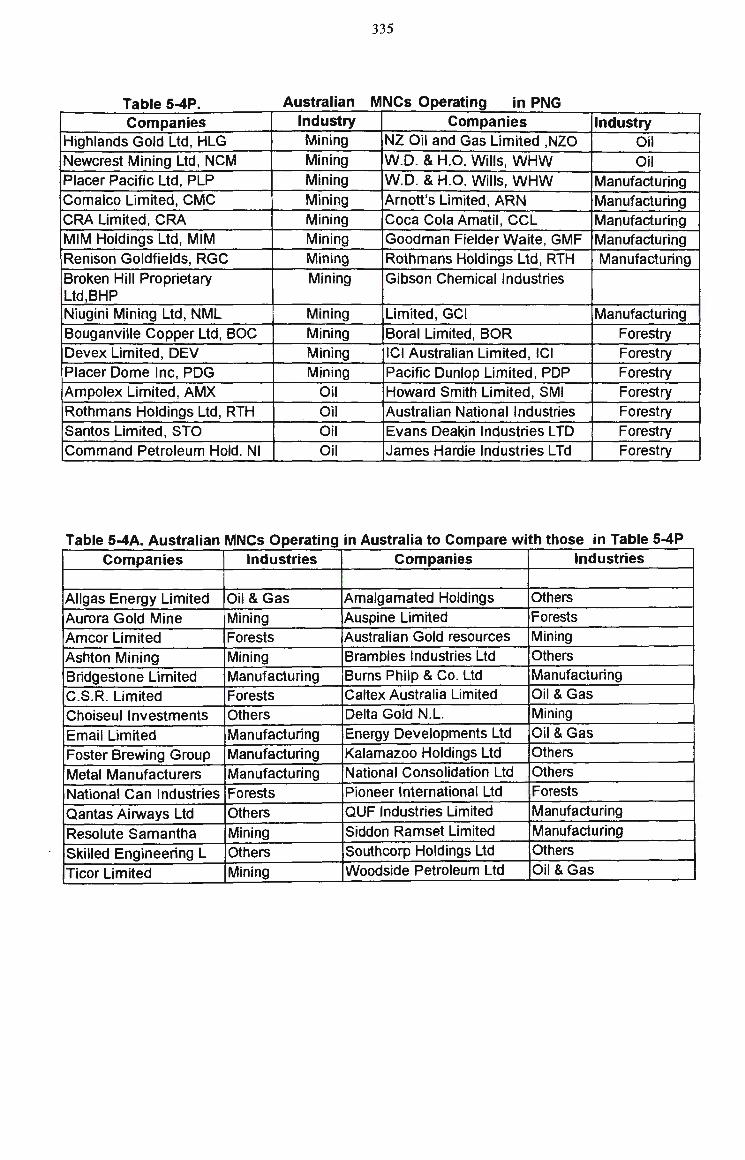
335
Table 5-4P. Australian MNCs Operating in PNG
Companies Industry Companies Industry Highlands Gold Ltd, HLG Mining NZ Oil and Gas Limited ,NZO Oil Newcrest Mining Ltd, NCM Mining W.D. & H.O. Wills, WHW Oil Placer Pacific Ltd, PLP Mining W.D. & H.O. Wills, WHW Manufacturing Comalco Limited, CMC Mining Arnott's Limited, ARN Manufacturing CRA Limited, CRA Mining Coca Cola Amatil, CCL Manufacturing MIM Holdings Ltd, MIM Mining Goodman Fielder Waite, GMF Manufacturing • Renison Goldfields, RGC Mining Rothmans Holdings Ltd, RTH Manufacturing Broken Hill Proprietary Mining Gibson Chemical Industries Ltd,BHP Niug1ini Mining Ltd, NML I Min.ing Limited, GCI Manufacturing Bouganville Copper Ltd, BOC Mining Boral Limited, BOR Forestry Devex Limited, DEV Mining ICI Australian Limited, ICI ' Forestry Placer Dome Inc, PDG Mining Pacific Dunlop Limited, PDP Forestry Ampolex Limited, AMX Oil Howard Smith Limited, SMI Forestry Rothmans Holdings Ltd, RTH Oil Australian National Industries Forestry Santos Limited, STO Oil Evans Deakin Industries LTD I Forestry Command Petroleum Hold. NI Oil James Hardie Industries L Td Forestry
Table 5-4A. Australian MNCs Operating in Australia to Compare with those in Table 5-4P Companies Industries Companies Industries
Allgas Energy Limited Oil & Gas Amalgamated Holdings Others
Aurora Gold Mine Mining Auspine Limited Forests
Amcor Limited Forests Australian Gold resources Mining
Ashton Mining Mining Brambles Industries Ltd Others
Bridgestone Limited Manufacturing Burns Philp & Co. Ltd Manufacturing
C.S.R. Limited Forests Caltex Australia Limited Oil & Gas
Choiseul Investments Others Delta Gold N.L. Mining
Email Limited 'Manufacturing Energy Developments Ltd Oil &Gas
Foster Brewing Group Manufacturing Kalamazoo Holdings Ltd Others
Metal Manufacturers Manufacturing National Consolidation Ltd Others
National Can 'Industries Forests Pioneer International Ltd Forests
Qantas Airways Ltd Others QUF Industries Limited Manufacturing
Resolute Samantha Mining Siddon Ramset Limited Manufacturing
Skilled Engineering L Others Southcorp Holdings Ltd Others
Ticor Limited Mining Woodside Petroleum Ltd Oil & Gas

336
Table 5-5. Preliminarv Survev Summarv o f E . nv1ronmental Disclosure of Samole MNCs 1=disclose O= Did not 2=Did not
Env. Report Disclose En. Rep. respond Number of Number of Number of ComRanies 1/0/2 ComQanies 1/0/2 ComRanies 1/0/2
1 2 ' 41 2 81 1 2 1 42 1 82 1 3 1 43 1 83 1 4 1 44 1 84 1 5 1 45 2 85 1 6 1 46 2 86 2 7 1 47 2 87 0 8 1 48 1 88 1 9 1 49 1 89 1 10 1 50 1 90 1 11 1 51 1 91 1 12 2 52 0 92 1 13 2 53 2 93 1 14 1 54 1 94 1 15 2 55 2 95 1 16 1 56 1 96 1 17 2 57 1 97 1 18 0 58 2 98 1 19 1 59 1 99 1 20 1 60 1 100 2 21 1 61 1 101 1 22 2 62 2 102 1 23 1 63 2 I 103 1 24 1 64 1 104 1 25 1 65 2 105 0 26 1 66 2 106 1 27 1 67 2 107 2
28 2 68 2 108 2 I
'
29 2 69 1 109 1 30 0 70 2 110 1
31 1 71 1 111 2
32 1 72 1 112 1
33 2 73 2 113 2
34 1 74 2 114 2
35 2 75 2 115 1
36 1 76 2 116 1
37 1 77 1 117 2
38 0 78 1 118 1
39 1 79 2 119 0
40 2 80 1
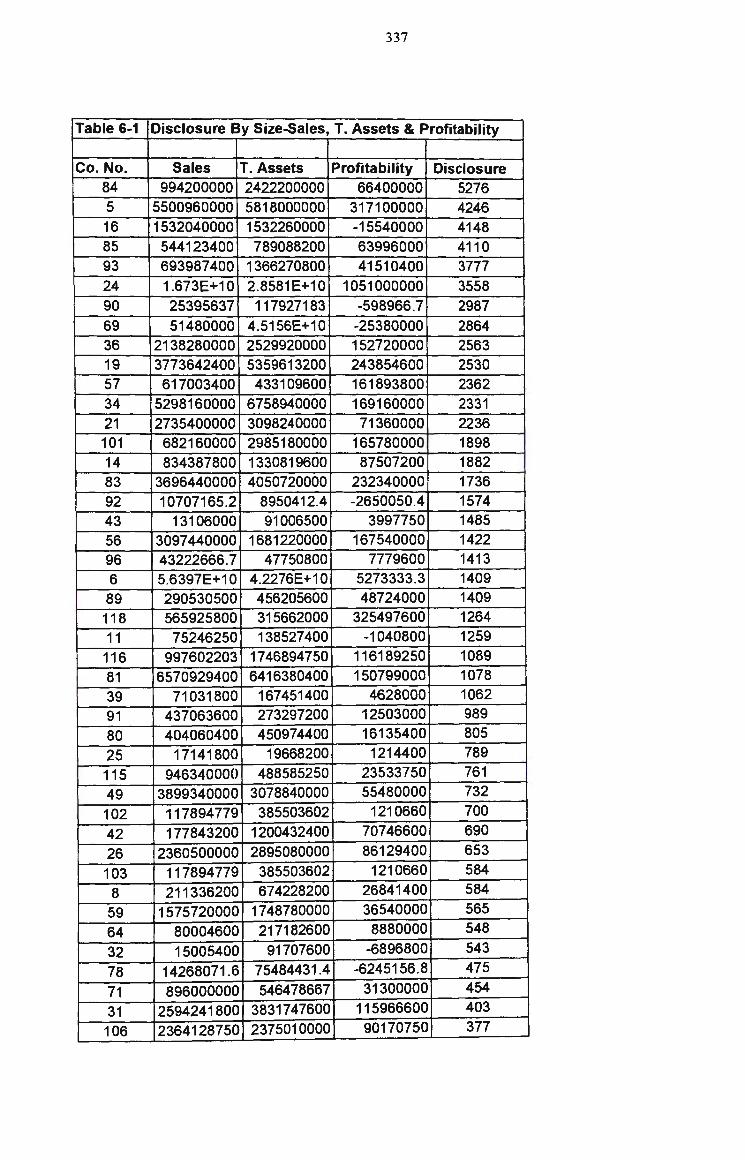
337
Table 6-1 Disclosure By Size-Sales, T. Assets & Profitability
Co. No. Sales T. Assets Profitability Disclosure 84 994200000 2422200000 66400000 5276 5 5500960000 5818000000 317100000 4246 16 1532040000 1532260000 -15540000 4148 85 544123400 789088200 63996000 ' 4110 93 693987400 1366270800 41510400 3777 24 1.673E+10 2.8581E+10 1051000000 3558 90 25395637 117927183 -598966.7 2987 69 51480000 4.5156E+10 -25380000 2864 36 2138280000 2529920000 152720000 2563
' 19 3773642400 5359613200 243854600 2530 57 617003400 433109600 161893800 2362 34 5298160000 6758940000 169160000 2331 21 2735400000 3098240000 71360000 2236 101 682160000 2985180000 165780000 1898 14 834387800 1330819600 87507200 , 1882 83 3696440000 4050720000 232340000 1736 92 10707165.2 8950412.4 -2650050.4 1574 43 13106000 91006500 3997750 1485 56 3097440000 1681220000 167540000 1422 96 43222666.7 47750800 7779600 1413 6 5.6397E+10 4.2276E+10 5273333.3 1409 89 290530500 456205600 48724000 1409 118 565925800 ' 315662000 325497600 1264 11 75246250 138527400 -1040800 1259 116 997602203 1746894750 116189250 1089 81 6570929400 6416380400 150799000 1078 39 71031800 167451400 4628000 1062 91 437063600 273297200 12503000 989 80 404060400 450974400 16135400 805 25 17141800 19668200 1214400 789 115 946340000 488585250 23533750 761
49 3899340000 3078840000 55480000 732
102 117894779 385503602 1210660 700
42 177843200 1200432400 70746600 690
26 2360500000 2895080000 86129400 653
103 117894779 385503602 1210660 584
8 211336200 674228200 26841400 584
59 1575720000 1748780000 36540000 565
64 80004600 217182600 8880000 548
32 15005400 91707600 -6896800 543
78 14268071.6 75484431.4 -6245156.8 475
71 896000000 546478667 31300000 454
31 2594241800 3831747600 115966600 403
106 2364128750 2375010000 90170750 377

338
T bl 6 1 C n· I b s· S I T As a e - ont. 1sc osure 1y ize: a es, . sets an d p fi b' . ro 1ta Ilhty 17 94348500 241292000 16321500 376 '
51 3899340000 3078840000 5917868.5 372 110 273817500 647405250 -11315000 365 82 33450000 48872000 3982750 333 60 780782200 1891491800 100657000 325 104 190538250 55328000 7820000 321 I
72 421361200 363422600 -76222200 302 99 92131644.2 185220485 17272966.4 287 97 1549399800 703203000 57635200 267 88 104000000 8192020000 68780000 264 3 75071946.8 72390503 6645205.2 263 10 80814112.4 20449396.4 68602.6 244 48 2704801600 4339213000 25888000 220 54 1378880000 1088980000 60880000 200 50 3899340000 3078840000 55840000 185 44 8036344.6 76148498 1929596.4 174 2 335275800 694486000 2333000 173 94 91914400 151431533 136432136.6 162 23 475732000 262246500 15502500 123 20 4460000 268840000 3320000 80 112 171755000 62032000 5084000 69 4 244533000 404970333 31756000 69 9 25411565.3 2548156.67 382579 58
109 111850000 4845900000 10595333 55 37 105392865 66463769.4 42654117 48 95 1059524.5 3682338.6 -188953 31 7 657244750 526943000 61975250 25 98 2157239000 2181723500 116368000 19

Table 6-5
MNCs in Australia Co.No. 1992 1993 1994
5 898 1236 564 90 754 1099 881 21 441 257 548 34 592 626 590 83 427 371 327 14 403 246 29 43 562 11 227 96 0 0 27 11 0 140 326 118 130 413 481 89 37 177 329 86 112 100 190 91 204 242 143 39 56 215 344 8 83 90 65
103 111 63 153 26 178 76 26 42 119 198 95 102 31 69 112 71 122 113 98 99 92 41 0 72 0 0 93 104 0 0 0 60 0 0 0 82 0 0 0 110 0 0 107 51 0 0 18 77 0 0 0 106 0 0 100 3 0 114 57
88 53 0 64 48 81 49 19 44 0 0 0 94 0 5 3 23 0 0 0 112 0 0 0 4 0 0 0
109 0 0 0 98 0 19 0
Total: 5486 5970 6016 Average 140.67 153.08 154.26 Std Dev 228.44 276.55 210.08
339
Environmental Disclosure Before and After 1994 (word count per MNC per annum)
MNCs in PNG 1995 1996 Co. 1992 1993 1994 1995
No 322 1226 7 0 0 0 25 109 144 95 0 0 0 0 410 580 37 0 0 0 0 90 i 433 9 0 0 0 0 97 517 20 18 46 0 0 593 ,I 561 2 31 39 103 0 4 681 54 0 28 36 18
426 960 50 0 33 0 73 286 401 10 0 74 0 134 16 208 97 141 0 72 54
353 513 31 0 82 124 85 181 222 78 30 0 97 158 140 260 59 88 245 28 27 259 188 64 0 0 0 269 147 199 32 30 130 13 178 52 206 25 186 73 258 106
231 142 115 0 0 17 127 238 50 49 70 209 187 0 295 193 116 0 209 186 199 26 117 81 356 246 39 69 3 151 6 122 133 0 315
65 144 56 405 489 102 351 222 99 92 338 48 481 447 151 174 101 257 104 195 493 167 167 36 340 370 64 957 141 117 19 229 411 678 932 46 308 57 471 383 878 265 151 225 69 409 346 515 648 81 196 ' 84 576 1311 582 1478 0 92 16 459 1550 817 792
147 0 93 551 343 787 847 41 30 24 368 154 601 895 34 140 85 663 734 817 1508 46 108 46 77 25 44 0 69 0 55 0 0
5641 9997 6138 7790 9671 11450 144.64 256.33 186.00 236.06 293.06 346.97 140.62 261.22 208.62 355.86 297.32 426.00
1996
0 31 48 58 16 0
118 79 36 0
112 190 177 279 192 166 578 266 414 418 839 123 261 849 832 380 365 946 1329 1104 1249 1240 388
13083 396.45 411 .58

340
T able 6-1 Oc. Disclosure b s •Y I MNC th t t . PNG ampe s a opera em : Co. No 1992 1993 1994 1995 1996 Increase/ Total Before After
Decrease Avg Avg Ava 7 0 0 0 25 0 Decrease 5.00 0.00 12.50
95 0 0 0 0 31 Increase 6.20 0.00 15.50 37 0 0 0 0 48 Increase 9.60 0.00 24.00 9 0 0 0 i 0 58 Increase 11.60 0.00 29.00
20 18 46 0 0 16 Increase 16.00 21.33 8.00 2 31 39 103 0 0 0 34.60 57.67 0.00 54 0 28 36 18 118 Increase 40.00 21.33 68.00 50 0 33 0 73 79 Increase 37.00 11.00 76.00 10 0 74 0 I 134 36 Decrease 48.80 24.67 85.00 97 141 0 72 54 0 Decrease 53.40 71.00 27.00
I 31 0 82 124 85 112 Increase 80.60 68.67 98.50 78 30 0 97 158 190 Increase 95.00 42.33 174.00 59 88 245 28 27 177 Increase 113.00 120.33 102.00 64 0 0 0 269 279 Increase 109.60 0.00 274.00 32 30 130 13 178 192 Increase 108.60 57.67 185.00 25 186 73 258 106 166 Increase 157.80 172.33 136.00 115 0 0 17 127 578 Increase 144.40 5.67 352.50 49 70 209 187 0 266 Increase 146.40 155.33 133.00 116 0 209 186 199 414 Increase 201.60 131.67 306.50 81 356 246 39 69 418 Increase 225.60 213.67 243.50 6 122 133 0 315 839 Increase 281 .80 85.00 577.00 56 405 489 102 351 123 Decrease 294.00 332.00 237.00 92 338 48 481 447 261 Decrease 315.00 289.00 354.00
101 257 104 195 493 849 Increase 379.60 185.33 671.00 36 340 370 64 957 832 Decrease 512.60 258.00 894.50 19 229 411 678 932 380 Decrease 526.00 439.33 656.00
57 471 383 878 265 365 Increase 472.40 577.33 315.00
69 409 346 515 648 946 Increase 572.80 423.33 797.00
84 576 1311 582 1478 1329 Decrease 1055.20 823.00 1403.50 16 459 1550 817 792 1104 Decrease 944.40 942.00 948.00
93 551 343 787 847 1249 : Increase 755.40 560.33 1048.00
24 368 154 601 895 1240 Increase 651.60 374.33 1067.50
85 663 734 817 1508 'I 388 Decrease 822.00 738 .00 948.00

341
Rests of Tests Based on Table 6-toc,
Results of T-Test for the:
Total: Period Before and Period After: Mean 279.62 Mean 218.23 Mean 371 .71 Standard 51 .65 Standard 45.13 Standard 67.90 Error Error Error Median 146.40 Median 120.33 Median 237.00 Mode #N/A Mode 0 Mode 948.00 Standard 296.68 Standard 259.23 Standard 390.06 Deviation Deviation Deviation Sample 88018.8 Sample 67200 Sample 152144. Variance 5 Variance Variance 36 Kurtosis 0.48 Kurtosis 1.20 Kurtosis 0.08 Skewness 1.20 Skewness 1.40 Skewness 1.08 Range 1050.20 Range 942 Range 1403.50 Minimum 5.00 Minimum 0 Minimum 0.00 Maximum 1055.20 Maximum 942 Maximum 1403.50 Sum 9227.60 Sum 7201 .7 Sum 12266.5
0 Count 33.00 Count 33 Count 33 .00 Confidence 105.20 Confidence 91 .92 Confidence 138.31 Level~95.0%~ Level~95.0%~ Level~95.0%~

342
Table 6-11 Comparison of Positive (Good) News and Negative (Bad) News Positive/Good Negative/Bad News News
MN Cs in Australia MN Cs in PNG Co.No. Positive Negative Co. No. Positive Negative
98 29 0 27 122 0 109 55 0 85 3913 30
4 79 0 24 2859 564 112 89 0 93 3670 62 23 123 0 16 3622 121 94 198 0 84 3589 704 44 265 0 69 2800 64 48 250 0 57 556 0 88 264 0 19 1860 595
3 263 0 36 2421 142 106 377 0 101 1784 104 77 362 0 92 949 1425 51 370 0 56 1320 78
110 356 0 6 1263 180 82 336 0 81 979 0 60 405 0 116 915 57
104 321 0 49 732 0 72 355 0 115 707 287 99 485 0 25 771 68 71 554 0 32 643 0
102 672 0 64 598 0 42 690 0 59 565 0 26 653 0 78 435 0
103 884 0 31 553 0 8 645 0 97 350 141
39 1018 0 10 344 0 91 1205 0 50 285 0 80 989 0 54 378 0 89 1369 0 2 573 0
118 1275 16 20 85 0 11 1245 0 9 60 0 96 1507 0 37 98 0 43 1563 20 95 0 40 14 2914 16 7 26 0 83 1989 6 34 2378 0 21 1722 1814 90 2846 195
5 3998 180 61 118 0
Total 35216 2247 39825 4662 Mean 877.62 56.18 1171 .32 137.12