1998 the influence of the mode of plasma generation on the
TRANSCRIPT

University of WollongongResearch Online
University of Wollongong Thesis Collection University of Wollongong Thesis Collections
1998
The influence of the mode of plasma generation onthe plasma nitriding behaviour of a micoralloyed[i.e. microalloyed] steelFarzad MahboubiUniversity of Wollongong
Research Online is the open access institutional repository for theUniversity of Wollongong. For further information contact ManagerRepository Services: [email protected].
Recommended CitationMahboubi, Farzad, The influence of the mode of plasma generation on the plasma nitriding behaviour of a micoralloyed [i.e.microalloyed] steel, Doctor of Philosophy thesis, University of Wollongong.Department of Materials Engineering, University ofWollongong, 1998. http://ro.uow.edu.au/theses/1529


THE INFLUENCE OF THE MODE OF PLASMA
GENERATION ON THE PLASMA NITRIDING BEHAVIOUR
OF A MICORALLOYED STEEL
A thesis submitted in fulfilment of the requirements for the award of the
degree of
DOCTOR OF PHILOSOPHY
from
UNIVERSITY^
TT70LLONGONG
by
FARZAD MAHBOUBI, B. Sc, M E. (Hons.)
Surface Engineering Research Centre
Department of Materials Engineering
December, 1995

DECLARATION
I, Farzad Mahboubi, hereby declare that the work presented in this thesis is m y own
work, except where acknowledged to others, and has not been submitted previously in
whole or in part in respect of any other academic record.
Farzad Mahboubi
u
SYNOPSIS
It is well understood that the introduction of nitrogen into metallic surfaces improves the
mechanical properties of engineering components, such as hardness, wear and fatigue as
well as the corrosion resistance. In addition to conventional techniques such as salt bath
and gas nitriding there are currently several methods which utilise plasma environments
for mass transfer, e.g. D C plasma nitriding, R F plasma nitriding and plasma immersion
ion implantation (PI-*).
It was the main aim of this investigation to study the plasma nitriding behaviour of a
commercially available chromium bearing microalloyed steel, M A X I M A ™ , in the hot
rolled and air cooled condition. The ultimate goal was to assess the possibility of using it
as an alternative to conventional quenched and tempered nitriding steels, such as En 19
(AISI 4140) which was used as a reference in this investigation. In order to identify the
most suitable gas mixture for the nitriding of M A X I M A ™ , a comprehensive
investigation of D C plasma nitriding at 450°C was performed by varying the hydrogen
concentration in the nitriding atmosphere and examining the structure and the properties
of the surface layers.
A detailed study of RF plasma nitriding and PI^ was undertaken using MAXIMA™
steel. In order to gain an insight into the influence of different modes of plasma
generation on the formation of the hardened layer and the mass transfer mechanisms
involved, a comparison was also made with D C plasma nitriding. All the experiments
were conducted on M A X I M A ™ steel for five hours at the temperatures of 350, 400,
450, 500 and 550°C.
Optical, scanning electron and atomic force microscopy, in conjunction with
microhardness and surface roughness measurements were employed to characterise the
nitrided surfaces. X-ray diffraction, both in normal and glancing angle configurations
and glow discharge optical emission spectroscopy were also utilised to identify the
phases that formed on the surface of nitrided specimens and the concentration profiles of
different elements.
It was found that DC plasma nitriding of MAXIMA™ at all temperatures developed
cases with higher surface hardness and roughness, and a slightly thinner compound layer
and diffusion zone than those obtained from Enl9 steel.
in

A comparative study between PI 3 and R F plasma nitriding revealed that the PI3 process
produced surface layers with more favourable properties, such as higher hardnesses and
thicker cases, than R F plasma nitriding. Unlike D C plasma nitriding, for the conditions
employed no compound layer was formed on the surface of the samples treated by either
PI 3 or R F plasma nitriding.
The best case, in terms of hardness and depth, was produced by PI3 at 350°C and by DC
plasma nitriding at higher temperatures. At all temperatures, R F plasma nitriding
produced the shallowest cases with the lowest hardnesses.
It has been argued that the mode of plasma generation plays a critical role in nitrogen
mass transfer. More specifically, the operating pressure and ion energy have been found
to be the key parameters in determining the total nitrogen adsorption on the surface. In
D C plasma nitriding mass transfer is primarily controlled by sputtering and re-deposition.
The moderate ion energy in D C plasma nitriding causes sputtering of the cathodic
surfaces. Sputtered species undergo collision with the nitrogen in the vicinity of the
surface because of low mean free path for collision (few millimetres) which is a direct
result of the relatively high operating pressure of a D C plasma. In stark contrast, in PI3
and R F plasma nitriding, the mean free path for collision of the ions and atoms is in the
order of several centimetres because of low operating pressure, hence there will be no
collisions near the sample and no re-deposition of sputtered material will take place.
Owing to extremely high ion energies involved in PI3, ion implantation is the dominant
mass transfer mechanism and sputtering of surface atoms is considerably lower than D C
plasma nitriding. The lack of significantly energised ions in R F plasma nitriding
eliminates the possibility of implantation and the main mass transfer mechanism is due to
the adsorption of low energy neutral species which are incapable of inducing and
sputtering.
Key Words
Plasma nitriding, DC plasma nitriding, RF plasma nitriding, ion nitriding, glow discharge
nitriding, plasma immersion ion implantation (PI3), high temperature ion implantation,
nitrogen ion implantation, microalloyed steel, H S L A steel.
iv

ACKNOWLEDGMENTS
I would like to express my appreciation to my supervisor Dr. M. Samandi for his
guidance and helpful supervision throughout the work particularly during the past six
months. I would also like to sincerely thank Prof. D. Dunne, my co-supervisor for his
help, continued support and encouragement.
Special thanks to the Ministry of Culture and Higher Education of Iran for award of a
scholarship which allowed this work to be undertaken.
I am particularly grateful to Dr. G. A. Collins from ANSTO for his close cooperation,
useful discussion and help. Grateful thanks to our other friends at ANSTO, Dr. J Tendys
and Dr. K. Short, where the RF plasma nitriding and PI3 treatments were performed
with the support of the Australian Institute of Nuclear Science and Engineering. I would
also like to thank Dr. M. Marychurch at BHP Research and Technology Centre for his
kind cooperation in GDOES of the samples.
All my friends in the department deserve heartfelt thanks for their valuable friendship,
especially Mr. A. Abdollahzadeh, M. Doroudian, S. Ghasemi, A. Razaghian, H. Zahiri J.
Jones and Dr. C. Montross. I would also like to sincerely thank the secretary of the
department, Mrs. R. Cambareri for her helpful and kind manner in dealing with the
official matters. Special thanks go to the technical staff of the department, L.
Brunckhorst, A. Scobe, G. Hamilton, G. Tillman, N. Mackie, R. Kinnell, R. De. Jong, A.
Bult and J. Gonzalez for their technical assistance.
Last but by far not least, I would like to express my sincere thanks to my wife and
parents for their continuous support, encouragement and patience throughout my
studies.
v

PUBLICATIONS
Mahboubi F., Samandi M., Dunne D., Bloyce A., Bell T; "Plasma nitriding of
microalloyed steel"; Surface and Coating Technology, 71 (1995) 135.
Mahboubi F., Samandi M., Dunne D.; "Plasma Immersion Ion Implantation and RF
Plasma Nitriding of a Microalloyed Steel"; submitted to Surface and Coating
Technology.
Mahboubi F., Samandi M., Dunne D.; "Plasma Nitriding Behaviour of Low Alloy and
Microalloyed Steels"; 'The Heat Is On'; Proc. of the first int. conf on the heat treatment,
24 & 25 May, 1995, Melbourne, Victoria, Institute of Metals & Materials, Australia.
Mahboubi F., Samandi M., Dunne D. and Collins G. A.; "The Influence of the Mode of
Plasma Generation on the Plasma Nitriding Behaviour of a Microalloyed Steel"; Proc.
of the 5th Word Seminar on Heat Treatment and Surface Engineering, 26-29 Sept. 1995,
Isfahan, Iran.
vi

TABLE OF CONTENTS
1. CHAPTER ONE: INTRODUCTION AND AIMS 23
1.1 Introduction 23
1.2 Aims of the Project 26
2. CHAPTER TWO: LITERATURE SURVEY 29
2.1 Iron-Nitrogen Phase Diagram 29
2.2 Nitrides of Iron 31
2.3 Structure of Nitrides 33
2.3.1 y,-Fe4N 33
2.3.2 6-Fe2N(i.x) 34
2.3.3 £-Fe2N 36
2.3.4 a"-Fei6N2 37
2.4 Nitriding 38
2.5 Kinetics of Nitriding 41
2.6 Nitriding Steels 46
2.7 HSLA Steels or Microalloyed Steels 50
2.7.1 Brief Introduction to MAXIMA™ microalloyed steel 52
vn

2.8 Nitriding of Microalloyed Steels 53
2.9 Plasma Discharges 55
2.9.1 Introduction 55
2.9.2 The DC Glow Discharge 56
2.9.3 Plasma Reaction Processes 62
2.9.4 Ion Interactions With Surface 63
2.9.5 The RF Glow Discharge 66
2.10 Plasma Nitriding 69
2.10.1 Introduction 69
2.10.2 Paschen'sLaw 71
2.10.3 Partial Pressure Operation 72
2.10.4 Nitrogen Activity 74
2.10.5 Equipment and Operation 75
2.10.6 Advantages and Disadvantages 7 8
2.10.7 Proposed Nitriding Models 81
2.11 Ion Implantation 85
2.11.1 Introduction 8 5
2.11.2 Basics of Ion Implantation 86
2.11.3 Strengthening Mechanisms of Ion Implantation 89
2.11.4 Plasma Source Ion Implantation (PSII) 91
2.11.5 Plasma Immersion Ion Implantation (PI3) 92
2.11.6 Advantages and Limitations of the Plasma Ion Implantation process 94
viii

CHAPTER THREE: EXPERIMENTAL PROCEDURE 97
3.1 Materials 97
3.2 Specimen Preparation 99
3.3 DC Plasma Nitriding 100
3.3.1 Treatment Conditions 102
3.4 PI3 and RF Plasma Nitriding 104
3.4.1 Treatment Conditions 106
3.5 Characterisation Techniques 107
3.5.1 Optical Microscopy 107
3.5.2 Scanning Electron Microscopy 107
3.5.3 X-ray Diffraction 108
3.5.4 Glancing Angle X-ray Diffraction 108
3.5.5 Glow Discharge Optical Emission Spectroscopy 108
3.5.6 Hardness Measurements 109
3.5.7 Surface Roughness Measurements 110
3.5.8 Atomic Force Microscopy 111
. CHAPTER FOUR: RESULTS 113
4.1 Introduction 113
4.2 Part I: Effect of Hydrogen Content on DC Plasma Nitriding of
MAXIMA™ . 116
ix

4.2.1 Microstructural Examination 116
4.2.2 X-ray Diffraction 118
4.2.3 Glow Discharge Optical Emission Spectroscopy 120
4.2.4 Hardness Tests 120
4.2.5 Surface Topography 123
4.3 Part II: DC Plasma Nitriding, RF Plasma Nitriding and PI3 127
4.3.1 Microstructural Examination 127
4.3.2 X-ray Diffraction 137
4.3.3 Glow Discharge Optical Emission Spectroscopy 141
4.3.4 Hardness Tests 147
4.3.5 Appearance of the Treated Samples 154
4.3.6 Surface Topography 155
5. CHAPTER FIVE: DISCUSSION 171
5.1 Effect of Hydrogen on Layer Formation in DC Plasma Nitriding 171
5.2 Comparative Study of DC Plasma Nitriding Behaviour of MAXIMA™
and En19 Steels 176
5.3 Plasma Immersion Ion Implantation (PI3) and RF Plasma Nitriding
of MAXIMA™ 183
5.4 GENERAL DISCUSSION: The Influence of the Mode of Plasma
Generation on the Plasma Nitriding Behaviour of MAXIMA™ 188
5.4.1 Introduction 188
x

5.4.2 Discussion 189
6. CHAPTER SIX: CONCLUSIONS 204
6.1 Effect of Hydrogen Content on DC Plasma Nitriding of MAXIMA™204
6.2 Comparative Study of MAXIMA™ and En19 Steels 205
6.3 Plasma Immersion Ion Implantation and RF Plasma Nitriding of
MAXIMA™ 206
6.4 The Influence of the Mode of Plasma Generation on the Nitriding
Behaviour of MAXIMA™ 207
7. APPENDICES 209
7.1 Appendix A: Metallography of Nitrided Samples 209
7.1.1 Edge Retention 209
7.1.2 Grinding and Polishing 210
7.1.3 Etching 211
7.1.4 Nickel Electroplating in Watts Bath 212
7.2 Appendix B: Glow Discharge Optical Emission Spectroscopy 215
7.3 Appendix C Surface Roughness Measurement 218
7.4 Appendix D: Atomic Force Microscope 221
8. REFERENCES _224
XI
LIST OF FIGURES
Figure 1. Iron-Nitrogen phase diagram (Kubaschewski, 1982). 30
Figure 2. Octahedral of metal atoms in the three closed-packed metal arrangements
(Jack and Jack, 1973). 33
Figure 3. The structure of nitrogen austenite and Y-Fe^N (Jack, 1948). 34
Figure 4. The crystal structure ofepsilon nitride (Jack 1952). 35
Figure 5. The crystal structure ofepsilon andzeta iron nitrides (Jack and Jack, 1973).36
Figure 6. Crystal structure of a"-Fei^2 (Jack, 1989). 37
Figure 7. Crystal structure of a"-Fei^2 as a defect of fee / structure (Jack, 1975). 38
Figure 8. (a) Microhardness profiles of a "strong" interaction: (b) schematic drawing
of the TiN, Ti, and N concentrations for a given nitriding time (Lightfoot and Jack,
1975). 42
Figure 9. (a) Microhardness profiles of a "weak" interaction or difficult nucleation;
(b) schematic drawing of the concentrations of the nitride phase (in this case a
metastable zone), Mo and N (Lightfoot and Jack, 1975). 45
Figure 10. (a) Microhardness profiles for an "intermediate" interaction; (b) schematic
drawing of the concentrations of CrN, Cr, andN(Lightfoot andJack, 1975). 46
Figure 11. Influence of alloying elements on hardness after nitriding. Base alloy
0.35% C, 0.30%Si, 0.70%Mn (Thelning, 1975). 47
xn
Figure 12. Influence of alloying elements on depth of nitriding measured at 400 HV.
Nitriding for 8 hat 520 °C (Thelning, 1975). 49
Figure 13. Current/voltage characteristic for a DC discharge. _57
Figure 14. various regions between the cathode an the anode of a glow discharge and
the accompanying changes in voltage, field strength, and net space charge across
it (Howatson, 1965). 60
Figure 15. (a) Inductively coupled plasma reactor. An alternating current power
source creates a time varying current, the magnetic field from which generates a
voltage that sustains the discharge, (b) Capacitively coupled plasma reactor.
Similar to (a), except the two plates are used to create an electric field to sustain
the discharge (Rossnagel et al, 1990). 68
Figure 16. Electron energy vs. electron density in glow discharge plasmas compared
to other well-known plasmas (Grube and Stephen; Kossoswsky (ed), 1989). 70
Figure 17. Paschen curves for a DC glow discharge between parallel-plate electrodes
for various gases. The breakdown voltage, Vb, is plotted against P.d( the gas
pressure times the distance, d, between the electrodes on log-log coordinates)
(Grube and Stephen; Kossoswsky (ed), 1989). _71
Figure 18. Number of gas molecules versus probability ofionisation (Dressier;
Sudorshan (ed), 1989). 73
Figure 19. Plasma nitriding unit. 76
Figure 20. Relative glow distribution at (a) low pressure, and (b) increased pressure,
for typical plasma nitriding gases (Kovacs andRusselll, 1987). 77
xm

Figure 21. Surface reactions occurring during plasma nitriding (Edenhofer, 1974,
part 1). 82
Figure 22. Processes occurring in a typical collision cascade (Solnick-Legg andLegg;
Sudarshan (ed), 1989). 88
Figure 23. Optical micrograph of as received (hot-rolled and air cooled) MAXIMA™
microalloyed steel, showing proeutectoidferrite plus some bainitic products.
Etched in 2.5% Nital. 98
Figure 24. Optical micrograph ofEnl9 steel, showing some undissolved carbide in a
matrix of tempered martensite. Etched in 2.5% nital. 98
Figure 25. 5 kW DC plasma nitriding unit designed and commissioned at the Surface
Engineering Research Centre at the University of Wollongong. 102
Figure 26. Schematic of the DC plasma nitriding apparatus. 103
Figure 27. Schematic drawing of the table and samples used in the DC plasma
nitriding unit. 103
Figure 28. Schematic of the PI$ and RF plasma nitriding apparatus. Note that in PP
the sample is connected to the high voltage circuit while in RF plasma nitriding the
sample is placed on a resistively heated stage. 106
Figure 29. SEM micrograph obtained from the surface of MAXIMA™ plasma nitrided
for 5h at 450 °C in 75%Nr25% H2 atmosphere. 111
Figure 30. The NanoScope® Atomic Force Microscope (AFM), from Digital
Instruments, at the University of Wollongong. 112
Figure 31. Optical micrographs of cross-sections of MAXIMA™ ((a), (c)) and En 19
((b), (d)) specimens plasma nitrided for 5 hat nominal 550 °C using a 40 kW
xiv

commercial scale unit. Samples were etched in 2.5% nital ((a), (b)), and 2.5%
nitalfollowedby Oberhoffer's, reagent ((c), (d)). 775
Figure 32. SEM micrograph showing the compound layer formed on the surface of
MAXIMA™ plasma nitrided for 5h at 450 V in atmospheres containing (a) 100%
N2, (b) 75%Nr25% H2, (c) 50%N2-50% H2, and (d) 25%N2-75% H2. The samples
were etched in 2.5% nital followed by Oberhoffer's reagent. 777
Figure 33. The effect of hydrogen concentration of the treatment atmosphere on the
compound layer thickness formed on the surface of the treated MAXIMA™
samples. 118
Figure 34. X- ray diffraction patterns of the MAXIMA™1 samples DC plasma nitrided
at 450 °Cfor 5hrs at various N2+H2 gas mixtures. 779
Figure 35. GDOES depth profiles for MAXIMA™ steel DC plasma nitrided at 450 °C
in (a) 100% N2, (b) 75% N2 - 25% H2, (c) 50% N2 - 50% H2, and (d) 25% N2 -
75% H2. 727
Figure 36. Surface hardness at different loads for samples DC plasma nitrided at
450 °Cfor 5 hours in atmospheres with different hydrogen concentrations. 122
Figure 37. The effect of hydrogen concentration in the treatment atmosphere on the
hardness profile of the samples DC plasma nitrided at 450 °Cfor 5 hours. 122
Figure 38. The effect of hydrogen concentration in the nitriding atmosphere on the
surface roughness of MAXIMA™ samples expressed as Ra. 124
Figure 39. AFM image of plasma nitrided surfaces treated at 450 °Cfor 5 hours at
atmospheres containing different H2-N2 gas mixtures, (a) 100%N2, (b) 75%Nr
25%H2. 125
xv

Figure 40. AFM image of plasma nitrided surfaces treated at 450 °Cfor 5 hours at
atmospheres containing different HrN2 gas mixtures, (a) 50%N2-50%H2 and (b)
25%N2-75%H2. 726
Figure 41. Optical micrographs of cross-sections of MAXIMA™ ((a), (c)) andEnl9
((b), (d)) specimens plasma nitrided in 75%N2 - 25%H2for 5 hat 450 °C and
etched in 2.5% nital ((a), (b)), and 2.5% nital followed by Oberhoffer's reagent
((c), (d)). __129
Figure 42. SEM micrographs of cross-sections of (a) MAXIMA™1 and (b) En 19
specimens plasma nitrided in 75%N2 - 25%H2for 5 hours at 350 °C and etched in
2.5% nital followed by Oberhoffer's reagent. 130
Figure 43. SEM micrographs of cross-sections of (a) MAXIMA™ and (b) Enl9
specimens plasma nitrided in 75%N2 - 25%H2 for 5 hours at 450 °C and etched in
2.5% nital followed by Oberhoffer's reagent. 737
Figure 44. SEM micrographs of cross-sections of (a) MAXIMA™ and (b) En 19
specimens plasma nitrided in 75%N2 - 25%H2 for 5 hours at 550 °C and etched in
2.5% nital followed by Oberhoffer's reagent. 132
Figure 45. Comparison of the thickness of the compound layers formed on the
surfaces of both steel DC plasma nitrided under similar conditions. 133
Figure 46. Typical microstructures obtained from the transverse cross-section of
MAXIMA™ steel (a) PI3 and (b) RF plasma nitrided in 75%N2 - 25%H2 at 350 °C
for 5 hours. Marbles etchant. 134
Figure 47. SEM micrographs of cross-sections of MAXIMA™ steel PI3 treated in
75%N2 - 25%H2for 5 hours at (a) 350, (b) 450, and (c) 550 °C. The samples were
etched in 2.5% nital followed by Oberhoffer's reagent. 135
xvi

Figure 48. SEM micrographs of cross-sections of MAXIMA™ steel RF plasma
nitrided in 75%N2 - 25%H2for 5 hours at (a) 350, (b) 450, and (c) 550 °C. The
samples were etched in 2.5% nital followed by Oberhoffer's reagent. 136
Figure 49. X-ray diffraction patterns of the MAXIMA™ and En 19 samples in the as
polished condition. 137
Figure 50. X-ray diffraction patterns of the MAXIMA™1 samples DC plasma nitrided
in 75%N2 - 25%H2 for 5 hours at various temperatures indicated. 138
Figure 51. X-ray diffraction patterns of the En 19 samples DC plasma nitrided in
75%N2 - 25%H2 for 5 hours at various temperatures indicated. 139
Figure 52. Glancing angle X-ray diffraction pattern of (a) PI3, (b) RF plasma nitrided
samples treated at 350 °C. Co Ka radiation, 1 ° incident angle and 10 sec/step of
0.1 °. 747
Figure 53. GDOES depth profile for MAXIMA™ steel DC plasma nitrided at (a) 350,
(b) 450, and(c) 550°C. 143
Figure 54. GDOES depth profile for En 19 steel DC plasma nitrided at (a) 350, (b)
450, and (c) 550°C. 144
Figure 55. Nitrogen and carbon line profiles obtained by GDOES of the PI3 treated
samples at (a) 350, (b) 450, and (c) 550 °C 145
Figure 56. Nitrogen and carbon line profiles obtained by GDOES of the RF plasma
nitrided samples at (a) 350, (b) 450, and (c) 550 °C 146
Figure 57. Hardness profiles of MAXIMA™ steel DC plasma nitrided at different
temperatures. 148
xvn

Figure 58. Hardness profiles of En 19 steel DC plasma nitrided at different
temperatures. 148
Figure 59. Case depth of the samples DC plasma nitrided at different temperatures for
5 hours. 149
Figure 60. The peak hardness and the core hardness of the samples after DC plasma
nitriding at different temperatures. Note the hardness of the samples before
treatment. 150
Figure 61. Surface hardness at different loads for (a) PI3 and (b) RF plasma nitrided
samples. 757
Figure 62. Hardness profiles of (a) PI3 and (b) RF plasma nitrided samples at
different temperatures for 5 hours. 152
Figure 63. The peak surface hardness developed on the samples treated at
temperatures ranging from 350 to 550C°by the PI3 and RF plasma nitriding
processes. 153
Figure 64. Surface appearance of MAXIMA™ sample DC plasma nitrided at 550 V.
Note the dark ring parallel to the edge of the sample. 154
Figure 65. Comparison of the surface roughness of both steels DC plasma nitrided
under identical conditions for 5 hours at different temperatures. 156
Figure 66. AFM images from the surface of (a) MAXIMA™ and (b) Enl9 samples DC
plasma nitrided at 350 °C. __158
Figure 67. AFM images from the surface of (a) MAXIMA™ and (b) En 19 samples DC
plasma nitrided at 450 °C. . 159
xvni

Figure 68. AFM images from the surface of (a) MAXIMA™ and (b) Enl9 samples DC
plasma nitrided at 550 °C. j ̂Q
Figure 69. AFM images from the surface of (a) MAXIMA™ and (b) En 19 samples DC
plasma nitrided at 550 °C at higher horizontal magnification. Note the nodular
morphology of the deposited iron nitrides resembling the morphology of the CVD
coatings. 767
Figure 70. SEM of the surface of MAXIMA™ sample DC plasma nitrided at 550 T at
two magnifications. 762
Figure 71. SEM of the surface of En 19 sample DC plasma nitrided at 550 X: at two
magnifications. 763
Figure 72. Surface roughness (Ra) for MAXIMA™ steel treated by PI3 and RF plasma
nitriding processes. 165
Figure 73. Optical micrographs obtained from the surface of the MAXIMA™ samples
treated by the PI3 process at (a) 350 °Ct (b) 450 °C and (c) 550 °C 166
Figure 74. Optical micrographs obtained from the surface of the MAXIMA™1 samples
RF plasma nitrided at (a) 350 °C, (b) 450 °C and (c) 550 °C. 167
Figure 75. AFM images from the surface of the (a) PI3 and (b) RF plasma nitrided
samples at 350 °C. 168
Figure 76. AFM images from the surface of the (a) PI3 and (b) RF plasma nitrided
samples at 450 °C 169
Figure 77. AFM images from the surface of the (a) PI3 and (b) RF plasma nitrided
samples at 550 °C. 170
xix

Figure 78. The changes in the applied voltage and current with changes in the
hydrogen concentration of the treatment atmosphere. All the treatments were
carried out at 450X1for 5 hours. 77^
Figure 79. The voltage and current applied at different treatment temperatures for DC
plasma nitriding. 757
Figure 80. Hardness profiles of the MAXIMA™ samples treated with different
processes at (a) 350, (b) 450 and (c) 550 °C for 5 hours. 790
Figure 81. Comparison of the surface roughness, Ra, values obtained from the
samples treated by different processes. 797
Figure 82. Thickness of the compound layer formed on the surface of the DC plasma
nitrided samples. 797
Figure 83. X- ray diffraction patterns of the samples nitrided at 450 °C by (a) DC
plasma, (b) PI3, and (c) RF plasma. 792
Figure 84. Proposed models for nitrogen mass transfer in (a) DC plasma nitriding, (b)
RF plasma nitriding, and (c) plasma immersion ion implantation (PI3). 193
Figure 85. AFM images showing the surface topography of the samples treated by (a)
DC plasma nitriding, (b) PI3 and (c) RF plasma nitriding at 350 °C. 196
Figure 86. AFM images showing the surface topography of the samples treated by (a)
DC plasma nitriding, (b) PI3 and (c) RF plasma nitriding at 450 °C 797
Figure 87. AFM images showing the surface topography of the samples treated by (a)
DC plasma nitriding, (b) PI3 and (c) RF plasma nitriding at 550 °C. 198
xx

Figure 88. SEM micrographs of samples (a) DC plasma nitrided (b) PI3, and (c) RF
plasma nitrided at 350 °C. 799
Figure 89. SEM micrographs of samples (a) DC plasma nitrided (b) PI3, and (c) RF
plasma nitrided at 450 °C 200
Figure 90. SEM micrographs of samples (a) DC plasma nitrided (b) PI3, and (c) RF
plasma nitrided at 550 °C. 201
Figure 91. Schematic diagram of a Grimm lamp (Berneron et al, 1980). 275
Figure 92. Graphical derivation ofRa (a) profile with centre line, (b) lower portions of
the profile inverted and (c) Ra is the mean height of the profile. 220
Figure 93. Schematic of a generalised scanning probe microscope (Howland et al,
1993). 222
Figure 94. Beam deflection system for vertical motion detection. This system has the
sensitivity to detect vertical motion of 0.01 nm as the tip scans the sample surface
(Strausser and Heaton, 1994). _223
xxi

List of Tables
Table 1. Phases in the iron-nitrogen system; after Ruhl and Cohen (1969). 32
Table 2. Some nitride phases of the commonly occurring alloying elements in nitrided
steels (Goldschmidt, 1967). 42
Table 3. Chemical composition of MAXIMA™1 and En 19 steels obtained by spark
emission spectroscopy. 97
Table 4. Hardness (HV2o) of the materials prior to surface treatment. 99
Table 5. PI3 treatments parameters. 705
Table 6. Core hardness values obtained from the samples after DC plasma nitriding
treatments. 149
Table 7. Surface roughness Ra results after PI3 and RF plasma nitriding at different
temperatures for 5 hours in 75% N2 -25% H2 gas mixture. 165
Table 8. List of etching reagents and etching conditions (Mridha, 1982). 272
Table 9. The Watts bath compositions and it operational conditions
(Samuels, 1967). 214
xxn
1. CHAPTER ONE:
INTRODUCTION AND AIMS
1.1 Introduction
Modification of the surface or near surface region of engineering components such as
bearings, dies, gears, shafts, and other parts for the purposes of improving appearance or
performance is an important part of modern manufacturing practice. This is not
surprising, since the interaction of materials with often hostile environments begins at the
surface and it is from surface-initiated effects that most components fail. In many cases,
tribological properties (friction and/or wear) are the limiting factor in performance and
much more attention is n o w paid to understanding and optimising the tribological, as
well as other properties, of the surfaces of engineering components.
The discipline of "Surface Engineering" emerged almost 15 years ago and has been
greatly influenced and driven by the realisation that the surface is the most friable part of
any engineering component. Surface Engineering encompasses many areas in
engineering, physics, and materials science.
The fundamental principle of Surface Engineering was established when it was realised
that it is inherently inefficient to utilise an expensive material in bulk simply to obtain the
required surface properties. A more appropriate engineering solution is to use a cheaper,
3 0009 03254579 5

Chapter One Introduction and aims 24
more easily-formed, underlying material with adequate base properties and then to
enhance the surface properties, either by deposition of suitable coatings or surface
modification to provide an improved overall performance in service (Strafford et al,
1990). The engineering solution of forming essentially a composite material with
enhanced properties in a case supported by a cheaper core material is almost always less
expensive than the alternative, (where it is even possible), of using a bulk material with
the desired combination of properties.
Surface engineering processes which are currently used to produce a hard surface on
metal components fall into two broad categories. The first category includes those in
which the hardened surface is produced by a heat treatment, usually accompanied or
preceded by the diffusion of elements, such as carbon or nitrogen, into the surface. The
second category is of those in which a layer of hard material is formed or deposited on
the surface (Spalvins, 1987).
The introduction of nitrogen into metallic surfaces has been practised for a long time in
order to improve mechanical properties, such as hardness, wear and fatigue as well as the
corrosion resistance of industrial parts. To achieve this goal, several methods have been
developed using gaseous, salt-bath or plasma environments.
Plasma nitriding is now widely used to impart surface hardening to metals, particularly
steels, for a wide variety of applications. As the name implies, the process is carried out
in a plasma medium containing ionised/excited nitrogen, alone or in combination with
other gases, to react with the work surface. The process was independently patented by
Egan (1931) and Berghaus (1932, 1939) and following advances in the field of power
electronics, has been commercially available since the early 1970s. It is widely used in

Chapter One Introduction and aims 25
the machinery, car and oil industries and for measuring instruments, parts of aircraft
engines, diesel engines, turbines, cutting tools and dies.
Plasma immersion ion implantation (PI3), on the other hand, is a relatively new
innovation developed by the Australian Nuclear Science and Technology Organisation
(ANSTO). Details of the technique were first published in 1988 (Tendys et al, 1988)
and development of it has continued (Collins et al, 1991; Hutchings et al, 1992, Collins
et al, 1993). PI3 is a hybrid technique, combining plasma nitriding and nitrogen ion
implantation. In this technique the workpiece is immersed in an inductively coupled
radiofrequency (RF) nitrogen plasma and implanted by the application of a pulsed
negative bias of 45 kV.
In the PI3 technique, the sample is heated by the high voltage ion bombardment but an
RF plasma nitriding treatment without any ion implantation is also possible in which the
specimen is heated to the nitriding temperatures, using auxiliary heating through a
resistively heated stage.
By combining HV ion bombardment with low pressure RF plasma nitriding, PI3 offers
the possibility of lowering the treatment temperature. This is particularly interesting for
the treatment of steels such as some HSLA steels which soften at normal nitriding
temperatures.

Chapter One Introduction and aims 26
1.2 Aims of the Project
In the plasma nitriding process, the part to be nitrided is usually in the quenched and
tempered (Q&T) condition in order to obtain the desired physical properties of the core,
to ensure proper grain refinement, and to have a stable microstructure at the plasma
nitriding temperature.
Microalloyed or high strength low alloy (HSLA) steels are carbon-manganese steels
containing small amounts of Nb, V or Ti. The excellent mechanical properties of these
alloys, particularly high yield strength, usually obviate the need for expensive quench and
tempering operations. Microalloying principles have been applied to some higher alloy
steels for use in the quench and tempered condition, but such steels also have the
potential for direct use after hot forming which is the processing route used for
microalloyed low carbon structural steels. Furthermore, the presence of a significant
amount of nitride forming elements in these higher alloy steels has generated interest in
their applicability as a new generation of nitriding steels. Thus, substituting a traditional
nitriding steel with a microalloyed steel would allow elimination of an expensive quench
and tempering operation and simplify the manufacturing steps, leading to a significant
cost reduction and time saving.
One of the objectives of this project was to study the response to plasma nitriding of a
commercially available hot rolled chromium-bearing microalloyed steel, "MAXIMA™",
and the possibility of using it as an alternative to conventional nitriding steels. Since
En 19 (AISI4140) steel is the most widely used nitriding alloy in industry and much work
has been carried out on its nitriding behaviour (Bell et al, 1975; Jones et al, 1975;

Chapter One Introduction and aims 27
Edenhofer, 1980; Robino and Inal, 1983), it was selected as a reference for comparison
with MAXIMA™.
Over the past 35 years a number of theories have been proposed to model what occurs at
the plasma-surface interface and in the bulk material during plasma nitriding. However,
it is difficult to develop a unique picture of the mechanisms involved due to the
complexity of the process and since the experimental results obtained under different
process conditions employed different materials. Consequently, there is no universally
accepted model which conclusively explains the mass transfer of nitrogen to the
workpiece surface and the layer formation mechanisms. Therefore, the other objective of
this project was to make a laboratory scale investigation to compare the effects of
different modes of plasma generation on the formation of nitrided surface layers by
studying the compound layer and diffusion zones formed on MAXIMA™ steel during
DC plasma nitriding, RF plasma nitriding, and plasma immersion ion implantation, PI3.
Furthermore, in an effort to separate the influence of high voltage implantation and
thermochemical treatment, a comparison was made between the RF plasma nitriding
process and PI3.
Throughout this work, unlike the traditionally employed pure nitrogen atmosphere in PI3
treatments, a 75%N2-25%H2 atmosphere has been used. This was done for two main
reasons; to compare the PI3 treatment with the DC and RF plasma nitriding processes
which were also carried out in atmospheres with the same N2-H2 percentages, and to
study PI3 in the atmospheres with lower N2 concentrations.
In Chapter Two, some fundamental principles of glow discharges and plasmas, plasma
nitriding processes and nitrides in steels are reviewed. Particular emphasis has been

Chapter One Introduction and aims 28
placed on plasma nitriding and the physics of plasmas, interaction of plasmas with
surfaces and proposed models of plasma nitriding. Experimental procedure, the details
of different plasma processing apparatus and characterisation techniques are presented in
Chapter Three. Experimental results and discussion are given in Chapter Four and
Chapter Five, respectively. Chapter Six contains the conclusions obtained from this
work.

2. CHAPTER TWO:
LITERATURE SURVEY
The nitriding process has been known since the beginning of this century, when Braune
in 1905 found that heating steel to 800°C in a flowing stream of ammonia could change
its mechanical properties and microstructure (Shoemaker, 1975). Chizhevskii in 1907-
1914 carried out the first systematic investigations of nitriding and of the reaction of
nitrogen with iron, steel and other metals. H e also studied the properties of many
nitrides, determined the optimum temperature for the reactions between nitrogen and
iron in ammonia and laid down the principles of the Fe-N phase diagram (Karpenko, et
al, 1979). Since then, variants of the nitriding process have continuously been developed
and it can n o w be applied to a much larger number of steels than was originally thought
possible. Nitriding can in practice be performed in powder, liquid, gas or plasma transfer
media. However, the emphasis of this literature review is placed on plasma nitriding.
2.1 Iron-Nitrogen Phase Diagram
Figure 1 shows an iron-nitrogen phase diagram constructed by Kubaschewski (1982).
The maximum solubility of nitrogen in a (Fe) in equilibrium with y'-Fe4N is 0.1 wt.%
(0.4 at.%) at 590 °C, the eutectoid temperature. The lattice parameter is practically
identical to that of a-Fe. The solubility at room temperature is only IO"4 wt.%,
therefore on quench aging either pure nitrogen-ferrite or any ferritic alloy nitrided under

Chapter T w o Literature Survey 30
the usual commercial conditions, f might be expected to precipitate (Jack, 1975). The Y
phase is isomorphous with the y-austenite phase in the Fe-C system and has a fee
structure (Kubaschewski, 1982). When the nitrogen content exceeds 0.1 wt.% (0.4 at.
%), Y-nitride with the chemical formula Fe4N is formed.
Nitrogen (wt.%) 1 2 3 4 6 8 10 12
Figure 1. Iron-Nitrogen phase diagram (Kubaschewski, 1982).

Chapter T w o Literature Survey 31
If the nitrogen concentration exceeds about 6 wt.% (26.4 at.%), the y'-nitride starts to
change into e-nitride, the chemical formula of which is Fe2N. Below 500 °C ^-nitride
begins to form. The nitrogen content of this phase is about 11 wt.% (49 at.%) and its
chemical formula is Fe2N. In the £-Fe2N structure the Fe atoms retain the same relative
position as in e-Fe2N, however, because of a rearrangement of the nitrogen atoms, which
in C, are more closely packed in one direction, the iron-atom lattice is anisotropically
distorted, (Jack 1952).
2.2 Nitrides of Iron
Table 1 lists the phases of the iron-nitrogen system. All the nitrides displayed in this
table are metastable with respect to one atmosphere of molecular nitrogen. However,
they are usually found during the nitriding of steels or during the aging of nitrogen-ferrite
(Jack and Jack, 1973). Molecular nitrogen is the phase in equilibrium with solid
solutions of nitrogen in iron. Nevertheless there is a great deviation from thermodynamic
equilibrium and the phases produced are highly metastable with respect to nitrogen. For
example, the maximum solubility of nitrogen in austenite is 0.26 wt% in equilibrium with
one atmosphere nitrogen gas, but is 2.8 wt% with respect to y'-Fe4N, for which the
corresponding equilibrium pressure of gaseous nitrogen is IO4 atm (Jack and Jack, 1973).
There are two types of interstices in the metal-atom arrangements of iron, surrounded
respectively by a tetrahedron of four metal atoms and by an octahedron of six metal
atoms. Carbon and nitrogen always occupy the octahedral holes in fee y-austenite and
bec a-ferrite and never the tetrahedral ones. The octahedron in the bec structure is

Chapter T w o Literature Survey 32
distorted compared with the regular octahedron of metal atoms in the fee and cph
structures, Figure 2. The regular metal-atom environment is rebuilt by the insertion of
interstitial carbon or nitrogen but a large anisotropic strain in the surrounding matrix is
produced. Therefore the solubility of nitrogen in a-iron is very small, see Table 1. There
is an isotropic expansion as interstitial atoms fill the octahedral holes in fee iron. At equal
interstitial atom: metal-atom ratios, the unit-cell dimensions of Fe-C and Fe-N austenites
are approximately equal.
Table 1. Phases in the iron-nitrogen system; after Ruhl and Cohen (1969).
Phase Composition Wt.%N At.%N Interstitial Bravais Unit-cell atoms per 100 lattice dimensions, A iron atoms
Ferrite (a)
Austenite (y)
Martensite (a')
a"
Y*
e
.
Fe
Fe
Fe
Fei6N2
Fe4N
Fe2Nfl_x)
Fe2N
0.10
2.8
2.6
3.0
5.9
4.5-11.0
11.14
0.40
11
10
11.1
20
18-32
33.3
12.4
11.1
12.5
25
22-49.3
50
bec
fee
bet
bc tertag.
cubic
hex.
ortho.
a, 2.8664
a, 3.572+0.0078
(at % N )
a, 2.8664-0.0018
(at ratio % N )
c/a, 1.000+0.0091 (at ratio % N )
a, 5.72
c/a, 1.10
a, 3.795
a, 2.764*(at 35 at.%N)
c/a, 1.599
a, 5.530
b, 4.480
c, 4.425
* Unit cell for cph metal atom arrangement at composition limit Fe2N.

Chapter T w o Literature Survey 33
l^-p*
m^ IF
.J
*S
V t —
^
4 B.C.C. F.C.C. C.RH. CPH. (plan)
0 Metal atoms at 0,0,0
O Metal atoms at i.±A
A Otahedral interstices at 1 •*"• •"-• 1 S. 2 3.3.4. 3.3-4
Figure 2. Octahedral of metal atoms in the three closed-packed metal arrangements
(Jack and Jack, 1973).
2.3 Structure of Nitrides
2.3.1 y'-Fe4N
G a m m a prime nitride exists over a narrow range of composition corresponding
approximately to the stoichiometric composition Fe+N and is stable only below 680°C,
Figure 1. Perfect stoichiometry gives a nitrogen content of 5.9 wt.%. The metal-atom
arrangement is fee like that of nitrogen austenite, Figure 3. However, unlike austenite,
the nitrogen atoms are not situated at random, but occupy one-quarter of the number of
octahedral interstices in a completely ordered manner (Jack, 1948). This is to minimise
the strain energy and the mutual repulsion between neighbouring nitrogen atoms.

Chapter T w o Literature Survey 34
f- Nitrogen austenite 7"-Fe4N
Tohffo;
[ J Iron atoms X Unoccupied interstices
Q Octahedral interstices. £ Nitrogen atom 1 in 10 randomly filled
Figure 3. The structure of nitrogen austenite and /-Fe4N (Jack, 1948).
Gamma prime - Fe4N is the only iron-nitride which occurs by decomposition of nitrogen-
austenite above the martensite start temperature Ms. Although y'-Fe4N is metastable
with respect to nitrogen gas, it persist for prolonged periods at temperatures below
650°C. The decomposition of y'-Fe+NT to form molecular nitrogen is inhibited by the
sluggishness of the surface reaction: 2N <=> N2. The phase has a Curie temperature of
490°C (Jack and Jack, 1973).
2.3.2 e - Fe2N(1.x)
The epsilon phase exists over a wide range of compositions. The lower limit of nitrogen
concentration varies greatly with temperature, whilst at the upper limit, the nitrogen
content is just insufficient to form the stoichiometric composition Fe2N. The empirical
formula of the phase is Fe2-3N however Fe2N(i-x) gives a more accurate description of

Chapter T w o Literature Survey 35
the phase. The metal atom arrangement in the phase is closed-packed hexagonal and the
unit cell contains six Fe atoms. The octahedral interstices within the structure are
arranged in layers perpendicular to the c-axis with an inter-planer distance of C/2 and
with two-dimensional close packing in each layer, see Figure 4.
For descriptive purposes the two planes of interstices within the unit cell can be labelled
A and B. One third of the interstices in each layer are occupied at the composition Fe3N
so that each nitrogen atom has six vacant sites surrounding it and a vacant site above and
below it (Jack, 1952). The homogeneity range of epsilon phase extends almost to the
composition Fe2N in which the nitrogen atoms are arranged in such a manner that
alternate layers of octahedral interstices are one-third and two-thirds filled respectively,
Figure 5.
• Metal atoms • Occupied in layer at height \/L
X Octahedal 0 Occupied in layer interstices height 3 A
O Unoccupied in layers atheightslA.BA fore-FeaN Occupiedm layer at height 1A fore-Fe2N
Figure 4. The crystal structure ofepsilon nitride (Jack 1952).

Chapter T w o Literature Survey 36
(a) c-Fe2N; 7-Co2N *t>) $-Fe2N
Figure 5. The crystal structure ofepsilon andzeta iron nitrides (Jack and Jack, 1973).
The structure of epsilon nitride with compositions between Fe2N and Fe3N is based on
the Fe2N structure, whereby the nitrogen atoms have been removed from the B layer
interstices in a strictly ordered manner.
2.3.3 £ - Fe2N
Just before the ideal e-Fe2N composition is reached there is a phase change to C-iron
nitride. This new phase has a stoichiometric composition Fe2N. The iron atoms retain
their same relative positions and are still in an approximately hexagonal closed-packed
array. However, one-half of the octahedral interstices in each layer plane are occupied
such that each nitrogen atom again has unoccupied holes above and below it in adjacent
planes, Figure 5. The nitrogen atom arrangement symmetry is orthorhombic. In each
layer the nitrogen atoms are distributed in zig-zag chains parallel to the orthohexagonal b
axis (Jack and Jack, 1973). This new phase is highly metastable and decomposes at
temperatures above 450°C.

Chapter T w o Literature Survey 37
2.3.4 a" - Fe16N2
This phase has a fully ordered nitrogen-atom arrangement in a slightly distorted bec iron-
atom array, Figure 6. a"-Fei6N2 is merely ferrite with a nitrogen superlattice, thus it fits
perfectly with the ferrite matrix in the a-direction, but there is a misfit in the c-direction
(Jack, 1975). In formation of a" there is no considerable movement of iron atoms. The
precipitates grow coherently as very thin platelets in the ferrite merely by localised
clustering of nitrogen atoms followed by their ordering. It has been observed by Dahmen
and co-workers (1987) that a" plate is made up of different segments with slightly
different orientations.
As shown in Figure 7, a"-Fei6N2 phase can also be regarded as fee y'-Fe4N in which
alternate nitrogen atoms are missing and which fits with the a-matrix in a Bain
orientation relationship (Jack, 1975):
(001)a I I (001)Fe4N0.5; {110}a I I {100}Fe4N0.5
f J Iron atom ^ D Nitrogen atom
Figure 6. Crystal structure of a"-Fe16N2 (Jack, 1989).

Chapter T w o Literature Survey 38
Figure 7. Crystal structure ofa"-Fel6N2 as a defect of fee y' structure (Jack, 1975).
2.4 Nitriding
Nitriding is a thermochemical treatment in which nitrogen is diffused into the surface of
metals, usually steels. The process is carried out at a temperature below the eutectoid
temperature of Fe-N system usually within the range 490-530°C. At higher temperatures
there is a reduction in hardness due to precipitate coarsening and also tempering of the
core with a reduction in its strength as well as the possibility of distortion due to phase
transformation. At lower temperatures, rates of nitriding are impractically slow (because
the rate of dissociation of ammonia is low). During the process atomic or nascent
nitrogen is adsorbed from either a gaseous, liquid (salt), or plasma carrier and
subsequently diffused into the base metal with a layer of iron nitrides forming on the

Chapter T w o Literature Survey 39
surface of the component being treated. This layer is often referred to as 'white layer'
due to its optical metallographic appearance (Edenhofer, 1974, part 2) and it consists of
a mixture of a face centred cubic y'-Fe4N phase, and a close packed hexagonal e- Fe2N(i.
X) phase of higher nitrogen content (refer to Fe-N phase diagram, Figure 1). This layer is
of metallic appearance and is normally indistinguishable from the steel unless examined
microscopically (Child, 1980). From this layer, nitrogen diffuses into the underlying
steel. Most air-melted steels contain a small amount of nitrogen, generally less than
0.1wt%. The maximum solubility of nitrogen in pure iron at 590°C is only 0.1 wt%, see
Figure 1. As nitrogen diffuses into the steel the solubility limit is soon reached and, in
the presence of alloying elements, nitrides are formed and precipitated in a very dispersed
form.
Since diffusion of the alloying elements at these low temperatures is very limited, nitrides
are produced in the immediate locality of the alloy atoms and little growth occurs. The
hardness is increased partly by distortion of the ferrite lattice by the high-volume fraction
of alloy nitrides and partly by the inherent hardness of the nitrides. The expansion of the
surface layers due to precipitation of alloy nitrides results in the development of high
surface compressive stresses of up to 750 N/mm2 (Child, 1980).
The white layer, which can be up to 50 urn thick (Bell, et al, 1975), is thin but brittle and
often must be removed by grinding or by chemical treatment before use, both of which
are relatively expensive (Bell, 1973). The necessity to remove the white layer arises
primarily from the possibility of spalling in service. The thickness of the underlying case,
the diffusion zone, is usually 0.2 -0.7 mm and has a peak hardness of 900 -1100 FTV
(International Research & Development Co. Ltd., 1986), excellent abrasion resistance,
and gives rise to a marked improvement in fatigue performance. It usually contains a

Chapter T w o Literature Survey 40
fine dispersion of alloying-element nitrides. The enhancement of the fatigue resistance is
ascribed to macro- and microstresses provided by these nitrides in the diffusion zone.
The case is temper-resistant up to ~500°C. No phase transformation is involved to room
temperature, and quenching is not required to develop surface hardness, consequently,
there is less distortion than in carburising or carbonitriding, although some growth does
occur due to the increase in volume of the case. However, this growth is constant and
predictable for a given part and cycle, so that in most cases parts may be machined very
close to final dimensions before nitriding (Avner, 1974). Nevertheless, the surface
compressive stresses developed in the case on nitriding, which improve fatigue
resistance, can also lead to distortion in hollow thin-walled components. Consequently,
nitriding is best carried out on substantially rigid, preferably axi-symmetrical components
such as shafts, thick walled cylinders, gears and die blocks, crankshafts, valve stems,
injectors and many other engineering components.
The properties imparted to steel by nitriding can be summarised as follows (Thelning,
1975):
1. The high-hardness surface layer has high resistance to galling, seizing, and scuffing,
even when poorly lubricated.
2. Wear resistance is increased.
3. Because of the compressive residual stress, low notch sensitivity is achieved; notched
fatigue strength is much higher than that of unnitrided steels, and approaches the
value of that of unnotched steel.
4. Fatigue strength is increased mainly by development of surface compressive stresses.
5. Hot hardness and resistance to tempering are improved.
6. Corrosion resistance for non-stainless steels is moderately improved.

Chapter T w o Literature Survey 4]
7. High dimensional stability.
2.5 Kinetics of Nitriding
The nitrides of the common alloying elements in nitrided steels are listed in the Table 2.
The strength of the interaction between nitrogen and the alloying element is indicated by
the heat of formation. The crystal structure of the nitride gives an indication of the ease
of nucleation of nitride precipitates in a ferrite matrix. Formation of fee phases with
a~4.05 A on the cube planes of ferrite is possible with a Bain orientation as coherent or
semi-coherent plates. Except for A1N, which is known to nucleate heterogeneously on
dislocations, such precipitates, or in some cases metastable zones, can nucleate
homogeneously (Lightfoot and Jack, 1975). The strength of the interaction between the
alloying element and nitrogen as well as the ease of nucleation of the nitride phase dictate
the form of the hardness profile developed during nitriding of alloyed iron.
When there is a strong interaction between nitrogen and substitutional solute atoms,
nitriding proceeds by the formation of a uniformly hard subscale, which advances
progressively into the core. The microstructure is characterised by a relatively sharp
case/core boundary, see Figure 8. All the alloying element (M) in the nitrided case has
precipitated and nitrogen is substantially absent in the core. Nitrogen diffusion in ferrite
predominantly controls the nitriding kinetics.

Chapter T w o Literature Survey 42
Table 2. Some nitride phases of the commonly occurring alloying elements in nitrided
steels (Goldschmidt, 1967).
Phase Bravais lattice Unit-cell dimensions, A Heat of formation, kcal/mol nitride
TiN
A1N
VN
CrN
Mo2N
W2N
fee
hex.O.
fee
fee
fee
fee
a, 4.244
a, 3.110
c, 4.975
a, 4.139
a, 4.149
a, 4.169
a, 4.126
-80
-72
-52
-30
-19.5
-17
1000
>
X
0
\
tl t.2
Fc-2Ti 580°C . 8%NH3
R2-5Cr 500°C 18%NH3
(a)
DEPTH
•7 0 r-<
cr i — z UJ u z 0 u
[TiN] j .
-^JN] | 7T!7r7rrr»-i.
cn]
Ks = 0
L (b)
DEPTH
Ks = [wt-%Ti] [zvt-°'0N]for homogeneous precipitation is assumed to be zero
Figure 8. (a) Microhardness profiles of a "strong" interaction: (b) schematic drawing
of the TiN, Ti, and N concentrations for a given nitriding time (Lightfoot and Jack,
1975).

Chapter T w o Literature Survey 43
The plate-like nitrides formed have a fee sublattice of M atoms and the interface between
the broad faces of the platelets and the matrix is coherent. This has been observed with
Fe-Ti alloys, with Fe-5.6wt.%Cr, and with Fe-V (Jack, 1975). A model for the reaction
has been derived from theories of diffusion accompanied by a phase change which have
been applied to internal oxidation (Lightfoot and Jack, 1975). This model assumes that:
1. Diffusion of the substitutional alloying element can be neglected.
2. Before moving of the nitriding front, all the alloying element at the interface between
nitrided and non-nitrided regions is reacted.
3. For homogeneous precipitation of the alloy nitride, the solubility product,
Ks= (nitrogen concentration) x (alloy element concentration), is negligibly small.
4. The surface nitrogen concentration is constant.
The analysis predicts that, in the absence of iron nitride formation, the subscale thickness
(£) varies with time (t) according to:
[N] is the atomic concentration of nitrogen in solution at the metal surface, [M] is the
original alloy element atomic concentration, r is the atomic ratio of nitrogen to alloy
element, N/M, in the phase formed by nitriding, and D is the diffusivity of nitrogen.
The square of the case depth is inversely proportional to alloy concentration and is
directly proportional to the surface nitrogen concentration, the bulk diffusivity of
nitrogen in ferrite, and time of nitriding. In this case, the precipitation reaction is so
rapid that the nitriding reaction is controlled by bulk diffusion of nitrogen from the
surface to the reaction front.

Chapter T w o Literature Survey 44
If the interaction between the alloying element and nitrogen is less strong, nucleation of
stable precipitates will not occur until a relatively large supersaturation of nitrogen is
achieved. In thin sections, the rate of hardening will be controlled by the rate of reaction
to form the nitride phase. After nitriding, the interface between the nitrided case and the
core is more diffuse and the microstructure is characterised by a very faint (or no)
case/core boundary in conjunction with a virtually constant nitrogen concentration.
Figure 9 schematically shows the development of nitrided hardness for a "weak"
interaction or difficult nucleation. Diffusion of alloying elements in the ferrite
predominantly controls the nitriding kinetics. The nucleation is difficult and the
nitride/matrix interface is incoherent because of the large crystallographic difference
between the nitrides (usually hexagonal) and the ferrite lattice. The presence of
dislocations facilitates heterogeneous precipitation of this kind of nitride. In addition,
nitriding kinetics on prolonged nitriding is accelerated due to the production of
dislocations for accommodation of the volume misfit between matrix and nitride particles
during precipitation of nitrides (Somers, 1989). The rate of homogeneous precipitation
is expected to be a sensitive function of supersaturation.
This indicates that the nitriding response of alloys with relatively unstable nitrides is
determined by the rate of precipitation. The supply of nitrogen to the interior of the
specimen in thicker sections will also exercise control. Iron-chromium alloys can show
nitriding response characteristic of "strong" or "weak" interactions, depending on the
chromium concentration. The case/core interface is less abrupt than that for a typical
"strong" interaction. Figure 10 illustrates an intermediate type of behaviour.
Since the critical solubility product for the nucleation of homogeneous precipitation for
CrN is higher than that for TiN but not so high as that for the nitride phase in Fe-Mo

Chapter T w o Literature Survey 45
alloys, such intermediate behaviour is seen in iron-chromium alloys. Meijring (1971) has
shown that the diffuseness of the interface, Ax/cj, is proportional to solubility product,
Ks/[%N][%Cr], Figure 9-b. Since, Ks will increase by increasing the nitriding
temperature so will the diffuseness of the interface. The case/core boundary becomes
more abrupt by increasing the surface nitrogen concentration and increasing alloy
content.
CO LO UJ
z n cr < X
R2-5MO oc (a) Fc-1-2Cr ° / D ^
.__ t3
\ ^̂^̂^̂^̂^
^~" ^ - — —
\ ^
^ ^ ^ _ !
z O h-< cr i—
z UJ u z O u
(b)
[Fc Mo N] ~~ -~ ——^_
~-—^ """"̂ ..-•'
..--"^ CMoJ...---"
>-" . - • •
DM]
DEPTH DEPTH
Figure 9. (a) Microhardness profiles of a "weak" interaction or difficult nucleation;
(b) schematic drawing of the concentrations of the nitride phase (in this case a
metastable zone), Mo and N (Lightfoot and Jack, 1975).

Chapter T w o Literature Survey 46
1000
o
cr h-Z W u z o u
A * a
CCrN]
CN] _.-•
Ks LNJCCr]
\ \ ; \ \ \ : \ -
y ..•• \
-*———•J^
(b)
TCrl
DEPTH DEPTH
•Ax-
at all points on the curves the product Ks = [vJt-%Cr] [zct-%N~\ is constant and non-zero
Figure 10. (a) Microhardness profiles for an "intermediate" interaction; (b) schematic
drawing of the concentrations of CrN, Cr, and N (Lightfoot and Jack, 1975).
2.6 Nitriding Steels
The presence of strong nitride forming elements in a steel is the main selection criterion
for the composition of a nitriding steel for which high surface hardness is required. It is
possible to investigate the tendency of the different alloying elements to form hard
nitrides or to increase the hardness of the steel by precipitation hardening mechanism, by
measuring the hardness of nitrided different alloy steels. Figure 11 shows the results
obtained by such investigations (Thelning, 1975).

Chapter T w o Literature Survey 47
Hardness HV 1200
IOOO
BOO
600
400
200
0 0 I 2 3 4 5 6'/.
Alloy content
Figure 11. Influence of alloying elements on hardness after nitriding. Base alloy
0.35% C, 0.30% Si, 0.70% Mn (Thelning, 1975).
The diagram illustrates how different alloying elements affect the surface hardness after
nitriding. Aluminium and titanium have the greatest effect on hardness, even at small
concentration (-1%) followed by chromium, molybdenum, and vanadium. The
hardening capacity of chromium increases as its concentration increases. In addition to
the contribution of molybdenum as a nitride former, it also decreases the possibility of
embrittlement at nitriding temperature (Knerr et al, 1991). The effect of other alloying
elements such as nickel, copper, silicon, and manganese on nitriding characteristics is not
considerable. Higher hardness values are obtainable in steels containing several alloying
elements, than if the alloying elements are used separately. Increasing the concentration,
especially of the strong nitride-formers, decreases the effective case depth, as shown in
M t
/y
Ti
~~Mo
Cr
Ni

Chapter T w o Literature Survey 48
especially of the strong nitride-formers, decreases the effective case depth, as shown in
Figure 12 (Thelning, 1975).
Strong nitride forming elements such as Al and Ti, which have a pronounced effect on
hardness, also delay the diffusion of nitrogen into the steel as their contents increase. At
roughly 1% Al content, an optimum value for hardness and depth of nitriding is obtained.
This amount of Al is normally used in Al-alloyed nitriding steels. Another element which
has a strong inhibiting effect on the diffusion of nitrogen is carbon (Thelning, 1975).
Aluminium containing steels (0.85 to 1.50% Al) yield the hardest nitrided case since
aluminium is the strongest nitride forming element. Nevertheless, the low ductility of the
nitrided case is a limitation that should be considered for the selection of these steels. On
the other hand, low alloy chromium-bearing steels produce a more ductile nitrided case
but with lower hardness (Knerr et al, 1991). Unalloyed carbon steels are not suitable for
nitriding because they form an extremely brittle case that spalls readily and also the
diffusion case is not significantly harder than the core.
Nitralloy series are the premier nitriding steels and contain approximately 1 wt % Al with
1.0 to 1.5 wt % Cr. Medium-carbon, chromium-containing low-alloy steels such as the
4100, 4300, 5100, 6100, 8600, 9300, and 9800 series form excellent diffusion cases.
Other suitable nitriding steels include hot-work die steels containing 5% chromium such
as HI 1, HI2, and HI3., low-carbon, chromium-containing low-alloy steels of the 3300,
8600, and 9300 series, air-hardening tool steels such as A-2, A-6, D-2, D-3, and S-7,
high-speed tool steels such as M-2 and M-4, ferritic and martensitic stainless steels of the
400 and 500 series, austenitic stainless steels of the 200 and 300 series, Nitronic stainless
steels such as 30, 40, 50 and 60, and precipitation-hardening stainless steels such as 13-8

Chapter T w o Literature Survey 49
PH, 15-5 PH, 17-4 PH, 17-7 PH, A-286, AM350, and A M 3 5 5 (Knerr et al, 1991).
Powder metallurgy (P/M) parts can also be nitrided but due to the characteristic porosity
of these parts, precleaning is more critical than with wrought alloys.
In cast iron or carbon steels, significant hardening in the diffusion zone cannot be
developed. Nevertheless, a compound zone which is often excellent for wear resistance
in lightly loaded parts, can be formed. These materials are not suitable for applications
involving high localised stresses because the compound zone is supported by a relatively
soft diffusion zone (Knerr et al, 1991).
Depth of nitriding mm
y
\ N
v \
A ^
Ti
\
\
\
\
V \
\
Cn
0 I 2 3 4 5 6 % Alloy content
Figure 12. Influence of alloying elements on depth of nitriding measured at 400 HV.
Nitriding for 8 hat 520 °C (Thelning, 1975).

Chapter T w o Literature Survey 50
2.7 HSLA Steels or Microalloyed Steels
To date, HSLA steels have mainly been used in pipe lines, heavy industrial machinery,
pressure vessels, ship building, and more recently for off shore platforms and in the
automotive industry. HSLA steels have characteristics and properties that result in
economies to the user when the steels are properly applied. They are considerably
stronger and in many instances tougher than structural carbon steel, yet have sufficient
ductility, formability, weldability and fatigue resistance to be fabricated successfully by
customary forming methods.
The earliest microalloyed steels were developed over 25 years ago, and the metallurgical
principles on which they are based are well-documented in many excellent technical
publications (Paules, 1991). The motivation for the application of HSLA steels is cost
reduction. High strength steels can bear service loads with thinner sections, providing
weight savings. Lower costs can be realised if a microalloyed steel replaces an alloy steel
containing significant amounts of expensive elements such as nickel, chromium and
molybdenum. However, the most significant cost reduction provided by microalloyed
steels is the elimination of expensive heat treatment steps. As-rolled microalloyed steels
exhibit properties comparable to normalised or quenched and tempered steels. The costs
associated with heat treatment, inventory, handling, energy, decarburisation and scale
(oxidation) loss are avoided with the microalloying approach.
Microalloying elements are added to steel for two purposes: to produce grain refinement
and/or precipitation strengthening. Both of these phenomena result from the
precipitation of small microalloy carbides (NbC, VC, TiC), nitrides (NbN, VN, TiN), or
complex carbonitrides [Nb(C,N), V(C,N), Ti(C,N)] (Paules, 1991). Microalloyed steels

Chapter T w o Literature Survey 5/
are usually furnished in the hot rolled condition. The most important method used to
increase the strength of the HSLA steels involves a refinement of the grain size. A major
factor in reducing the ferritic grain size is the addition of a small amount of a strong
carbide-forming element or elements to HSLA steels. The most important of these
elements is niobium, which can have a significant effect on the properties of the steel
even in amounts less than 0.05 percent. Because these grain-size controlling additions
are introduced in such small proportions, it is a common practice to call the steels
containing them "microalloyed", even though they may contain more conventional
alloying elements in relatively large concentrations.
The principal effect of these grain-size controlling elements is to markedly increase the
time required to recrystallise the austenite during hot rolling. The ability of these
microalloying elements to slow down recrystallisation is due to the fact that they tend to
precipitate as particles (carbides, nitrides, and carbonitrides) that can interact with the
austenite grain boundaries. These precipitate particles can restrict both the
recrystallisation and the grain growth of the austenite. There is a temperature, however,
above which each type of precipitate dissolves and the microalloying element goes back
into solution. Just above this solution temperature, the austenite grains become subject
to coarsening. Improvement in strength is also obtained by precipitation hardening.
The microalloying elements can also produce other precipitates in the ferrite. These are
finer than those that appear in the austenite and form largely as a result of interphase
precipitation at ferrite-austenite boundaries during the transformation of austenite to
ferrite. However, these hardening precipitates may also nucleate inside the ferrite grains.
This type of precipitation has to be the result of the lower solubility of the microalloying
elements in the ferrite than in the austenite. Adding alloying elements such as manganese

Chapter T w o Literature Survey 52
that increase the strength of the ferrite matrix by solid solution strengthening is another
method to increase the strength and other desirable properties of a HSLA steel (Hill and
Abbaschian, 1992). Strain aging and processing that increases the dislocation density of
the substructure of the steel are also strengthening mechanisms used with HSLA steels.
2.7.1 Brief Introduction to MAXIMA™ microalloyed steel
MAXIMA™ is a commercial high strength microalloyed steel which is designed so that
upon quenching it develops predominantly lath martensite to the exclusion of twinned
martensite, which has a high hardness but quite poor toughness and ductility. The
chemical composition of this steel is shown in Table 3, page 97. MAXIMA™ is also
designed to have markedly improved toughness due to the presence of a small but
significant amount of retained austenite, less than 5 Vol % (Bangaro et al, unpublished
paper).
The primary functions of microalloying in MAXIMA™ are:
1. To induce a very fine grained microstructure in the cast or wrought conditions.
2. To achieve very favourable mechanical properties.
Unlike many (HSLA) steels, microalloying in MAXIMA™ is not intended to provide any
appreciable precipitation strengthening. Titanium-niobium additions in conjunction with
appropriate levels of Al and N, develop and maintain austenite grain sizes less than about
50um. Controlled addition of Ti-Nb also enables relatively small grain sizes to be
produced in the weld HAZ.

Chapter T w o Literature Survey 53
Copper induces atmospheric/sour environment-corrosion resistance which decreases the
generation and absorption of H (atomic hydrogen) and reduces the susceptibility of
MAXIMA™ to hydrogen induced cracking in sour service and makes it more resistant to
weld cold cracking. Copper also enhances the stability of retained austenite and enables
the austenite to act as an effective sink for H, thus decreasing the stress corrosion
cracking susceptibility (Bangaro et al, unpublished paper).
It has also been claimed that the low Si content of MAXIMA™ along with the reduced
carbon level, eliminates the formation of undesirable twinned martensite in the weld
HAZ.
2.8 Nitriding of Microalloyed Steels
The attractive properties of microalloyed steels and the presence of nitride forming
elements such as chromium in some of these steels, have generated interest in the
applicability of these alloys as a new generation of nitriding steels. In recent years there
have been some efforts to study the nitriding behaviour of some of these steels. Mongis
et al (1984) carried out an investigation to assess the nitriding kinetics of microalloyed
steel grades S800, S1000, U1000, F1200 and Z1300 in the as-rolled condition in
comparison with the conventional steels 120M19 and 150M36 in the quenched and
tempered condition. They found that the nitriding kinetics of S800 and SI000
microalloyed steels were about 50% higher than those of 120M19 and 150M36
conventional steels. They ascribed the higher nitriding kinetics to greater hardening at
the base of the diffusion zone caused by the presence of niobium and vanadium. They

Chapter T w o Literature Survey 54
also proposed the substitution of low alloy nitriding steels with microalloyed steels in
order to simplify the processing procedure by eliminating quenching and tempering
operations.
In an effort to compare the properties obtained from plasma nitriding of two low carbon
thermochemically processed microalloyed steels and a quenched and tempered medium
carbon steel, Palmiere et al (1988) conducted several experiments. They also made a
comparison between the plasma nitrided properties of the two microalloyed steels and an
induction hardened medium carbon quenched and tempered steel. They found that the
increase in surface hardness obtained by plasma nitriding of both low carbon
microalloyed steels was better than that achieved for the medium carbon quenched and
tempered steel by either plasma nitriding or induction hardening. They also found that
after plasma nitriding, the microalloyed steels had superior fatigue resistance over the
heat treatable steel. The improved properties of one microalloyed steel were attributed
to the presence of (FeMo)2N and "ultra-fine" MoxN precipitates in the diffusion zone.
A series of experiments were conducted by Kuppusami and co-workers (1993) to
compare the plasma nitriding behaviour of type 316 stainless steel and a microalloyed
steel. They examined the effects of treatment temperature and ion current on the
maximum surface hardnesses obtainable for these steels. Cyclic plasma nitriding
developed a uniform surface morphology on the stainless steel while this process was
found not to be necessary for the microalloyed steel. Maximum surface hardness was
obtained at 575°C for the stainless steel and at 500°C for the microalloyed steel under
similar conditions of time and ion current.

Chapter T w o Literature Survey 35
Hanada and co-workers (1995) have studied the nitriding response of a newly developed
high strength low alloy bainitic steel in comparison with that of En40B steel. They found
that the peak hardness of the bainitic steel was maintained over a much greater nitriding
temperature range and that its wear and fatigue behaviour was acceptable.
2.9 Plasma Discharges
2.9.1 Introduction
Plasma is nature's "unnatural" fourth state of matter, an electronic jelly, or foam,
consisting of positively and negatively charged particles as well as neutral species. On
average a plasma is electrically neutral, because any charge imbalance would result in
electric fields that would tend to move the charges in such a way as to eliminate the
imbalance. As a result, the density of electrons plus the density of negative ions will be
equal to the density of positive charged ions. Some energy is required for forming and
sustaining a plasma. In steady state, the rate of ionisation must balance the losses of ions
and electrons from the plasma volume by recombination and diffusion or convection to
the boundary.
The plasmas which will be considered here are initiated and sustained by electric fields
which are produced by either direct current DC or alternating current AC power
supplies. A typical AC frequency of excitation is 13.56 MHz in the radio frequency RF
portion of the spectrum which will be discussed later. These plasmas are also referred to
as electric discharges, gaseous discharges, or glow discharges.
Chapter T w o Literature Survey 56
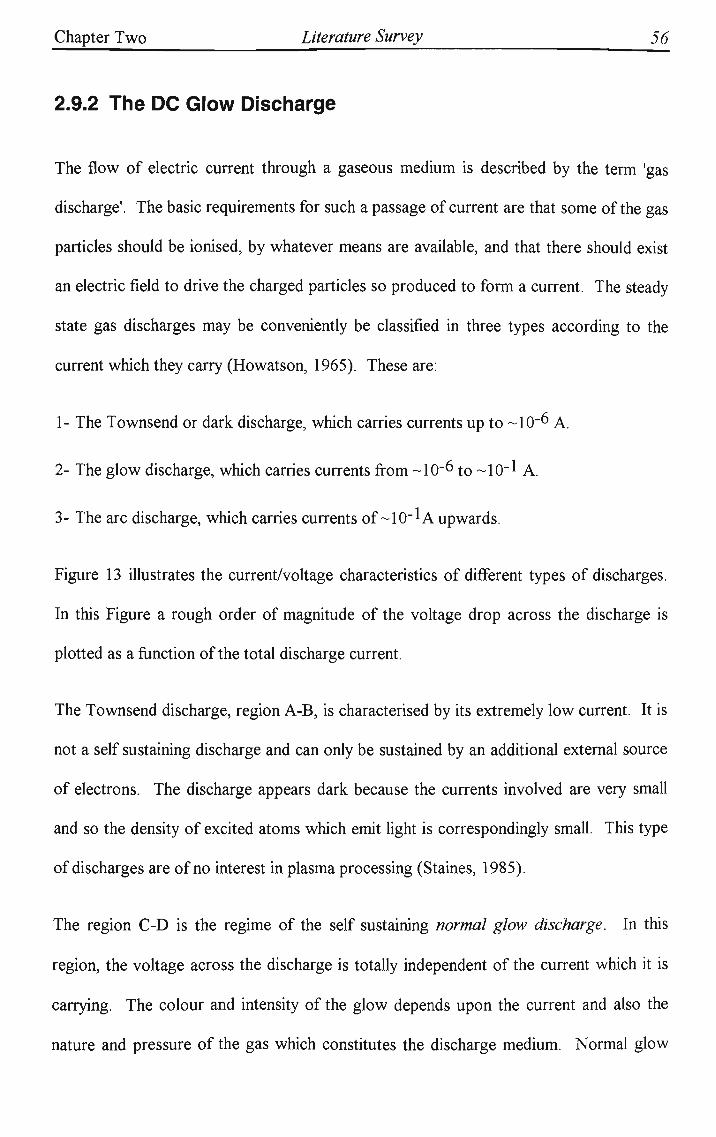
2.9.2 The DC Glow Discharge
The flow of electric current through a gaseous medium is described by the term 'gas
discharge'. The basic requirements for such a passage of current are that some of the gas
particles should be ionised, by whatever means are available, and that there should exist
an electric field to drive the charged particles so produced to form a current. The steady
state gas discharges may be conveniently be classified in three types according to the
current which they carry (Howatson, 1965). These are:
1- The Townsend or dark discharge, which carries currents up to ~10~6 A.
2- The glow discharge, which carries currents from ~10~6 to ~10~1 A.
3- The arc discharge, which carries currents of -10" 1A upwards.
Figure 13 illustrates the current/voltage characteristics of different types of discharges.
In this Figure a rough order of magnitude of the voltage drop across the discharge is
plotted as a function of the total discharge current.
The Townsend discharge, region A-B, is characterised by its extremely low current. It is
not a self sustaining discharge and can only be sustained by an additional external source
of electrons. The discharge appears dark because the currents involved are very small
and so the density of excited atoms which emit light is correspondingly small. This type
of discharges are of no interest in plasma processing (Staines, 1985).
The region C-D is the regime of the self sustaining normal glow discharge. In this
region, the voltage across the discharge is totally independent of the current which it is
carrying. The colour and intensity of the glow depends upon the current and also the
nature and pressure of the gas which constitutes the discharge medium. Normal glow

Chapter T w o Literature Survey 57
discharges are used in industry for lamps, florescent tubes, etc., and can be maintained
with relatively low energies and weak currents (Edenhofer, 1974, part 1).
1000
3E XL
ss 500 -
Abnormal Glow Discharge
Townsend discharge
Normal Glow Discharge
10-12 10-4
Current (Amps)
10-1
Figure 13. Current/voltage characteristic for a DC discharge.
Arc Discharge
10
The main reason that the normal glow is not used in plasma surface treatments is that the
surface coverage of the component is not complete. However, as the current increases
the surface coverage is increased and the current reaches a critical value where there is a
sudden transition, complete surface coverage occurs and the voltage is more sensitive to
changes in the applied current, region D-E. This region is called the abnormal glow
discharge and the plasma behaves as an ohmic load, i.e. increasing the voltage increases
the current. Most plasma processes are carried out using the high current and power
densities that occur in the region of the abnormal and unstable glow discharge. The
cathode glow is due to excitation of gas atoms by the positive ions which possess greater
Chapter T w o Literature Survey 58
velocities in the abnormal discharge. The abnormal discharge hence operates using
ionisation by positive ions as well as by secondary electrons.
When operating an abnormal discharge, heating of the cathode occurs as the colliding
particles give up their energy to the metallic surface. The amount of heating is
proportional to the current density. If the current density is increased beyond a critical
maximum value, point E, the voltage across the electrodes drops rapidly away to several
tens of volts and it would quickly result in a concentration of the discharge at that
particular point and formation of an arc discharge (Edenhofer, 1974, part 1). Severe
damage to both components and equipment can be expected if such a condition is
maintained. Therefore, plasma heat treatment units incorporate advanced circuit breaker
systems which are capable of interrupting and extinguishing any arc discharges which
may occur.
Figure 14 illustrates schematically the various regions between the cathode and the anode
of a glow discharge and the accompanying changes in voltage, field strength, and net
space charge across it. Pressure, voltage, current and type of gas, dictate the slopes and
inflection points of the curve. Each region is characterised by its relative luminosity
which gives an indication of the collision and reaction processes occurring within it
The electrons required for maintaining the discharge are produced at the cathode by
secondary electron emission resulting mainly from positive-ion bombardment and are
then accelerated towards the anode. During their journey these electrons are subjected
to collisions with gas atoms and molecules within the discharge space, ionising gas
molecules, and forming fall of positive charge towards the cathode. The electric field
magnitude and the density of the gas are such that a self sustaining state is effected. The

Chapter T w o Literature Survey 59
electron-gas collisions and the secondary electron emission processes produce sufficient
electrons to maintain a stable discharge. Starting at the cathode, there is a very thin dark
area known as the Aston dark space. It lies directly in front of the cathode surface, and
represents a region in which the electrons have not yet moved sufficiently far in the
cathode electric field to acquire threshold excitation energies. As one moves away from
the cathode, a layer of neutral atom radiations called the cathode glow appears. The
luminosity in this region is produced by the recombination of incoming positive ions with
slow electrons, for which the recombination coefficient is high (Howatson, 1965). Next
outward is a region of far less luminosity called the Crookes or Hittorf s or cathode dark
space. In this region, gas atoms and molecules are ionised by electrons which have
passed through the cathode glow without interaction. The region appears dark since the
electrons liberated by these collisions do not have sufficient energy themselves to excite
the gas molecules around them.
The three regions, Aston dark space, cathode glow and cathode dark space, make up the
cathode fall. Near to the cathode surface, the electrons before gaining appreciable
velocity, form a negative space charge. But the space charge becomes positive a short
distance from the cathode and remains positive throughout the cathode dark space
producing a large voltage gradient.

Chapter T w o Literature Survey 60
Cathode Faraday dark space dark space Anode glow
Aston dark space \ \ Positive column
Cathode glow Negative glow Anode dark space
Figure 14. various regions between the cathode an the anode of a glow discharge and
the accompanying changes in voltage, field strength, and net space charge across it
(Howatson, 1965).
Therefore, most of the voltage is taken up in this region and the electrons are accelerated
sufficiently to produce intense ionisation and hence multiplication. The electrons carry
nearly all the current by the end of the cathode dark space. The large number of
electrons emitted from the cathode fall is enough to considerably reduce the net positive

Chapter T w o Literature Survey 61
space charge and to produce a reversal in the sign of the space charge from positive to
negative in the region neighbouring the cathode dark space. Just prior to this, the
voltage gradient becomes slightly negative. Therefore there is a small, local reversal in
the direction of the electric field. Consequently, the fast electrons emerging from the
cathode fall are no longer accelerated and their energy is absorbed mainly by intense
ionisation and excitation, producing the bright negative glow.
As the electrons are slowed down, the negative space charge reaches a maximum. The
electrons have little energy left for further excitation and ionisation. They do not regain
energy rapidly due to the very weak electric field in this region of the discharge and this
leads to the formation of the Faraday dark space.
The positive column is the ionised region that extends from the Faraday dark space
almost to the anode. It is not an essential part of the discharge, and for very short tubes
it is absent. It serves merely to maintain the conduction of current by electrons which is
established in the cathode region and has little or no net space-charge. The field strength
in this region is weak and is just sufficient to produce ionisations to counteract losses by
recombination and diffusion, and hence carry the current to the anode. In the region near
the anode, the net space charge becomes negative again and this is accompanied by an
increase in the electric field strength. The presence of this positive anode fall is often
accompanied by an anode dark space and an anode glow.

Chapter T w o Literature Survey 62
2.9.3 Plasma Reaction Processes
In the glow discharge, various chemical and physical reactions occur between the highly
active and energetic particles mainly by collisions, of which we may distinguish different
types.
2.9.3.1 Collisions
An elastic collision is one in which the energy exchanged is translational kinetic energy
only. The atomic or molecular structure is unchanged and no excitation or ionisation
occurs. In such a collision, the particles behave like elastic spheres and their interaction
can be predicted by classical mechanics using conservation of momentum and energy.
The nature of the collision between two particles depends upon the angle between their
velocity vectors, the line joining their centres of impact and the ratio of their masses.
In an inelastic collision, the gas atom or molecule becomes excited or ionised by
acquired energy from the incident particle (Nasser, 1971). This means that a portion of
the kinetic energy of the system prior to impact has been converted to potential energy of
one of the particles in the system. Generally speaking, whenever conversion from kinetic
to potential energy, or vice-versa, occurs, the collision is inelastic.
There are two kinds of inelastic collision, (a) collision of the first kind in which one of
the colliding species releases some of its kinetic energy and increases the potential energy
of the other particle and (b) collision of the second kind which is an inverse of the above
process. One particle strikes another and absorbs some of its potential energy, moving
off with greater kinetic energy (Howatson, 1965).

Chapter T w o Literature Survey 63
Potential energy transfer between atoms and ions is an important class of second kind
inelastic collision. An ion and neutral atom may collide and exchange positive charge,
the ion capturing an electron from the atom. Excitation energy can be exchanged
between atoms in a similar way. In some cases the excitation energy of one neutral atom
is enough to ionise another atom. Such a process is made more probable if the excited
atom is in a metastable state. This phenomenon is called the Penning Effect and can be
an important ionising agent for discharges in mixtures containing atoms which have
metastable states of high energy.
Attachment and recombination are other important inelastic collision processes. The
process in which an electron, colliding with a neutral particle, forms a negative ion is
called attachment. It can be an important process in the removal of free electrons from
an ionised gas. Of similar nature to attachment is recombination which can happen when
a positive ion collides with either an electron or a negative ion and is neutralised.
2.9.4 Ion Interactions With Surface
When a fast incident particle strikes the surface of the target, its momentum is transferred
to the atoms in the target material. The interactions between the incident particle and the
target material may be split into two broad categories:
i) Elastic effects where striking particles, ions and electrons, may set up a series of
collisions between atoms of the target resulting in ejection of one of these atoms, a
process referred to as sputtering.
ii) Inelastic effects where colliding cations interact with lattice electrons to yield optical
and x-radiation together with secondary electron emission.

Chapter T w o Literature Survey 64
2.9.4.1 Sputtering
The removal or ejection of atoms or molecules of a surface by impacting particles is
called sputtering. Edenhofer (1974, part 1) considered the process as a vaporisation of
the surface by very "hot" ions which strike the surface and intensely heat a localised
surface area of the workplace leading to vaporisation of the atoms in that particular
region. Sputtering is now considered as a cascade of atomic collisions by the lattice
recoil from incident particles due to momentum transfer (Wehner, 1965). The series of
collisions in the target, generated by the primary collision at the surface, is known as a
collision cascade. It will be a matter of luck whether this cascade leads to the sputter
ejection of an atom from the surface or whether the cascade heads off into the interior of
the target, progressively dissipating the energy of the primary impact, finally to lattice
vibrations, i.e. heat.
Sigmund (1969) suggested that sputtering was based on random collision processes.
When the energy transferred from the incident particles is greater than the displacement
energy of a lattice atom, collision cascades are initiated. Sputtering occurs if and when
the cascade intersects the surface with atoms of energy greater than the surface binding
energy.
The incident particle has to be of atomic dimensions, in order for the sputtering process
to be efficient. A very small particle, such as an electron, does not carry enough
momentum to be effective, whereas a large particle, such as an atomic cluster or
macroparticles, is so massive that it cannot interact with individual atoms or molecules in
the surface.

Chapter T w o Literature Survey 65
A useful measure of the strength of the momentum transfer process for each material is
the sputtering yield S, defined as the number of target atoms (or molecules) ejected per
incident ion (Sigmund, 1969). For ion bombardment the sputtering yield S is given by
the following equation (2):
o __ 3cc AMtMt E ° ~ 4TI (Mt+Mt) U0 (2)
Here Mi is the mass of colliding atom, Mt is the mass of target atom, E is the energy of
incident atom, U0 is the surface binding energy of the material being sputtered, and a is
a monotonic increasing function of Mx IMt.
The incident ions should have an energy exceeding a threshold value which is necessary
for sputtering process to occur. This threshold value for iron and its alloying elements is
between 20 and 30 eV (Keller, 1969). Above the threshold, the sputtering rate increases
to a maximum as the ion energy increases. At very high energies, the sputtering rate
decreases due to ion penetration into the sub-surface region and ion implantation
becomes dominant. The sputtering rate is seen to be dependent upon several parameters
such as the mass of the impinging ion, the kinetic energy of the colliding ion, the cathode
fall voltage, the discharge gas pressure, and the discharge current.
2.9.4.2 Secondary Electron Emission
The impact of the ion may cause the target to eject an electron, usually referred to as a
secondary electron. The number of electrons ejected per incident particle is called the
secondary electron coefficient or yield. This value is dependent upon the particle
velocity, the discharge gas, and the electrode material (Howatson, 1965). Electron
emission yield, as with sputtering, is also dependent upon colliding ion energies-

Chapter T w o Literature Survey 66
increasing with higher energies up to the point where ion penetration predominates.
Lighter ions produce larger numbers of high energy electrons.
If the ionisation potential of the ion is less than twice the cathode material work function
(4.77 eV for iron), no electron will be released. However, if the total energy of the
colliding ion exceeds twice the cathode metal work function, then one electron may be
ejected whilst a second electron neutralises the ion.
At low ion energy levels, less than IkeV, there are two forms of electron emission,
potential and kinetic emission. At higher ion energy levels, kinetic emission prevails.
+ +
The ionisation potential for H 2 and N 2 from their gases are 15.43 and 15.55 eV (Field
and Franklin, 1957) respectively, hence potential emission is the dominate process and is
the means by which secondary electron emission sustains the glow in plasma nitriding.
2.9.5 The RF Glow Discharge
Most of the input power in a DC glow discharge is used to accelerate the ions through
the cathode sheath and appears as heat when the ions strike the cathode. If the
secondary electron coefficient, the number of electrons ejected per incident particle, were
0.1, then, to a good approximation, only 10% of the power will end up in the negative
glow from the secondary electrons which are accelerated in the sheath (Rossnagel et al,
1990). In this sense, the DC glow discharge is a rather inefficient plasma generator.
The necessity of conducting net current to sustain the discharge is an even more serious
limitation of a DC glow discharge. This requirement generally prevents the use of
insulating materials in sputtering targets, substrates, or deposited films, because the

Chapter T w o Literature Survey 67
insulators would hinder D C current conduction. These shortcomings of the D C glow
discharge can be assuaged by using an AC power source.
An RF discharge may be maintained either by inductive or capacitive coupling with the
power source, Figure 15. In the case of capacitive coupling the high frequency electric
field is responsible for maintaining the discharge. In contrast, an inductively coupled
discharge is maintained by the time varying magnetic field.
RF discharge is in some ways quite similar to, and in other ways very different from, the
DC discharge that was discussed previously. Unlike the DC discharge, in such system
there is no real cathode or anode since the net flow of charge to either electrode is zero.
There is also no uniquely defined floating potential (Chapman, 1980). The potential
reached by an electrically isolated surface is called floating potential (Thornton, 1987).
Such surfaces are bombarded by equal fluxes of electrons and ions.
In RF discharges, elastic collisions of charged particles with the background gas is the
major mechanism by which the power is coupled into the discharge. RF discharges have
been utilised to achieve higher degrees of ionisation and dissociation and to obtain better
control over ion energies than is conceivable for DC discharges (Lisper, 1994).
The RF glow discharge manifests many of the same qualitative features of the DC glow
discharge, with the formation of sheaths in which strong electric fields will accelerate
ions and electrons.

Chapter T w o Literature Survey 68
COIL
(a)
GAS INLE
PLASMA
PUMP
\ SPLIT RING
ELECTROOE:
(b)
Figure 15. (a) Inductively coupled plasma reactor. An alternating current power
source creates a time varying current, the magnetic field from which generates a
voltage that sustains the discharge, (b) Capacitively coupled plasma reactor. Similar
to (a), except the two plates are used to create an electric field to sustain the discharge
(Rossnagel et al, 1990).
At low frequency (up to 50 kHz), with a period which is long compared to the time it
takes for the plasma particles to come to equilibrium with electric field, the A C discharge
is very similar to the D C discharge. As the frequency increases, the massive ions have
too much inertia to respond to the instantaneous electric field in the sheath region, while
the lighter electrons will. Here, for discharge configurations with unequal electrode

Chapter T w o Literature Survey 69
areas and where the electrons are the dominant negative charge carriers, a self-bias will
arise which will produce a time-average negative voltage on the smaller electrode. Ions
will be accelerated by the difference between the time-average plasma potential and the
time-average bias (Rossnagel et al, 1990). Generally, the energy of the bombarding ions
in an RF discharge will increase as the driving frequency is decreased and/or the neutral
pressure is decreased.
There are three mechanisms through which the energy input to the RF discharge occurs.
Firstly, striking the electrode by energetic ions will cause the formation of secondary
electrons. The acceleration of these electrons through the sheath will cause ionisation as
in the sheath and negative glow regions of the DC discharge. Secondly, the oscillating
electric fields in the glow can input energy directly into the electrons, much in the same
way as the positive column of the DC discharge. Finally, the electrons in the glow will
be accelerated by the oscillating sheath electric field, a "surf-riding" mechanism which
has no direct analogue in the DC discharge.
2.10 Plasma Nitriding
2.10.1 Introduction
Plasma nitriding or ion nitriding is a modern process used to impart surface hardening to
metals for a wide variety of applications. As the name implies, the process is carried out
in a plasma media containing ionised nitrogen alone, or in combination with other gasses
to react with the work surface. The process was independently patented by Egan

Chapter T w o Literature Survey 70
(1931), and Berghaus (1932, 1939), and advances in the field of power electronics have
caused the process to gain world wide popularity in a variety of applications.
Glow discharges which are typically utilised for introducing interstitial elements into the
surface of metals possess electron densities and electron energies as shown in Figure 16.
From this Figure it can be seen that the glow discharge plasma contains a very high
density of electrons (Ixl0^/Cm^) with an average energy in the range of 1 to 10 eV.
Diatomic molecules are ionised or dissociated by electrons of this energy range and
produce chemically active atoms that are needed for the process.
10 16
£
10 12
HIGH-PRESSURE ARCS
LOW-PRESSURE ARCS
o a~
10
io4l
///y//4> ;ZvGL0W "Vy ^ DISCHARGE^
A/////A/
'',. CONTROLLED FUSION
FLAMES
ELECTRON BEAMS
SOLAR CORONA
10 0.1 1.0 10 100 1000 10000
kT - (eV) e
Figure 16. Electron energy vs. electron density in glow discharge plasmas compared
to other well-known plasmas (Grube and Stephen; Kossoswsky (ed.), 1989).

Chapter T w o Literature Survey 71
2.10.2 Paschen's Law
Under the constant pressure and the voltage, by decreasing the distance between anode
and cathode, d, the positive column simply shrinks in length until it disappears entirely as
the anode enters the Faraday dark space. None of the discharge parameters change
appreciably until the anode approaches the negative glow. U p to this point little change
occurs in the glow regions near the electrodes. W h e n the anode is very near the negative
glow, the discharge is still stable, but at a slightly higher voltage. The voltage necessary
to maintain stable operation will increase, as d is further decreased, unless the pressure is
increased in order to maintain approximately the same total amount of gas between the
electrodes as when d was large.
o
>
4 0,000
20,000
iopoo
6000
4000 3000
600
400 300
200
lOOi
V--""•vv
N
DRU rvE ST :Y il I P INNING. RE V. M O D.P HY!
VAN VOORHIS PHYS. REV. 25 583 (1925)
4 ^L/UF
C2F
*s£r
S
XJ
N1 X
->. —__̂
— > ia»
^^*~
^ ~
>,' /.I 2 i —
N 0 • —
1
2 P. 114 (1940) 1 '
: [ E L - '"--•
1 i
.y*£l
g T ^ ^ ^^^"_^^y
=-— *J~\
**
-j , - t — ^ = -
S*
S
- ̂ -~
Llndt A
/ y^
v^-y
y*
Ir Pro
E"? ^ y*l 5*
r-" f
'S
•
V \
f.
.
.
7Y< <*
N< +IX A
duel i c 3m
I -y ir
•f
t
L-
l l
1
-iH,
Ml 1A"
353
ai a2 OJ Q4 ae as 2 3 4 5 6 8 10 20 30 40 pd IN mm Hg X em
60 80 100 200 4O0 600 ' 1000
Figure 17. Paschen curves for a DC glow discharge between parallel-plate electrodes
for various gases. The breakdown voltage, Vb, is plotted against P.d (the gas pressure
times the distance, d, between the electrodes on log-log coordinates) (Grube and
Stephen; Kossoswsky (ed.), 1989).

Chapter T w o Literature Survey J2
As can be seen from the Paschen curves, Figure 17, the voltage required to maintain a
stable discharge in a gas at low pressure is a function of the product of the pressure p
and the distance d between the electrodes. Hence, the pressure must be increased, as d is
further decreased, in order to permit operation at the minimum voltage of the Paschen
curve. Operating near the minimum voltage of the Paschen curve is an advantage
because it eases the requirements on the power supply and also it minimises the voltage
required to obtain complete coverage of the cathode (workpiece) by the plasma which is
essential in order to ensure a case of uniform depth over the entire surface of the part.
This minimum voltage is indicated by x in Figure 13.
2.10.3 Partial Pressure Operation
The pressure of the gas mixture for the glow discharge is an important factor that bears
directly on the probability that molecular elements in the gas mixture will be ionised by a
collision with an electron travelling from the cathode to the anode. Mean free path is the
distance that an electron will travel before colliding with a gas molecule. This mean free
path is inversely proportional to the gas pressure and proportional to the absolute
temperature of the gas. If the pressure of the processing chamber is below IO"2 mbar ( 1
Pa), good vacuum (Figure 18), the mean free path will be large and few gas molecules
will be in the electron path between electrodes (Dressier; Sudarshan (ed.), 1989). Thus
there will be too few collisions between electrons and the gas molecules to sustain an
electrical current. The applied voltage governs partly the number of electrons leaving the
cathode. A high voltage can be applied, if necessary, to produce a large number of
electrons to increase the probability of ionisation. Nevertheless, in a good vacuum,

Chapter T w o Literature Survey 73
where there is considerable distance between gas molecules, the probability of an
electron-gas molecule collision will still be low.
If the partial pressure of the gas mixture is increased to between 10" and 10 mbar (1 and
1000 Pa), there will be a reduction in mean free path and there will be an adequate
number of gas molecules to ensure gas ionisation levels that can sustain a glow discharge
with a current value suitable for plasma treatment. By further increasing the gas
pressure, there will be more than enough gas molecules to ensure collisions with
electrons. But, the electrons will now have such a short mean free path between
collisions that they will probably not acquire enough energy to cause ionisation of any of
the gas molecules encountered unless the voltage is made higher than values considered
practical for plasma treating.
t
GOOD VACUUM PRESSURE <1 PASCAL
PARTIAL PRESSURE 1 PASCAL< PRESSURE < 1000 PASCALS
ATMOSPHERIC PRESSURE PRESSURE=105 PASCALS
Figure 18. Number of gas molecules versus probability of ionisation (Dressier;
Sudarshan (ed.), 1989).

Chapter T w o Literature Survey 74
2.10.4 Nitrogen Activity
In an abnormal glow discharge the density of each molecular species in the gas mixture is
important due to its individual contribution to electrical conductance and to the final
metallurgy of the surface. The nitrogen activity which is a measure of the nitrogen that is
actually available for the nitriding reaction, is a function of many parameters that cannot
always be accurately calculated. However, at present time, a good assumption is that
this activity is proportional to the nitrogen partial pressure and to the current density at
the work surface (Dressier; Sudarshan (ed.), 1989). Current density at the surface of the
workpiece is responsible for most of the metallurgical and thermal effects at the surface.
The surface area of the workpiece can be calculated and the power supply current is also
measured easily, hence the surface current density can be calculated easily. The current
density in a plasma process is a function of the gas density or the number of molecules
per unit of volume. Increasing the gas pressure increases the current density by
increasing the number of available charge carriers if other plasma parameters are fixed.
The gas composition has also an important effect on current density. For most plasma
nitriding processes a mixture of nitrogen and hydrogen gases is generally used. If the
other parameters remain fixed, the gases that are ionised more easily will produce higher
current densities. Increasing the concentration of nitrogen at any fixed gas pressure
lowers the resistivity of the plasma and allows an increase in the current density
(Dressier; Sudarshan (ed.), 1989). Although the percentage of N2 in the gas mixture is
an easily measured quantity, it should be remembered that the more important physical
parameter is the partial pressure of the gas, not the percentage of the gas. The current
density is also an important function of plasma voltage.

Chapter T w o Literature Survey ^ 75
To calculate similar plasma conditions where current densities can be expected to be
nearly the same, the equation of state can be used in the following form, provided the gas
composition remains constant:
JiPi/Ti=J2P2/T2
J = current density
P = gas pressure
T = surface temperature in degree Kelvin
For example the current density in a plasma discharge at lOOPa and at 100°C will be
approximately equal to the current density in a discharge at 200Pa at 473°C. The current
density decreases with increasing temperature since the gas density decreases with
decreasing gas pressure and increasing temperature.
2.10.5 Equipment and Operation
Figure 19 shows schematically the arrangement of the apparatus needed for plasma
nitriding. The main elements are the vacuum furnace, the power supply, and the gas
distribution system with a gas-mixing panel or other mass flow controls. Pea. isolated
heartplate or work support fixturing is also required to ensure electrical isolation
between the workpiece and vacuum vessel. An auxiliary heating system and a rapid
cooling system can also be included. The vacuum pump together with the gas
distribution system, evacuate the furnace from any possible contaminating gasses such as
air, and provide proper mix ratios and flow rate to maintain the required pressure, usually
between lOPa (0.1 torr) to lOOOPa (10 torr) (Edenhofer, 1974, part 1). In the system, a
DC potential which can have a value from about 300 volts up to 1500 volts, is placed
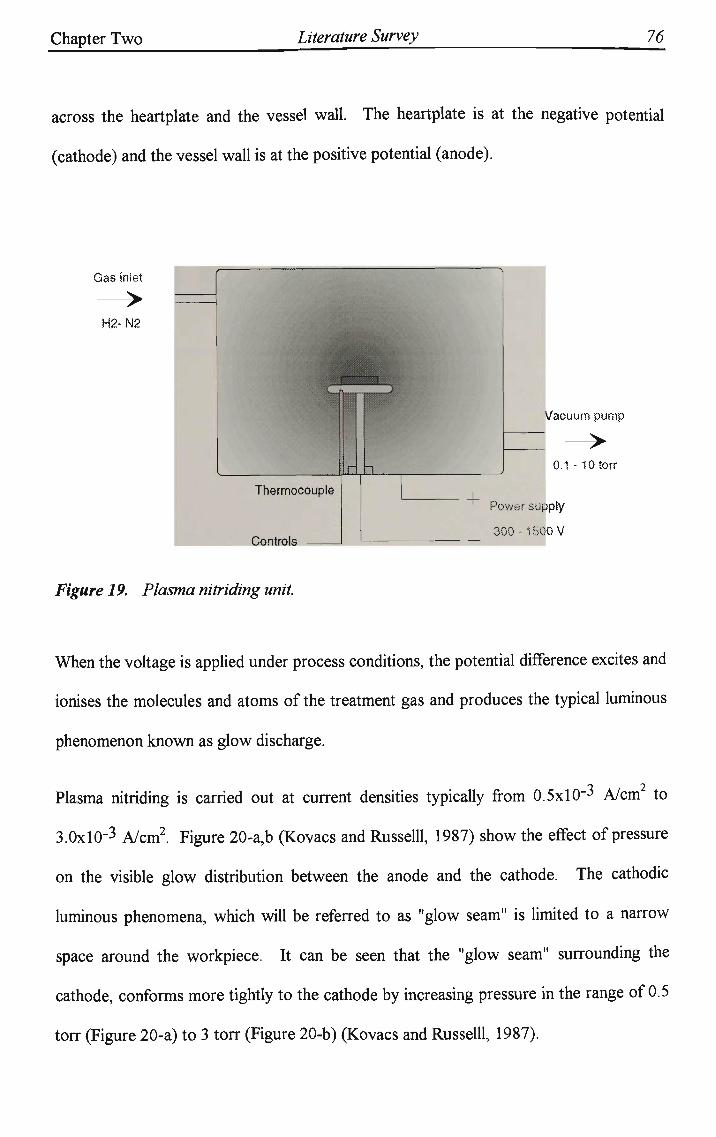
Chapter T w o Literature Survey 76
across the heartplate and the vessel wall. The heartplate is at the negative potential
(cathode) and the vessel wall is at the positive potential (anode).
Gas inlet
>
H2- N2
Thermocouple
Controls
Figure 19. Plasma nitriding unit.
Vacuum pump
I — > I 0.1 -10 torr
Power supply
300 -1500 V
When the voltage is applied under process conditions, the potential difference excites and
ionises the molecules and atoms of the treatment gas and produces the typical luminous
phenomenon known as glow discharge.
Plasma nitriding is carried out at current densities typically from 0.5x10"J A/cm to
3.0xl0"3 A/cm2 Figure 20-a,b (Kovacs and Russelll, 1987) show the effect of pressure
on the visible glow distribution between the anode and the cathode. The cathodic
luminous phenomena, which will be referred to as "glow seam" is limited to a narrow
space around the workpiece. It can be seen that the "glow seam" surrounding the
cathode, conforms more tightly to the cathode by increasing pressure in the range of 0.5
torr (Figure 20-a) to 3 torr (Figure 20-b) (Kovacs and Russelll, 1987).

Chapter Two Literature Survey 77
Cl) Aston dark space
(2) Cathode glow
C3) Cathode dark space
® Negative glow
(§) Faraday dark space
\§) Positive column
(TJ Anode glow
® Anode dark space
Figure 20. Relative glow distribution at (a) low pressure, and (b) increased pressure,
for typical plasma nitriding gases (Kovacs and Russelll, 1987).
Chapter T w o Literature Survey 78
This phenomena is useful in commercial plasma nitriding of workpieces containing holes.
Higher pressure or tighter glow seam, causes nitriding through holes, whereas, lower
pressure leads to jumping over holes and prevent their nitriding. For irregular shaped or
closely placed parts, variation of pressure may put the glow in a region where the glow
seams of opposite surfaces meet or overlap. This will lead to trapping ions which in turn
causes heavier ion bombardment and higher current densities local to the area. This
effect which is known as "hollow cathode", will result in overheating of part(s).
Each gas has its own unique light and dark spaces or line spectra. Under the normal
nitriding conditions, there are two distinct visible bands of light near the cathode, see
Figure 20. The closest band is thin and pink in colour while the next band is much wider
and is purple-blue colored.
2.10.6 Advantages and Disadvantages
The advantages of plasma nitriding can be summarised as follows. Plasma nitriding is
essentially faster than other conventional nitriding techniques. Treatment times half as
long for the same case depth have been quoted (Loh, 1980). This accelerated rate of
nitriding may be attributed to the presence of a strong electric field in the plasma
nitriding process which creates a net flux of ions and energetic neutral molecules (which
arise from charge exchange collisions) towards the workpiece surface. Hence, for a
given pressure, the workpiece surface receives a far greater number of 'active' species per
unit time in a glow discharge environment than the number of molecules available for an
equivalent gaseous system. An increase in reaction rate may therefore be expected at the
early stages of the treatment. Nevertheless, as treatment proceeds, diffusion of nitrogen
within the material becomes rate controlling. Hence when hardness profiles obtained

Chapter T w o Literature Survey 79
from materials treated at similar temperatures for identical times by gas nitriding and
plasma nitriding processes are compared, there are only small differences in case depth
(Staines, 1985). In materials with passive oxide films, eg austenitic stainless steels, it is
possible to achieve reductions in processing time. This is due to depassivation of the
surfaces and removal of passive oxide films and contaminants present on workpiece
surfaces by the sputtering effect of the glow discharge, whereas conventional nitriding
processes cannot depassivate surfaces in the same way. Furthermore, post treatments
may be eliminated in most cases due to the inherently high quality of surface finish
obtained.
The use of vacuum environment allows savings as high as 95% to be made in treatment
gas consumption, compared to gaseous treatment An extensive investigation on energy
utilisation have been carried out by Marciniak and Karpinski (1980). They suggested
that for fully loaded units there is no significant savings, but when the loading is light
plasma nitriding units are more economic with regard to electrical energy consumption.
This reduction in energy consumption is achieved not only because treatment times are
reduced but because it is only the cathodically charged workpieces that are heated and
there is no need to heat up the whole furnace chamber.
Proper control of the temperature, atmosphere composition, and discharge parameters
can lead to production of superior microstructure and permit better control over the
composition of the final product surface, its structure, and its properties. Loh (1980) has
claimed that single-phase compound layers may be formed, which is not possible with
conventional nitriding treatments.

Chapter T w o Literature Survey 80
Operating conditions ensure a uniform glow seam independent of their distance to the
anode and thus uniform treatment of all exposed surfaces leading to an improvement in
the uniformity of the hardness profile on complex shapes.
Unlike conventional nitriding treatments the process can operate at a temperature as low
as 350 °C. Low temperature nitriding allows high surface hardness to be achieved along
with the maintenance of high core strength in low temperature tempering steels.
Furthermore, treating at these low temperatures keeps distortion to a minimum.
Unlike conventional nitriding in which tin plating, copper plating, and liquid glass are
used as a protective coating, easy masking is possible by use of mechanical masks to
prevent full coverage of the surface by the treatment plasma. Areas can be protected by
sheet-materials or by special sleeves slit a few hundredth of a mm, because a glow
discharge cannot form in such gaps.
Plasma nitriding is environmentally non polluting. The gas discharge from a plasma
nitriding furnace is non-toxic and can be vented directly to an outdoor location.
There are few disadvantages of the plasma nitriding process. These can be summarised
as follows:
Cleanliness of surface of the components is essential to hinder unstable arc discharges
forming during the heating cycle. The need to fixture parts to avoid overheating is
another disadvantage of plasma treatment. Because of power/surface area relationships,
components with similar size may not be plasma nitrided in one batch. The last and
perhaps the most disadvantageous of plasma processes is the high initial plant cost.

Chapter T w o Literature Survey 81
2.10.7 Proposed Nitriding Models
One of the most widely used model for plasma nitriding is based on the work done by
Kolbel between 1965 and 1968. The model is based on the sputtering by ion
bombardment. Figure 21 illustrates the layer formation mechanism suggested by Kolbel.
Initially, incoming nitrogen ions and highly energised neutral particles sputter elemental
iron from the cathode workpiece surface. These ion atoms reacts with nitrogen neutrals
in the cathode fall region and form FeN which is deposited on the workpiece surface.
Since FeN is not thermally stable compound, it degrades to iron nitrides with a lower
nitrogen content, producing nitrogen atoms that are capable of diffusion.
A significant limitation imposed by Kolbel is that repurified nitrogen must be used. This
model cannot be considered valid if small quantities of hydrogen are present (Kolbel,
1965). The findings of Keller (1971) and Edenhofer (1974, part 1) further support this
model. Their investigations on the plasma nitriding of spheroidal graphite iron showed
that a uniform compound layer of iron nitrides was produced even on the graphite
nodules cut by the specimen's surface. They interpreted this result as confirmation of
Kolbel's layer formation model. Nevertheless, in investigations into the industrial plasma
nitriding of cast iron, no compound layer was detected on the surface at the sites of
graphite lamella penetration (Lampe, 1993). This would indicate that Kolbel's layer
formation mechanism plays a minor role in industrial plasma nitriding using nitrogen-
hydrogen mixtures.

Chapter T w o Literature Survey 82
Figure 21. Surface reactions occurring during plasma nitriding (Edenhofer, 1974,
part 1).
Another model proposed by Tibbets (1974) is based on the mass transfer of neutral
atoms to the workpiece surface. According to Tibbets the mass transfer occurs mainly
by the adsorption of neutral atoms, not of ions on the metal surface. A positively biased
grid was placed 1.5 m m from the cathode within a N2/H2 glow discharge plasma.
Tibbets found that the cathode continued to nitride even when the grid potential was
such as to repel almost all positive ions from the specimen surface. It was shown that
the nitriding rates for materials with or without the grid were almost the same. From his

Chapter T w o Literature Survey 83
calculations Tibbets concluded that there were no neutral or excited N/H molecules with
sufficient lifetimes to effect any nitriding once passed through the grid. He also
supported his view with the fact that the level of ionisation of particles in the glow
discharge used for plasma nitriding is low, typically a fraction of -10 -7- Tibbets
concluded that the active nitriding species must be neutral atomic nitrogen. This model
was partially supported by the mass spectroscopic investigations carried out by Szabo
and Wilhelmi (1984). They have confirmed the adsorption of neutral particles of the
form FeNH2-3 on the workpiece surface and their contribution to layer formation.
Neutral particles and excited neutrals which have been generated by sputtering and/or
reactions in the plasma can also contribute to the process.
A number of authors (Lakhtin and Krymskii, 1970; Hudis, 1973; Jones et al, 1975), have
claimed that the mass transfer occurs mainly by the ionised atoms and molecules. Hudis
performed a study of the plasma nitriding process in a nitrogen-hydrogen-argon gas
mixture. The distribution of ionic species near the cathode was determined utilising a
mass and energy analyser. He concluded that NH3 molecular ion species were mainly
responsible for nitriding. Nevertheless, he claimed that the ionised environment alone is
not sufficient to nitride the work piece. Employing RF plasma, he observed that the
nitriding occurred only if a potential difference across the electrode was applied. He also
verified that the process operates via particle bombardment and not via simple gas
absorption. By introducing hydrogen to a nitrogen/argon atmosphere, Hudis noticed a
great improvement in the nitriding rate. The optimum nitriding condition were observed
when all the argon had been replaced with hydrogen.
Ricard et al (1989) have investigated nitriding of steels in post discharge and obtained
results which were comparable to the nitriding in glow discharge. They have

Chapter T w o Literature Survey 84
demonstrated using emission and absorption spectroscopy, that the long lived active
species, the N2+ ions, the vibrational N2 and N neutral species are responsible for
nitriding in post discharges. From their experiments it can be concluded that the
sputtering is not an essential prerequisite for plasma nitriding.
By superimposing a crossed magnetic field onto a glow discharge plasma, Brockman and
Tuler (1981) have been able to perform nitriding at low pressures. They showed that the
ratio of electric field/pressure (E/P) dictated the surface atomic concentration and found
that the nitrided case depth varied only with current density for a fixed time and fixed
E/P ratio. Consequently, they concluded that the nitriding process is controlled by ionic
flux and not by atomic nitrogen concentration as proposed by Tibbets.
Xu and Zhang (1987) have suggested a collision dissociation model. They claim that in
plasma nitriding the process of nitrogen atom migration from gas phase to solid phase is
achieved basically by penetration of active nitrogen atoms produced by collision
dissociation. Positive ions of high energy dissociate N2 or NH3 to produce active N
atoms by inelastic collisions. They have also claimed that hydrogen has a significant role
in plasma nitriding. The strong deoxidation and sputtering capability of hydrogen atoms
helps eliminate the passivated film and activate the metal surface. It also significantly
reduces the energy required for collision dissociation to produce active N atoms.
A detailed study of the species present within a glow discharge plasma have been made
by Ricard et al (1982). Based on the evidence achieved they claimed that, both ionic and
neutral atom bombardment of the surface occurs and that it is high energy neutrals that
are the main species responsible for the heating and nitriding action. They also found
that the addition of hydrogen to the plasma produces an increase in the secondary

Chapter T w o Literature Survey 85
electron coefficient of the ferrous surface which in turn influences the ratios of the
plasma constituents and enhances the nitrogen potential of the medium.
A study of plasma nitriding by Petitjean and Ricard (1984) has been conducted in a
nitrogen-hydrogen gas mixture using optical emission spectroscopy. They found that the
addition of a few percent of hydrogen leads to a significant increase of discharge current
and sample temperature.
Although many plasma diagnostic investigation have been carried out and some models
have been suggested, further critical experimentation is required to reconcile the various
points of views. It would appear that all of the mechanisms suggested by different
authors so far play some role in the process but which is the main factor is not obvious
and depends greatly on operating conditions.
2.11 Ion Implantation
2.11.1 Introduction
Ion implantation is a modern surface modification technique that causes hardening by
entirely different mechanisms compared to nitriding. It was first used in the 1960s to
dope semiconductor materials for the electronics industry. Due to its accuracy, speed,
cleanliness and controllability it has become the standard method for this type of work.
In the early 1970s the idea of using ion beams to enhance the surface properties of metals

Chapter T w o Literature Survey 86
became a reality. Ion implantation of metal surfaces was found to produce surprising
results in reducing wear, friction and corrosion (Hartley et al, 1972).
Ion implantation is the process of introducing atoms of alloying elements into the surface
of materials by accelerating the atoms to very high energies of 50-200 keV and allowing
them to strike the metal surface (Kossowsky, 1989). It requires the formation of an ion
beam which is rastered in a predetermined pattern across the surface of the material to be
implanted. For treating complex parts, they may also need to be manipulated remotely to
allow a complete surface treatment (Elder et al, 1989). Implanted layers are typically in
the order of 0.01-1 urn thick, depending on the energy of the ions. The need for high
temperatures to produce a thermal diffusion of the incident atoms into the surface is
eliminated due to the mechanical injection of the atoms into the surface. Hence, heating
of the workpiece by ion bombardment is usually undesirable and is avoided by using a
cooled platform. The temperature of the implanted part is typically kept below 100°C.
2.11.2 Basics of Ion Implantation
Ion Implantation processes are generally carried out in a high vacuum, 1 mPa, in order to
minimise scattering or neutralisation of the beam (Dearnaley et al, 1986). In its simplest
form the implanter contains an ion source , in which the ions are created from a plasma,
and a chamber containing the items to be treated. The material to be ionised is
introduced into a chamber as a gas. It may already be in the form of a gas (e.g.
nitrogen), or the gas may be produced by vaporisation from a source, or it can be
produced by other means. Biasing the source at 50-200 keV (and in some cases up to 4
MeV) accelerates the ions to high speeds and directs them into the chamber. The
process is line-of-sight, since the ions enter the chamber as a beam. Because many ions

Chapter T w o Literature Survey 87
are produced from compounds, if a single ion species is needed the beam must be
filtered. The ions can be separated according to charge and mass by passing through a
suitably controlled magnetic or electrostatic field. A magnetic field is commonly used.
The ions are forced into an arc path, and the field adjusted to only allow those of the
desired mass or charge to pass through the opening at the entrance to the accelerator.
The selected ions then enter an accelerator which is basically a series of plates that are
progressively charged to a high potential. For proper implantation, the final energy must
be in the range of kilo-electron volts which is much higher than that required for
ionisation or dissociation.
When the highly energetic ions strike the surface, a number of near surface phenomena
take place. Collision cascades and sputtering are the two major occurrences which are
illustrated in Figure 22 and have been already discussed previously.
As the incident ion impinges the surface, its kinetic energy will be dissipated in elastic
collisions with substrate atoms and by excitation of bound electrons. The energetic ion
collides with the atoms of the solid and continue its way to a depth of many hundred
Angstroms. Along this path, it displaces many atoms by primary and secondary
encounters, and for a time of about IO"11 s creates a region of the material containing
hundreds of interstitials and vacancies, Figure 22, (Solnick-Legg and Legg; Sudarshan
(ed.), 1989). This is known as a collision cascade and is often visualised as a very
localised spike of thermal energy, although it cannot truly be thought of as a thermal
process. As the ion continues to penetrate, it will collide with more atoms, continually
dissipating energy and will finally come to a rest.

Chapter T w o Literature Survey 88
100 keV
3 sputtered atoms
surface moves
several thousand
lattice atoms moved
several hundred
Interstitials several hundred
vacancies
rbon
distribution
— / /
/• *. diffusion
/ \
atoms move out
atoms move in
Figure 22. Processes occurring in a typical collision cascade (Solnick-Legg and Legg;
Sudarshan (ed.), 1989).
The maximum penetration of the ions is a function of atomic number and mass of
incident species and substrate elements, and energy and angle of incidence of the ion
beam (Fenske, 1992). As the energy of the ion beam is increased or the atomic number,
density of the substrate and mass of the incident decreased, deeper penetration is
achieved. The depth profile is, generally, Gaussian with a slightly pronounced tail, and
can be calculated using Monte Carlo simulation programs.
When the high energy ions strike the surface, they may have sufficient energy to cause
some of the atoms of the material to be sputtered from the surface. This can occur by
single or double collision events and cascades, accumulation in the gradual erosion of the
surface. The same factors which control the depth of penetration also control the

Chapter T w o Literature Survey 89
sputtering rate. Generally, if the depth of penetration is increased, sputtering is
diminished.
Dose or fluence is the common term used to describe the amount of ions implanted into a
material. It is defined as the total number of ions which have impinged the surface
during implantation per cm2 (Elder et al, 1989). It is important to differentiate between
dose (fluence) and retained dose, the number of ions embedded in the material per cm2.
Due to ablation at the surface, the retained dose is always less than the dose.
Nitrogen ion implantation was developed in mid 70s to increase the useful life of
production tooling. It is now being used commercially for improving the wear and
corrosion resistance of a wide variety of tools. The implantation processes for nitrogen
ions use energies of 50-150 keV and doses of 1-10x10 ion cm" (Legg and Solnick-
Legg, 1988). Nitrogen ion implantation is usually carried out in a simple ion implanter
not equipped for mass separation of different ion species, so all the ions produced in the
ion source are fired into the sample. Sample or beam scanning, while sometimes used,
can often be discarded in favour of simply using a broad ion beam of reasonable
uniformity.
2.11.3 Strengthening Mechanisms of Ion Implantation
Elder et al (1989) suggested three mechanisms which are responsible for the increase in
the surface hardness of an ion implanted material and a brief summary of the proposed
mechanisms is given here. The first mechanism is a damage and defect induced effect
caused by the slowing implanted ions, producing results similar to those obtained
through shot peening and cold working. Ion implantation results in compressive surface

Chapter T w o Literature Survey %
residual stresses. These stresses are due to the expansion of the lattice in an ion
implanted layer, from the accommodation of large numbers of impurity atoms, which
results in the constraint of the substrate putting the surface in compression. Strain
hardening in the implanted layer arises from a dense network of tangled dislocations and
dislocation loops, generated as a result of the collapse of vacancy clusters during
implantation. These strain fields create a large energy barrier, which prevents plastic
flow.
Solid solution strengthening is the second mechanism. Strengthening is achieved by
blocking the movement of dislocations. This is done by creating obstacles, i.e., points at
which energy is absorbed in the movement of a dislocation. Foreign atoms, either
interstitial or substitutional, are the simplest obstacles. The strain field associated with
substitutional impurities hinders dislocations movement. Interstitial atoms are able to
segregate at dislocation, if they are mobile, and form Cottrell atmospheres which resist
deformation.
The third proposed mechanism is second-phase strengthening, where the dislocations are
pinned at the sites of the second phase particles. A dispersion of second phase particles
will resist deformation, particularly if they are hard. However, if they are too large the
interface can crack. Since ion implantation is carried out at low temperatures, it is ideal
for introducing a very fine dispersion of second-phase precipitates.
The dose governs the contribution from each of these mechanisms to the total hardness
of the implanted layer (Leutenecher, 1989). Damage induced hardening effects dominate
for very low doses, 1015-1016 ions cm"2. The contribution from solid solution
strengthening becomes more dominant for intermediate doses, 1016-1017 ions cm" . For

Chapter T w o Literature Survey 07
high doses, > IO17 ions cm"2, the contribution from precipitation strengthening tends to
dominate.
2.11.4 Plasma Source Ion Implantation (PSII)
The main problem with conventional ion implantation is that the ion beam must be
directed to the surface of the part and the best implantation is obtained when the beam is
normal to the surface. This is a line-of-sight process, and the parts being implanted, as
mentioned earlier, generally require manipulation in fixtures to implant the desired
surfaces. Manipulation adds complexity to the process and limits the size of component
that can be implanted.
In a new method, plasma source ion implantation (PSII) developed by Conrad and co
workers (1987) in Wisconsin, USA, the part is placed directly in the plasma source and is
pulse-biased to a negative potential of-10 to -lOOkV relative to the chamber walls. A
thick ion matrix sheath forms around the target. On each pulse, ions are sucked out of
the plasma directly into the sample surface from all directions simultaneously. This gives
relatively uniform implantation and overcomes the line-of-sight restriction. In order to
prevent the plasma losing all of its ions, the pulse is turned off after a few microseconds.
In this way the implant dose is built up by a series of very short pulses. The beam
current in each pulse can be very high (many amperes), but the dose rate is determined
by the average current. This is limited by sample heating considerations and by the
capability of the power supply. Unlike other ion-assisted surface modification techniques
such as ion plating, ion coating, or plasma nitriding, PSII produces a deposition profile
characteristic of high-energy ion implantation.

Chapter T w o Literature Survey 92
2.11.5 Plasma Immersion Ion Implantation (PI3)
Plasma immersion ion implantation (PI-*) was developed by ANSTO (Australian Nuclear
Science and Technology Organisation) at Lucas Heights, Australia, and the details of the
process were first published in 1988 (Tendys et al, 1988). Depending on treatment
temperature, it has been demonstrated to impart properties to the treated material typical
of ion implantation, plasma nitriding or a combination of both. The process has been
able to overcome some of the problems associated with ion implantation, utilising a gas
plasma in combination with high voltage pulses to form an evenly treated layer.
Although PI-* was developed independently, it is closely related to PSII.
The difference between the two techniques lies in the method of plasma generation. In
PSII, the plasma is generated by high energy electrons emitted from a biased multidipole
filament and confined by an array of permanent magnets situated around the chamber
(Conrad et al, 1987). In contrast, the PP plasma is an inductively-coupled radio
frequency (RF) glow discharge and there is no magnetic confinement. The PP apparatus
has been discussed in detail in the literature (Tendys et al, 1988; Collins et al, 1991;
Hutchings et al, 1992), and only a brief summary is given below.
In a cylindrical vacuum vessel, a suitable gas (or gas mixture) is used at a filling pressure
between 1-2 x IO"3 mbar. The workpiece is supported in the centre of the vessel by an
isolated conducting stage which supplies the bias voltage for implantation.
Approximately 300W of RF power at 13.56 MHz is used to produce a plasma with an
ion density of 2x109 cm"3. The target forms the cathode of the bias circuit which supplies
-45 kV pulses of 100 us duration. The high voltage is pulsed because of the large

Chapter T w o Literature Survey 93
current density drawn from the plasma. The body of the vessel is grounded and forms
the anode of the implantation circuit.
An ion rich sheath is formed which effectively insulates the target from the surrounding
neutral plasma and ions are accelerated across the sheath and strike the surface at angles
close to normal. This will result in a high retained dose and minimal ion sputtering. The
high ionisation rate of the RF glow discharge is believed to form a sheath of equilibrium
width several microseconds after the initiation of each high voltage pulse. This is in
contrast to the continuously expanding sheath observed in PSII (Collins, 1990). In other
words, in PSII the sheath is quickly depleted and has to expand to acquire nitrogen,
while in PP\ the RF plasma supplies an abundant amount of nitrogen ions which enter
the sheath and are accelerated towards the target.
The current density in the pulse ranges from 1 to 2 mA cm"2, which is two order of
magnitude higher than for conventional implantation. The heating contribution of ion
bombardment is significantly increased and the frequency of pulse repetition or the duty
cycle are regulated to control the surface temperature of the sample which is measured
using an infra-red pyrometer installed at the top of the chamber. Elevated temperature
treatment enables diffusion of nitrogen to significantly greater depths than those achieved
in conventional ion implantation. Thermal equilibrium of the target is usually reached
after 20-30 minutes of treatment time and radiation provides the dominant cooling
mechanism. Treatment temperatures range from 150°C up to approximately 600°C
(Hutchings R, 1994).
It is beyond the scope of this section to discuss the results obtained by other workers in
order to evaluate the capabilities of the PI3 technique. Hutchings (1994) and Collins and

Chapter T w o Literature Survey 94
co-workers (1994) have thoroughly reviewed the relevant literatures. Nevertheless, it is
worth mentioning some of the materials employed during these investigations, such as
mild steel and stainless steel (Collins et al, 1991), tool steels including AISI HI3
(Hutchings et al, 1991; Hutchings et al, 1992), AISI SI and Viking™ (Samandi et al,
1992; Collins et al, 1993), austenitic stainless steels AISI 304 (Collins et al, 1991) and
AISI 316 (Samandi et al, 1993). All the experiments have been conducted in a pure
nitrogen atmosphere.
In PP treatment at low temperature (below 200°C in steels), although nitrogen is
confined to the top lOOnm of the material, significant improvements in wear performance
have been obtained. At higher temperatures, nitrogen diffuses to depths well beyond the
implantation range and structures are formed that are more like those obtained in plasma
nitriding with significant increase in hardness and load-bearing capacity. At these
temperatures, nitrogen can also be thermochemically absorbed from the RF plasma so the
process can be considered as a hybrid treatment combining low-pressure plasma nitriding
with high energy ion bombardment (Samandi et al, 1992).
2.11.6 Advantages and Limitations of the Plasma Ion
Implantation process
There are several advantages of plasma-base ion implantation over traditional methods of
plasma nitriding such as (Collins et al, 1994):
1) The possibility of production of a nitrided layer at temperatures as low as 250°C.

Chapter T w o Literature Survey 95
2) Nitriding can be carried out at atmosphere containing nitrogen with no hydrogen at
pressures typically 10" mbar.
3) Target bias is separated from the plasma generation circuit which in turn reduces the
possibility of arcing and offers better control of the process.
4) Production of surface "metastable" phases with superior wear and corrosion
resistance compared to the equilibrium phases obtained by thermochemical processes.
5) Remarkable dimensional stability and good surface dignity of the treated samples.
Several advantages have been attributed to the plasma-based ion implantation process
over the conventional methods of ion implantation, including uniform coverage, low unit
cost, the easing of line-of-sight restriction and the ability to treat complex shapes.
Additionally, it is easier to scale to large targets, offering the prospect of a
technologically simple implanter design (Collins et al, 1991). However, the limitations of
the plasma-based ion implantation compared with traditional methods of ion implantation
are as follows (Collins et al, 1994).
1) Contrary to the earlier claims, plasma ion implantation dose not completely overcome
the line-of-sight restrictions of traditional ion implantation.
2) There are limitations on the packing density for multiple components of complex
shape. The distance between the components needs to be in excess of 10cm due to the
relatively large sheaths (Conrad etal, 1989).
3) The ion energy achievable by plasma ion implantation is restricted not only by the
technical problems but also by safety hazards associated with electric shock and x-ray
production. Furthermore, practical considerations such as field emission from the target,

Chapter T w o Literature Survey ptf
larger cathodic sheaths, reduced efficiency from secondary-electron emission, heat
dissipation in the surface and the increased current requirements of the modulator, put
the maximum operating high voltage in the range 50-100kV.
4) For the development of particular applications, conventional ion beam techniques
offer better species and dose control which may be advantageous in certain situations.

3. CHAPTER THREE:
EXPERIMENTAL PROCEDURE
3.1 Materials
Two materials were used in this investigation, a commercially available chromium
bearing microalloyed steel, M A X I M A ™ and a conventional nitriding steel, En 19, which
was used as a reference. The chemical composition of these steels which obtained by
spark emission spectroscopy is shown in Table 3. The structure of M A X I M A ™ and
Enl9 steels prior to nitriding were examined by optical microscope. The
photomicrograph in Figure 23 shows the microstructure of as received M A X I M A ™ ,
consisting of proeutectoid ferrite plus bainite. The grain boundaries are clearly visible
indicating a grain size of- 40-70um. The microstructure of Enl9 steel consists mainly
of tempered martensite plus some undissolved carbides, Figure 24.
Table 3. Chemical composition of MAXIMA™ and Enl9 steels obtained by spark
emission spectroscopy.
Element, wt. %
Steel C M n Cr M o Si Ni Cu Al N b Ti V
M A X I M A ™ 0.21 1.57 1.9 0.03 0.05 0.255 0.41 0.029 0.01 0.012 0.005
Enl9 0.4 0.79 1.05 0.17 0.26 0.042 0.056 0.037 <0.003 <0.003 0.003
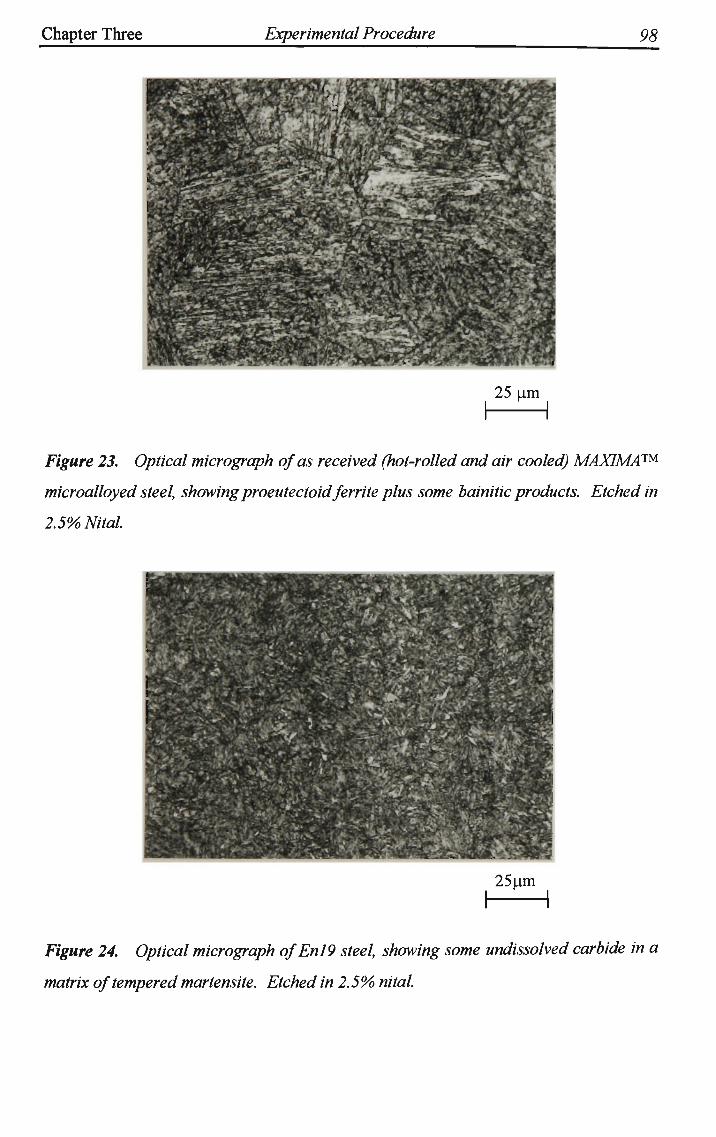
Chapter Three Experimental Procedure 98
25 um
Figure 23. Optical micrograph of as received (hot-rolled and air cooled) MAXIMA™
microalloyed steel, showingproeutectoid ferrite plus some bainitic products. Etched in
2.5% Nital.
25 um
Figure 24. Optical micrograph ofEnl9 steel, showing some undissolved carbide in a
matrix of tempered martensite. Etched in 2.5% nital.
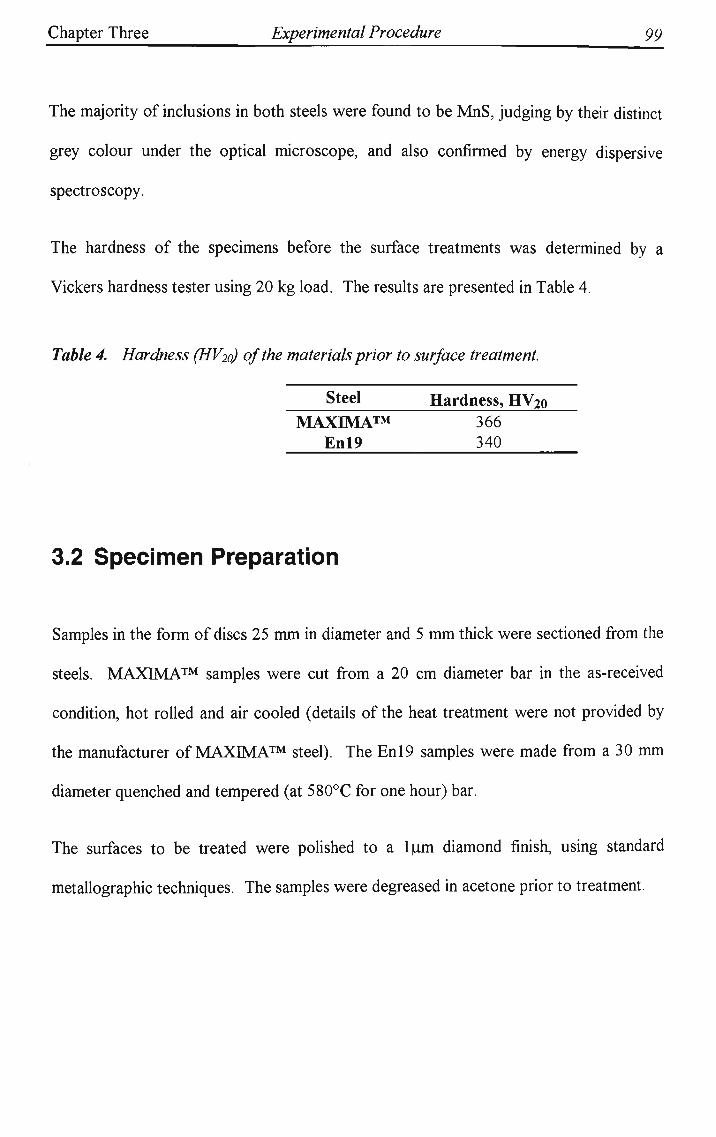
Chapter Three Experimental Procedure 99
The majority of inclusions in both steels were found to be M n S , judging by their distinct
grey colour under the optical microscope, and also confirmed by energy dispersive
spectroscopy.
The hardness of the specimens before the surface treatments was determined by a
Vickers hardness tester using 20 kg load. The results are presented in Table 4,
Table 4. Hardness (HV2Q) of the materials prior to surface treatment.
Steel Hardness, HV20 MAXIMA™ 366
Enl9 340
3.2 Specimen Preparation
Samples in the form of discs 25 mm in diameter and 5 mm thick were sectioned from the
steels. MAXIMA™ samples were cut from a 20 cm diameter bar in the as-received
condition, hot rolled and air cooled (details of the heat treatment were not provided by
the manufacturer of MAXIMA™ steel). The Enl9 samples were made from a 30 mm
diameter quenched and tempered (at 580°C for one hour) bar.
The surfaces to be treated were polished to a lum diamond finish, using standard
metallographic techniques. The samples were degreased in acetone prior to treatment.

Chapter Three Experimental Procedure JOO
3.3 DC Plasma Nitriding
DC plasma nitriding was carried out using two different plasma nitriding units. At the
inception of this work no plasma nitriding facility was available at the University of
Wollongong, therefore, the preliminary DC plasma nitriding treatments were performed
in a 40 kW Klockner Ionnon industrial scale unit at the University of Birmingham,
England.
Further experiments were later carried out using a unit designed and commissioned at the
Surface Engineering Research Centre at the University of Wollongong, see Figure 25. It
uses a 5 kW switch mode power supply equipped with arc suppression circuitry. A
schematic of the unit is displayed in Figure 26. All treatments were carried out with
power regulation to maintain the desired temperature. During treatment, the
temperature was monitored by an inconel sheathed chromel-alumel thermocouple
embedded in the specimen and electrically isolated by a ceramic sleeve. The temperature
was controlled by a Eurotherm temperature controller within ±1°C. The voltage and
current parameters were automatically varied to maintain the temperature at the pressure
setting.
The processing gases were provided using pre-mixed gas bottles. Since the pumping
speed as well as the conductance of the throttle valve are different for nitrogen and
hydrogen, the actual gas composition inside the chamber during the process is expected
to be different from the feeding gas. In an effort to monitor the nitrogen and hydrogen
partial pressures (actual gas composition) of the nitriding atmosphere, a HTDEN HAL-
100 residual gas analyser was utilised. Since the operating pressure of the gas analyser
was several orders of magnitude lower than the nitriding pressure, an orifice was

Chapter Three Experimental Procedure ]0J
installed between the chamber and the gas analyser instrument. However, the
requirement for using orifice precluded the utilisation of the instrument at chamber
pressures higher than 1.5 mbar which was lower than the processing pressure (4mbar).
It should be mentioned, if it were possible to monitor the partial pressures of the gases in
the processing atmosphere using an orifice, the readings still would not be the real gas
composition of the treatment atmosphere. This is again due to the difference in the gas
conductance of the orifice for nitrogen and hydrogen. Nitrogen and hydrogen molecules
(ions) pass through the orifice and reach the gas analyser detector with different speeds.
Bearing in mind the above mentioned points, the gas compositions stated in DC plasma
nitriding hereafter, is the feeding gas composition which might be different from the
actual processing composition.
The treatment pressure was monitored by both mechanical and pirani gauges and
regulated by up-stream control of process gas through a needle valve.
The specimens were symmetrically positioned on a steel table (Figure 27), 15 cm in
diameter, in order to eliminate any risk of temperature non-uniformity.
The chamber was evacuated twice to 10"2mbar and purged with nitrogen prior to the
treatment. Heating of the specimens was performed in a hydrogen plasma, which
involved gradually increasing the pressure from 5x10"1 mbar to the treatment pressure of
4 mbar. All heating was supplied by the glow discharge, and once the treatment
temperature was achieved, (usually within 1 hour), the hydrogen was replaced by the
treatment gas. After treatment, the specimens were slowly cooled to room temperature
in a nitrogen environment.

Chapter Three Experimental Procedure 102
3.3.1 Treatment Conditions
DC plasma nitriding of the samples, using a 40 kW industrial scale unit, were carried out
at different temperatures, namely 350, 400, 450, 500, and 550°C in a 75%N2-25%H2
atmosphere. The treatment duration was 5 and 10 hours and the pressure was 4 mbar.
Two series of experiments were performed using the 5kW prototype unit. In order to
gain a rough idea about the optimum N2-H2 gas mixture for nitriding of M A X I M A ™ ,
preliminary experiments were carried out at 450°C in atmospheres containing different
concentrations of N2-H2, i.e., 100%N2, 75%N2-25%H2, 50%N2-50%H2, and 25%N2-
75%H2. The other series of experiments was conducted using both M A X I M A ™ and
Enl9 samples, at 350, 400, 450, 500, and 550°C in a 75%N2-25%H2 atmosphere. In all
cases, the treatment time was 5 hours and the pressure during the treatments was 4mbar.
Figure 25. 5 kW DC plasma nitriding unit designed and commissioned at the Surface
Engineering Research Centre at the University of Wollongong.
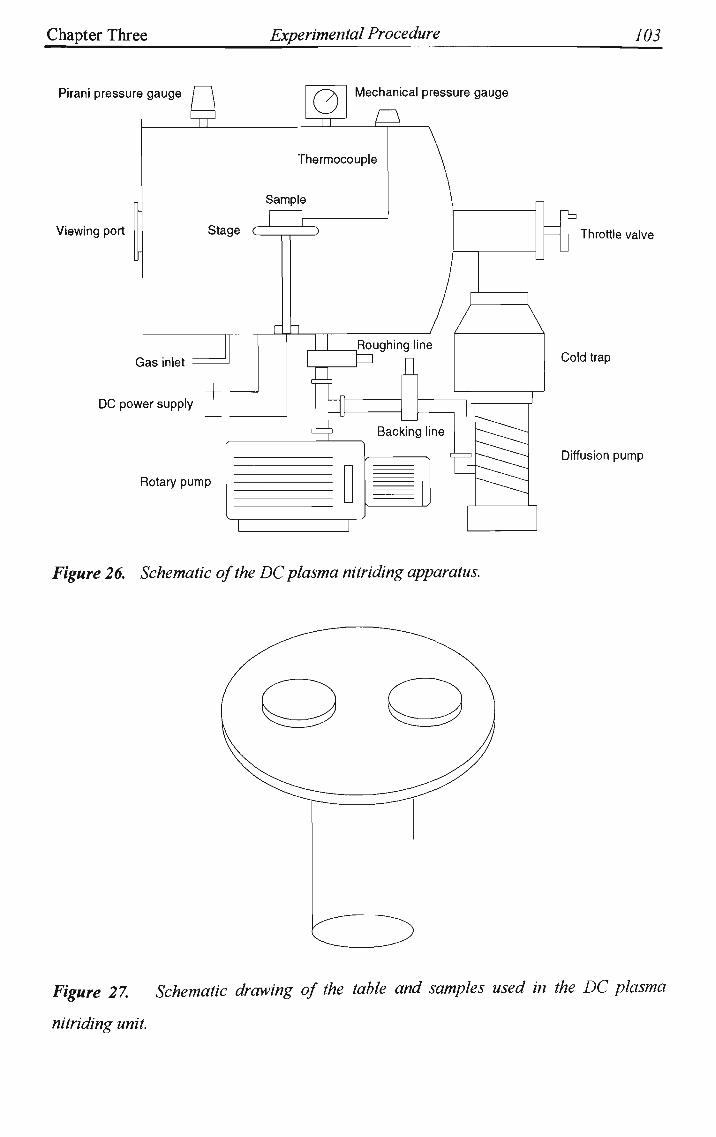
Chapter Three Experimental Procedure 103
Pirani pressure gauge
Viewing port
XL 0 Mechanical pressure gauge
Thermocouple
Sample
Stage C
Gas inlet
D C power supply +
Roughing line
D
ii Backing line
Rotary pump
s Lv
Throttle valve
Cold trap
Diffusion pump
Figure 26. Schematic of the DC plasma nitriding apparatus.
Figure 27. Schematic drawing of the table and samples used in the DC plasma
nitriding unit.

Chapter Three Experimental Procedure ]04
3.4 P|3 and RF Plasma Nitriding
PI3 and RF plasma nitriding were carried out using only MAXIMA™ samples in a unit
developed at ANSTO. A schematic drawing of the unit is illustrated in Figure 28. For
both PI3 and RF plasma nitriding, the unit was operated at a filling pressure of 1.6xlO"3
mbar, with 300W of RF power at 13.56 MHz. Nitrogen and hydrogen gasses were
provided in separate bottle and were fed to the chamber by means of mass flow
controllers, with flows of 9 and 10 seem, respectively. A HTDEN HAL-100 residual gas
analyser was used to monitor the nitrogen and hydrogen partial pressures during the
processes. A separately pumped chamber was used for the residual gas analyser,
connected to the main chamber through a small orifice. The residual gas analyser
readings were calibrated in terms of the partial pressures of hydrogen and nitrogen in the
process chamber. To obtain the 75%N2-25%H2 ratio inside the chamber a 53%N2-
47%H2 gas mixture had to be used. The reason for this is that the hydrogen was pumped
out faster than the nitrogen due to the conductance of the throttling valve used which
was nearly 4 times greater for hydrogen than nitrogen. After the processes were
completed, the samples were allowed to cool to room temperature in the chamber.
The details and functioning of the PI3 process were covered in the previous chapter. All
the PI3 treatments were carried out using high voltage pulses of - 43 kV amplitude,
100u,sec duration and 0.95A current. Secondary electron coefficient, y, was 3
(secondary electron/ion) and current density during HV pulses was 1.2 mA/cm . The
PP treatment parameters are given in Table 5.

Chapter Three Experimental Procedure ]05
Table 5. PI3 treatments parameters.
Temp., °C
350
400
450
500
550
Time to temp., min.
20
24
39
47
68
Freq. to temp., Hz
200
200
200
250
260
Freq. at temp., Hz
72
105
146
180
200
Total dose, atom/cm2
25.35 xlO17
32.49 xlO17
46.55 xlO17
57.85 xlO17
68.67 xlO17
Since no high voltage pulses were involved in R F plasma nitriding, the samples were
heated to the nitriding temperatures in vacuum, using auxiliary heating through a
resistively heated stage. After reaching the temperature the RF plasma was turned on for
5 hours. The temperature was monitored by means of two thermocouples, one inserted
in the stage, near the surface region, and the other in a sample placed on the stage. After
PI3 and RF plasma nitriding treatments, the samples were allowed to cool in the vacuum
chamber.

Chapter Three Experimental Procedure 106
Gas inlet
Viewing port
Infra - red pyrometer
Matching network
RF antenna n Throttle (gate) valve
Sample Stage c ' •)
Rotary pump
200 - 300 W RF 13.56 Hz
Roots pump
Turbomolecular pump
Figure 28. Schematic of the PI3 and RF plasma nitriding apparatus. Note that in PI3
the sample is connected to the high voltage circuit while in RF plasma nitriding the
sample is placed on a resistively heated stage.
3.4.1 Treatment Conditions
Apart from the mode of heating, other nitriding parameters, such as time, temperature
and atmosphere were kept constant for both R F plasma nitriding and PI3 treatments.
For both processes, the M A X I M A ™ specimens were treated in a 75%N 2-25%H 2
atmosphere for 5 hours at different temperatures, namely 350, 400, 450, 500 and 550°C.
Chapter Three Experimental Procedure J07
3.5 Characterisation Techniques
3.5.1 Optical Microscopy
The treated samples were sectioned normal to the surface. An electroplated nickel layer
was deposited on the nitrided specimens using a Watt's bath (see Appendix A) in order
to protect the edges and to preserve the white layer. The thickness of the nickel layer
was about 60p.m. After surface grinding, the specimens were polished on 6 and lum
diamond lapping wheels.
Several etchants such as 2.5% nital, Oberhoffer's, and Marbel's reagent, were used in this
investigation to reveal different constituents of the microstructure of the nitrided cases.
The composition of these etchants is given in Appendix A. Optical microscopy was
carried out on both etched and unetched (as polished) surfaces using a Nikon optical
microscope. The thickness of the compound layers produced by nitriding was also
measured by optical microscopy using an eyepiece graticule. The samples were etched in
2.5% nital prior to the measurments. The thickness values quoted are the average of at
least 25 readings.
3.5.2 Scanning Electron Microscopy
A Leica Stereoscan 440 scanning electron microscope was employed to study in more
detail the layers formed on the surface of the treated samples. The samples were
prepared in a similar manner to those used in optical microscopy, except for the fact that
they were slightly over etched. Furthermore, the samples were coated with a thin layer
of gold sputtered on the surface to improve electrical conduction and to avoid charging

Chapter Three Experimental Procedure J08
which causes drifting of the image. SEM was also used to examine the morphological
features of the surface of the treated samples.
3.5.3 X-ray Diffraction
X-ray diffraction was employed as the major analysis technique for identification of the
phases formed on the surface of the treated samples. A Philips X-ray diffractometer was
used to perform the analyses utilising an iron filtered, Co Ka radiation. The scanning
angle (29) ranged from 30° to 100° and the scanning speed was l°/min. The
measurement conditions of the tube voltage and current were 40 kV and 25 mA
respectively. A detailed study of the surface of the samples was made in both the as-
received and treated conditions.
3.5.4 Glancing Angle X-ray Diffraction
Glancing angle X-ray diffraction using a Siemens D500 0-20 diffractometer was also
utilised to identify the phases formed on the surface of RF plasma nitrided and PP
treated samples. The incident radiation was Co Ka, with a range of incident angles (a)
between 1° and 5° used to evaluate the distribution of phases with depth. Bragg angles
(20) between 40° and 90° were examined with a scan step of 0.1° and dwell time of 10
seconds between each step.
3.5.5 Glow Discharge Optical Emission Spectroscopy
Nitrogen and carbon concentration profiles at the surface of treated samples were
determined by Glow Discharge Optical Emission Spectroscopy (GDOES) using a Jobin-

Chapter Three Experimental Procedure 109
Yvon GDS-JY50S instrument. Briefly, the GDOES technique involves cathodic
sputtering of the specimen surface by applying a controlled voltage across the specimen
being analysed at a controlled argon pressure. The sputtered surface atoms diffuse into
the argon plasma where excitation provides optical emission spectra with a linear
relationship between element concentration and spectral intensity. More details of the
process are explained in Appendix B.
The instrument comprises a Grimm-style glow discharge lamp, using ultrahigh purity
argon as the plasma gas. To ensure that the sample is effectively the sole cathode, a
ceramic support was used. A 4mm diameter anode was utilised and the sample-to-anode
distance was set to 140±20 um. GDOES enables the determination of elemental depth
profiles to a maximum depth close to 50um. The depth of the crater created by sputter
erosion was measured using a Taylor-Hobson Form Talysurf-120 profilometer, thus
allowing a quantitative assessment of the sputter rate to be made.
3.5.6 Hardness Measurements
A Leco M-400-H1 Vickers microhardness tester was used to obtain indentations on
treated surfaces at 25, 50, 100, 300 and 1000 gram load. At least 10 indentations were
made on each sample at each load, and a set loading pattern was maintained.
The hardness profiles of the samples across the treated case were measured on
metallographically prepared cross sections with a load of 50g. The hardness values
quoted are the average of at least 5 readings. All precautions were taken to ensure
consistent and reliable results. The nitrided case depth was measured from the hardness
profiles using the Japanese Industrial Standard (JIS) G0562 (1995) in which the case

Chapter Three Experimental Procedure no
depth is defined as the distance from the surface of the specimen to the point at which
the microhardness profile reaches a value 50 Vickers point (or Knoop) above the core
hardness.
To check for softening of the material during treatment, several 20 kg hardness
indentations were also made in the core of each sample after treatment.
3.5.7 Surface Roughness Measurements
Surface roughness was characterised with a Talysurf stylus instrument. The diamond
tipped stylus has a chisel edge, with the flat, contacting face of the stylus having
dimensions of 0.2 by 1 um (Dagnall, 1980). The instrument converts the vertical height
as a function of horizontal displacement to a voltage as a function of time leading to a
graphical representation of the surface by a line profile. Once the trace has been
produced, filters are applied numerically to the recorded raw profile, enabling the
removal of either short or long wavelength components (Maddrell, 1991).
Comparison of surface roughness was based on Roughness Average, Ra, measurement.
Ra is universally recognised and the most common statistical description of surface
roughness. It is the arithmetic mean of the departures of the profile from the mean line.
The principles of surface roughness measurements are discussed in more detail in
Appendix C. An evaluation length of 9.6mm was used throughout this investigation. A
Gaussian high pass filter with a cut-off wavelength of 0.8mm in conjunction with a
bandwidth of 300:1 were used in the calculation of Ra.

Chapter Three Experimental Procedure U\
3.5.8 Atomic Force Microscopy
Except for the samples DC plasma nitrided at high temperatures such as 500 and 550°C,
SEM examination of the surface of the other samples did not provide any clear or
informative images due to the low topographical features, see Figure 29. In order to
study the surface topography of the treated samples in more detail, a NanoScope®
Atomic Force Microscope (AFM), from Digital Instruments, was utilised in the contact
mode, see Figure 30. Briefly, in AFM a sharp tip mounted on the end of a cantilever
with a low spring constant, is brought close to the sample surface. Interactions between
the tip and sample deflect the cantilever. As the tip is scanned over the sample by a
piezoelectric scanner, a detector measures the cantilever deflection.
25 urn
I 1
Figure 29. SEM micrograph obtained from the surface of MAXIMA™ plasma nitrided
for 5h at 450 °C in 75%N2-25% H2 atmosphere.

Chapter Three Experimental Procedure 112
The measured cantilever deflections allow a computer to generate a map of the surface
topography and converts the data into an image (Howland R. S. et al, 1993). More
details of the technique and the instrument are presented in Appendix D.
Figure 30. The NanoScope® Atomic Force Microscope (AFM), from Digital
Instruments, at the University of Wollongong.

4. CHAPTER FOUR:
RESULTS
4.1 Introduction
After characterising the samples plasma nitrided in the 40 kW Klockner Ionnon industrial
scale unit at the University of Birmingham, it was realised that the samples were treated
at higher temperatures than those intended, especially at nominal 550°C.
The hardness of MAXIMA™ steel is strongly dependent on treatment temperature. At
550°C, the core hardness should be approximately 290 HV20, whereas the hardness of
the M A X I M A ™ sample after treatment was about 248 HV20, indicating a much higher
treatment temperature than the nominal 550°C.
The other observation which supports the fact that the treatment temperature was
actually higher than the intended temperature of 550°C, is the dark etching band in the
interface between the compound layer and the diffusion zone of both steels treated at
nominal 550°C, see Figure 31. This is believed to be the product of eutectoid
decomposition of y (nitrogen austenite) upon cooling from temperatures above the
eutectoid temperature (590°C) in the iron-nitrogen phase diagram, see Figure 1. It
should be stated that most alloying elements raise the eutectoid temperature in Fe-N
system. Nitriding at temperatures above the eutectoid initially results in nitrogen

Chapter Four Results \\4
saturation of ferrite and, when the limit of solid solubility is exceeded, y phase will form.
When y-phase is saturated, y' phase is formed at the surface, and finally, the s-phase
precipitates at higher nitrogen content. Thus the nitrided layer from the surface toward
the core consists of e + y' + y + a at the treatment temperature (Gulyaev, 1980). Slow
cooling in the chamber results in the decomposition of the 8 and a phases according to
the equilibrium diagram (Figure 1) and precipitation of surplus y' phase. Furthermore,
according to the following reaction, the y-phase undergoes a eutectoid decomposition
into a + y', manifested as the dark etching band shown in the micrographs of Figure 31.
y-Fe (N) —> a-Fe (N) + y'-Fe4N
Unfortunately, the exact cause of this over-heating could not be ascertained. Dirtiness,
or lack of calibration or misplacement of the thermocouple cannot be over-ruled. The
other factor which can be considered as the source of the overheating, is the
overshooting of the power supply due to a fault in the temperature controller or mis-
programming of it.
In order to make a reliable comparison between different nitriding processes and to gain
a better understanding of the nitrided layer formation and nitrogen mass transfer
mechanism in DC plasma nitriding, RF plasma nitriding and PI3, it was decided to repeat
the DC plasma nitriding treatments under more controlled conditions with a 5 kW
prototype unit.

Chapter Four Results 115
*Mx*y mmlk . ' , .
Al
^1 ^
<*<
(a)
.&«*
m **fe
(b)
< -,>y-y'---^.^^yy^
^-<&y.> " /• r •*..' " s.< fv» - 3 y
(c) (d)
25 um
Figure 51. 0/tfj'ca/ micrographs of cross-sections of MAXIMA™ ((a), (c)) and Enl9
((b), (d)) specimens plasma nitrided for 5 h at nominal 550 V using a 40 kW
commercial scale unit. Samples were etched in 2.5% nital ((a), (b)), and 2.5% nital
followed by Oberhoffer's, reagent ((c), (d)).
Chapter Four Results 116
The following section comprises two parts. Part I presents the results of a series of DC
plasma nitriding treatments carried out using the prototype unit to find the optimum gas
composition for nitriding of MAXIMA™. In part II, the results of DC plasma nitriding
of MAXIMA™ and En 19 steels in conjunction with those obtained from PI3 and RF
plasma nitriding of MAXIMA™ are reported.
4.2 Part I: Effect of Hydrogen Content on DC Plasma
Nitriding of MAXIMA™
4.2.1 Microstructural Examination
Typical images obtained by SEM from the cross section of the nitrided samples are
shown in Figure 32. The morphology of the compound layers developed on the surface
of the samples treated under the various conditions were almost similar to each other,
except for the thickness of the layers. The differences in the thickness of the compound
layers are clearly seen in these micrographs. Samples treated in 75%N2-25%H2
developed the thickest compound layer whereas treatment in 25%N2-75%H2 atmosphere
produced the thinnest compound layer. The actual values for the thickness of layers are
shown in Figure 33. In all samples, the iron nitride at the interface of the compound
layer with the diffusion zone has grown in an acicular morphology towards the core.

Chapter Four Results 117
(c)
y\ IS
4um
• \
Figure 32. SEM micrograph showing the compound layer formed on the surface of
MAXIMA™ plasma nitrided for 5h at 450°C in atmospheres containing (a) 100% N2,
(b) 75%N2-25% H2, (c) 50%N2-50% H2, and (d) 25%Nr75% H2. The samples were
etched in 2.5% nital followed by Oberhoffer's reagent.

Chapter Four Results 118
i \
.,:':'..•.•:':.::'./•.:.•.'.:•. .-.-i: •• '.••.-..•••.. •• :-f ,• •:.,,:....•.:.:,...
25 50
% Hydrogen
75
—r4
3 E
-a c o Q-
E o U
Figure 33. The effect of hydrogen concentration of the treatment atmosphere on the
compound layer thickness formed on the surface of the treated MAXIMA™ samples.
4.2.2 X-ray Diffraction
X-ray diffraction patterns of the samples are displayed in Figure 34. Treatment in 100%
nitrogen atmosphere (0% H2) resulted in the formation of a dual phase (e-h*') compound
layer composed mainly of 8 iron nitride. Increasing the hydrogen concentration of the
treatment atmosphere resulted in a decrease in the s phase and corresponding increase in
y' phase. Treatment in 25%N2-75%H2 produced a predominantly y' compound layer.
Furthermore, for this sample the intensity of the oc-iron peak was increased, indicating a
reduction in the thickness of compound layer.

Chapter Four Results
d
d
1C0W
e
1 1 1 1 | T
y/e
a
e Y
i i i , i i
75%N2-25%H>
a e y/e
_ JV 7V__ — i — i 1 1 — i - i 1 1-1 1 1-1 1 r-
Y
- 1 — i — i — i — i —
on
d
50W-50P/fffc
8
a
y/e V
— i — i — i — i — i — i — i — i — i — | — i — i — i — i — 1 | — i — i — i — i —
25%N2-75%ft
8 y/e
a
k Y
,
40 45 50 55
Twatheta, degree
60
Figure 34. X- ray diffraction patterns of the MAXIMA™ samples DC plasma
at 450 °C for 5hrs at various N2+H2 gas mixtures.

Chapter Four Results 720
4.2.3 Glow Discharge Optical Emission Spectroscopy
Figure 35 illustrate the nitrogen and carbon depth profiles obtained by GDOES. Samples
treated in a 100% nitrogen atmosphere showed the highest nitrogen content in the
compound layer whereas treatment in 25%N2-75%H2 atmosphere resulted in the
formation of a compound layer with the least nitrogen content. The GDOES depth
profiles of the sample treated in 75%N2-25%H2 was similar to that of the sample treated
in 50%N2-50%H2, except for the extend of the nitrogen profile which was deeper for the
former, indicating a thicker compound layer. A trend was observed between the nitrogen
and carbon concentration in the compound layer. Generally, higher nitrogen level in the
layer was accompanied by a decrease in the carbon concentration and vice versa. There
is also evidence of carbon being pushed out of the compound layer, appearing as a hump
in carbon profile at the interface with the diffusion zone.
4.2.4 Hardness Tests
Surface hardnesses at different loads for the samples treated in different atmospheres are
shown in Figure 36. The core hardness of the samples is also indicated in this Figure.
The sample treated in 75%N2-25%H2 atmosphere showed the highest surface hardness at
all loads whereas samples treated in 100%N2 gas developed the least hard surface.
Treatment in 50%N2-50%H2 and 25%N2-75%H2 gave fairly similar surface hardnesses
which lie between the results obtained from treatments in the atmospheres of 75% N2-
25% H2 and 100%N2. Hardness profiles were also obtained from the cross-section of
the samples to evaluate the microhardness distribution across the treated cases, see
Figure 37. The results are consistent with the hardness profiles obtained from the
surface hardness at different loads described above.

Chapter Four Results 121
(a)
(b)
(c)
(d)
.y
u
z
100
50 -
^^^SC^X^Cy^CC^
50 100 150
Sputtering time, sec.
yy
100
50
50 100 150 Sputtering time, sec.
1 U
yy
100
50
50 100 150 Sputtering time, sec.
100
50 - N
200
200
200
250
250
250
/im," H * V M **ot*G>*G2x£££CZZZyyZ~+*-
50 100 150 Sputtering time, sec.
200 250
Figure 35. GDOES depth profiles for MAXIMA™ steel DC plasma nitrided at 450 °C
in (a) 100% N2, (b) 75% N2 - 25% H2, (c) 50% N2 - 50% H2, and (d) 25% N2 - 75% H2.

Chapter Four Results 122
C« C/3
H c-3
X
100%N2
75%N2-25%H2
50%N2-50%H2
25%N2-75%H2
n 1 1 1 r
0 25 50 100 300 500 1000 Core
Load, gram
Figure 36. Surface hardness at different loads for samples DC plasma nitrided at
450 °Cfor 5 hours in atmospheres with different hydrogen concentrations.
c d
C« CA CJ
c -o
0 100
100%N2
75%N2-25%H2
50%N2-50%H2
25%N2-75%H2
200 300 400
Distance from surface, um
Figure 37. The effect of hydrogen concentration in the treatment atmosphere on the
hardness profile of the samples DC plasma nitrided at 450 °Cfor 5 hours.

Chapter Four Results 72J
4.2.5 Surface Topography
The surface roughness of the samples is illustrated in Figure 38. Samples treated in a
100% N2 atmosphere showed the highest level of surface roughening whereas other gas
compositions developed surfaces with lower surface roughness values.
This trend of surface roughness was also confirmed by Atomic Force Mcroscopy (AFM)
examination of the treated samples, Figures 39 and 40. Nitriding in a 100% nitrogen
atmosphere resulted in a surface with an irregular morphology with maximum sputtering
effect. Small needle-shaped features superimposed on larger undulations, Figure 39-a,
are also visible. The surface roughness of the sample treated in 75%N2-25%H2 (Figure
39-b) was decreased substantially and its morphology was completely different from that
treated in 100%N2. The grain boundaries were highlighted and the sample was covered
with very fine and uniform nodular particles, superimposed on larger wavelength
undulations. The morphology of the sample treated in 50%N2-50%H2 (Figure 39-c) was
a combination of those treated in 75% N2 and 25% N2 (rest H2), fine nodular particles
superimposed on irregularities. The surface of the sample treated in 25%N2-75%H2
showed large irregularities again, see Figure 39-d.

Chapter Four Results 124
Polished
% Hydrogen
s
Figure 38. The effect of hydrogen concentration in the nitriding atmosphere on the
surface roughness of MAXIMA™ samples expressed as Ra.

Chapter Four Results 125
(a)
(b)
Figure 39. AFM image of plasma nitrided surfaces treated at 450 °C for 5 hours at
atmospheres containing different Hr-N2 gas mixtures, (a) 100%N2, (b) 75%N2-25%H2.
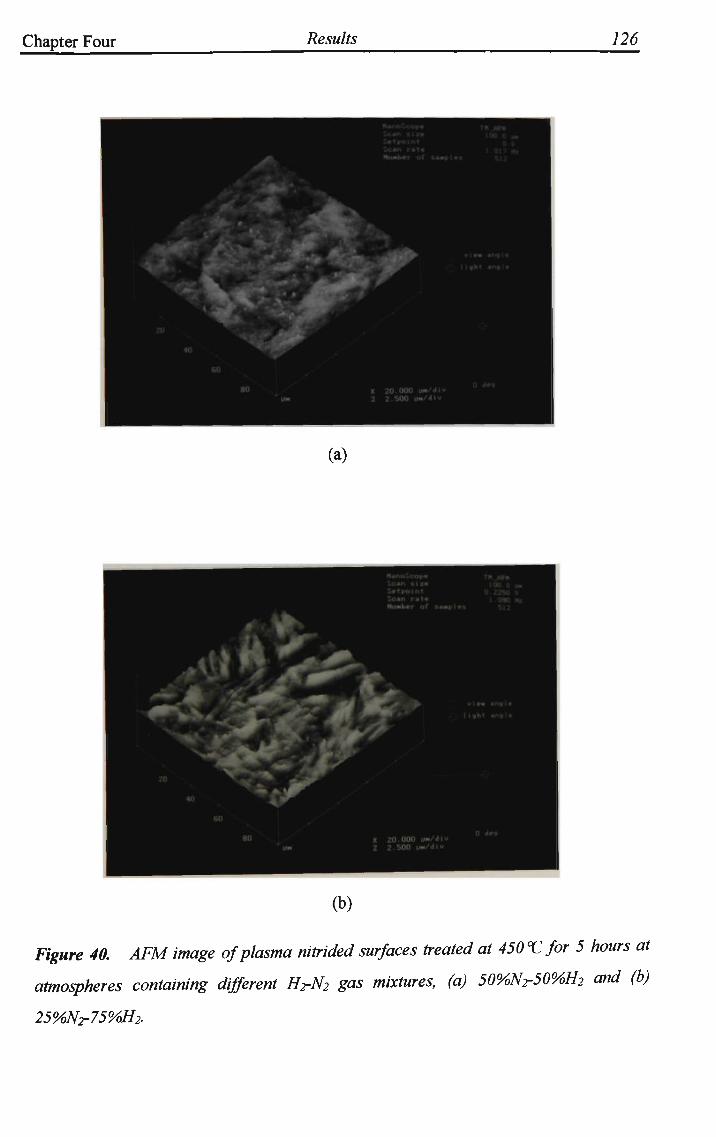
Chapter Four Results 126
(a)
(b)
Figure 40. AFM image of plasma nitrided surfaces treated at 450 °C for 5 hours at
atmospheres containing different HrN2 gas mixtures, (a) 50%N2-50%H2 and (b)
25%N2-75%H2.

Chapter Four Results 127
4.3 Part II: D C Plasma Nitriding, RF Plasma Nitriding
and Pl3
4.3.1 Microstructural Examination
4.3.1.1 DC Plasma Nitriding
Typical microstructures obtained from the MAXIMA™ and Enl9 samples treated at
450°C in a 75%N2-25%H2 atmosphere are displayed in Figure 41. The compound layers
or so called white layers, are clearly highlighted after etching with nital (Figure 41-a,b).
Oberhoffer's reagent attacks different constituents of the compound layer differently and
distinguishes them, see Figure 41-c,d, showing duo-phase compound layer.
SEM micrographs obtained from the MAXIMA™ and En 19 samples DC plasma nitrided
in a 75%N2-25%H2 atmosphere at 350, 450 and 550°C are displayed in Figures 42-44,
respectively. The increase in thickness of these layers as a function of treatment
temperature is illustrated. A distinct difference is observable between the morphology of
the compound layer formed on the MAXIMA™ and En 19 specimens plasma nitrided
under identical conditions. The compound layer on MAXIMA™ is uneven and in some
areas in the interface of compound layer and the diffusion zone has grown with an
acicular morphology towards the core. In the case of En 19 a more uniform layer with a
sharp interface with the diffusion zone was formed.
At some points along the interface, the compound layer is extended into the grain
boundaries for both steels. Iron (carbo)nitrides are preferentially precipitated at the grain

Chapter Four Results 128
boundaries parallel to the outer surface, since the material is free to expand perpendicular
to the surface, Figure 43. For both steels some pores and cracks were also evident in the
compound layer of the samples treated at high nitriding temperature of 550°C.
Increasing the nitriding temperature gives rise to an increase in compound layer thickness
for both MAXIMA™ and Enl9 steels, Figure 45. At all temperatures, the compound
layer formed on the surface of the Enl9 samples were thicker than those formed on the
MAXIMA™.

Chapter Four Results 129
(a) (b)
:
mMm? yjt?T£ &^:*^y-rr
(c)
'•4
JS
!r3^2','SI M^?,< >/XiS3
PIP^I tjjrTmu'Ol
\ ^$39$
*W*^Is |e\ ">**hy vSari •̂""V • •r JVil
SSt^^^B?
%3(^3bd^Si^SSs SSKSyiy^tiS
KMH •** »'^—S^3cJBTLT
p R v '"vvlBPVs fW9
^mby%&
KT^Mfl
'".J1 f 7 i-***?
i^AjjprJvf->Jtt* v f L R
#^A3C
SJj 5̂ 5 3w*
K#* • . *• * v -
*?Bi'i
^^w-^i
^jjf+*
TOV* VSB£$& >
:-'^ '
(d)
h 20um
Figure 41. Optical micrographs of cross-sections of MAXIMA™ ((a), (c)) and En 19
((b), (d)) specimens plasma nitrided in 75%N2 - 25%H2 for 5 h at 450 °C and etched in
2.5% nital ((a), (b)), and 2.5% nital followed by Oberhoffer's reagent ((c), (d)).

Chapter Four Results 130
(a)
(b)
4um
Figure 42. SEM micrographs of cross-sections of (a) MAXIMA™ and (b) Enl9
specimens plasma nitrided in 75%N2 - 25%H2for 5 hours at 350 °C and etched in 2.5%
nital followed by Oberhoffer's reagent.

Chapter Four Results 131
(a)
(b)
4um
I 1
Figure 43. SEM micrographs of cross-sections of (a) MAXIMA™ and (b) Enl9
specimens plasma nitrided in 75%N2 - 25%H2 for 5 hours at 450 °C and etched in 2.5%
nital followed by Oberhoffer's reagent.
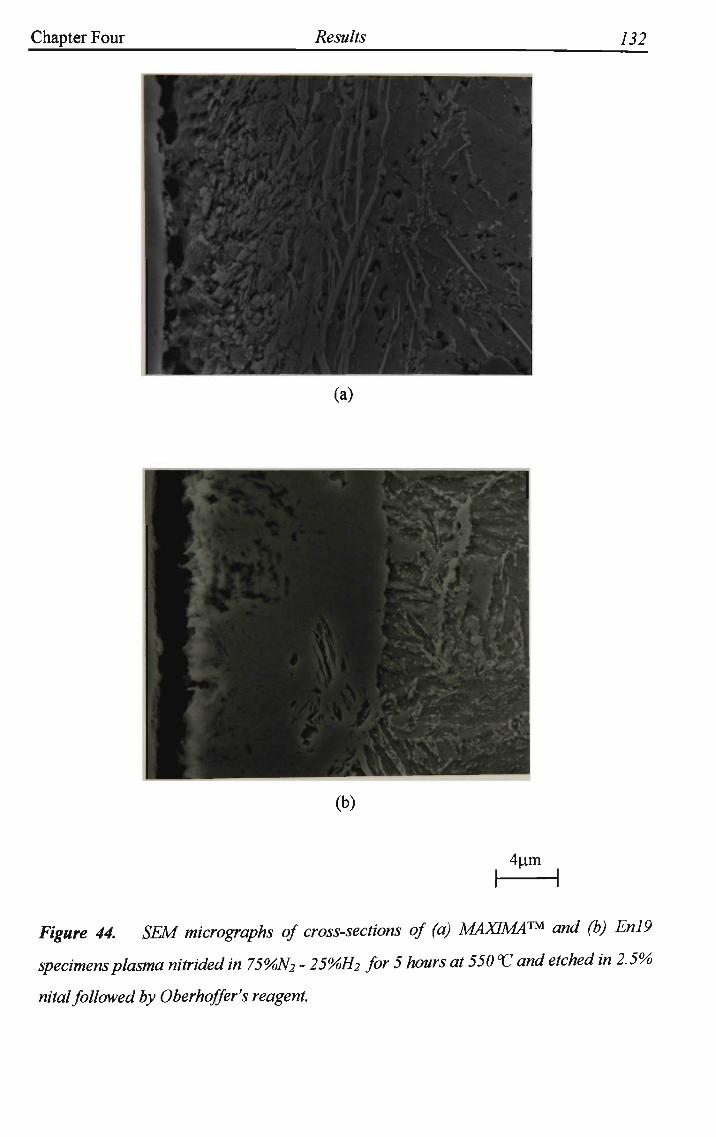
Chapter Four Results 132
(a)
(b)
4um
Figure 44. SEM micrographs of cross-sections of (a) MAXIMA™ and (b) Enl9
specimens plasma nitrided in 75%N2 - 25%H2 for 5 hours at 550 °C and etched in 2.5%
nital followed by Oberhoffer's reagent.

Chapter Four Results 133
Figure 45. Comparison of the thickness of the compound layers formed on the
surfaces of both steel DC plasma nitrided under similar conditions.
4.3.1.2 RF Plasma Nitriding and PI3
No compound layer was observed on MAXIMA™ after PI3 and RF plasma nitriding in a
75%N 2 - 2 5 % H 2 atmosphere at 350 °C, see Figure 46-a,b. The extent of nitrogen
diffusion as revealed by etching with Marbles reagent was found to be deeper for the
sample treated by PI3 process.
SEM micrographs presented in Figures 47 and 48, show that for both processes,
treatments at 350°C developed some iron nitride (y') platelets in some surface areas
which are extended towards the core of the samples, see Figures 47-a and 48-a.
Nevertheless, R F plasma nitriding produced more surface iron nitride platelets than the
PI3 process. It should be noted that the nitrides are not continuous and do not form
compound layer. Samples treated at higher temperatures by both treatments did not
show any evidence of surface iron nitride formation, see Figures 47-b,c and 48-b,c.

Chapter Four Results 134
(a)
(b)
50um
Figure 46. Typical microstructures obtained from the transverse cross-section of
MAXIMA™ steel (a) PI3 and (b) RF plasma nitrided in 75%N2 - 25%H2 at 350 °Cfor 5
hours. Marbles etchant.

Chapter Four Results 135
(a)
(b)
(c)
r 4um
Figure 47. SEM micrographs of cross-sections of MAXIMA™ steel PI3 treated in
75%N2 - 25%H2 for 5 hours at (a) 350, (b) 450, and (c) 550V. The samples were
etched in 2.5% nital followed by Oberhoffer's reagent.

Chapter Four Results 136
S ^ '• • \'-yA-
r.C
(a)
(b)
(c)
Nfc ^
*y'S V.
\ v \ - -' 5 1
- f
4 i
%
m
4um
Figure 48. SEM micrographs of cross-sections of MAXIMA™ steel RF plasma
nitrided in 75%N2 - 25%H2for 5 hours at (a) 350, (b) 450, and (c) 550 V. The samples
were etched in 2.5% nital followed by Oberhoffer's reagent.

Chapter Four Results 137
4.3.2 X-ray Diffraction
4.3.2.1 DC Plasma Nitriding
The x-ray diffraction patterns obtained from the as polished MAXIMA™ and En 19
samples before plasma nitriding are shown in Figure 49. A small peak attributable to
(austenite) yzoo phase was found in the M A X I M A ™ sample which could not be detected
in the En 19 sample.
Figure 50 shows typical x-ray diffraction patterns of the M A X I M A ™ samples after D C
plasma nitriding treatment at 350, 450 and 550°C. The austenite phase (y), described
above, has disappeared, indicating the decomposition of the austenite to ferrite and
cementite at these treatment temperatures. Reflections from e and y' nitrides in the
compound layer can be observed as well as reflections from underlaying a iron matrix.
s
MAXIMA™
— i — i — I — i — I — i — i — r ll
— i — i — i — r
I
— i — i — i — i — i — i — i —
55 60
Two theta, degrees
Figure 49. X-ray diffraction patterns of the MAXIMA™ and Enl9 samples in the as
polished condition.

Chapter Four Results 138
1/3
8
CA
ts OJ
350 °C
e
1 1 1 1 IJ ' T
y/e
• > • • ' - ' — i — r
a
A - i — i — i —
y
• i| i i
450°C
e
i i i ii
y/e
— 1 — 1 — 1 — 1
a y
cfl
C cu
550 °C
e
A i '
y/e
A i i i
e a y
A II i i i i
40 45 50 55
Two theta, degree
60
Figure 50. X-ray diffraction patterns of the MAXIMA™ samples DC plasma nitrided
in 75%N2 - 25%H2 for 5 hours at various temperatures indicated.

Chapter Four Results
1
1
1
450 °C
y/e
eoc
A i i i i i
y
I ; i
40 45 50 55
Two theta, degree
60
Figure 51. X-ray diffraction patterns of the Enl9 samples DC plasma
75%N2 - 25%H2 for 5 hours at various temperatures indicated.

Chapter Four Results 140
The sample treated at 350°C shows traces of 8 and y* iron nitride peaks and a reduction
in a-Fe peak intensity. With increasing the nitriding temperature the intensity of the
diffraction peaks of 8 and y' phases increased and the intensity of the a-Fe phase
decreased while its width increased and shifted to lower angles. This apparent shift may
simply be due to overlapping with s peak. Diffraction patterns obtained from the En 19
samples nitrided at 350, 450 and 550°C are illustrated in Figure 51. As in MAXIMA™
samples, the e phase was detected with y' nitride in all samples, with their peaks intensity
increasing with increasing treatment temperature indicating the formation of a thicker
compound layer. The intensity of the a-iron peak is again reduced, widened and shifted
to lower 20 angles with increasing treatment temperature.
4.3.2.2 RF Plasma Nitriding and PI3
X-ray diffraction failed to show any evidence of compound layer formation on PI3 or RF
plasma nitrided samples. A more detailed analysis of the surfaces of the RF plasma
nitrided and PI3 treated samples was undertaken using the glancing angle X-ray
diffraction technique. Except for the RF plasma nitrided sample treated at 350°C, shown
in Figure 52, no iron nitride peaks were detected on the remainder of the samples.
Although peaks of y' iron nitride were identified in the RF plasma nitrided sample treated
at 350°C, the SEM micrograph (Figure 48-a) show that the y' phase was not continuous
and was in the form of isolated plates which formed on the surface and grew towards the
core of the sample in preferential orientations.

Chapter Four Results 141
(a)
Intensity
i — i —
40
a
J 45 50
Two theta, degree
i 1 1 r-
55
1 I
60
(b)
Figure 52. Glancing angle X-ray diffraction pattern of (a) PI3, (b) RF plasma nitrided
samples treated at 350 °C. Co Ka radiation, 1 ° incident angle and 10 sec/step of 0.1 °.
4.3.3 Glow Discharge Optical Emission Spectroscopy
4.3.3.1 D C Plasma Nitriding
The qualitative G D O E S profiles for carbon and nitrogen are illustrated in Figure 53 for
M A X I M A ™ steel and Figure 54 for Enl9 steel. The sputtering rate was measured to be
approximately 0.04um/sec for M A X I M A ™ and Enl9 samples. The trend of the profiles
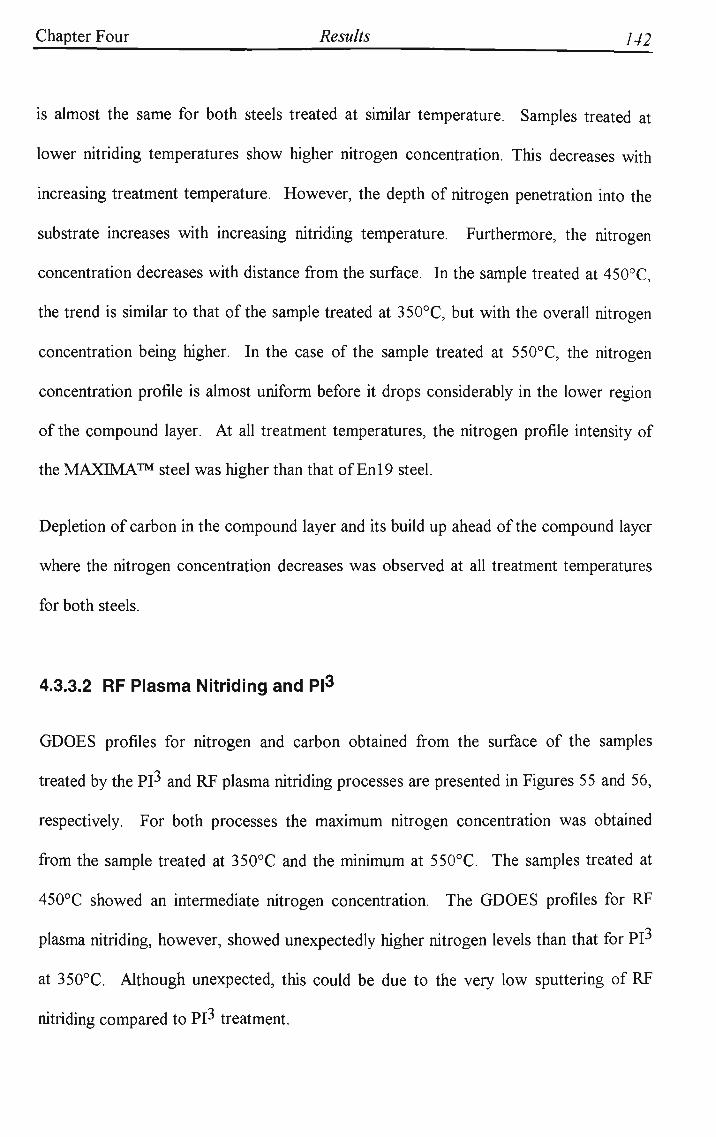
Chapter Four Results 142
is almost the same for both steels treated at similar temperature. Samples treated at
lower nitriding temperatures show higher nitrogen concentration. This decreases with
increasing treatment temperature. However, the depth of nitrogen penetration into the
substrate increases with increasing nitriding temperature. Furthermore, the nitrogen
concentration decreases with distance from the surface. In the sample treated at 450°C,
the trend is similar to that of the sample treated at 350°C, but with the overall nitrogen
concentration being higher. In the case of the sample treated at 550°C, the nitrogen
concentration profile is almost uniform before it drops considerably in the lower region
of the compound layer. At all treatment temperatures, the nitrogen profile intensity of
the MAXIMA™ steel was higher than that of Enl9 steel.
Depletion of carbon in the compound layer and its build up ahead of the compound layer
where the nitrogen concentration decreases was observed at all treatment temperatures
for both steels.
4.3.3.2 RF Plasma Nitriding and PI3
GDOES profiles for nitrogen and carbon obtained from the surface of the samples
treated by the PI3 and RF plasma nitriding processes are presented in Figures 55 and 56,
respectively. For both processes the maximum nitrogen concentration was obtained
from the sample treated at 350°C and the minimum at 550°C. The samples treated at
450°C showed an intermediate nitrogen concentration. The GDOES profiles for RF
plasma nitriding, however, showed unexpectedly higher nitrogen levels than that for PP
at 350°C. Although unexpected, this could be due to the very low sputtering of RF
nitriding compared to PI3 treatment.

Chapter Four Results 143
Figure 53. GDOES depth profile for MAXIMA™ steel DC plasma nitrided at (a) 350,
(b) 450, and (c) 550°C

Chapter Four Results 144
(a)
0
~\ 1 1 1 r
50 100 150 Sputtering time, sec.
200
(b)
(c)
Figure 54. GDOES depth profile for Enl9 steel DC plasma nitrided at (a) 350, (b)
450, and (c) 550°C
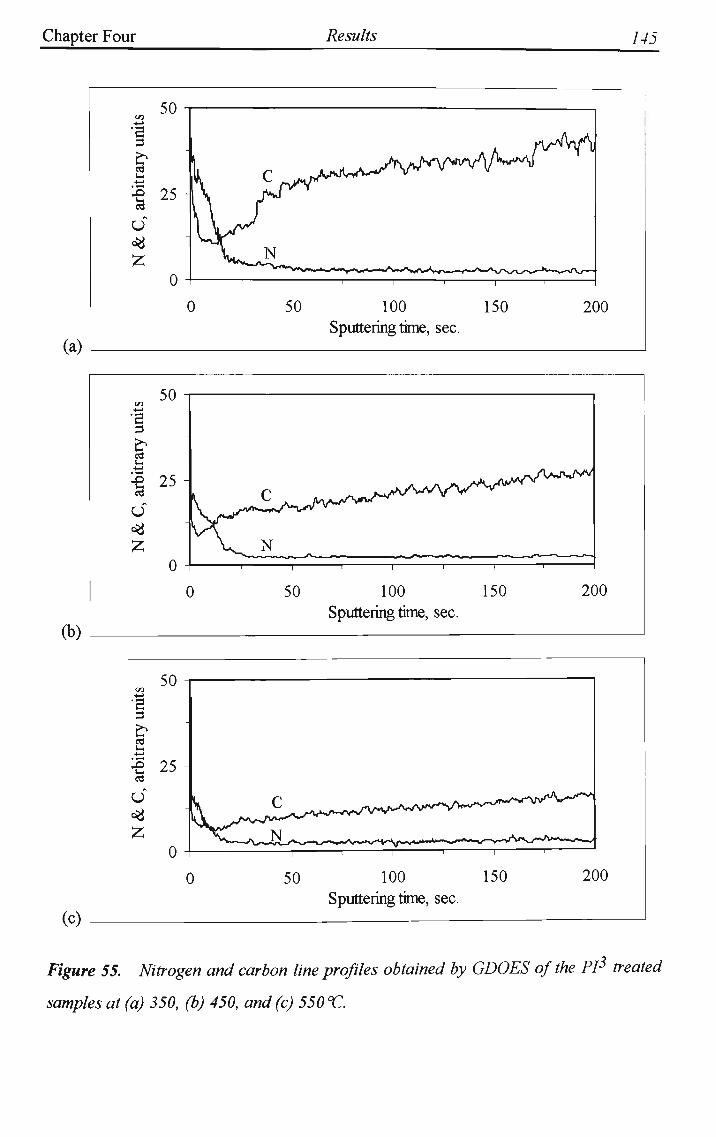
Chapter Four Results 145
(a)
(b)
(c)
C/3 y>
•a 3
£ y,
I 25-u ^
Z 0 J
k C .v*yAMU'^^
H^N i i i i i i J
0 50 100 150 Sputtering time, sec.
200
50 -i c/a
*a
t-i
•e 25 -
u <%
o -(
V c ^
V^ N i i
) 50
1 | -r-
100 Sputtering time, sec.
— i — -
150 200
ttrary units o
i i
•e 25 -e3 u
z o -1
(
\ t / v ^ ^/ , / l ^ v ^
**i~—S\*yJ2Ls>y*r~ T- 1
) 50
< V w W W - A ^ r W W
i i i
100
Sputtering time, sec.
^^i^-^r^rv
150
*\s~*~~*
200
Figure 55. Nitrogen and carbon line profiles obtained by GDOES of the PI3 treated
samples at (a) 350, (b) 450, and (c) 550 °C.
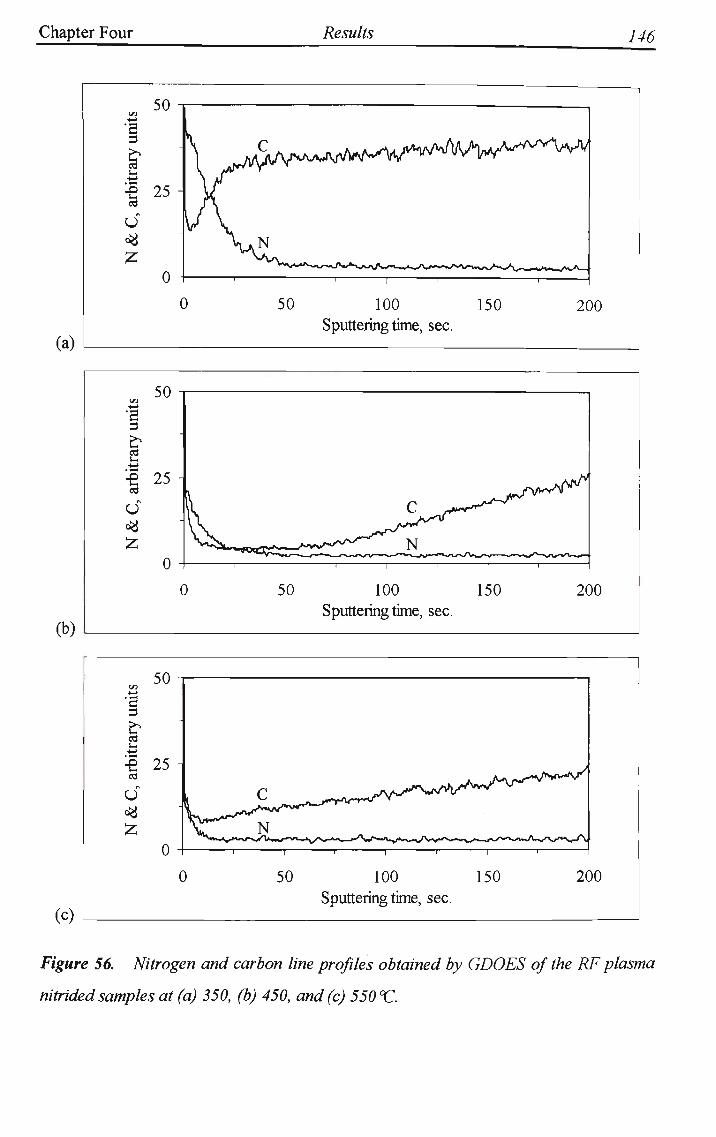
Chapter Four Results 146
(a)
50 100 150 Sputtering time, sec.
200
50 -i
"I 3
arbitrary
ts) 1
'
#
£ o 4
c
\
v̂
vv ^ ^ - ^ « « i ^ c ^ :
i i
) 50
C^^r"~ ^ ^ ^
w s ^ ^ N i 1 i
100 Sputtering time, sec.
*sv ^ ^ ^
1
150
^y
200
(b)
(c)
Figure 56. Nitrogen and carbon line profiles obtained by GDOES of the RF plasma
nitrided samples at (a) 350, (b) 450, and(c) 550 V.

Chapter Four Results 147
4.3.4 Hardness Tests
4.3.4.1 DC Plasma Nitriding
Figures 57 and 58 display the hardness profiles of the samples nitrided at different
temperatures ranging from 350 to 550°C for MAXIMA™ and Enl9 steels, respectively.
Samples treated at lower temperatures developed steep hardness profiles, while at higher
nitriding temperatures a more gradual hardness profile was developed.
The peak hardness achieved by MAXIMA™ at all treatment temperatures was higher
than that of Enl9. MAXIMA™ exhibited a sharper case/core interface while Enl9
showed a smoother transition from the nitrided case to the core. The transition from
case to core for MAXIMA™ after 550°C treatment was not smooth and a hump in the
profile was observed. The hardness levels at any depth within the case were generally
lower for En 19.
The case depths have been determined from the graphs of micro-hardness vs depth
(Figures 57 and 58). Figure 59 shows the general trend in case depth variation measured
against plasma nitriding temperature for both steels. It can clearly be seen that the
nitrided case depth increases with increasing nitriding temperatures.
The core hardness values of the samples after plasma nitriding at different temperatures
are presented in Table 6.

Chapter Four Results 148
m o d
co CO
<D
-S s
1200 -1
1000 -
800 -
600 -
400 -
200 -
0 -
—0—350 °C
—6—400 °C
-o-450°C
-D-500°C
—*— 550 °C
i i i i i i i
0 200 400 600 800
Distance from surface, pm
Figure 57. Hardness profiles of MAXIMA™1 steel DC plasma nitrided at different
temperatures.
o d
to co
a T3 & X
1200 -
1000 -I
800 -
600 -
400 -
200 -
l) i
(
— 0 — 350 °C
- & — 400 °C
- O — 450 °C
- D — 500 °C
—0—550 °C
-©
i i i i i i i
) 200 400 600 800
Distance from surface, pm
Figure 58. Hardness profiles of EnI9 steel DC plasma nitrided at different
temperatures.

Chapter Four Results
EN19 MAXIMA™
300 400 500 600
Temperature, °C
Figure 59. Case depth of the samples DC plasma nitrided at different temperatures for
5 hours.
Table 6. Core hardness values obtained from the samples after DC plasma nitriding
treatments.
Steel
MAXIMA™ Enl9
350 348 349
Hardness,
After treatment
Temperature, °C
400 450 500
345 343 328
346 345 340
HV20
550 293 319
Before treatment
366 340
Figure 60 shows the variation in core hardness values as well as the peak hardness, of the
samples plasma nitrided at different temperatures. In the case of MAXIMA™ steel,
samples plasma nitrided at lower temperatures, ranging from 350 to 450°C, show a slight
reduction in core hardness, while those treated at higher temperatures, indicate a higher
degree of softening which was more pronounced for the sample treated at 550°C. There
was not any discernible softening for Enl9 samples plasma nitrided at 350-500°C
S
<D T3 CD CO
u

Chapter Four Results 150
temperatures. A slight reduction in core hardness was observed for the 550°C treatment
temperature.
Comparison of peak hardness curves of MAXIMA™ and En 19 steels reveals that the
trend is the same for both steels, see Figure 60. The highest peak hardness with no
significant reduction to the core strength was achieved at 450°C for both steels.
co CO
O tS T3 i-«j
X
Temperature, °C
•O---MAXVcore,HV20
-O---EN19/core,HV20
-0 MAX/case,HV0.05
-O EN19/case,HV0.05
Figure 60. The peak hardness and the core hardness of the samples after DC plasma
nitriding at different temperatures. Note the hardness of the samples before treatment.
4.3.4.2 RF Plasma Nitriding and PI3
Surface hardness at different loads for PI3 and R F plasma nitriding treatments at 350,
450 and 550°C are presented in Figure 61. The core hardnesses (HV20) after each
treatment are also included.

Chapter Four Results 151
(a)
CO CO <D CS T3 u
1200
1000 -
800
600
400
200 T 1 1 1 1 r
0 25 50 100 300 500 1000 Core
Load, gram
(b)
co CO
<U CS
X
1200
1000
800
600 -
400 -
200
0
8**-*-*=-̂ •350°C
•450°C
• 550 °C
HV20 *- l
25
—1 1 1 1 1
50 100 300 500 1000 Core
Load, gram
Figure 61. Surface hardness at different loads for (a) PI3 and (b) RF plasma nitrided
samples.

Chapter Four Results 152
o d
CO CO
<D CS
(a)
400
Distance from surface, pm
(b)
o d
CO CO
<D CS
X
1200
1000
800
600
400
200
0
0 100 200
I - ^ ^ - ^
—0—350 °C
- 6 — 400 °C
- o — 450 °C
-n— 500 °C
—0—550 °C
1 1 1 1 r i
300 400
Distance from surface, jum
Figure 62. Hardness profiles of (a) PI3 and (b) RF plasma nitrided samples at
different temperatures for 5 hours.

Chapter Four Results 153
Since the depth of penetration increases by increasing the indentation load, and the
measured hardness is affected by material up to 10 times the indent depth, a judgement
as to the case depth should be possible from the trend of hardness with increasing load.
Figure 62 illustrates the hardness profiles after PI3 and RF plasma nitriding which are
consistent with the surface hardness measurements seen in Figure 61. The samples
treated at 400°C developed cases with maximum hardness, whereas samples treated at
550°C showed the minimum surface hardness, see Figure 63. From the hardness
profiles, increasing treatment temperature increased case depth and decreased surface
hardness.
co co 4)
ts
I
« 2
Temperature, °C
- 0 — PI3/core,HV20
-O— RF/core,HV20
-•—PI3/case, HV0.05
-•—RF/case,HV0.05
Figure 63. The peak surface hardness developed on the samples treated at
temperatures ranging from 350 to 550C°by the PI3 and RF plasma nitriding processes.

Chapter Four Results 154
4.3.5 Appearance of the Treated Samples
4.3.5.1 DC Plasma Nitriding
After DC plasma nitriding all the samples treated at different temperatures displayed a
greyish (dark) ring parallel to their edge, see Figure 64. The degree of the darkening was
dependent upon the treatment temperature; the higher the temperature the darker the
ring.
Figure 64. Surface appearance of MAXIMA™ sample DC plasma nitrided at 550 °C
Note the dark ring parallel to the edge of the sample.
4.3.5.2 RF Plasma Nitriding and PI3
After RF plasma nitriding, except for the sample treated at 350°C, no noticeable change
in the appearance of samples was observed and the samples were still shiny (similar to

Chapter Four Results 155
their as polished condition). The sample treated at 350°C, however, had lost its
reflectivity and was slightly grey in colour.
Samples treated by the PI3 displayed some changes in reflectivity, especially the sample
treated at 350°C which showed the most darkening compared to those treated at higher
temperatures.
Unlike the DC plasma nitrided sample, no dark ring was formed on the surface of the
samples treated by RF plasma nitriding and PI3 processes.
4.3.6 Surface Topography
4.3.6.1 DC Plasma Nitriding
Definite trends in the surface roughness as a function of the treatment temperatures were
evident for both steels, see Figure 65. Minimum roughening occurred at 350°C
treatment temperature, while 550°C temperature resulted in the roughest surface.
Generally speaking, increasing the treatment temperature increased the roughness of the
surface. Comparison of the two steels treated under identical conditions revealed that
the surface roughness of MAXIMA™ samples was greater than that of the En 19
samples.
AFM images of MAXIMA™ and Enl9 samples nitrided at 350, 450 and 550°C are
displayed in Figures 66-68. As the treatment temperature increased, the surface
morphology changed and the nodular particles deposited on the surface of the steels
became larger in size.
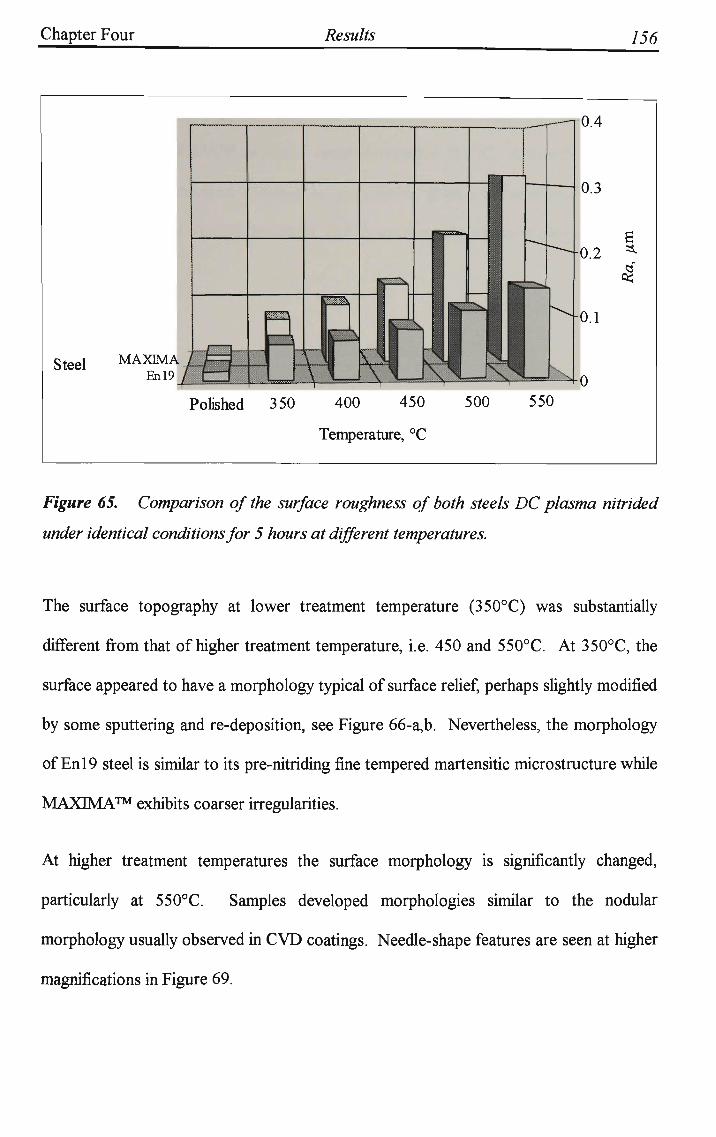
Chapter Four Results 156
Steel MAXIM^ Enl9
j ~\
Polished 350 400 450
Temperature, °C
500
0.4
0.3
550
Figure 65. Comparison of the surface roughness of both steels DC plasma nitrided
under identical conditions for 5 hours at different temperatures.
The surface topography at lower treatment temperature (350°C) was substantially
different from that of higher treatment temperature, i.e. 450 and 550°C. At 350°C, the
surface appeared to have a morphology typical of surface relief, perhaps slightly modified
by some sputtering and re-deposition, see Figure 66-a,b. Nevertheless, the morphology
of En 19 steel is similar to its pre-nitriding fine tempered martensitic microstructure while
M A X I M A ™ exhibits coarser irregularities.
At higher treatment temperatures the surface morphology is significantly changed,
particularly at 550°C. Samples developed morphologies similar to the nodular
morphology usually observed in C V D coatings. Needle-shape features are seen at higher
magnifications in Figure 69.

Chapter Four Results 157
S E M micrographs in Figures 70 and 71 clearly show the difference in the surface
topography of MAXIMA™ and Enl9 samples treated at 550 °C. Although, the surface
of both steels was covered with nodular precipitates, grain boundaries in MAXIMA™
were also delineated which is consistent with its microstructure prior to nitriding.

Chapter Four Results 158
(a)
(b)
Figure 66. AFM images from the surface of (a) MAXIMA™ and (b) En 19 samples DC
plasma nitrided at 350 °C.

Chapter Four Results 159
(a)
(b)
Figure 67. AFM images from the surface of (a) MAXIMA™- and (b) Enl9 samples DC
plasma nitrided at 450 °C.

Chapter Four Results 160
(a)
(b)
Figure 68. AFM images from the surface of (a) MAXIMA™ and (b) Enl9 samples DC
plasma nitrided at 550 °C.

Chapter Four Results 161
Ik
HartoScop. .. i f (
Sc*n llH 25 00 _ S.«point 1 275 T 5 " " r , t ! 1 W 7 H, NuMlxr of u a r l n 512
L ^ j j i & j ^ " W^f view Anfli
lHht amlt
20 jS 0 4m%
' M" 2 2!500 um/iiv
(a)
(b)
Figure tf9. ylFM images from the surface of (a) MAXIMA™ and (b) Enl9 samples DC
plasma nitrided at 550 °C at higher horizontal magnification. Note the nodular
morphology of the deposited iron nitrides resembling the morphology of the CVD
coatings.
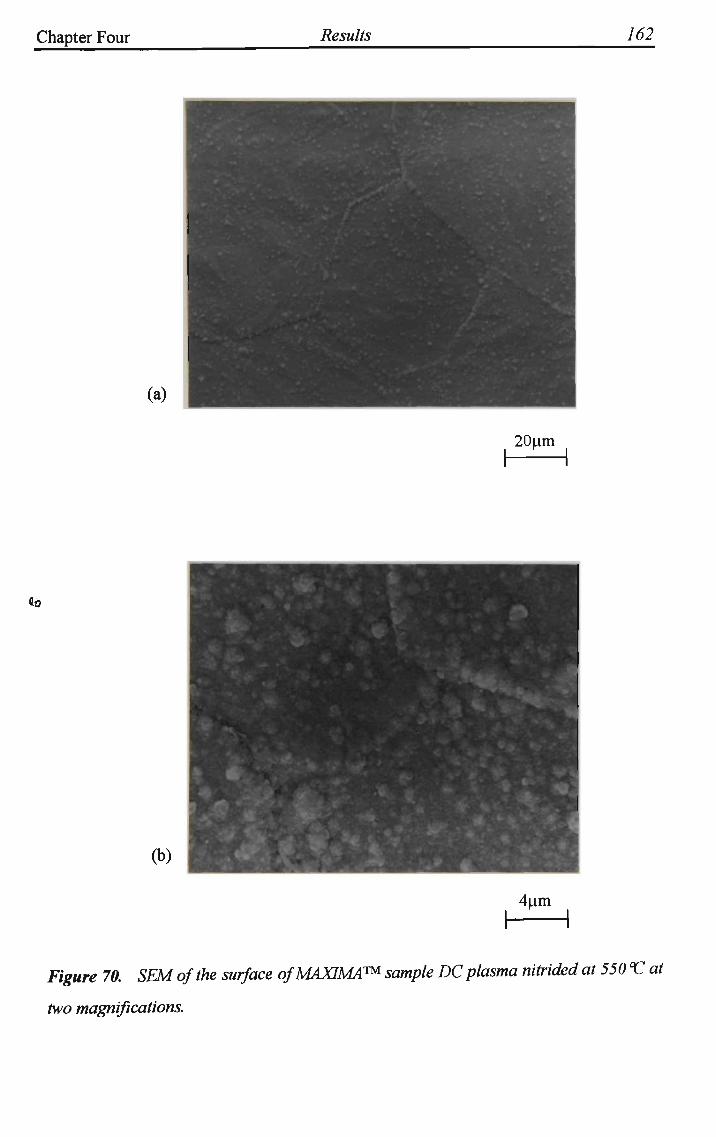
Chapter Four Results 162
(a)
20um
I 1
fi.ij
(b)
4pm
• \
Figure 70. SEM of the surface of MAXIMA™ sample DC plasma nitrided at 550"C at
two magnifications.

Chapter Four Results 163
(a)
20pm
(b)
4pm
Figure 71. SEM of the surface ofEnl9 sample DC plasma nitrided at 550 <C at two
magnifications.

Chapter Four Results 164
4.3.6.2 RF Plasma Nitriding and PI3
The results of the surface roughness measurements, of the PI3 and RF plasma nitrided
samples are presented in Table 7 and Figure 72. Similar trends in the surface roughness
occurred with treatment temperature for both treatments. Maximum roughening took
place at 350°C, minimum roughening at 450°C and intermediate roughening at 550°C.
At all temperatures the surface roughness of the samples treated by PI3 were greater
than those of RF plasma nitrided samples.
Optical micrographs from the surface of the samples treated by the PI3 process and RF
plasma nitriding are shown in Figures 73 and 74, respectively. Both processes at 350°C
developed surfaces with morphologies resembling surface relief, see Figures 73-a and 74-
a. Higher treatment temperatures for both processes, however, resulted in surfaces with
morphologies typical of sputter etching, the severity of which increases with increasing
temperature, see Figures 73-b,c and 74-b,c. Note that grains as well as grain boundaries
were sputter etched in PI3 treated samples, while only grain boundaries were highlighted
in RF plasma nitrided samples.
The AFM images in Figures 75, 76 and 77 reveal the above mentioned observations in
more detail. Generally speaking, the severity of sputter etching was greater for PI3 than
RF plasma nitriding.

Chapter Four Results 165
Table 7. Surface roughness Ra results after PI3 and RF plasma nitriding at different
temperatures for 5 hours in 75% N2 -25% H2 gas mixture.
Treatment
PI3
RF
350
0.086
0.065
/?a,pjm
Temperature,
400
0.048
0.028
450
0.045
0.026
°C
500
0.051
0.029
550
0.053
0.032
As polished
0.012
0.012
Treatment
Polished 350 400 450 500
Treatment temperature, °C
•0.1
B.04 *
550
Figure 72. Surface roughness (RJ for MAXIMA™ steel treated by PI3 and RF plasma
nitriding processes.

Chapter Four Results 166
(a)
(b)
(c)
-H*. £?
^ > ~ /it;
- . J - ::s*
?--iyy.:, y *">.< ./£. /r/L5r . •• • tf / >y JT> - ,^ §rf%Jy
1 >&HM 50pm
Figure 75. Optical micrographs obtained from the surface of the MAXIMA™ samples
treated by the PI3 process at (a) 350 °C, (b) 450 °C and (c) 550 °C

Chapter Four Results 167
(a)
(b)
(c) '
y
50pm
Figure 74. Optical micrographs obtained from the surface of the MAXIMA™ samples
RF plasma nitrided at (a) 350 °C, (b) 450 °C and (c) 550 °C.

Chapter Four Results 168
(a)
(b)
Figure 75. AFM images from the surface of the (a) PI3 and (b) RF plasma nitrided
samples at 350 °C.

Chapter Four Results 169
(a)
(b)
Figure 76. AFM images from the surface of the (a) PI3 and (b) RF plasma nitrided
samples at 450 °C.

Chapter Four Results 170
(a)
THJWH 100 0 y
0 V I 177 Hi
512
(b)
Figure 77. AFM images from the surface of the (a) PI3 and (b) RF plasma nitrided
samples at 550 °C.

5. CHAPTER FIVE:
DISCUSSION
5.1 Effect of Hydrogen on Layer Formation in D C
Plasma Nitriding
Considerable differences have been observed in the properties of the sample nitrided in
pure nitrogen and those nitrided in atmospheres containing various percentages of
hydrogen. Nitriding in pure nitrogen developed the least hard and the roughest surface
while treatment in 75%N2-25%H2 resulted in the formation of the hardest and smoothest
surface with the thickest compound layer.
Although nitriding in atmospheres containing hydrogen resulted in higher hardness and a
deeper case, pure nitrogen atmospheres also produced a hardened case. This cannot be
explained by the model suggested by Hudis (1973) in which the hydrogen-nitrogen
molecular ions are regarded as a decisive factor in plasma nitriding. The results,
however, may partly be explained by the collision dissociation model proposed by X u
and Zhang (1987). They have claimed that the nitrogen atom migration from gas phase
to solid phase in plasma nitriding is achieved essentially by the penetration of active
nitrogen atoms produced by collisional dissociation. Nevertheless, in a pure nitrogen
atmosphere the nitrogen ions need to have high energy to obtain good nitriding effects.

Chapter Five Discussion 172
This high ion energy is obtained if the pressure is low and the applied voltage is high. O n
the other hand, the ion energy in plasma nitriding in an atmosphere containing hydrogen,
appears to have no obvious relationship to nitriding results within the energy ranges
tested (Fangli, 1981).
In pure nitrogen, the dissociation of N2 molecules through inelastic collision is only
possible by N* ions whose energies exceed 15 eV, whereas FT*" ions with less mass can
dissociate N2 molecules with only lOeV energy (Xu and Zhang, 1987). Therefore, the
role of hydrogen in nitriding is very important due to its contribution in lowering the
energy required for collision dissociation to produce active nitrogen atoms.
Furthermore, the strong deoxidation properties of hydrogen, which chemically remove
the oxide film and activate the surface of the metal makes it an important constituent of
the nitriding atmosphere. In addition, hydrogen in the nitriding atmosphere has been
observed to be the main source of both the secondary electron emission and the
sputtering of ferrous surfaces. For a positive nitriding capacity, a minimum level of
~10%H2 has been suggested by Petijean and co-workers (1982).
Increasing the hydrogen concentration of the treatment atmosphere led to a decrease in
both the nitrogen concentration profile as well as the amount of e-iron nitride phase in
the compound layer, see Figures 34 and 35. This effect seems likely to be due to the
significant reduction of the amount of nitrogen ions (molecules, atoms) in the nitrogen-
hydrogen plasmas due to the formation of N-H ions (molecules).
The ions N+ and N2+ are the dominant charged species in nitrogen plasmas (Hudis, 1973).
Nevertheless, in a nitrogen-hydrogen plasma the number of nitrogen ions decreases in
favour of HT and N-H ions i.e., NH+, NH2+, NH3
+, NH/, which suppresses sputtering by
Chapter Five Discussion 173
N 2 (Motsumoto et al, 1982). Furthermore, Bougdira and co-workers (1991) have
shown that the introduction of a small amount of H2 in the nitriding atmosphere
decreases the sputtering of the substrate. This may explain why the sample treated in
pure nitrogen developed a surface with the highest level of roughness due to the high
sputtering, see Figures 38-40. It is worth mentioning that the AFM examination of the
nitrided surfaces which has not been reported by previous workers, is a powerful
technique to study the topography and morphology of the modified surfaces. AFM is
very useful, particularly for the surfaces with miniature topographical features which
other instruments such as SEM cannot reveal them.
Although the nitrogen concentration in the compound layer of the sample treated in pure
nitrogen was higher than that treated in 75%N2-25%H2, the thickness of the compound
layer of the latter was greater, see Figure 32. Again the higher sputtering rate in the pure
nitrogen atmosphere, is believed to be responsible for the lower thickness of the
compound layer formed in the pure nitrogen atmosphere. Another possibility is that the
higher applied voltage (Figure 78) which is required to sustain the ion current density
necessary to maintain the sample at the treatment temperature in a pure nitrogen
atmosphere is responsible for the higher sputtering leading to a reduction in the
compound layer thickness.
Further increases of the hydrogen concentration in the nitriding atmosphere resulted in a
further decrease in the compound layer thickness, Figures 32 and 33. This may be
explained by the results of an investigation carried out by Bougdira et al (1991). By
optical spectroscopic analysis of plasmas having different nitrogen-hydrogen
percentages, they found a decrease in N2 and N2+ emission line intensities with increasing

Chapter Five Discussion 174
H2 content. The reduction in the N2 and N2 + species which are vital for the compound
layer formation and growth, will cause a reduction in the thickness of compound layer.
With 25%N2 content of treatment gas, the thinnest compound layer consisting
predominantly of y' phase was formed. The small thickness of this layer may be
attributed to the limited composition range of y' phase, leading to a very low
concentration gradient which is not enough to induce any further growth of the layer, as
also pointed out by Edenhofer (1974, part 2). Nevertheless, nitriding in atmospheres
with higher nitrogen concentrations, such as 50%, 75%, and even 100%, did not result in
production of an e monophase layer but a dual phase (e+y) compound layer. L o w
proportions of nitrogen and carbon in these layers is believed to be the main reason for
the tendency for y' phase formation (Lampe et al, 1993).
700
>
f 500 + "0 >
400
300
25 50
Hydrogen, %
1.6
r 1.2
0.8 M I
- 0 — Voltage
-A— Current
U
0.4
0
75
Figure 78. The changes in the applied voltage and current with changes in the
hydrogen concentration of the treatment atmosphere. All the treatments were carried
out at 450 °Cfor 5 hours.

Chapter Five Discussion 175
The distribution of carbon determined by the G D O E S analysis of the treated samples
(Figure 35), particularly those treated in 75%N2-25%H2 and 50%N2-50%H2, shows a
higher carbon concentration at the top and bottom part of the compound layer. In the
centre of the compound layer, however, there is a carbon depleted zone. It is difficult to
explain the exact reason for this phenomena. However, the higher affinity of chromium
for nitrogen than for carbon may be responsible. Upon diffusion of nitrogen into the
specimen and formation of the compound layer, chromium carbides normally present in
the compound layer tend to convert to chromium nitrides or carbo-nitrides.
Consequently, (some) carbon will be liberated which can diffuse to either side of the
compound layer and enrich those regions with carbon.
The case depth and hardness achieved in a pure nitrogen atmosphere are lower than
those obtained from treatment in atmospheres containing nitrogen-hydrogen mixtures,
see Figures 36 and 37. Although many authors have observed similar results, no
convincing explanation has yet been suggested. According to Szasz et al (1989), in a
pure nitrogen atmosphere, the sticking coefficient is much less, leading to a smaller
nitriding depth and hardness (Hudis, 1973). Addition of hydrogen to the nitriding
atmosphere, however, results in a reduction of stoichiometric iron nitride formation
which in turn leads to an increased hardness (Grill and Itzhak, 1983). The formation of
randomly distributed chromium nitride particles and the introduction of large internal
stresses are responsible for high hardness (Rozendaal et al, 1985). This implies that the
formation of a homogeneously nitrided matrix is mainly responsible for the surface
hardening, rather than simply a precipitated iron nitride phase.
Chapter Five Discussion 176
5.2 Comparative Study of DC Plasma Nitriding
Behaviour of MAXIMA™ and En19 Steels
Comparison of the hardness profiles of the MAXIMA™ and Enl9 DC plasma nitrided
samples, (Figures 57 and 58), reveals that at all treatment temperatures the surface
hardnesses achieved by MAXIMA™ were higher than those of Enl9. MAXIMA™
exhibited a sharper case/core interface, while En 19 showed smoother transition from the
nitrided case to the core. Both the ease of nucleation of a nitride phase and the strength
of the interaction between the alloying elements and nitrogen govern the form of the
hardness profiles that develop during the nitriding process (Lightfoot and Jack, 1975).
Strong nitrogen-alloy interaction leads to a sharp interface between the case/core region,
whereas a weak interaction results in a more diffuse interface. Furthermore, increasing
the concentration of a nitride-forming alloying element tends to sharpen the case/core
interface. The results obtained are readily explained according to established theory of
nitriding and internal oxidation. The higher Cr content of MAXIMA™ (1.9 %),
compared to that of En 19 (1.05 %), Table 3, is believed to be the major factor
responsible for the higher hardness, sharper hardness profile and shallower case depth
obtained from plasma nitriding of MAXIMA™ microalloyed steel. The results are in
accordance with findings of Robino and Inal, (1983), and Inal and Kazim (1987). It can
also be seen in Figure 59 that the case depth increases for both steels for increasing
treatment temperature due to the increased nitrogen diffusivity.
As with age hardening alloys, where at a particular temperature and time the maximum
hardness is achieved, in plasma nitriding the maximum hardness achieved by the process
is governed by the precipitate size and density (number). Higher treatment temperatures

Chapter Five Discussion 177
and longer times results in precipitate coarsening and further tempering of the matrix.
Both steels exhibit similar behaviour and show a maximum surface hardness at 450°C,
Figure 60, which is consistent with the findings of Edenhofer and Bewley (1976). This
can be explained by the temperature dependence of the dispersion hardening of the
(chromium) nitride precipitates within the matrix. Precipitates of a certain size and
number will be the most effective in preventing the movement of dislocations and in
producing the maximum strengthening and hardness. The 450°C treatment produced an
optimum nitride precipitate size and density. At a low nitriding temperature of 350°C,
the nitrogen uptake and precipitate density were low leading to a low hardening effect.
On the other hand, as the nitriding temperature was increased (550°C) the precipitates
became larger in size, leading to a reduction in precipitate density and hence lower
hardness. Moreover, at the higher temperature, the chromium available in solid solution
will combine with the carbides present in the matrix therefore reducing the strength of
the steel. As a consequence, there is less chromium left in solid solution for nitride
formation.
The En 19 steel treated at different temperatures showed no significant reduction in core
hardness, while MAXIMA™ samples exhibited some softening which was more
noticeable for the sample treated at 550°C, as shown in Table 6. Softening of the
MAXIMA™ substrate at the higher nitriding temperature may be attributed to the
coarsening of carbides, recovery of dislocation structure, and the growth of ferrite grains
present in the as-rolled condition.
X-ray diffraction patterns of the nitrided surfaces, shown in Figures 50 and 51, indicate
that the compound layer developed on both steels was dual phase consisting of y' and e
iron nitrides. In general, increasing the treatment temperature resulted in an increase in
Chapter Five Discussion 178
the intensity of the iron nitride peaks and a reduction of the iron peaks. This may be
explained by the increase in the compound layer thickness for an increase in the
treatment temperature, see Figure 45. Since plasma nitriding is a diffusion-controlled
process, the thickness of the compound layer also increases as the treatment temperature
increases (Inal and Robino, 1982). The thicker compound layers prevent the incident x-
rays from reaching the ferritic substrates. Moreover, the iron peaks were broadened and
shifted to lower angles. The line broadening is brought about by small crystallite size,
microstrains while the line shift is due to the presence of macrostrains in the ferrite lattice
(Koolera/, 1981).
The intensity of the iron nitride peaks in En 19 steel were slightly higher than those in
MAXIMA™ steel. The most probable reason for this is the thicker compound layer
produced on the En 19, see Figure 45.
There is an important difference in the diffraction patterns of MAXIMA™ and En 19
steels. The oc-iron and e-nitride peaks which appear at diffraction angles around 51-52°
in the MAXIMA™ steel are merged, and the linewidth was increased, while for En 19
steel no peak overlap was observed and two distinctive a and s peaks were resolved.
This phenomenon is most likely due to the higher carbon content of Enl9 steel, which is
twice that of MAXIMA™ steel. The presence of carbon stabilises the s phase due to the
very wide solubility range for both nitrogen and carbon (Slycke and Sproge, 1989).
Therefore, the En 19 steel, containing more carbon, develops more e phase during
nitriding and consequently the s phase peak in the diffraction pattern is more intense.
Although the x-ray analysis results indicated that the compound layer developed at
different nitriding temperatures consisted of y' and e for both steels, the morphologies of

Chapter Five Discussion 179
the layers were distinctly different, as seen in Figures 42-44. The difference in the
morphologies of the compound layers formed in MAXIMA™ and En 19 is likely to be
due to the difference in their pre-nitriding microstructure. The acicular morphology of
the compound layer in MAXIMA™ is similar in appearance to the Widmanstatten side-
plate growth of ferrite into austenite in carbon steels. In the present case, iron nitride
plates have extended into the ferrite matrix of the MAXIMA™ (Mahboubi et al, 1995).
Such growth is favoured by lower transformation temperatures and is characterised by
the development of parallel plates along a low energy crystallographic interface plane
within a given ferrite grain. The apparent absence of this acicular morphology in En 19
can be associated with the different substrate microstructure of tempered lath/plate
martensite. The small plate widths present orientation changes over a scale which may
be fine enough to prevent the development of an observable acicular morphology.
In both steels, some pores and cracks were evident in the compound layer adjacent to the
surface region of the samples treated at higher temperature, particularly 550°C. The
development of porosity in the compound layer is a well-known phenomenon which is
observed in most nitriding processes. Pore formation may be explained in a similar way
to that suggested by Somers and Mittemejier (1992). Nitrogen atoms diffusing through
the compound layer can coalesce to form molecular nitrogen, particularly at energetically
favourable sites, such as grain boundaries.
Growth of the compound layer is controlled by diffusion of nitrogen through this layer
(Edenhofer and Bewley, 1976). As with the diffusion layer thickness, the general trend is
an increasing thickness with increasing treatment temperature for both steels, although
the compound layer formed on Enl9 was thicker than that of MAXIMA™, as seen in
Figure 45.

Chapter Five Discussion 180
The thickness of the compound layer depends on the carbon content and other alloying
elements of the steel. The higher thickness of the compound layer of Enl9 may be
attributed to the higher carbon content (Cho and Lee, 1980) of this steel (0.4% C) which
is twice that of MAXIMA™ steel (0.21% C). The higher carbon content in Enl9 steel
stabilises the 8 phase so that it will form at much lower nitrogen activities. This leads to
a faster growth of the compound layer due to the much wider solubility range of carbon
and nitrogen in the e phase. The difference in the compound layer thicknesses is more
evident for higher treatment temperatures.
Increasing the nitride forming alloying elements, such as chromium, decreases the growth
rates of the compound layer and the diffusion zone due to the higher demand for
nitrogen (Slycke and Sproge, 1989). The higher nitrogen content of the MAXIMA™
compound layer in comparison to that of the Enl9 steel was confirmed by the GDOES
of the treated samples, see Figures 53 and 54. Therefore, the thinner compound layer of
MAXIMA™ can also be associated with the higher chromium content of this steel (1.9%
Cr) in comparison to that of Enl9 (1.05% Cr).
The diffusion zone in the case of En 19 is reminiscent of a tempered martensite structure
whereas MAXIMA™ displays a predominantly ferritic structure, consistent with the pre-
nitriding microstructures.
Surface roughness of both steels increased with increasing the treatment temperature, see
Figure 65. At 350°C, the surface roughness was mainly due to the surface relief caused
by the volumetric expansion associated with the formation of nitrides. Iron nitrides
formed on the surface and grew towards the core. The nucleation and growth of the
nitrides is accompanied by surface roughening. Nevertheless, sputtering and re-

Chapter Five Discussion 181
deposition of the sputtered material on the surface may have also played some minor role
in the surface roughening, Figure 66. Slight differential sputtering of grain boundaries
also occurred which was due to the higher free energies of the grain boundaries, making
them more susceptible to sputtering.
Surface roughening at higher treatment temperatures was due to a similar expansion
effect as well as preferential sputtering combined with the re-deposition of iron nitrides
on the surface, Figure 67. More importantly, increasing the treatment temperature
involves an increase in the applied voltage (Figure 79) which in turn increases the kinetic
energy of the incident ion (or atom). Therefore the sputtering yield (S) which is
dependent upon the kinetic energy of the colliding ions, increases with increasing
temperature, leading to an increase in the surface roughness. Thus, the samples treated
at 550°C show the highest value of surface roughness, see Figure 68.
700
600 ->
| 500 "o >
400
300
• Voltage
• Current
300 400 500
Temperature, °C
2
1.6
- 1.2
0.8
0.4
0
600
y.
1) l~
u
Figure 79. The voltage and current applied at different treatment temperatures for DC
plasma nitriding.

Chapter Five Discussion 182
Comparison of the two steels revealed that the surface roughness of M A X I M A ™
microalloyed samples was greater than those of the Enl9 samples, see Figure 65. This
can be explained by the pre-nitriding microstructure of these steels. The grain size and
carbide distribution in the steel affect the surface roughness obtained after nitriding. The
initial microstructure of MAXIMA™ appeared to be proeutectoid ferrite plus bainite,
whereas the microstructure of En 19 was tempered lath/plate martensite. Formation of
nitrides and/or carbonitrides at the grain boundaries will induce some stresses in the
grains due to their volume expansion at the grain boundaries. This in turn can displace
individual grains in the surface layer leading to deformation or cracking of the compound
layer (Thelning, 1975). The displacement of the grains at the surface is clearly shown in
Figure 67-a. Additionally, the preferential sputtering of the large ferrite grain boundaries
in MAXIMA™ in comparison to the fine tempered martensitic structure of En 19 plays
some role in the increased surface roughening of this steel.

Chapter Five Discussion 183
5.3 Plasma Immersion Ion Implantation (P|3) and RF
Plasma Nitriding of MAXIMA™
For both processes, the appearance of the samples treated at low temperature were
totally different from those treated at higher temperature, see Figures 73-75. Treatment
at the low temperature of 350°C in a 75%N2-25%H2 atmosphere, resulted in surface
morphologies typical of surface relief, while higher treatment temperatures developed
surface morphologies typical of sputter etching. Grain boundaries, not seen in the
original polished surfaces, were evident after treatment. The reflectivity of the surface
progressively decreased with increasing treatment temperature. Nevertheless, at all
treatment temperatures, RF plasma nitriding resulted in smoother surfaces. It should be
noted that the portion of specimens masked from the plasma in both treatments,
exhibited no increase in surface roughness or change in appearance, indicating that the
phenomenon (surface roughening) was not due to the time at temperature.
One of the unique features of PI3 and RF plasma nitriding is the absence of a continuous
compound layer on the surface of the treated samples. Standard x-ray diffraction
analysis of the samples was not able to identify any iron nitride peaks. Glancing angle x-
ray diffraction (GAXRD) analysis, however, confirmed the formation of the y' peaks only
on the RF plasma nitrided samples treated at 350°C, see Figure 52. SEM examination of
the cross section of the samples also confirmed the formation of iron nitride at 350°C,
see Figure 48-a. It is worth mentioning that although the SEM of the PI3 samples
revealed the formation of iron nitride on the surface of the sample treated at 350°C
(Figure 47-a), the amount (number) of these iron nitride plates was not enough to be
detected by GAXRD, see Figure 52-a.

Chapter Five Discussion 184
This effect may partly be explained by nucleation and growth theory. For the formation
of a phase, clusters of that phase should be formed. Once a cluster is established and
becomes stable, a nucleus is formed and gradually grows. In RF plasma nitriding, which
is a thermochemically driven diffusion process, cluster formation on the surface happens
more easily and in more sites than in the PI3 process, in which the formation of clusters
is interrupted due to ion bombardment (Mahboubi et al, 1995). Moreover, in PI3
treatment, due to the implantation of nitrogen about 100 nm beneath the surface (Collins
et al, 1995), the process of surface iron nitride formation is hindered. However, during
the off period of the high voltage, since the sample is immersed in the RF plasma, there is
some thermochemically driven diffusion of nitrogen from the surface of the sample,
leading to formation of iron nitrides on preferential orientations in which the free energy
for nucleation is less.
Although at low treatment temperatures, the surface roughness for both processes is
mainly due to the surface relief phenomenon, sputtering also plays some role in
roughening the surface of the treated samples, particularly in the PI3 process. Due to the
high energy ion bombardment of the sample in PI3 treatment, there is some sputtering in
addition to the ion implantation. In RF plasma nitriding, however, since no bias voltage
is involved, other than the self-bias potential which is ~ 40 V, there is not much ion
bombardment of the sample, hence less sputtering. Consequently, the surface roughness
of the RF plasma nitrided sample was generally lower than that of PI3 treated samples,
see Figure 72.
At higher treatment temperatures (400°C and higher), no surface iron nitride is formed
on the samples treated by either processes and the surface roughness value is much
lower, see Figures 72, 76 and 77. This effect can be attributed to the increased treatment

Chapter Five Discussion 185
temperature which increases the diffusion rate preventing the nitrogen build up necessary
for iron nitride phase formation on the surface.
The surface roughening mechanism is also changed for the treatment at higher
temperatures and is mainly due to the sputtering. Increasing the treatment temperature
demands an increase in the frequency of pulse repetition of the high voltage in PI3
treatment, leading to an increase in the sputtering yield. In RF plasma nitriding,
however, since the sample is heated by a resistively heated stage and not ion
bombardment, the RF frequency and power does not change. Therefore the increase in
the surface roughness is believed to be due to the increase in the sample temperature,
which in turn increases the vibrational motion of the sample atoms, making them more
susceptible for sputtering.
The lack of compound layer on the surface of the specimens in the present experiments
can be attributed to the low nitrogen activity of the treatment atmospheres. Since both
processes are carried out at a very low pressure, typically 1-2 x 10" mbar, the nitrogen
activity, which is directly proportional to the partial pressure of the nitrogen in the
treatment atmosphere (Dressier; Sudarshan (ed.), 1989), is not high enough to produce a
continuous iron nitrides or a compound layer. Moreover, for the low processing
pressure employed in both treatments, the mean free path of the ions and atoms is in the
order of several centimetres, hence there will be no redeposition of the sputtered material
on the surface (this will be discussed in more detail in the next section).
The question of why the treatments are not carried out at higher pressures must then be
addressed. In the PI3 process, the low pressure is necessary to prevent the ions losing
energy by collisions with neutral species in the chamber atmosphere. Increasing the

Chapter Five Discussion 186
process pressure also results in localising the plasma around the R F antenna, preventing
the homogeneous immersion of the sample in the RF generated plasma.
Existence of a compound layer can be regarded as an advantage or a disadvantage
according to where the treated part is intended to be used. Due to its high corrosion
resistance, the compound layer protects the part in a corrosive atmosphere. On the other
hand, since it is brittle, it may spall in service, especially where the part undergoes high
dynamic stresses. Furthermore, it has been reported that this brittle layer can lead to
accelerated wear as a result of fragmentation during high load wear testing, causing
detrimental wear of the contact tip which in turn gouged and abrasively wore the
substrate at a high rate (Samandi, 1992).
PI3 treatment resulted in the formation of a hardened case with higher hardness and
thicker case at all temperatures. These differences can be attributed to the differences in
the physics of the processes. In RF plasma nitriding the sample is immersed in an RF
generated plasma and the excited neutrals and ions are diffused into the surface of the
sample. In PI3, however, the ions are accelerated towards the surface of the sample by
the application of high voltage (-45kV) pulses of lOOpsec duration, and are implanted
into the surface of the samples. Furthermore, in the periods while the high voltage is off,
excited neutrals and ions are thermochemically driven into the surface. This combination
of implantation and thermochemically driven diffusion of nitrogen is believed to be the
reason for the production of cases with higher hardness and thicker case depth.
The maximum surface hardness was developed on samples treated at 400°C for both
treatments. The temperature dependence of the dispersion hardening of the (chromium)
nitride precipitates within the matrix may explain this effect (Edenhofer and Bewley,

Chapter Five Discussion 187
1976). Precipitates of a certain size and number, which are coherent or semi-coherent
with the matrix, will be the most effective in obstructing the movement of dislocations
and in producing the maximum strengthening and hardness. At higher nitriding
temperature such as 500 and 550°C, the nitride precipitates are larger in size and become
incoherent along with a lower precipitate density and therefore are less effective in
hardening.
Samples treated at 550°C showed the smallest increase in hardness but this was
maintained at all loads, see Figure 61, indicating deeper diffusion of nitrogen into the
material, producing a thicker case. Although the hardening effect at 550°C was less than
that for lower temperatures, the results still showed a significant increase in surface
hardness over that of the substrate material, taking into account the softening of the base
material at 550°C.

Chapter Five Discussion 188
5.4 GENERAL DISCUSSION:
The Influence of the Mode of Plasma Generation on the
Plasma Nitriding Behaviour of MAXIMA™
5.4.1 Introduction
Over the past 35 years a number of theories have been proposed to model what occurs at
the plasma-surface interface and in the bulk material during plasma nitriding. However,
it is difficult to develop a unique picture of the mechanisms involved due to the
complexity of the process and since the experimental results obtained under different
process conditions employing different materials. Consequently, there is no universally
accepted model which decisively explains the mass transfer of nitrogen to the workpiece
surface. Although the layer formation mechanisms are still not well-understood, it has
been often claimed that the following four surface reactions are involved: (i) sputtering,
(ii) ion implantation, (iii) absorption of gas, (iv) condensation/deposition (Rie, 1990).
The purpose in presenting this section is to discuss and compare the effects of different
modes of plasma generation on the production of nitrided surface layers. To accomplish
this goal, the results obtained from the treatments of MAXIMA™ by different processes,
i.e. DC plasma nitriding, RF plasma nitriding and PI3 treatment, in a 75%N2-25%H2
atmosphere at temperatures of 350, 450 and 550°C, have been used and re-presented in
figures and graphs within the following discussion.

Chapter Five Discussion 189
5.4.2 Discussion
The picture emerging from the results points to a fundamentally different nitriding
response of the material to the three processes. The differences are manifested in the
form of higher surface hardness and roughness for DC plasma nitrided samples at 450
and 550°C. At the lowest treatment temperature (350°C) the PI3 treatment produced
the hardest and roughest surface layer, see Figures 80 and 81. The formation of a
compound layer on the DC plasma nitrided samples (Figures 82 and 83) which was not
produced by the other two processes, was the other major difference. These differences
can be attributed to the different operating conditions of the processes, notably the
pressure and ion energy which is related to the applied potential between the anode and
the cathode (sample). Some of the differences may be partly explained using the model
proposed by Kolbel (1965) and later supported by Keller (1971) and Edenhofer (1974,
part 1). This model is based on sputtering by ion bombardment and re-deposition
(condensation).
The incident ions need to possess an energy exceeding a threshold value for sputtering to
occur, which for iron and its alloying elements is between 20 and 30 eV (Keller, 1971).
Below this threshold, the ion energy is not high enough to detach the atoms from the
surface. Above the threshold, the sputtering rate increases to a maximum as the ion
energy increases. At very high energies, the sputtering rate decreases due to ion
penetration of the surface as ion implantation becomes dominant.
Although Edenhofer did not elaborate on the role of pressure and ion energy, it is
implicit in the model that any factor which affects sputtering or collisions in the gas phase
would inevitably influence the growth of the compound layer.
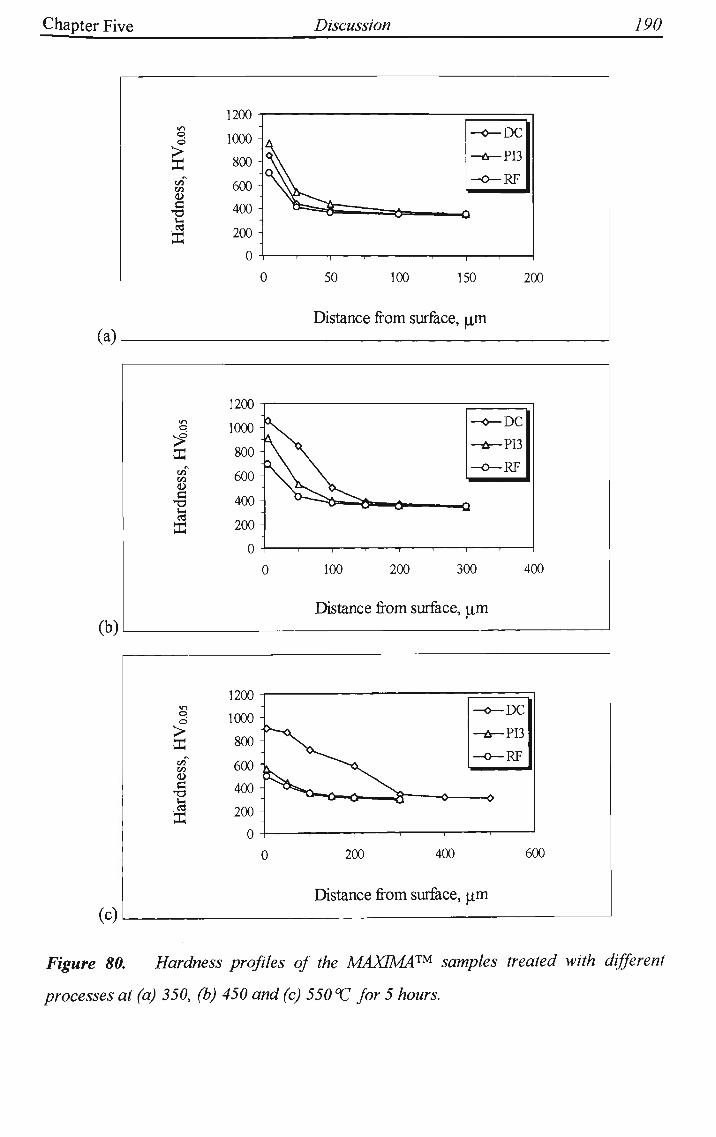
Chapter Five Discussion 190
(a)
o d
VJ
Vi
c
1200
1000
800
600
400
200
0
A
\
^ : ^ ^ n
-o—DC
-A-PI3
-o—RF
1 1 1 1 1 1 1
50 100 150 200
Distance from surface, p m
Figure 80. Hardness profiles of the MAXIMA™ samples treated with different
processes at (a) 350, (b) 450 and (c) 550 V for 5 hours.

Chapter Five Discussion 191
D C Treatment PI3
RF
Polished 350 450
Temperature, °C
550
E si.
Cy
Figure 81. Comparison of the surface roughness, Ra, values obtained from the
samples treated by different processes.
£$$&
f—1 350
\ :1 450
Temperature, °C
\
550
|12
10
e 8 $
M 6 T3
0
k g. 0
2 ^
b
Figure 82. Thickness of the compound layer formed on the surface of the DC plasma
nitrided samples.

Chapter Five Discussion 192
(c)
(b)
(a) — i — —i 1 r
e y'/e
1 1 1 1 1
a
A a
k e a
« i i i
< • — ,,
— i —
Y'
— i — i — i — i —
40 45 50 55 60
T w o theta, degrees
Figure 83. X- ray diffraction patterns of the samples nitrided at 450 °C by (a) DC
plasma, (b) PI3, and (c) RF plasma.
In DC plasma nitriding, there is a few hundred volts potential difference between the
cathode and anode, which gives the incident ions sufficient energies for sputtering,
despite charge-exchange collisions which occur at the relatively high operating pressure
(4 mbar). Incoming nitrogen ions and highly energetic neutral particles sputter elemental
iron from the cathode workpiece surface, as depicted in Figure 84-a. At these pressures,
the mean free path of the plasma particles is of the order of a few millimetres. Therefore,
the sputtered iron atoms collide with the highly reactive nitrogen atoms in the region
adjacent to the surface (the cathode fall region) and form FeN, some of which may re-
deposit on the workpiece surface, giving a surface morphology typical of CVD coatings,
as shown in Figures 86-a and 87-a.

Chapter Five Discussion 193
DC plasma nitriding
Sheath Thickness, - 3 m m T""F\
Sample
__ ^ 300-1000 v, D C
Mean free path for collision of atoms, - few millimeters 1- Bombardment of the sample by energetic ions and neutral particles 2- Sputtering of Fe atoms 3- Collision of sputtered Fe atoms with nitrogen in sheath area and formation of FeN 4- Re-deposition of FeN and its subsequent decomposition to lower nitrides
RF plasma nitriding
Sheath Thickness, - 1 0 m m
\
v 1 """ 30 -40 V, self bias
Sample
Mean free path for collision of atoms, - few centimeters 1- Adsorption of excited neutral particles 1'- Ion bombardment due to self bias 2- Slight sputtering due to self bias. Note that the mean free path is too large to cause any collision leading to re-deposition
P13
Sheath Thickness, -100 m m
• 45 kV pulses
Mean free path for collision of atoms, - few centimeters 1- Adsorption of nitrogen in high voltage - off period 1'- High energy ion bom implantation in high voltage - on period 2- Sputtering. Note that the sputtering is not as severe as in D C plasma nitriding since most of the ions are implanted beneath the surface and do not contribute in the sputtering process. Again no collision, hence, no redeposition due to large mean free path
Figure 84. Proposed models for nitrogen mass transfer in different plasma nitriding
processes.

Chapter Five Discussion 194
Increasing the treatment temperature in D C plasma nitriding involves an increase in the
applied voltage and thus incident ion energy. Therefore the sputtering yield increases,
leading to an increase in the rate of sputtering and redeposition processes. Hence the
surface roughness increases, Figure 81. Since FeN is not a thermally stable compound, it
decomposes to form iron nitrides with a lower nitrogen content such as s-Fe2-3N and y'-
Fe4N, releasing nitrogen atoms which are then free to diffuse into the base metal to form
a layer of iron nitrides called the compound or white layer, shown in Figures 88-a, 89-a,
and 90-a. This surface layer acts as a reservoir of nitrogen throughout the process from
which free nitrogen diffuses into the underlying steel. When the solubility limit is
reached, in the presence of alloying elements, nitrides are formed and precipitated in a
very dispersed form creating the diffusion zone.
Although no compound layer was formed on the surface of the samples treated by PI3
and RF plasma nitriding, the surface of the samples was hardened. This cannot be
explained by the model suggested by Kolbel and Edenhofer. In RF plasma nitriding, the
model proposed by Tibbets (1974, part 1) may be more appropriate.
According to this model, mass transfer of nitrogen occurs mainly by the adsorption of
excited neutral atoms and not of ions on the metal surface, see Figure 84-b. Excited
neutrals can be generated by sputtering and/or electron collisions in the plasma. In our
RF plasma nitriding process, the sample is immersed in an RF generated plasma from
which excited neutrals can be absorbed onto the sample surface and then diffuse into the
sample.
The mechanism of surface hardening in the PI3 process, however, is different from RF
plasma nitriding and cannot be explained by Tibbets' neutral adsorption model alone.
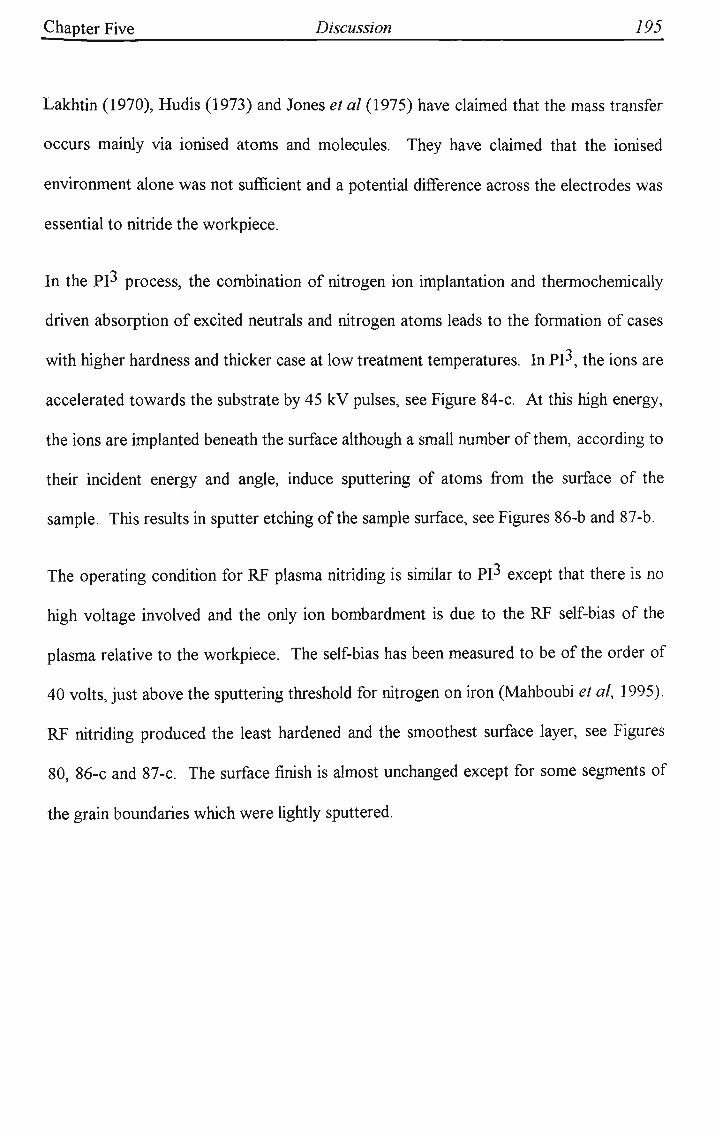
Chapter Five Discussion 195
Lakhtin (1970), Hudis (1973) and Jones etal (1975) have claimed that the mass transfer
occurs mainly via ionised atoms and molecules. They have claimed that the ionised
environment alone was not sufficient and a potential difference across the electrodes was
essential to nitride the workpiece.
In the PI3 process, the combination of nitrogen ion implantation and thermochemically
driven absorption of excited neutrals and nitrogen atoms leads to the formation of cases
with higher hardness and thicker case at low treatment temperatures. In PI3, the ions are
accelerated towards the substrate by 45 kV pulses, see Figure 84-c. At this high energy,
the ions are implanted beneath the surface although a small number of them, according to
their incident energy and angle, induce sputtering of atoms from the surface of the
sample. This results in sputter etching of the sample surface, see Figures 86-b and 87-b.
The operating condition for RF plasma nitriding is similar to PI3 except that there is no
high voltage involved and the only ion bombardment is due to the RF self-bias of the
plasma relative to the workpiece. The self-bias has been measured to be of the order of
40 volts, just above the sputtering threshold for nitrogen on iron (Mahboubi et al, 1995).
RF nitriding produced the least hardened and the smoothest surface layer, see Figures
80, 86-c and 87-c. The surface finish is almost unchanged except for some segments of
the grain boundaries which were lightly sputtered.

Chapter Five Discussion 196
Figure 85. AFM images showing the surface topography of the samples treated by (a)
DC plasma nitriding, (b) PI3 and (c) RF plasma nitriding at 350 °C.

Chapter Five Discussion 197
(a)
(b)
(c)
Figure 86. AFM images showing the surface topography of the samples treated by (a)
DC plasma nitriding, (b) PI3 and (c) RF plasma nitriding at 450 °C.

Chapter Five Discussion 198
(a)
(b)
(c)
Figure 87. AFM images showing the surface topography of the samples treated by (a)
DC plasma nitriding, (b) PI3 and (c) RF plasma nitriding at 550 °C

Chapter Five Discussion 199
4pm
Figure 88. SEM micrographs of samples (a) DC plasma nitrided (b) PI3, and (c) RF
plasma nitrided at 350 °C.

Chapter Five Discussion 200
(a)
(b)
(c)
4pm
Figure 89. SEM micrographs of samples (a) DC plasma nitrided (b) PI3, and (c) RF
plasma nitrided at 450 °C.

Chapter Five Discussion 201
(a)
(b)
(c)
4pm
Figure 90. SEM micrographs of samples (a) DC plasma nitrided (b) PI3, and (c) RF
plasma nitrided at 550 °C.
Chapter Five Discussion 202
In R F plasma nitriding and PI3, the operating pressure is about 10 mbar, three orders
of magnitude lower than that of DC plasma nitriding, so the mean free path of the plasma
particles is several tens of centimetres. Due to this large mean free path, the sputtered
atoms do not collide with any nitrogen in the vicinity of the sample surface and contrary
to DC plasma nitriding, there will not be any significant re-deposition of iron nitrides, see
Figure 84-b. Thus no compound layer is formed.
The major difference in the appearance of the DC plasma nitrided samples and those
treated by RF plasma nitriding and PI3 processes is the formation of a dark grey ring
parallel to the edge of the sample. The degree of the grey tone increases with increasing
treatment temperature. The differences stem from basic differences in the operating
conditions of the processes.
Ring formation on the surface of the DC plasma nitrided sample is due to the non
uniform sputtering and redeposition which occurs during the process. Removal of
sample material by sputtering predominates at edges and corners while on flat faces, such
as the centre of the sample, vapour deposition prevails (Wells and Strydom, 1986 and
1988). This may be explained by the large gradient in the electric field and current
density around the edges and sharp corners (Lanagan, 1988). The cathodic sheath
formed around the sample is of the order of a few millimetres, (-1-3 mm), depending on
the chamber pressure and the applied voltage. The current density is not uniform across
the sample and tends to rise towards the edge and then fall. The current density dictates
the density of the reactive species and this in turn governs the sputtering rate. Hence,
more sputtering occurs around sharp edges and corners of the sample, resulting in the
formation of the dark grey ring parallel to the edge of the sample.

Chapter Five Discussion 203
The uniform appearance of the samples treated by R F plasma nitriding and PI3 processes
and the lack of any ring around the edge of the treated samples, can be explained by the
large cathodic sheath length involved in these processes. The large cathodic sheaths in
RF plasma nitriding (~10mm) and PI3 (~100mm) (Collins and Tendys, 1994) are less
sensitive to the corners and edges of the sample leading to an almost uniform current
density and in turn uniform sputtering rate across the sample. Moreover, unlike DC
plasma nitriding in which the sample is a part of plasma generation system (cathode), in
PI3 and RF plasma nitriding, the sample is separated from the plasma generation and is
immersed in a uniform and diffuse plasma.
At 350°C, maximum hardening was observed on the samples treated by the PI3 process.
This may be attributed to the high nitrogen ion implantation involved in the process. At
this temperature, the low diffusion rate of nitrogen allows a high nitrogen concentration
to build-up at the surface, leading to the formation of a hard case, which produces a
relatively large amount of surface relief, see Figure 85-b. As the temperature increases
so does the diffusion rate of nitrogen. Since the process is carried out at low pressure,
hence low nitrogen activity (Dressier; Sudarshan (ed.), 1989), the increase in the
diffusion rate of nitrogen cannot be matched by the nitrogen source. This results in a
decrease in the surface concentration of nitrogen and a subsequent lower increase in
hardness. For 450 and 550°C treatment temperatures, the DC plasma nitrided samples
showed higher hardness with the difference being more pronounced for 550°C, see
Figure 80. At these higher temperatures, the increase in diffusion rate of nitrogen is
supported by the compound layer formed on the surface in this process which serves as a
constant reservoir of nitrogen.

6. CHAPTER SIX:
CONCLUSIONS
6.1 Effect of Hydrogen Content on DC Plasma Nitriding
of MAXIMA™
An investigation which was carried out to determine the optimum level of hydrogen for
D C plasma nitriding of hot rolled Cr-bearing microalloyed steel, M A X I M A ™ , yielded
the following conclusions:
• DC plasma nitriding of MAXIMA™ in 100%N2 resulted in the lowest hardness and
shallowest case. The treatment in 75%N 2 - 25%H 2 atmosphere yielded the highest
hardness and thickest case. These improvements in hardness and case depth were
attributed to the presence of hydrogen in the nitriding atmosphere.
• Plasma nitriding in the atmospheres of 50%N2-50%H2 and 25%N2-75%H2 gave fairly
similar results in terms of hardness and case depth, which fell between the results
obtained from treatments in the 75%N 2 - 2 5%H 2 and 100%N 2 atmospheres.
• The highest surface roughness was obtained after DC plasma nitriding in the 100%N2
atmosphere due to the severe sputtering of the substrate by N2 + ions as well as from
the higher applied voltage required for the treatment.

Conclusions 205
• Treatment in the 75%N 2-25%H 2 atmosphere resulted in the smoothest surface due to
a reduction in the number of nitrogen ions in favour of hydrogen and hydrogen-
nitrogen ions which led to a reduction in the sputtering.
• The thickest compound layer was formed on the sample treated in the 75%N2-25%H2
atmosphere. The compound layer that formed on the surface of the sample treated in
the 100%N2 was the second thickest layer due to a high sputtering which removed
some of the already formed layer. Increasing the hydrogen concentration resulted in a
decrease of the compound layer thickness due to a significant decrease in the number
of nitrogen ions (molecules, atoms).
6.2 Comparative Study of MAXIMA™ and En19 Steels
The nitriding response of MAXIMA™ was compared against a traditional nitriding steel
Enl9 (AISI 4140), and the following conclusions were drawn:
• DC plasma nitriding of MAXIMA™ developed cases having a higher surface
hardness, sharper case/core interface and higher surface roughness than those
obtained on Enl9 steel. These were attributed to the higher Cr content and pre-
nitriding microstructure of MAXIMA™.
• The compound layer and the diffusion layer of MAXIMA™ were thinner than those
for Enl9 at all treatment temperatures. This was most likely due to the lower carbon
and higher chromium contents of MAXIMA™.

Conclusions 206
• Although the morphologies of the compound layers produced on the surface of the
two steels were different due to the difference in their pre-nitriding microstructure,
similar phases (y1 and e) were formed.
• Both steels showed a maximum surface hardness at the 450°C treatment temperature
owing to the temperature dependence of dispersion hardening of chromium nitride
within the matrix.
• MAXIMA™ steel showed some reduction in core hardness which was more
pronounced at the higher nitriding temperatures. This was probably because of the
coarsening of carbides and the recovery of dislocation structure present in the as-
rolled condition.
• Substitution of En 19 with MAXIMA™ may be preferable in some applications where
a higher surface hardness is required.
6.3 Plasma Immersion Ion Implantation and RF Plasma
Nitriding of MAXIMA™
The basic aim of this study was to make a comparison between PI3 and RF plasma
nitriding using MAXIMA™ steel. Based on the results obtained, the following
conclusions can be derived:
• The PI3 process produced surface layers with more favourable properties such as
higher hardness and thicker case, than RF plasma nitriding. The superior properties of

Conclusions 207
PI 3 treated samples are believed to be due to the additional high voltage ion
implantation employed in PI3. The DC self-bias in RF plasma nitriding, although
capable of driving nitrogen into the steel, is insufficient on its own to develop the
optimum properties and has to be boosted by high voltage pulses.
• For the conditions employed, no compound layer was formed on the surface of the
treated samples by either of the two processes due to the low nitrogen activity of the
atmosphere. This is attractive for applications that demand a high hardness but
without compound layer at the surface.
• For both processes, the low temperature treatment (350°C) developed surfaces with
the highest hardness and roughness. These were attributed to the low diffusion rate
of nitrogen which led to its build up at the surface leading to the formation of a hard
case and resulting in surface relief which roughens the surface.
6.4 The Influence of the Mode of Plasma Generation on
the Nitriding Behaviour of MAXIMA™
It would appear that all of the mechanisms suggested by different authors play some role
in the plasma nitriding process. Determining which of these is dominant is not straight
forward and depends upon the operating conditions of different nitriding processes.
Nonetheless, the following conclusions can be drawn:

Conclusions 208
• The mass transfer in D C plasma nitriding is more likely to be due to the sputtering and
redeposition model. In PI3, however, ion implantation and diffusion of the implanted
nitrogen are the major means of mass transfer. Mass transfer in RF plasma nitriding is
likely to be mainly due to the adsorption of neutral particles.
• No compound layer was formed on the surfaces of the samples treated by PI3 and RF
plasma nitriding at any treatment temperature. On the other hand, DC plasma
nitriding produced a compound layer that increased in thickness with increasing
temperature.
• The best case, in terms of hardness and depth, was produced by PI3 at 350°C and by
DC plasma nitriding at 450 and 550°C. From this, it can be concluded that the PI3
process is suitable for low temperature plasma nitriding of steels which soften
(temper) at higher nitriding temperatures and DC plasma nitriding is the preferred
nitriding process at higher temperatures where a high hardness and a thicker case are
required. At all applied temperatures, RF plasma nitriding produced hardened cases
with the poorest properties.
• DC plasma nitriding produced the surfaces with the highest roughness values (Ra)
followed by PI3 treatment, except for the 350°C temperature in which the PI3
produced the roughest surface. The surface roughness value of the samples treated by
RF plasma nitriding are the lowest of all treatment temperatures.

7. APPENDICES
7.1 Appendix A:
Metallography of Nitrided Samples
Sample preparation of plasma nitrided steels for revealing the true microstructure
requires different technique than is normally required. Firstly, the high hardness
differential between the case and the core causes some problems. In addition, the white
layer, which is usually the primary subject of metallographic examination, is partly or
completely destroyed by ordinary preparation techniques (Metals Handbook, Desk
Edition, 1985).
7.1.1 Edge Retention
Preservation of the edges of nitrided steels is of the utmost importance. For edge
preservation, any of three recommended methods can be used: (a) use of hard mounting
materials or iron-filled epoxy mounting materials; (b) surrounding the specimen in the
mount with bits of ceramic, small hardened steel balls, chilled iron shot, or with a pipe
section, or (c) nickel plating of the specimen.
Plating of the nitrided specimens in order to protect the edges and to preserve the white
layer, is essential and must be done without blasting or severe etching. Due to the lack

Appendices 210_
of good adherence of chromium plated layers to nitrided surfaces without an
unacceptable amount of surface preparation, chromium plating is unsatisfactory.
Copper, cadmium, and zinc plates are too soft. It has been proved that nickel plating is
the best technique and is now common practice. In addition to protecting and preserving
the edges during cutting, it also helps maintain sample flatness during grinding and
polishing. The thickness of the plate layer is not that critical, a plate thickness of about
50pm is usually sufficient, but a thicker plate layer is not harmful.
7.1.2 Grinding and Polishing
Like other steel specimens, coarse and fine grinding is required for nitrided specimens.
Coarse grinding is usually done with 80, 100, or 120 mesh abrasive and fine grinding is
usually done with papers of progressively finer grit size, such as 240, 320, 400, 600, and
1200 mesh.
After grinding, specimens are polished on a napless cloth covered disk, rotating at 150 to
300 rpm, impregnated with 6-mm diamond (paste) spray, followed by 1-pm diamond
(paste) spray. The specimen is held by hand and moved in the direction opposite to the
direction of wheel rotation. Alternatively, automated devices can be used for grinding
and polishing. Time required for polishing varies with hardness and size of the specimen,
but the average time is 2 to 4 minutes. It should be mentioned that the polishing time
should be reduced to the minimum necessary to achieve the required polish but avoiding
edge roundness.

Appendices 2U_
7.1.3 Etching
To ensure that all disturbed metal is removed and that the true structure is revealed, the
best practice is to etch the polished specimen, immediately repolish very lightly (just
enough to remove the evidence of etching), and etch again and continue this procedure
for two or more cycles. If proper care is taken during the initial grinding and polishing,
this practice is not needed.
Nitrided steel specimens are occasionally etched in nital for routine examination. A 0.5%
nital (0.5% nitric acid, 99.5% ethanol) preferentially attacks grain and phase boundaries.
A 2.5% nital solution is used for microscopic examination and up to 5% nital for case-
depth measurements at low magnification. Nital is the only reagent which leaves the
compound zone white. However the s-nitride phase in alloy steels is attacked with
prolonged etching (Mridha and Jack, 1982).
It is claimed that the Oberhoffer's reagent is the most useful single etchant for revealing
the different zones in a nitrided steel as well as distinguishing the dissimilar phases of the
compound layer (Mridha and Jack, 1982). Also, when it is preceded by etching in
picrate, the presence of cementite in the compound layer is clearly revealed. Both the
nitrided and carbide-enriched zones in nitrided chromium-containing steels and the
cementite at prior austenite grain boundaries within the nitrided zone are delineated by
this reagent.
The boundary of the nitrided zone is most clearly delineated by Marble's reagent and
Oberhoffer's reagent. They also reveal the extent of the carbide-enriched region below
the nitrided zone.
A list of etching reagents and etching conditions used are presented in Table 8.

Appendices 212_
Table 8. List of etching reagents and etching conditions (Mridha, 1982).
Reagents Etching conditions
Nital 2.5%: 2.5ml nitric acid, 97.5ml ethyl 2-8 sec at room temp. alcohol
Oberhoffer: lg cupric chloride, 30g ferric 2-5 sec only for chloride, 0.5g stannous chloride, 50ml H C L , compound layer 500ml distilled water, 500ml ethyl alcohol
Marble's reagent: lOg copper sulphate, 50 ml 2-10 sec H C L , 50 ml distilled water
7.1.4 Nickel Electroplating in Watts Bath
When nickel sulphate is dissolved in water it ionises. By establishing an electric potential
between two electrodes which are immersed in the solution, positively charged nickel
ions are attracted to the more negative electrode (cathode), acquiring a negative charge
and are then electrically neutralised, being deposited as metal on the cathode (article).
The negatively charged sulphate ions migrate to the positive electrode (anode), giving up
their charge at the anode and combine with either the metal of the anode, or with the
electrolyte itself (if the anode is chemically inert). If the anode is made of pure nickel, it
gradually dissolves during passage of current and combines with the sulphate radical,
forms more nickel sulphate and replenishes the solution. Consequently, in the nickel
plating process, the nickel metal transfers from nickel anode through the solution and
deposits on to the cathode. If 1 amp flows for 1 hour, approximately 12 microns will be
deposited over 1 dm2 (the International Nickel Company, (Mond)).

Appendices 2L3_
The Watt's bath is one of the standard general purpose nickel plating solutions. It
consists of nickel sulphate, nickel chloride, boric acid. The composition and operating
conditions of Watts bath are presented in Table 9 (Samuels, 1967).
The nickel chloride serves to prevent anode passivity and ensures that the anode
dissolves at high efficiency. It also provides additional nickel ions and enhances the
conductivity of the electrolyte. Increasing the chloride content lowers the ductility,
hardens the deposit, and increases internal stress in the plated layer. The boric acid acts
as a buffer to maintain the acidity of the solution and to prevent wide changes of PH or
hydrogen ion concentration in the vicinity of the cathode. To avoid the formation of
rough deposits, the anode is put in a cotton or synthetic fibre anode bag while in use
(Brimi and Luck, 1965).
Fluctuations in the operating temperature can have a pronounced effect on the
electrodeposited nickel and should be maintained within +/- 2°C of the recommended
temperature (Di Bari, 1994). However, changes in the operating conditions such as
current density, temperature, or PH (below 5.0) do not affect the physical properties of
the deposit. Chemical composition fluctuations exert far greater influences. Specimens
to be plated should be cleaned, degreased, and washed prior to plating. Tiny bubbles of
hydrogen gas evolving at the cathode may prevent deposition of metal there and gives
rise to a local pitting in the deposit. These bubbles can be dislodged by agitating the
solution (The International Nickel Company, (Mond)).

Appendices 214
Table 9. The Watts bath compositions and it operational conditions (Samuels, 1967).
Composition
Nickel sulphate, M S O 4 . 6H20
Nickel chloride, M C I 2 . 6H20
Boric acid, H 3 B O 3
P H
Temperature
Voltage
Current density
Agitation
Anode
Operating condition
300 g/1 of distilled water
60 g/1 of distilled water
40 g/1 of distilled water
4
55°C
1-3 volts
25 mA/cm 2
Vigorous stirring (to avoid pitting)
Anode nickel (99%)

Appendices 215
7.2 Appendix B:
Glow Discharge Optical Emission Spectroscopy
Glow Discharge Optical Emission Spectroscopy (GDOES) is a rapid depth profiling
technique using a Grimm-style 'hollow anode' lamp (Grimm, 1968). A schematic cross-
section of a Grimm lamp is shown in Figure 91. The sample is placed against the O-ring
which provides the seal between the sample and the cathode block. The cathode block
can be made from copper, although a ceramic material is preferred. The anode is
constructed from copper.
cooling argon te* pumpl t Teflon
dU
i
to -* spectrometer
quartz window
pump 2
Figure 91. Schematic diagram of a Grimm lamp (Berneron et al, 1980).

The sample is held in place by the vacuum in the lamp and a brass water-cooled block is
placed beside the sample in order to keep the sample cool during the sputtering process.
The block is pressed on the sample by a pneumatic mounting composed of a jack and a
drill which also provides the electrical connection to the sample.
Argon gas is bled through the anode where it is deferentially pumped to a pressure of ~
0.2 mbar and then ~ 700 V is applied between the anode and the sample. Consequently,
a current of- 60 mA flows between the sample and the inside of the hollow anode which
causes ionisation of the argon gas. Much of the ionisation occurs close to the sample
surface (Boumans, 1991) resulting in rapid and relatively uniform sputtering of the
sample surface which is defined by the diameter of the anode. The sputtered material
travels up the inside of the hollow anode where it is highly excited electronically by the
plasma. The excited atoms emit their characteristic electro magnetic spectra and the
wavelength of the spectra is characteristic of the composition of the layer being
sputtered. The concentration of the various elements is determined by spectral analysis
of the radiation emitted by the plasma.
A MgF2 window is used to pass the emissions from the lamp to a series of spectrometers
without absorption of any radiation in the wavelength band concerned. With
spectrophotometers covering the range 100-700 nm, detection of all elements in the
Periodic table is possible. Wavelengths between 200-700 nm, which includes most
metals, are detected by a polychromator while wavelengths in the range of 100-150nm,
belonging to H, O, Cl and N gases and absorbed by air in the polychromator. Therefore,
an evacuated nitrogen purged polychromator called FVUV Poly is used to detect these
far vacuum ultra violet emissions.

Appendices 217_
Since the intensity of emissions from each element is proportional to its concentration
within the matrix, semi-quantitative analysis of the spectrometer signals are possible.
Highly characterised standard materials, however, are required to carry out such analysis.
Since standard samples with high nitrogen contents were not available, the GDOES were
used only to give a qualitative depth profile the samples.

ices
7.3 Appendix C
Surface Roughness Measurement
A surface which is nominally flat and smooth will always have some roughness texture,
which may vary from fine to coarse, according to the finishing process. The term
"surface texture" refers to the fine irregularities (peaks and valleys) produced on the
surface by the different processes. Surface texture is an important property of an
engineering component affecting its quality and function in areas such as wear, contact
mechanics, lubrication, appearance, paint holding ability and the conformance of
products to specified dimensions. It is a result of the interaction of the physical
processes that have acted on the component in its formation and the material that the
component is made from. By convention, the texture comprises two components,
roughness and waviness. Roughness consists of the finer irregularities characteristic of
the process itself, such as grit spacing of a grinding wheel. Waviness consists of the
more widely spaced irregularities that are often produced by vibration during the
machining process. Usually, however, the terms "surface texture" and "roughness" are
used interchangeably, because roughness is specified and measured much more often
than waviness.
There are two types of profiling techniques for surface texture, profile methods or raster
area methods, depending on whether the height measurements are made simply along a
line or over an area. Both types of techniques develop quantitative knowledge of the
surface peaks and valleys by point-by-point measurement with a high-resolution probe.
The profile may be produced by optical interferometric fringes, by a contacting stylus
that traverses the surface, or by a noncontacting probe (Song and Vorburger, 1992).

Appendices 219_
The stylus method has been widely used by engineers, opticists, and tribologists and was
also used in this investigation. Therefore, the stylus technique and some of the related
parameters appearing in the thesis will be discussed briefly in this appendix.
In the instrument used, a diamond tipped stylus transverses the surface being profiled
with a constant speed. The shape of the stylus plays an important role and can influence
the appearance of the line profile it measures. Because the stylus tip has a finite
sharpness, it cannot show very fine detail and tends to distort some shapes. For example,
valleys in the surface are shown narrower than they actually are and peaks are shown
broader. Also, because only a fairly small portion of the surface can realistically be
measured, the profilometer data are not absolute values and should be used only as
relative data for comparison purposes.
The instrument converts the vertical height as a function of horizontal displacement to a
voltage as a function of time leading to a graphical representation of the surface by a line
profile. Once the trace has been produced, filters are applied numerically to the recorded
raw profile, enabling the removal of either short or long wavelength components
(Maddrell, 1991).
Traditionally, the analog out put of the profilometer is analysed in terms of the deviation
of the profile from the centreline. Two slightly different measures have been used, the
roughness average, Ra, and the root mean square value, RMS, (also called Rq). Ra is the
mean vertical deviation from the centreline through a prescribed sampling length. Thus,
the Ra value of the surface is the average height of the profile above and below the mean
line as illustrated in Figure 92 (Dagnall, 1980). It is the value most often used in Europe.

Appendices 220
iCentre line
u.
171 Centre line
Figure 92. Graphical derivation ofRa (a) profile with centre line, (b) lower portions of
the profile inverted and (c) Ra is the mean height of the profile.
The root mean square value, R M S , is the value most commonly used in the United States
(Larsen-Basse, 1992). It is calculated as the square root of the mean of the squares of
the deviations and represents the standard deviation of the height distribution. Ra and Rq
are closely related and are useful estimators of the average heights and depths of surface
profiles. Roughness average is used in the automotive and other metalworking industries
to specify the surface of the components. The RMS roughness is commonly specified for
the surfaces of optical components.
There are a great variety of surface parameters which have been developed to
characterise the function of engineering surfaces for particular applications and
explanation of all of them are out of the scope of this Appendix.

appendices
7.4 Appendix D:
Atomic Force Microscope
Atomic Force Microscope (AFM) belongs to Scanning Probe Microscopes (SPMs), a
family of instruments used to study the surface of materials. All the SPMs contain the
components shown in Figure 93. The AFM uses a very sharp tip (few microns long and
less than 100 A in diameter) to probe and map the morphology of a surface (Howland et
al, 1993). The tip is on the end of a cantilever with a low spring constant (of the order
of 1 Newton/m). In contact mode, the tip-to-sample spacing is fixed by maintaining a
constant and very low force on the cantilever, pushing the tip against the sample. This
force is in the range of interatomic forces (Van der Waals forces) (about IO"9 Newton, or
1/10000 of the weight of a fly (Babcock, 1994)), hence the name "atomic force"
microscopy (Strausser and Heaton, 1994). The force is low enough such that the tip
usually causes no damage to the surface under investigation, particularly for harder
surfaces. Interaction between the tip and specimen deflect the cantilever while the
specimen is moved by means of a piezoelectric scanner. The vertical motion of the tip as
it slides over the sample surface is detected by the change in the position of a laser beam
reflected from the back of the cantilever, see Figure 94. The measured cantilever
deflections allow a computer to generate a map of the surface topography.

Appendices 222
A way of sensing the vertical position of the tip
A feedback system to control the vertical position of the tip
\/
sharp \!/
A piezoelectric scanner which moves the tip over the sample (or the sample under the tip) in a raster pattern
A coarse positioning system to bring the tip into the general vicinity of the sample
A computer system that drives the scanner, measures data and converts the data into an image.
Figure 93. Schematic of a generalised scanning probe microscope (Howland et al,
1993).
Appendices 223
Split-Diode Photo detector
Sample
Laser Diode
Cantilever & Substrate
XYZ Single Tube Piezo Scanner
Figure 94. Beam deflection system for vertical motion detection. This system has the
sensitivity to detect vertical motion of 0.01 nm as the tip scans the sample surface
(Strausser and Heaton, 1994).

8. REFERENCES
Avner S., Introduction to physical metallurgy, McGraw-Hill, Inc., 1974.
Bangaro N.V., Voigt R.C., and Svoboda J. M., "Development of high performance
HSLA cast steel", unpublished paper.
Bell T., Birch B. J., Korotchenko V., and Evans S. P., Heat treatment '73, The Metals
Society, London, 1975, p. 51.
Bell T., Survey of the heat treatment of engineering components, The Iron and Steel
Institute, 1973, p.43.
BerghausB., German Patent, DPR 668,639, 1932.
Berghaus B., German Patent, DPR 851, 560, 1939.
Berneron R., Michael H, Gatois M., Heat treatment '79, The Metals Society, London,
1980, pp. 45.
Bobcock K., Photonics Spectra, Laurin Publishing Co., Inc., May 1994.
Boumans P. W. J. M., Spectrochim. Acta, 46B (1991) 711.
Brimi M. A., Luck J. R., Electrofinishing, American Elsevier, New York, 1965.
Brockman A., Tuler F. K, Journal of Applied Physics, 52 (1981) 468.
Chapman B., Glow Discharge Processes, John Wiley & Sons, New York, 1980.

References 225
Child H. C , Surface hardening of steel; Engineering design guides: 37, Oxford
university press, 1980, p. 18.
Cho K. S. and Lee C. O., Journal of Engineering Materials and Technology, 102 (1)
(1980) 229.
Colijn P. F., Mittemeijer E. J., and Rozenaal H. C. F., Z. Metallk., 74 (1983) 620.
Colligon J. S., Vacuum, 36 (7-9) (1986) 413.
Collins G. A. and Tendys J., Plasma Sources Science and Technology, 3 (1994) 10.
Collins G. A., Hutchings R., and Tendys J., Materials Science and Engineering, A139
(1991)171.
Collins G. A., Hutchings R., and Tendys J., Surface and Coatings Technology, 59
(1993) 267.
Collins G. A., Hutchings R., Short K. T., and Tendys J., Heat Treatment of Metals, 22
(1995)91.
Collins G. A., Hutchings R., Tendys J. and Samandi M., Surface and Coatings
Technology, 68/69 (1994) 285.
Collins G. A., Short K. T., Tendys J. and Van Der Valk C. H, "Control and
Performance of a Plasma Immersion Ion Implantation System for the Surface Treatment
of Metal Components", submitted to Surface and Coatings Technology.
Conrad J. R., Baumann S., Fleming R. And Meeker G. P., Journal of Applied Physics,
65 (1989) 1707.
225

References 226
Conrad J. R., Radke J. L., Dodd R. A., Worzala F. I, and N. C. Tran, Journal of
Applied Physics, 62 (11) (1987) 4591.
Dagnall H., Exploring Surface Texture, Rank Taylor Hobson, 1980.
Dahmen U., Ferguson P., and Westmacott K. H, Acta Metallurgica, 35 (1987) 1037.
Dearnaley G. and Hartley N. E. W., Proceedings of the 4th Conference on the Scientific
and Industrial Applications of Small Accelerators, Denton, TX, 1975, IEEE, New
York, 1976, p. 20.
Dearnaley G., Goode P. D., Minter F. J., Peacock A. T., Hughes W. and Proctor G. W.,
Vacuum, 36 (11/12) (1986) p. 807.
Di Bari G. A., "Nickel Plating", in ASM Handbook, Vol. 5, Metals Park, OH, 1994, p.
201.
Dressier S., Surface Modification Technologies: An Engineer Guide, in T. S. Sudarshan
(ed.), Marcel Dekker, Inc., New York, 1989.
Edenhofer B. and. Bewley T. J, Heat Treatment '76, The Metals Society, London, 1976,
p. 7.
Edenhofer B., Harterei-Tech. Mitt.29 (1974) 105.
Edenhofer B., Heat Treatment '79, The Metals Society, London, 1980, p. 52.
Edenhofer B., Heat Treatment of Metals, 1974. part 1, p. 23.
Edenhofer B., Heat Treatment of Metals, 1974. part 2, p. 59.
Egan J. J.: US Patent 1837256, 1931.
226

References 227
Elder J. E. Thamburaj R., and Patnaik P. C, Surface Engineering, 5 (1) (1989) 55.
Fast J. D. and Verrijp M. B., Journal of Iron and Steel Institute, 176 (1954) 24.
Fenske G., "Ion Implantation", in ASM Handbook, Vol. 18, ASM, Metals Park, OH,
1992.
Field F. H. and Franklin J. L., Electron Impact Phenomena, Academic Press, 1957.
Goldschmidt H. J., Interstitial alloys, Butterworths, London, 1967.
Grill A. and ItzhakD., Thin Solid Films, 101 (1983) 219.
Grimm W., Spectrochim. Acta, 23B (1968) 433.
Gulyaev A., Physical Metallurgy, Vol. 1, Mir publishers, Moscow, 1980, p.320.
Hanada Y, Bell T., Sun Y, Surface Engineering, 11 (2) (1995) 149.
Handbook of chemistry and physics, 55th edn, section F, Dow Chemicals, 1974-1975.
Hartley N. E. W. and Watkins R. E. J., in Dearnaley G. (ed.), Materials Engineering
Applied, 1 (1978) 28.
Hartley N. E. W., Dearnaley G. and Turner J. F., Conference Proceedings on Ion
Implantation, YorktownHts, 1972, (PlenumPress, 1973), p. 423.
Hill R. E. and Abbaschian R., Physical Metallurgy Principles, PWS-KENT, Boston,
MA, 3rd edn., 1993.
Howatson A. M., Introduction to Gas Discharges, Pergamon Press, London, 1965.
227

References 228
Howland R. S., Okagaki J., and Mitobe L., How to Buy a Scanning Probe Microscope,
Key Features to Look for When Purchasing an SPM, Park Scientific Instruments, 1993.
Hudis M., Journal of Applied Physics, AA (A) (1973) 1489.
Hutchings R, Materials Science and Engineering, A184 (1994) 87.
Hutchings R., Collins G. A., and Tendys J., Surface and Coatings Technology, 51
(1992) 489.
Hutchings R., Kenny M. J., Miller D. R., and Yeung W. Y., Proceedings of the 1st
Australian International Conference on Surface Engineering: Practice and Prospects,
Adelaide, March 1991, Techsearch, Adelaide, 1991.
Inal O. T. and Kazim O., in Ion Nitriding, Proceedings of an International Conference
on Ion-Nitriding, Spalvins T. (Ed.), 15-17 Sep. 1986, Clev., Ohio, ASM Int., 1987, p.
31.
Inal O. T. and Robino C. V., Thin Solid Films, 95 (1982) 313.
Jack D.H. and Jack K. H, Materials Science and Engineering, 11(1973) 1.
Jack K. H., Acta Crystallographica, 5 (1952) 404.
Jack K. H., Heat treatment '73, The Metals Society, London, 1975, p. 39.
Jack K. H., High Nitrogen Steels, HNS 88, Proceedings of the international conference
organised by The Institute of Metals and the Societe Francais de Metallurgie and held at
Lille in France on May 18-20, 1988, Edited by Foot J. and Hendry A., The Institute of
Metals, 1989, p. 117.
228

References 229
Jack K. H , Proceedings of the Royal Society, A, 195 (1948) 34.
Japanese Industrial Standard (JIS) G0562, Surface Engineering, 11 (1) (1995) 57.
Jones C. K., Martin S. W., Sturges D. J., Hudis M., Heat Treatment'73, Metals Society,
London, 1975, p. 71.
Karpenko G. V., Pokhmurovskii V. I., Dalisov V.B., Zamikhovskii V. S., Influence of
diffusion coatings on the strength of steel, Trans Tech Publications, Switzerland, 1979.
Keller K., Harterei-Tech. Mitt. 26 (1971) 120.
Keller K, PhD Thesis, Technical University of Rhine-Westphalia, 1969.
Knerr C. H., Rose T. C, Filkowski J. H, "Gas Nitriding", in ASM Handbook, Vol.4,
A S M , Metals Park, OH, 1991, p. 387.
Kolbel J., Die Nitridschichtbildung bei der Climmnitrierung; Westd. VerlagKoln ,1965,
Forschungsberichte des Landes Nordrhein-Westfalen, Nr. 1555.
Kool W. H, Mittemeijer E. J., and Schalkoord D., Mikrochimica Acta, Suppl. 9 (1981)
349.
Kossowsky R. (ed.), "Surface Modification Engineering: Volume 1 Fundamental
Aspects", C R C press, Boca Raton, Florida, 1989.
Kossowsky R. (ed.), Surface Modification Engineering: Volume 2 Technological
Aspects, C R C press, Boca Raton, Florida, 1989.
Kovacs W. and Russelll W., In Spalvins T. (ed.), Ion Nitriding, ASM, Metals Park, OH,
1987, p. 9.
229

References 230
Kubaschewski O., Iron-Binary phase diagrams, Springer-Verlag, Berlin, 1982, p. 67.
Kuppusami P., Sundararaman D. and Raghunathan V. S., Surface Engineering, 9 (2)
(1993) 137.
Lakhtin Yu. M., Krymskii Yu. M.; Protective Coating on Metals, 2 (1970) 179.
Lampe T., Eisenberg S., and Laudien G., Surface Engineering, 9 (1993) 69.
Lanagan J., "Plasma Surface Engineering of Titanium alloys", PhD thesis, University of
Birmingham, 1988.
Larsen-Basse J., in ASMHandbook, Vol. 18, ASM, Metals Park, OH, 1992, p. 27.
Legg K. O. and Solinck-Legg H, in Sudarshan T. S. and Bhat D. G. (ed.), Trends in Ion
Implantation and Ion-Assisted Coatings, Proceedings of the 1st International
Conference on Surface Modification Technologies, Phoenix, AZ, Jan. 1988, The
Metallurgical Society of ATME, Warrendale, PA, 1988, p. 79.
Leutenecher R., in H. K. Pulker. (ed.), Surface Modifications by Ion Beam Techniques,
John Wiley and Sons, 1989, p.241.
Lightfoot B. J. and Jack D. H, Heat treatment '73, The Metals Society, London, 1975, p.
59.
Lisper G. G., Vacuum, 45 (5) (1994) 525.
Loh N. L., "Plasma Nitriding and the Fatigue Properties of 722M27 Steel", PhD
Thesis, Liverpool University, 1980.
230

References 231
Maddrell E. R., "A Review of the Techniques and Applications of Surface Roughness
Measurement", BHP CPD Research and Technology Report No. 1039, Jan. 1991.
Mahboubi F., Samandi M., Dunne D. and Collins A. G., Proceedings of the 5th Word
Seminar on Heat Treatment and Surface Engineering, 26-29 Sept. 1995, Isfahan, Iran.
Mahboubi F., Samandi M., Dunne D., "Plasma Immersion Ion Implantation and RF
Plasma Nitriding of a Microalloyed Steel"; "submitted" to Surface and Coating
Technology.
Mahboubi F., Samandi M., Dunne D., "The Heat Is On"; Proceedings of the 1st
International Conference on heat treatment, 24 & 25 May, 1995, Melbourne, Victoria,
Institute of Metals & Materials, Australia.
Mahboubi F., Samandi M., Dunne D., Bloyce A., Bell T, Surface and Coating
Technology, 71 (1995) 135.
Marciniak A., and Karpinski T.; Industrial Heating, April 1980, p. 42.
Meijering J. L., Advances in material research, Wiley Interscience, New York, Vol. 5,
1971, p. 1.
Metals Handbook Desk Edition, Boyer H. E., and Gall T. L.(eds.), ASM, Metals Park,
OH, 1985.
Mongis J., Peyre J. P. and Tournier C, Heat treatment of Metals, 3 (1984) 71.
Mridha S. and Jack D. H., Metallography, Elsevier Science Publishing Co., Inc., 1982, p
163.
231

References 232
Nasser E., Fundamentals of Gaseous Ionisation and Plasma Electronics, N e w York,
Willey, 1971.
Nickel Plating, Technique and Application, the International Nickel Company(Mond)
Limited.
O'Brien J. M., "Plasma (Ion) Nitriding", in ASM Handbook, Vol.4, ASM, Metals Park,
OH, 1991, p. 420.
Palmiere E. J., Burke M. G., Garcia C. I. and DeArdo A. J., in DeArdo A. J. (ed.),
Processing, Microstructure and Properties of HSLA Steels, The Minerals, Metals and
Materials Society, Warrendale, PA, 1988, p. 439.
Paules J. R., JOM, January 1991, p. 41.
Penning F. M., Electrical Discharges in Gases, Philips Technical Library, 1957.
Petijean L., Ricard A., Casedesus P., Michel H, and Gantois M Conference
Proceedings of the 4th International Colloqium on Plasmas and Cathodic Sputtering,
Nice, 1982, p. 183.
PetitjeanL. and Ricard A., Journal of Applied Physics, 17 (1984) 919.
Repas P. E., Microalloyed HSLA Steels, ASM International, Metals Park, OH, 1988, p.
5.
Ricard A., Oseguera J., Michel H, Gantois M.; Proceedings of the 1st International
Conference on Plasma Surface Engineering, Garmisch-Partenkirchen, FRG, 1988,
DGM, 1989, p.83.
232

References 233
Ricard A., Petitjean L., Casedesus P.; Conference Proceedings of the 4th International
Colloqium on Plasmas and Cathodic Sputtering, Nice, 1982, p. 25.
Rickerby D.S., Hendry A. and Jack K. H, Heat Treatment '81, The Metals Society,
London, 1983, p. 130.
Rie K. T., Ion nitriding and Ion carburising, Proceedings of the 2nd International
Conference on Ion nitriding/carburizing, 18-20 Sept. 1989, Cincinnati, Ohio, USA
ASM International, cl990, p. 45.
Robino C. V. and Inal 0. T., Materials Science and Engineering, 59 (1983) 79.
Rossanagel S. M., Cuomo J. J., Westwood W. D., Handbook of Plasma Processing
Technology, Noyes Publications, New Jersey, 1990.
Rossnagel S. M., Cuomo J. J., in Westwood W. D. (ed.), Handbook of Plasma
Processing Technology: Fundamentals, Etching, Deposition, and Surface Interactions,
NOYES, Park Ridge, New Jersey, USA, 1990.
Rozendaal H. C. F., Colijn P. F., and Mittemeijer, Surface Engineering, 1 (1985) 30.
Ruhl R. C. And Cohen M., Transaction AIME, 245 (1969) 241.
Samandi M., Li X. and Shedden B. A., Conference Proceedings, Microscopy: Materials
& Techniques, Mascot, New South Wales, Australia, Edited by Institute of Metals and
Materials Australia Ltd., 21-22 Sept., 1993, p. 31.
Samandi M., Pauza A., Hatziandoniou G., Yasbandha H., Hutchings R., Collins G. A,
and Tendys J., Surface and Coating Technology, 54-55 (1993) 447.
233

References 234
Samandi M., Pauza B. A., Hatziandonioum G., Yasbandha H , Hutchings R., Collins G.
A. and Tendys J., Surface and Coating Technology, 54-55 (1992) 447.
Samandi M., Shedden B. A, Bell T., Collins G. A, Hutchings R., and Tendys, Journal
of Vacuum Science and Technology, B, 12 (1004) 935.
Samandi M., Shedden B. A., Smith D. I, Collins G. A., Hutchings R., and Tendys J.,
Surface and Coating Technology, 59 (1993) 261.
Samuels L. E., Metallographic Polishing by Mechanical Methods, Sir Isaac Pitman &
Sons Ltd., 1967.
Shoemaker R., Industrial Heating, Al (9) (1975) 22.
Sigmound P., Physical Review, 184 (2) (1969) 383.
Slycke J. and Sproge L., Surface Engineering, 5 (2) (1989) 125.
Solinck-Legg H and Legg K. 0., in Sudarshan T. S. (ed.), Surface Modification
Technologies, An Engineer's Guide, Marcel Dekker, New York and Basel, 1989.
Somers M. A. J. and Mittemeijer E. J., Materials Science Forum, 102-104 (1992) 223.
Somers M. A. J., " Internal and External Nitriding and Nitrocarburising of Iron and
Iron-Based Alloys", PhD thesis, Delft University of Technology, 1989.
Song J. F., and Vorburger T. V., "Surface Texture", in ASM Handbook, Vol.18, ASM,
Metals Park, OH, 1992, p.334.
Spalvins T., Ion Nitriding, Splavins T. (ed.), ASM, 1987, p. 1.
234

References 235
Strafford K. N., Datta P. K , Gray J. S., Surface Engineering Practice, Processes,
Fundamentals and Applications in Corrosion and Wear, Ellis Horwood, 1990.
Strausser Y. E., and Heaton M. G., American Laboratory, May 1994.
Szabo A., Wilhelmi H, Harterei-Tech. Mitt., 39 (1984) 148.
Tendys J., Donelly I. J., Kenny M. J., and Polloock J. T. A., Applied Physics Letters, 53
(1988)2143.
Thelning K. E., Steel and its heat treatment, Bofors Handbook, Butterworths, Boston,
1975.
Thornton J. A, Ion Nitriding, Splavins T. (ed.), ASM, 1987, p. 19.
Tibbets G. G., Journal of Applied Physics, 45 (11) (1974) 5072.
Van Wiggen P.C., Rozendaal H. C. F. and Mittemeijer E. J., Journal of Materials
Science, 20(1985)4561.
Wear Resistant Surfaces, A Guide to Their Production, Properties and Selection,
Department of Trade and Industry (Britain), Her Majesty's Stationary Office, London,
1986.
Wehner G. K, Physical Review, 102 (3) (1965) 690.
Wells A. and Strydom L. le R., Surface Engineering, 2 (1986) 263.
Wells A. and Strydom L. le R., Surface Engineering, 4 (1988) 55.
Xu B., Zhang Y.; Surface Engineering, 1987, 3 (3) (1987) 226.
235