1999 annual report€¦ · total equity before distribution ... income, changes in stockholders’...
TRANSCRIPT
42 Brief Balance Sheet
43 Brief Statement of Income
43 Market Price, Net Worth, Earnings
and Dividends Per Share
44 Auditors’ Opinion
44 Supervisors’ Report
45 Financial Analysis
46 Review and Analysis of Financial
Status and Operating Results
47 Report of Independent Accountants
and Financial Statements
83 Consolidated Financial Statements
1999 Annual Report
f i n a n c i a l r e v i e w
4 2
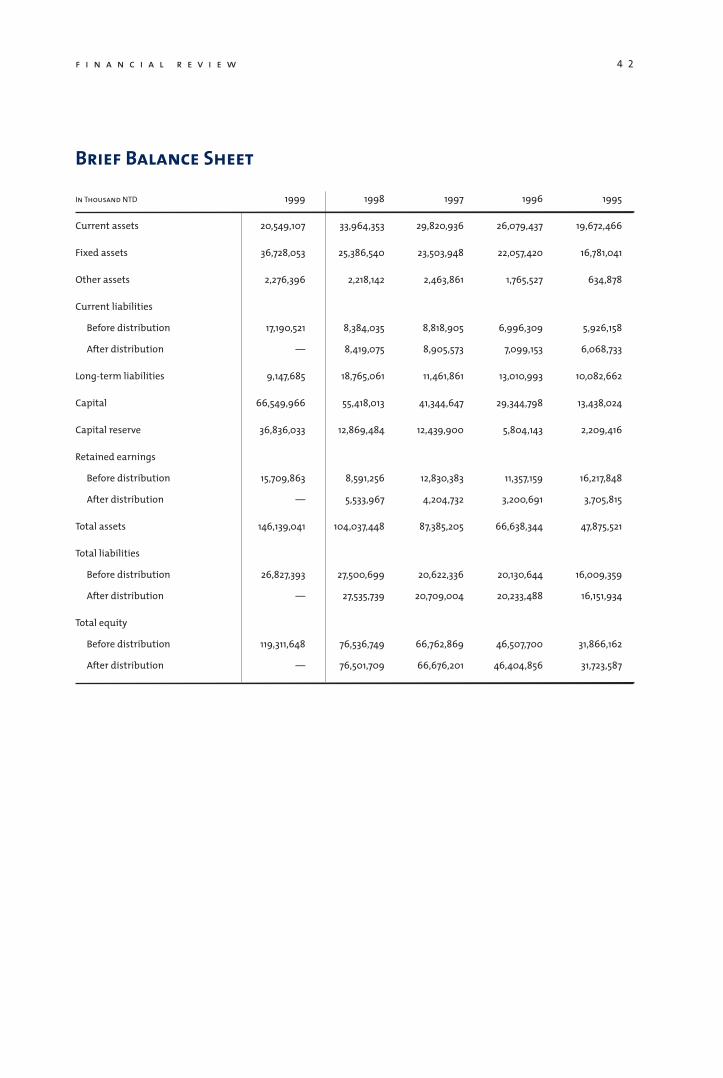
Brief Balance Sheet
f i n a n c i a l r e v i e w
In Thousand NTD 1999 1998 1997 1996 1995
Current assets 20,549,107 33,964,353 29,820,936 26,079,437 19,672,466
Fixed assets 36,728,053 25,386,540 23,503,948 22,057,420 16,781,041
Other assets 2,276,396 2,218,142 2,463,861 1,765,527 634,878
Current liabilities
Before distribution 17,190,521 8,384,035 8,818,905 6,996,309 5,926,158
After distribution — 8,419,075 8,905,573 7,099,153 6,068,733
Long-term liabilities 9,147,685 18,765,061 11,461,861 13,010,993 10,082,662
Capital 66,549,966 55,418,013 41,344,647 29,344,798 13,438,024
Capital reserve 36,836,033 12,869,484 12,439,900 5,804,143 2,209,416
Retained earnings
Before distribution 15,709,863 8,591,256 12,830,383 11,357,159 16,217,848
After distribution — 5,533,967 4,204,732 3,200,691 3,705,815
Total assets 146,139,041 104,037,448 87,385,205 66,638,344 47,875,521
Total liabilities
Before distribution 26,827,393 27,500,699 20,622,336 20,130,644 16,009,359
After distribution — 27,535,739 20,709,004 20,233,488 16,151,934
Total equity
Before distribution 119,311,648 76,536,749 66,762,869 46,507,700 31,866,162
After distribution — 76,501,709 66,676,201 46,404,856 31,723,587
u m c a n n u a l r e p o r t 1 9 9 9 4 3
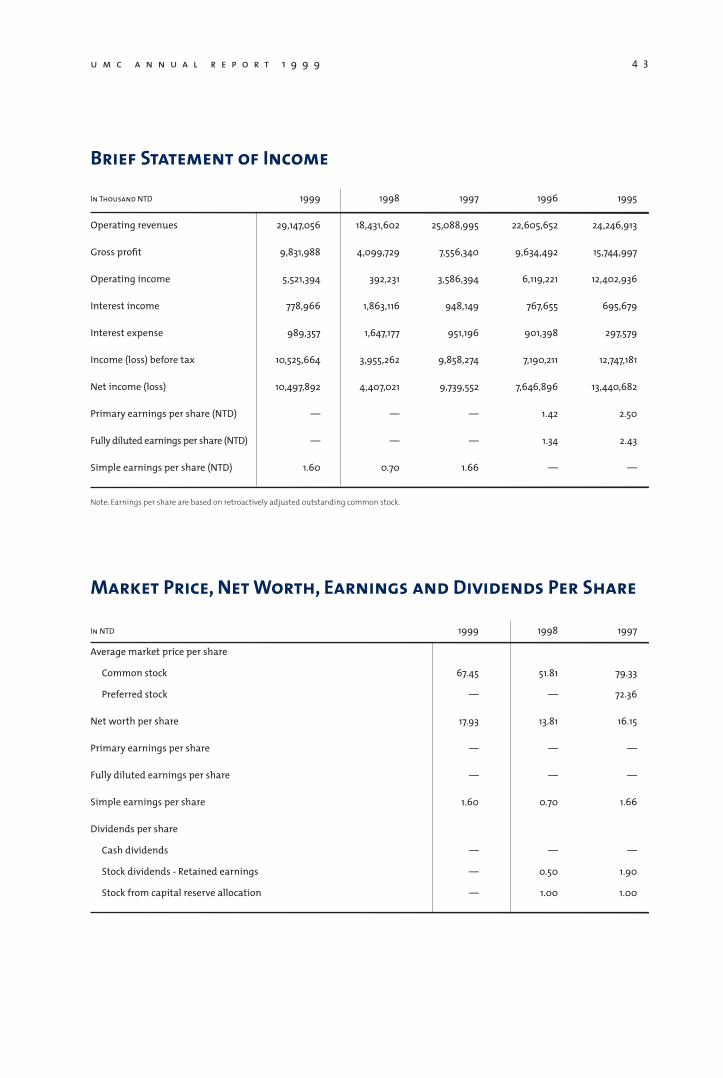
Brief Statement of Income
In Thousand NTD 1999 1998 1997 1996 1995
Operating revenues 29,147,056 18,431,602 25,088,995 22,605,652 24,246,913
Gross profit 9,831,988 4,099,729 7,556,340 9,634,492 15,744,997
Operating income 5,521,394 392,231 3,586,394 6,119,221 12,402,936
Interest income 778,966 1,863,116 948,149 767,655 695,679
Interest expense 989,357 1,647,177 951,196 901,398 297,579
Income (loss) before tax 10,525,664 3,955,262 9,858,274 7,190,211 12,747,181
Net income (loss) 10,497,892 4,407,021 9,739,552 7,646,896 13,440,682
Primary earnings per share (NTD) — — — 1.42 2.50
Fully diluted earnings per share (NTD) — — — 1.34 2.43
Simple earnings per share (NTD) 1.60 0.70 1.66 — —
Note: Earnings per share are based on retroactively adjusted outstanding common stock.
In NTD 1999 1998 1997
Average market price per share
Common stock 67.45 51.81 79.33
Preferred stock — — 72.36
Net worth per share 17.93 13.81 16.15
Primary earnings per share — — —
Fully diluted earnings per share — — —
Simple earnings per share 1.60 0.70 1.66
Dividends per share
Cash dividends — — —
Stock dividends - Retained earnings — 0.50 1.90
Stock from capital reserve allocation — 1.00 1.00
Market Price, Net Worth, Earnings and Dividends Per Share
4 4
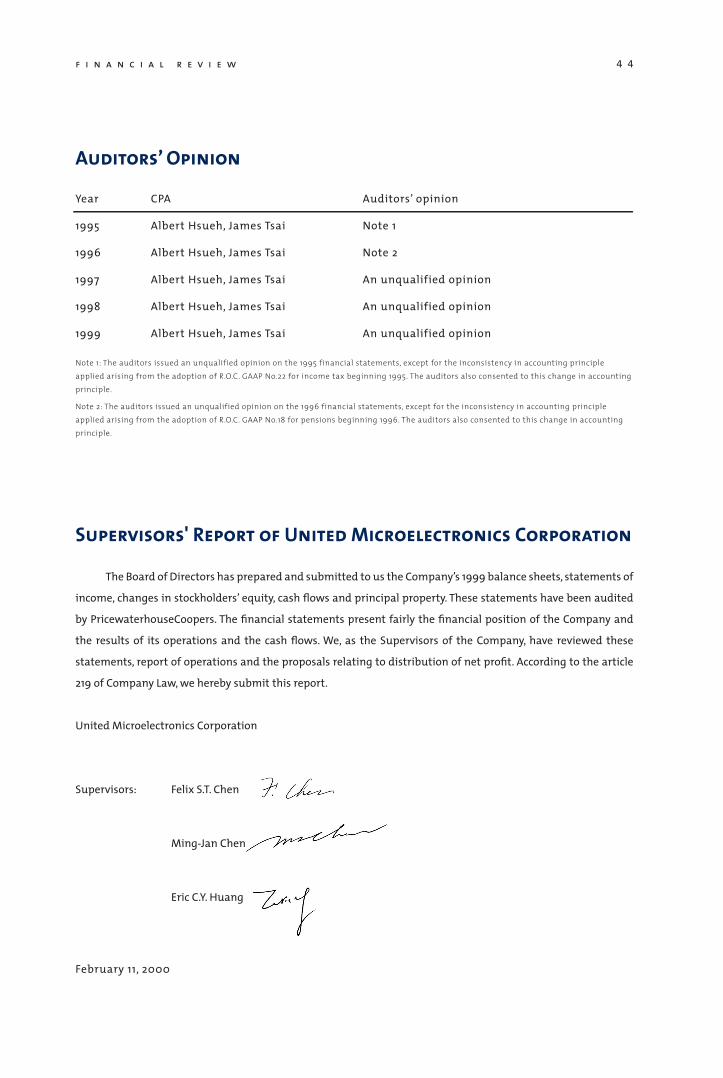
Supervisors' Report of United Microelectronics Corporation
f i n a n c i a l r e v i e w
Year CPA Auditors’ opinion
1995 Albert Hsueh, James Tsai Note 1
1996 Albert Hsueh, James Tsai Note 2
1997 Albert Hsueh, James Tsai An unqualified opinion
1998 Albert Hsueh, James Tsai An unqualified opinion
1999 Albert Hsueh, James Tsai An unqualified opinion
Note 1: The auditors issued an unqualified opinion on the 1995 financial statements, except for the inconsistency in accounting principle applied arising from the adoption of R.O.C. GAAP No.22 for income tax beginning 1995. The auditors also consented to this change in accounting principle.
Note 2: The auditors issued an unqualified opinion on the 1996 financial statements, except for the inconsistency in accounting principle applied arising from the adoption of R.O.C. GAAP No.18 for pensions beginning 1996. The auditors also consented to this change in accounting principle.
Auditors’ Opinion
The Board of Directors has prepared and submitted to us the Company’s 1999 balance sheets, statements of
income, changes in stockholders’ equity, cash flows and principal property. These statements have been audited
by PricewaterhouseCoopers. The financial statements present fairly the financial position of the Company and
the results of its operations and the cash flows. We, as the Supervisors of the Company, have reviewed these
statements, report of operations and the proposals relating to distribution of net profit. According to the article
219 of Company Law, we hereby submit this report.
United Microelectronics Corporation
Supervisors: Felix S.T. Chen
Ming-Jan Chen
Eric C.Y. Huang
February 11, 2000
u m c a n n u a l r e p o r t 1 9 9 9 4 5
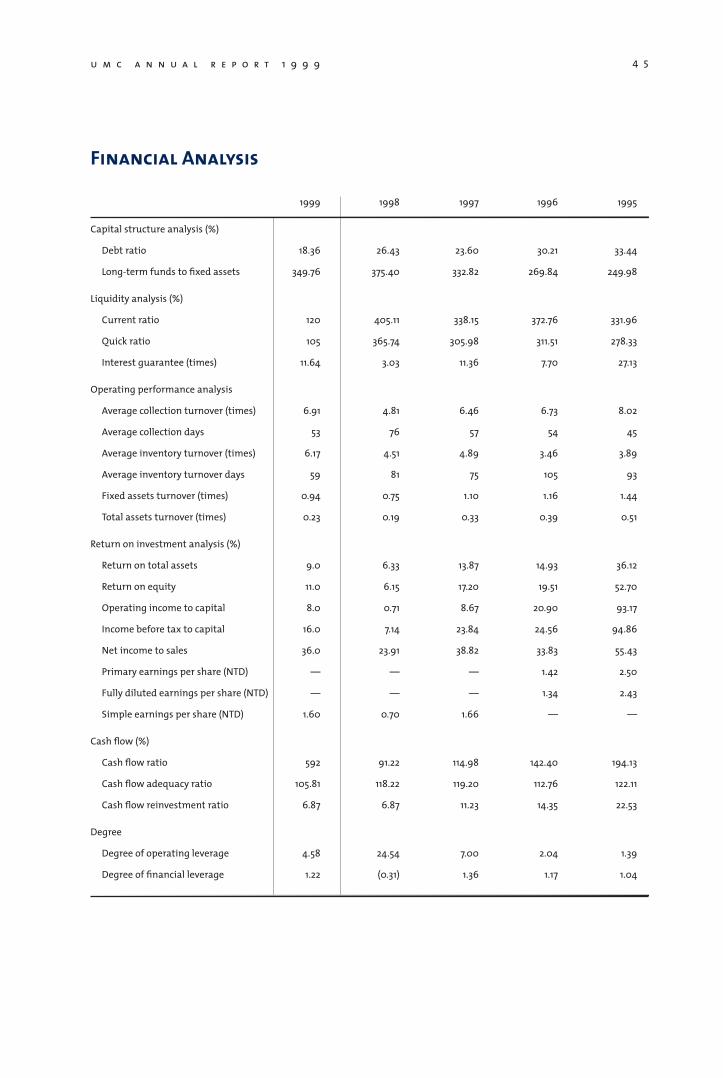
1999 1998 1997 1996 1995
Capital structure analysis (%)
Debt ratio 18.36 26.43 23.60 30.21 33.44
Long-term funds to fixed assets 349.76 375.40 332.82 269.84 249.98
Liquidity analysis (%)
Current ratio 120 405.11 338.15 372.76 331.96
Quick ratio 105 365.74 305.98 311.51 278.33
Interest guarantee (times) 11.64 3.03 11.36 7.70 27.13
Operating performance analysis
Average collection turnover (times) 6.91 4.81 6.46 6.73 8.02
Average collection days 53 76 57 54 45
Average inventory turnover (times) 6.17 4.51 4.89 3.46 3.89
Average inventory turnover days 59 81 75 105 93
Fixed assets turnover (times) 0.94 0.75 1.10 1.16 1.44
Total assets turnover (times) 0.23 0.19 0.33 0.39 0.51
Return on investment analysis (%)
Return on total assets 9.0 6.33 13.87 14.93 36.12
Return on equity 11.0 6.15 17.20 19.51 52.70
Operating income to capital 8.0 0.71 8.67 20.90 93.17
Income before tax to capital 16.0 7.14 23.84 24.56 94.86
Net income to sales 36.0 23.91 38.82 33.83 55.43
Primary earnings per share (NTD) — — — 1.42 2.50
Fully diluted earnings per share (NTD) — — — 1.34 2.43
Simple earnings per share (NTD) 1.60 0.70 1.66 — —
Cash flow (%)
Cash flow ratio 592 91.22 114.98 142.40 194.13
Cash flow adequacy ratio 105.81 118.22 119.20 112.76 122.11
Cash flow reinvestment ratio 6.87 6.87 11.23 14.35 22.53
Degree
Degree of operating leverage 4.58 24.54 7.00 2.04 1.39
Degree of financial leverage 1.22 (0.31) 1.36 1.17 1.04
Financial Analysis
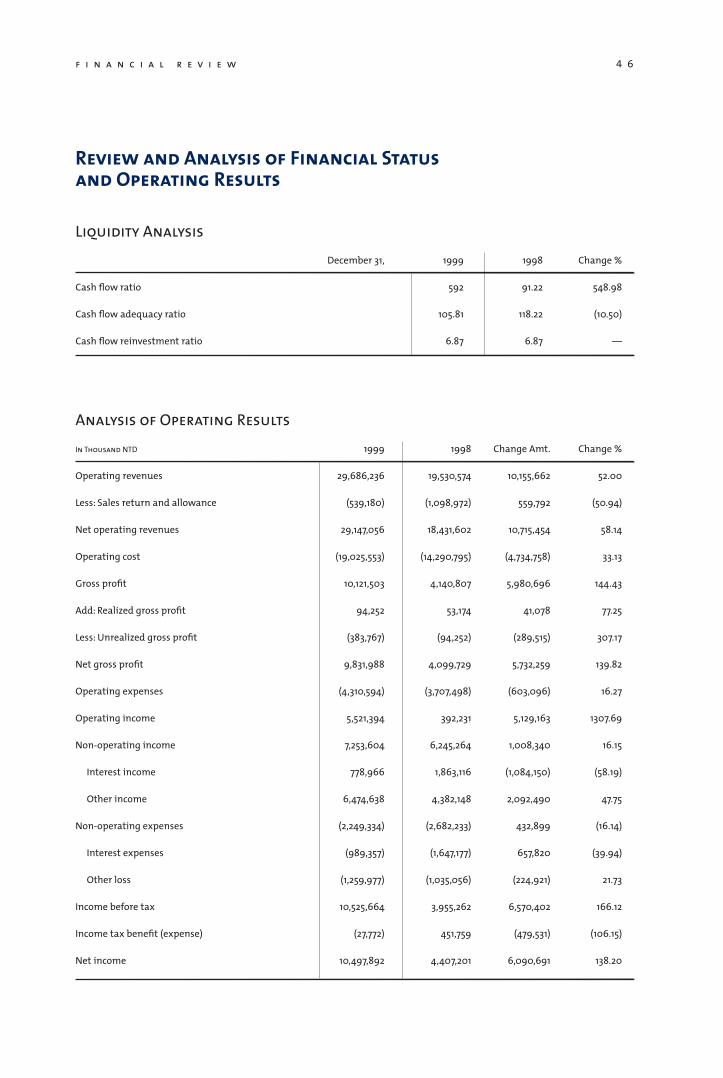
4 6
Liquidity Analysis
December 31, 1999 1998 Change %
Cash flow ratio 592 91.22 548.98
Cash flow adequacy ratio 105.81 118.22 (10.50)
Cash flow reinvestment ratio 6.87 6.87 —
Analysis of Operating Results
In Thousand NTD 1999 1998 Change Amt. Change %
Operating revenues 29,686,236 19,530,574 10,155,662 52.00
Less: Sales return and allowance (539,180) (1,098,972) 559,792 (50.94)
Net operating revenues 29,147,056 18,431,602 10,715,454 58.14
Operating cost (19,025,553) (14,290,795) (4,734,758) 33.13
Gross profit 10,121,503 4,140,807 5,980,696 144.43
Add: Realized gross profit 94,252 53,174 41,078 77.25
Less: Unrealized gross profit (383,767) (94,252) (289,515) 307.17
Net gross profit 9,831,988 4,099,729 5,732,259 139.82
Operating expenses (4,310,594) (3,707,498) (603,096) 16.27
Operating income 5,521,394 392,231 5,129,163 1307.69
Non-operating income 7,253,604 6,245,264 1,008,340 16.15
Interest income 778,966 1,863,116 (1,084,150) (58.19)
Other income 6,474,638 4,382,148 2,092,490 47.75
Non-operating expenses (2,249,334) (2,682,233) 432,899 (16.14)
Interest expenses (989,357) (1,647,177) 657,820 (39.94)
Other loss (1,259,977) (1,035,056) (224,921) 21.73
Income before tax 10,525,664 3,955,262 6,570,402 166.12
Income tax benefit (expense) (27,772) 451,759 (479,531) (106.15)
Net income 10,497,892 4,407,201 6,090,691 138.20
f i n a n c i a l r e v i e w
Review and Analysis of Financial Status and Operating Results
u m c a n n u a l r e p o r t 1 9 9 9 4 7
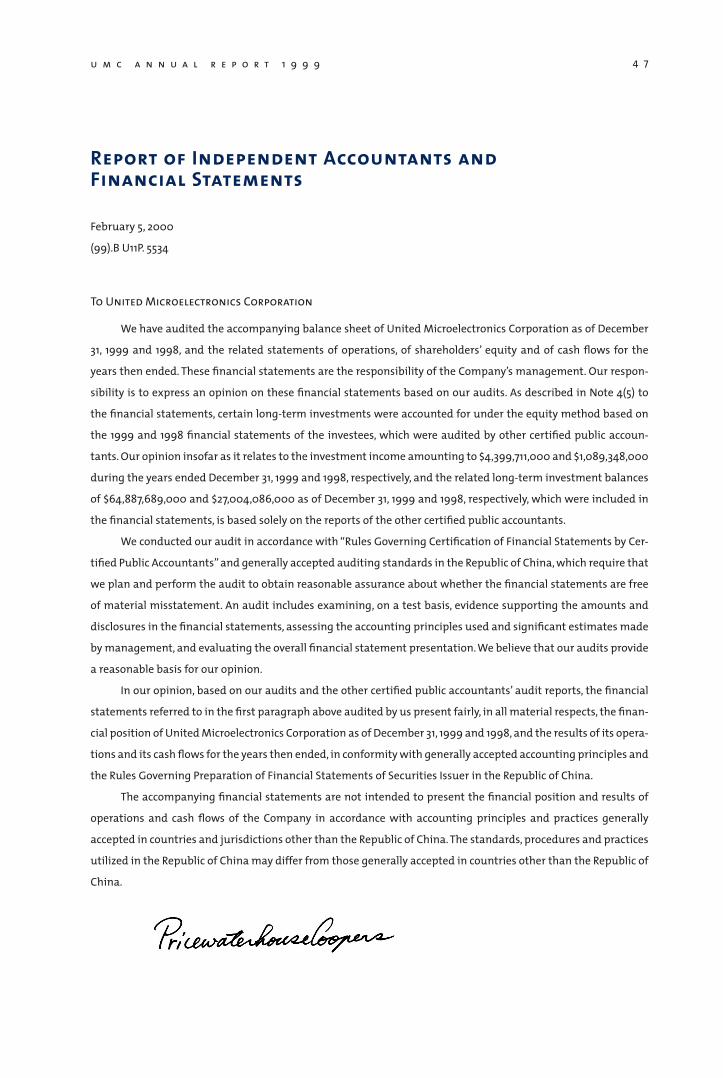
Report of Independent Accountants andFinancial Statements
February 5, 2000
(99).B U11P. 5534
To United Microelectronics Corporation
We have audited the accompanying balance sheet of United Microelectronics Corporation as of December
31, 1999 and 1998, and the related statements of operations, of shareholders’ equity and of cash flows for the
years then ended. These financial statements are the responsibility of the Company’s management. Our respon-
sibility is to express an opinion on these financial statements based on our audits. As described in Note 4(5) to
the financial statements, certain long-term investments were accounted for under the equity method based on
the 1999 and 1998 financial statements of the investees, which were audited by other certified public accoun-
tants. Our opinion insofar as it relates to the investment income amounting to $4,399,711,000 and $1,089,348,000
during the years ended December 31, 1999 and 1998, respectively, and the related long-term investment balances
of $64,887,689,000 and $27,004,086,000 as of December 31, 1999 and 1998, respectively, which were included in
the financial statements, is based solely on the reports of the other certified public accountants.
We conducted our audit in accordance with “Rules Governing Certification of Financial Statements by Cer-
tified Public Accountants” and generally accepted auditing standards in the Republic of China, which require that
we plan and perform the audit to obtain reasonable assurance about whether the financial statements are free
of material misstatement. An audit includes examining, on a test basis, evidence supporting the amounts and
disclosures in the financial statements, assessing the accounting principles used and significant estimates made
by management, and evaluating the overall financial statement presentation. We believe that our audits provide
a reasonable basis for our opinion.
In our opinion, based on our audits and the other certified public accountants’ audit reports, the financial
statements referred to in the first paragraph above audited by us present fairly, in all material respects, the finan-
cial position of United Microelectronics Corporation as of December 31, 1999 and 1998, and the results of its opera-
tions and its cash flows for the years then ended, in conformity with generally accepted accounting principles and
the Rules Governing Preparation of Financial Statements of Securities Issuer in the Republic of China.
The accompanying financial statements are not intended to present the financial position and results of
operations and cash flows of the Company in accordance with accounting principles and practices generally
accepted in countries and jurisdictions other than the Republic of China. The standards, procedures and practices
utilized in the Republic of China may differ from those generally accepted in countries other than the Republic of
China.
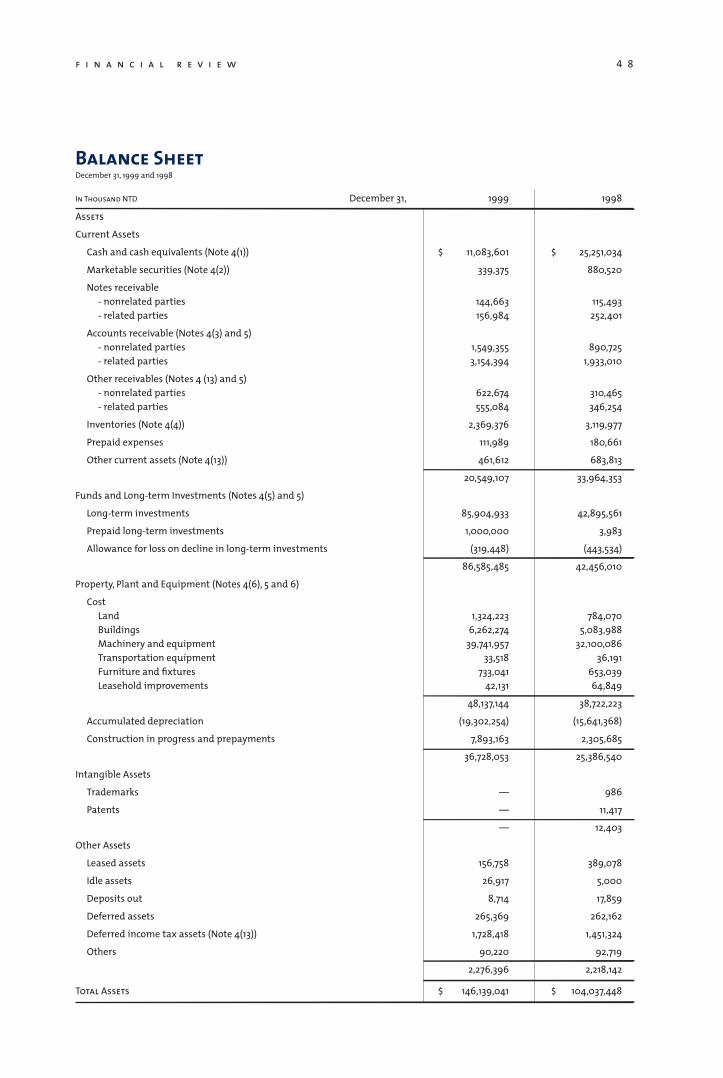
4 8f i n a n c i a l r e v i e w
Balance SheetDecember 31, 1999 and 1998
In Thousand NTD December 31, 1999 1998
Assets
Current Assets
Cash and cash equivalents (Note 4(1)) $ 11,083,601 $ 25,251,034
Marketable securities (Note 4(2)) 339,375 880,520
Notes receivable - nonrelated parties 144,663 115,493 - related parties 156,984 252,401
Accounts receivable (Notes 4(3) and 5) - nonrelated parties 1,549,355 890,725 - related parties 3,154,394 1,933,010
Other receivables (Notes 4 (13) and 5) - nonrelated parties 622,674 310,465 - related parties 555,084 346,254
Inventories (Note 4(4)) 2,369,376 3,119,977
Prepaid expenses 111,989 180,661
Other current assets (Note 4(13)) 461,612 683,813
20,549,107 33,964,353
Funds and Long-term Investments (Notes 4(5) and 5)
Long-term investments 85,904,933 42,895,561
Prepaid long-term investments 1,000,000 3,983
Allowance for loss on decline in long-term investments (319,448) (443,534)
86,585,485 42,456,010
Property, Plant and Equipment (Notes 4(6), 5 and 6)
Cost Land 1,324,223 784,070 Buildings 6,262,274 5,083,988 Machinery and equipment 39,741,957 32,100,086 Transportation equipment 33,518 36,191 Furniture and fixtures 733,041 653,039 Leasehold improvements 42,131 64,849
48,137,144 38,722,223
Accumulated depreciation (19,302,254) (15,641,368)
Construction in progress and prepayments 7,893,163 2,305,685
36,728,053 25,386,540
Intangible Assets
Trademarks — 986
Patents — 11,417
— 12,403
Other Assets
Leased assets 156,758 389,078
Idle assets 26,917 5,000
Deposits out 8,714 17,859
Deferred assets 265,369 262,162
Deferred income tax assets (Note 4(13)) 1,728,418 1,451,324
Others 90,220 92,719
2,276,396 2,218,142
Total Assets $ 146,139,041 $ 104,037,448
u m c a n n u a l r e p o r t 1 9 9 9 4 9
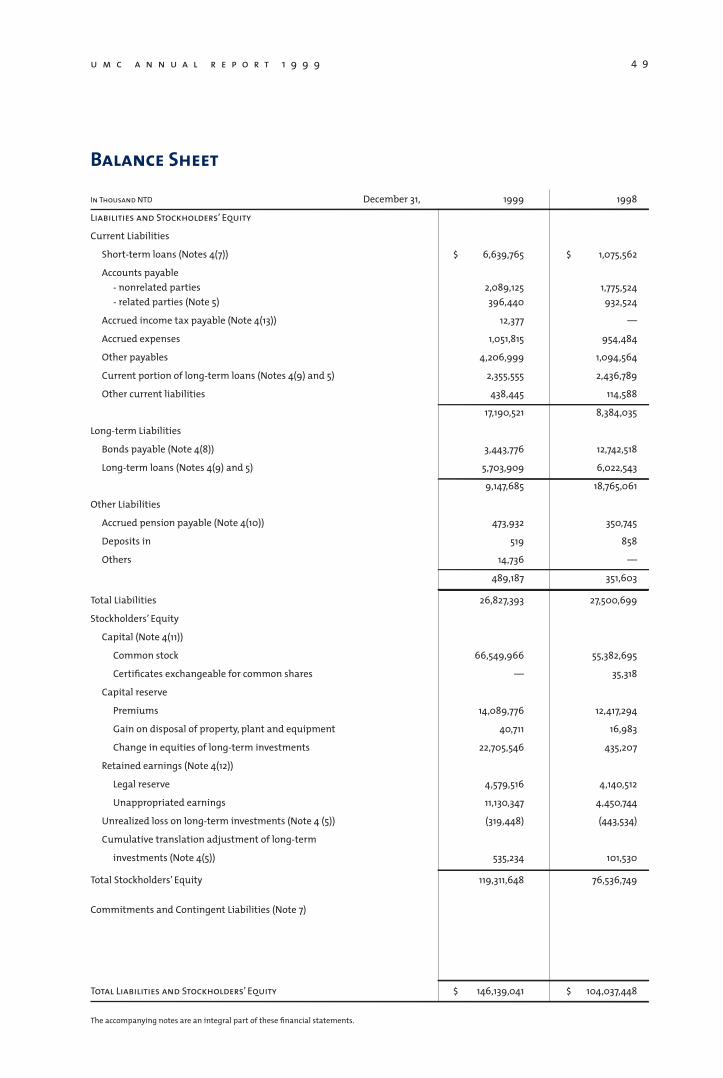
Balance Sheet
In Thousand NTD December 31, 1999 1998
Liabilities and Stockholders’ Equity
Current Liabilities
Short-term loans (Notes 4(7)) $ 6,639,765 $ 1,075,562
Accounts payable - nonrelated parties 2,089,125 1,775,524 - related parties (Note 5) 396,440 932,524
Accrued income tax payable (Note 4(13)) 12,377 —
Accrued expenses 1,051,815 954,484
Other payables 4,206,999 1,094,564
Current portion of long-term loans (Notes 4(9) and 5) 2,355,555 2,436,789
Other current liabilities 438,445 114,588
17,190,521 8,384,035
Long-term Liabilities
Bonds payable (Note 4(8)) 3,443,776 12,742,518
Long-term loans (Notes 4(9) and 5) 5,703,909 6,022,543
9,147,685 18,765,061
Other Liabilities
Accrued pension payable (Note 4(10)) 473,932 350,745
Deposits in 519 858
Others 14,736 —
489,187 351,603
Total Liabilities 26,827,393 27,500,699
Stockholders’ Equity
Capital (Note 4(11))
Common stock 66,549,966 55,382,695
Certificates exchangeable for common shares — 35,318
Capital reserve
Premiums 14,089,776 12,417,294
Gain on disposal of property, plant and equipment 40,711 16,983
Change in equities of long-term investments 22,705,546 435,207
Retained earnings (Note 4(12))
Legal reserve 4,579,516 4,140,512
Unappropriated earnings 11,130,347 4,450,744
Unrealized loss on long-term investments (Note 4 (5)) (319,448) (443,534)
Cumulative translation adjustment of long-term
investments (Note 4(5)) 535,234 101,530
Total Stockholders’ Equity 119,311,648 76,536,749
Commitments and Contingent Liabilities (Note 7)
Total Liabilities and Stockholders’ Equity $ 146,139,041 $ 104,037,448
The accompanying notes are an integral part of these financial statements.
5 0f i n a n c i a l r e v i e w
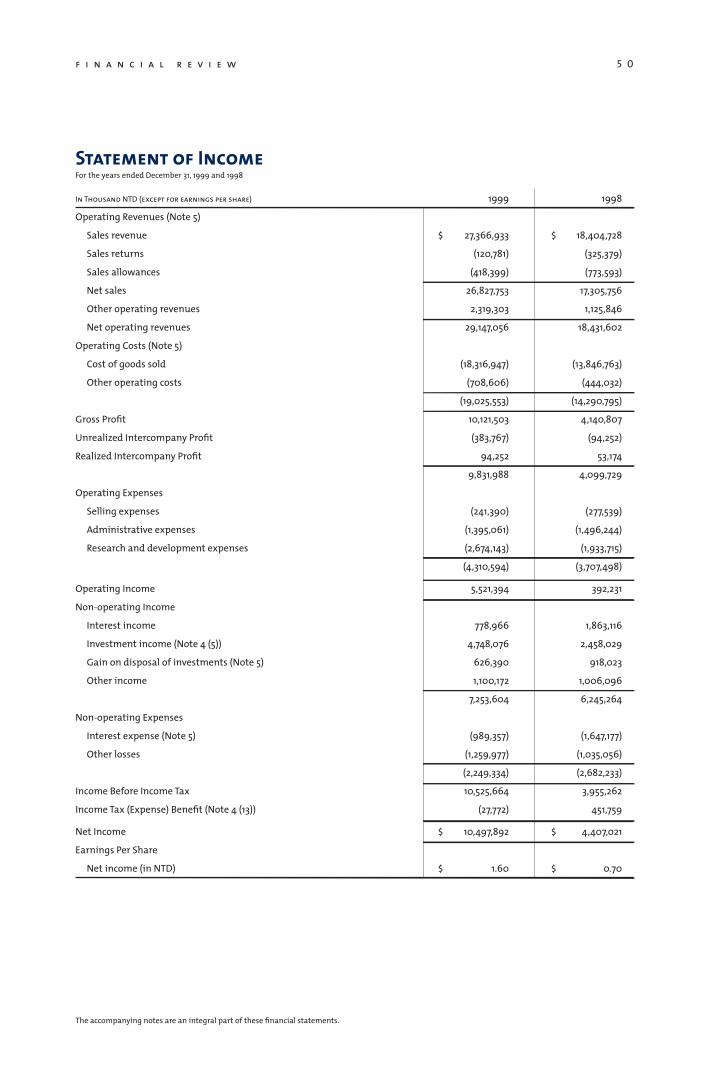
Statement of IncomeFor the years ended December 31, 1999 and 1998
In Thousand NTD (except for earnings per share) 1999 1998
Operating Revenues (Note 5)
Sales revenue $ 27,366,933 $ 18,404,728
Sales returns (120,781) (325,379)
Sales allowances (418,399) (773,593)
Net sales 26,827,753 17,305,756
Other operating revenues 2,319,303 1,125,846
Net operating revenues 29,147,056 18,431,602
Operating Costs (Note 5)
Cost of goods sold (18,316,947) (13,846,763)
Other operating costs (708,606) (444,032)
(19,025,553) (14,290,795)
Gross Profit 10,121,503 4,140,807
Unrealized Intercompany Profit (383,767) (94,252)
Realized Intercompany Profit 94,252 53,174
9,831,988 4,099,729
Operating Expenses
Selling expenses (241,390) (277,539)
Administrative expenses (1,395,061) (1,496,244)
Research and development expenses (2,674,143) (1,933,715)
(4,310,594) (3,707,498)
Operating Income 5,521,394 392,231
Non-operating Income
Interest income 778,966 1,863,116
Investment income (Note 4 (5)) 4,748,076 2,458,029
Gain on disposal of investments (Note 5) 626,390 918,023
Other income 1,100,172 1,006,096
7,253,604 6,245,264
Non-operating Expenses
Interest expense (Note 5) (989,357) (1,647,177)
Other losses (1,259,977) (1,035,056)
(2,249,334) (2,682,233)
Income Before Income Tax 10,525,664 3,955,262
Income Tax (Expense) Benefit (Note 4 (13)) (27,772) 451,759
Net Income $ 10,497,892 $ 4,407,021
Earnings Per Share
Net income (in NTD) $ 1.60 $ 0.70
The accompanying notes are an integral part of these financial statements.
u m c a n n u a l r e p o r t 1 9 9 9 5 1
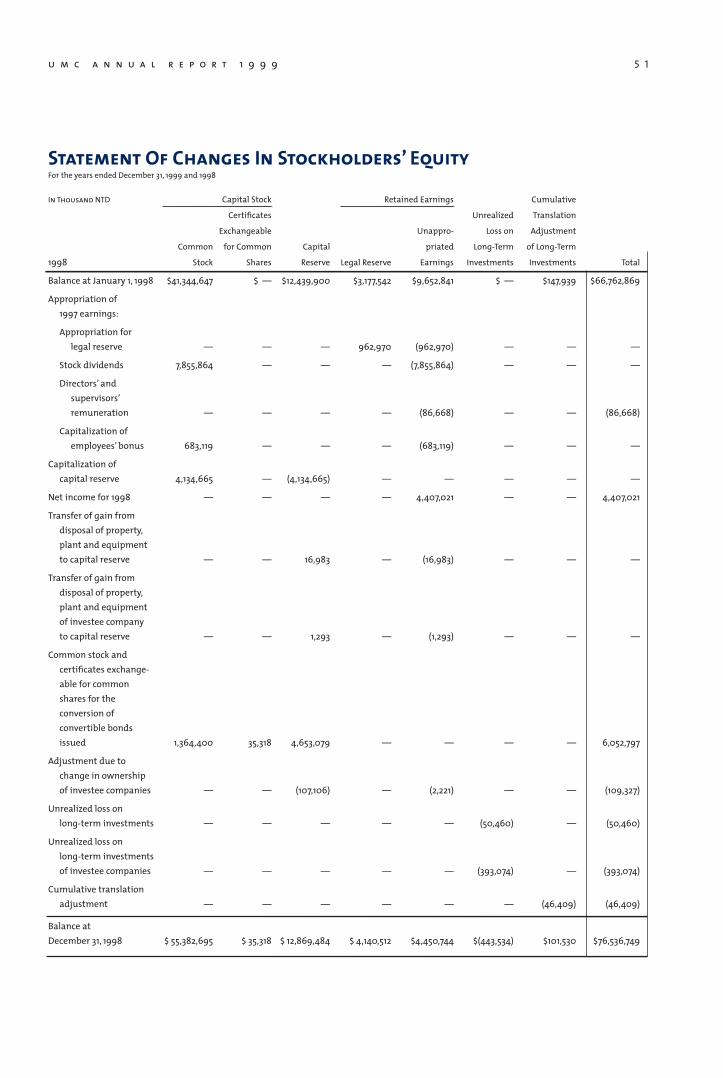
Statement Of Changes In Stockholders’ EquityFor the years ended December 31, 1999 and 1998
In Thousand NTD Capital Stock Retained Earnings Cumulative
Certificates Unrealized Translation
Exchangeable Unappro- Loss on Adjustment
Common for Common Capital priated Long-Term of Long-Term
1998 Stock Shares Reserve Legal Reserve Earnings Investments Investments Total
Balance at January 1, 1998 $41,344,647 $ — $12,439,900 $3,177,542 $9,652,841 $ — $147,939 $66,762,869
Appropriation of 1997 earnings:
Appropriation for legal reserve — — — 962,970 (962,970) — — —
Stock dividends 7,855,864 — — — (7,855,864) — — —
Directors’ and supervisors’ remuneration — — — — (86,668) — — (86,668)
Capitalization of employees’ bonus 683,119 — — — (683,119) — — —
Capitalization of capital reserve 4,134,665 — (4,134,665) — — — — —
Net income for 1998 — — — — 4,407,021 — — 4,407,021
Transfer of gain from disposal of property, plant and equipment to capital reserve — — 16,983 — (16,983) — — —
Transfer of gain from disposal of property, plant and equipment of investee company to capital reserve — — 1,293 — (1,293) — — —
Common stock and certificates exchange- able for common shares for the conversion of convertible bonds issued 1,364,400 35,318 4,653,079 — — — — 6,052,797
Adjustment due to change in ownership of investee companies — — (107,106) — (2,221) — — (109,327)
Unrealized loss on long-term investments — — — — — (50,460) — (50,460)
Unrealized loss on long-term investments of investee companies — — — — — (393,074) — (393,074)
Cumulative translation adjustment — — — — — — (46,409) (46,409)
Balance at December 31, 1998 $ 55,382,695 $ 35,318 $ 12,869,484 $ 4,140,512 $4,450,744 $(443,534) $101,530 $76,536,749
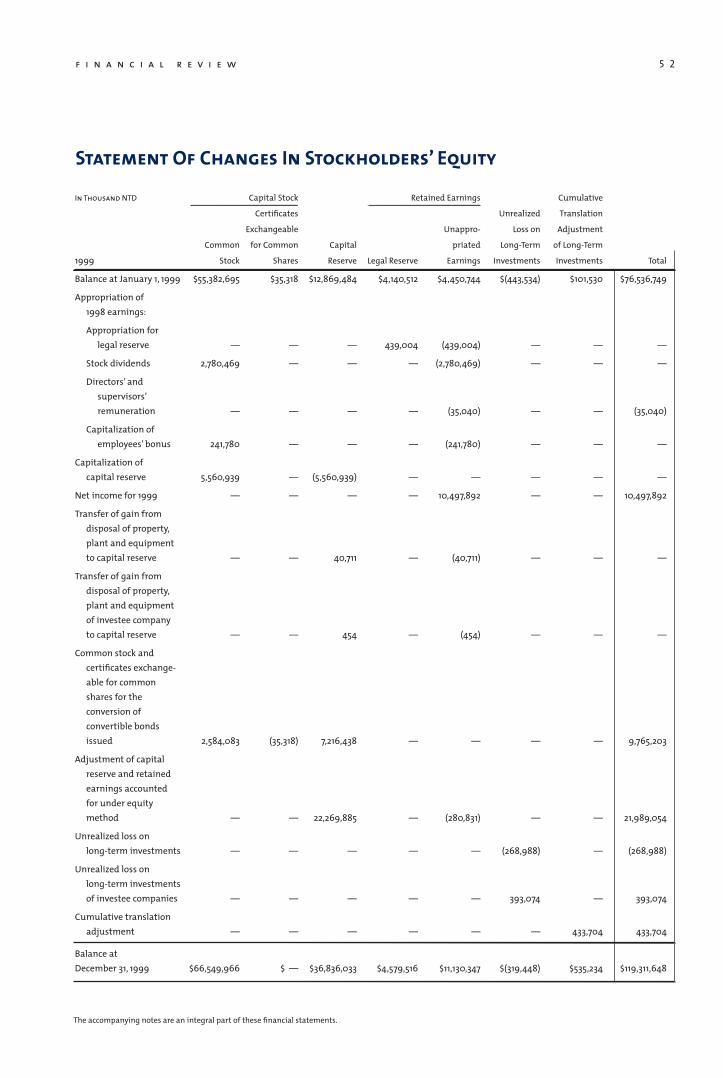
Statement Of Changes In Stockholders’ Equity
5 2
In Thousand NTD Capital Stock Retained Earnings Cumulative
Certificates Unrealized Translation
Exchangeable Unappro- Loss on Adjustment
Common for Common Capital priated Long-Term of Long-Term
1999 Stock Shares Reserve Legal Reserve Earnings Investments Investments Total
Balance at January 1, 1999 $55,382,695 $35,318 $12,869,484 $4,140,512 $4,450,744 $(443,534) $101,530 $76,536,749
Appropriation of 1998 earnings:
Appropriation for legal reserve — — — 439,004 (439,004) — — —
Stock dividends 2,780,469 — — — (2,780,469) — — —
Directors’ and supervisors’ remuneration — — — — (35,040) — — (35,040)
Capitalization of employees’ bonus 241,780 — — — (241,780) — — —
Capitalization of capital reserve 5,560,939 — (5,560,939) — — — — —
Net income for 1999 — — — — 10,497,892 — — 10,497,892
Transfer of gain from disposal of property, plant and equipment to capital reserve — — 40,711 — (40,711) — — —
Transfer of gain from disposal of property, plant and equipment of investee company to capital reserve — — 454 — (454) — — —
Common stock and certificates exchange- able for common shares for the conversion of convertible bonds issued 2,584,083 (35,318) 7,216,438 — — — — 9,765,203
Adjustment of capital reserve and retained earnings accounted for under equity method — — 22,269,885 — (280,831) — — 21,989,054
Unrealized loss on long-term investments — — — — — (268,988) — (268,988)
Unrealized loss on long-term investments of investee companies — — — — — 393,074 — 393,074
Cumulative translation adjustment — — — — — — 433,704 433,704
Balance at December 31, 1999 $66,549,966 $ — $36,836,033 $4,579,516 $11,130,347 $(319,448) $535,234 $119,311,648
The accompanying notes are an integral part of these financial statements.
f i n a n c i a l r e v i e w
u m c a n n u a l r e p o r t 1 9 9 9 5 3
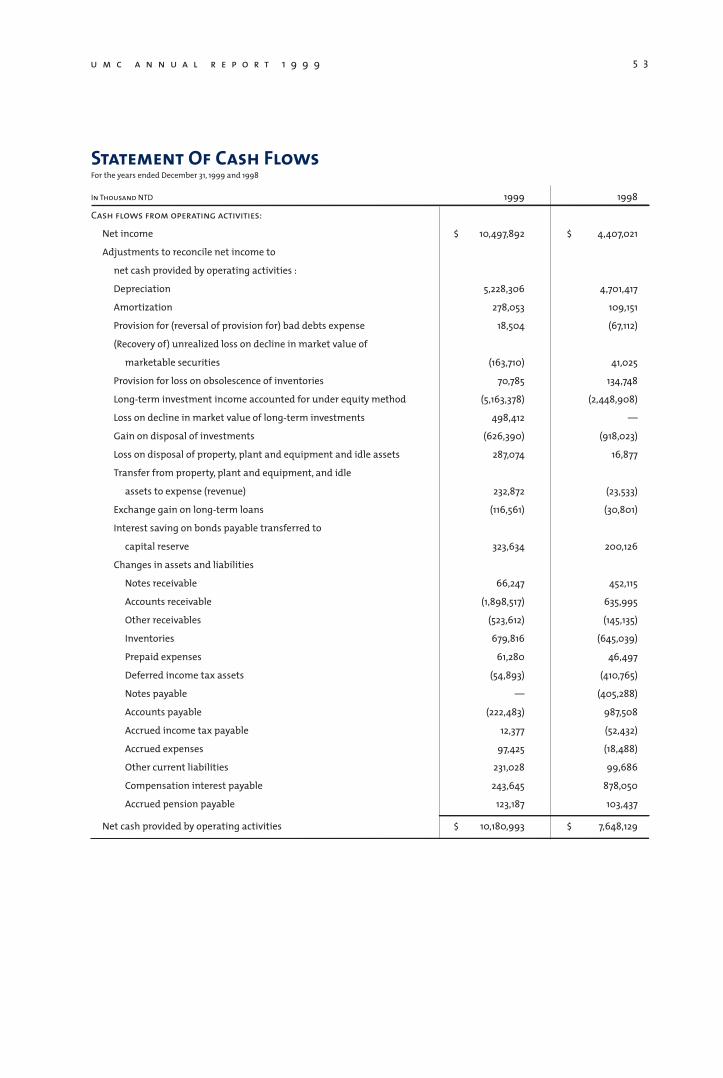
Statement Of Cash FlowsFor the years ended December 31, 1999 and 1998
In Thousand NTD 1999 1998
Cash flows from operating activities:
Net income $ 10,497,892 $ 4,407,021
Adjustments to reconcile net income to
net cash provided by operating activities :
Depreciation 5,228,306 4,701,417
Amortization 278,053 109,151
Provision for (reversal of provision for) bad debts expense 18,504 (67,112)
(Recovery of) unrealized loss on decline in market value of
marketable securities (163,710) 41,025
Provision for loss on obsolescence of inventories 70,785 134,748
Long-term investment income accounted for under equity method (5,163,378) (2,448,908)
Loss on decline in market value of long-term investments 498,412 —
Gain on disposal of investments (626,390) (918,023)
Loss on disposal of property, plant and equipment and idle assets 287,074 16,877
Transfer from property, plant and equipment, and idle
assets to expense (revenue) 232,872 (23,533)
Exchange gain on long-term loans (116,561) (30,801)
Interest saving on bonds payable transferred to
capital reserve 323,634 200,126
Changes in assets and liabilities
Notes receivable 66,247 452,115
Accounts receivable (1,898,517) 635,995
Other receivables (523,612) (145,135)
Inventories 679,816 (645,039)
Prepaid expenses 61,280 46,497
Deferred income tax assets (54,893) (410,765)
Notes payable — (405,288)
Accounts payable (222,483) 987,508
Accrued income tax payable 12,377 (52,432)
Accrued expenses 97,425 (18,488)
Other current liabilities 231,028 99,686
Compensation interest payable 243,645 878,050
Accrued pension payable 123,187 103,437
Net cash provided by operating activities $ 10,180,993 $ 7,648,129
5 4f i n a n c i a l r e v i e w
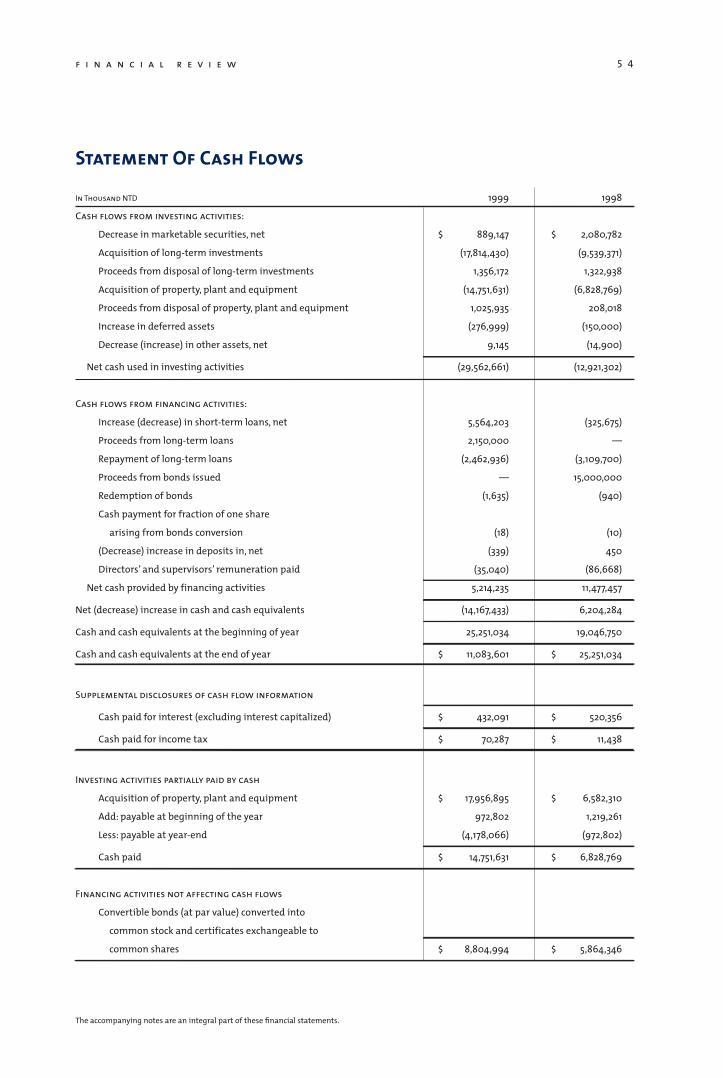
Statement Of Cash Flows
In Thousand NTD 1999 1998
Cash flows from investing activities:
Decrease in marketable securities, net $ 889,147 $ 2,080,782
Acquisition of long-term investments (17,814,430) (9,539,371)
Proceeds from disposal of long-term investments 1,356,172 1,322,938
Acquisition of property, plant and equipment (14,751,631) (6,828,769)
Proceeds from disposal of property, plant and equipment 1,025,935 208,018
Increase in deferred assets (276,999) (150,000)
Decrease (increase) in other assets, net 9,145 (14,900)
Net cash used in investing activities (29,562,661) (12,921,302)
Cash flows from financing activities:
Increase (decrease) in short-term loans, net 5,564,203 (325,675)
Proceeds from long-term loans 2,150,000 —
Repayment of long-term loans (2,462,936) (3,109,700)
Proceeds from bonds issued — 15,000,000
Redemption of bonds (1,635) (940)
Cash payment for fraction of one share
arising from bonds conversion (18) (10)
(Decrease) increase in deposits in, net (339) 450
Directors’ and supervisors’ remuneration paid (35,040) (86,668)
Net cash provided by financing activities 5,214,235 11,477,457
Net (decrease) increase in cash and cash equivalents (14,167,433) 6,204,284
Cash and cash equivalents at the beginning of year 25,251,034 19,046,750
Cash and cash equivalents at the end of year $ 11,083,601 $ 25,251,034
Supplemental disclosures of cash flow information
Cash paid for interest (excluding interest capitalized) $ 432,091 $ 520,356
Cash paid for income tax $ 70,287 $ 11,438
Investing activities partially paid by cash
Acquisition of property, plant and equipment $ 17,956,895 $ 6,582,310
Add: payable at beginning of the year 972,802 1,219,261
Less: payable at year-end (4,178,066) (972,802)
Cash paid $ 14,751,631 $ 6,828,769
Financing activities not affecting cash flows
Convertible bonds (at par value) converted into
common stock and certificates exchangeable to
common shares $ 8,804,994 $ 5,864,346
The accompanying notes are an integral part of these financial statements.
u m c a n n u a l r e p o r t 1 9 9 9 5 5
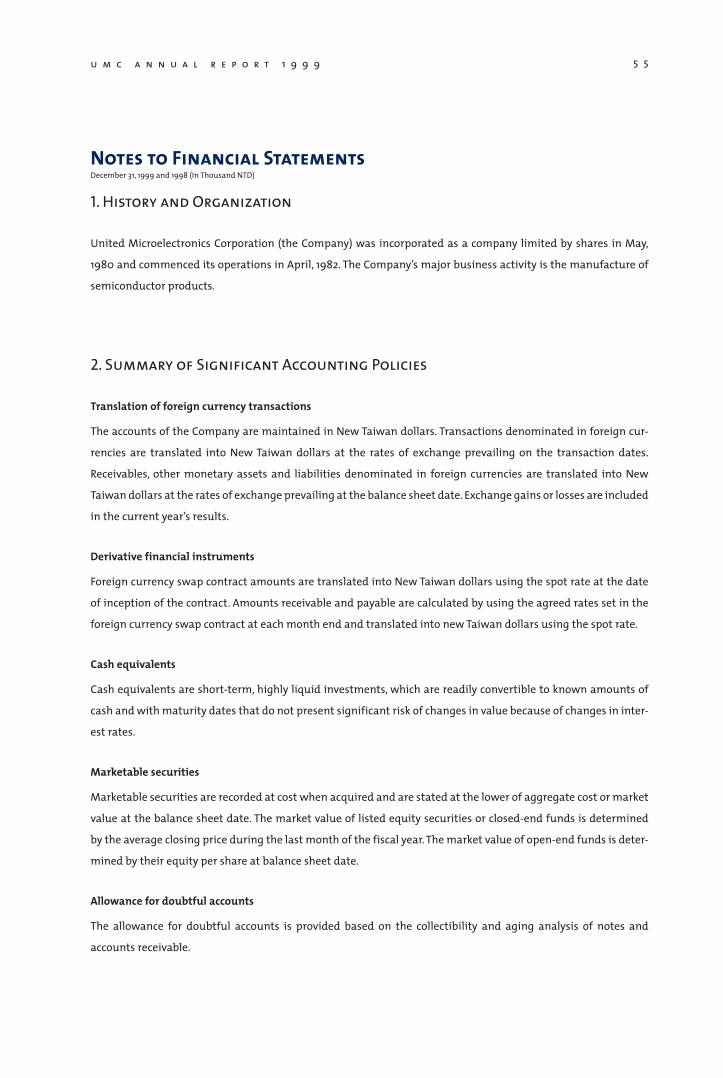
1. History and Organization
United Microelectronics Corporation (the Company) was incorporated as a company limited by shares in May,
1980 and commenced its operations in April, 1982. The Company’s major business activity is the manufacture of
semiconductor products.
2. Summary of Significant Accounting Policies
Translation of foreign currency transactions
The accounts of the Company are maintained in New Taiwan dollars. Transactions denominated in foreign cur-
rencies are translated into New Taiwan dollars at the rates of exchange prevailing on the transaction dates.
Receivables, other monetary assets and liabilities denominated in foreign currencies are translated into New
Taiwan dollars at the rates of exchange prevailing at the balance sheet date. Exchange gains or losses are included
in the current year’s results.
Derivative financial instruments
Foreign currency swap contract amounts are translated into New Taiwan dollars using the spot rate at the date
of inception of the contract. Amounts receivable and payable are calculated by using the agreed rates set in the
foreign currency swap contract at each month end and translated into new Taiwan dollars using the spot rate.
Cash equivalents
Cash equivalents are short-term, highly liquid investments, which are readily convertible to known amounts of
cash and with maturity dates that do not present significant risk of changes in value because of changes in inter-
est rates.
Marketable securities
Marketable securities are recorded at cost when acquired and are stated at the lower of aggregate cost or market
value at the balance sheet date. The market value of listed equity securities or closed-end funds is determined
by the average closing price during the last month of the fiscal year. The market value of open-end funds is deter-
mined by their equity per share at balance sheet date.
Allowance for doubtful accounts
The allowance for doubtful accounts is provided based on the collectibility and aging analysis of notes and
accounts receivable.
Notes to Financial StatementsDecember 31, 1999 and 1998 (In Thousand NTD)
5 6f i n a n c i a l r e v i e w
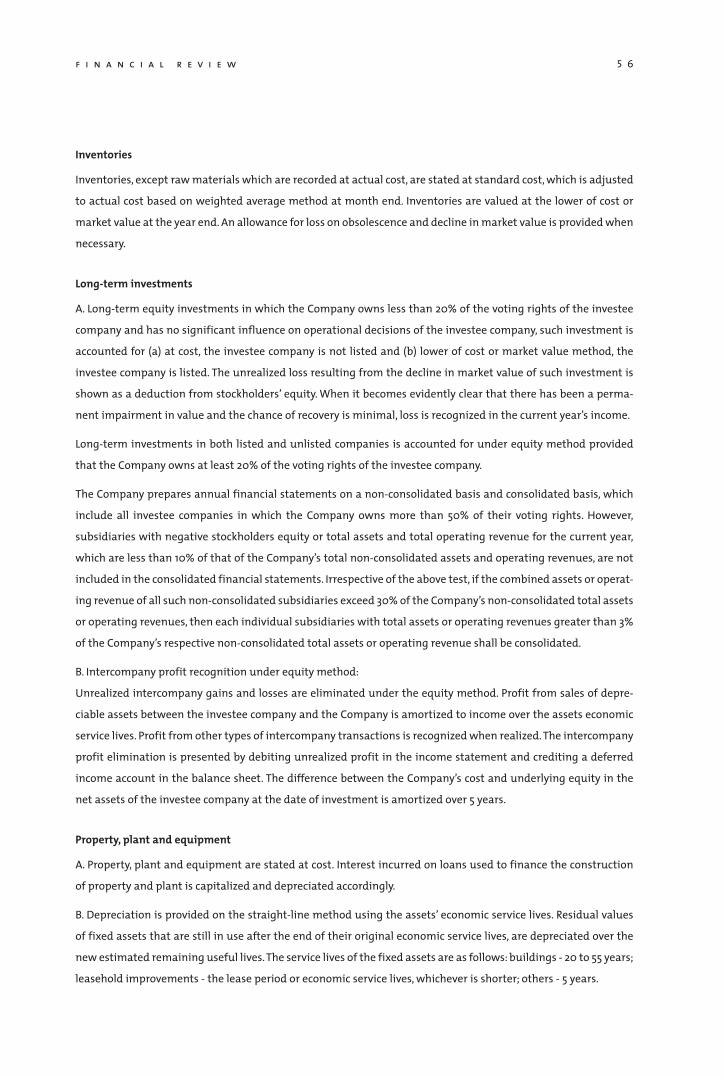
Inventories
Inventories, except raw materials which are recorded at actual cost, are stated at standard cost, which is adjusted
to actual cost based on weighted average method at month end. Inventories are valued at the lower of cost or
market value at the year end. An allowance for loss on obsolescence and decline in market value is provided when
necessary.
Long-term investments
A. Long-term equity investments in which the Company owns less than 20% of the voting rights of the investee
company and has no significant influence on operational decisions of the investee company, such investment is
accounted for (a) at cost, the investee company is not listed and (b) lower of cost or market value method, the
investee company is listed. The unrealized loss resulting from the decline in market value of such investment is
shown as a deduction from stockholders’ equity. When it becomes evidently clear that there has been a perma-
nent impairment in value and the chance of recovery is minimal, loss is recognized in the current year’s income.
Long-term investments in both listed and unlisted companies is accounted for under equity method provided
that the Company owns at least 20% of the voting rights of the investee company.
The Company prepares annual financial statements on a non-consolidated basis and consolidated basis, which
include all investee companies in which the Company owns more than 50% of their voting rights. However,
subsidiaries with negative stockholders equity or total assets and total operating revenue for the current year,
which are less than 10% of that of the Company’s total non-consolidated assets and operating revenues, are not
included in the consolidated financial statements. Irrespective of the above test, if the combined assets or operat-
ing revenue of all such non-consolidated subsidiaries exceed 30% of the Company’s non-consolidated total assets
or operating revenues, then each individual subsidiaries with total assets or operating revenues greater than 3%
of the Company’s respective non-consolidated total assets or operating revenue shall be consolidated.
B. Intercompany profit recognition under equity method:
Unrealized intercompany gains and losses are eliminated under the equity method. Profit from sales of depre-
ciable assets between the investee company and the Company is amortized to income over the assets economic
service lives. Profit from other types of intercompany transactions is recognized when realized. The intercompany
profit elimination is presented by debiting unrealized profit in the income statement and crediting a deferred
income account in the balance sheet. The difference between the Company’s cost and underlying equity in the
net assets of the investee company at the date of investment is amortized over 5 years.
Property, plant and equipment
A. Property, plant and equipment are stated at cost. Interest incurred on loans used to finance the construction
of property and plant is capitalized and depreciated accordingly.
B. Depreciation is provided on the straight-line method using the assets’ economic service lives. Residual values
of fixed assets that are still in use after the end of their original economic service lives, are depreciated over the
new estimated remaining useful lives. The service lives of the fixed assets are as follows: buildings - 20 to 55 years;
leasehold improvements - the lease period or economic service lives, whichever is shorter; others - 5 years.
u m c a n n u a l r e p o r t 1 9 9 9 5 7
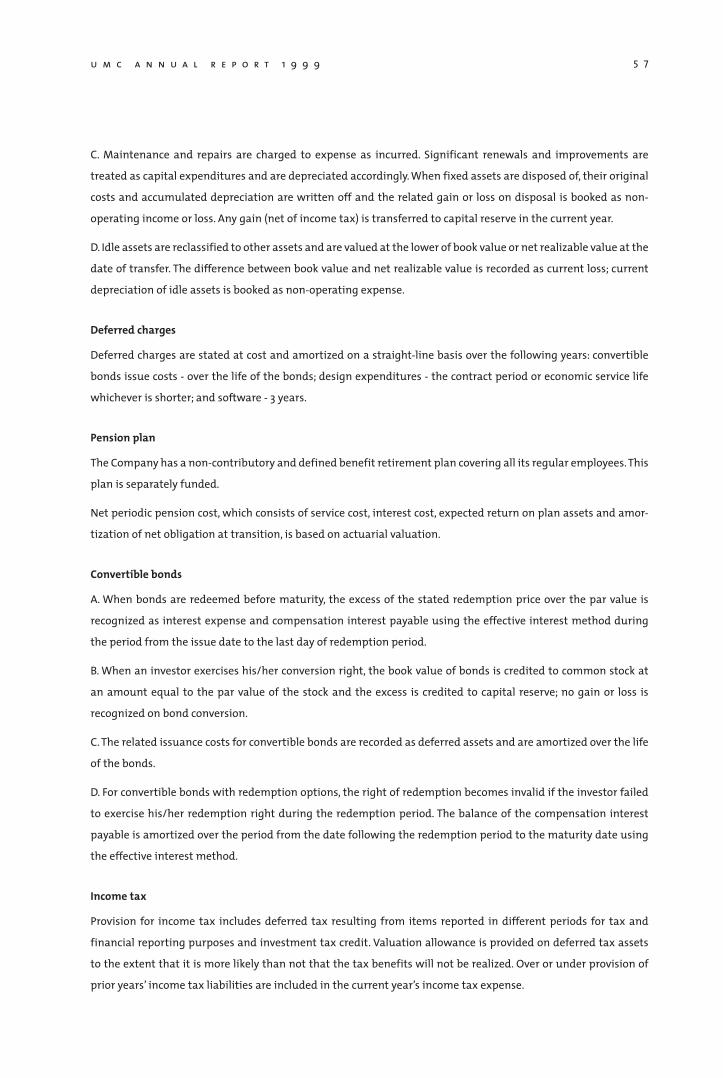
C. Maintenance and repairs are charged to expense as incurred. Significant renewals and improvements are
treated as capital expenditures and are depreciated accordingly. When fixed assets are disposed of, their original
costs and accumulated depreciation are written off and the related gain or loss on disposal is booked as non-
operating income or loss. Any gain (net of income tax) is transferred to capital reserve in the current year.
D. Idle assets are reclassified to other assets and are valued at the lower of book value or net realizable value at the
date of transfer. The difference between book value and net realizable value is recorded as current loss; current
depreciation of idle assets is booked as non-operating expense.
Deferred charges
Deferred charges are stated at cost and amortized on a straight-line basis over the following years: convertible
bonds issue costs - over the life of the bonds; design expenditures - the contract period or economic service life
whichever is shorter; and software - 3 years.
Pension plan
The Company has a non-contributory and defined benefit retirement plan covering all its regular employees. This
plan is separately funded.
Net periodic pension cost, which consists of service cost, interest cost, expected return on plan assets and amor-
tization of net obligation at transition, is based on actuarial valuation.
Convertible bonds
A. When bonds are redeemed before maturity, the excess of the stated redemption price over the par value is
recognized as interest expense and compensation interest payable using the effective interest method during
the period from the issue date to the last day of redemption period.
B. When an investor exercises his/her conversion right, the book value of bonds is credited to common stock at
an amount equal to the par value of the stock and the excess is credited to capital reserve; no gain or loss is
recognized on bond conversion.
C. The related issuance costs for convertible bonds are recorded as deferred assets and are amortized over the life
of the bonds.
D. For convertible bonds with redemption options, the right of redemption becomes invalid if the investor failed
to exercise his/her redemption right during the redemption period. The balance of the compensation interest
payable is amortized over the period from the date following the redemption period to the maturity date using
the effective interest method.
Income tax
Provision for income tax includes deferred tax resulting from items reported in different periods for tax and
financial reporting purposes and investment tax credit. Valuation allowance is provided on deferred tax assets
to the extent that it is more likely than not that the tax benefits will not be realized. Over or under provision of
prior years’ income tax liabilities are included in the current year’s income tax expense.
5 8
3. Effect on Change in Accounting Principles
None.
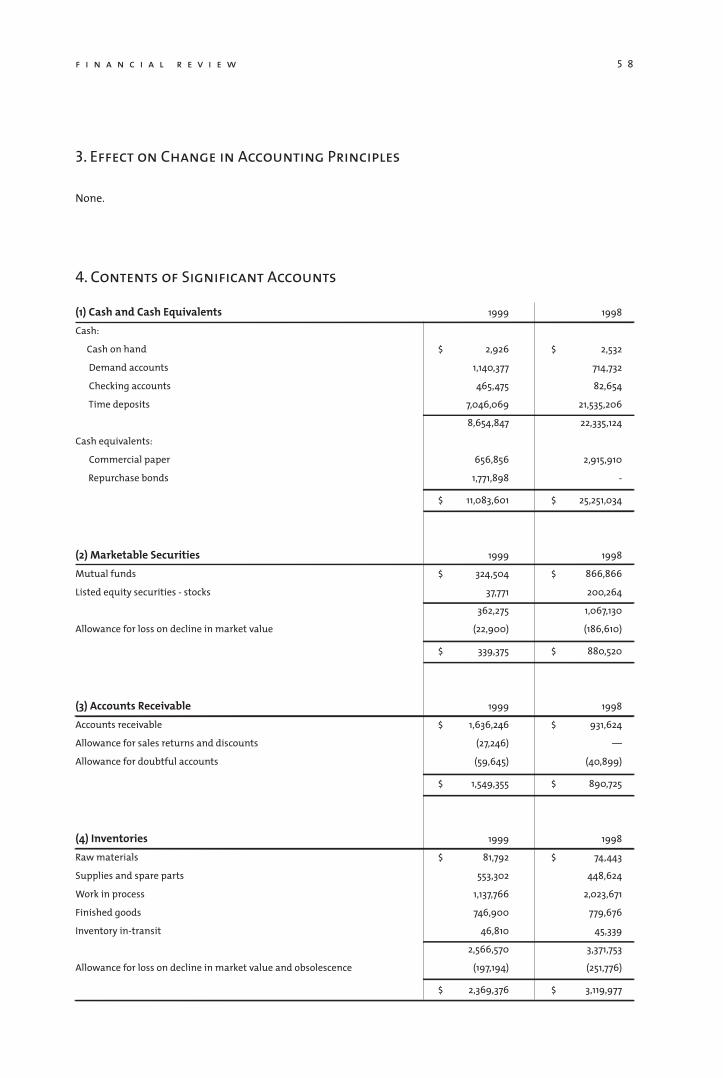
4. Contents of Significant Accounts
(1) Cash and Cash Equivalents 1999 1998
Cash:
Cash on hand $ 2,926 $ 2,532
Demand accounts 1,140,377 714,732
Checking accounts 465,475 82,654
Time deposits 7,046,069 21,535,206
8,654,847 22,335,124
Cash equivalents:
Commercial paper 656,856 2,915,910
Repurchase bonds 1,771,898 -
$ 11,083,601 $ 25,251,034
(2) Marketable Securities 1999 1998
Mutual funds $ 324,504 $ 866,866
Listed equity securities - stocks 37,771 200,264
362,275 1,067,130
Allowance for loss on decline in market value (22,900) (186,610)
$ 339,375 $ 880,520
(3) Accounts Receivable 1999 1998
Accounts receivable $ 1,636,246 $ 931,624
Allowance for sales returns and discounts (27,246) —
Allowance for doubtful accounts (59,645) (40,899)
$ 1,549,355 $ 890,725
(4) Inventories 1999 1998
Raw materials $ 81,792 $ 74,443
Supplies and spare parts 553,302 448,624
Work in process 1,137,766 2,023,671
Finished goods 746,900 779,676
Inventory in-transit 46,810 45,339
2,566,570 3,371,753
Allowance for loss on decline in market value and obsolescence (197,194) (251,776)
$ 2,369,376 $ 3,119,977
f i n a n c i a l r e v i e w
u m c a n n u a l r e p o r t 1 9 9 9 5 9
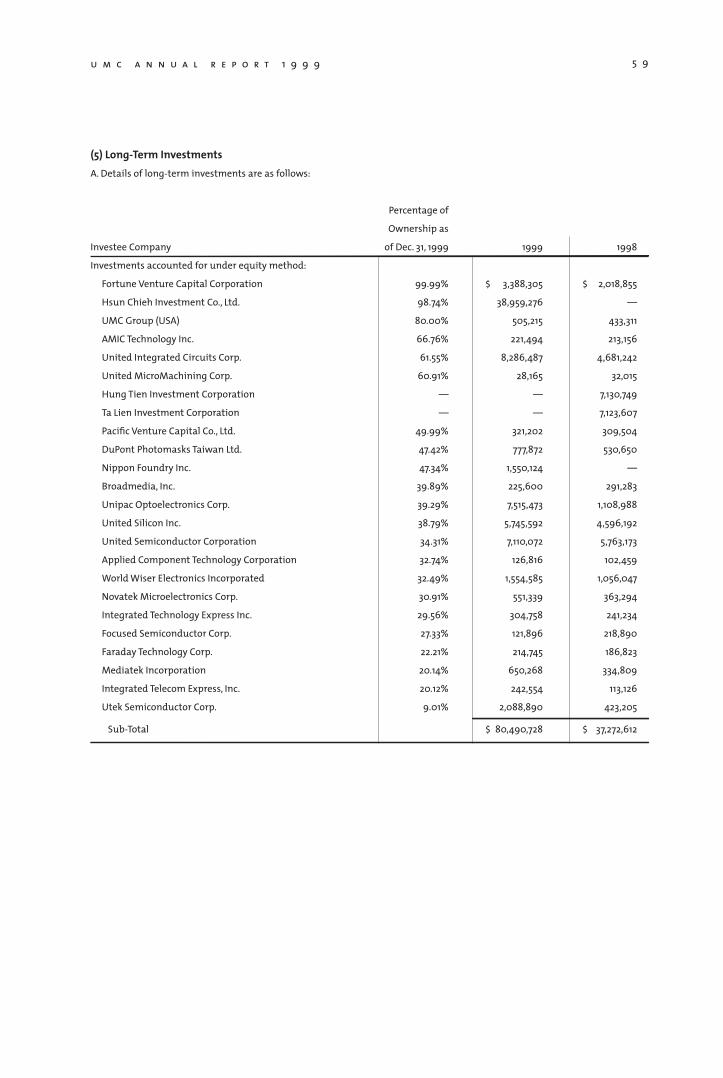
(5) Long-Term InvestmentsA. Details of long-term investments are as follows:
Percentage of
Ownership as
Investee Company of Dec. 31, 1999 1999 1998
Investments accounted for under equity method:
Fortune Venture Capital Corporation 99.99% $ 3,388,305 $ 2,018,855
Hsun Chieh Investment Co., Ltd. 98.74% 38,959,276 —
UMC Group (USA) 80.00% 505,215 433,311
AMIC Technology Inc. 66.76% 221,494 213,156
United Integrated Circuits Corp. 61.55% 8,286,487 4,681,242
United MicroMachining Corp. 60.91% 28,165 32,015
Hung Tien Investment Corporation — — 7,130,749
Ta Lien Investment Corporation — — 7,123,607
Pacific Venture Capital Co., Ltd. 49.99% 321,202 309,504
DuPont Photomasks Taiwan Ltd. 47.42% 777,872 530,650
Nippon Foundry Inc. 47.34% 1,550,124 —
Broadmedia, Inc. 39.89% 225,600 291,283
Unipac Optoelectronics Corp. 39.29% 7,515,473 1,108,988
United Silicon Inc. 38.79% 5,745,592 4,596,192
United Semiconductor Corporation 34.31% 7,110,072 5,763,173
Applied Component Technology Corporation 32.74% 126,816 102,459
World Wiser Electronics Incorporated 32.49% 1,554,585 1,056,047
Novatek Microelectronics Corp. 30.91% 551,339 363,294
Integrated Technology Express Inc. 29.56% 304,758 241,234
Focused Semiconductor Corp. 27.33% 121,896 218,890
Faraday Technology Corp. 22.21% 214,745 186,823
Mediatek Incorporation 20.14% 650,268 334,809
Integrated Telecom Express, Inc. 20.12% 242,554 113,126
Utek Semiconductor Corp. 9.01% 2,088,890 423,205
Sub-Total $ 80,490,728 $ 37,272,612
6 0
Percentage of
Ownership as
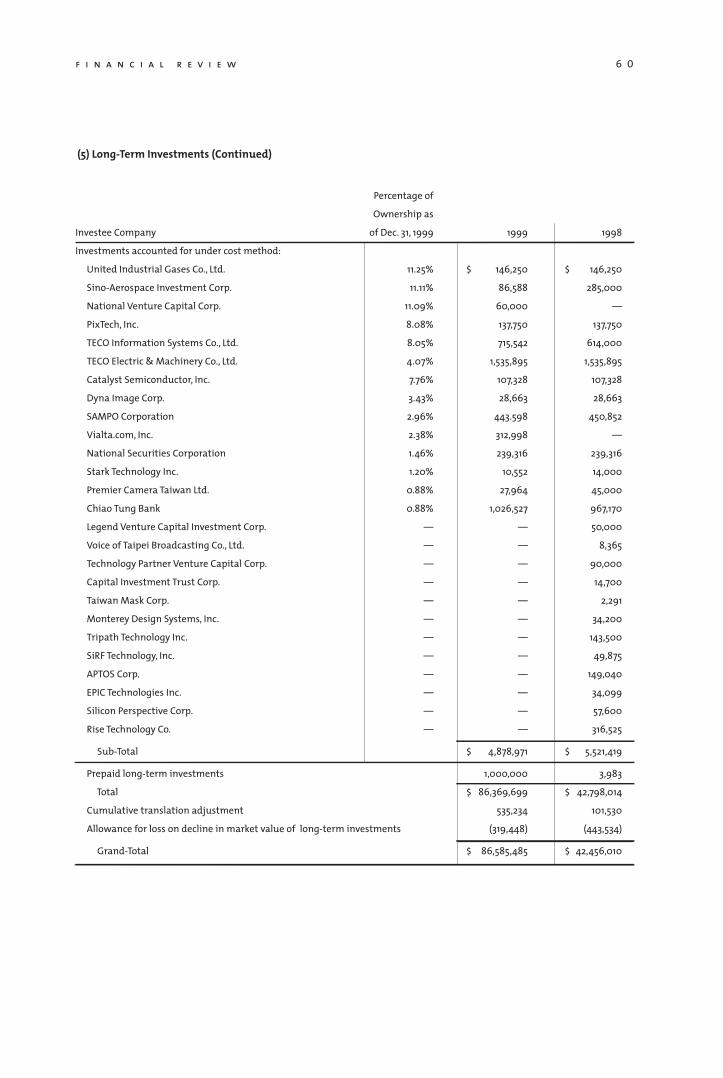
Investee Company of Dec. 31, 1999 1999 1998
Investments accounted for under cost method:
United Industrial Gases Co., Ltd. 11.25% $ 146,250 $ 146,250
Sino-Aerospace Investment Corp. 11.11% 86,588 285,000
National Venture Capital Corp. 11.09% 60,000 —
PixTech, Inc. 8.08% 137,750 137,750
TECO Information Systems Co., Ltd. 8.05% 715,542 614,000
TECO Electric & Machinery Co., Ltd. 4.07% 1,535,895 1,535,895
Catalyst Semiconductor, Inc. 7.76% 107,328 107,328
Dyna Image Corp. 3.43% 28,663 28,663
SAMPO Corporation 2.96% 443.598 450,852
Vialta.com, Inc. 2.38% 312,998 —
National Securities Corporation 1.46% 239,316 239,316
Stark Technology Inc. 1.20% 10,552 14,000
Premier Camera Taiwan Ltd. 0.88% 27,964 45,000
Chiao Tung Bank 0.88% 1,026,527 967,170
Legend Venture Capital Investment Corp. — — 50,000
Voice of Taipei Broadcasting Co., Ltd. — — 8,365
Technology Partner Venture Capital Corp. — — 90,000
Capital Investment Trust Corp. — — 14,700
Taiwan Mask Corp. — — 2,291
Monterey Design Systems, Inc. — — 34,200
Tripath Technology Inc. — — 143,500
SiRF Technology, Inc. — — 49,875
APTOS Corp. — — 149,040
EPIC Technologies Inc. — — 34,099
Silicon Perspective Corp. — — 57,600
Rise Technology Co. — — 316,525
Sub-Total $ 4,878,971 $ 5,521,419
Prepaid long-term investments 1,000,000 3,983
Total $ 86,369,699 $ 42,798,014
Cumulative translation adjustment 535,234 101,530
Allowance for loss on decline in market value of long-term investments (319,448) (443,534)
Grand-Total $ 86,585,485 $ 42,456,010
f i n a n c i a l r e v i e w
(5) Long-Term Investments (Continued)
u m c a n n u a l r e p o r t 1 9 9 9 6 1
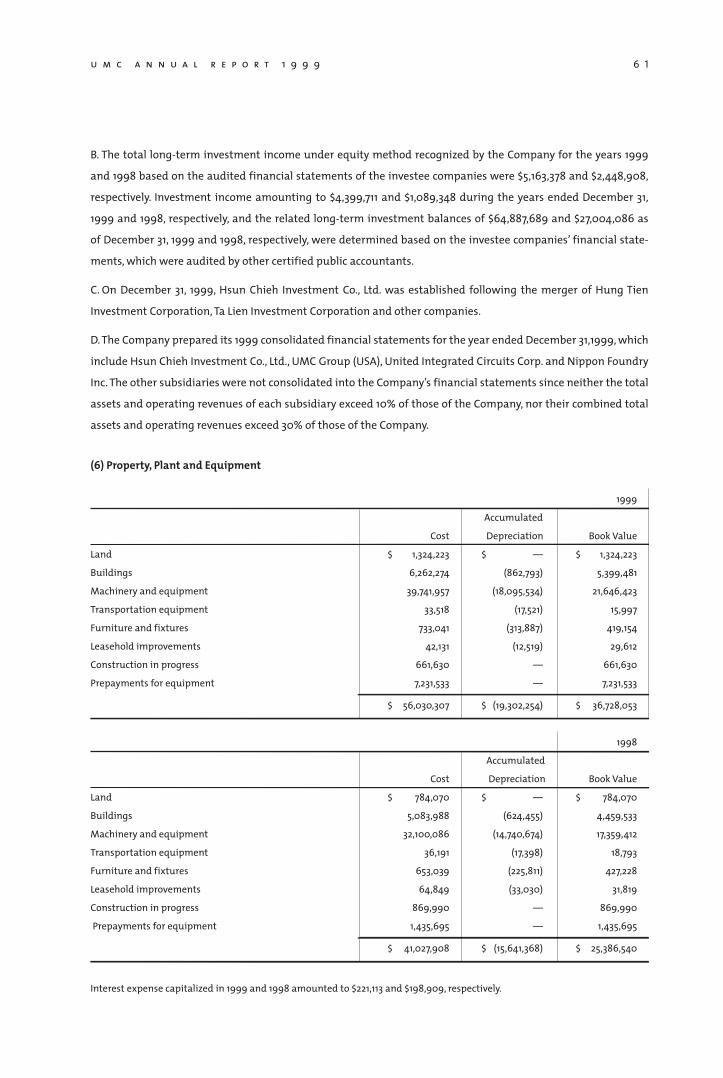
B. The total long-term investment income under equity method recognized by the Company for the years 1999
and 1998 based on the audited financial statements of the investee companies were $5,163,378 and $2,448,908,
respectively. Investment income amounting to $4,399,711 and $1,089,348 during the years ended December 31,
1999 and 1998, respectively, and the related long-term investment balances of $64,887,689 and $27,004,086 as
of December 31, 1999 and 1998, respectively, were determined based on the investee companies’ financial state-
ments, which were audited by other certified public accountants.
C. On December 31, 1999, Hsun Chieh Investment Co., Ltd. was established following the merger of Hung Tien
Investment Corporation, Ta Lien Investment Corporation and other companies.
D. The Company prepared its 1999 consolidated financial statements for the year ended December 31,1999, which
include Hsun Chieh Investment Co., Ltd., UMC Group (USA), United Integrated Circuits Corp. and Nippon Foundry
Inc. The other subsidiaries were not consolidated into the Company’s financial statements since neither the total
assets and operating revenues of each subsidiary exceed 10% of those of the Company, nor their combined total
assets and operating revenues exceed 30% of those of the Company.
(6) Property, Plant and Equipment
1999
Accumulated
Cost Depreciation Book Value
Land $ 1,324,223 $ — $ 1,324,223
Buildings 6,262,274 (862,793) 5,399,481
Machinery and equipment 39,741,957 (18,095,534) 21,646,423
Transportation equipment 33,518 (17,521) 15,997
Furniture and fixtures 733,041 (313,887) 419,154
Leasehold improvements 42,131 (12,519) 29,612
Construction in progress 661,630 — 661,630
Prepayments for equipment 7,231,533 — 7,231,533
$ 56,030,307 $ (19,302,254) $ 36,728,053
1998
Accumulated
Cost Depreciation Book Value
Land $ 784,070 $ — $ 784,070
Buildings 5,083,988 (624,455) 4,459,533
Machinery and equipment 32,100,086 (14,740,674) 17,359,412
Transportation equipment 36,191 (17,398) 18,793
Furniture and fixtures 653,039 (225,811) 427,228
Leasehold improvements 64,849 (33,030) 31,819
Construction in progress 869,990 — 869,990
Prepayments for equipment 1,435,695 — 1,435,695
$ 41,027,908 $ (15,641,368) $ 25,386,540
Interest expense capitalized in 1999 and 1998 amounted to $221,113 and $198,909, respectively.
6 2
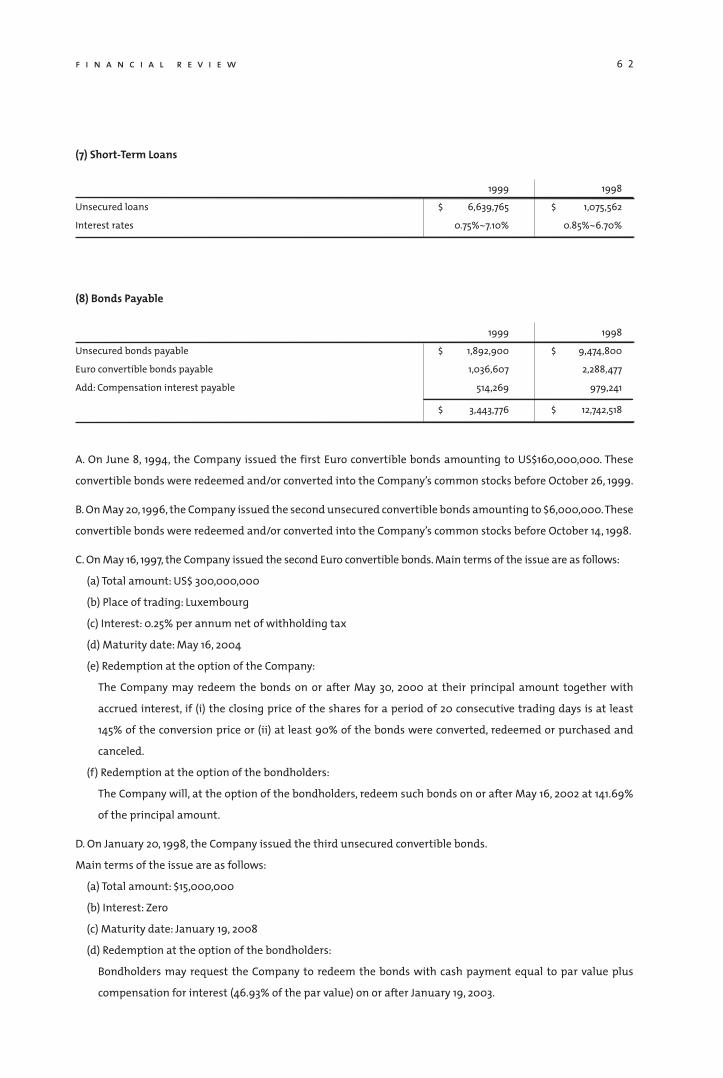
(7) Short-Term Loans
1999 1998
Unsecured loans $ 6,639,765 $ 1,075,562
Interest rates 0.75%~7.10% 0.85%~6.70%
(8) Bonds Payable
1999 1998
Unsecured bonds payable $ 1,892,900 $ 9,474,800
Euro convertible bonds payable 1,036,607 2,288,477
Add: Compensation interest payable 514,269 979,241
$ 3,443,776 $ 12,742,518
A. On June 8, 1994, the Company issued the first Euro convertible bonds amounting to US$160,000,000. These
convertible bonds were redeemed and/or converted into the Company’s common stocks before October 26, 1999.
B. On May 20, 1996, the Company issued the second unsecured convertible bonds amounting to $6,000,000. These
convertible bonds were redeemed and/or converted into the Company’s common stocks before October 14, 1998.
C. On May 16, 1997, the Company issued the second Euro convertible bonds. Main terms of the issue are as follows:
(a) Total amount: US$ 300,000,000
(b) Place of trading: Luxembourg
(c) Interest: 0.25% per annum net of withholding tax
(d) Maturity date: May 16, 2004
(e) Redemption at the option of the Company:
The Company may redeem the bonds on or after May 30, 2000 at their principal amount together with
accrued interest, if (i) the closing price of the shares for a period of 20 consecutive trading days is at least
145% of the conversion price or (ii) at least 90% of the bonds were converted, redeemed or purchased and
canceled.
(f) Redemption at the option of the bondholders:
The Company will, at the option of the bondholders, redeem such bonds on or after May 16, 2002 at 141.69%
of the principal amount.
D. On January 20, 1998, the Company issued the third unsecured convertible bonds.
Main terms of the issue are as follows:
(a) Total amount: $15,000,000
(b) Interest: Zero
(c) Maturity date: January 19, 2008
(d) Redemption at the option of the bondholders:
Bondholders may request the Company to redeem the bonds with cash payment equal to par value plus
compensation for interest (46.93% of the par value) on or after January 19, 2003.
f i n a n c i a l r e v i e w
u m c a n n u a l r e p o r t 1 9 9 9 6 3
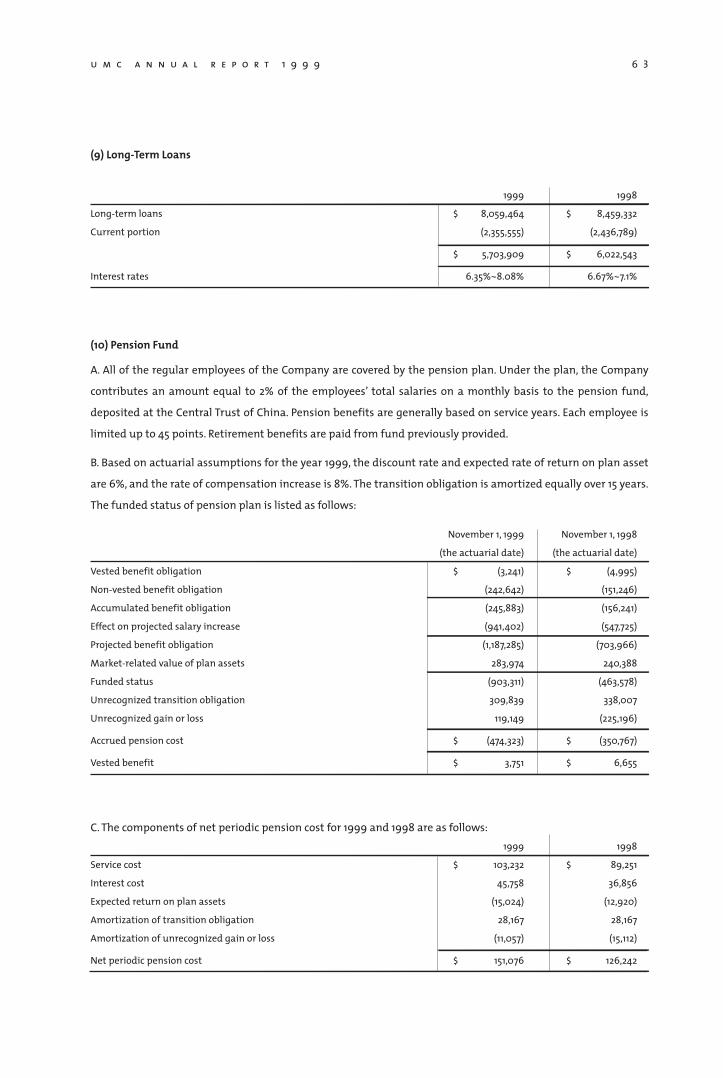
(9) Long-Term Loans
1999 1998
Long-term loans $ 8,059,464 $ 8,459,332
Current portion (2,355,555) (2,436,789)
$ 5,703,909 $ 6,022,543
Interest rates 6.35%~8.08% 6.67%~7.1%
(10) Pension Fund
A. All of the regular employees of the Company are covered by the pension plan. Under the plan, the Company
contributes an amount equal to 2% of the employees’ total salaries on a monthly basis to the pension fund,
deposited at the Central Trust of China. Pension benefits are generally based on service years. Each employee is
limited up to 45 points. Retirement benefits are paid from fund previously provided.
B. Based on actuarial assumptions for the year 1999, the discount rate and expected rate of return on plan asset
are 6%, and the rate of compensation increase is 8%. The transition obligation is amortized equally over 15 years.
The funded status of pension plan is listed as follows:
November 1, 1999 November 1, 1998
(the actuarial date) (the actuarial date)
Vested benefit obligation $ (3,241) $ (4,995)
Non-vested benefit obligation (242,642) (151,246)
Accumulated benefit obligation (245,883) (156,241)
Effect on projected salary increase (941,402) (547,725)
Projected benefit obligation (1,187,285) (703,966)
Market-related value of plan assets 283,974 240,388
Funded status (903,311) (463,578)
Unrecognized transition obligation 309,839 338,007
Unrecognized gain or loss 119,149 (225,196)
Accrued pension cost $ (474,323) $ (350,767)
Vested benefit $ 3,751 $ 6,655
C. The components of net periodic pension cost for 1999 and 1998 are as follows: 1999 1998
Service cost $ 103,232 $ 89,251
Interest cost 45,758 36,856
Expected return on plan assets (15,024) (12,920)
Amortization of transition obligation 28,167 28,167
Amortization of unrecognized gain or loss (11,057) (15,112)
Net periodic pension cost $ 151,076 $ 126,242
6 4
(11) Capital
A. The Company has authorized capital of 11,000,000,000 shares of stock (of which 1,500,000,000 shares are
reserved for convertible bonds issued in R.O.C. or in foreign countries) with NT$10 (in dollar) par value per share.
As of December 31, 1999 6,654,996,600 common shares were issued and outstanding.
B. Based on the resolution of the shareholders’ meeting on May 13, 1999, the Company issued new shares of
858,319,000 shares from the capitalization of retained earnings of $2,780,469, employees’ bonus of $241,780 and
capital reserve of $5,560,939. The Company has completed the amendment procedures for registration.
C. On June 14, 1999, the Company’s Board of Directors passed a resolution for the Company’s merger with United
Semiconductor Corporation (USC), United Integrated Circuits Corporation (UICC), United Silicon Incorporated
(USI), and Utek Semiconductor Inc (Utek). According to the merger agreement, the Company is the surviving
company and will issue new shares in exchange of the shares of USC, UICC, USI and Utek at the ratio of 1:1, 1:3,
1:1.35 and 1:2, respectively. As of January 3, 2000, the officially merged date, the capital stock of the Company was
$90,386,469.
(12) Retained Earnings
A. According to the Company’s Articles of Incorporation, current year’s earnings, if any, shall be distributed in the
following order:
(a) paying all taxes and dues;
(b) covering prior years’ operating losses, if any;
(c) setting aside 10% of the remaining amount, after deducting (a) and (b), as legal reserve;
(d) allocating 1% of the remaining amount, after deducting (a), (b), and (c) above from the current year’s earn-
ings, as directors’ and supervisors’ fees; and
(e) retaining or distributing the remaining amount as follows: 92% as common stockholders’ bonus and 8% to
employees as employees’ bonus.
B. The new Taiwan imputation tax system requires that any undistributed current earnings, on tax basis of a
company derived on or after January 1, 1998 be subject to an additional 10% corporate income tax if the earn-
ings are not distributed before a specific time. This 10% additional tax on undistributed earnings paid by the
company can be used as tax credit by shareholders, including foreign shareholders, against the withholding tax
on dividends. In addition, the domestic shareholders can claim a proportionate share in the company’s corporate
income tax as tax credit against its individual income tax liability effective 1998.
C. As of December 31, 1999, the ending balance of unappropriated earnings amounted to $11,130,347, of which
$64,220 was earned prior to January 1, 1998.
D. As of December 31, 1999, the balance of stockholders tax credit account was $42,785. The estimated ratio of
deductible tax credit for the appropriation of 1999 earnings will be 0.39%. The ratio of deductible tax credit for
the appropriation of 1998 earnings was 0.54%.
f i n a n c i a l r e v i e w
u m c a n n u a l r e p o r t 1 9 9 9 6 5
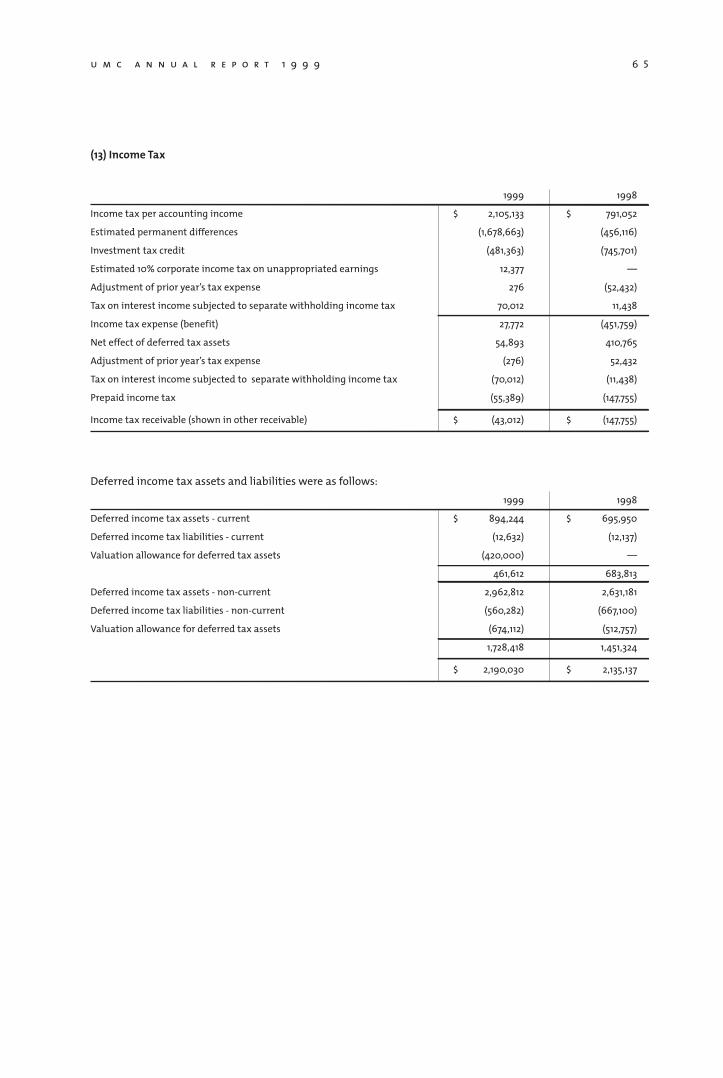
(13) Income Tax
1999 1998
Income tax per accounting income $ 2,105,133 $ 791,052
Estimated permanent differences (1,678,663) (456,116)
Investment tax credit (481,363) (745,701)
Estimated 10% corporate income tax on unappropriated earnings 12,377 —
Adjustment of prior year’s tax expense 276 (52,432)
Tax on interest income subjected to separate withholding income tax 70,012 11,438
Income tax expense (benefit) 27,772 (451,759)
Net effect of deferred tax assets 54,893 410,765
Adjustment of prior year’s tax expense (276) 52,432
Tax on interest income subjected to separate withholding income tax (70,012) (11,438)
Prepaid income tax (55,389) (147,755)
Income tax receivable (shown in other receivable) $ (43,012) $ (147,755)
Deferred income tax assets and liabilities were as follows: 1999 1998
Deferred income tax assets - current $ 894,244 $ 695,950
Deferred income tax liabilities - current (12,632) (12,137)
Valuation allowance for deferred tax assets (420,000) —
461,612 683,813
Deferred income tax assets - non-current 2,962,812 2,631,181
Deferred income tax liabilities - non-current (560,282) (667,100)
Valuation allowance for deferred tax assets (674,112) (512,757)
1,728,418 1,451,324
$ 2,190,030 $ 2,135,137
6 6
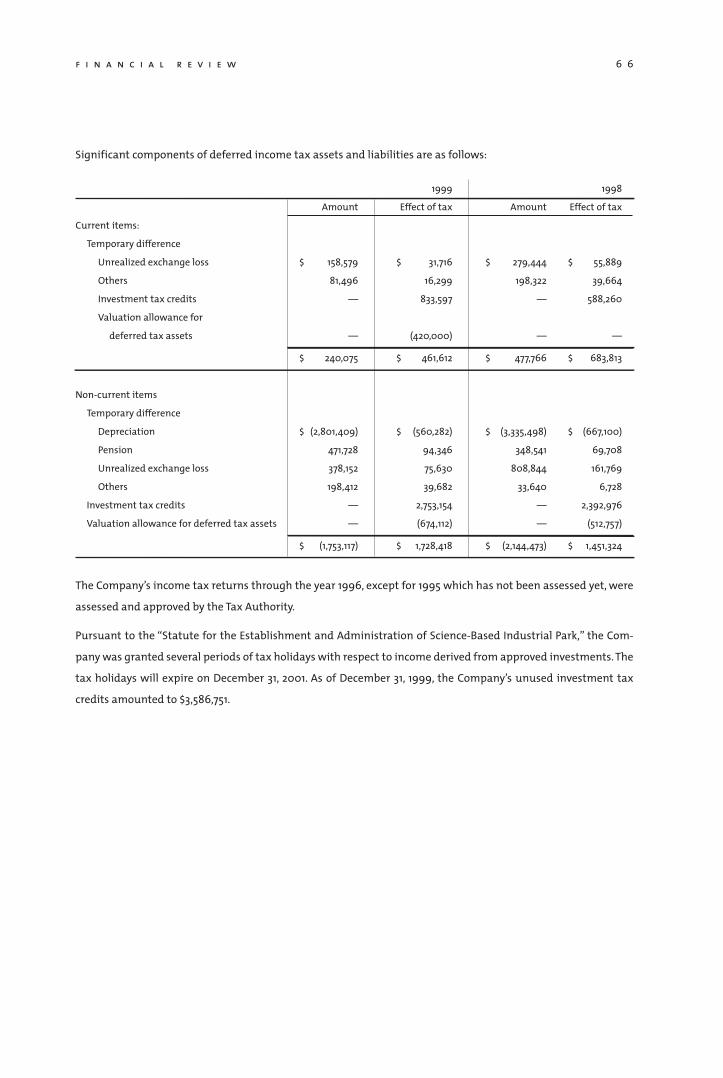
Significant components of deferred income tax assets and liabilities are as follows:
1999 1998
Amount Effect of tax Amount Effect of tax
Current items:
Temporary difference
Unrealized exchange loss $ 158,579 $ 31,716 $ 279,444 $ 55,889
Others 81,496 16,299 198,322 39,664
Investment tax credits — 833,597 — 588,260
Valuation allowance for
deferred tax assets — (420,000) — —
$ 240,075 $ 461,612 $ 477,766 $ 683,813
Non-current items
Temporary difference
Depreciation $ (2,801,409) $ (560,282) $ (3,335,498) $ (667,100)
Pension 471,728 94,346 348,541 69,708
Unrealized exchange loss 378,152 75,630 808,844 161,769
Others 198,412 39,682 33,640 6,728
Investment tax credits — 2,753,154 — 2,392,976
Valuation allowance for deferred tax assets — (674,112) — (512,757)
$ (1,753,117) $ 1,728,418 $ (2,144,473) $ 1,451,324
The Company’s income tax returns through the year 1996, except for 1995 which has not been assessed yet, were
assessed and approved by the Tax Authority.
Pursuant to the “Statute for the Establishment and Administration of Science-Based Industrial Park,” the Com-
pany was granted several periods of tax holidays with respect to income derived from approved investments. The
tax holidays will expire on December 31, 2001. As of December 31, 1999, the Company’s unused investment tax
credits amounted to $3,586,751.
f i n a n c i a l r e v i e w
u m c a n n u a l r e p o r t 1 9 9 9 6 7
5. Related Party Transaction
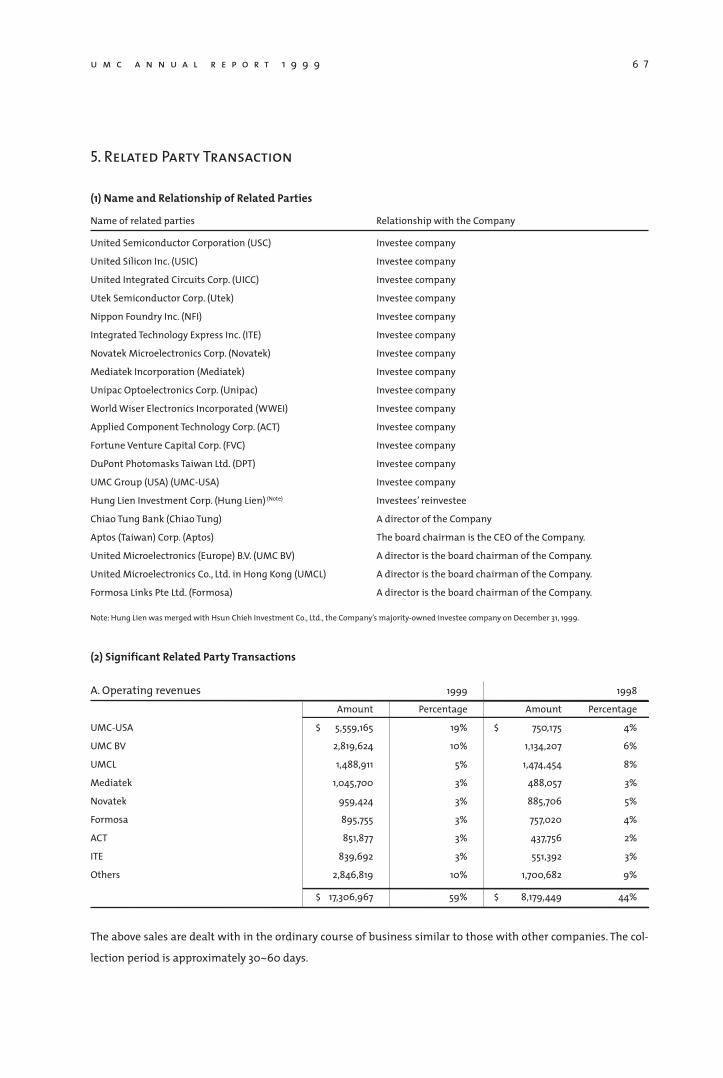
(1) Name and Relationship of Related Parties
Name of related parties Relationship with the Company
United Semiconductor Corporation (USC) Investee company
United Silicon Inc. (USIC) Investee company
United Integrated Circuits Corp. (UICC) Investee company
Utek Semiconductor Corp. (Utek) Investee company
Nippon Foundry Inc. (NFI) Investee company
Integrated Technology Express Inc. (ITE) Investee company
Novatek Microelectronics Corp. (Novatek) Investee company
Mediatek Incorporation (Mediatek) Investee company
Unipac Optoelectronics Corp. (Unipac) Investee company
World Wiser Electronics Incorporated (WWEI) Investee company
Applied Component Technology Corp. (ACT) Investee company
Fortune Venture Capital Corp. (FVC) Investee company
DuPont Photomasks Taiwan Ltd. (DPT) Investee company
UMC Group (USA) (UMC-USA) Investee company
Hung Lien Investment Corp. (Hung Lien) (Note) Investees’ reinvestee
Chiao Tung Bank (Chiao Tung) A director of the Company
Aptos (Taiwan) Corp. (Aptos) The board chairman is the CEO of the Company.
United Microelectronics (Europe) B.V. (UMC BV) A director is the board chairman of the Company.
United Microelectronics Co., Ltd. in Hong Kong (UMCL) A director is the board chairman of the Company.
Formosa Links Pte Ltd. (Formosa) A director is the board chairman of the Company.
Note: Hung Lien was merged with Hsun Chieh Investment Co., Ltd., the Company’s majority-owned investee company on December 31, 1999.
(2) Significant Related Party Transactions
A. Operating revenues 1999 1998
Amount Percentage Amount Percentage
UMC-USA $ 5,559,165 19% $ 750,175 4%
UMC BV 2,819,624 10% 1,134,207 6%
UMCL 1,488,911 5% 1,474,454 8%
Mediatek 1,045,700 3% 488,057 3%
Novatek 959,424 3% 885,706 5%
Formosa 895,755 3% 757,020 4%
ACT 851,877 3% 437,756 2%
ITE 839,692 3% 551,392 3%
Others 2,846,819 10% 1,700,682 9%
$ 17,306,967 59% $ 8,179,449 44%
The above sales are dealt with in the ordinary course of business similar to those with other companies. The col-
lection period is approximately 30~60 days.
6 8
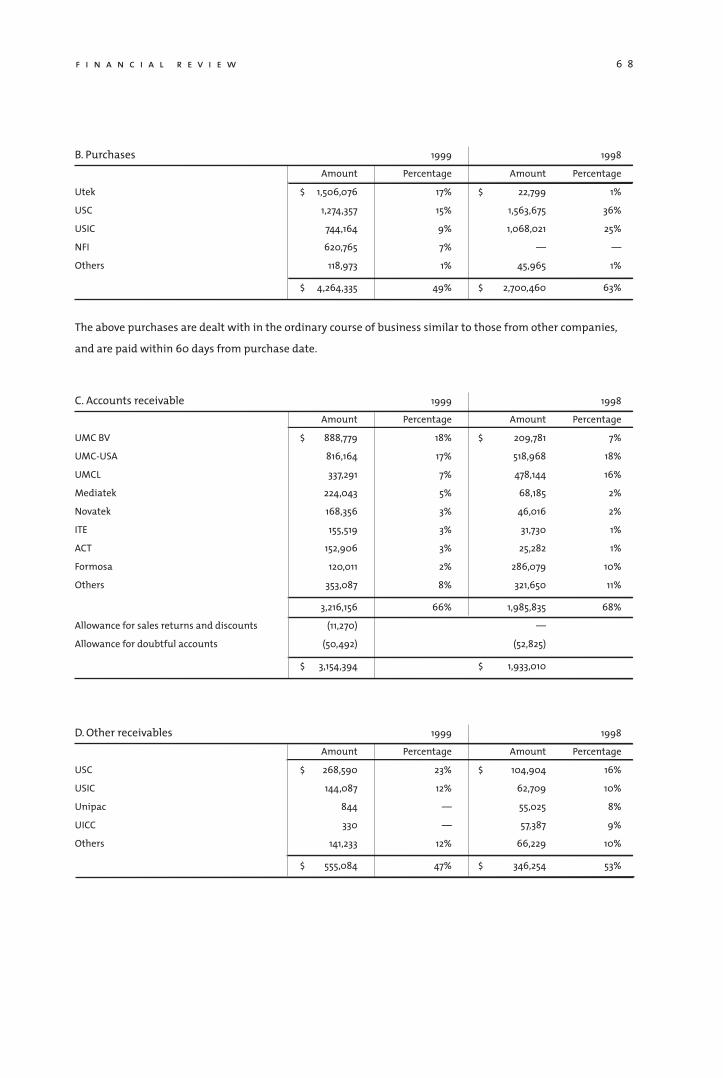
B. Purchases 1999 1998
Amount Percentage Amount Percentage
Utek $ 1,506,076 17% $ 22,799 1%
USC 1,274,357 15% 1,563,675 36%
USIC 744,164 9% 1,068,021 25%
NFI 620,765 7% — —
Others 118,973 1% 45,965 1%
$ 4,264,335 49% $ 2,700,460 63%
The above purchases are dealt with in the ordinary course of business similar to those from other companies,
and are paid within 60 days from purchase date.
C. Accounts receivable 1999 1998
Amount Percentage Amount Percentage
UMC BV $ 888,779 18% $ 209,781 7%
UMC-USA 816,164 17% 518,968 18%
UMCL 337,291 7% 478,144 16%
Mediatek 224,043 5% 68,185 2%
Novatek 168,356 3% 46,016 2%
ITE 155,519 3% 31,730 1%
ACT 152,906 3% 25,282 1%
Formosa 120,011 2% 286,079 10%
Others 353,087 8% 321,650 11%
3,216,156 66% 1,985,835 68%
Allowance for sales returns and discounts (11,270) —
Allowance for doubtful accounts (50,492) (52,825)
$ 3,154,394 $ 1,933,010
D. Other receivables 1999 1998
Amount Percentage Amount Percentage
USC $ 268,590 23% $ 104,904 16%
USIC 144,087 12% 62,709 10%
Unipac 844 — 55,025 8%
UICC 330 — 57,387 9%
Others 141,233 12% 66,229 10%
$ 555,084 47% $ 346,254 53%
f i n a n c i a l r e v i e w
u m c a n n u a l r e p o r t 1 9 9 9 6 9
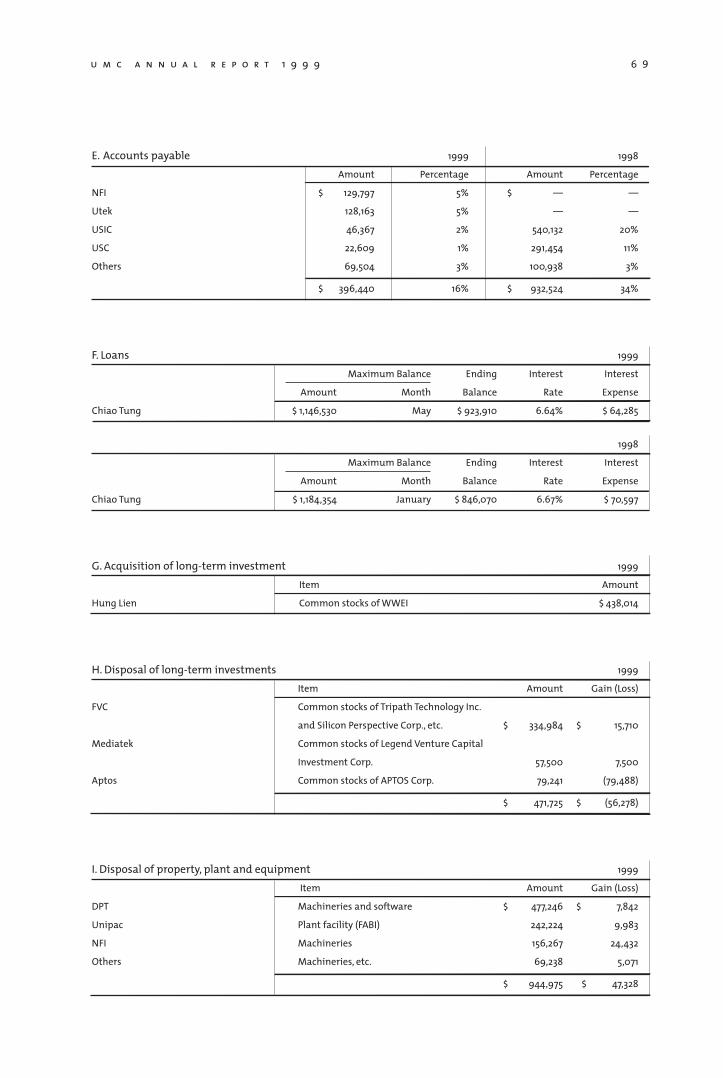
E. Accounts payable 1999 1998
Amount Percentage Amount Percentage
NFI $ 129,797 5% $ — —
Utek 128,163 5% — —
USIC 46,367 2% 540,132 20%
USC 22,609 1% 291,454 11%
Others 69,504 3% 100,938 3%
$ 396,440 16% $ 932,524 34%
F. Loans 1999
Maximum Balance Ending Interest Interest
Amount Month Balance Rate Expense
Chiao Tung $ 1,146,530 May $ 923,910 6.64% $ 64,285
1998
Maximum Balance Ending Interest Interest
Amount Month Balance Rate Expense
Chiao Tung $ 1,184,354 January $ 846,070 6.67% $ 70,597
G. Acquisition of long-term investment 1999
Item Amount
Hung Lien Common stocks of WWEI $ 438,014
H. Disposal of long-term investments 1999
Item Amount Gain (Loss)
FVC Common stocks of Tripath Technology Inc.
and Silicon Perspective Corp., etc. $ 334,984 $ 15,710
Mediatek Common stocks of Legend Venture Capital
Investment Corp. 57,500 7,500
Aptos Common stocks of APTOS Corp. 79,241 (79,488)
$ 471,725 $ (56,278)
I. Disposal of property, plant and equipment 1999
Item Amount Gain (Loss)
DPT Machineries and software $ 477,246 $ 7,842
Unipac Plant facility (FABI) 242,224 9,983
NFI Machineries 156,267 24,432
Others Machineries, etc. 69,238 5,071
$ 944,975 $ 47,328
7 0
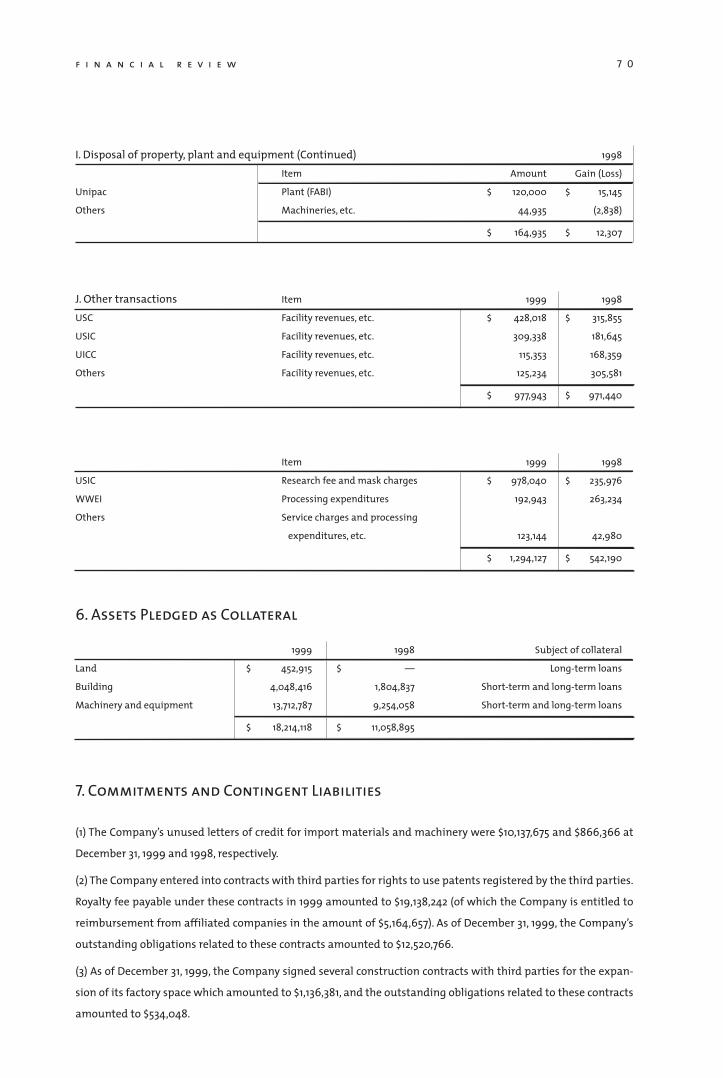
I. Disposal of property, plant and equipment (Continued) 1998
Item Amount Gain (Loss)
Unipac Plant (FABI) $ 120,000 $ 15,145
Others Machineries, etc. 44,935 (2,838)
$ 164,935 $ 12,307
J. Other transactions Item 1999 1998
USC Facility revenues, etc. $ 428,018 $ 315,855
USIC Facility revenues, etc. 309,338 181,645
UICC Facility revenues, etc. 115,353 168,359
Others Facility revenues, etc. 125,234 305,581
$ 977,943 $ 971,440
Item 1999 1998
USIC Research fee and mask charges $ 978,040 $ 235,976
WWEI Processing expenditures 192,943 263,234
Others Service charges and processing
expenditures, etc. 123,144 42,980
$ 1,294,127 $ 542,190
6. Assets Pledged as Collateral
1999 1998 Subject of collateral
Land $ 452,915 $ — Long-term loans
Building 4,048,416 1,804,837 Short-term and long-term loans
Machinery and equipment 13,712,787 9,254,058 Short-term and long-term loans
$ 18,214,118 $ 11,058,895
7. Commitments and Contingent Liabilities
(1) The Company’s unused letters of credit for import materials and machinery were $10,137,675 and $866,366 at
December 31, 1999 and 1998, respectively.
(2) The Company entered into contracts with third parties for rights to use patents registered by the third parties.
Royalty fee payable under these contracts in 1999 amounted to $19,138,242 (of which the Company is entitled to
reimbursement from affiliated companies in the amount of $5,164,657). As of December 31, 1999, the Company’s
outstanding obligations related to these contracts amounted to $12,520,766.
(3) As of December 31, 1999, the Company signed several construction contracts with third parties for the expan-
sion of its factory space which amounted to $1,136,381, and the outstanding obligations related to these contracts
amounted to $534,048.
f i n a n c i a l r e v i e w
u m c a n n u a l r e p o r t 1 9 9 9 7 1
(4) A number of third parties have notified the Company of its alleged infringement on the patents held by
those third parties (including EMI, Intel, NEC, etc.), and have demanded that the Company obtain a license for
various semiconductor fabrication techniques and circuit designs. The Company commenced evaluation of the
specific patents involved, and the preliminary discussions with the third parties regarding licensing terms. Com-
pany management indicated a willingness to obtain licenses, wherever required and necessary, to continue the
Company’s business.
(5) In October, 1998, Micron Technology (Micron) filed a petition against the Company. Micron’s petition alleged
that imports of Dynamic Random Access Memory (DRAM) manufactured in Taiwan were sold in the U.S. at prices
which were less than fair market value (i.e., at “dumped prices”). On November 19, 1999, the International Trade
Commission (ITC) of the United States issued an order which terminated the antidumping case and the no anti-
dumping duties will be assessed on DRAMs imported from Taiwan.
(6) In April 1998, Oak Technology Inc. filed a lawsuit with the U.S. ITC against the Company for alleged violation
of the settlement agreement for patents held in relation to its CD ROM controller chip. On September 27, 1999,
the U.S. ITC issued a ruling affirming that there was no infringement. Oak has appealed the finding of non-
infringement to the Federal Circuit Court of Appeals. Company management believes that this complaint will not
have an adverse material effect on the Company’s operations and financial performances, since the Company no
longer includes any sales of UMC CD ROM controllers in its financial plans.
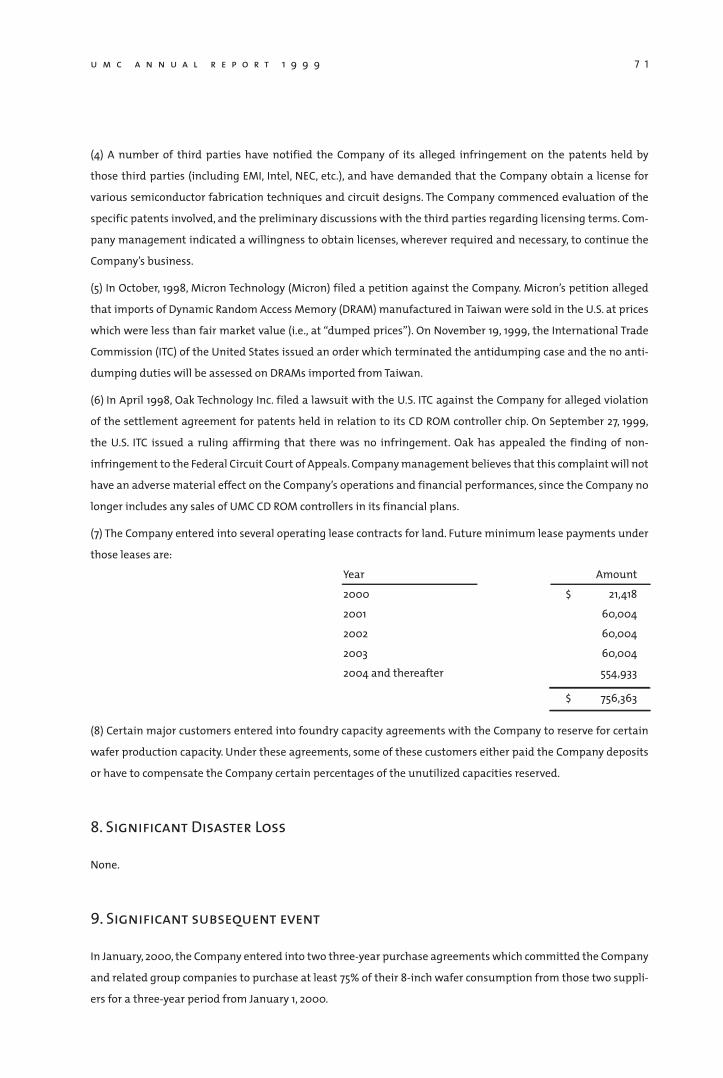
(7) The Company entered into several operating lease contracts for land. Future minimum lease payments under
those leases are:
Year Amount
2000 $ 21,418
2001 60,004
2002 60,004
2003 60,004
2004 and thereafter 554,933
$ 756,363
(8) Certain major customers entered into foundry capacity agreements with the Company to reserve for certain
wafer production capacity. Under these agreements, some of these customers either paid the Company deposits
or have to compensate the Company certain percentages of the unutilized capacities reserved.
8. Significant Disaster Loss
None.
9. Significant subsequent event
In January, 2000, the Company entered into two three-year purchase agreements which committed the Company
and related group companies to purchase at least 75% of their 8-inch wafer consumption from those two suppli-
ers for a three-year period from January 1, 2000.
7 2
10. Segment Information
(1) Operations in different industries
The Company operates principally in one industry. The Company’s major operation is the manufacture of semi-
conductor products.
(2) Operations in different geographic areas
The Company has no significant foreign operations.
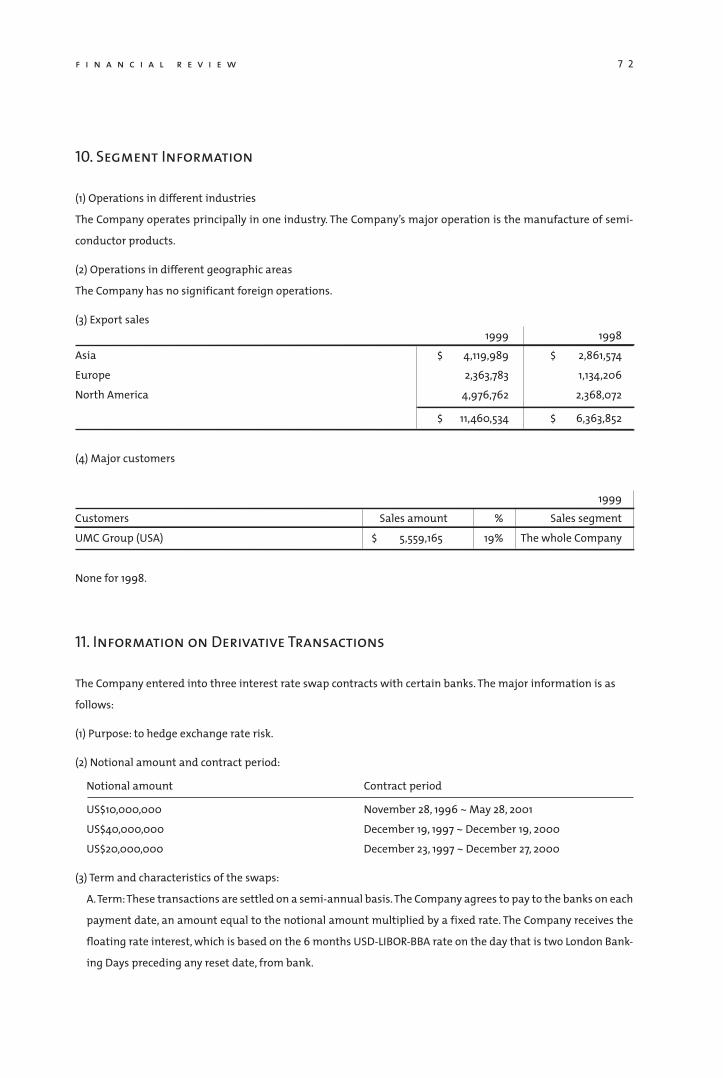
(3) Export sales 1999 1998
Asia $ 4,119,989 $ 2,861,574
Europe 2,363,783 1,134,206
North America 4,976,762 2,368,072
$ 11,460,534 $ 6,363,852
(4) Major customers
1999
Customers Sales amount % Sales segment
UMC Group (USA) $ 5,559,165 19% The whole Company
None for 1998.
11. Information on Derivative Transactions
The Company entered into three interest rate swap contracts with certain banks. The major information is as
follows:
(1) Purpose: to hedge exchange rate risk.
(2) Notional amount and contract period:
Notional amount Contract period
US$10,000,000 November 28, 1996 ~ May 28, 2001
US$40,000,000 December 19, 1997 ~ December 19, 2000
US$20,000,000 December 23, 1997 ~ December 27, 2000
(3) Term and characteristics of the swaps:
A. Term: These transactions are settled on a semi-annual basis. The Company agrees to pay to the banks on each
payment date, an amount equal to the notional amount multiplied by a fixed rate. The Company receives the
floating rate interest, which is based on the 6 months USD-LIBOR-BBA rate on the day that is two London Bank-
ing Days preceding any reset date, from bank.
f i n a n c i a l r e v i e w
u m c a n n u a l r e p o r t 1 9 9 9 7 3
B. Credit risk: There is no significant credit risk with respect to the above three transactions because the banks
have good global standing.
C. Market risk: The market risk is low due to the nature of the swaps.
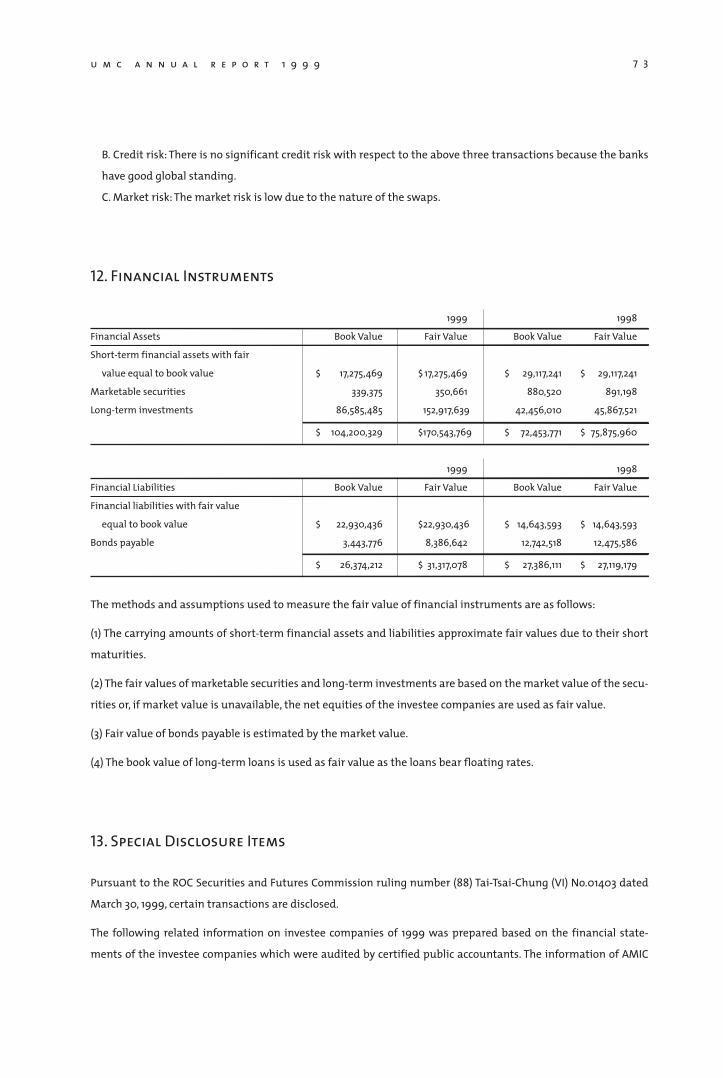
12. Financial Instruments
1999 1998
Financial Assets Book Value Fair Value Book Value Fair Value
Short-term financial assets with fair
value equal to book value $ 17,275,469 $ 17,275,469 $ 29,117,241 $ 29,117,241
Marketable securities 339,375 350,661 880,520 891,198
Long-term investments 86,585,485 152,917,639 42,456,010 45,867,521
$ 104,200,329 $ 170,543,769 $ 72,453,771 $ 75,875,960
1999 1998
Financial Liabilities Book Value Fair Value Book Value Fair Value
Financial liabilities with fair value
equal to book value $ 22,930,436 $ 22,930,436 $ 14,643,593 $ 14,643,593
Bonds payable 3,443,776 8,386,642 12,742,518 12,475,586
$ 26,374,212 $ 31,317,078 $ 27,386,111 $ 27,119,179
The methods and assumptions used to measure the fair value of financial instruments are as follows:
(1) The carrying amounts of short-term financial assets and liabilities approximate fair values due to their short
maturities.
(2) The fair values of marketable securities and long-term investments are based on the market value of the secu-
rities or, if market value is unavailable, the net equities of the investee companies are used as fair value.
(3) Fair value of bonds payable is estimated by the market value.
(4) The book value of long-term loans is used as fair value as the loans bear floating rates.
13. Special Disclosure Items
Pursuant to the ROC Securities and Futures Commission ruling number (88) Tai-Tsai-Chung (VI) No.01403 dated
March 30, 1999, certain transactions are disclosed.
The following related information on investee companies of 1999 was prepared based on the financial state-
ments of the investee companies which were audited by certified public accountants. The information of AMIC
7 4
Technology, Inc., Hsun Chieh Investment Co., Ltd., United Integrated Circuits Corp., United Silicon Inc. and Utek
Semiconductor Corp was prepared based on the financial statements which were audited by other certified
public accountants.
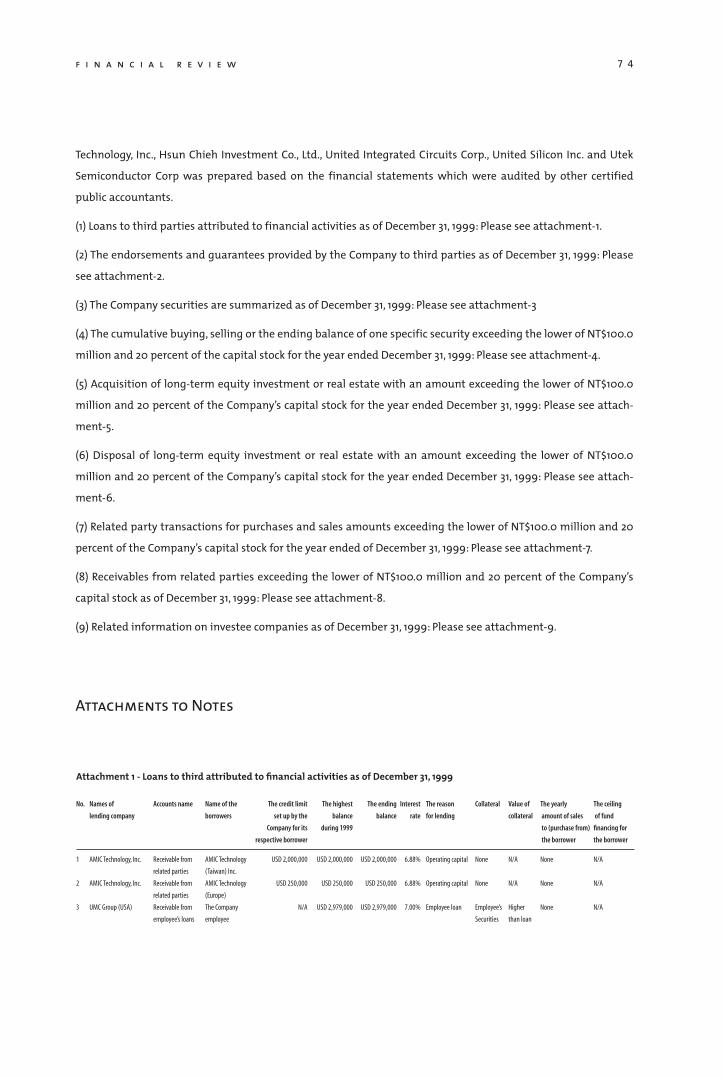
(1) Loans to third parties attributed to financial activities as of December 31, 1999: Please see attachment-1.
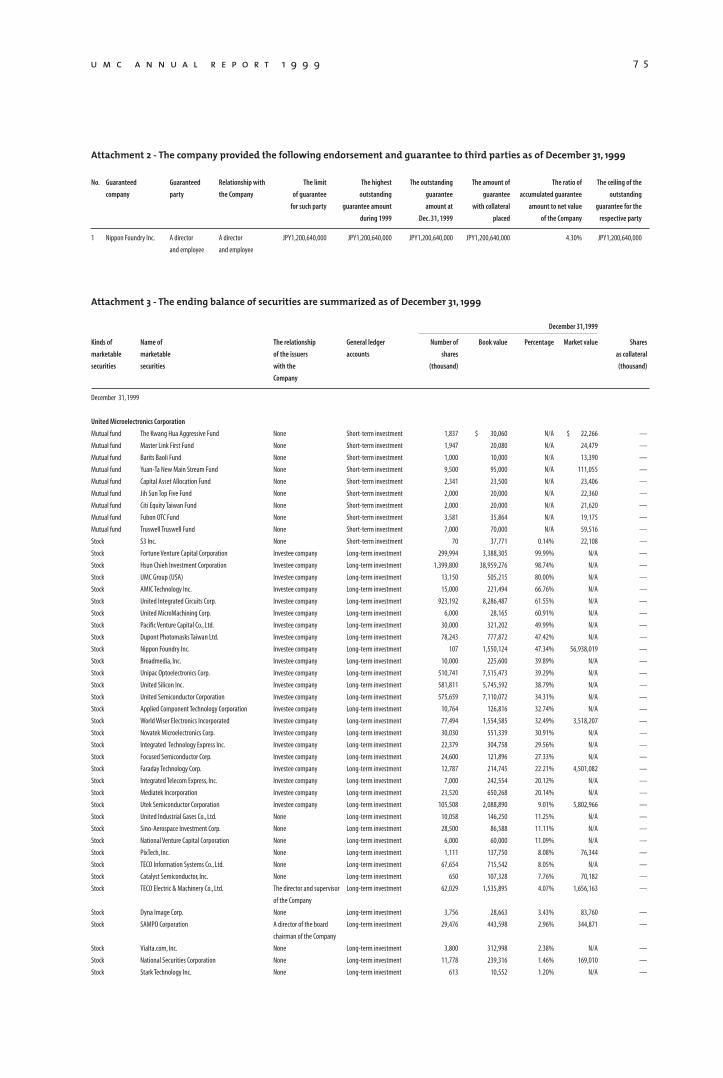
(2) The endorsements and guarantees provided by the Company to third parties as of December 31, 1999: Please
see attachment-2.
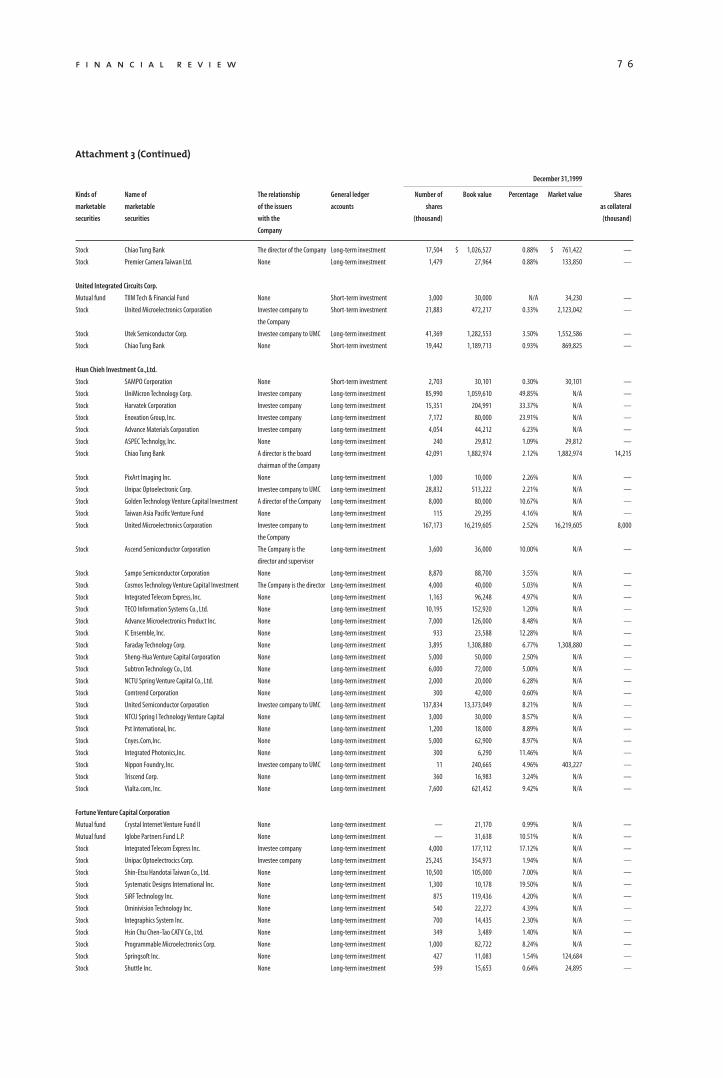
(3) The Company securities are summarized as of December 31, 1999: Please see attachment-3
(4) The cumulative buying, selling or the ending balance of one specific security exceeding the lower of NT$100.0
million and 20 percent of the capital stock for the year ended December 31, 1999: Please see attachment-4.
(5) Acquisition of long-term equity investment or real estate with an amount exceeding the lower of NT$100.0
million and 20 percent of the Company’s capital stock for the year ended December 31, 1999: Please see attach-
ment-5.
(6) Disposal of long-term equity investment or real estate with an amount exceeding the lower of NT$100.0
million and 20 percent of the Company’s capital stock for the year ended December 31, 1999: Please see attach-
ment-6.
(7) Related party transactions for purchases and sales amounts exceeding the lower of NT$100.0 million and 20
percent of the Company’s capital stock for the year ended of December 31, 1999: Please see attachment-7.
(8) Receivables from related parties exceeding the lower of NT$100.0 million and 20 percent of the Company’s
capital stock as of December 31, 1999: Please see attachment-8.
(9) Related information on investee companies as of December 31, 1999: Please see attachment-9.
Attachments to Notes
f i n a n c i a l r e v i e w
Attachment 1 - Loans to third attributed to financial activities as of December 31, 1999
No. Names of Accounts name Name of the The credit limit The highest The ending Interest The reason Collateral Value of The yearly The ceiling
lending company borrowers set up by the balance balance rate for lending collateral amount of sales of fund
Company for its during 1999 to (purchase from) financing for
respective borrower the borrower the borrower
1 AMIC Technology, Inc. Receivable from AMIC Technology USD 2,000,000 USD 2,000,000 USD 2,000,000 6.88% Operating capital None N/A None N/A
related parties (Taiwan) Inc.
2 AMIC Technology, Inc. Receivable from AMIC Technology USD 250,000 USD 250,000 USD 250,000 6.88% Operating capital None N/A None N/A
related parties (Europe)
3 UMC Group (USA) Receivable from The Company N/A USD 2,979,000 USD 2,979,000 7.00% Employee loan Employee’s Higher None N/A
employee’s loans employee Securities than loan
u m c a n n u a l r e p o r t 1 9 9 9 7 5
Attachment 2 - The company provided the following endorsement and guarantee to third parties as of December 31, 1999
No. Guaranteed Guaranteed Relationship with The limit The highest The outstanding The amount of The ratio of The ceiling of the
company party the Company of guarantee outstanding guarantee guarantee accumulated guarantee outstanding
for such party guarantee amount amount at with collateral amount to net value guarantee for the
during 1999 Dec. 31, 1999 placed of the Company respective party
1 Nippon Foundry Inc. A director A director JPY1,200,640,000 JPY1,200,640,000 JPY1,200,640,000 JPY1,200,640,000 4.30% JPY1,200,640,000
and employee and employee
Attachment 3 - The ending balance of securities are summarized as of December 31, 1999
December 31,1999
Kinds of Name of The relationship General ledger Number of Book value Percentage Market value Shares
marketable marketable of the issuers accounts shares as collateral
securities securities with the (thousand) (thousand)
Company
December 31, 1999
United Microelectronics Corporation
Mutual fund The Kwang Hua Aggressive Fund None Short-term investment 1,837 $ 30,060 N/A $ 22,266 —
Mutual fund Master Link First Fund None Short-term investment 1,947 20,080 N/A 24,479 —
Mutual fund Barits Baoli Fund None Short-term investment 1,000 10,000 N/A 13,390 —
Mutual fund Yuan-Ta New Main Stream Fund None Short-term investment 9,500 95,000 N/A 111,055 —
Mutual fund Capital Asset Allocation Fund None Short-term investment 2,341 23,500 N/A 23,406 —
Mutual fund Jih Sun Top Five Fund None Short-term investment 2,000 20,000 N/A 22,360 —
Mutual fund Citi Equity Taiwan Fund None Short-term investment 2,000 20,000 N/A 21,620 —
Mutual fund Fubon OTC Fund None Short-term investment 3,581 35,864 N/A 19,175 —
Mutual fund Truswell Truswell Fund None Short-term investment 7,000 70,000 N/A 59,516 —
Stock S3 Inc. None Short-term investment 70 37,771 0.14% 22,108 —
Stock Fortune Venture Capital Corporation Investee company Long-term investment 299,994 3,388,305 99.99% N/A —
Stock Hsun Chieh Investment Corporation Investee company Long-term investment 1,399,800 38,959,276 98.74% N/A —
Stock UMC Group (USA) Investee company Long-term investment 13,150 505,215 80.00% N/A —
Stock AMIC Technology Inc. Investee company Long-term investment 15,000 221,494 66.76% N/A —
Stock United Integrated Circuits Corp. Investee company Long-term investment 923,192 8,286,487 61.55% N/A —
Stock United MicroMachining Corp. Investee company Long-term investment 6,000 28,165 60.91% N/A —
Stock Pacific Venture Capital Co., Ltd. Investee company Long-term investment 30,000 321,202 49.99% N/A —
Stock Dupont Photomasks Taiwan Ltd. Investee company Long-term investment 78,243 777,872 47.42% N/A —
Stock Nippon Foundry Inc. Investee company Long-term investment 107 1,550,124 47.34% 56,938,019 —
Stock Broadmedia, Inc. Investee company Long-term investment 10,000 225,600 39.89% N/A —
Stock Unipac Optoelectronics Corp. Investee company Long-term investment 510,741 7,515,473 39.29% N/A —
Stock United Silicon Inc. Investee company Long-term investment 581,811 5,745,592 38.79% N/A —
Stock United Semiconductor Corporation Investee company Long-term investment 575,659 7,110,072 34.31% N/A —
Stock Applied Component Technology Corporation Investee company Long-term investment 10,764 126,816 32.74% N/A —
Stock World Wiser Electronics Incorporated Investee company Long-term investment 77,494 1,554,585 32.49% 3,518,207 —
Stock Novatek Microelectronics Corp. Investee company Long-term investment 30,030 551,339 30.91% N/A —
Stock Integrated Technology Express Inc. Investee company Long-term investment 22,379 304,758 29.56% N/A —
Stock Focused Semiconductor Corp. Investee company Long-term investment 24,600 121,896 27.33% N/A —
Stock Faraday Technology Corp. Investee company Long-term investment 12,787 214,745 22.21% 4,501,082 —
Stock Integrated Telecom Express, Inc. Investee company Long-term investment 7,000 242,554 20.12% N/A —
Stock Mediatek Incorporation Investee company Long-term investment 23,520 650,268 20.14% N/A —
Stock Utek Semiconductor Corporation Investee company Long-term investment 105,508 2,088,890 9.01% 5,802,966 —
Stock United Industrial Gases Co., Ltd. None Long-term investment 10,058 146,250 11.25% N/A —
Stock Sino-Aerospace Investment Corp. None Long-term investment 28,500 86,588 11.11% N/A —
Stock National Venture Capital Corporation None Long-term investment 6,000 60,000 11.09% N/A —
Stock PixTech, Inc. None Long-term investment 1,111 137,750 8.08% 76,344 —
Stock TECO Information Systems Co., Ltd. None Long-term investment 67,654 715,542 8.05% N/A —
Stock Catalyst Semiconductor, Inc. None Long-term investment 650 107,328 7.76% 70,182 —
Stock TECO Electric & Machinery Co., Ltd. The director and supervisor Long-term investment 62,029 1,535,895 4.07% 1,656,163 —
of the Company
Stock Dyna Image Corp. None Long-term investment 3,756 28,663 3.43% 83,760 —
Stock SAMPO Corporation A director of the board Long-term investment 29,476 443,598 2.96% 344,871 —
chairman of the Company
Stock Vialta.com, Inc. None Long-term investment 3,800 312,998 2.38% N/A —
Stock National Securities Corporation None Long-term investment 11,778 239,316 1.46% 169,010 —
Stock Stark Technology Inc. None Long-term investment 613 10,552 1.20% N/A —
7 6f i n a n c i a l r e v i e w
Attachment 3 (Continued)
December 31,1999
Kinds of Name of The relationship General ledger Number of Book value Percentage Market value Shares
marketable marketable of the issuers accounts shares as collateral
securities securities with the (thousand) (thousand)
Company
Stock Chiao Tung Bank The director of the Company Long-term investment 17,504 $ 1,026,527 0.88% $ 761,422 —
Stock Premier Camera Taiwan Ltd. None Long-term investment 1,479 27,964 0.88% 133,850 —
United Integrated Circuits Corp.
Mutual fund TIIM Tech & Financial Fund None Short-term investment 3,000 30,000 N/A 34,230 —
Stock United Microelectronics Corporation Investee company to Short-term investment 21,883 472,217 0.33% 2,123,042 —
the Company
Stock Utek Semiconductor Corp. Investee company to UMC Long-term investment 41,369 1,282,553 3.50% 1,552,586 —
Stock Chiao Tung Bank None Short-term investment 19,442 1,189,713 0.93% 869,825 —
Hsun Chieh Investment Co.,Ltd.
Stock SAMPO Corporation None Short-term investment 2,703 30,101 0.30% 30,101 —
Stock UniMicron Technology Corp. Investee company Long-term investment 85,990 1,059,610 49.85% N/A —
Stock Harvatek Corporation Investee company Long-term investment 15,351 204,991 33.37% N/A —
Stock Enovation Group, Inc. Investee company Long-term investment 7,172 80,000 23.91% N/A —
Stock Advance Materials Corporation Investee company Long-term investment 4,054 44,212 6.23% N/A —
Stock ASPEC Technolgy, Inc. None Long-term investment 240 29,812 1.09% 29,812 —
Stock Chiao Tung Bank A director is the board Long-term investment 42,091 1,882,974 2.12% 1,882,974 14,215
chairman of the Company
Stock PixArt Imaging Inc. None Long-term investment 1,000 10,000 2.26% N/A —
Stock Unipac Optoelectronic Corp. Investee company to UMC Long-term investment 28,832 513,222 2.21% N/A —
Stock Golden Technology Venture Capital Investment A director of the Company Long-term investment 8,000 80,000 10.67% N/A —
Stock Taiwan Asia Pacific Venture Fund None Long-term investment 115 29,295 4.16% N/A —
Stock United Microelectronics Corporation Investee company to Long-term investment 167,173 16,219,605 2.52% 16,219,605 8,000
the Company
Stock Ascend Semiconductor Corporation The Company is the Long-term investment 3,600 36,000 10.00% N/A —
director and supervisor
Stock Sampo Semiconductor Corporation None Long-term investment 8,870 88,700 3.55% N/A —
Stock Cosmos Technology Venture Capital Investment The Company is the director Long-term investment 4,000 40,000 5.03% N/A —
Stock Integrated Telecom Express, Inc. None Long-term investment 1,163 96,248 4.97% N/A —
Stock TECO Information Systems Co., Ltd. None Long-term investment 10,195 152,920 1.20% N/A —
Stock Advance Microelectronics Product Inc. None Long-term investment 7,000 126,000 8.48% N/A —
Stock IC Ensemble, Inc. None Long-term investment 933 23,588 12.28% N/A —
Stock Faraday Technology Corp. None Long-term investment 3,895 1,308,880 6.77% 1,308,880 —
Stock Sheng-Hua Venture Capital Corporation None Long-term investment 5,000 50,000 2.50% N/A —
Stock Subtron Technology Co., Ltd. None Long-term investment 6,000 72,000 5.00% N/A —
Stock NCTU Spring Venture Capital Co., Ltd. None Long-term investment 2,000 20,000 6.28% N/A —
Stock Comtrend Corporation None Long-term investment 300 42,000 0.60% N/A —
Stock United Semiconductor Corporation Investee company to UMC Long-term investment 137,834 13,373,049 8.21% N/A —
Stock NTCU Spring I Technology Venture Capital None Long-term investment 3,000 30,000 8.57% N/A —
Stock Pst International, Inc. None Long-term investment 1,200 18,000 8.89% N/A —
Stock Cnyes.Com,Inc. None Long-term investment 5,000 62,900 8.97% N/A —
Stock Integrated Photonics,Inc. None Long-term investment 300 6,290 11.46% N/A —
Stock Nippon Foundry, Inc. Investee company to UMC Long-term investment 11 240,665 4.96% 403,227 —
Stock Triscend Corp. None Long-term investment 360 16,983 3.24% N/A —
Stock Vialta.com, Inc. None Long-term investment 7,600 621,452 9.42% N/A —
Fortune Venture Capital Corporation
Mutual fund Crystal Internet Venture Fund II None Long-term investment — 21,170 0.99% N/A —
Mutual fund Iglobe Partners Fund L.P. None Long-term investment — 31,638 10.51% N/A —
Stock Integrated Telecom Express Inc. Investee company Long-term investment 4,000 177,112 17.12% N/A —
Stock Unipac Optoelectrocics Corp. Investee company Long-term investment 25,245 354,973 1.94% N/A —
Stock Shin-Etsu Handotai Taiwan Co., Ltd. None Long-term investment 10,500 105,000 7.00% N/A —
Stock Systematic Designs International Inc. None Long-term investment 1,300 10,178 19.50% N/A —
Stock SiRF Technology Inc. None Long-term investment 875 119,436 4.20% N/A —
Stock Ominivision Technology Inc. None Long-term investment 540 22,272 4.39% N/A —
Stock Integraphics System Inc. None Long-term investment 700 14,435 2.30% N/A —
Stock Hsin Chu Chen-Tao CATV Co., Ltd. None Long-term investment 349 3,489 1.40% N/A —
Stock Programmable Microelectronics Corp. None Long-term investment 1,000 82,722 8.24% N/A —
Stock Springsoft Inc. None Long-term investment 427 11,083 1.54% 124,684 —
Stock Shuttle Inc. None Long-term investment 599 15,653 0.64% 24,895 —
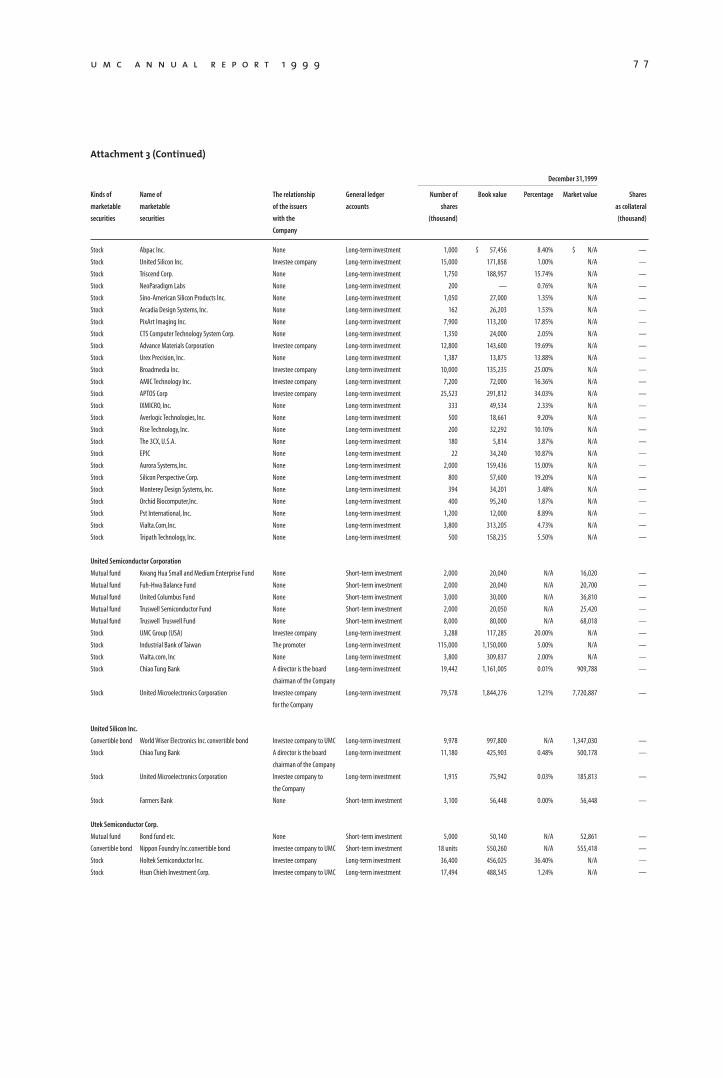
u m c a n n u a l r e p o r t 1 9 9 9 7 7
Attachment 3 (Continued)
December 31,1999
Kinds of Name of The relationship General ledger Number of Book value Percentage Market value Shares
marketable marketable of the issuers accounts shares as collateral
securities securities with the (thousand) (thousand)
Company
Stock Abpac Inc. None Long-term investment 1,000 $ 57,456 8.40% $ N/A —
Stock United Silicon Inc. Investee company Long-term investment 15,000 171,858 1.00% N/A —
Stock Triscend Corp. None Long-term investment 1,750 188,957 15.74% N/A —
Stock NeoParadigm Labs None Long-term investment 200 — 0.76% N/A —
Stock Sino-American Silicon Products Inc. None Long-term investment 1,050 27,000 1.35% N/A —
Stock Arcadia Design Systems, Inc. None Long-term investment 162 26,203 1.53% N/A —
Stock PixArt Imaging Inc. None Long-term investment 7,900 113,200 17.85% N/A —
Stock CTS Computer Technology System Corp. None Long-term investment 1,350 24,000 2.05% N/A —
Stock Advance Materials Corporation Investee company Long-term investment 12,800 143,600 19.69% N/A —
Stock Urex Precision, Inc. None Long-term investment 1,387 13,875 13.88% N/A —
Stock Broadmedia Inc. Investee company Long-term investment 10,000 135,235 25.00% N/A —
Stock AMIC Technology Inc. Investee company Long-term investment 7,200 72,000 16.36% N/A —
Stock APTOS Corp Investee company Long-term investment 25,523 291,812 34.03% N/A —
Stock IXMICRO, Inc. None Long-term investment 333 49,534 2.33% N/A —
Stock Averlogic Technologies, Inc. None Long-term investment 500 18,661 9.20% N/A —
Stock Rise Technology, Inc. None Long-term investment 200 32,292 10.10% N/A —
Stock The 3CX, U.S.A. None Long-term investment 180 5,814 3.87% N/A —
Stock EPIC None Long-term investment 22 34,240 10.87% N/A —
Stock Aurora Systems,Inc. None Long-term investment 2,000 159,436 15.00% N/A —
Stock Silicon Perspective Corp. None Long-term investment 800 57,600 19.20% N/A —
Stock Monterey Design Systems, Inc. None Long-term investment 394 34,201 3.48% N/A —
Stock Orchid Biocomputer,Inc. None Long-term investment 400 95,240 1.87% N/A —
Stock Pst International, Inc. None Long-term investment 1,200 12,000 8.89% N/A —
Stock Vialta.Com,Inc. None Long-term investment 3,800 313,205 4.73% N/A —
Stock Tripath Technology, Inc. None Long-term investment 500 158,235 5.50% N/A —
United Semiconductor Corporation
Mutual fund Kwang Hua Small and Medium Enterprise Fund None Short-term investment 2,000 20,040 N/A 16,020 —
Mutual fund Fuh-Hwa Balance Fund None Short-term investment 2,000 20,040 N/A 20,700 —
Mutual fund United Columbus Fund None Short-term investment 3,000 30,000 N/A 36,810 —
Mutual fund Truswell Semiconductor Fund None Short-term investment 2,000 20,050 N/A 25,420 —
Mutual fund Truswell Truswell Fund None Short-term investment 8,000 80,000 N/A 68,018 —
Stock UMC Group (USA) Investee company Long-term investment 3,288 117,285 20.00% N/A —
Stock Industrial Bank of Taiwan The promoter Long-term investment 115,000 1,150,000 5.00% N/A —
Stock Vialta.com, Inc None Long-term investment 3,800 309,837 2.00% N/A —
Stock Chiao Tung Bank A director is the board Long-term investment 19,442 1,161,005 0.01% 909,788 —
chairman of the Company
Stock United Microelectronics Corporation Investee company Long-term investment 79,578 1,844,276 1.21% 7,720,887 —
for the Company
United Silicon Inc.
Convertible bond World Wiser Electronics Inc. convertible bond Investee company to UMC Long-term investment 9,978 997,800 N/A 1,347,030 —
Stock Chiao Tung Bank A director is the board Long-term investment 11,180 425,903 0.48% 500,178 —
chairman of the Company
Stock United Microelectronics Corporation Investee company to Long-term investment 1,915 75,942 0.03% 185,813 —
the Company
Stock Farmers Bank None Short-term investment 3,100 56,448 0.00% 56,448 —
Utek Semiconductor Corp.
Mutual fund Bond fund etc. None Short-term investment 5,000 50,140 N/A 52,861 —
Convertible bond Nippon Foundry Inc.convertible bond Investee company to UMC Short-term investment 18 units 550,260 N/A 555,418 —
Stock Holtek Semiconductor Inc. Investee company Long-term investment 36,400 456,025 36.40% N/A —
Stock Hsun Chieh Investment Corp. Investee company to UMC Long-term investment 17,494 488,545 1.24% N/A —
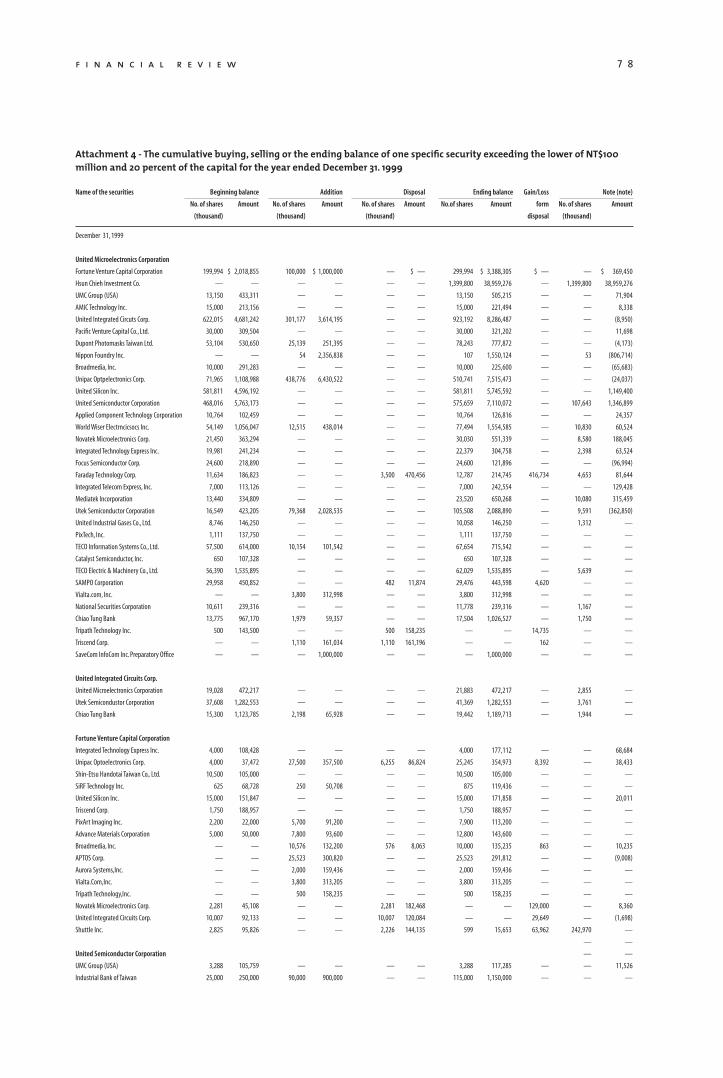
7 8
Attachment 4 - The cumulative buying, selling or the ending balance of one specific security exceeding the lower of NT$100 million and 20 percent of the capital for the year ended December 31. 1999
Name of the securities Beginning balance Addition Disposal Ending balance Gain/Loss Note (note)
No. of shares Amount No. of shares Amount No. of shares Amount No.of shares Amount form No. of shares Amount
(thousand) (thousand) (thousand) disposal (thousand)
December 31, 1999
United Microelectronics Corporation
Fortune Venture Capital Corporation 199,994 $ 2,018,855 100,000 $ 1,000,000 — $ — 299,994 $ 3,388,305 $ — — $ 369,450
Hsun Chieh Investment Co. — — — — — — 1,399,800 38,959,276 — 1,399,800 38,959,276
UMC Group (USA) 13,150 433,311 — — — — 13,150 505,215 — — 71,904
AMIC Technology Inc. 15,000 213,156 — — — — 15,000 221,494 — — 8,338
United Integrated Circuts Corp. 622,015 4,681,242 301,177 3,614,195 — — 923,192 8,286,487 — — (8,950)
Pacific Venture Capital Co., Ltd. 30,000 309,504 — — — — 30,000 321,202 — — 11,698
Dupont Photomasks Taiwan Ltd. 53,104 530,650 25,139 251,395 — — 78,243 777,872 — — (4,173)
Nippon Foundry Inc. — — 54 2,356,838 — — 107 1,550,124 — 53 (806,714)
Broadmedia, Inc. 10,000 291,283 — — — — 10,000 225,600 — — (65,683)
Unipac Optpelectronics Corp. 71,965 1,108,988 438,776 6,430,522 — — 510,741 7,515,473 — — (24,037)
United Silicon Inc. 581,811 4,596,192 — — — — 581,811 5,745,592 — — 1,149,400
United Semiconductor Corporation 468,016 5,763,173 — — — — 575,659 7,110,072 — 107,643 1,346,899
Applied Component Technology Corporation 10,764 102,459 — — — — 10,764 126,816 — — 24,357
World Wiser Electrncicsocs Inc. 54,149 1,056,047 12,515 438,014 — — 77,494 1,554,585 — 10,830 60,524
Novatek Microelectronics Corp. 21,450 363,294 — — — — 30,030 551,339 — 8,580 188,045
Integrated Technology Express Inc. 19,981 241,234 — — — — 22,379 304,758 — 2,398 63,524
Focus Semiconductor Corp. 24,600 218,890 — — — — 24,600 121,896 — — (96,994)
Faraday Technology Corp. 11,634 186,823 — — 3,500 470,456 12,787 214,745 416,734 4,653 81,644
Integrated Telecom Express, Inc. 7,000 113,126 — — — — 7,000 242,554 — — 129,428
Mediatek Incorporation 13,440 334,809 — — — — 23,520 650,268 — 10,080 315,459
Utek Semiconductor Corporation 16,549 423,205 79,368 2,028,535 — — 105,508 2,088,890 — 9,591 (362,850)
United Industrial Gases Co., Ltd. 8,746 146,250 — — — — 10,058 146,250 — 1,312 —
PixTech, Inc. 1,111 137,750 — — — — 1,111 137,750 — — —
TECO Information Systems Co., Ltd. 57,500 614,000 10,154 101,542 — — 67,654 715,542 — — —
Catalyst Semiconductor, Inc. 650 107,328 — — — — 650 107,328 — — —
TECO Electric & Machinery Co., Ltd. 56,390 1,535,895 — — — — 62,029 1,535,895 — 5,639 —
SAMPO Corporation 29,958 450,852 — — 482 11,874 29,476 443,598 4,620 — —
Vialta.com, Inc. — — 3,800 312,998 — — 3,800 312,998 — — —
National Securities Corporation 10,611 239,316 — — — — 11,778 239,316 — 1,167 —
Chiao Tung Bank 13,775 967,170 1,979 59,357 — — 17,504 1,026,527 — 1,750 —
Tripath Technology Inc. 500 143,500 — — 500 158,235 — — 14,735 — —
Triscend Corp. — — 1,110 161,034 1,110 161,196 — — 162 — —
SaveCom InfoCom Inc. Preparatory Office — — — 1,000,000 — — — 1,000,000 — — —
United Integrated Circuits Corp.
United Microelectronics Corporation 19,028 472,217 — — — — 21,883 472,217 — 2,855 —
Utek Semicondustor Corporation 37,608 1,282,553 — — — — 41,369 1,282,553 — 3,761 —
Chiao Tung Bank 15,300 1,123,785 2,198 65,928 — — 19,442 1,189,713 — 1,944 —
Fortune Venture Capital Corporation
Integrated Technology Express Inc. 4,000 108,428 — — — — 4,000 177,112 — — 68,684
Unipac Optoelectronics Corp. 4,000 37,472 27,500 357,500 6,255 86,824 25,245 354,973 8,392 — 38,433
Shin-Etsu Handotai Taiwan Co,. Ltd. 10,500 105,000 — — — — 10,500 105,000 — — —
SiRF Technology Inc. 625 68,728 250 50,708 — — 875 119,436 — — —
United Silicon Inc. 15,000 151,847 — — — — 15,000 171,858 — — 20,011
Triscend Corp. 1,750 188,957 — — — — 1,750 188,957 — — —
PixArt Imaging Inc. 2,200 22,000 5,700 91,200 — — 7,900 113,200 — — —
Advance Materials Corporation 5,000 50,000 7,800 93,600 — — 12,800 143,600 — — —
Broadmedia, Inc. — — 10,576 132,200 576 8,063 10,000 135,235 863 — 10,235
APTOS Corp. — — 25,523 300,820 — — 25,523 291,812 — — (9,008)
Aurora Systems,Inc. — — 2,000 159,436 — — 2,000 159,436 — — —
Vialta.Com,Inc. — — 3,800 313,205 — — 3,800 313,205 — — —
Tripath Technology,Inc. — — 500 158,235 — — 500 158,235 — — —
Novatek Microelectronics Corp. 2,281 45,108 — — 2,281 182,468 — — 129,000 — 8,360
United Integrated Circuits Corp. 10,007 92,133 — — 10,007 120,084 — — 29,649 — (1,698)
Shuttle Inc. 2,825 95,826 — — 2,226 144,135 599 15,653 63,962 242,970 —
— —
United Semiconductor Corporation — —
UMC Group (USA) 3,288 105,759 — — — — 3,288 117,285 — — 11,526
Industrial Bank of Taiwan 25,000 250,000 90,000 900,000 — — 115,000 1,150,000 — — —
f i n a n c i a l r e v i e w
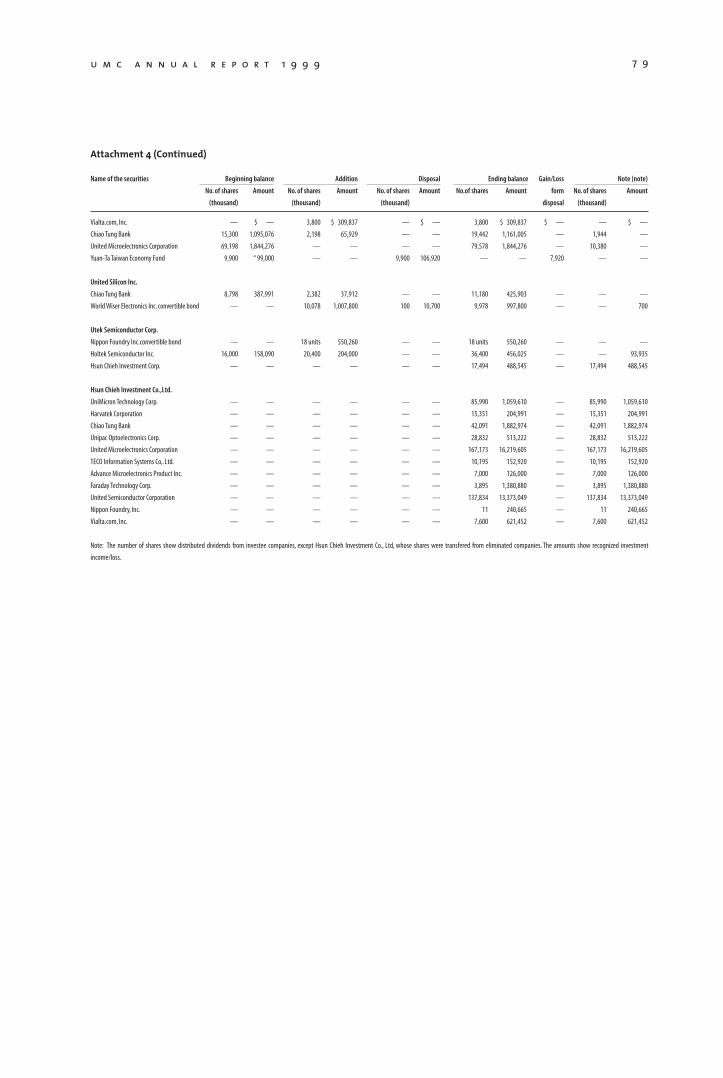
u m c a n n u a l r e p o r t 1 9 9 9 7 9
Attachment 4 (Continued)
Name of the securities Beginning balance Addition Disposal Ending balance Gain/Loss Note (note)
No. of shares Amount No. of shares Amount No. of shares Amount No.of shares Amount form No. of shares Amount
(thousand) (thousand) (thousand) disposal (thousand)
Vialta.com, Inc. — $ — 3,800 $ 309,837 — $ — 3,800 $ 309,837 $ — — $ —
Chiao Tung Bank 15,300 1,095,076 2,198 65,929 — — 19,442 1,161,005 — 1,944 —
United Microelectronics Corporation 69,198 1,844,276 — — — — 79,578 1,844,276 — 10,380 —
Yuan-Ta Taiwan Economy Fund 9,900 “ 99,000 — — 9,900 106,920 — — 7,920 — —
United Silicon Inc.
Chiao Tung Bank 8,798 387,991 2,382 37,912 — — 11,180 425,903 — — —
World Wiser Electronics Inc. convertible bond — — 10,078 1,007,800 100 10,700 9,978 997,800 — — 700
Utek Semiconductor Corp.
Nippon Foundry Inc.convertible bond — — 18 units 550,260 — — 18 units 550,260 — — —
Holtek Semiconductor Inc. 16,000 158,090 20,400 204,000 — — 36,400 456,025 — — 93,935
Hsun Chieh Investment Corp. — — — — — — 17,494 488,545 — 17,494 488,545
Hsun Chieh Investment Co.,Ltd.
UniMicron Technology Corp. — — — — — — 85,990 1,059,610 — 85,990 1,059,610
Harvatek Corporation — — — — — — 15,351 204,991 — 15,351 204,991
Chiao Tung Bank — — — — — — 42,091 1,882,974 — 42,091 1,882,974
Unipac Optoelectronics Corp. — — — — — — 28,832 513,222 — 28,832 513,222
United Microelectronics Corporation — — — — — — 167,173 16,219,605 — 167,173 16,219,605
TECO Information Systems Co,. Ltd. — — — — — — 10,195 152,920 — 10,195 152,920
Advance Microelectronics Product Inc. — — — — — — 7,000 126,000 — 7,000 126,000
Faraday Technology Corp. — — — — — — 3,895 1,380,880 — 3,895 1,380,880
United Semiconductor Corporation — — — — — — 137,834 13,373,049 — 137,834 13,373,049
Nippon Foundry, Inc. — — — — — — 11 240,665 — 11 240,665
Vialta.com, Inc. — — — — — — 7,600 621,452 — 7,600 621,452
Note: The number of shares show distributed dividends from investee companies, except Hsun Chieh Investment Co., Ltd, whose shares were transfered from eliminated companies. The amounts show recognized investment
income/loss.
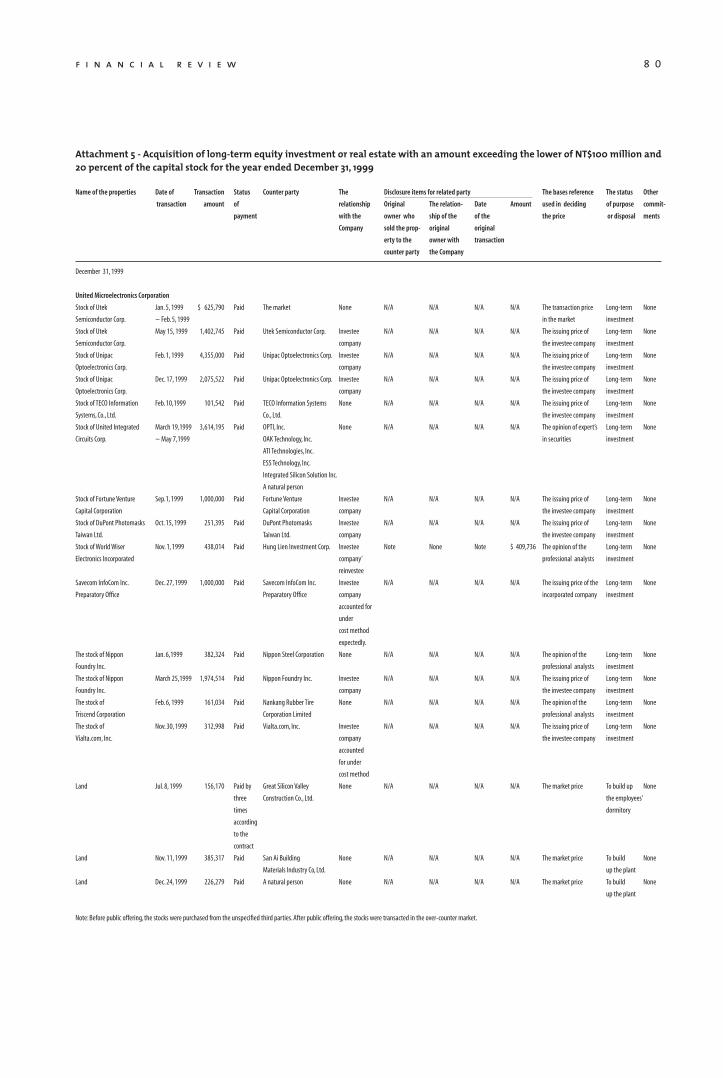
Attachment 5 - Acquisition of long-term equity investment or real estate with an amount exceeding the lower of NT$100 million and 20 percent of the capital stock for the year ended December 31, 1999
Name of the properties Date of Transaction Status Counter party The Disclosure items for related party The bases reference The status Other
transaction amount of relationship Original The relation- Date Amount used in deciding of purpose commit-
payment with the owner who ship of the of the the price or disposal ments
Company sold the prop- original original
erty to the owner with transaction
counter party the Company
December 31, 1999
United Microelectronics Corporation
Stock of Utek Jan. 5, 1999 $ 625,790 Paid The market None N/A N/A N/A N/A The transaction price Long-term None
Semiconductor Corp. ~ Feb. 5, 1999 in the market investment
Stock of Utek May 15, 1999 1,402,745 Paid Utek Semiconductor Corp. Investee N/A N/A N/A N/A The issuing price of Long-term None
Semiconductor Corp. company the investee company investment
Stock of Unipac Feb. 1, 1999 4,355,000 Paid Unipac Optoelectronics Corp. Investee N/A N/A N/A N/A The issuing price of Long-term None
Optoelectronics Corp. company the investee company investment
Stock of Unipac Dec. 17, 1999 2,075,522 Paid Unipac Optoelectronics Corp. Investee N/A N/A N/A N/A The issuing price of Long-term None
Optoelectronics Corp. company the investee company investment
Stock of TECO Information Feb. 10,1999 101,542 Paid TECO Information Systems None N/A N/A N/A N/A The issuing price of Long-term None
Systems, Co., Ltd. Co., Ltd. the investee company investment
Stock of United Integrated March 19,1999 3,614,195 Paid OPTI, Inc. None N/A N/A N/A N/A The opinion of expert’s Long-term None
Circuits Corp. ~ May 7,1999 OAK Technology, Inc. in securities investment
ATI Technologies, Inc.
ESS Technology, Inc.
Integrated Silicon Solution Inc.
A natural person
Stock of Fortune Venture Sep.1, 1999 1,000,000 Paid Fortune Venture Investee N/A N/A N/A N/A The issuing price of Long-term None
Capital Corporation Capital Corporation company the investee company investment
Stock of DuPont Photomasks Oct. 15, 1999 251,395 Paid DuPont Photomasks Investee N/A N/A N/A N/A The issuing price of Long-term None
Taiwan Ltd. Taiwan Ltd. company the investee company investment
Stock of World Wiser Nov. 1, 1999 438,014 Paid Hung Lien Investment Corp. Investee Note None Note $ 409,736 The opinion of the Long-term None
Electronics Incorporated company’ professional analysts investment
reinvestee
Savecom InfoCom Inc. Dec. 27, 1999 1,000,000 Paid Savecom InfoCom Inc. Investee N/A N/A N/A N/A The issuing price of the Long-term None
Preparatory Office Preparatory Office company incorporated company investment
accounted for
under
cost method
expectedly.
The stock of Nippon Jan. 6,1999 382,324 Paid Nippon Steel Corporation None N/A N/A N/A N/A The opinion of the Long-term None
Foundry Inc. professional analysts investment
The stock of Nippon March 25,1999 1,974,514 Paid Nippon Foundry Inc. Investee N/A N/A N/A N/A The issuing price of Long-term None
Foundry Inc. company the investee company investment
The stock of Feb. 6, 1999 161,034 Paid Nankang Rubber Tire None N/A N/A N/A N/A The opinion of the Long-term None
Triscend Corporation Corporation Limited professional analysts investment
The stock of Nov. 30, 1999 312,998 Paid Vialta.com, Inc. Investee N/A N/A N/A N/A The issuing price of Long-term None
Vialta.com, Inc. company the investee company investment
accounted
for under
cost method
Land Jul. 8, 1999 156,170 Paid by Great Silicon Valley None N/A N/A N/A N/A The market price To build up None
three Construction Co., Ltd. the employees’
times dormitory
according
to the
contract
Land Nov. 11, 1999 385,317 Paid San Ai Building None N/A N/A N/A N/A The market price To build None
Materials Industry Co, Ltd. up the plant
Land Dec. 24, 1999 226,279 Paid A natural person None N/A N/A N/A N/A The market price To build None
up the plant
Note: Before public offering, the stocks were purchased from the unspecified third parties. After public offering, the stocks were transacted in the over-counter market.
f i n a n c i a l r e v i e w 8 0
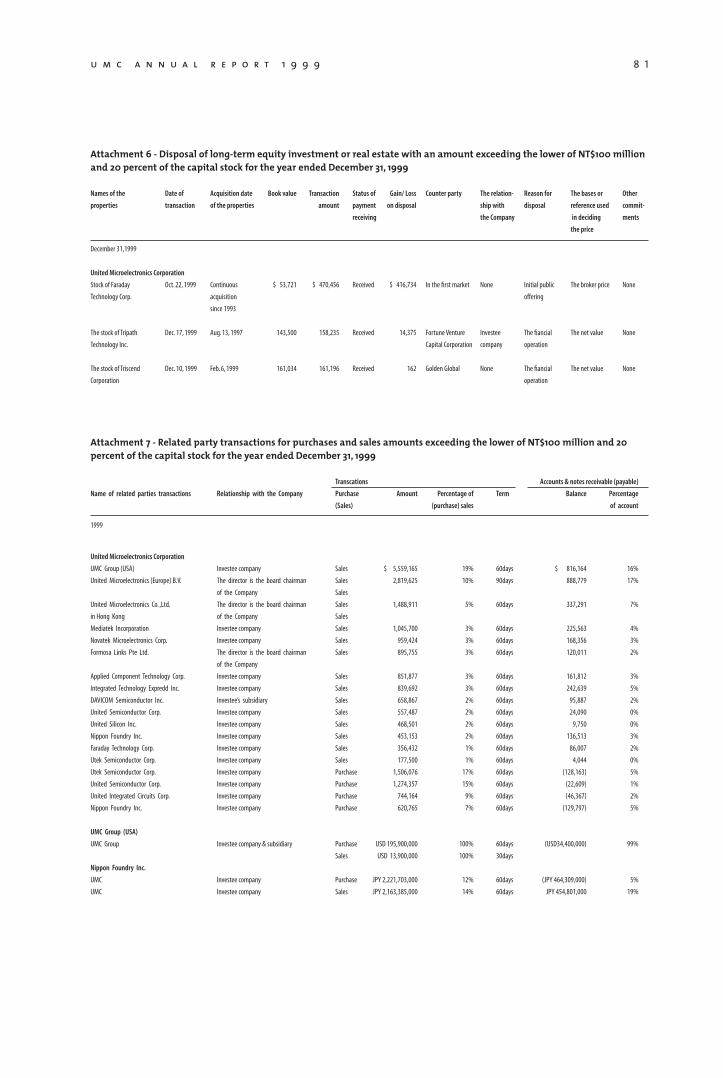
u m c a n n u a l r e p o r t 1 9 9 9 8 1
Attachment 5 - Acquisition of long-term equity investment or real estate with an amount exceeding the lower of NT$100 million and 20 percent of the capital stock for the year ended December 31, 1999
Name of the properties Date of Transaction Status Counter party The Disclosure items for related party The bases reference The status Other
transaction amount of relationship Original The relation- Date Amount used in deciding of purpose commit-
payment with the owner who ship of the of the the price or disposal ments
Company sold the prop- original original
erty to the owner with transaction
counter party the Company
December 31, 1999
United Microelectronics Corporation
Stock of Utek Jan. 5, 1999 $ 625,790 Paid The market None N/A N/A N/A N/A The transaction price Long-term None
Semiconductor Corp. ~ Feb. 5, 1999 in the market investment
Stock of Utek May 15, 1999 1,402,745 Paid Utek Semiconductor Corp. Investee N/A N/A N/A N/A The issuing price of Long-term None
Semiconductor Corp. company the investee company investment
Stock of Unipac Feb. 1, 1999 4,355,000 Paid Unipac Optoelectronics Corp. Investee N/A N/A N/A N/A The issuing price of Long-term None
Optoelectronics Corp. company the investee company investment
Stock of Unipac Dec. 17, 1999 2,075,522 Paid Unipac Optoelectronics Corp. Investee N/A N/A N/A N/A The issuing price of Long-term None
Optoelectronics Corp. company the investee company investment
Stock of TECO Information Feb. 10,1999 101,542 Paid TECO Information Systems None N/A N/A N/A N/A The issuing price of Long-term None
Systems, Co., Ltd. Co., Ltd. the investee company investment
Stock of United Integrated March 19,1999 3,614,195 Paid OPTI, Inc. None N/A N/A N/A N/A The opinion of expert’s Long-term None
Circuits Corp. ~ May 7,1999 OAK Technology, Inc. in securities investment
ATI Technologies, Inc.
ESS Technology, Inc.
Integrated Silicon Solution Inc.
A natural person
Stock of Fortune Venture Sep.1, 1999 1,000,000 Paid Fortune Venture Investee N/A N/A N/A N/A The issuing price of Long-term None
Capital Corporation Capital Corporation company the investee company investment
Stock of DuPont Photomasks Oct. 15, 1999 251,395 Paid DuPont Photomasks Investee N/A N/A N/A N/A The issuing price of Long-term None
Taiwan Ltd. Taiwan Ltd. company the investee company investment
Stock of World Wiser Nov. 1, 1999 438,014 Paid Hung Lien Investment Corp. Investee Note None Note $ 409,736 The opinion of the Long-term None
Electronics Incorporated company’ professional analysts investment
reinvestee
Savecom InfoCom Inc. Dec. 27, 1999 1,000,000 Paid Savecom InfoCom Inc. Investee N/A N/A N/A N/A The issuing price of the Long-term None
Preparatory Office Preparatory Office company incorporated company investment
accounted for
under
cost method
expectedly.
The stock of Nippon Jan. 6,1999 382,324 Paid Nippon Steel Corporation None N/A N/A N/A N/A The opinion of the Long-term None
Foundry Inc. professional analysts investment
The stock of Nippon March 25,1999 1,974,514 Paid Nippon Foundry Inc. Investee N/A N/A N/A N/A The issuing price of Long-term None
Foundry Inc. company the investee company investment
The stock of Feb. 6, 1999 161,034 Paid Nankang Rubber Tire None N/A N/A N/A N/A The opinion of the Long-term None
Triscend Corporation Corporation Limited professional analysts investment
The stock of Nov. 30, 1999 312,998 Paid Vialta.com, Inc. Investee N/A N/A N/A N/A The issuing price of Long-term None
Vialta.com, Inc. company the investee company investment
accounted
for under
cost method
Land Jul. 8, 1999 156,170 Paid by Great Silicon Valley None N/A N/A N/A N/A The market price To build up None
three Construction Co., Ltd. the employees’
times dormitory
according
to the
contract
Land Nov. 11, 1999 385,317 Paid San Ai Building None N/A N/A N/A N/A The market price To build None
Materials Industry Co, Ltd. up the plant
Land Dec. 24, 1999 226,279 Paid A natural person None N/A N/A N/A N/A The market price To build None
up the plant
Note: Before public offering, the stocks were purchased from the unspecified third parties. After public offering, the stocks were transacted in the over-counter market.
Attachment 6 - Disposal of long-term equity investment or real estate with an amount exceeding the lower of NT$100 million and 20 percent of the capital stock for the year ended December 31, 1999
Names of the Date of Acquisition date Book value Transaction Status of Gain/ Loss Counter party The relation- Reason for The bases or Other
properties transaction of the properties amount payment on disposal ship with disposal reference used commit-
receiving the Company in deciding ments
the price
December 31,1999
United Microelectronics Corporation
Stock of Faraday Oct. 22, 1999 Continuous $ 53,721 $ 470,456 Received $ 416,734 In the first market None Initial public The broker price None
Technology Corp. acquisition offering
since 1993
The stock of Tripath Dec. 17, 1999 Aug. 13, 1997 143,500 158,235 Received 14,375 Fortune Venture Investee The fiancial The net value None
Technology Inc. Capital Corporation company operation
The stock of Triscend Dec. 10, 1999 Feb. 6, 1999 161,034 161,196 Received 162 Golden Global None The fiancial The net value None
Corporation operation
Attachment 7 - Related party transactions for purchases and sales amounts exceeding the lower of NT$100 million and 20 percent of the capital stock for the year ended December 31, 1999
Transcations Accounts & notes receivable (payable)
Name of related parties transactions Relationship with the Company Purchase Amount Percentage of Term Balance Percentage
(Sales) (purchase) sales of account
1999
United Microelectronics Corporation
UMC Group (USA) Investee company Sales $ 5,559,165 19% 60days $ 816,164 16%
United Microelectronics (Europe) B.V. The director is the board chairman Sales 2,819,625 10% 90days 888,779 17%
of the Company Sales
United Microelectronics Co. ,Ltd. The director is the board chairman Sales 1,488,911 5% 60days 337,291 7%
in Hong Kong of the Company Sales
Mediatek Incorporation Investee company Sales 1,045,700 3% 60days 225,563 4%
Novatek Microelectronics Corp. Investee company Sales 959,424 3% 60days 168,356 3%
Formosa Links Pte Ltd. The director is the board chairman Sales 895,755 3% 60days 120,011 2%
of the Company
Applied Component Technology Corp. Investee company Sales 851,877 3% 60days 161,812 3%
Integrated Technology Expredd Inc. Investee company Sales 839,692 3% 60days 242,639 5%
DAVICOM Semiconductor Inc. Investee’s subsidiary Sales 658,867 2% 60days 95,887 2%
United Semiconductor Corp. Investee company Sales 557,487 2% 60days 24,090 0%
United Silicon Inc. Investee company Sales 468,501 2% 60days 9,750 0%
Nippon Foundry Inc. Investee company Sales 453,153 2% 60days 136,513 3%
Faraday Technology Corp. Investee company Sales 356,432 1% 60days 86,007 2%
Utek Semiconductor Corp. Investee company Sales 177,500 1% 60days 4,044 0%
Utek Semiconductor Corp. Investee company Purchase 1,506,076 17% 60days (128,163) 5%
United Semiconductor Corp. Investee company Purchase 1,274,357 15% 60days (22,609) 1%
United Integrated Circuits Corp. Investee company Purchase 744,164 9% 60days (46,367) 2%
Nippon Foundry Inc. Investee company Purchase 620,765 7% 60days (129,797) 5%
UMC Group (USA)
UMC Group Investee company & subsidiary Purchase USD 195,900,000 100% 60days (USD34,400,000) 99%
Sales USD 13,900,000 100% 30days
Nippon Foundry Inc.
UMC Investee company Purchase JPY 2,221,703,000 12% 60days (JPY 464,309,000) 5%
UMC Investee company Sales JPY 2,163,385,000 14% 60days JPY 454,801,000 19%
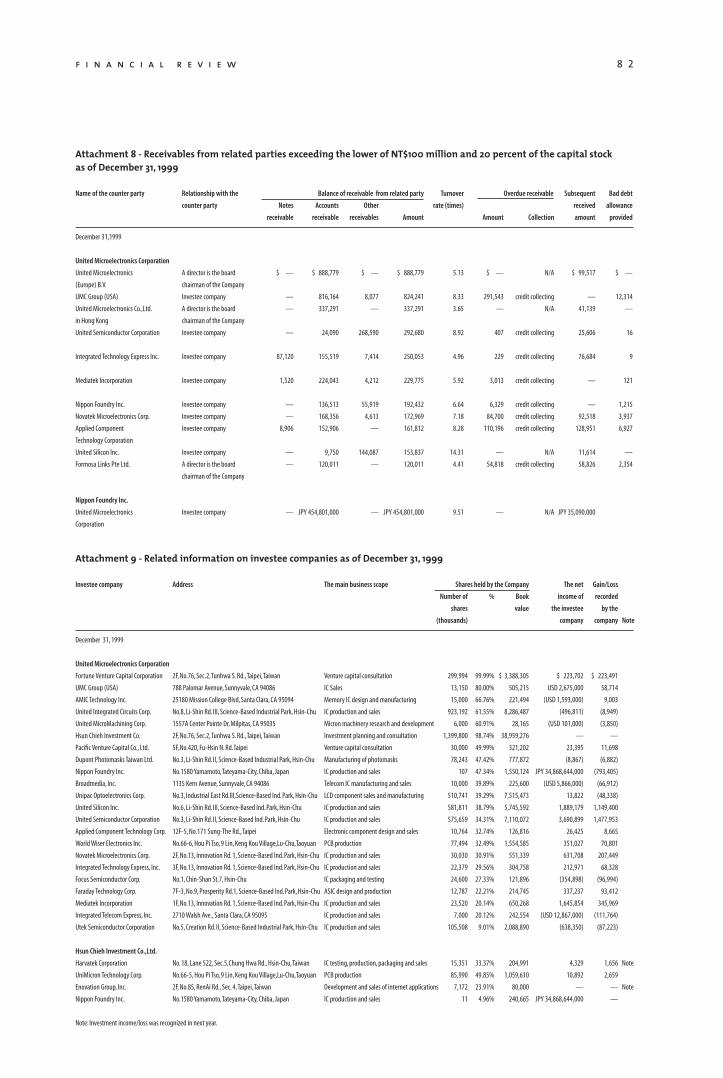
8 2
Attachment 8 - Receivables from related parties exceeding the lower of NT$100 million and 20 percent of the capital stock as of December 31, 1999
Name of the counter party Relationship with the Balance of receivable from related party Turnover Overdue receivable Subsequent Bad debt
counter party Notes Accounts Other rate (times) received allowance
receivable receivable receivables Amount Amount Collection amount provided
December 31,1999
United Microelectronics Corporation
United Microelectronics A director is the board $ — $ 888,779 $ — $ 888,779 5.13 $ — N/A $ 99,517 $ —
(Europe) B.V. chairman of the Company
UMC Group (USA) Investee company — 816,164 8,077 824,241 8.33 291,543 credit collecting — 12,314
United Microelectronics Co.,Ltd. A director is the board — 337,291 — 337,291 3.65 — N/A 41,139 —
in Hong Kong chairman of the Company
United Semiconductor Corporation Investee company — 24,090 268,590 292,680 8.92 407 credit collecting 25,606 16
Integrated Technology Express Inc. Investee company 87,120 155,519 7,414 250,053 4.96 229 credit collecting 76,684 9
Mediatek Incorporation Investee company 1,520 224,043 4,212 229,775 5.92 3,013 credit collecting — 121
Nippon Foundry Inc. Investee company — 136,513 55,919 192,432 6.64 6,329 credit collecting — 1,215
Novatek Microelectronics Corp. Investee company — 168,356 4,613 172,969 7.18 84,700 credit collecting 92,518 3,937
Applied Component Investee company 8,906 152,906 — 161,812 8.28 110,196 credit collecting 128,951 6,927
Technology Corporation
United Silicon Inc. Investee company — 9,750 144,087 153,837 14.31 — N/A 11,614 —
Formosa Links Pte Ltd. A director is the board — 120,011 — 120,011 4.41 54,818 credit collecting 58,826 2,354
chairman of the Company
Nippon Foundry Inc.
United Microelectronics Investee company — JPY 454,801,000 — JPY 454,801,000 9.51 — N/A JPY 35,090,000
Corporation
Attachment 9 - Related information on investee companies as of December 31, 1999
Investee company Address The main business scope Shares held by the Company The net Gain/Loss
Number of % Book income of recorded
shares value the investee by the
(thousands) company company Note
December 31, 1999
United Microelectronics Corporation
Fortune Venture Capital Corporation 2F, No.76, Sec.2, Tunhwa S. Rd., Taipei, Taiwan Venture capital consultation 299,994 99.99% $ 3,388,305 $ 223,702 $ 223,491
UMC Group (USA) 788 Palomar Avenue, Sunnyvale, CA 94086 IC Sales 13,150 80.00% 505,215 USD 2,675,000 58,714
AMIC Technology Inc. 25180 Mission College Blvd, Santa Clara, CA 95094 Memory IC design and manufacturing 15,000 66.76% 221,494 (USD 1,593,000) 9,003
United Integrated Circuits Corp. No.8, Li-Shin Rd. III, Science-Based Industrial Park, Hsin-Chu IC production and sales 923,192 61.55% 8,286,487 (496,811) (8,949)
United MicroMachining Corp. 1557A Center Pointe Dr, Milpitas, CA 95035 Micron machinery research and development 6,000 60.91% 28,165 (USD 101,000) (3,850)
Hsun Chieh Investment Co. 2F, No.76, Sec.2, Tunhwa S. Rd., Taipei, Taiwan Investment planning and consultation 1,399,800 98.74% 38,959,276 — —
Pacific Venture Capital Co., Ltd. 5F, No.420, Fu-Hsin N. Rd. Taipei Venture capital consultation 30,000 49.99% 321,202 23,395 11,698
Dupont Photomasks Taiwan Ltd. No.3, Li-Shin Rd. II, Science-Based Industrial Park, Hsin-Chu Manufacturing of photomasks 78,243 47.42% 777,872 (8,867) (6,882)
Nippon Foundry Inc. No.1580 Yamamoto, Tateyama-City, Chiba, Japan IC production and sales 107 47.34% 1,550,124 JPY 34,868,644,000 (793,405)
Broadmedia, Inc. 1135 Kern Avenue, Sunnyvale, CA 94086 Telecom IC manufacturing and sales 10,000 39.89% 225,600 (USD 5,866,000) (66,912)
Unipac Optoelectronics Corp. No.3, Industrial East Rd.III,Science-Based Ind. Park, Hsin-Chu LCD component sales and manufacturing 510,741 39.29% 7,515,473 13,822 (48,338)
United Silicon Inc. No.6, Li-Shin Rd. III, Science-Based Ind. Park, Hsin-Chu IC production and sales 581,811 38.79% 5,745,592 1,889,179 1,149,400
United Semiconductor Corporation No.3, Li-Shin Rd. II, Science-Based Ind. Park, Hsin-Chu IC production and sales 575,659 34.31% 7,110,072 3,690,899 1,477,953
Applied Component Technology Corp. 12F-5, No.171 Sung-The Rd., Taipei Electronic component design and sales 10,764 32.74% 126,816 26,425 8,665
World Wiser Electronics Inc. No.66-6, Hou Pi Tso, 9 Lin, Keng Kou Village,Lu-Chu,Taoyuan PCB production 77,494 32.49% 1,554,585 351,027 70,801
Novatek Microelectronics Corp. 2F, No.13, Innovation Rd. 1, Science-Based Ind. Park, Hsin-Chu IC production and sales 30,030 30.91% 551,339 631,708 207,449
Integrated Technology Express, Inc. 3F, No.13, Innovation Rd. 1, Science-Based Ind. Park, Hsin-Chu IC production and sales 22,379 29.56% 304,758 212,971 68,328
Focus Semiconductor Corp. No.1, Chin-Shan St.7, Hsin-Chu IC packaging and testing 24,600 27.33% 121,896 (354,898) (96,994)
Faraday Technology Corp. 7F-3, No.9, Prosperity Rd.1, Science-Based Ind. Park, Hsin-Chu ASIC design and production 12,787 22.21% 214,745 337,237 93,412
Mediatek Incorporation 1F, No.13, Innovation Rd. 1, Science-Based Ind. Park, Hsin-Chu IC production and sales 23,520 20.14% 650,268 1,645,854 345,969
Integrated Telecom Express, Inc. 2710 Walsh Ave., Santa Clara, CA 95095 IC production and sales 7,000 20.12% 242,554 (USD 12,867,000) (111,764)
Utek Semiconductor Corporation No.5, Creation Rd. II, Science-Based Industrial Park, Hsin-Chu IC production and sales 105,508 9.01% 2,088,890 (638,350) (87,223)
Hsun Chieh Investment Co.,Ltd.
Harvatek Corporation No. 18, Lane 522, Sec.5,Chung Hwa Rd., Hsin-Chu, Taiwan IC testing, production, packaging and sales 15,351 33.37% 204,991 4,329 1,656 Note
UniMicron Technology Corp. No.66-5, Hou Pi Tso, 9 Lin, Keng Kou Village,Lu-Chu,Taoyuan PCB production 85,990 49.85% 1,059,610 10,892 2,659
Enovation Group, Inc. 2F, No.85, RenAi Rd., Sec. 4, Taipei, Taiwan Development and sales of internet applications 7,172 23.91% 80,000 — — Note
Nippon Foundry Inc. No.1580 Yamamoto, Tateyama-City, Chiba, Japan IC production and sales 11 4.96% 240,665 JPY 34,868,644,000 —
Note: Investment income/loss was recognized in next year.
f i n a n c i a l r e v i e w
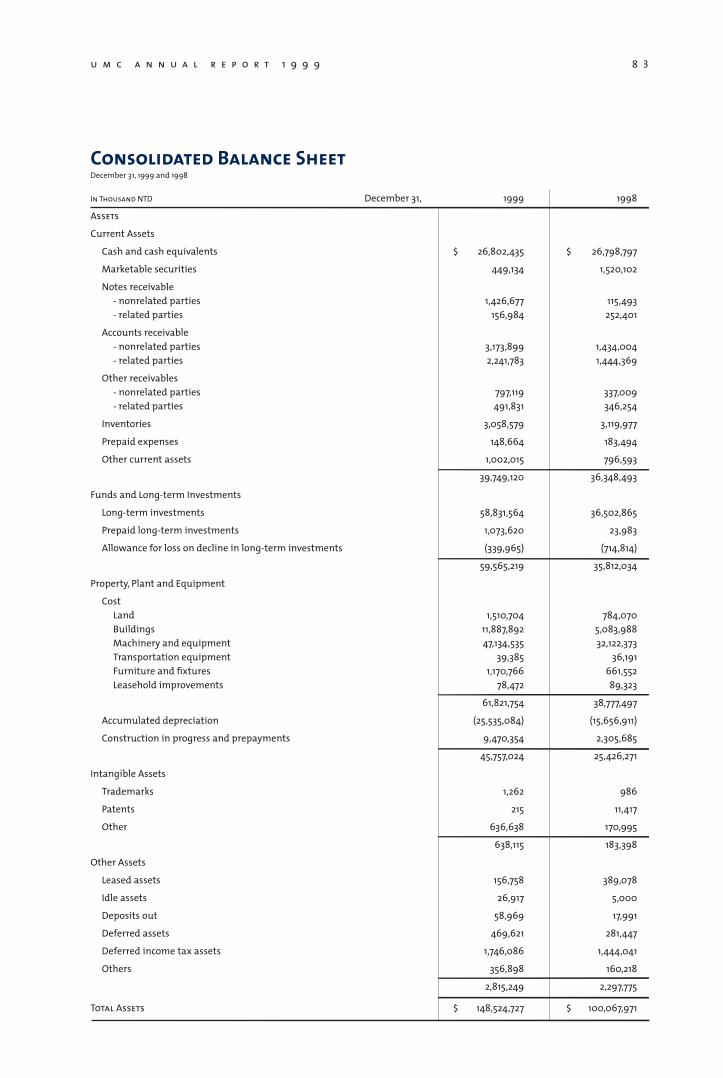
u m c a n n u a l r e p o r t 1 9 9 9 8 3
Consolidated Balance SheetDecember 31, 1999 and 1998
In Thousand NTD December 31, 1999 1998
Assets
Current Assets
Cash and cash equivalents $ 26,802,435 $ 26,798,797
Marketable securities 449,134 1,520,102
Notes receivable - nonrelated parties 1,426,677 115,493 - related parties 156,984 252,401
Accounts receivable - nonrelated parties 3,173,899 1,434,004 - related parties 2,241,783 1,444,369
Other receivables - nonrelated parties 797,119 337,009 - related parties 491,831 346,254
Inventories 3,058,579 3,119,977
Prepaid expenses 148,664 183,494
Other current assets 1,002,015 796,593
39,749,120 36,348,493
Funds and Long-term Investments
Long-term investments 58,831,564 36,502,865
Prepaid long-term investments 1,073,620 23,983
Allowance for loss on decline in long-term investments (339,965) (714,814)
59,565,219 35,812,034
Property, Plant and Equipment
Cost Land 1,510,704 784,070 Buildings 11,887,892 5,083,988 Machinery and equipment 47,134,535 32,122,373 Transportation equipment 39,385 36,191 Furniture and fixtures 1,170,766 661,552 Leasehold improvements 78,472 89,323
61,821,754 38,777,497
Accumulated depreciation (25,535,084) (15,656,911)
Construction in progress and prepayments 9,470,354 2,305,685
45,757,024 25,426,271
Intangible Assets
Trademarks 1,262 986
Patents 215 11,417
Other 636,638 170,995
638,115 183,398
Other Assets
Leased assets 156,758 389,078
Idle assets 26,917 5,000
Deposits out 58,969 17,991
Deferred assets 469,621 281,447
Deferred income tax assets 1,746,086 1,444,041
Others 356,898 160,218
2,815,249 2,297,775
Total Assets $ 148,524,727 $ 100,067,971
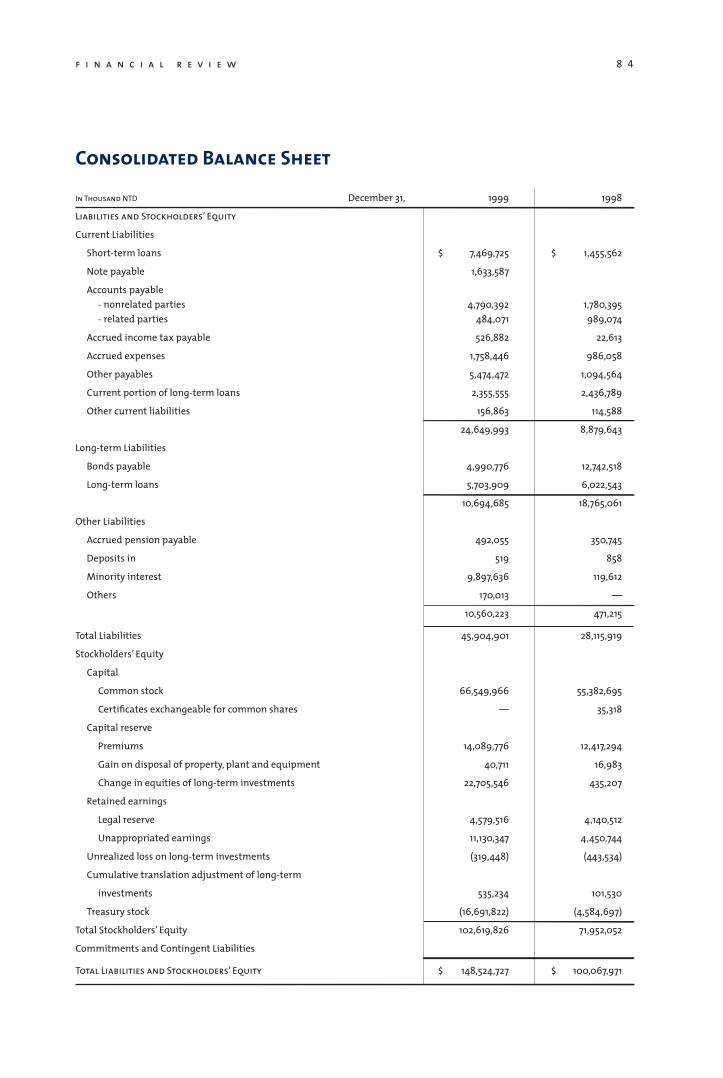
8 4
Consolidated Balance Sheet
In Thousand NTD December 31, 1999 1998
Liabilities and Stockholders’ Equity
Current Liabilities
Short-term loans $ 7,469,725 $ 1,455,562
Note payable 1,633,587
Accounts payable - nonrelated parties 4,790,392 1,780,395 - related parties 484,071 989,074
Accrued income tax payable 526,882 22,613
Accrued expenses 1,758,446 986,058
Other payables 5,474,472 1,094,564
Current portion of long-term loans 2,355,555 2,436,789
Other current liabilities 156,863 114,588
24,649,993 8,879,643
Long-term Liabilities
Bonds payable 4,990,776 12,742,518
Long-term loans 5,703,909 6,022,543
10,694,685 18,765,061
Other Liabilities
Accrued pension payable 492,055 350,745
Deposits in 519 858
Minority interest 9,897,636 119,612
Others 170,013 —
10,560,223 471,215
Total Liabilities 45,904,901 28,115,919
Stockholders’ Equity
Capital
Common stock 66,549,966 55,382,695
Certificates exchangeable for common shares — 35,318
Capital reserve
Premiums 14,089,776 12,417,294
Gain on disposal of property, plant and equipment 40,711 16,983
Change in equities of long-term investments 22,705,546 435,207
Retained earnings
Legal reserve 4,579,516 4,140,512
Unappropriated earnings 11,130,347 4,450,744
Unrealized loss on long-term investments (319,448) (443,534)
Cumulative translation adjustment of long-term
investments 535,234 101,530
Treasury stock (16,691,822) (4,584,697)
Total Stockholders’ Equity 102,619,826 71,952,052
Commitments and Contingent Liabilities
Total Liabilities and Stockholders’ Equity $ 148,524,727 $ 100,067,971
f i n a n c i a l r e v i e w
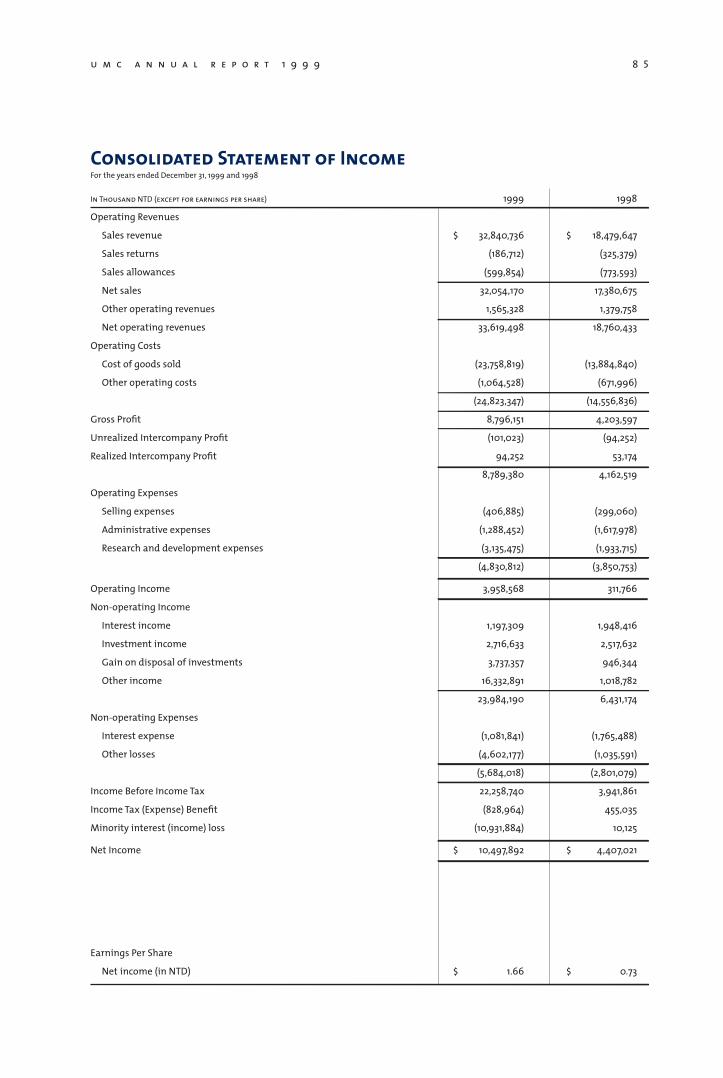
u m c a n n u a l r e p o r t 1 9 9 9 8 5
Consolidated Statement of IncomeFor the years ended December 31, 1999 and 1998
In Thousand NTD (except for earnings per share) 1999 1998
Operating Revenues
Sales revenue $ 32,840,736 $ 18,479,647
Sales returns (186,712) (325,379)
Sales allowances (599,854) (773,593)
Net sales 32,054,170 17,380,675
Other operating revenues 1,565,328 1,379,758
Net operating revenues 33,619,498 18,760,433
Operating Costs
Cost of goods sold (23,758,819) (13,884,840)
Other operating costs (1,064,528) (671,996)
(24,823,347) (14,556,836)
Gross Profit 8,796,151 4,203,597
Unrealized Intercompany Profit (101,023) (94,252)
Realized Intercompany Profit 94,252 53,174
8,789,380 4,162,519
Operating Expenses
Selling expenses (406,885) (299,060)
Administrative expenses (1,288,452) (1,617,978)
Research and development expenses (3,135,475) (1,933,715)
(4,830,812) (3,850,753)
Operating Income 3,958,568 311,766
Non-operating Income
Interest income 1,197,309 1,948,416
Investment income 2,716,633 2,517,632
Gain on disposal of investments 3,737,357 946,344
Other income 16,332,891 1,018,782
23,984,190 6,431,174
Non-operating Expenses
Interest expense (1,081,841) (1,765,488)
Other losses (4,602,177) (1,035,591)
(5,684,018) (2,801,079)
Income Before Income Tax 22,258,740 3,941,861
Income Tax (Expense) Benefit (828,964) 455,035
Minority interest (income) loss (10,931,884) 10,125
Net Income $ 10,497,892 $ 4,407,021
Earnings Per Share
Net income (in NTD) $ 1.66 $ 0.73