1d interpretation of schlumberger dc resistivity data from ... · there are some faults identified...
TRANSCRIPT
Proceedings World Geothermal Congress 2015
Melbourne, Australia, 19-25 April 2015
1
1D Interpretation of Schlumberger DC Resistivity Data from the Talasea Geothermal Field,
West New Britain Province, Papua New Guinea
Ronald T. Verave, Nathan Mosusu and Philip Irarue
Mineral Resources Authority, Geological Survey Division, Mining Haus Poreporena, Freeway, PO BOX 1906, Port Moresby 121,
Papua New Guinea
Keywords: 1D inversion, 1D Layered Model, Geoelectric Layers, IX1D, Resistivity, Schlumberger array, Talasea (Garua)
Geothermal Field,
ABSTRACT
Four Schlumberger resistivity soundings were conducted at the Talasea (Garua) geothermal field as a preliminary study by the
Mineral Resources Authority to test whether the ABEM Terrameter SAS1000 resistivity equipment would be able to detect
geoelectric layers corresponding to geothermal activity. The resistivity data were processed by Interpex IX1D program using one-
dimensional (1D) inversion to model the vertical variations of subsurface resistivity at depths of less than 200 m.
The data were interpreted to show four geoelectric layers: a top thin layer of varying resistivity values (17 to 688 Ωm) interpreted
as a mixture of volcanic sediments comprising of gravel, sand, silt, ash and clay; a second layer of moderately low resistivity values
(20-50 Ωm) comparable to moderately altered volcanic sediments whose conductivity is due to pore fluid conduction, ; a third layer
has anomalously very low resistivity of ≤2 Ωm and is related to low temperature (50-200°C) alteration in the smectite-zeolite zone;
and a fourth layer shows a highly resistive layer which was poorly modeled. Resistivity data observed outside geothermal fields
interpreted the second layer as the ground water aquifer zone.
Comparison of resistivity values modeled for the moderately low resistivity layer from the current study and past ground water
investigations revealed Talasea geothermal field most probably has high heat flow. This is supported by extensive surface
manifestations and the shallow detection of the very low resistivity zone.
The lateral extent of the anomalously very low resistivity was restricted to the orientation of a suspected fault identified through
visual interpretation of the 3D models generated in ERDAS ER Mapper in the Wavua Manifestations. The thickness of this layer
was not adequately modeled due to breaks and distortions of the measured data at longer electrode spacing.
1. INTRODUCTION
In 2012, the Mineral Resources Authority (MRA), through the Geological Survey Division, began conducting preliminary
assessments of the geothermal resources of the Independent State of Papua New Guinea (PNG). Reconnaissance studies such as
geological mapping and geochemical analysis were carried out by the MRA with positive outcomes. Results from geochemical
studies have identified Talasea geothermal field and several other fields in West New Britain as potential electrical power
generating geothermal fields. This was based on reservoir temperatures of 300-320°C calculated from geochemical analysis done
by Lahan et al. (2013). Surface manifestation mapping and documenting were also carried out during that exercise. Despite the
latest information obtained from this studies, previous studies have shown similar results.
However, detailed geophysical exploration of geothermal resources in PNG has never been done until only just recently when
MRA embarked on a challenge to carry out DC Resistivity studies of Talasea geothermal fields with available resources it had. The
aim of the study was to model the subsurface resistivity distribution of Talasea geothermal fields using 1D interpretation to identify
resistivity layers corresponding to geothermal activity.
Resistivity is one of the most important physical properties of materials and it is proven to be the most useful geophysical
parameter in the search for geothermal resources (Ussher et al., 2000). Rocks in the natural surroundings of high temperature
geothermal systems are generally affected by hydrothermal alteration processes associated with saline fluids and high temperature
that changes the resistivity of the rock. These changes can only be detected by resistivity methods which makes it the most
powerful tool used in geothermal prospecting. This is because the subsurface resistivity distribution can tell about the parameters
directly influencing the geothermal system.
2. TALASEA GEOTHERMAL FIELD OVERVIEW
PNG sits directly on the Pacific Ring of Fire. It is located within a seismically active region with hundreds of earthquakes recorded
annually by the USGS (http://neic.usgs.gov) and the Rabaul Volcano Observatory mainly along the tectonic boundaries. Seismicity
in this area has been described as the most intense in the world (Ripper and McCue, 1983; Cooper and Taylor, 1989). In general,
the seismicity of the island is due to a complex cocktail of tectonic regimes illustrated in Figure 1. There is large scale subduction
of the Pacific Plate and Indo-Australian Plate. At the micro plate level, there is the subduction of the Caroline Plate towards the
north and the Solomon Plate to the southeast. The presence of two well documented spreading zones and rifting, both sandwiched
between the major subduction and deformation zones further complicates the island’s tectonic setting. Spreading in the north splits
the New Guinea Island arc into two micro tectonic boundaries, the North Bismarck and South Bismarck plates; while in the
southeast, the Woodlark spreading extends from the D’Entercastreaux Islands to the east where it meets the New Britain trench.
The western end of the spreading centre transitions into the most rapidly extending (∼20–40 mm year−1 at 151.5◦E) active rift

Verave et al.
2
system on Earth (e.g., Abers, 2001). The tectonic diversity, their forms and dynamics, contributes immensely to the existence of
active volcanism and known high temperature hydrothermal activity scattered all throughout the country.
The Talasea (Garua) geothermal field is located along the Talasea Peninsula (formally known as Willaumez Peninsula) of New
Britain Island in the West New Britain province of Papua New Guinea (Figure 1, yellow square). The New Britain island is
situated within the South Bismarck micro plate which is bounded to the north by the seismically active Bismarck Sea seismic
lineation, a zone of left-lateral transform faults and spreading segments (Taylor, 1979, Tregoning et al., 1999), and to the south by
the New Britain Trench. Since 3.5 Mya, northward subduction of the Solomon Sea has resulted in arc magmatism in New Britain
and back-arc basin formation in the Bismarck Sea (Baldwin et al., 2012).
Figure 1: Map of the Tectonic setting of Papua New Guinea
Volcanism in this region dates back to the Late Eocene, Late Oligocene, and Mio-Pliocene according to (Lindley, 1988).
Quaternary (Pleistocene to Holocene) volcanism mainly along the northern coast of New Britain produced the Kimbe Volcanics
(Qk) which are commonly products of central-type strato-volcanoes and include lava flows, high-level intrusives, pyroclastics and
reworked pyroclastics (Ryburn, 1975). Patches of alluvium scatter within the Kimbe Volcanics in areas of low relief.
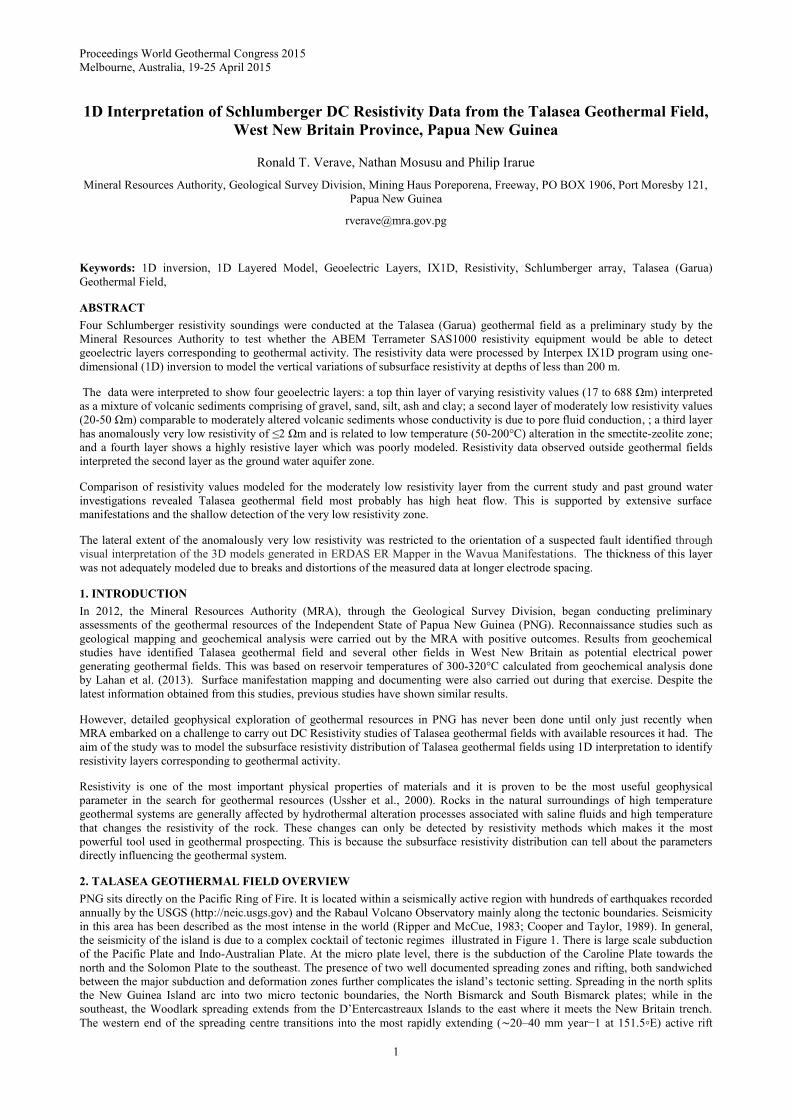
Talasea geothermal field lies inside the Garua (Talasea) Harbour volcanic field as shown in Figure 2. It is made up of Pangalu
geothermal fields in the north shores of Garua Harbour and the Talasea station geothermal field in the south shores. The volcanic
fields in Talasea are dormant with at least some vents dating back to Holocene and are made up of lava domes and ash cones. The
field has many surface manifestations including, hot springs, large boiling pools, fumaroles, and small geysers, particularly along
the shores of Garua Harbour and on the north shore near Pangalu village. Mudpots occur near Talasea station in the south shores
(Figure 2).
The geology of the Talasea geothermal field shown in Figure 2 is almost homogenous and is dominated by Kimbe Volcanics. The
volcanics here consist mostly of rhyolitic rocks. Gravel, sand, silt and clay alluvium are seen in the western shore of Garua Harbour
extending westward into the interior and into the Pangalu geothermal field. It ends briefly in the interior and appears again towards
the west cost of the Peninsula. Most faults are deeply seated and therefore none have been mapped. However, as shown in Figure 2,
there are some faults identified through visual interpretation of the 3D models generated in ERDAS ER Mapper (Mosusu et al.,
2014). Faults in this region generally trend N-S.
3. RESISTIVITY MEASUREMENTS
Due to limitations in experience and resources for geothermal prospecting, existing resources and equipment such as the ABEM
SAS1000 Terrameter, which is mainly used for groundwater investigations and mineral exploration were utilized. Hence, during
this survey Schlumberger DC resistivity measurements carried out on four VES stations, used electrode spacing configuration AB/2
and MN/2 specifically setup for groundwater DC resistivity surveying by the Geological Survey of Papua New Guinea.
During the survey, current electrode spacing AB/2, ranging from 1 to 1000 m and potential electrode spacing, MN/2, ranging from
0.1 to 15 m were applied in successive steps. The field site selection was based purely on accessibility and difficulty faced laying
out lengthy spread lines usually associated with Schlumberger method (Figure 2).
Verave et al.
3
Three VES soundings (VES01, VES02, and VES03) were conducted at the Wavua geothermal manifestation. The area is
characterized by volcanic sediment comprised of gravel, sand, silt, and clay alluvium. Fumaroles, large boiling pools, and mud pots
are all present within an area marred by extensive surface alteration shown in Figure 2.The fourth VES Sounding (VES04) was
conducted near the Rabili Gariki and Kedotutu geothermal manifestation with no additional sounding after because the areas were
not suitable for Schlumberger array method. The area is within the mapped Kimbe Volcanics and has a huge fumarole at higher
elevation towards the south-east of VES04. Two geysers are located towards the south of VES04 where fumaroles and mudpots are
also evident at lower elevations relative to Kedotutu fumaroles.
Figure 2 Geology map of Talasea geothermal field showing resistivity sounding stations and profiles 1 & 2
4. DATA PROCESSING AND INTERPRETATION
All Schlumberger sounding curves were processed and modeled using Interpex IX1D program, which uses interpretation
techniques based on the Barnes Layer Model (Bhoi, 2012). Forward modeling and the automated inversion processes were used
interchangeably to produce best fit curves that agree with qualitative interpretation. Forward modeling was used extensively
because the inversion could only yield best fits at shorter electrode spacing where the measured data appear smooth. At longer
spacing where most distortion and cusp are prominent, automated inversion process yielded dubious depth models which exceeded
expected depth values beneath each sounding station. Manually matching curves through forward modeling yielded parameters that
best explained the measured data based on the modeler’s best judgment. Measured curves with distortions had to be modeled with
care with forward modeling to complete the 1D layered models. Model parameters for curves with distortions were based on an
educated guess.
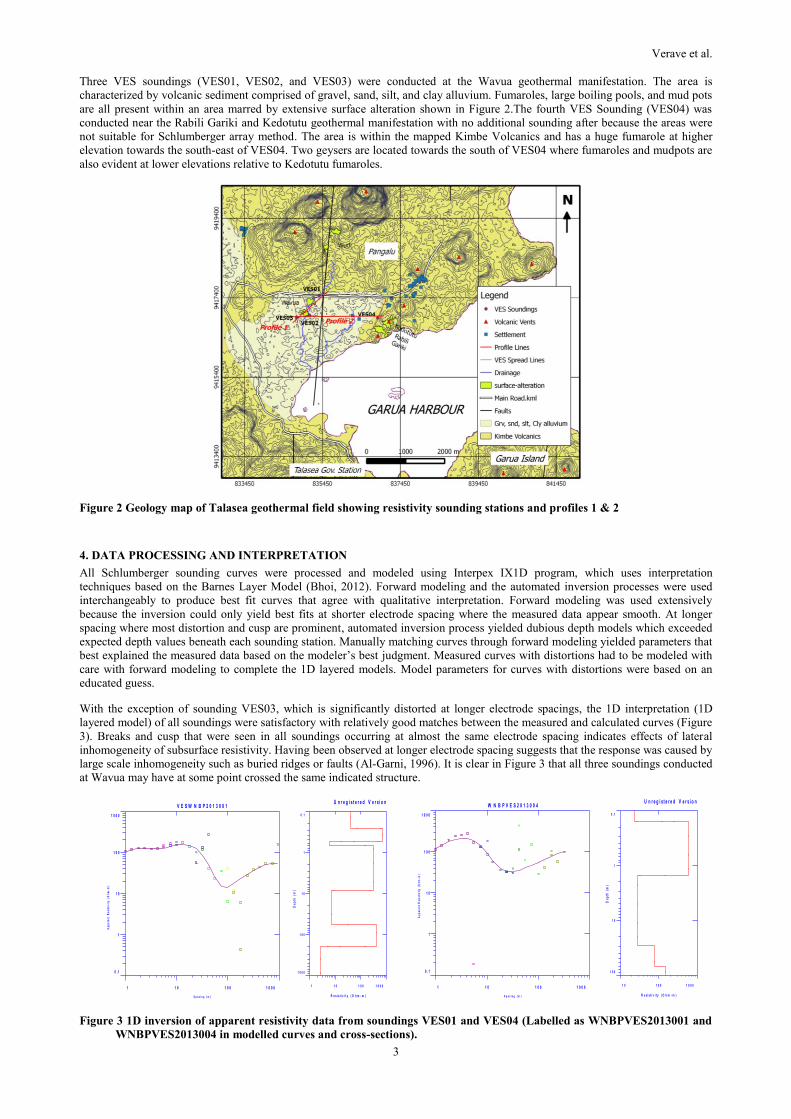
With the exception of sounding VES03, which is significantly distorted at longer electrode spacings, the 1D interpretation (1D
layered model) of all soundings were satisfactory with relatively good matches between the measured and calculated curves (Figure
3). Breaks and cusp that were seen in all soundings occurring at almost the same electrode spacing indicates effects of lateral
inhomogeneity of subsurface resistivity. Having been observed at longer electrode spacing suggests that the response was caused by
large scale inhomogeneity such as buried ridges or faults (Al-Garni, 1996). It is clear in Figure 3 that all three soundings conducted
at Wavua may have at some point crossed the same indicated structure.
Figure 3 1D inversion of apparent resistivity data from soundings VES01 and VES04 (Labelled as WNBPVES2013001 and
WNBPVES2013004 in modelled curves and cross-sections).
1 1 0 1 0 0 1 0 0 0
0 . 1
1
1 0
1 0 0
1 0 0 0
V E S W N B P 2 0 1 3 0 0 1
Ap
pa
ren
t R
esi
stiv
ity
(O
hm
-m)
S p a c i n g ( m )
1 1 0 1 0 0 1 0 0 0
0 . 1
1
1 0
1 0 0
1 0 0 0
De
pth
(m
)
R e s i s t i v i t y ( O h m - m )
U n r e g i s t e r e d V e r s i o n
1 1 0 1 0 0 1 0 0 0
0 . 1
1
1 0
1 0 0
1 0 0 0
W N B P V E S 2 0 1 3 0 0 4
Ap
pa
ren
t R
esi
stiv
ity
(O
hm
-m)
S p a c i n g ( m )
1 0 1 0 0 1 0 0 0
0 . 1
1
1 0
1 0 0
De
pth
(m
)
R e s i s t i v i t y ( O h m - m )
U n r e g i s t e r e d V e r s i o n

Verave et al.
4
Two resistivity cross-sections were generated from further inversion of the calculated 1D layered models and estimated smooth
model (Figure 4, brown lines) grouped by profile lines (Profile 1) and (Profile 2) shown in Figure 2. The cross-sections are
created using the Create profile option in IX1D where estimated smooth model under each soundings are linked by profile to
display subsurface resistivity distribution in color. Figure 5 and 6 show cross-sections grouped by Profile 1 and 2 respectively with
the Zaborvsky plot displayed above the Elevation section.
Figure 4. Inverted 1D layered model showing estimated smooth model (brown lines)
Profile 1 dissects the Wavua geothermal manifestation from SW to NE through Soundings VES03, VES02 and VES01
respectively. It has a length of almost 900 m and is oriented almost along the proposed identified fault. Figure 5 shows the resulting
resistivity cross-section of Profile 1 and it generally shows a low homogeneous resistivity all across the cross-section in the
uppermost layers. Four geoelectric layers were modeled having a top layer with varying resistivity values ranging from 17 to 688
Ωm. This layer has thickness ranging from 1.5 to 3.2 m which thickens toward VES01 where an additional resistive thin layer (2.2
m thick) is observed beneath it. The second layer has low resistivity of range 20 -50 Ωm , observed all throughout the cross-section.
The unit is thinner at the centre (4.5 m) and thicker towards the flanks of the cross-section with the thickest (39.6 m) observed at the
right flank under VES01. The region with anomalously very low resistivity occupies the third layer having resistivity values ≤2
Ωm. The anomaly is continuous all through the cross section being shallow at the centre and deeper on the flanks. This
anomalously very low resistivity structure is underlain by a fourth resistive layer which was poorly modeled by the inversion. It has
high resistivity that ranges between 500 to 800 Ωm.
Figure 5 Resistivity cross-section across Profile 1
1 1 0 1 0 0 1 0 0 0
0 . 1
1
1 0
1 0 0
1 0 0 0
V E S W N B P 2 0 1 3 0 0 1
Ap
pa
ren
t R
esi
stiv
ity
(O
hm
-m)
S p a c i n g ( m )
1 1 0 1 0 0 1 0 0 0
0 . 1
1
1 0
1 0 0
1 0 0 0
De
pth
(m
)
R e s i s t i v i t y ( O h m - m )
U n r e g i s t e r e d V e r s i o n
VES01 VES02 VES03
▼ ▼ ▼
SW NE

Verave et al.
5
Profile 2 was generated for the purpose of comparison between the two profiles. It runs a total length of 2 km west to east covering
VES02, VES01 and VES04 linking the Wavua geothermal manifestations on the left flank to Rabili Gariki and Kedotutu
geothermal manifestations on the right flank. The resistivity cross-section of this profile is presented in Figure 6. Here the
resistivity structure of Profile 1 particularly below VES03 and VES02 are incorporated with that of VES04 to the eastern flank to
give a comparative picture. In general, beneath VES04 four geoelectric layers have been modeled. A top thin layer of resistivity
range 23 -584 Ωm is seen all throughout the cross-section. A second layer of low resistivity (28 Ωm) is consistent with VES
stations located in Wavua geothermal manifestations been thicker at VES04 (27 m). The third unit is an isolated structure with a
resistivity of 80 Ωm only identified at VES04 and is 40 m thick. Succeeding this layer is the poorly modeled high resistivity layer
detected at a depth of 68 m. The anomalously very low resistivity structure could only be modeled at VES stations located in the
Wavua geothermal manifestations and was absent under VES04 conducted near Rabili Gariki and Kedotutu geothermal
manifestation.
The top thin layer observed on both cross-sections corresponds to top soil consisting of clayey silt, minor sand, minor pumice and
gravel. The varying degrees of resistivity values are due to the amount of saturation and clay content present within that unit. The
additional layer of high resistivity beneath VES01 and VES04 could be caused by the presence of dry large gravel with little sand
and clay.
The low resistivity layer beneath the top thin layer can be correlated with the bore-hole information of Berhane and Kalberkam,
(1995) taken from well fields in the Kimbe town area (West New Britain Provincial capital) and DC resistivity data done by Irarue
et al., (2009) for ground water investigations. This additional information was taken from geologically similar environment
described as the alluvium deposits mapped in the study area. Bore log data confirm that this layer is characterized by alluvium
deposits with a thickness of 28 m comparable to the current study findings. Irarue et al., (2009) modeled this layer as the aquifer
zone with resistivity values ranging from 70 – 174 Ωm as compared to the current findings with resistivity range 20 to 50 Ωm. The
difference in resistivity values may be explained by the high heat flow gradient and slight alteration encountered in Talasea
geothermal fields with conductivity mainly due to pore fluid conduction.
The up-doming shape of the anomalous very low resistivity layer is indicative of an upwelling zone of geothermal fluids and steam
or gases that pervasively alter the natural resistivity of rocks. This explains the thinning of the overlying alluvium layer at the centre
of Profile 1 shown in Figure 5. This layer of anomalously very low resistivity coincides well with low temperature clay minerals
such as smectite and zeolite which are formed at temperatures between 50 - 200 °C. Here the conductive clay minerals mainly
smectite exhibits surface conduction due to increased Cation Exchange Capacity (CEC) making it mobile and conductive. The area
from which this layer is modeled has clear evidence of extensive surface manifestations described earlier. Very low resistivity
delineated in this layer extends across all soundings in Profile 1 whereas in Profile 2 it appears only toward the western flank of the
profile. The only explanation for the discontinuity of this layer in Profile 2 is that, it may be caused by lateral flow of geothermal
fluid or gasses aided by the N-S trending fault identified in the Talasea geothermal field. This is supported by the shallow depths at
which it is detected by VES03 and VES01 situated outside the surface manifestation zone but in line with the general trend of the
fault. It is evident from profile 2 that areas outside the fracture zone may not detect the very low resistivity layer at shallow depths.
Figure 6 Resistivity cross-section across Profile 2
VES04 VES02 VES03
▼ ▼ ▼
W E

Verave et al.
6
Although all modeled curves indicated a high resistivity body beneath the anomalously very low resistivity layer, it could not be
modeled because of the limited depth penetration of the Schlumberger sounding. The mediocre quality of the measured data caused
by large lateral inhomogeneity in resistivity also added to the unsatisfactory layer thickness modeling particularly for the
anomalously conductive layer. Nevertheless, the results have provided useful information for deeper subsurface geophysical
investigations.
5. CONCLUSION
The results show a very low resistivity zone at shallow depths in the Wavua surface manifestations. The resistivity value of this
conductive zone commonly found above geothermal systems has been linked to temperatures between 50-200°C. The lateral extent
of this zone is restricted to a possible N-S trending fracture mapped within the Wavua surface manifestation. Its vertical extent was
limited by distortion in the measured data and applicability of Schlumberger DC resistivity array.
Comparison of resistivity values modeled outside Talasea geothermal field but in similar geological setting suggest, Talasea
geothermal field is most likely situated within an area of high heat flow. The abundance of surface manifestations and low
resistivity values <100 Ωm modeled outside the identified/suspected fault zone and in layers overlain the conductive zone support
this observation.
To better understand the parameters that influence the Talasea geothermal system at greater depth, future work involving surveys
that can map great depths such as MT and TEM is recommended.
ACKNOWLEDGEMENTS
The authors wishes to thank MRA for funding this study and its support in general for Geothermal Exploratory work.
REFERENCES
Abers, G.A.: Evidence for seismogenic normal faults at shallow dips in continental rifts. Geol. Soc. Lond. Spec. Publ. 187 (2001),
305–18.
Al-Garni M, A.: Direct current resistivity investigation of groundwater in the lower Mesilla Valley, New Mexico and Texas. Master
of Science (Geophysics) Thesis, (1996), p. 23.
Bahoi, A. K.: An Assessment of Electrical Resistivity Soundings Data by Different Interpretation Techniques. International
Journal of Biological, Ecological and Environmentl Science (IJBEES) Vol. 1, No. 3, (2012), ISSN 2277 – 4394.
Baldwin, S.L., Fitzgerald, P.G.., Webb, L.E.: Tectonics of the New Guinea Region. Annu. Rev. Earth Planet. Sci. 40 (2012), 495-
520.
Berhane, D., Kalberkamp, U.: Kimbe Town Area Resistivity Survey, TN26/94, Mineral Resources Authority (1994).
Cooper, P., and Taylor, B.: Seismicity and focal mechanisms at the New Britain Trench related to deformation of the lithosphere:
Technophysics, 164 (1989), p.25-40.
Irarue, P., Verave, R.T., Egara, S., Mosusu, N.: Resistivity Soundings for Groundwater, Kimbe Town Area, West New Britain
Province, TN8/2009, Mineral Resources Authority, Papua New guinea (2009).
Lahan, M., Verave, R.T., Irarue, P.: A Preliminary Reconnaissance Geothermal Mapping in West New Britain, Papua new Guinea,
TN2013/06, Mineral Resources Authority, Papua New Guinea (2013).
Lindley, D.: Early Cainozoic stratigraphy and structure of the Gazelle Peninsula, East New Britain: an example of extensional
tectonics in the New Britain arc-trench complex. Aust. J. Earth Sci. 35, 1988, 231–44.
Mosusu, N., Lahan, M., Pion, D., Taranu, F.: Defining Structural Lineations Associated with Geothermal Manifestations Using
Radar Imagery and Seismicity Datasets, Mineral Resources Authority, (2014).
Ripper, I.D., and McCue, J.F.: The seismic zone of the Papuan Fold Belt: BMR Journal of Australian Geology and Geophysics, 8,
(1983), p.147-156.
Ryburn, R.J.: Talasea-Gasmata, New Britain -1:250000 Geological Series: Bureau of Mineral Resources, Geological and
Geophysics, Explanatory Notes, 26 (1975), SB/56-5 and BS/56-9.
Taylor, B.: Bismarck Sea: Evolution of a back-arc basin. Geology 7, (1979), 171–74.
Tregoning, P., Jackson, R.J., McQueen, H., Lambeck, K., Stevens, C., et al..: Motion of the South Bismarck Plate, Papua New
Guinea. Geophys. Res. Lett. 26 (1999), 3517–20.
Ussher, G., Harvey, C., Jonstone, R., Anderson, E.: Understanding the Resistivity Observed in Geothermal Systems, Proceedings,
World Geothermal Congress, (2000).