1h 2017 financial results - m.corporate.arcelormittal.com/media/files/a/... · 2 • improved 1h...
TRANSCRIPT

27 July 2017
1H 2017 Financial Results Lakshmi N. Mittal - Chairman & Chief Executive OfficerAditya Mittal - Group CFO & CEO ArcelorMittal Europe
0

1
Disclaimer
Forward-Looking Statements
This document may contain forward-looking information and statements about ArcelorMittal and its subsidiaries. These statements include financial projections and estimates and their underlying assumptions, statements regarding plans, objectives and expectations with respect to future operations, products and services, and statements regarding future performance. Forward-looking statements may be identified by the words “believe”, “expect”, “anticipate”, “target” or similar expressions. Although ArcelorMittal’s management believes that the expectations reflected in such forward-looking statements are reasonable, investors and holders of ArcelorMittal’s securities are cautioned that forward-looking information and statements are subject to numerous risks and uncertainties, many of which are difficult to predict and generally beyond the control of ArcelorMittal, that could cause actual results and developments to differ materially and adversely from those expressed in, or implied or projected by, the forward-looking information and statements. These risks and uncertainties include those discussed or identified in the filings with the Luxembourg Stock Market Authority for the Financial Markets (Commission de Surveillance du Secteur Financier) and the United States Securities and Exchange Commission (the “SEC”) made or to be made by ArcelorMittal, including ArcelorMittal’s latest Annual Report on Form 20-F on file with the SEC. ArcelorMittal undertakes no obligation to publicly update its forward-looking statements, whether as a result of new information, future events, or otherwise.
1

2
• Improved 1H results with strengthening market backdrop
• Transformed balance sheet, set to strengthen further
• Unique global portfolio of competitive well-invested assets
• Industry leader in product and process innovation
• Action 2020 to improve profitability
• Investing with focus and discipline
Introduction: Progress on many fronts
Strategic progress achieved in 1H 2017 against a backdrop of improving market conditions
ArcelorMittal is fully focussed on delivering value to its shareholders and has achieved notable progress on several strategic fronts during 1H’17.
Financial results showed material improvement over the same period of 2016. In fact this was the strongest first half EBITDA since 2012. Demand in our core markets is growing, with PMI readings currently at the highest level since 2011. This suggests that shipments in the second half of this year will follow a stronger than normal seasonal pattern. Together with healthy steel spreads, this provides a supportive outlook for the second half of the year.
In recent years the Company has transformed its balance sheet. Despite a healthy investment in working capital, net debt at the end of June 2017 was the lowest mid year level since the ArcelorMittal merger in 2006. The progress is best illustrated by the ratio of Net Debt to EBITDA (LTM) which now stands at 1.5x, the lowest level achieved since 2009. The Company expects of the remainder of 2017 to release working capital which should support a further reduction in net debt and a corresponding strengthening of this ratio.
As it continues to lead the industry, the Company has made progress in the first half 2017 through its introduction of new category-leading automotive steel grades as well as launching our new JVD (Jet Vapor Deposition) coating technology.
The Action 2020 plan continues to differentiate ArcelorMittal from its peer group. The plan to structurally improve EBITDA is advancing. Those investors and analysts who attended the recent site trip to Gent in Belgium, had the opportunity to hear first hand how the Europe Transformation plan has driven significant outperformance vs. the European peer group and how the next phase will be driven by the application of digital technologies.
Finally, while the priority for surplus cash continues to be debt reduction, the Company is investing to improve further returns for shareholders. During 1H’17 a number of projects were completed in support of our ongoing transition towards higher added value products. In addition, we were able to make progress with our asset portfolio including the proposed merger of our Long products business in Brazil with Votorantim and – more significantly - being selected to become the new owner of ILVA, Italy’s largest steel producer.
2

3
0.780.820.810.850.85
1H172010
1.0
2013 20152012 20142011
1.4
3.1
2007
1.9
2.5
1.8
20092008 2016
3
Health & Safety Lost time injury frequency (LTIF) rate*Mining & steel, employees and contractors
* LTIF = Lost time injury frequency defined as Lost Time Injuries per 1.000.000 worked hours; based on own personnel and contractors
Safety is our priority
Our goal is to be the safest Metals & Mining company
Health & Safety performance
• LTIF rate of 0.72x in 2Q’17 vs. 0.80x in 1Q’17 and 0.79x in 2Q’16
• Stable LTIF rate of 0.78x in 1H’17 vs. 1H’16
• The Company’s efforts to improve the Group’s Health and Safety record will continue
• The Company is focused on further reducing the rate of severe injuries and fatality prevention
Beginning as always with a comment on our safety performance.
Lost time injury frequency rate was stable at 0.78x in 1H’17 as compared to 1H’16.
We must strive to eliminate all injuries but our first focus must be on fatalities and serious injuries.
We remain committed to the journey towards zero harm and are ensuring that all levels of the organization are focused on this primary objective.

4
• EBITDA: $4.3bn (+61% YoY); 1H’17 EBITDA/t at $102/t significantly higher than $62/t in 1H’16
• Steel performance: primarily benefited from improved prices and lower costs
• Mining performance: improvement primarily driven by higher seaborne iron ore prices (+43% YoY)
• Net income: increased to $2.3bn (vs. $0.7bn in 1H’16) driven by higher operating results
• Net Debt: $11.9bn as of Jun 30, 2017 as compared to $11.1bn as of Dec 31, 2016; net debt $0.8bn lower YoY
Materially improved 1H 2017 results
Note: YoY refers to 1H’17 vs. 1H’16
Solid 1H’17 performance: EBITDA/t of $102/t Solid 1H’17 performance: EBITDA/t of $102/t
4.3
2.7
+61%
1H’171H’16
11.911.112.7
Jun’17Jun’16
-0.8
Dec’16
EBITDA ($bn) and EBITDA/t ($/t)
Net debt ($bn)
$62/t$102/t
Against an improving macro backdrop, ArcelorMittal has materially improved its financial performance in the 1H’17.
EBITDA of $4.3 billion was 61% above the same period of 2016.
On a per-tonne basis, EBITDA reached $102/t in 1H’17 as compared to $62/t in 1H16.
Net income for the 1H’17 was $2.3 billion.
Finally, we ended 1H’17 with a net debt of $11.9 billion. This is an increase compared to the end of 2016 due to a $2.7 billion investment in working capital (due to improved market conditions) and a $0.4 billion headwind from foreign exchange rate impacts.
Net debt has declined by $0.8 billion over the past 12 months despite a $2.8 billion investment in working capital and a $0.2 billion headwind from foreign exchange rate impacts.
The next 2 slides will look at the drivers behind the operating performance improvement in a little more detail.
4

5
5
1H’17 v 1H’16 highlights
• Europe: EBITDA up +70% YoY Strong performance driven by positive price-cost impact offset in part by lower steel shipments
• NAFTA: EBITDA up +20.9% YoY Positive price-cost impact and higher steel shipment volumes (+1.1%)
• Brazil: EBITDA up +24.8% YoY Positive price-cost impact offset in part by lower steel shipments
• ACIS: EBITDA up +20.3% YoY Positive price-cost impact offset in part by lower steel shipments
Improved YoY performance in steel segments
1H’17 steel-only EBITDA improvement 45% YoY
3.5
3.1
2.4
1H’16
+45%
2H’16
+16%
1H’17
Steel-only EBITDA ($bn) and EBITDA/t ($/t)
$56/t
$83/t
Note: YoY refers to 1H’17 vs. 1H’16
$76/t
Beginning first with the Steel business. We saw solid results in all our steel segments in 1H’17 as compared to 1H’16 reflecting the stronger market backdrop and ongoing benefits of our Action 2020 plan.
Europe generated the strongest improvement, with a 70% increase in EBITDA YoY primarily driven by higher average steel selling prices, and transformation gains.
NAFTA’s EBITDA increased by 20.9% as a result of a positive price cost impact and a 1.1% increase in shipment volumes.
Brazil and ACIS EBITDA increased by 24.8% and 20.3% respectively due to a positive price-cost impact, which more than offset the impact of lower shipment volumes. Lower shipments in Brazil primarily reflected the weak construction market’s impacts on domestic long products. Lower shipments in ACIS were largely on account of lower production in Ukraine due to the reline of BF9, but there was also an impact from lower shipments in South Africa due to the weak domestic demand.
Steel-only EBITDA/t improved as compared to 2H’16 and was 45% above the levels achieved in 1H’16. Again, this largely reflects the improved steel market backdrop as well as the ongoing improvements generated by the Action 2020 plan. As is our normal course, we will detail the impact of Action 2020 on performance at the time of our full year results.

6
Mining: higher iron ore shipments
Mining profitability positively impacted by higher iron ore prices and higher volume * CFR China 62% Fe
799
501
261
206%
1H’172H’161H’16
EBITDA $m
• Solid performance: 1H’17 EBITDA improved significantly vs. 1H’16 due to higher seaborne IO market prices (+43%), higher market priced IO shipments (+4.3%) and higher coal prices
• Growth: Market priced iron ore shipments on track to grow ~10% in 2017 YoY
Mexico: Volcan mine restarted Feb’17
Liberia: Gangra ramp up underwayhigher grade / low strip ratio DSO
Canada: AMMC debottlenecking ongoing;record iron ore shipments in 1H’17
• Cost focus maintained: FCF breakeven remains $40/t*
Marketable iron ore shipments (Mt)
18.116.217.4
4.3%
2H’16 1H’171H’16
Moving to the Mining segment, EBITDA increased by over 200% in 1H’17 as compared to 1H’16 due to higher seaborne iron ore market prices (+43%), a 4.3% increase in market priced iron ore shipments to 18.1Mt and higher coal prices.
Our target to increase market priced iron ore shipments in 2017 by approximately 10% YoY remains on track, with an acceleration expected during 2H’17.
In Mexico, the Volcan mine was restarted in February 2017 and is expected to produce an additional 2Mt (vs. 2016).
In Liberia, the ramp up of the Gangra mine is underway and is expected to produce 3Mt in 2017 (vs. 2Mt in 2016), ramping up to 5Mt in 2018.
Production in Ukraine has also recovered following resolution of a delay in accessing new tailings disposal land which negatively impacted production in 2016 by approximately 1Mt.
Finally, at our flagship operation AMMC, we are increasing production through debottlenecking and achieved record shipments in 1H’17.
ArcelorMittal’s Mining segment strategy remains to focus on product quality to optimize value in use whilst maintaining cost discipline to ensure that the iron ore price level at which the segment achieves free cash flow breakeven remains ~$40/t (CFR China 62% Fe).
6
6

7Source: *Markit. ArcelorMittal estimates; ArcelorMittal PMIs (weighted by ArcelorMittal steel deliveries)
Healthy demand environment
ArcelorMittal weighted global manufacturing PMI*
Stronger growth in world ex-China should support higher steel shipments in 2017
35
37
39
41
43
45
47
49
51
53
55
57
2006 2007 2008 2009 2010 2011 2012 2013 2014 2015 2016 2017
(latest data point: June 2017 54.3)
As already mentioned, the operating environment during 1H’17 has been positive.
As you can see in the chart on screen, on a shipment-weighted basis, the ArcelorMittal PMI reading in June was 54.3 and has been around this level for the past couple of months. This is the strongest indicator of demand in the markets we are operating that we have seen since the first half of 2011.
This strengthening market backdrop suggests that shipments in the second half of 2017 will be higher than would normally be suggested by seasonality alone.
7

8
Source: *ArcelorMittal estimates ** Excludes tubular demand
Global steel demand forecasts raised
Stronger global manufacturing growth should support higher steel shipments in 2017
Global
Brazil
EU28
US**
China
+2.5% to +3.0%
CIS
+0.5% to +1.5%
+2.0% to +3.0%
Global ASC 2017 v 2016*
+2.0% to +2.5%
+2.0% to +3.0%
8
+2.5% to +3.5%
• Global apparent steel consumption forecast to increase by +2.5% to +3.0% in 2017 (vs. +0.5% to +1.5% forecast in Feb 2017)
• Healthy demand backdrop maintained in Europe and US
• China: Demand forecast raised due to strength in market driven by real estate and machinery
• Brazil: Positive demand outlook with growth in automotive offset by ongoing weakness in construction
• CIS: Upward revision of forecasts reflecting stronger economic growth in Russia
Reflecting the strength in the indicators we are increasing our global steel demand forecasts for 2017.
We now expect global apparent steel consumption to grow by approximately +2.5% to +3.0% in 2017 (revised up from previous forecast ~+0.5% to +1.5%).
In China, we are increasing our ASC forecast to +2.5% to +3.5%, vs our previous forecast of -1.0% to 0%primarily due to strength in real estate and machinery.
In the CIS, ASC is expected to grow +2.0% to +2.5% (revised up from previous forecast of -0.5% to +0.5%) reflecting stronger economic growth in Russia.
ASC in the US (excluding Pipe & tube) is now expected to grow +2.0% to +3.0% (revised down from previous forecast of +3.0% to 4.0%) reflecting lower automotive production impacting flat products.
In Europe, ArcelorMittal expects the pick-up in underlying demand to continue, driven primarily by strength of the construction and machinery markets, and apparent demand is expected to remain at +0.5% to +1.5% in 2017 on top of around 3% growth in 2016.
In Brazil, while demand for flat products has progressed in line with our expectations, demand for long products remains low due to weak construction markets and as such we now expect ASC to grow +2.0% to +3.0% in 2017 (revised down from previous forecast +3.0% to +4.0%).

9
• Global overcapacity remains a threat to sustainable returns on capital
• US government has responded with measures in place continued enforcement required; flat rolled imports increased ~+5% YoY*
• EU response has been limited; comprehensive solutions still required
– Imports continue to increase +13.5% YoY*
– Lower Chinese and CIS imports offset by higher imports from other countries
Comprehensive trade solutions still required
Comprehensive trade solutions requiredComprehensive trade solutions required
EU28 imports increasing in 2017 vs. 2016
2016
21.9
+13.5%
19.3
2017**
EU28 finished flat carbon steel imports (Mt)
Source: * Based on Jan – May 2017 YoY and Jun 17 license data; ** Based on Jan – May 2017 annualised data
Global excess capacity remains an issue and the resulting market behaviour is an ongoing threat to the sustainability of returns on capital. The response to this key issue continues to differ between the regions in which we operate.
In the US, the government have reacted swiftly and put measures in place – there are import duties on all 4 major flat product categories (corrosion resistant, cold rolled, hot rolled and plate). This being said, unfairly priced imports still remain a threat (Jan – May 2017 YoY and Jun’17 license data US flat rolled imports increased ~+5%) and therefore we need to ensure that enforcement of the trade cases continues.
In Europe, the response to unfair trade has been slow and more limited. As a result imports in to EU28 continue to increase, rising +13.5% YoY on an annualised basis through May’17.
We will continue to work with governments in the countries where we operate to make sure that our world-class assets are protected from unfair competition and to ensure there is a level playing field that supports continuous investment.
9

10
Deleveraging ongoing
Deleveraging remains the priority for surplus cash flow
Net interest costs 2012 - 2017F ($ billion)
21.817.4 16.6
12.7 11.9
-0.8
-45%
Jun 30, 2017
Jun 30, 2016
Jun 30, 2015
Dec 31, 2012
Jun 30, 2014
Net debt as Jun 30, 2017 ($ billion)
1.9
1.10.8
-1.1
FY’17FFY’16FY’12
• Our top financial priority is to recover our investment grade credit rating
• Net debt down by almost 50% over last 4 years
• Deleveraging remains the near term priority of surplus cash flow
• A lower cost balance sheet will further enhance our ability to translate EBITDA in to free cash flow to generate value for our investors
ArcelorMittal’s financial priority is to recover our investment grade credit rating. Over the past four years, we have reduced our net debt almost 50% and we now have one of the strongest balance sheets in the industry.
Whilst maintaining strong liquidity, we have utilized our available cash to repay and prepay near and medium term bond maturities. On April 3, 2017, ArcelorMittal redeemed all of its outstanding $1.5 billion 9.85% Notes due June 1, 2019. Financed with existing cash and liquidity, the total cash spent of $1,040 million included a notional outstanding amount of $851 million, a premium of $159 million and accrued interest of $30 million.
Given the liability management exercise and lower average debt we now expect interest expenses in 2017 to be $0.8 billion (vs. previous guidance of $0.9 billion), which is $1.1 billion below the level in 2012.
Deleveraging remains the near term priority of surplus cash flow. A lower cost balance sheet will further enhance our ability to translate EBITDA in to free cash flow to generate value for our investors.
10
10

11
Cash needs of the business reduced
Cash needs of the business reduced further to $4.6bn in 2017
Cash needs of the business ($ billions)
2.9 2.9
0.9 0.8
1.20.9
Previous 2017 guidance*
Capex
Pension & others-0.4
Net interest
~4.65.0
Revised 2017 guidance*
* Excludes premiums paid to retire debt early of $0.2 billion
2017 Working capital ($ billions)
2.7
FY’17F
~1.5
~1.2
1H’17 2H’17F
OWCR Investment
OWCR Investment
OWCR Release
Working capital release expected in the 2H’17 –
the extent of which will be determined by how prices evolve between now and
Dec’17
Key to our deleveraging is managing the cash requirements of the business.
During the 1H’17, we have – as is the normal seasonal pattern - invested in working capital. The investment of $2.7 billion also reflects the improved market conditions in the 1H’17 and its impact on both our inventory and receivables (higher volumes and selling prices). The increase in our inventory is also driven by the higher level of raw material costs in 1H’17 as compared to the 1H’16.
As a result of the improved market conditions we now anticipate approximately $1.5 billion investment in working capital in 2017, (versus our previous guidance of $1 billion). This implies a release of working capital over the remainder of the year. The extent of this release will ultimately be determined by how prices evolve between now and December 2017.
At the same time, the cash needs of the business are now expected to be approximately $4.6 billion (excluding working capital and premiums paid to retire debt early of $0.2 billion) as compared to our previous guidance of $5.0 billion. We continue to expect capex of $2.9 billion but now expect net interest expense to decline to $0.8 billion (as compared to $0.9 billion previous guidance and $1.1 billion in FY 2016). We also expect cash taxes, contributions to fund pensions, and other cash expenses to be lower than our previous guidance.
11
11

Automotive Industry Leadership
The head of Audi’s ‘Lightweight Construction Centre’ is quoted as saying that “There will be no cars made of aluminium alone in the future. Press hardened steel will play a special role in this development. If you compare the stiffness to weight ratio, PHS is currently ahead of aluminium”.
12
Recent product launches
• Usibor®2000 and Ductibor®1000 new generations of press hardenable steels (PHS) commercially available in Europe; in North America, samples available for qualification testing
• First Fortiform® 3rd Gen AHSS for cold forming commercially launched in Europe in Sep’ 14; investments at Calvert to produce in NAFTA in late 2017
• Jet Vapor Deposition (JVD) breakthrough technology for metallic coating of steel industrialized at Liège, Belgium
Audi coming back to steel
Leveraging R&D for new products, solutions and processes
Over 40% of the materials in the 2018 Audi A8 body structure will be steel, of which 17% will be press hardenable steel
ArcelorMittal continues to lead the global steel industry. There is no better example of this than the Company’s position at the forefront of providing steel solutions to the most demand automotive customers.
Recent product launches include Usibor®2000 and Ductibor®1000, our latest generation of press hardenablesteels which are today commercially available in Europe and available for qualification testing in North America.
Our first third-generation AHSS for cold forming, Fortiform®, which was commercially launched in Europe in 2014 will soon be available in North America through investments made at Calvert.
Jet Vapor Deposition (JVD) is a breakthrough technology for metallic coating of steel, developed by ArcelorMittal and now installed at Liege, Belgium. JVD offers significant advantages including exceptionally uniform coating and improved adhesion of the coating regardless of the steel grade.
Some recent evidence that advancements in AHSS and UHSS are bearing fruit is the news that our customer Audi, who had been experimenting with aluminium in its luxury models, is returning to steel. Scheduled for release in 2018, the body structure of the new A8 will be made up of over 40% steel, of which 17% will be press hardenable steel, following the trend we have seen for other auto manufacturers to use higher proportions of more advanced steels. This is a marked turnaround on the all-aluminium body-in-white which Audi developed for the A8 in 1994. The quote on the slide from the Head of Audi’s Light Weight Construction Centre reinforces our view that steel will remain the material of choice for Automotive and we remain focussed on maintaining our position as the supplier of choice to this important end market.
12

Action 2020 progress continues
13
Action 2020 plan to sustainability improve EBITDA and FCF progressing
• Europe: Transformation program progressing
Operating from a more efficient resized footprint
Enhanced digitalization of operations driving productivity improvements and supporting maintenance excellence
• US: footprint optimization ongoing
Idled redundant operations including the #1 aluminize line, 84” HSM, and #5 continuous galvanizing line (CGL)
No.2 steel shop (idled in 2Q 2017)
• Calvert ramp up ongoing: Capacity utilisation ~90%
3.0
0.9
2016 2020 Target
Action 2020 EBITDA progress ($ billions)
Action 2020 is a key differentiator for ArcelorMittal. It is Action 2020 that will ensure we are able to make sustainable improvement versus the competition and thrive through all aspects of the cycle. The target is a $3 billion structural improvement to EBITDA supporting at least $2 billion in annual free cash flow. We continue to make good progress across all segments.
In Europe the Transformation program is progressing well; we are now operating from a more efficient, resized footprint and utilising enhanced digitalization of operations to drive productivity improvements and support maintenance excellence.
In the Americas, the footprint optimization program in US is underway and we have idled steelshop No.2 during 2Q’17 whilst restoration of 80” hot strip mill and IH finishing, and logistics are ongoing. Project completion is expected in 2018.
In Calvert capacity utilisation has reached almost 90%. The HSM continues to progress, both in terms of reliability and productivity, and we continue to make progress with both line pipe capability and automotive volumes. At the end of 2Q’17, 307 out of 383 target packages were completed with nearly 100 more new qualifications targeted by the end of 2018.
All areas of the business remain focussed on structurally improving costs; capturing the volume opportunities; and increasing the share of high added value products.
13

Investments completed in 1H 2017
• Calvert: Phase 2: Slab yard expansion Bay 5 Increase coil production from 4.6mt/pa to 5.3mt/pa (completed 2Q’17)
• Dofasco: increased shipments of galvanized sheets by ~130ktpy, along with improved mix and optimized cost(completed 2Q’17)
• Poland: Investment in the downstream operations: Increase of the HSM mill capacity by 0.9Mtpa
(commissioned in 2Q’17)
Increasing the HDG capacity by 0.4Mtpa(commissioned in 2Q’17)
Furthering our downstream capabilities for automotive and industrial applications
HDG2 Krakow
Calvert: Slab Yard bay 5
Dofasco galvanizing line
Continuous shift towards higher added value products14
In 1H’17, ArcelorMittal has completed several key investment projects in NAFTA and Europe to further support our continuous shift towards higher added value products, an important pillar of Action 2020.
At Calvert, we have completed the phase 2 expansion of the slab yard which will enable us to increase coil production from 4.6Mtpa to 5.3Mtpa, which is the facility’s operational capacity.
In Canada at Dofasco, we have increased our galvanized sheet capability by ~130ktpy as well as improved mix and optimized cost.
In Poland, we have made investments in our downstream operations, including the extension of the hot strip mill capacity by 0.9Mtpa and increasing the hot dip galvanizing capacity by 0.4Mtpa. Both these projects were commissioned in 2Q’17.
14

15
Taranto
Genova: Cold rolling, hot dip galvanising and tin plate capacities
Taranto: Integrated plant for production and sale of HRC, plates, pipes and tubes
15
New ILVA – a tier 1 steel asset
ILVA is a strong fit within ArcelorMittal’s existing business & strategy
• ILVA is the perfect opportunity for ArcelorMittal
– Italy is the 2nd largest steel consuming country in Europe (Mt)
– Large scale, underperforming asset requiring turnaround
– Significant cost improvement potential and synergies identified
– Opportunity to leverage AM strengths in R&D and product leadership and service
– Ilva will be re-established as a tier one supplier to European & Italian customers
• Minimal balance sheet impact, EBITDA accretive in Year 1
• Next step is regulatory approvals
97Mt Total European Flat
Steel demand in 2015
SOURCE: World Steel, Steel Statistical Yearbook 2015; Notes: *Iberia defined as Spain + Portugal
Novi Ligure: Cold rolling mill to serve end-users customers (e.g. packaging, white goods)
Moving to the topic of Ilva. As you will be aware from our press release and subsequent conference call, the Italian government announced in June that they will lease and then subsequently sell Ilva, Italy’s largest integrated steel producer, to ArcelorMittal.
This is an important strategic acquisition for us as Italy is Europe’s second largest steel market and we do not have any primary steel-making facilities in the country. ILVA is a tier-1 asset with significant potential. Taranto is Europe’s largest single-site steel making facility, very well positioned in terms of cost competitiveness. It is complemented by two high quality finishing facilities at Genova and Novi Liguri.
ILVA has excellent turnaround potential and presents a unique opportunity for ArcelorMittal to create value for our shareholders by leveraging our strengths – we have unique synergies and are in the best position to realise ILVA’s potential as a Tier-1 steel asset.
The acquisition of ILVA will have a limited impact on ArcelorMittal's balance sheet. For a minimum of 2 years we will be leasing the assets, with the annual leasing charge of €180 million effectively a down payment against the acquisition price of €1.8 billion. It should also be noted that the acquisition price includes €1 billion of working capital. The capex associated with our investment will be spread over a number of years and we expect ILVA to be cash flow accretive (cash from operations greater than capex) by year 3 of ownership.
We are now working on receiving regulatory approvals.
The ILVA acquisition and the investments in our finishing capacity at Calvert, Dofasco and Poland are fully consistent with ArcelorMittal’s financial policy to maximise long term shareholder value whilst maintaining a strong balance sheet.

16
• Unique global portfolio of competitive well-invested assets
• Industry leader in product and process innovation, supported by continuous investment in R&D and technology
• Transformed balance sheet, set to strengthen further as Company continues to prioritise an investment grade credit rating
• Ilva acquisition is a clear example of value-driven strategic investment
• Action 2020 plan to structurally improve profitability ongoing
• Positive operating environment that supported improved 1H’17 results continues
Building long term shareholder value
The world’s leading global steel company positioned to deliver value to shareholders
To conclude.
ArcelorMittal has a unique global portfolio of cost-competitive, well-invested assets.
We are the Industry leader in terms of our product offering and in terms of our process innovation. This leadership position is supported by continuous investment in R&D and technology.
Over the past 18 months we have transformed our balance sheet, and this will continue as the Company continues to prioritise an investment grade credit rating and the benefits to our shareholders that will go with it in terms of reducing the cost of our balance sheet to enhance our ability to translate EBITDA to free cash flow.
Within the context of our disciplined capital allocation, the ILVA acquisition is a clear example of a value-driven strategic investment opportunity. We will create value for our shareholders through capturing the synergies and realising ILVA’s potential as a tier-1 steel asset.
Our Action 2020 plan will ensure that we continue to make sustainable improvement versus the competition.
And finally, demand in our core markets remains strong and the ArcelorMittal PMI was 54.3 in June, which is the highest we have seen since the first half of 2011. This strengthening market backdrop suggests that shipments in the second half of 2017 will be higher than would normally by suggested by seasonality alone. Together with healthy steel spreads, this provides a supportive outlook for the second half of the year.
16

17
Appendix

18
18
EBITDA to net results
2,112
1,390 1,5131,322
210
Taxes and non-
controlling interests
(191)
Pre-tax income
Income from investments
120
Operating income
Forex and other fin. result
Net interest expense
Net income
(207)
(676)
EBITDA Impairment
(46)
D&A
Positive net income primarily driven by improved operating income
BASIC EPS 2Q’17
Weighted Av. No. of shares (in millions) 1,020
Earnings per share $1.30
2Q’17 EBITDA to net income analysis ($ million)
Impairment related to a downward revision of cash
flow projections in South Africa
Improved performance of Chinese investees
Includes mark to market gains on certain derivativesof $0.2bn and forex gains of $0.2bn offset by recurring
finance costs

19
EBITDA to free cashflow
* Change in working capital: cash movement in trade accounts receivable plus inventories less trade and other accounts payable
Positive free cash flow driven by improved operations
648
1,214
2,112
(350)
(548)
Cash flow from operations
EBITDA 2Q’17 Free cash flow
(566)
Change in working capital*
Net financial cost, tax and others
Capex
2Q’17 EBITDA to free cashflow analysis ($ million)
19

20
Net debt analysis
Net debt decrease driven by positive free cash flow offset by forex loss
372
63
M&AFree cash flow Net debt at Jun 30, 2017
11,884
Forex and other
(648)
Net debt at Mar 31, 2017
12,097
Mar 31, 2017 to Jun 30, 2017 ($ million)
Primarily related to Sumare
acquisition
20

21
21
EBITDA to net results
4,343
2,966 2,8192,324
Net income
(430)206
Pre-tax income
D&AEBITDA Income from investments
Net interest expense
Operating income
(1,331)
Forex and other fin. result
77
Taxes and non-
controlling interests
(495)
Impairment
(46)
Positive net income primarily driven by improved operating income
BASIC EPS 1H’17
Weighted Av. No. of shares (in millions) 1,020
Earnings per share $2.28
1H’17 EBITDA to net income analysis ($ million)
Impairment related to a downward
revision of cash flow projections in
South Africa
Includes annual dividend declared by Erdemir ($45m), improved performance of
Calvert and Chinese investees offset by loss on dilution of China Oriental stake ($44m)*
* China Oriental completed a share placement to restore the minimum 25% free float as per HKEx listing requirements. Following the share placement, ArcelorMittal’s interest in China Oriental decreased from 47% to 39%, upon which ArcelorMittal recorded a net dilution loss of $44 million.
Includes mark to market gains on certain derivatives partially offset by $0.2bn premium on the early bond
redemptions offset by non-cash

22
EBITDA to free cashflow
* Change in working capital: cash movement in trade accounts receivable plus inventories less trade and other accounts payable
Negative free cash flow driven by working capital investment
915
4,343
EBITDA 1H’17
(231)
Free cash flowCash flow from operations
(699)
(1,146)
(2,729)
Change in working capital*
Net financial cost, tax and others
Capex
1H’17 EBITDA to free cashflow analysis ($ million)
22

23
Net debt analysis
Net debt increase driven by negative free cash flow and forex
87
467
231
Net debt at Dec 31, 2016
Net debt at Jun 30, 2017
Forex and other
40
Dividend*
11,059
11,884
Free cash flow M&A
Dec 31, 2016 to Jun 30, 2017 ($ million)
* Dividends paid to minority shareholders
23

24
Liquidity and debt maturity profile
Rating upgrades demonstrate a positive trajectory towards target to achieve an IG credit rating
Liquidity at Jun 30, 2017 ($ billion)
Liquidity lines:
• $5.5bn lines of credit refinanced and extended in Dec 2016; two tranches:
• $2.3bn matures Dec 2019• $3.2bn matures Dec 2021
• Continued strong liquidity • Average debt maturity 6.4Yrs
Debt maturity: Ratings:
• S&P – BB+, stable outlook• Moody’s – Ba1, stable outlook • Fitch – BB+, stable outlook
5.5
2.3
Unused credit lines
Cash
Liquidity at Jun 30, 2017
7.8
Debt maturities at Jun 30, 2017 ($ billion)
0.6
1.50.9
1.91.3
4.8
1.0
0.3
0.6
0.5
>20212018 2019
0.2
0.2
2020 2021
0.20.2
2017
Other loans includes: $0.5bn USA facility which is available until 2021; and a 4.5bn ZAR (~$350m) revolving borrowing base facility
in South Africa (of which $258m is drawn) available until 2020
Commercial paper BondsOther loans
24

25
25
Sustainable development - key to our resilience
Leadership in our response to long term trends
• Embedding 10 sustainable development (SD) outcomes into the business gives us a long term view of risks and opportunities, and enables each business to prepare within their own stakeholder context.
• Having published our Annual Review 2016, 'Sustainable Progress’, which describes our long-term outlook beyond 2020, we are listening to feedback and planning our final step in our three year journey towards integrated reporting.
• Customers increasingly expect us to reassure them on sustainability standards in their supply chain. Our leadership in driving multi-stakeholder sustainability standards for mining and steel production continues to be appreciated, particularly by automotive customers in Europe who are concerned about our supply chain for raw materials. Our work on mining certification standards ismoving ahead strongly, with a roadmap for the IRMA standard to be market-ready by 2018. We have also been instrumental in evolving a partnership between IRMA and TSM, a similar standard in Canada. Pilots of the ResponsibleSteel™ standard are ongoing at three of our sites.
• Carbon reduction on the scale required by the Paris agreement remains a challenge for steel. A border adjustment on the carbon content of imported steel is needed to ensure fairer competition between European-made steel and imports to the European market. Importantly, the right policies would also incentivise us in our development of low-carbon steel technology. Our CDP climate score in 2016 was “B” and we have resubmitted for 2017.
• Ranked 1st for low carbon technology development in the Climate Disclosure Project’s report on the steel sector ‘Nerves of Steel – Who’s ready to get tough on emissions?’
• Trend towards circular economy offers us opportunities, and naturally aligns with steel vs other materials. Our leadership incircular economy was recognised in VDBO’s benchmark study
• We continue to be assessed by and included in a number of sustainability leadership indices:
25

Trade case: Comprehensive solution required
US
Europe
• Anti-Dumping (AD) and Anti Subsidy (AS) duties are in place on all four flat product categories: CORE, CRC, HRC, and Plate from key importing countries measures in place for five years
• Anti-circumvention investigations initiated by the Department of Commerce (DOC) for CRC and CORE imports from China (through Vietnam) with determinations due mid Sept 2017
• April 20, 2017, initiation of a national security investigation (Section 232) with respect to steel imports. The Secretary of Commerce, in consultation with the Secretary of Defense, conducting investigation
26
• Final AD duties on CRC imports from China & Russia
• Final AD duties on HRC and QP imports from China approved on Feb 10, 2017 by the EU council (duties from 18.1% to 35.9%)
• AS AD on HRC imports from China Approved by the EU Council 9th June 2017, (duties aligned under the Lesser duty rule with the AD duties to final level from 18.1% to 35.9%)
• Ongoing AD investigation on HRC imports from five additional countries (Brazil, Iran, Ukraine, Russia and Serbia) – the European Commission circulated a proposal for duties from 4 of the 5 countries (Serbia excluded), considering the application of duties below a minimum import price. We are expecting a decision of the final measures latest by Oct 2017.
• AD investigation started in December 2016 on imports from China of Corrosion resistant steel (HDG non-auto) - provisional measures expected 3Q’17
26

Key trade case update: EU & USUS Flat RolledProd Exporter Status Timeline
Core AD/CVD China India Italy KoreaTaiwan
• DOC final determination:
─ CVD: China: 39.05 – 241.07%, India: 8% - 29.46%;Italy: 0.07 – 38.15%; Korea: 0.72-1.19%; Taiwan –de minimus (no duty imposed)
─ AD: China 209.97%; India 3.05-4.44%; Italy 12.63-92.12%; Korea 8.75-47.8.5%; Taiwan: 3.77%
• ITC voted affirmative on all countries – orders issued
Measures inplace for the next 5 years
CRC AD/CVD BrazilChina India Korea
AD onlyJapan UK
• DOC final determinations:
─ CVD: Brazil: 11.09%-11.31%; China: 256.44%; India: 10%; Korea: 3.91%-58.36%
─ AD: Brazil:14.35%-35.43%; China: 265.79%; India: 7.6%; Japan: 71.35%; Korea: 6.32%-34.33%; UK: 5.4%-25.56%
• ITC voted affirmative on Brazil, China, India, Korea, Japan and UK – orders issued
• ITC voted negative on Russia AD and CVD - no orders will be issued
Measures inplace for the next 5 years
HRC AD/CVDKorea Brazil
AD onlyAustraliaJapanNetherlandsTurkeyUK
• DOC final determination:
─ CVD: Brazil: 11.09%-11.30%; Korea: 3.89%-57.04%
─ AD: Australia: 29.37%, Brazil: 33.14%- 34.28%, Japan: 4.99%-7.51%, Korea: 3.89%-9.49%, Netherlands: 3.73%, Turkey: 3.66%-7.15%, UK: 33.06%
• ITC voted affirmative on all AD and Korea and Brazil CVD – orders issued; the ITC voted negative on Turkey CVD – no order issued
Measures inplace for the next 5 years
QP AD/ CVDChina Korea
ADAustriaBelgium BrazilFrance GermanyItaly Japan South Africa TurkeyTaiwan
• DOC final determinations for cooperating countries:
─ CVD: China: 210.50%; Korea 4.31%
─ AD: Austria: 53.72%, Belgium: 5.40%-51.78%, Brazil: 74.52%, China: 68.27%, France: 8.62%-148.02%, Germany: 5.38%-22.90%, Italy: 6.08%-22.19%, Japan: 14.79%-48.67%, Korea: 7.39%, South Africa: 87.72%- 94.14%, Taiwan 3.62%-6.95%, Turkey: 42.02%-50%
• ITC voted affirmative on all countries
• Brazil, S. Africa and Turkey orders issued 26 Jan‘17; China order issued 20 Mar’17; all others issued May 26
Measures inplace for the next 5 years
Europe Flat, Long and Tubes Prod Exporter Status Timeline
CRC AD ChinaRussia
• Definitive measures and retroactive implementation were voted in favouron July 7: China: 19.8% to 22.1%, Russia: 18.1% to 35.9%
• Measures in place for the next 5 years
HRC ADChina
CVDChina
ADIran, Serbia, Ukraine, Russia & Brazil
• AD Provisional measures published on Oct 17 - duties from 13.2% to 22.6%
• AD final measures voted in favour on the10th of Feb 2017 – duties from 18.1% to 36.6%
• CVD China final measures approved 9th
June 2017
• AD (5 Cs) Investigation started July 7, 2016; In July 2017, proposal for duties below minimum import price circulated (Serbia excluded)
• Decision on final measures expected latest Oct 2017
CRS(HDG – non auto)
ADChina
• Initiation of investigation on the 22nd of December 2016
• Provisional measures expected 3Q 2017
QP AD China
• AD Provisional measures published on Oct 17 - duties from 65% to 74%
• AD final measures voted in favour on the 10 Feb 2017 – same level as provisional measures
27
Notes:─ Timelines provided are defined based on regulation maximum limits─ Provisional AD duties vs Rebar LF from Belarus published 19 Dec at 12.5%─ Provisional AD duties vs Seamless tubes (large diameter) from China published 11th Nov
from 45.4% to 81.1%
27

28* Net debt refers to long-term debt, plus short term debt, less cash and cash equivalents, restricted cash and short-term investments; ** Liquidity is defined as cash and cash equivalents plus available credit lines excluding back-up lines for commercial paper program
Balance sheet structurally improved
Balance sheet fundamentals improved
Net debt* ($ billion) Average debt maturity (Years)
Liquidity** ($ billion) Bank debt as component of total debt (%)
11.9
32.5
2Q 20173Q 2008
-20.66.4
2.6
2Q 20173Q 2008
7.8
12.0
2Q 20173Q 2008 2Q 2017
9%
3Q 2008
75%
28

29
ArcelorMittal USA now progressing with a “footprint optimization project” at Indiana Harbor
Indiana Harbor “footprint optimization project”:
• Current configuration uncompetitive structural changes required across all cost elements
• #1 aluminize, 84” hot strip mill (HSM), #5 continuous galvanizing line (CGL), and steel shop No.2 now idled; all planned asset consolidation now complete with the idling of steel shop No.2
• Planned investments totalling ~US$200m:
− New caster at No.3 steelshop installed & commissioned 4Q’16
− Restoration of 80” hot strip mill and IH finishing, and logistics ongoing
− Project completion expected in 2018
Indiana Harbor - USA Footprint
Indiana Harbor Plant 80”HSM: 5 Walking Beam Furnace No. 3SP: New Downcomer
No. 3SP: New #2 Caster
No. 3SP: New #2 Caster commissioning
29

30
AM/NS Calvert JV
Investment in Calvert to further enhance automotive capabilities
Investment in No.4 continuous coating line: Project completed 1Q’15:
• Increases ArcelorMittal’s North American capacity to produce press hardenable steels one of the strongest steels used in automotive applications, Usibor®, a type one aluminum-silicon coated (Al Si) high strength steel
• AM/NS Calvert capable of producing Ductibor®, an energy-absorbing high strength steel grade designed specifically to complement Usibor® and offer ductility benefits to customers
• Modifications completed at the end of 2014 and the first commercial coil was produced in Jan 2015
Slab yard expansion to increase Calvert’s slab staging capacity and efficiency (capex $40m):
• Expand the HSM slab yard bays 4 & 5 with overhead cranes and roller table to feed the HSM production to 5.3mt/year of coils.
• Current HSM consists of 3 bays with 335kt capacity for incoming slabs (less than the staging capacity required to achieve 5.3mt target)
• Phase 1 completed 1Q’16: Slab yard expansion of Bay 4 & minor installations for Bay 5 increase coil production up to 4.6mt/pa
• Phase 2: Slab yard expansion Bay 5 Increase coil production from 4.6mt/pa to 5.3mt/pa. Project completed in 2Q’17 HSM Slab yard Bay 4Phase 1 slab yard
Slab Yard bay 5 Calvert
Roller table
30

Cost optimization, mix improvement and increase of shipments of galvanized products:
• Phase 1: New heavy gauge galvanizing line (#6 Galvanizing Line):
– Completed construction of heavy gauge galvanizing line #6 (cap. 660ktpy) and closure of line #2 (cap. 400ktpy) increased shipments of galvanized sheet by 260ktpy, along with improved mix and optimized cost
– Line #6 will incorporate AHSS capability part of program to improve Dofasco’s ability to serve customers in the automotive, construction, and industrial markets
– The first commercial coil was produced in April 2015
• Phase 2: Approved galvanizing line conversion to Galvalume and Galvanize:
– Restart conversion of #4 galvanizing line to dual pot line (capacity 160ktpy of galvalume and 128ktpy of galvanized products) and closure of line #1 galvanizing line (cap.170ktpy of galvalume) increased shipments of galvanized sheets by 128ktpy, along with improved mix and optimized cost.
– Project completed in 2Q’17
31
Dofasco (NAFTA)
Expansion supported by strong market for galvanized products
31
31

32
Europe: ArcelorMittal Krakow (Poland)
Investments in excess of €120m in upstream and downstream installations in Krakow
On July 7, 2015, ArcelorMittal Poland announced it will restart preparations for the relining of BF#5 in Krakow completed during 3Q’16.
• Further investments in the primary operations:
– The modernization of the BOF #3
• Investment in the downstream operations include:
– The extension of the HSM mill capacity by 0.9Mtpa (project commissioned in 2Q’17)
– Increasing the HDG capacity by 0.4Mtpa (project commissioned in 2Q’17)
HRM Krakow
HRM
Walking beam furnace #2 HDG2 Krakow
32
32

Europe: UHSS Automotive Program
Investments to enhance UHSS capabilitiesInvestments to enhance UHSS capabilities
Upgrade of capabilities to produce new steels Fortiform grades offer a 20% weight saving on identified application Commercial benefits of additional ~400kt UHSS (Ultra High Strength Steel)The project is executed in several sub projects in Gent cluster (Liège and Gent plants):Gent:• Upgrade of Gent HSM completed end 2016• Erection of new furnace for Gent HDG expected completion in 2017Liège:• 1st step of annealing line transformation (cooling zone) - completed 3Q’15• JVD 1st trial coils were produced in 3Q’16• Second step of annealing line transformation - completed 1Q’17 • Remaining process optimizations & modifications on CAL expected completion in 2017
New stand F1 in front of line –Gent HSM
Top rolls of new direct flaming furnace - Liege
33
Cooling water plant -Gent
33

JVD a new, breakthrough technology for themetallic coating of steel
The JVD process is unique and is the result of a breakthrough scientific development34
• Feb 2017, ArcelorMittal opened a new €63m production line - the Jet Vapor Deposition (JVD) line at its facilities in Kessales, Belgium
• JVD technology coats moving strips of steel in a vacuum chamber, by vaporizing zinc onto the steel at high speed prevents corrosion and improves durability
• Two new product families ArcelorMittal’s range of metallic coatings:
Jetgal®: JVD zinc coating applied to steel grades for the automotive industry developed for steels including UHSS Fortiform®
Jetskin™: JVD zinc coating applied to steel grades for industrial applications such as household appliances, doors, drums and interior building applications
• Multiple advantages including:
A lower environmental footprint
Ensures exceptionally uniform coating enhances the surface quality and makes welding easier for the customer
Guarantees excellent adhesion of the coating, regardless of the steel grade, even for new UHSS steels currently under development
Highly flexible process with ability to produce different coating thicknesses and to coat a variety of substrates regardless of their chemical composition
34

Improving and growing high added value products
Indiana Harbor Plant
No. 3SP: New #2 Caster
• Investment features:
– new cooling bed; new cold saw; new gagpress;
• Customer benefits:
– improved service in terms of lead time andreliability
– highest quality for the most demanding grades& largest sizes thanks to improved straightnessand surface quality
• Expected completion in 1Q 2018Roller straightener in pre-assembly stage
35
ArcelorMittal Differdange: Modernisation of finishing of “Grey rolling mill”• ArcelorMittal Differdange Section Mill, the “Grey mill”, is recognized as the worldwide leader forheavy and jumbo beams.
• The mill produces a unique portfolio of heavy sections used in the structure of numerous landmarkprojects across the World.
• Aim to continue to be the undisputed market leader in supplying the most advanced structural steelproducts and solutions for construction and high rise buildings.
• The key feature of the project is to install the largest straightener in the World for sectionsintegrated in a new production flow.
Roller straightener in pre-assembly stage
Freedom Tower‐New York
35

36
Kryvyi Rih - New LF&CC 2&3
AMKR investments to ensure sustainability & improve productivity
• Facilities upgrade to switch from ingot to continuous casting route; additional billets capacity of 290kt/y
• Industrial target: Step-by-step steel plant modernization with state-of-art technology:
– Product mix development
• Supportive target:
– Cost reduction
– Billet quality improvement for sustaining customers
– Better yield and productivity
• Project completion expected in 4Q 2018
Entry section o Continuous Annealing Line
Site preparation for
LF&CC 2&3
<–>
AM Kryvyi Rih LF&CC 1
36
36

AM USA expands surface critical capability at Burns Harbor to provide a sustained automotive footprint
Burns Harbor - New Walking Beam Furnaces
Burns Harbor Hot Mill - New Walking Beam Furnaces:
• Install 2 latest generation walking beam furnaces, including recuperators & stacks, building extension & foundations for new units
• Benefits associated to the project:• Hot rolling quality and productivity • Sustaining market position• Reducing energy consumption
• Project completion expected in 2021
37
37

38
VAMA-JV with Hunan Valin (China)
Robust Chinese automotive market: growth to ~32 million vehicles by 2022*
• VAMA: JV between ArcelorMittal and Hunan Valin which will produce steel for high-end applications in the automobile industry, supplying international automakers and first-tier Chinese car manufacturers as well as their supplier networks for rapidly growing Chinese market
• Construction of automotive facility : State of the art pickling tandem CRM (1.5Mt); Continuous annealing line (1.0Mt), and Hot dip galv. line (0.5Mt)
• Capex ~$832 million (100% basis) First automotive coils produced during 1Q 2015
– VAMA has completed development of DP780, DP980, DP1180HY and Ductibor 500
– VAMA top products (Usibor® 1500P, Ductibor®500, DP980 and DP780) are approved by large number of end users and sold to Tier 1 stamper market
– VAMA has successfully completed homologation on UHSS/AHSS with key tier 1 auto OEMs and focuses on replacing parts in running models and entering new models
Entry section of Continuous Annealing Line
* Source: IHC
Laser Welder at PLTCMPLTCM entry looper
38
38
39
39* Source: AISI, Eurofer and ArcelorMittal estimates
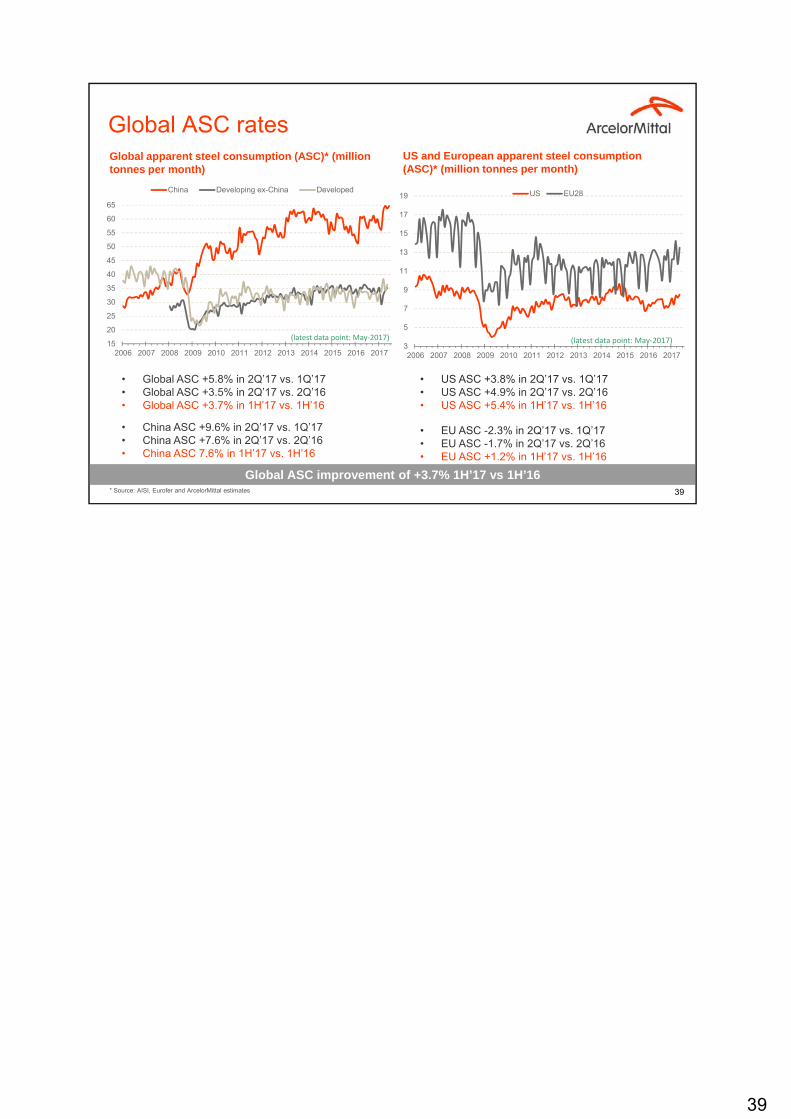
Global ASC rates
Global ASC improvement of +3.7% 1H’17 vs 1H’16
Global apparent steel consumption (ASC)* (million tonnes per month)
US and European apparent steel consumption (ASC)* (million tonnes per month)
• EU ASC -2.3% in 2Q’17 vs. 1Q’17• EU ASC -1.7% in 2Q’17 vs. 2Q’16• EU ASC +1.2% in 1H’17 vs. 1H’16
• US ASC +3.8% in 2Q’17 vs. 1Q’17• US ASC +4.9% in 2Q’17 vs. 2Q’16• US ASC +5.4% in 1H’17 vs. 1H’16
• China ASC +9.6% in 2Q’17 vs. 1Q’17 • China ASC +7.6% in 2Q’17 vs. 2Q’16• China ASC 7.6% in 1H’17 vs. 1H’16
• Global ASC +5.8% in 2Q’17 vs. 1Q’17• Global ASC +3.5% in 2Q’17 vs. 2Q’16• Global ASC +3.7% in 1H’17 vs. 1H’16
15
20
25
30
35
40
45
50
55
60
65
2006 2007 2008 2009 2010 2011 2012 2013 2014 2015 2016 2017
China Developing ex-China Developed
3
5
7
9
11
13
15
17
19
2006 2007 2008 2009 2010 2011 2012 2013 2014 2015 2016 2017
US EU28
(latest data point: May‐2017)(latest data point: May‐2017)

40
200
300
400
500
600
700
2006 2007 2008 2009 2010 2011 2012 2013 2014 2015 2016 2017
Residential Non residential
(latest data point: May‐2017)
30
35
40
45
50
55
60
65
2006 2007 2008 2009 2010 2011 2012 2013 2014 2015 2016 2017
Architecture Billings Index (USA) Eurozone construction PMI
(latest data point: Jun‐2017)
40* Source: US Census Bureau; ** Source: Markit and The American Institute of Architects
Construction markets in developed market
Construction growth accelerating in EU28
Housing permits & starts in Jan-May’17 grew 5.6% and 3.8% YoY respectively, but growth is beginning to slow
Non-residential construction spending continues to grow, particularly office and commercial demand but overall growth rates are slowing to ~2% from over 4% in 2016
Infrastructure expenditure was weak in 2016 but the timing and strength of rebound is uncertain as it is unclear when the new administration will pass an infrastructure bill
US residential and non-residential construction indicators (SAAR) $bn*
Eurozone and US construction indicators**
United States
Europe
European construction grew ~1.5% last year, held back by weak infrastructure spending despite a pick-up in building construction
Improving economic outlook has led to greater confidence to undertake construction projects, with growth accelerating to 2.6% YoY (Jan-Apr’17)
While growth prospects vary considerably across countries, the Eurozone construction PMI now >50 for 8 months

41
41* Source: China National Bureau of Statistics, China Real Estate Index System (via Haver) and ArcelorMittal estimates; Source: NBS, CISA, WSA, Mysteel, ArcelorMittal Strategy estimates
China overview
China ASC demand now expected to grow in 2017 by +2.5% to +3.5%
Economy supported by real estate, robust infrastructure, credit growth and stronger exports, with a modest tightening of monetary conditions and only a mild slowdown likely ahead of Oct’17 party congress
Rising house prices and real estate sales growth (+16% YoY 1H’17), have continued despite the imposition of purchase restrictions in 25 cities last year
Real demand has been marginally stronger than anticipated during 1H supported by real estate and machinery
ASC growth was strong in H1’17 (+7.6% y-o-y) but lower than if calculated using NBS data alone
As construction gradually weakens we expect ASC to decline YoY in 2H’17 but to still be up roughly 5% over 2H’15 levels
Crude steel finished production and inventory (mmt)
China construction % change YoY, (3mth moving av.)*China
5
10
15
20
25
35
45
55
65
75
2007 2008 2009 2010 2011 2012 2013 2014 2015 2016 2017
Steel inventory at warehouses (RHS)
Steel inventory at mills (RHS)
Finished steel production (LHS)
(latest data point: May‐2017)
-40%
-20%
0%
20%
40%
60%
80%
100%
2008 2009 2010 2011 2012 2013 2014 2015 2016 2017 201
Residential floor space sold (6 month lag)
Residential floor space started
(latest data point: May‐2017 )

42
42* Source: WSA, Mysteel, ArcelorMittal Strategy estimates
Regional inventories
Inventory trends
German inventories (000 Mt)
China service centre inventories* (Mt/mth) with ASC%Brazil service centre inventories (000 Mt)
US service centre total steel inventories (000 Mt)
2.0
2.2
2.4
2.6
2.8
3.0
3.2
3.4
3.6
5,000
6,000
7,000
8,000
9,000
10,000
11,000
12,000
13,000
2007 2008 2009 2010 2011 2012 2013 2014 2015 2016 2017
USA (MSCI)
Months Supply (RHS)
(latest data point: May‐2017)
2.0
2.5
3.0
3.5
4.0
4.5
1,200
1,400
1,600
1,800
2,000
2,200Germany flat stocks
Months Supply (RHS)
(latest data point: Apr‐2017)
1.0
2.0
3.0
4.0
5.0
6.0
7.0
200
400
600
800
1,000
1,200
1,400Flat stocks at service centresMonths Supply (RHS)
(latest data point: June‐2017)
0%
10%
20%
30%
40%
50%
0
5
10
15
20
25
2007 2008 2009 2010 2011 2012 2013 2014 2015 2016 2017
Flat and long% of ASC (RHS)
(latest data point: June‐2017)
.

Daniel Fairclough – Global Head Investor [email protected]+44 207 543 1105
Hetal Patel – UK/European Investor [email protected]+44 207 543 1128
Valérie Mella – European/Retail Investor [email protected]+44 207 543 1156
Maureen Baker – Fixed Income/Debt Investor [email protected]+33 1 71 92 10 26
Lisa Fortuna – US Investor [email protected]+312 899 3985
We have released an ArcelorMittal investor relations app available for download on IOS or android devices
ArcelorMittal IR app and contacts
43