1h fy3/17 results materials · bldg techno, the sankei building management, skb usa, skb seattle 10...
TRANSCRIPT

1H FY3/17 Results Materials (Six Months ended September 30, 2016)
November 2, 2016 Fuji Media Holdings, Inc.
These materials are an English translation of the original document inJapanese. The Company's performance forecasts and other informationare based on the Company's understanding as of the time the earningspresentation materials were prepared.These materials may contain information about financial targets,forecasts, and other forward looking statements regarding Fuji MediaHoldings, Inc., its affiliates, and investees. Actual results may differsubstantially due to a variety of factors, including changes in businessmanagement, economic conditions, financial markets, and othercircumstances.
“FY3/17” means the fiscal year ending March 31, 2017. The period from April 1, 2016 to September 30, 2016 is referred to as “1H.”The period from July 1, 2016 to September 30, 2016 is referred to as “2Q.”

1H FY3/17 Consolidated Results
2
Millions of yen <April 1, 2016 to September 30, 2016>
FY3/16 FY3/17 YoY
1H FY3/17
Forecast (Announced on
May 12)
1H FY3/17 Actual/ 1H Forecast
Net Sales 311,736 327,601 15,864 5.1% 333,700 (6,098) (1.8)%
Operating Income 4,905 13,301 8,395 171.1% 11,200 2,101 18.8%
Ordinary Income 8,170 17,735 9,565 117.1% 14,200 3,535 24.9%
Net income attributable to owners of the parent
5,079 12,732 7,652 150.7% 9,000 3,732 41.5%
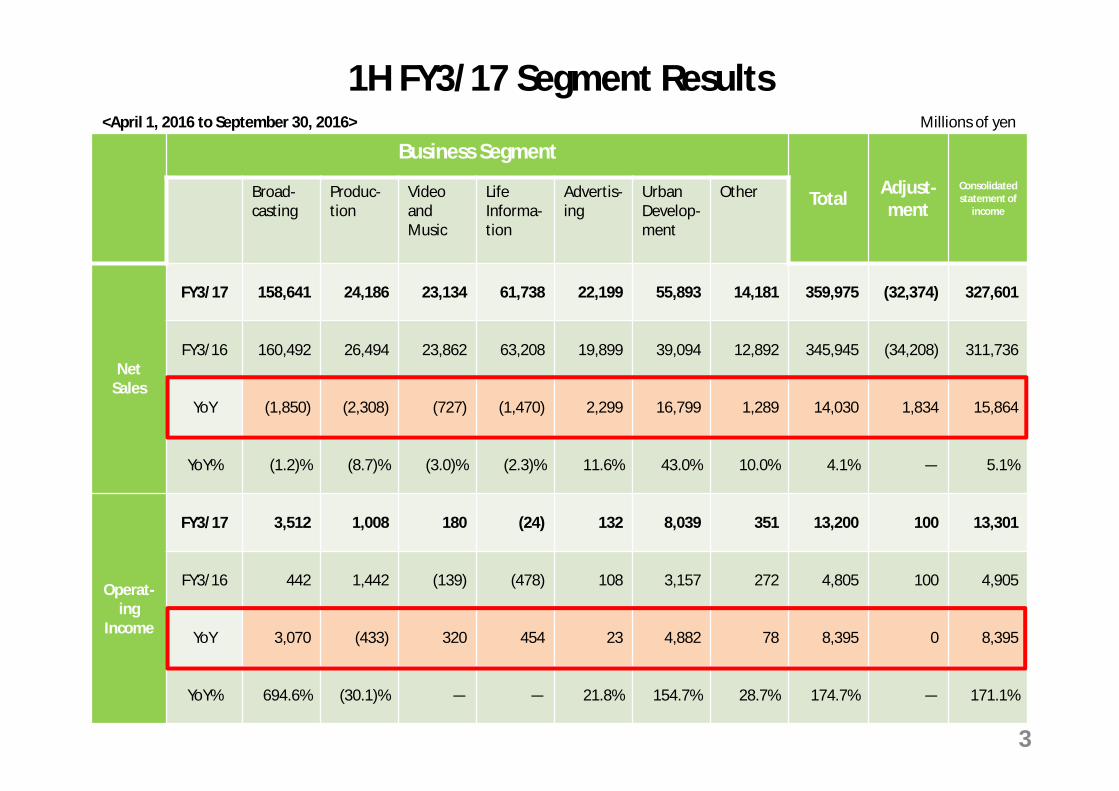
1H FY3/17 Segment Results
3
Business Segment
Total Adjust-ment
Consolidated statement of
income Broad-casting
Produc-tion
Video and Music
Life Informa-tion
Advertis-ing
Urban Develop-ment
Other
Net Sales
FY3/17 158,641 24,186 23,134 61,738 22,199 55,893 14,181 359,975 (32,374) 327,601
FY3/16 160,492 26,494 23,862 63,208 19,899 39,094 12,892 345,945 (34,208) 311,736
YoY (1,850) (2,308) (727) (1,470) 2,299 16,799 1,289 14,030 1,834 15,864
YoY% (1.2)% (8.7)% (3.0)% (2.3)% 11.6% 43.0% 10.0% 4.1% ― 5.1%
Operat-ing
Income
FY3/17 3,512 1,008 180 (24) 132 8,039 351 13,200 100 13,301
FY3/16 442 1,442 (139) (478) 108 3,157 272 4,805 100 4,905
YoY 3,070 (433) 320 454 23 4,882 78 8,395 0 8,395
YoY% 694.6% (30.1)% ― ― 21.8% 154.7% 28.7% 174.7% ― 171.1%
<April 1, 2016 to September 30, 2016> Millions of yen

1H FY3/17 Consolidated Results (Year-on-Year)Operating Income of Major Subsidiaries
4
Name FY3/16 FY3/17 YoYFuji TV (1.0) 2.3 3.3Sankei Building 1.7 6.1 4.4GRANVISTA Hotels & Resorts 2.1 1.7 (0.3)BS Fuji 1.2 1.1 (0)Dinos Cecile (0.1) 0 0.1Pony Canyon (0.3) (0.2) 0
0
500
1,000
1,500
2,000
2,500
3,000
3,500
2015.9月期 2016.9月期
160.4
63.2
39.0
311.7
327.6+15.8+5.1%
Broadcasting158.6(1.2)%
Life Information
61.7(2.3)%
Urban Development
55.8+43.0%
0
20
40
60
80
100
120
140
2015.9月期 2016.9月期0.4
3.1
4.9
Broadcasting3.5+3.0
Urban Development
8.0+4.8
13.3+8.3
+171.1%
0
40
80
120
160
200
2015.9月期 2016.9月期
8.1
17.7+9.5
+117.1%
0
40
80
120
2015.9月期 2016.9月期
5.0
12.7+7.6
+150.7%
Others
Others
Net Sales Operating Income Ordinary Income Net income attributable to owners of the parent
1H FY3/16 1H FY3/17 1H FY3/16 1H FY3/17 1H FY3/16 1H FY3/17 1H FY3/16 1H FY3/17
Billions of yenBillions of yen
350
300
250
200
150
100
50
14
12
10
8
6
4
2
20
16
12
8
4
12
8
4
Billions of yen
Billions of yen
Billions of yen
5
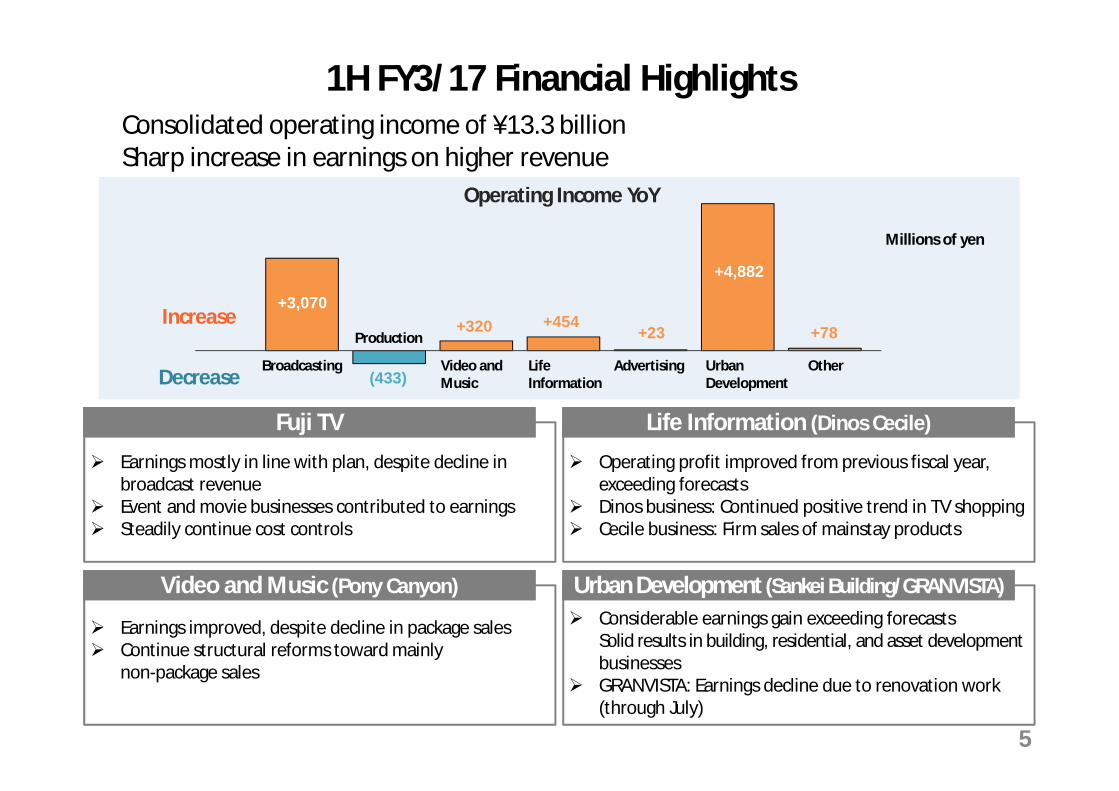
1H FY3/17 Financial Highlights Consolidated operating income of ¥13.3 billionSharp increase in earnings on higher revenue
Fuji TVFuji TV
Video and Music (Pony Canyon)Video and Music (Pony Canyon) Urban Development (Sankei Building/GRANVISTA)Urban Development (Sankei Building/GRANVISTA)
Life Information (Dinos Cecile)Life Information (Dinos Cecile)
+3,070+320 +454 +23 +78
Earnings improved, despite decline in package sales Continue structural reforms toward mainly
non-package sales
Considerable earnings gain exceeding forecastsSolid results in building, residential, and asset developmentbusinesses
GRANVISTA: Earnings decline due to renovation work (through July)
Operating profit improved from previous fiscal year, exceeding forecasts
Dinos business: Continued positive trend in TV shopping Cecile business: Firm sales of mainstay products
Earnings mostly in line with plan, despite decline in broadcast revenue
Event and movie businesses contributed to earnings Steadily continue cost controls
(433)
+4,882
Decrease
Increase
Broadcasting
Production
Video and Music
Life Information
Advertising Urban Development
Other
Millions of yen
Operating Income YoY

6
Segment Information (Consolidated Subsidiaries)
Segment Company Name No. of Companies
Broadcasting Fuji Television Network, Fuji Satellite Broadcasting (BS Fuji), Nippon Broadcasting System 3
Production Fuji Creative Corporation, Kyodo Television, Vasc, Fuji Media Technology, NEXTEP TV WORKSHOP, Fuji Art, Van Eight Production, Kyodo Edit, Basis 9
Video and MusicFuji Music Partners, Pony Canyon, Ponycanyon Enterprise, EXIT TUNES, Fujipacific Music, Shinko Music Publishers, FUJI MUSIC GROUP, ARC MUSIC, ARC/CONRAD MUSIC
9
Life Information Sankei Living Shimbun, Dinos Cecile, Living Pro-seed, Dinos Cecile Communications 4
Advertising Quaras 1
Urban Development
The Sankei Building, Granvista Holdings, Koshien Development, Sankei Kaikan, GRANVISTA Hotels & Resorts, Sankei Building Well Care, The Sankei Bldg Techno, The Sankei Building Management, SKB USA, SKB Seattle
10
Other Fusosha Publishing, Fujimic, Nippon Broadcasting Project, Fuji Games, FUJI CAREER DESIGN, FUJISANKEI COMMUNICATIONS INTERNATIONAL 6
Total 42
*Companies listed in red were included in the scoped of consolidation in FY3/17.

7
[Segment Details] Summary of Broadcasting Segment by Company
Net Sales Operating Income
1H FY3/16 1H FY3/17 YoY 1H FY3/16 1H FY3/17 YoY
Fuji Television 146,629 144,165 (2,464) (1.7)% (1,016) 2,305 3,322
―
Nippon Broadcasting System 7,094 7,092 (1)
(0.0)% 218 79 (138)(63.7)%
BS Fuji 7,830 8,340 5096.5% 1,239 1,171 (68)
(5.6)%
Adjustment (1,062) (957) ― 0 (43) ―
Total 160,492 158,641 (1,850)(1.2)% 442 3,512 3,070
694.6%
<April 1, 2016 to September 30, 2016> Millions of yen

8
Net Sales Operating Income
1H FY3/16 1H FY3/17 YoY 1H FY3/16 1H FY3/17 YoY
Kyodo Television 8,460 7,211 (1,248)(14.8)% 194 186 (8)
(4.2)%
Fuji Creative Corporation 6,571 6,271 (299)
(4.6)% 301 422 12140.3%
Others and adjustment 11,462 10,702 ― 947 400 ―
Total 26,494 24,186 (2,308)(8.7)% 1,442 1,008 (433)
(30.1)%
<April 1, 2016 to September 30, 2016> Millions of yen
[Segment Details] Summary of Production Segment by Company

9
Net Sales Operating Income
1H FY3/16 1H FY3/17 YoY 1H FY3/16 1H FY3/17 YoY
Pony Canyon 16,964 15,885 (1,079) (6.4)% (335) (269) 65
―
Others and adjustment 6,897 7,249 ― 195 450 ―
Total 23,862 23,134 (727)(3.0)% (139) 180 320
―
<April 1, 2016 to September 30, 2016> Millions of yen
[Segment Details] Summary of Video and Music Segment by Company

10
Net Sales Operating Income
1H FY3/16 1H FY3/17 YoY 1H FY3/16 1H FY3/17 YoY
Dinos Cecile 55,719 54,335 (1,384)(2.5)% (158) 3 161
―
Sankei Living Shimbun 4,873 4,785 (87)
(1.8)% (371) (148) 222―
Others and adjustment 2,616 2,616 ― 50 120 ―
Total 63,208 61,738 (1,470)(2.3)% (478) (24) 454
―
<April 1, 2016 to September 30, 2016> Millions of yen
[Segment Details] Summary of Life Information Segment by Company
11
Net Sales Operating Income
1H FY3/16 1H FY3/17 YoY 1H FY3/16 1H FY3/17 YoY
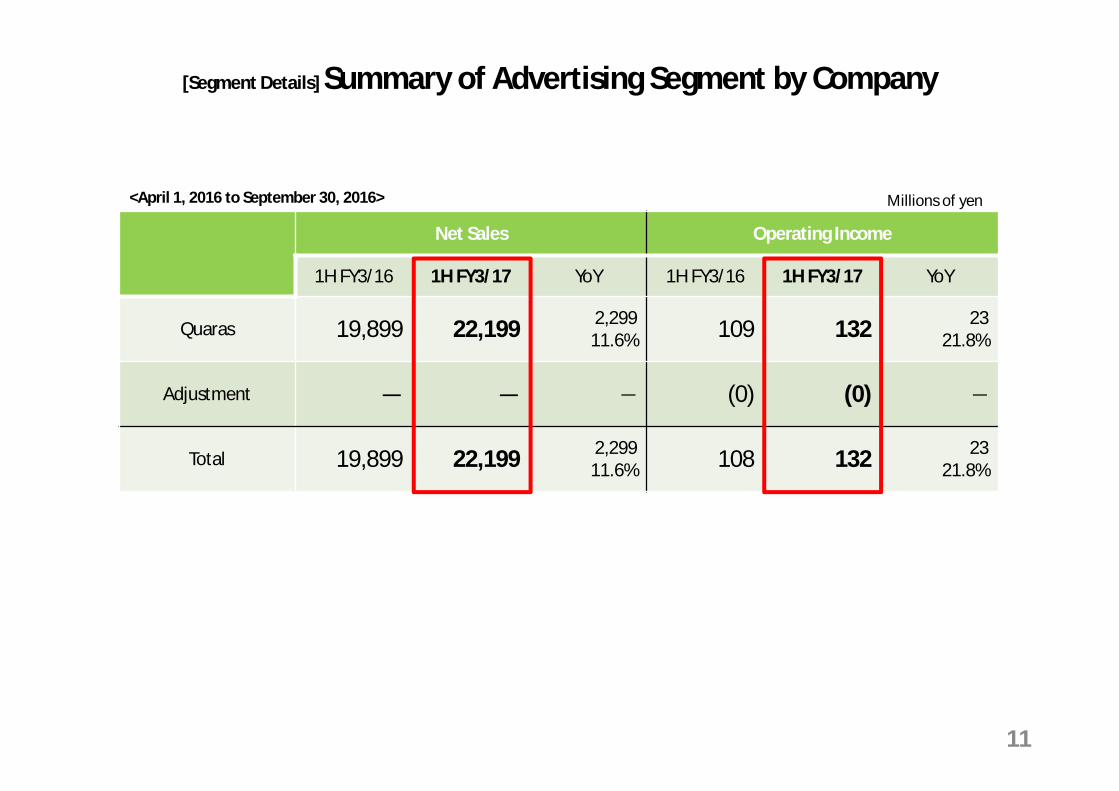
Quaras 19,899 22,199 2,299 11.6% 109 132 23
21.8%
Adjustment ― ― ― (0) (0) ―
Total 19,899 22,199 2,29911.6% 108 132 23
21.8%
<April 1, 2016 to September 30, 2016> Millions of yen
[Segment Details] Summary of Advertising Segment by Company

12
Net Sales Operating Income
1H FY3/16 1H FY3/17 YoY 1H FY3/16 1H FY3/17 YoY
Sankei Building 19,404 36,586 17,18288.5% 1,729 6,158 4,428
256.0%
GRANVISTA Hotels & Resorts 15,104 14,423 (680)
(4.5)% 2,117 1,744 (372)(17.6)%
Others and adjustment 4,585 4,883 ― (690) 137 ―
Total 39,094 55,893 16,79943.0% 3,157 8,039 4,882
154.7%
<April 1, 2016 to September 30, 2016> Millions of yen
[Segment Details] Summary of Urban Development Segment by Company

13
1H FY3/16 1H FY3/17 YoY
Non-operating income
Dividends income 1,254 1,549 295 23.6%
Equity in earnings of affiliates 1,826 2,048 221 12.1%
Other 1,983 2,036 52 2.7%
Total 5,064 5,635 570 11.3%
Non-operating expenses
Interests 888 760 (127) (14.4)%
Loss on investments in partnership 409 211 (197) (48.3)%
Other 501 228 (273) (54.5)%
Total 1,800 1,201 (599) (33.3)%
<April 1, 2016 to September 30, 2016>
Main Items in Non-Operating Income and ExpensesMillions of yen

1H FY3/16 1H FY3/17 YoY
Extraordinary gain
Gain on sales of non-current assets 0 46 46 ―
Gain on sales of investment securities 2 45 43 ―
Other 2 1 (0) (15.4)%
Total 4 93 89 ―
Extraordinary loss
Impairment loss 133 702 569 428.2%
Loss on reconstruction 95 394 299 315.2%
Other 270 341 71 26.4%
Total 498 1,439 940 188.7%14
<April 1, 2016 to September 30, 2016> Millions of yen
Main Items in Extraordinary Gain and Loss

Fuji TV Results

16
FY3/16 FY3/17 YoY FY3/17 Forecast(Announced on May 12)
Forecast ―Actual
Net Sales 146,629 144,165 (2,464) (1.7)%Full Year 294,200
1H 146,800 (2,634)
Operating Income (1,016) 2,305 3,322 ―
Full Year 10,000
1H 2,500 (194)
Ordinary Income (203) 2,670 2,874 ―
Full Year 10,100
1H 2,600 70
Net Income (247) 1,647 1,895 ―Full Year 6,400
1H 1,500 147
1H FY3/17 Fuji TV Results
<April 1, 2016 to September 30, 2016> Millions of yen

17売 上 高 営業利益 経常利益
0
200
400
600
800
1,000
1,200
1,400
1,600
2015.9月期 2016.9月期
146.6
23.0
123.5
144.1(2.4)
(1.7)%
Broadcasting117.4(4.9)%
Other businesses26.7
+15.7%
(20)
(10)
0
10
20
30
40
50
(1.0)
Forecast announced on May 12
2.5 2.3
(10)
0
10
20
30
40
50
(0.2)
Forecast announced on May 12
2.6 2.6
Operating income 1Q 2Q 1H
FY3/17 4.6 (2.3) 2.3FY3/16 3.6 (4.6) (1.0)
1H FY3/17 Fuji TV Results (Year-on-Year)
Billions of yen
Net Sales Operating Income Ordinary Income
160
140
120
100
80
60
40
20
5
4
3
2
1
(1)
(2)1H FY3/16 1H FY3/17
1H FY3/16 1H FY3/17
Billions of yen
5
4
3
2
1
(1)
1H FY3/17
1H FY3/16 1H FY3/17 1H FY3/17
Billions of yen Billions of yen

1H FY3/17 YoY
Broadcasting Business Revenues 117,447 (6,090) (4.9)%
Broadcasting 100,608 (6,490) (6.1)%
Network time 45,421 (4,260) (8.6)%
Local time 6,420 (520) (7.5)%
Spot 48,766 (1,709) (3.4)%
Other Broadcasting 16,838 399 2.4%
Program sales 8,648 (220) (2.5)%
CS broadcasting and Other 8,189 620 8.2%
Cost of Broadcasting Business 82,547 (5,456) (6.2)%18
Broadcasting Business: Revenues and CostMillions of yen

Industry Share
Last YearShare YoY
Cosmetic/Toiletries 14.2% 15.8% 5.5%
Information/Communications/Broadcasting
14.9% 13.1% (16.7)%
Beverage (Non-Alcoholic) 8.3% 8.6% (2.5)%
Foods 7.5% 8.5% 6.8%
Publications/Entertainment 7.7% 7.4% (8.7)%
Autos 6.6% 6.3% (9.6)%
Fast Foods/Services 6.6% 5.6% (19.7)%
Pharmaceuticals/ Medical Products
5.8% 5.6% (9.2)%
Finance/Insurance 4.6% 5.3% 7.8%
Industry Share
Last YearShare YoY
Distribution/Retail 3.2% 4.3% 26.5%
Apparel/Accessories 3.7% 3.2% (17.5)%
Real Estate/Housing 2.5% 3.1% 18.8%
Beverage (Alcoholic) 3.7% 2.9% (25.2)%
Precision/Optical Equipment 4.4% 2.8% (41.0)%
Travel/Leisure 3.0% 2.4% (23.2)%
Telephone Services 2.0% 2.0% (8.7)%
Consumer Electronics 0.9% 1.4% 44.2%
Energy/Machinery 0.0% 0.4% ―
Others 0.4% 1.5% 244.3%
19
Spot Advertising YoY Trend by Industry July – September 2016 *Administrative accounting base

1H FY3/16 1H FY3/17 YoY
1Q 22,206 21,599 (2.7)%
2Q 27,307 23,619 (13.5)%
1H 49,514 45,218 (8.7)%
3Q 22,881
4Q 20,840
2H 43,722
Full Year 93,236
20
Production CostsMillions of yen
* Direct costs of in-house production and program purchases

1H FY3/17 YoY
Other Businesses Revenues 26,718 3,626 15.7%
Event 12,060 4,499 59.5%
Movie 4,959 366 8.0%
Digital 3,642 (280) (7.2)%
Merchandising 2,721 (434) (13.8)%
Video 1,141 (513) (31.0)%
Other 2,192 (11) (0.5)%
Cost of Other Businesses 21,763 1,960 9.9%21
Other Businesses: Revenues and CostMillions of yen

1H FY3/17 YoY
SG&A 37,548 (2,290) (5.7)%
Selling expenses 26,490 (1,908) (6.7)%
General and administrative expenses 11,057 (382) (3.3)%
Operating Expenses 141,859 (5,786) (3.9)%
Operating Income 2,305 3,322 ―
Non-operating income 509 (439) (46.3)%
Non-operating expenses 144 8 6.1%
Ordinary Income 2,670 2,874 ―
22
SG&A and Non-Operating Income and ExpensesMillions of yen

FY3/17 Earnings Forecasts

Highlights of Revision to FY3/17 Earnings Forecast
No change in full-year operating income forecast of ¥27.2 billion
Fuji TVFuji TV Urban Development (Sankei Building/GRANVISTA)Urban Development (Sankei Building/GRANVISTA)
(2,500)
+100
Revision to Full-Year Operating Income Forecast(Comparison with Previous Forecast)
+200±0 ±0
Sankei BuildingStrong results expected for office leasing, residential, and asset development businesses
GRANVISTASteady contribution to earnings expected, continued high rate of hotel occupancy
Broadcast revenue forecast revised downward Other businesses expected to contribute to full-
year results beyond initial forecast Continue effective cost management
Lowered
Raised+2,000
±0
Forecasts for Fuji TV revised downward, with upward revisions for the Urban Development, Life Information, and Video and Music segments
Video and music
Broadcasting
Production Life information
Urban development
Advertising Other
Millions of yen
24

YoY 2H Forecast Previous Forecast Full-Year Forecast Previous
Forecast
Network Time (4.1)% 0.3% (6.4)% (3.0)%
Local Time (7.9)% (7.9)% (7.7)% (8.6)%
Spot 2.0% 4.2% (0.6)% 2.3%
Total Broadcasting Revenues (1.2)% 1.8% (3.7)% (0.8)%
Consolidated Revised Forecast Previous Forecast Change
Net Sales 663,200 670,500 (7,300)
Operating Income 27,200 27,200 0
Ordinary Income 34,400 33,000 1,400Net Income Attributable to Owners of the Parent 24,500 23,000 1,500
Fuji TV Revised Forecast Previous Forecast Change
Net Sales 288,300 294,200 (5,900)
Operating Income 7,500 10,000 (2,500)
Ordinary Income 7,900 10,100 (2,200)
Net Income 4,900 6,400 (1,500)
25
Revision to FY3/17 Earnings ForecastsMillions of yen

Business SegmentTotal Adjust
-mentConsolidatedstatement ofincome
Broad-casting
Produc-tion
VideoandMusic
LifeInforma-tion
Advertis-ing
UrbanDevelop-ment
Other
Net Sales
Revised forecast 318,200 48,900 50,300 135,100 43,000 103,800 28,500 727,800 (64,600) 663,200
Previousforecast 323,100 50,600 54,100 137,500 43,000 101,900 26,100 736,300 (65,800) 670,500
Change (4,900) (1,700) (3,800) (2,400) 0 1,900 2,400 (8,500) ― (7,300)
Operat-ing
Income
Revised forecast 10,100 1,900 1,800 1,800 400 10,500 700 27,200 0 27,200
Previousforecast 12,600 1,900 1,700 1,600 400 8,500 700 27,400 (200) 27,200
Change (2,500) 0 100 200 0 2,000 0 (200) ― 0
26
Revision to FY3/17 Segment Forecasts
<April 1, 2016 to March 31, 2017> Millions of yen

FY3/17FY3/18(Plan)1H
(Actual)Full-Year
(Plan)
CAPEX
Consolidated 19,723 45,200 51,300Fuji TV 2,120 6,700 11,500Urban Development 14,914 33,000 36,700
Fuji Media HD 56 500 500
Depreciation and
amortization
Consolidated 9,067 19,600 21,000Fuji TV 3,840 8,800 9,200Urban Development 2,439 4,800 5,900
Fuji Media HD 1,137 2,400 2,400
27
CAPEX Plan and Depreciation and AmortizationMillions of yen

16 18
36
44 40 40 40 40
0
10
20
30
40
50
FY3/10 FY3/11 FY3/12 FY3/13 FY3/14 FY3/15 FY3/16 FY3/17(Forecast)
28
FY3/17 Annual Dividends ¥40 (Forecast, No Revision)
Guiding principle of stable dividend based on a 40% target payout ratio
Shareholder Returns
Yen
Note: Fuji Media Holdings adopted the unit share system, and implemented a share split at the ratio of 100 shares for each share of common stock, effective October 1, 2013. Previous dividend figures have been calculated with the number of shares following the split.

Business Measures by Company
30
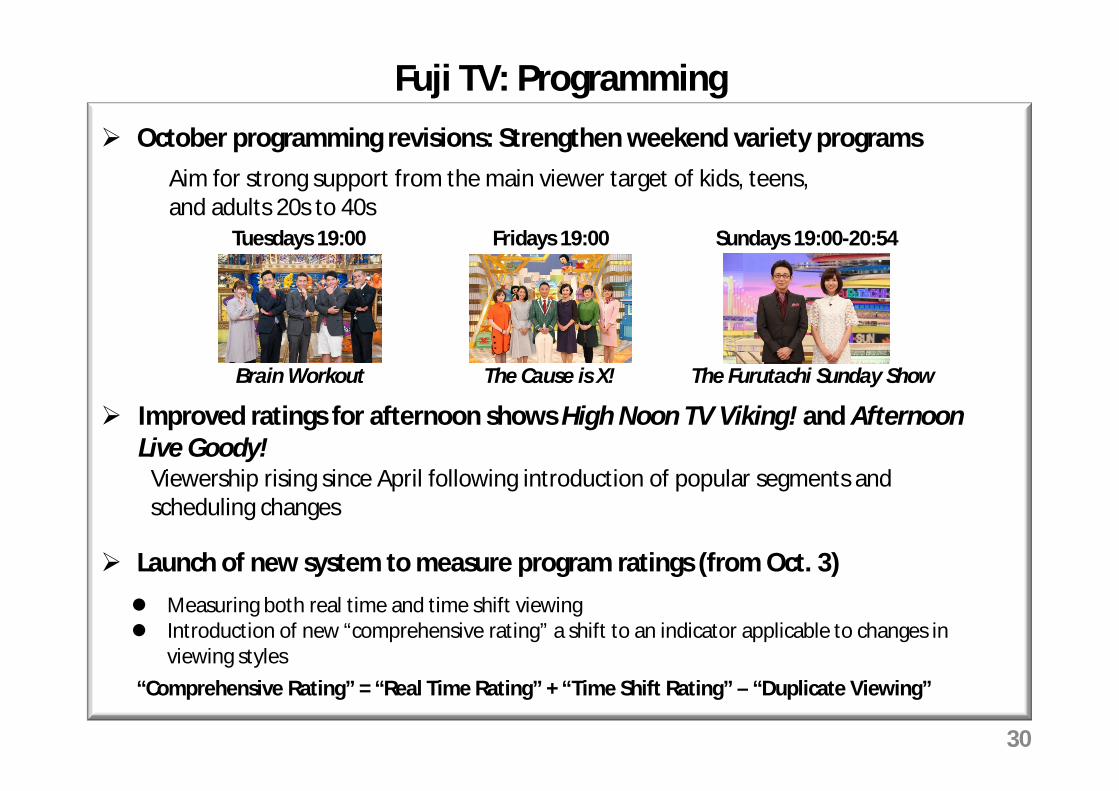
Improved ratings for afternoon shows High Noon TV Viking! and Afternoon Live Goody!
October programming revisions: Strengthen weekend variety programsAim for strong support from the main viewer target of kids, teens, and adults 20s to 40s
The Furutachi Sunday Show
Sundays 19:00-20:54Tuesdays 19:00
Brain Workout
Fridays 19:00
The Cause is X!
Launch of new system to measure program ratings (from Oct. 3) Measuring both real time and time shift viewing Introduction of new “comprehensive rating” a shift to an indicator applicable to changes in
viewing styles“Comprehensive Rating” = “Real Time Rating” + “Time Shift Rating” – “Duplicate Viewing”
Fuji TV: Programming
Viewership rising since April following introduction of popular segments and scheduling changes

Release in-house productions on streaming platforms and other outletsAim to gain stable earnings
Movie Business Expectations for strong lineup in 2H
Oct. 8Good Morning ShowLatest work from director and screenwriter Ryoichi Kimizuka of the Bayside Shakedown filmsMajor hit now playing
Dec. 23THE MOLE SONG -Hong Kong Capriccio- (provisional title)Second movie adaptation of the popular comic; previous movie recorded ¥2.19bn in box office revenue
Jan. 14HONNOJI HOTEL (provisional title)An original historical thriller based on the Honno-ji Incident, one of the biggest mysteries from Japanese history
Feb. 11Survival FamilyLatest film from director Shinobu Yaguchi, producer of Water Boys and many other major hits
Mar. 24Daytime Shooting Star (provisional title)Live-action film version of the popular girls’ comic that sold more than 1.7 million copies
Event Business Cirque du Soleil’s TOTEM
Successive performances scheduled for Nagoya, Fukuoka, and Sendai (through May 2017)
Detroit Institute of Arts Exhibition: European Masterworks from Across the Atlantic Ocean
Positive start to the Tokyo exhibition
31
Performances in Tokyo and OsakaMajor hit with total attendance of 868,500
Tokyo: Feb. 19-20, 2017Osaka: Feb. 25-26, 2017
Oct. 7, 2016 to Jan. 21, 2017
Nitro Circus 10th Anniversary TourAction and sports entertainment generating excitement and enthusiasm around the worldEven more thrilling than previous performance
THE MOLE SONG -Hong Kong Capriccio- (provisional title)
HONNOJI HOTEL(provisional title)
Survival Family
Fuji TV: Non-Broadcasting Business
32
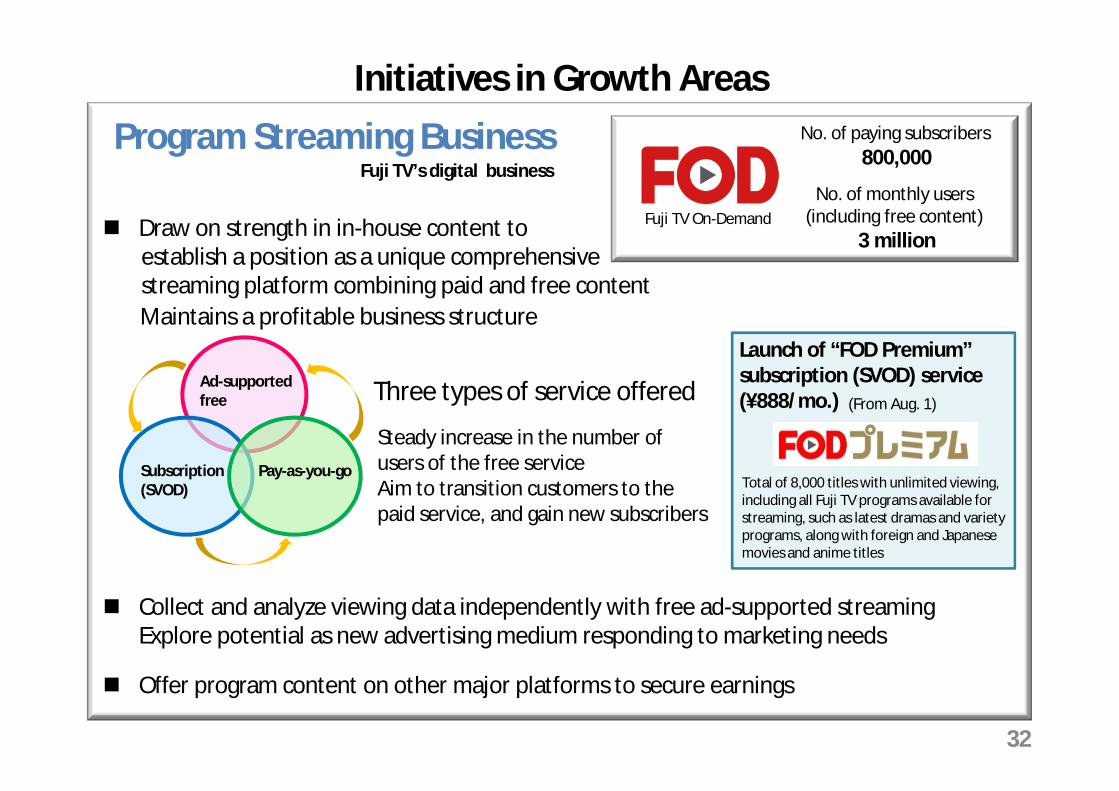
Program Streaming BusinessFuji TV’s digital business
Maintains a profitable business structure
Offer program content on other major platforms to secure earnings
Draw on strength in in-house content to establish a position as a unique comprehensivestreaming platform combining paid and free content
Collect and analyze viewing data independently with free ad-supported streamingExplore potential as new advertising medium responding to marketing needs
Three types of service offeredAd-supported free
Subscription (SVOD)
Pay-as-you-go
Steady increase in the number of users of the free serviceAim to transition customers to the paid service, and gain new subscribers
Launch of “FOD Premium” subscription (SVOD) service (¥888/mo.) (From Aug. 1)
Initiatives in Growth AreasNo. of paying subscribers
800,000
No. of monthly users (including free content)
3 millionFuji TV On-Demand
Total of 8,000 titles with unlimited viewing, including all Fuji TV programs available for streaming, such as latest dramas and variety programs, along with foreign and Japanese movies and anime titles

33
Game Business Fuji Games, Inc. (Established in Apr. 2016)
As a game company originating from a broadcaster, draw on expertise in planning/production, promotional tie-ins, and other functions to develop major games
Fuji Media HD
New CompanyFuji Games, Inc.
Inherited Fuji TV’s game business
THERMAE ROMAE
GeGeGe no Kitaro-Yokai Yokocho
Aim to expand earnings through multifaceted development
For Whom the Alchemist
Shinobi Nightmare
Fuji&gumi Games
Development of app games proceeding• Latest game “PROJECT CHRONUS” started
Collaboration with Marvelous Inc., Release planned for summer 2017
EventsAnimeComics
Toshl Café Customer is Matayoshi! - Journey to Create Discerning Dishes
Terrestrial and satellite broadcasts, and available FOD (free on demand)
Derby Road presented by Minna no Keiba
Three popular titles currently available
Reputation creation through special TV programming
Intellectual
Development
Intellectual Property
Development
MusicGoods
BroadcastingStreaming
Regular program also launched• Development begun on other major titles
Game information variety programKayoko no Heya – Late-Night Game Meeting
ekimemo!-station memories
Initiatives in Growth Areas
“Other Business” segment
Phantom of the Kill
Other games

BroadcastingBS Fuji
BroadcastingBS Fuji
Continue to effectively manage production costs
Strengthen timetable to expand broadcast income
34
Popular quiz program made a weekday evening regular program
Positive start for sales of new regular programs
New prime time regular program in an expanded broadcast slot
Video and Music Pony Canyon
Video and Music Pony Canyon
Investment from the production stage
Multifaceted development, including live events and sales of goods
Participate in production of popular works such as anime, and gain a broad range of rightsDiversify revenue streams, including TV broadcasts, cinema movies, events, online streaming, merchandizing, and overseas business
Ace of Diamond
Optimize scope of package (CD, DVD) releases, and ensure effective management
KUROMUKUROIn-house production
Global streaming via major platform
Saturdays 21:00 to 21:55Prime News SUPERNew Saturday program derived from anchor program BS Fuji LIVE Prime News
Mondays to Thursdays 22:00 to 22:55
Cultivate new viewer segment
A Silent Voice: The MovieSept. 17 released
Investment from the production stage
Blu-ray/DVD sales planned
Gain earnings over the long term
Major Subsidiaries excl. Fuji TV
Shift to a business structure that does not rely only on packages
Quiz! Brain Bell SHOW

Life InformationDinos Cecile
Life InformationDinos Cecile
35
Urban Development Sankei Building/GRANVISTA
Urban Development Sankei Building/GRANVISTA
Hotel Resort Business
1H earnings exceeded forecasts in the building, residential, asset development, and hotel resort businesses
Building Business/Residential Business
Develop mid-sized hotels in central areas of major citiesAim to capture growing hotel and tourism demand, and achieve high growth
GRANVISTA: Maintain high occupancy rate at major hotels
Develop highly functional office buildings and leased residences, concentrating on prime urban areasExpand and stabilize the earnings base
Aim for advancements in the business model to support future growth
Success in lowering costs, and effective sales promotions
[Dinos Business]
[Cecile Business]
Improve the earnings structure with stronger inventory controls, and revisions to unprofitable catalogues
TV shopping business continues to be strong, boosting revenue
Accelerate to strengthen ecommerce
Steady sales of mainstay products such as ladies’ innerwear
Earnings gain on contributions from the Dinos TV shopping business, and Cecilebusiness
Major Subsidiaries excl. Fuji TV
P. 31: Photos: OSA Images, Matt Beard Costumes: Kym Barrett © 2010, 2014 Cirque du Soleil © 2015 Fuji TelevisionP. 31: Self Portrait of Vincent Willem van Gogh 1887 Oil on artist board, mounted to wood panel City of Detroit Purchase P. 31: Photo courtesy of Nitro CircusP. 31: © 2016 Fuji Television, Shogakukan, J Storm, Toho, OLMP. 31: © Noboru Takahashi, ShogakukanP. 31: © 2017 Fuji Television, Toho, HoriProP. 31: © 2017 Fuji Television, Toho, Dentsu, ALTAMIRA PICTURESP. 33: © Fuji Games/Alt Plus inc.P. 33: © Fuji Television/Fuji GamesP. 33: © Fuji&gumi GamesP. 34: © KUROMUKURO Production CommitteeP. 34: © Yuji Terashima, Kodansha/ Ace of Diamond Production Committee, TV TokyoP. 34: © Yoshitoki Oima, Kodansha/ A Silent Voice: The Movie Production Committee
36