1q 2008 earnings presentation - ibm › investor › att › pdf ›...
TRANSCRIPT
www.ibm.com/investor
�
1Q 2008 Earnings PresentationApril 16, 2008
2www.ibm.com/investor
Forward Looking StatementsForward Looking Statements
Certain comments made in this presentation may be characterized as forward looking under the Private Securities Litigation Reform Act of 1995.
Those statements involve a number of factors that could cause actual results to differ materially.
Additional information concerning these factors is contained in the Company's filings with the SEC. Copies are available from the SEC, from the IBM web site, or from IBM Investor Relations.
These charts and the associated remarks and comments are integrally related, and are intended to be presented and understood together.
3www.ibm.com/investor
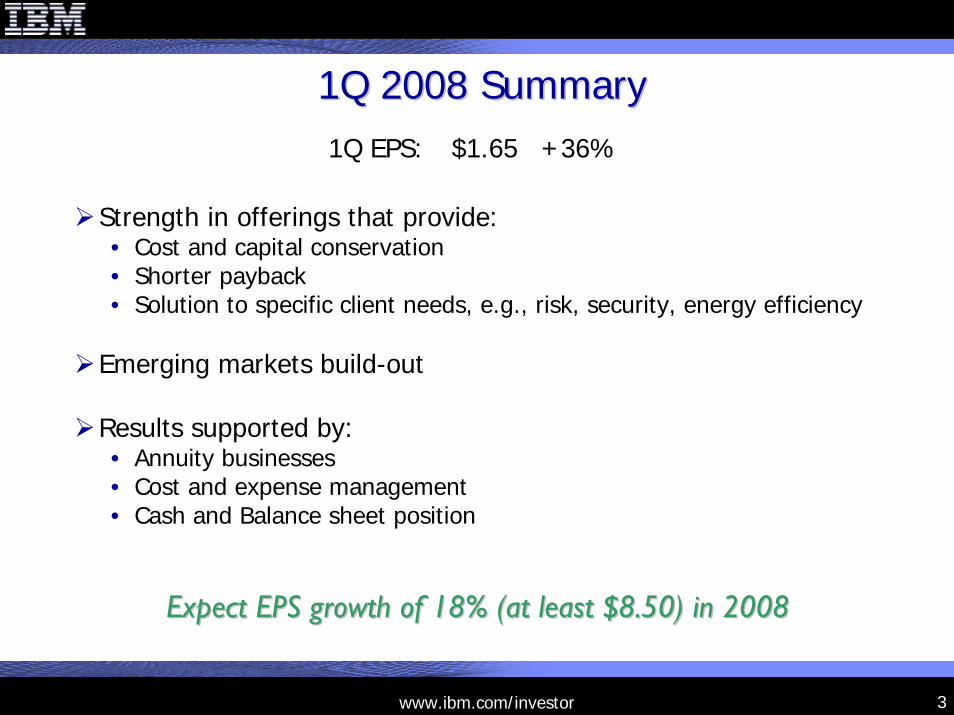
1Q 2008 Summary1Q 2008 Summary
Strength in offerings that provide:• Cost and capital conservation• Shorter payback• Solution to specific client needs, e.g., risk, security, energy efficiency
Emerging markets build-out
Results supported by:• Annuity businesses• Cost and expense management• Cash and Balance sheet position
1Q EPS: $1.65 +36%
Expect EPS growth of 18% (at least $8.50) in 2008Expect EPS growth of 18% (at least $8.50) in 2008
4www.ibm.com/investor
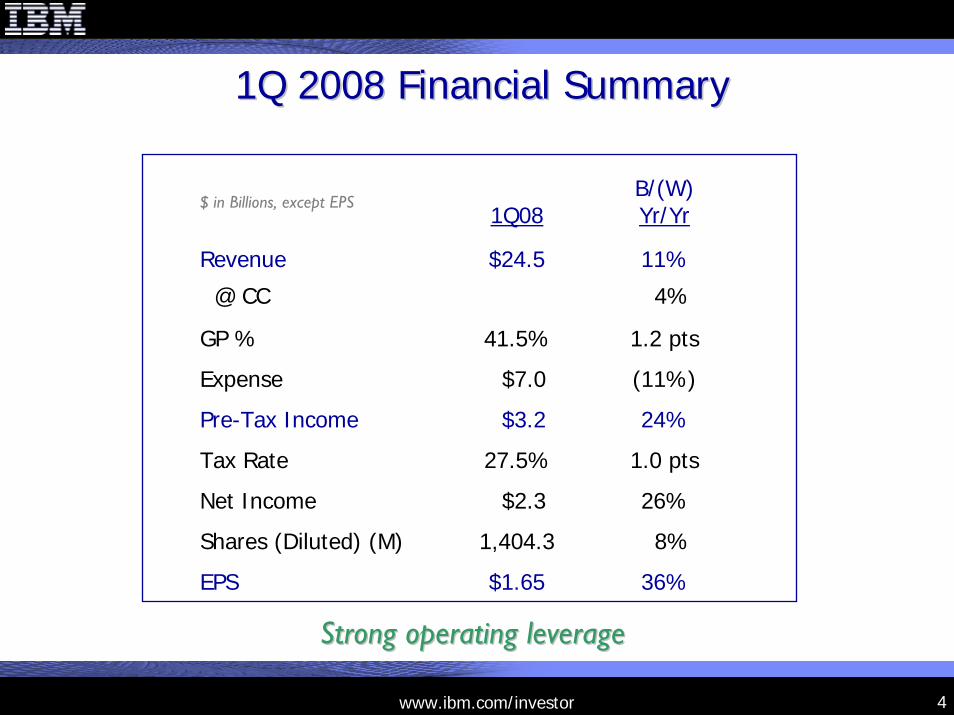
1Q 2008 Financial Summary1Q 2008 Financial Summary
1Q08B/(W)Yr/Yr
Revenue $24.5 11%
@ CC 4%
GP % 41.5% 1.2 pts
Expense $7.0 (11%)
Pre-Tax Income $3.2 24%
Tax Rate 27.5% 1.0 pts
Net Income $2.3 26%
Shares (Diluted) (M) 1,404.3 8%
EPS $1.65 36%
$ in Billions, except EPS
Strong operating leverageStrong operating leverage
5www.ibm.com/investor
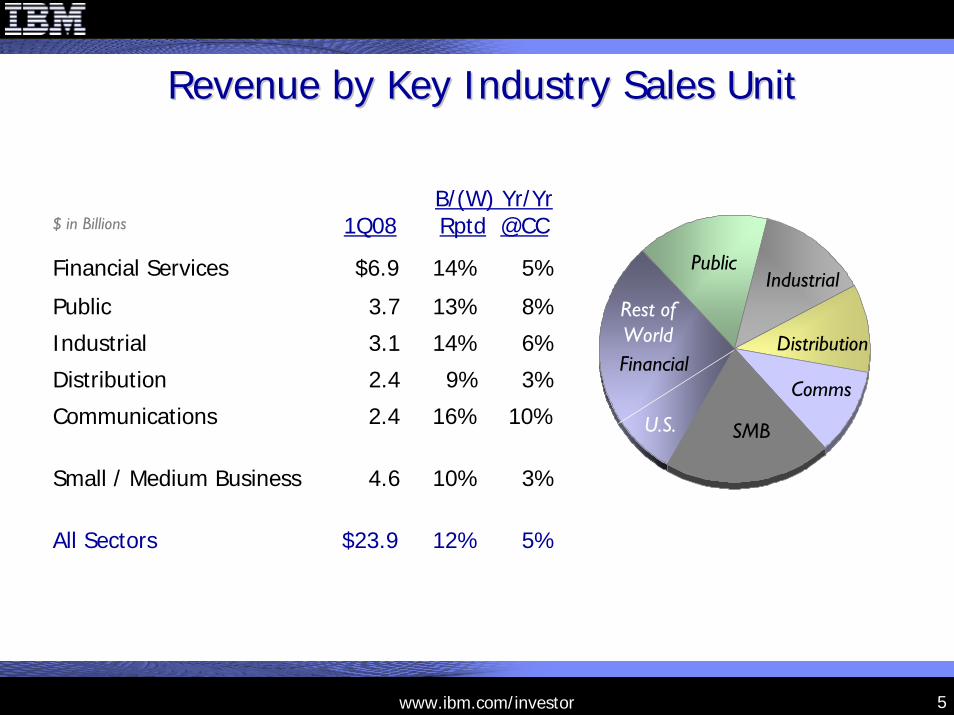
1Q08B/(W) Yr/Yr Rptd @CC
Financial Services $6.9 14% 5%
Public 3.7 13% 8%
Industrial 3.1 14% 6%
Distribution 2.4 9% 3%
Communications 2.4 16% 10%
Small / Medium Business 4.6 10% 3%
All Sectors $23.9 12% 5%
Revenue by Key Industry Sales UnitRevenue by Key Industry Sales Unit
$ in Billions
Financial
SMB
Comms
Distribution
Industrial Public
Rest of World
U.S.
6www.ibm.com/investor
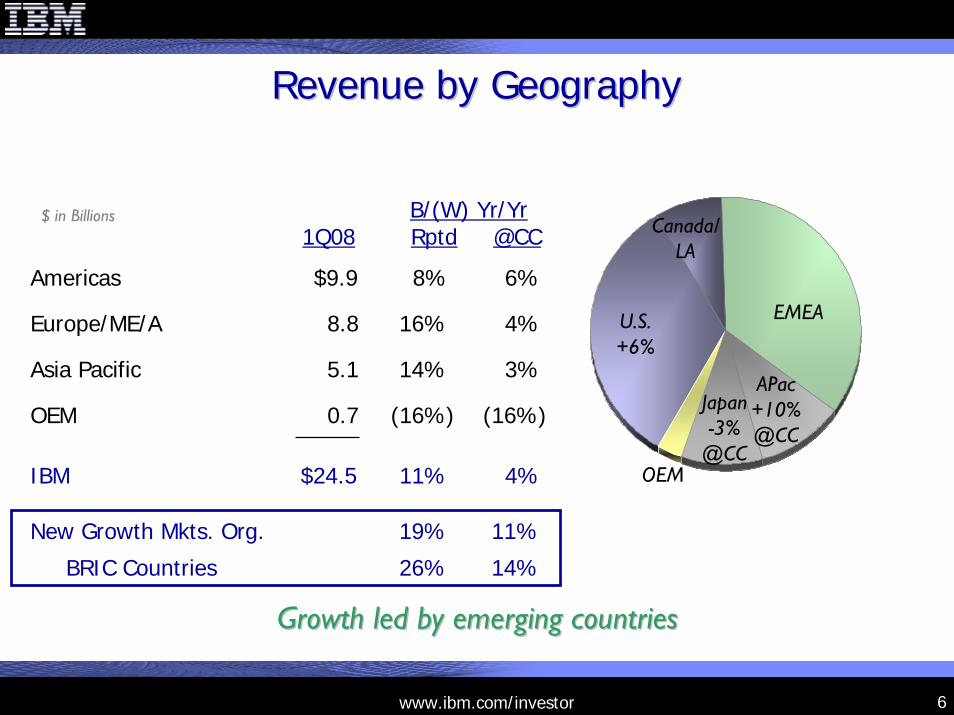
Revenue by GeographyRevenue by Geography
1Q08B/(W) Yr/Yr Rptd @CC
Americas $9.9 8% 6%
Europe/ME/A 8.8 16% 4%
New Growth Mkts. Org. 19% 11%
BRIC Countries 26% 14%
OEM 0.7 (16%) (16%)
IBM $24.5 11% 4%
Asia Pacific 5.1 14% 3%
Growth led by emerging countriesGrowth led by emerging countries
$ in Billions
APac+10% @CC
OEM
U.S. +6%
EMEA
Canada/ LA
Japan-3%
@CC
7www.ibm.com/investor
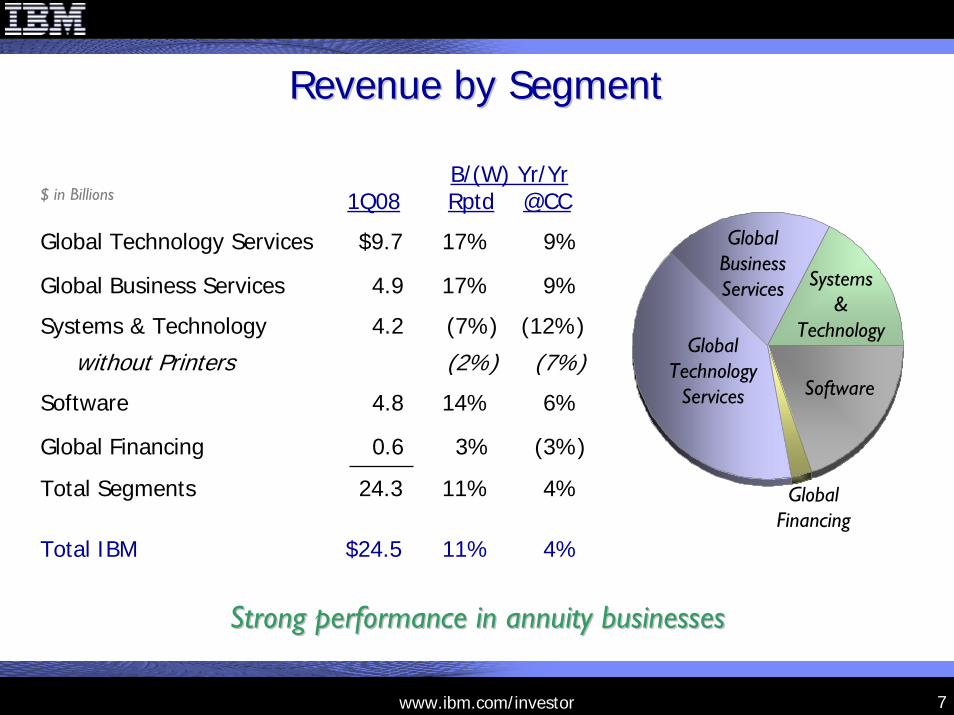
Revenue by SegmentRevenue by Segment
1Q08B/(W) Yr/Yr Rptd @CC
Global Technology Services $9.7 17% 9%
Global Business Services 4.9 17% 9%
Systems & Technology 4.2 (7%) (12%)
without Printers (2%) (7%)
Software 4.8 14% 6%
Global Financing 0.6 3% (3%)
Total Segments 24.3 11% 4%
Total IBM $24.5 11% 4%
$ in Billions
Strong performance in annuity businessesStrong performance in annuity businesses
Global Technology
Services
Global Business Services Systems
& Technology
Software
Global Financing
8www.ibm.com/investor
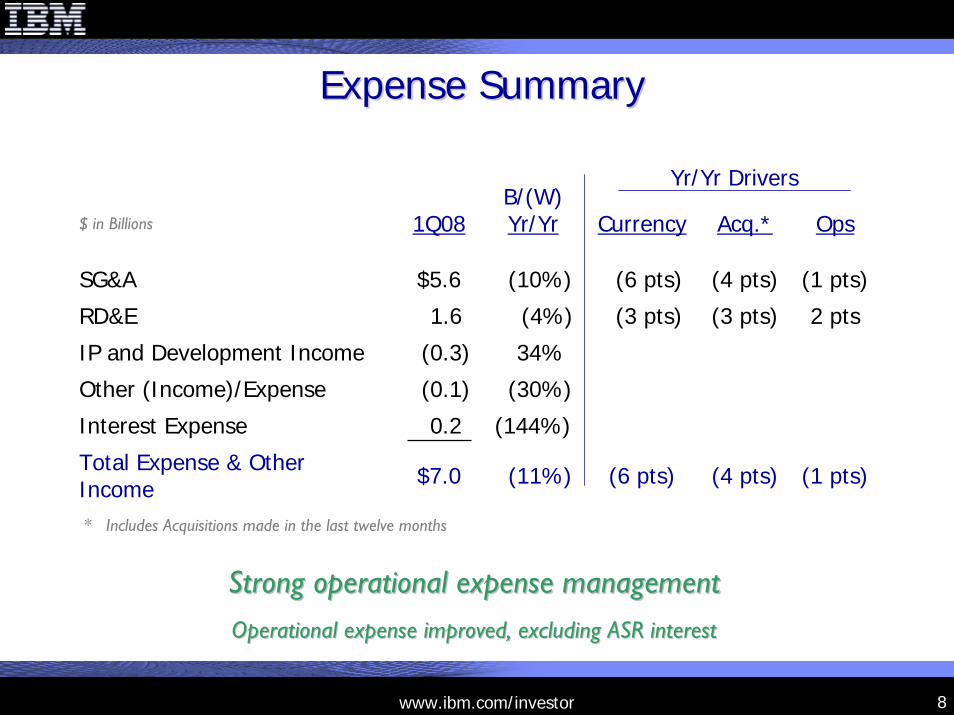
Expense SummaryExpense Summary
1Q08B/(W)Yr/Yr Currency Acq.* Ops
(1 pts)
2 pts
(1 pts)
SG&A $5.6 (10%) (6 pts) (4 pts)
RD&E 1.6 (4%) (3 pts) (3 pts)
IP and Development Income (0.3) 34%
Other (Income)/Expense (0.1) (30%)
Interest Expense 0.2 (144%)
Total Expense & Other Income $7.0 (11%) (6 pts) (4 pts)
* Includes Acquisitions made in the last twelve months
$ in Billions
Yr/Yr Drivers
Strong operational expense managementStrong operational expense management
Operational expense improved, excluding ASR interestOperational expense improved, excluding ASR interest
9www.ibm.com/investor
1Q08B/(W)
Yr/Yr Pts 1Q08B/(W)
Yr/Yr Pts
9.8% 2.0 pts
0.7 pts
1.3 pts
1.6 pts
(0.7 pts)
1.7 pts
1.3 pts
11.2%
3.3%
23.0%
38.1%
12.9%
13.1%
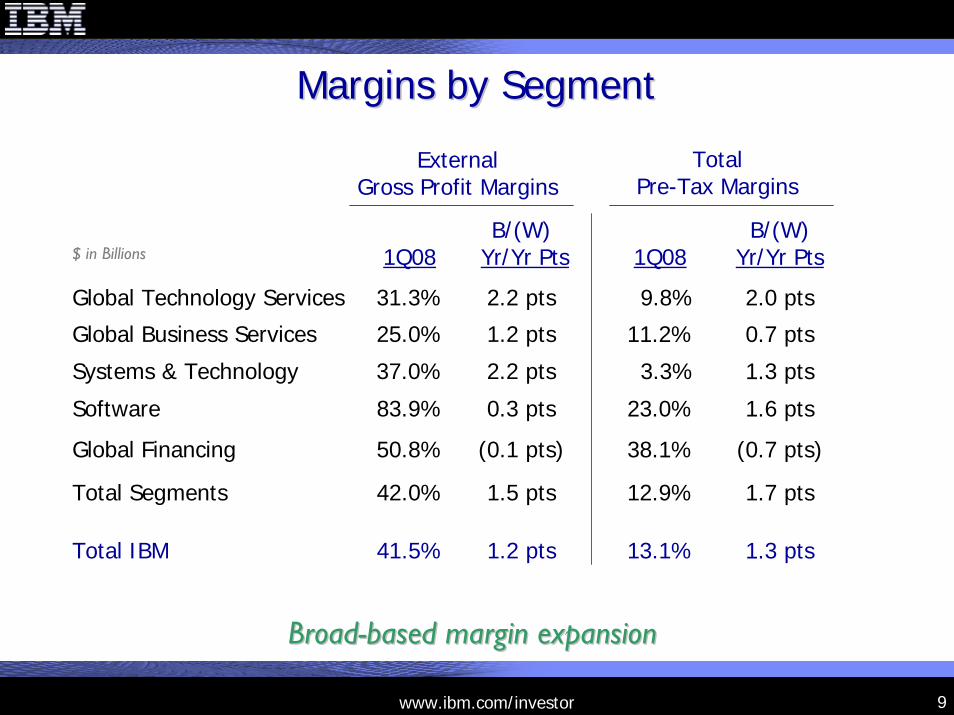
Global Technology Services 31.3% 2.2 pts
Global Business Services 25.0% 1.2 pts
Systems & Technology 37.0% 2.2 pts
Software 83.9% 0.3 pts
Global Financing 50.8% (0.1 pts)
Total Segments 42.0% 1.5 pts
Total IBM 41.5% 1.2 pts
Margins by SegmentMargins by Segment
$ in Billions
External Gross Profit Margins
Total Pre-Tax Margins
BroadBroad--based margin expansionbased margin expansion
10www.ibm.com/investor
B/(W) Yr/Yr
1Q08 Rptd @CC
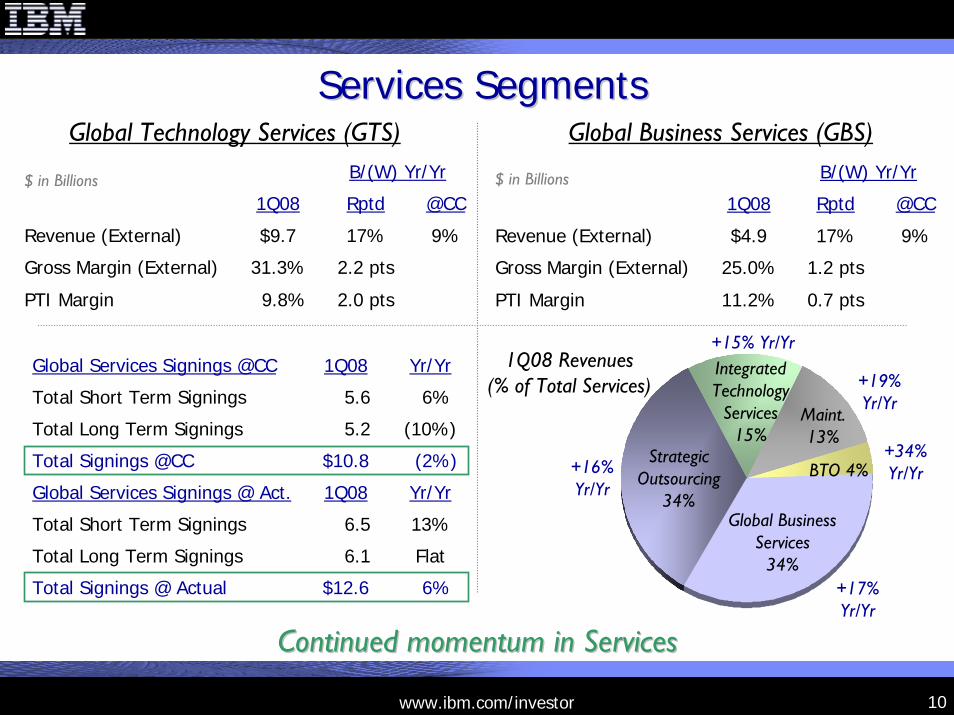
Revenue (External) $9.7 17% 9%
Gross Margin (External) 31.3% 2.2 pts
PTI Margin 9.8% 2.0 pts
B/(W) Yr/Yr
1Q08 Rptd @CC
Revenue (External) $4.9 17% 9%
Gross Margin (External) 25.0% 1.2 pts
PTI Margin 11.2% 0.7 pts
Services SegmentsServices Segments
Strategic Outsourcing
34% Global Business
Services 34%
Integrated Technology
Services 15%
Maint. 13%
BTO 4%
$ in Billions
Global Technology Services (GTS) Global Business Services (GBS)
Continued momentum in ServicesContinued momentum in Services
1Q08 Revenues (% of Total Services)
+16% Yr/Yr
+17% Yr/Yr
+34% Yr/Yr
+19% Yr/Yr
+15% Yr/YrGlobal Services Signings @CC
$ in Billions
1Q08 Yr/Yr
Total Long Term Signings 5.2 (10%)
Total Signings @CC $10.8 (2%)
Global Services Signings @ Act. 1Q08 Yr/Yr
Total Short Term Signings 6.5 13%
Total Long Term Signings 6.1 Flat
Total Signings @ Actual $12.6 6%
Total Short Term Signings 5.6 6%
11www.ibm.com/investor
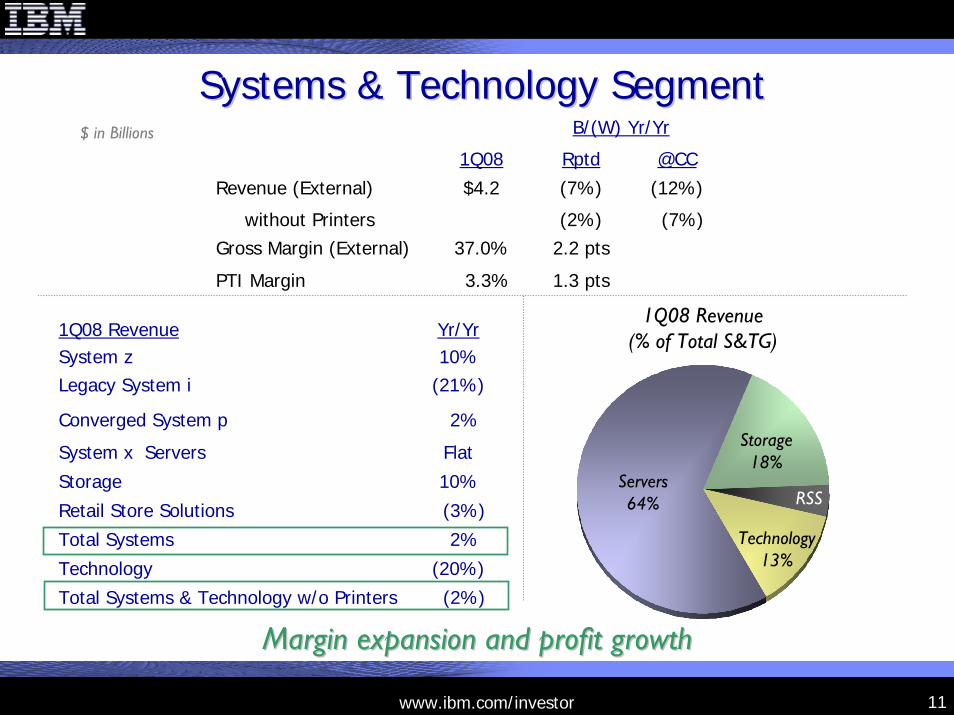
Systems & Technology SegmentSystems & Technology SegmentB/(W) Yr/Yr
1Q08 Rptd @CC
without Printers (2%) (7%)
Revenue (External) $4.2 (7%) (12%)
Gross Margin (External) 37.0% 2.2 pts
PTI Margin 3.3% 1.3 pts
$ in Billions
1Q08 Revenue Yr/Yr
System x Servers Flat
Storage 10%
Retail Store Solutions (3%)
Total Systems 2%
Technology (20%)
Total Systems & Technology w/o Printers (2%)
System z 10%Legacy System i (21%)
Converged System p 2%
1Q08 Revenue(% of Total S&TG)
Servers 64%
Storage 18%
Technology 13%
RSS
Margin expansion and profit growthMargin expansion and profit growth
12www.ibm.com/investor
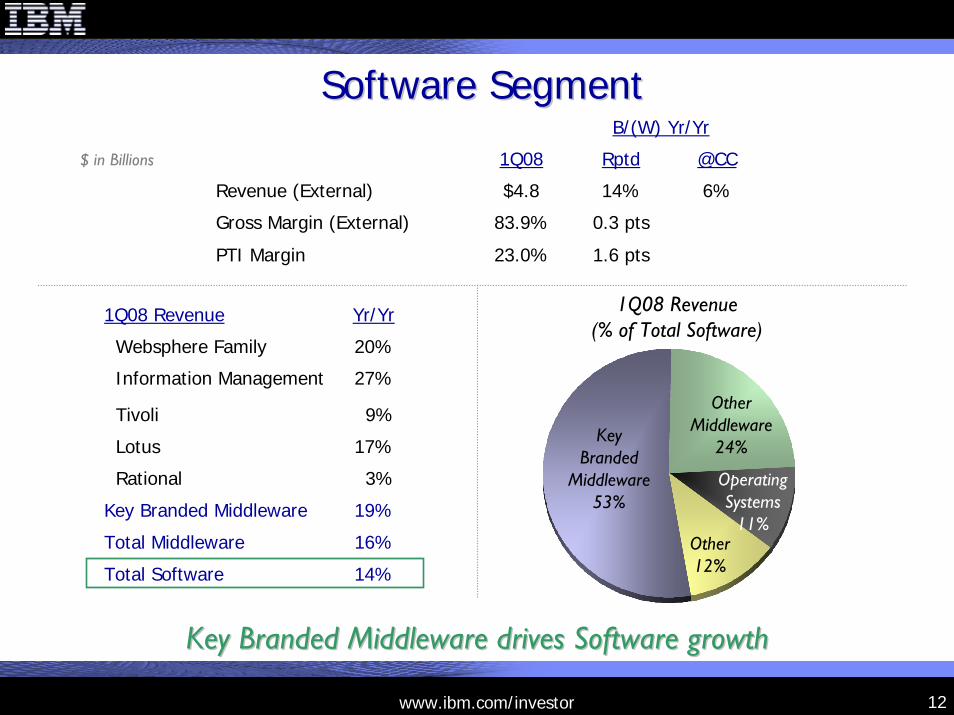
Software SegmentSoftware SegmentB/(W) Yr/Yr
1Q08 Rptd @CC
Revenue (External) $4.8 14% 6%
Gross Margin (External) 83.9% 0.3 pts
PTI Margin 23.0% 1.6 pts
1Q08 Revenue Yr/Yr
Lotus 17%
Rational 3%
Key Branded Middleware 19%
Total Middleware 16%
Total Software 14%
Websphere Family 20%
Information Management 27%
Tivoli 9%
Key Branded Middleware drives Software growthKey Branded Middleware drives Software growth
1Q08 Revenue (% of Total Software)
Key Branded
Middleware 53%
Operating Systems
11%
Other Middleware
24%
Other 12%
$ in Billions
13www.ibm.com/investor
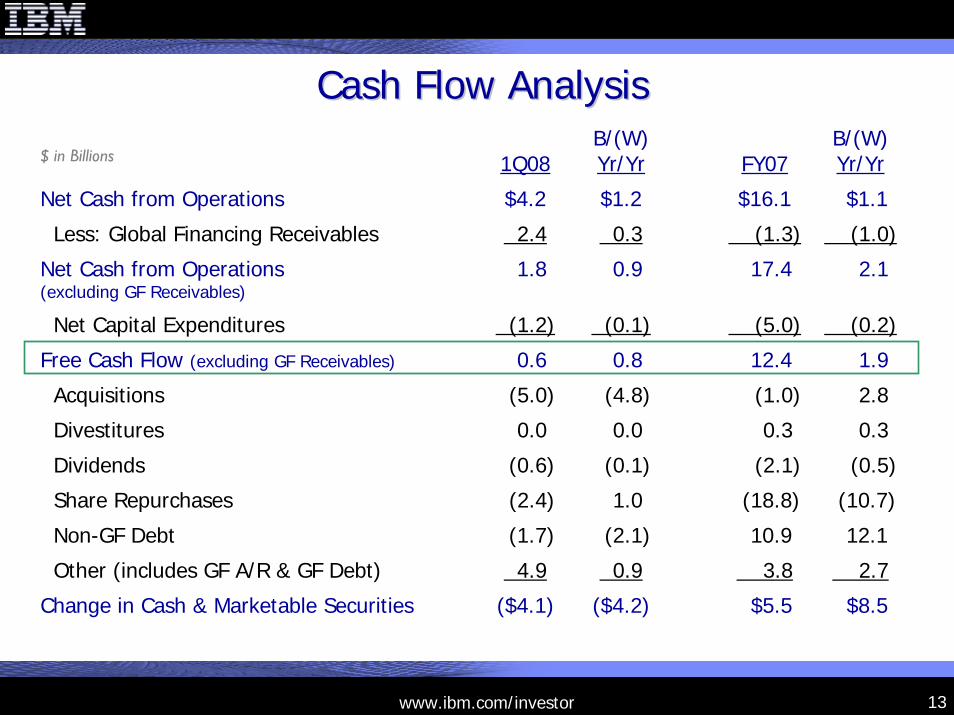
Cash Flow AnalysisCash Flow Analysis
1Q08B/(W)Yr/Yr FY07
B/(W)Yr/Yr
$16.1 $1.1
(1.0)
2.1
(0.2)
1.9
2.8
0.3
(0.5)
(10.7)
12.1
2.7
Change in Cash & Marketable Securities ($4.1) ($4.2) $5.5 $8.5
(1.3)
17.4
(5.0)
12.4
(1.0)
0.3
(2.1)
(18.8)
10.9
3.8
Net Capital Expenditures (1.2) (0.1)
Free Cash Flow (excluding GF Receivables) 0.6 0.8
Acquisitions (5.0) (4.8)
Divestitures 0.0 0.0
Dividends (0.6) (0.1)
Share Repurchases (2.4) 1.0
Non-GF Debt (1.7) (2.1)
Other (includes GF A/R & GF Debt) 4.9 0.9
Net Cash from Operations $4.2 $1.2
Less: Global Financing Receivables 2.4 0.3
Net Cash from Operations (excluding GF Receivables)
1.8 0.9
$ in Billions
14www.ibm.com/investor
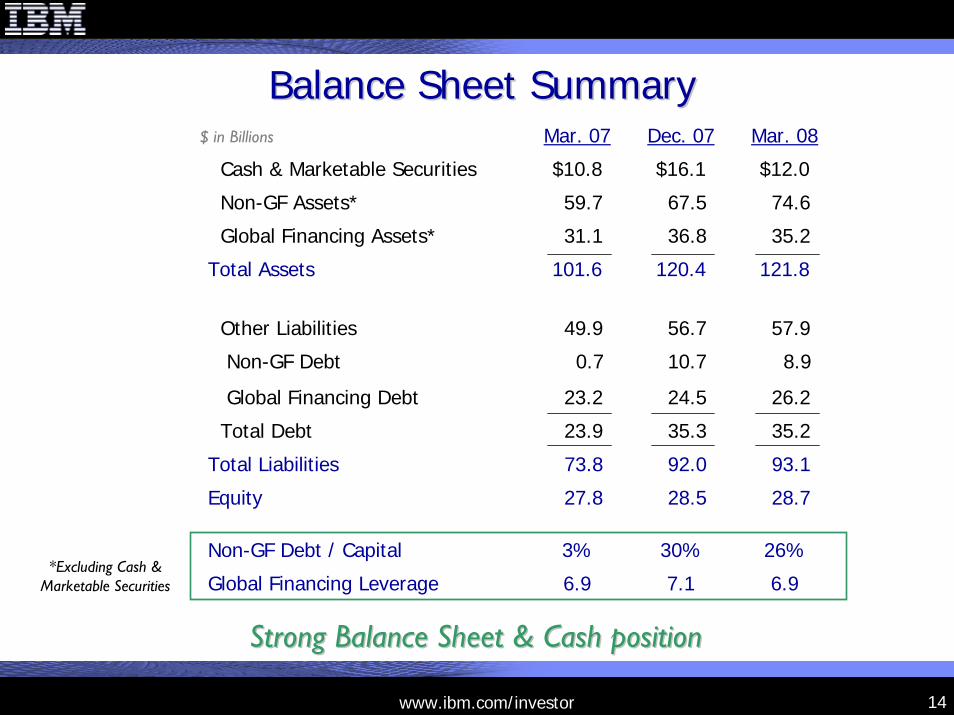
Mar. 07 Dec. 07 Mar. 08
$16.1
67.5
36.8
120.4
56.7
10.7
24.5
35.3
92.0
28.5
30%
7.1
$12.0
74.6
35.2
121.8
57.9
Non-GF Debt 0.7 8.9
Global Financing Debt 23.2 26.2
Total Debt 23.9 35.2
Total Liabilities 73.8 93.1
Equity 27.8 28.7
26%
Global Financing Leverage 6.9 6.9
Total Assets 101.6
Other Liabilities 49.9
Non-GF Debt / Capital 3%
Cash & Marketable Securities $10.8
Non-GF Assets* 59.7
Global Financing Assets* 31.1
Balance Sheet SummaryBalance Sheet Summary$ in Billions
Strong Balance Sheet & Cash positionStrong Balance Sheet & Cash position
*Excluding Cash & Marketable Securities
15www.ibm.com/investor
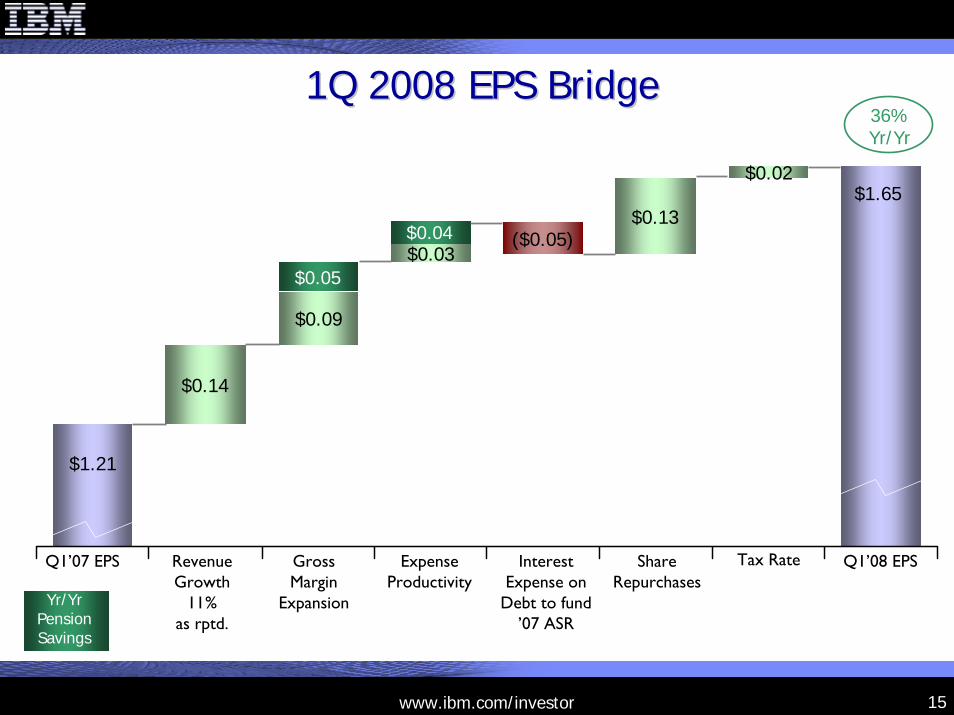
$0.09
$0.02$1.65
$1.21
$0.03
$0.14
$0.13($0.05)
1Q 2008 EPS Bridge1Q 2008 EPS Bridge
Q1’07 EPS Revenue Growth
11% as rptd.
Gross Margin
Expansion
Expense Productivity
Share Repurchases
Q1’08 EPS
36% Yr/Yr
Tax Rate
$0.05
$0.04
Yr/Yr Pension Savings
Interest Expense on
Debt to fund ’07 ASR
16www.ibm.com/investor
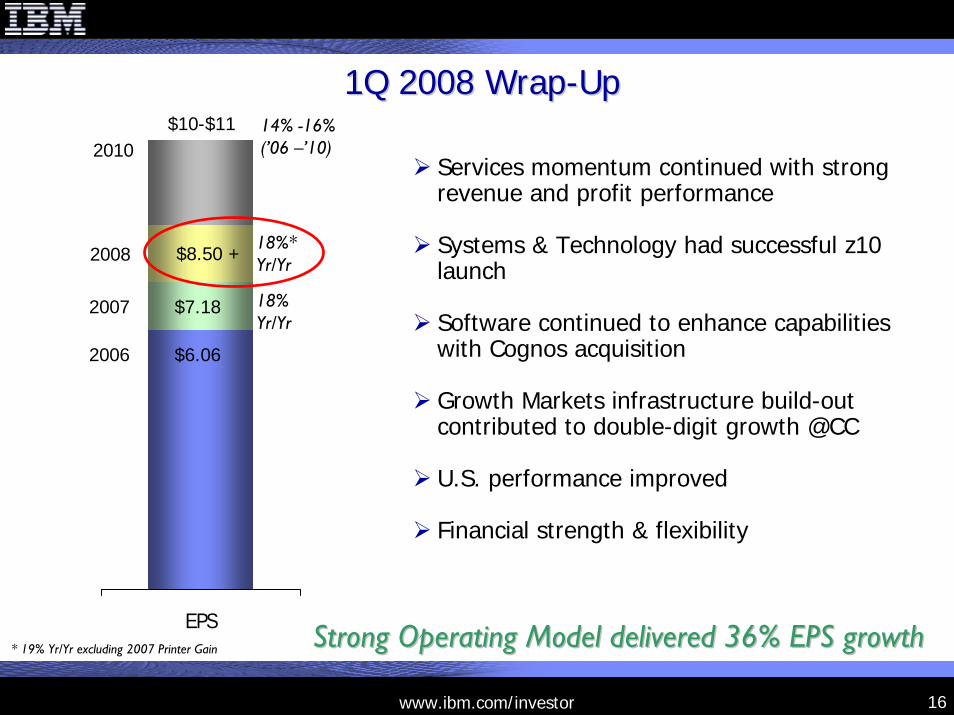
1Q 2008 Wrap1Q 2008 Wrap--UpUp
EPS
2006
2010
$6.06
$10-$11
2007 $7.18 18% Yr/Yr
2008 $8.50 +18%* Yr/Yr
14% -16% (’06 –’10)
* 19% Yr/Yr excluding 2007 Printer Gain
Services momentum continued with strong revenue and profit performance
Systems & Technology had successful z10 launch
Software continued to enhance capabilities with Cognos acquisition
Growth Markets infrastructure build-out contributed to double-digit growth @CC
U.S. performance improved
Financial strength & flexibility
Strong Operating Model delivered 36% EPS growthStrong Operating Model delivered 36% EPS growth
17www.ibm.com/investor
18www.ibm.com/investor
Supplemental MaterialsSupplemental Materials
Supplemental Segment Information – Global ServicesSupplemental Segment Information – Systems & Technology, SoftwareCurrency – Year/Year ComparisonCash Flow (FAS 95)Non-GAAP Supplementary Materials• Divested Printing Systems Division• Constant Currency, Cash Flow• Interest Expense• Reconciliation of Asia Pacific Revenue Growth
Some columns and rows in these materials, including the supplemental exhibits, may not add due to rounding
19www.ibm.com/investor
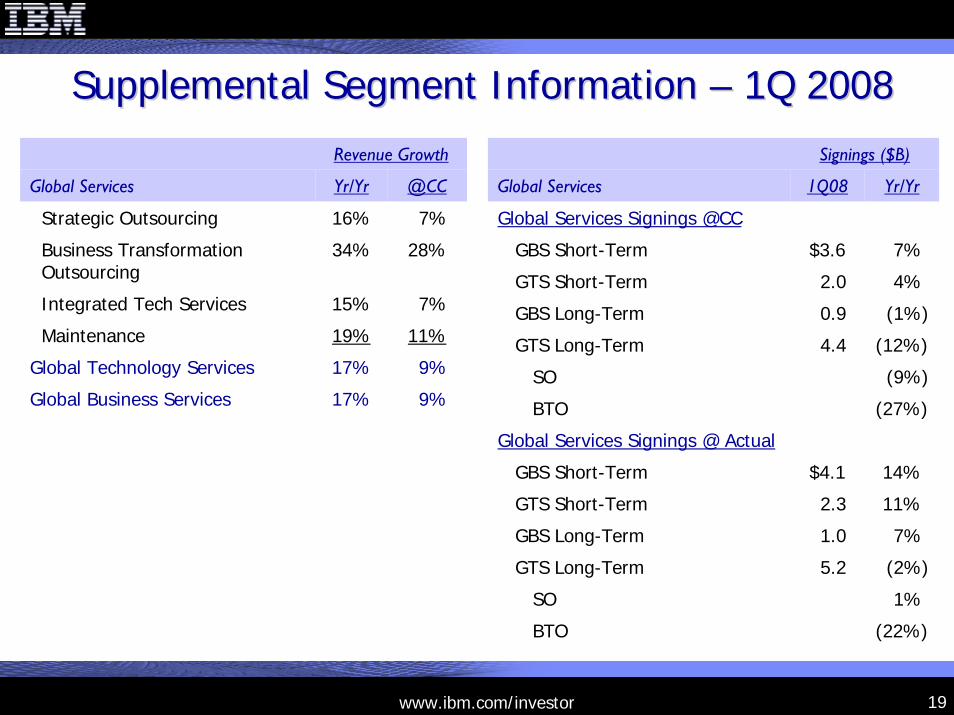
Supplemental Segment Information Supplemental Segment Information –– 1Q 20081Q 2008Revenue Growth
Global Services Yr/Yr @CC
Maintenance 19% 11%
Global Technology Services 17% 9%
Global Business Services 17% 9%
Strategic Outsourcing 16% 7%
Business Transformation Outsourcing
34% 28%
Integrated Tech Services 15% 7%
Signings ($B)
GTS Long-Term 5.2 (2%)
SO 1%
BTO (22%)
Global Services 1Q08 Yr/Yr
GBS Long-Term 0.9 (1%)
GTS Long-Term 4.4 (12%)
SO (9%)
BTO (27%)
Global Services Signings @ Actual
GBS Short-Term $4.1 14%
GTS Short-Term 2.3 11%
GBS Long-Term 1.0 7%
Global Services Signings @CC
GBS Short-Term $3.6 7%
GTS Short-Term 2.0 4%
20www.ibm.com/investor
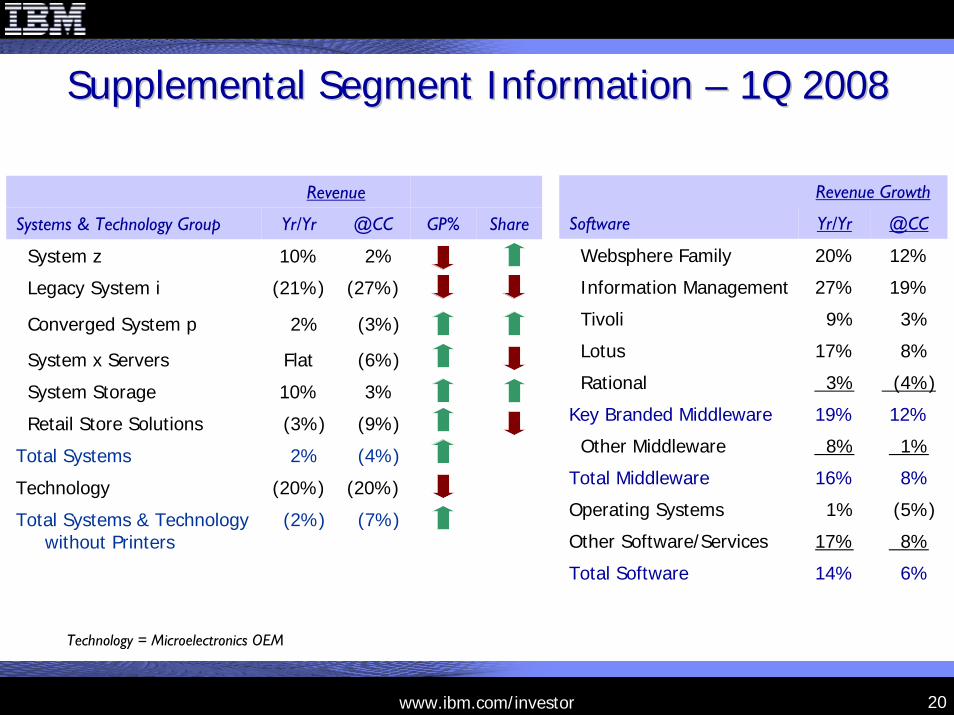
Supplemental Segment Information Supplemental Segment Information –– 1Q 20081Q 2008
Revenue
Systems & Technology Group Yr/Yr @CC GP% Share
2%
(27%)
(3%)
(6%)
3%
(9%)
(4%)
(20%)
(7%)
System x Servers Flat
System Storage 10%
Retail Store Solutions (3%)
Total Systems 2%
Technology (20%)
Total Systems & Technologywithout Printers
(2%)
System z 10%
Legacy System i (21%)
Converged System p 2%
Technology = Microelectronics OEM
Revenue Growth
Software Yr/Yr @CC
Lotus 17% 8%
Rational 3% (4%)
Key Branded Middleware 19% 12%
Other Middleware 8% 1%
Total Middleware 16% 8%
Operating Systems 1% (5%)
Other Software/Services 17% 8%
Total Software 14% 6%
Websphere Family 20% 12%
Information Management 27% 19%
Tivoli 9% 3%
21www.ibm.com/investor
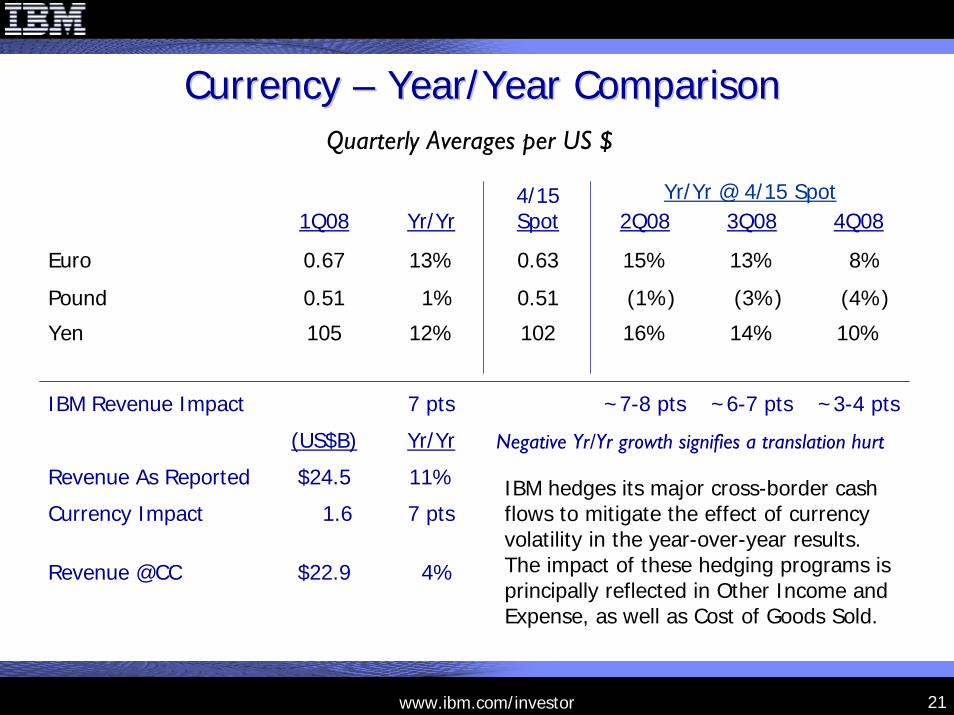
Currency Currency –– Year/Year ComparisonYear/Year Comparison
1Q08 Yr/Yr4/15Spot 2Q08 3Q08 4Q08
15% 8%
(4%)
10%
~3-4 pts
(US$B) Yr/Yr
Revenue As Reported $24.5 11%
Currency Impact 1.6 7 pts
Revenue @CC $22.9 4%
(1%)
16%
0.63
~7-8 pts
13%
(3%)
14%
~6-7 pts
0.51
102
13%
1%
12%
7 pts
Euro 0.67
Pound 0.51
Yen 105
IBM Revenue Impact
Negative Yr/Yr growth signifies a translation hurt
IBM hedges its major cross-border cash flows to mitigate the effect of currency volatility in the year-over-year results. The impact of these hedging programs is principally reflected in Other Income and Expense, as well as Cost of Goods Sold.
Yr/Yr @ 4/15 Spot
Quarterly Averages per US $
22www.ibm.com/investor
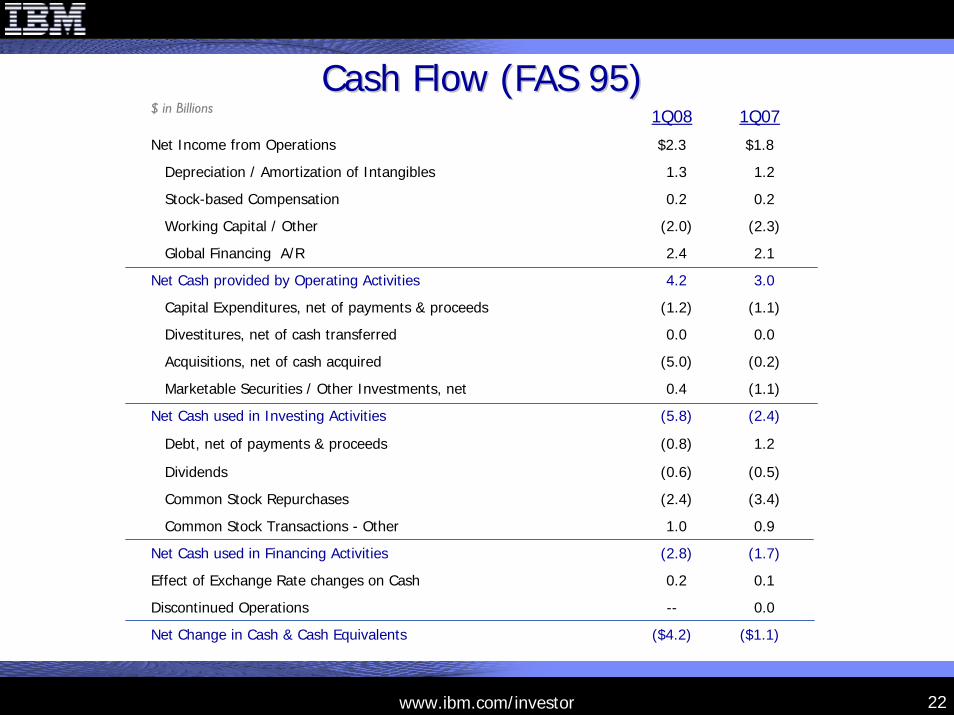
Cash Flow (FAS 95)Cash Flow (FAS 95)1Q08 1Q07
$2.3 $1.8
1.2
0.2
(2.3)
2.1
3.0
(1.1)
0.0
(0.2)
(1.1)
(2.4)
1.2
(0.5)
(3.4)
0.9
(1.7)
0.1
Discontinued Operations -- 0.0
($1.1)
1.3
0.2
(2.0)
2.4
4.2
(1.2)
0.0
(5.0)
0.4
(5.8)
(0.8)
(0.6)
(2.4)
1.0
(2.8)
0.2
($4.2)
Depreciation / Amortization of Intangibles
Stock-based Compensation
Working Capital / Other
Global Financing A/R
Net Cash provided by Operating Activities
Capital Expenditures, net of payments & proceeds
Divestitures, net of cash transferred
Acquisitions, net of cash acquired
Marketable Securities / Other Investments, net
Net Cash used in Investing Activities
Debt, net of payments & proceeds
Dividends
Common Stock Repurchases
Common Stock Transactions - Other
Net Cash used in Financing Activities
Effect of Exchange Rate changes on Cash
Net Change in Cash & Cash Equivalents
Net Income from Operations
$ in Billions
23www.ibm.com/investor
NonNon--GAAP Supplementary MaterialsGAAP Supplementary MaterialsIn an effort to provide investors with additional information regarding the company's results as determined by generally accepted accounting principles (GAAP), the company also discusses, in its earnings press release and earnings presentation materials, the following Non-GAAP information which management believes provides useful information to investors.
Divested Printing Systems Division
Management presents certain financial results without Printing Systems Division (PSD) revenue and the divestiture-related gain. In June 2007, the company divested 51 percent of its shares in a wholly-owned subsidiary, InfoPrint Solutions, that was based on PSD. Given this divestiture, management believes that presenting certain financial information without PSD revenue and the divestiture-related gain is more representative of the company’s performance and provides additional insight into, and clarifies the basis for, historical and/or future performance, which may be more useful for investors.
24www.ibm.com/investor
NonNon--GAAP Supplementary MaterialsGAAP Supplementary MaterialsConstant Currency
Management refers to growth rates at constant currency or adjusting for currency so that the business results can be viewed without the impact of fluctuations in foreign currency exchange rates, thereby facilitating period-to-period comparisons of the company's business performance. Generally, when the dollar either strengthens or weakens against other currencies, the growth at constant currency rates or adjusting for currency will be higher or lower than growth reported at actual exchange rates.
Cash Flow
Management includes presentations of both cash flow from operations and free cash flow that exclude the effect of Global Financing Receivables. For a financing business, increasing receivables is the basis for growth. Receivables are viewed as an investment and an income-producing asset. Therefore, management presents financing receivables as an investing activity. Management’s view is that this presentation gives the investor the best perspective of cash available for new investment or for distribution to shareholders.
25www.ibm.com/investor
NonNon--GAAP Supplementary MaterialsGAAP Supplementary Materials
Interest Expense
Management presents certain financial results excluding the effects of a higher level of interest expense as a result of the company’s Accelerated Share Repurchase executed in the second quarter of 2007. Given its unique nature, management believes that presenting certain financial information without this higher level of interest expense is more representative of the company's operational performance and provides additional insight into, and clarifies the basis for, historical and/or future performance, which may be more useful for investors.
26www.ibm.com/investor
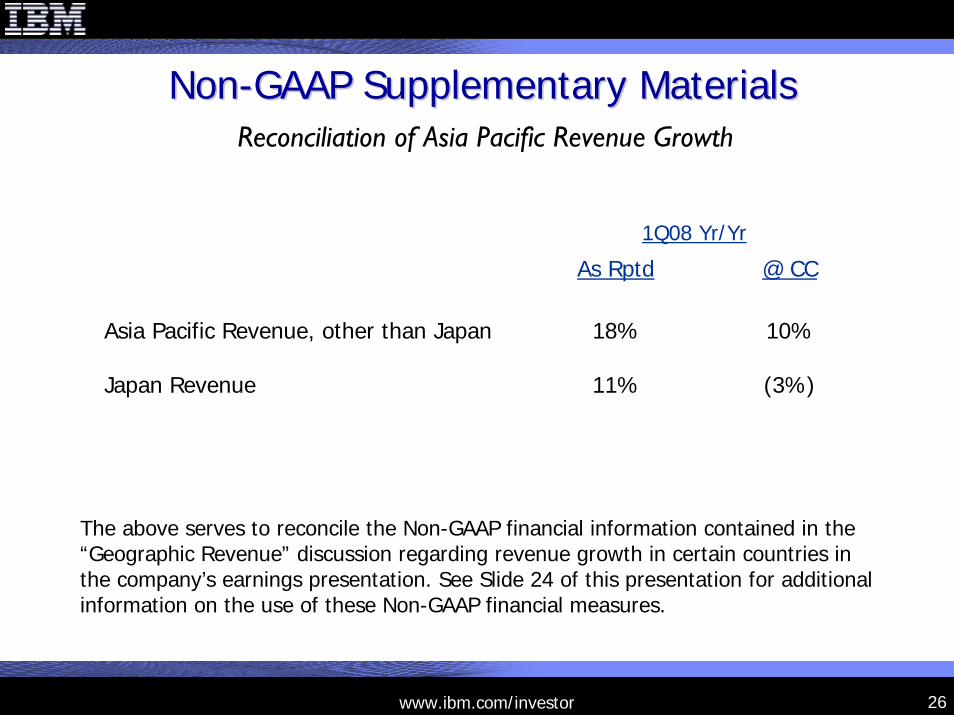
NonNon--GAAP Supplementary MaterialsGAAP Supplementary MaterialsReconciliation of Asia Pacific Revenue Growth
As Rptd @ CC
Asia Pacific Revenue, other than Japan
Japan Revenue
18%
11%
10%
(3%)
1Q08 Yr/Yr
The above serves to reconcile the Non-GAAP financial information contained in the “Geographic Revenue” discussion regarding revenue growth in certain countries in the company’s earnings presentation. See Slide 24 of this presentation for additional information on the use of these Non-GAAP financial measures.

27www.ibm.com/investor