1q 2016 earnings presentation
TRANSCRIPT

Date
1
BGC PARTNERS, INC. Earnings Presentation Q1 2016
NASDAQ: BGCP

Date
2
DISCLAIMER
Discussion of Forward-Looking Statements by BGC Partners
Statements in this document regarding BGC's businesses that are not historical facts are "forward-looking statements" that involve risks and uncertainties. Except as required by law, BGC undertakes
no obligation to release any revisions to any forward-looking statements. For a discussion of additional risks and uncertainties, which could cause actual results to differ from those contained in the
forward-looking statements, see BGC's Securities and Exchange Commission filings, including, but not limited to, the risk factors set forth in its public filings, including the most recent Form 10-K and
any updates to such risk factors contained in subsequent Forms 10-Q or Forms 8-K.
Note Regarding Financial Tables and Metrics
Excel files with the Company’s quarterly financial results and metrics from the current period dating back to the full year 2008 are accessible in the various financial results press releases at the
“Investor Relations” section of http://www.bgcpartners.com. They are also available directly at ir.bgcpartners.com/news-releases/news-releases.
Distributable Earnings
This presentation should be read in conjunction with BGC’s most recent financial results press release. Unless otherwise stated, throughout this document we refer to our results only on a
distributable earnings basis. For a complete and revised description of this term and how, when and why management uses it, see the "Distributable Earnings Defined" pages of this presentation. For
both this description and a reconciliation to GAAP, see the sections of BGC’s most recent financial results press release entitled “Distributable Earnings Defined”, “Differences Between Consolidated
Results for Distributable Earnings and GAAP”, and “Reconciliation of GAAP Income (Loss) to Distributable Earnings”, which are incorporated by reference, and available at
http://ir.bgcpartners.com/Investors/default.aspx.
Adjusted EBITDA
See the sections of BGC’s most recent financial results press release titled “Adjusted EBITDA Defined” and “Reconciliation of GAAP Income (Loss) to Adjusted EBITDA (and Comparison to Pre-Tax
Distributable Earnings)."
Other Items
“Newmark Grubb Knight Frank” is synonymous in this document with “NGKF” or “Real Estate Services.”
Our discussion of financial results for “Newmark Grubb Knight Frank,” “NGKF,” or “Real Estate Services” reflects only those businesses owned by us and does not include the results for Knight Frank
or for the independently-owned offices that use some variation of the NGKF name in their branding or marketing.
For the purposes of this document, all of the Company’s fully electronic businesses in the Financial Services segment may be referred to interchangeably as “FENICS” or “e-businesses.” This
includes fees from fully electronic brokerage, as well as data, software, and post-trade services (formerly known as “market data and software solutions”) across both BGC and GFI. FENICS results
do not include those of Trayport, which are reported separately due to its sale to Intercontinental Exchange, Inc. (“ICE”) for approximately 2.5 million ICE common shares in December of 2015.
Trayport generated gross revenues of approximately $80 million for the trailing twelve months ended September 30, 2015 and had a pre-tax profit margin of nearly 45 percent..
On June 28, 2013, BGC sold its fully electronic trading platform for benchmark U.S. Treasury Notes and Bonds to Nasdaq Inc. For the purposes of this document, the assets sold may be referred to
as “eSpeed,” and the businesses remaining with BGC that were not part of the eSpeed sale may be referred to as "retained" or "FENICS".
Beginning on February 27, 2015, BGC began consolidating the results of GFI, which continues to operate as a controlled company and as a separately branded division of BGC. BGC owned
approximately 67% of GFI’s outstanding common shares as of December 31, 2015. On January 12, 2016, BGC completed the merger of GFI by acquiring 100% of GFI's outstanding shares.
"BGC", "BGC Trader", "Newmark", "Grubb & Ellis", "Grubb", "GFI", and "Capitalab" are trademarks and service marks of BGC Partners, Inc. and/or its affiliates. Knight Frank is a service mark of
Knight Frank (Nominees) Limited. Trayport is a trademark or registered trademark of Trayport Limited and/or its affiliates. FENICS and FENICS.COM are trademarks or registered trademarks of
Fenics Software Inc. and/or its affiliates.
© 2016 BGC Partners, Inc. All rights reserved. 2

Date
3
GENERAL OVERVIEW
BGC PARTNERS
Date
4
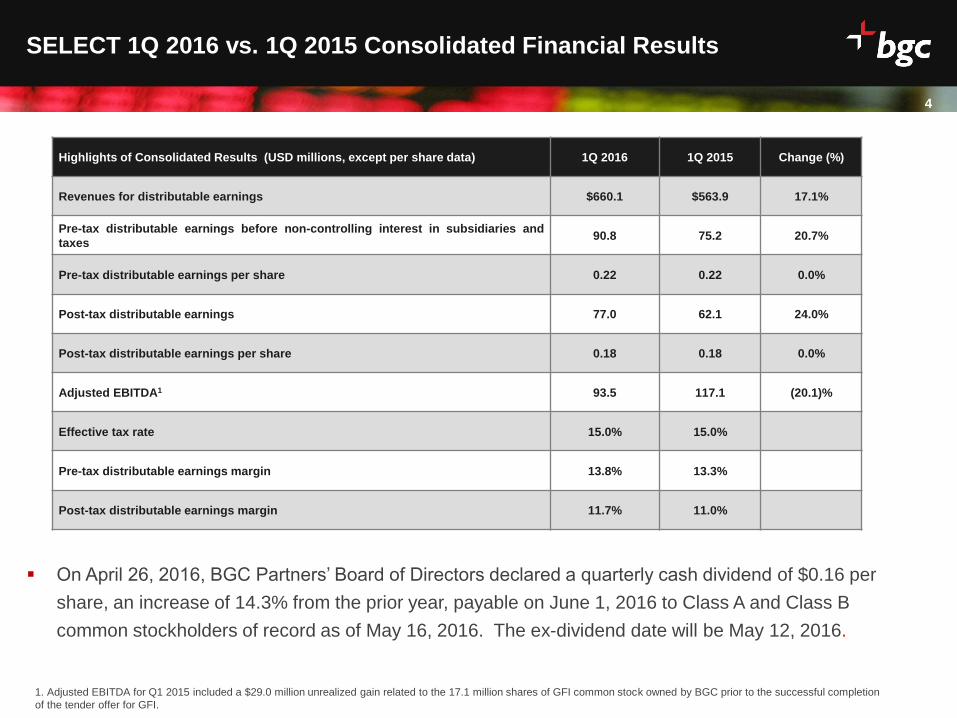
SELECT 1Q 2016 vs. 1Q 2015 Consolidated Financial Results
Highlights of Consolidated Results (USD millions, except per share data) 1Q 2016 1Q 2015 Change (%)
Revenues for distributable earnings $660.1 $563.9 17.1%
Pre-tax distributable earnings before non-controlling interest in subsidiaries and
taxes 90.8 75.2 20.7%
Pre-tax distributable earnings per share 0.22 0.22 0.0%
Post-tax distributable earnings 77.0 62.1 24.0%
Post-tax distributable earnings per share 0.18 0.18 0.0%
Adjusted EBITDA1 93.5 117.1 (20.1)%
Effective tax rate 15.0% 15.0%
Pre-tax distributable earnings margin 13.8% 13.3%
Post-tax distributable earnings margin 11.7% 11.0%
On April 26, 2016, BGC Partners’ Board of Directors declared a quarterly cash dividend of $0.16 per
share, an increase of 14.3% from the prior year, payable on June 1, 2016 to Class A and Class B
common stockholders of record as of May 16, 2016. The ex-dividend date will be May 12, 2016.
1. Adjusted EBITDA for Q1 2015 included a $29.0 million unrealized gain related to the 17.1 million shares of GFI common stock owned by BGC prior to the successful completion
of the tender offer for GFI.
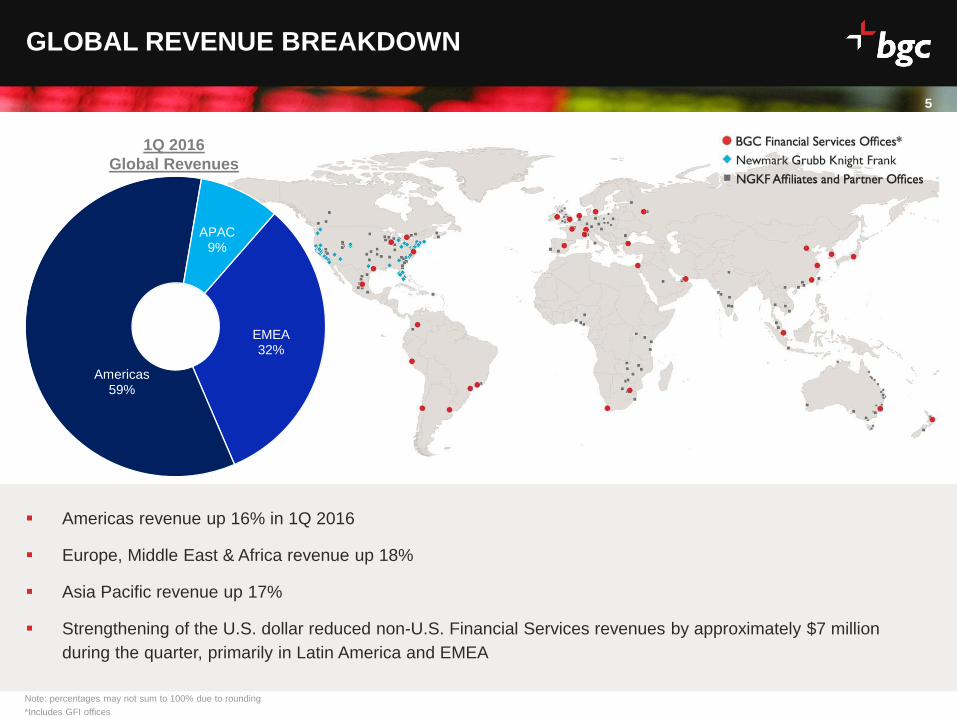
Date Americas revenue up 16% in 1Q 2016
Europe, Middle East & Africa revenue up 18%
Asia Pacific revenue up 17%
Strengthening of the U.S. dollar reduced non-U.S. Financial Services revenues by approximately $7 million
during the quarter, primarily in Latin America and EMEA
EMEA 32%
Americas 59%
APAC 9%
Q1
5
GLOBAL REVENUE BREAKDOWN
Note: percentages may not sum to 100% due to rounding
*Includes GFI offices
1Q 2016
Global Revenues
Date
6
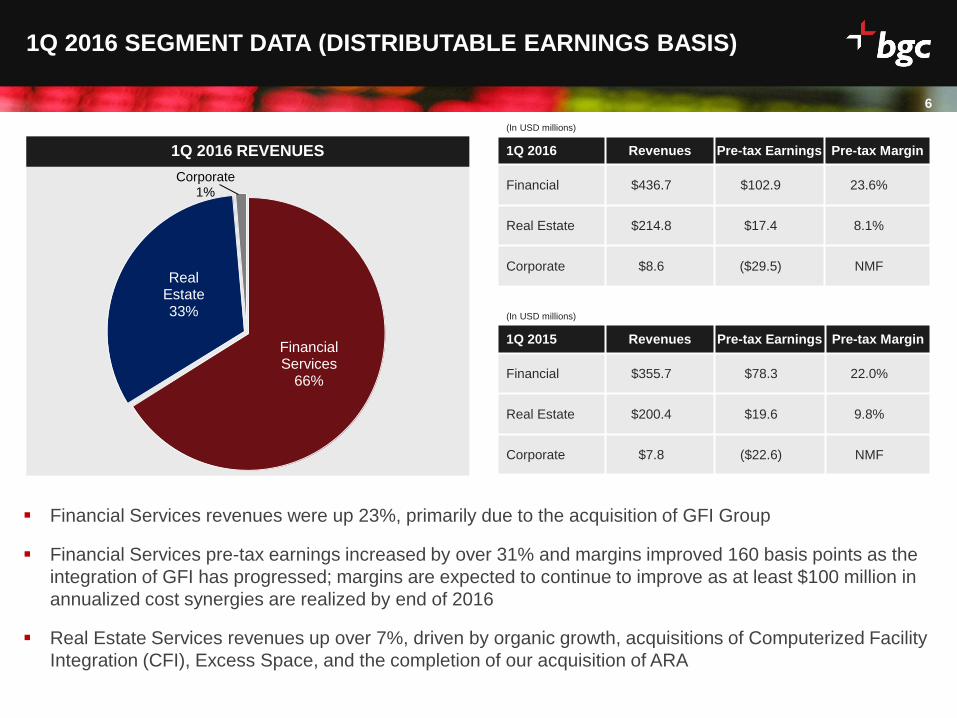
1Q 2016 REVENUES
1Q 2016 SEGMENT DATA (DISTRIBUTABLE EARNINGS BASIS)
1Q 2016 Revenues Pre-tax Earnings Pre-tax Margin
Financial $436.7 $102.9 23.6%
Real Estate $214.8 $17.4 8.1%
Corporate $8.6 ($29.5) NMF
(In USD millions)
Financial Services revenues were up 23%, primarily due to the acquisition of GFI Group
Financial Services pre-tax earnings increased by over 31% and margins improved 160 basis points as the
integration of GFI has progressed; margins are expected to continue to improve as at least $100 million in
annualized cost synergies are realized by end of 2016
Real Estate Services revenues up over 7%, driven by organic growth, acquisitions of Computerized Facility
Integration (CFI), Excess Space, and the completion of our acquisition of ARA
Financial Services
66%
Real Estate 33%
Corporate 1%
1Q 2015 Revenues Pre-tax Earnings Pre-tax Margin
Financial $355.7 $78.3 22.0%
Real Estate $200.4 $19.6 9.8%
Corporate $7.8 ($22.6) NMF
(In USD millions)
Date
7
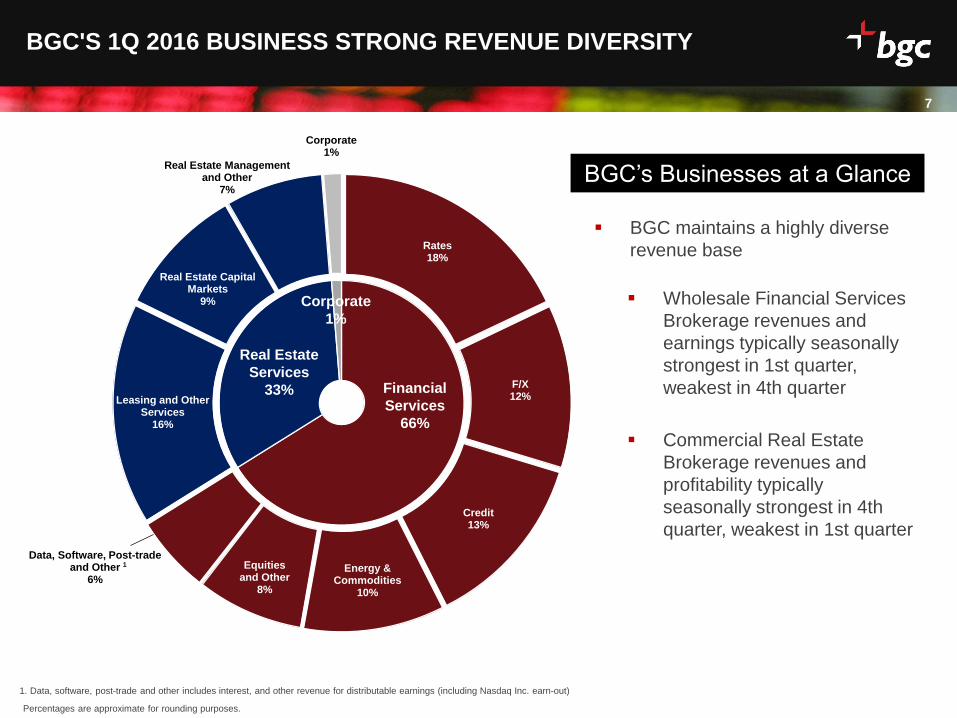
Rates 18%
F/X 12%
Credit 13%
Energy & Commodities
10%
Equities and Other
8%
Data, Software, Post-trade and Other
6%
Leasing and Other Services
16%
Real Estate Capital Markets
9%
Real Estate Management and Other
7%
Corporate 1%
Financial
Services
66%
Real Estate
Services
33%
Corporate
1%
BGC'S 1Q 2016 BUSINESS STRONG REVENUE DIVERSITY
Percentages are approximate for rounding purposes.
1. Data, software, post-trade and other includes interest, and other revenue for distributable earnings (including Nasdaq Inc. earn-out)
BGC maintains a highly diverse
revenue base
Wholesale Financial Services
Brokerage revenues and
earnings typically seasonally
strongest in 1st quarter,
weakest in 4th quarter
Commercial Real Estate
Brokerage revenues and
profitability typically
seasonally strongest in 4th
quarter, weakest in 1st quarter
BGC’s Businesses at a Glance
1
Date
8
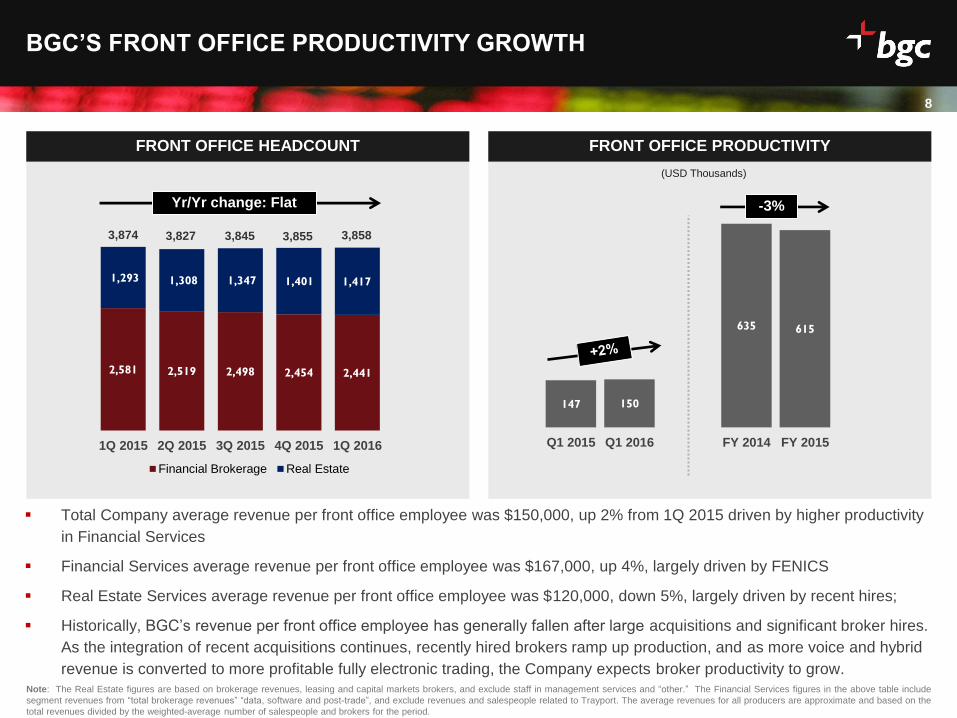
2,581 2,519 2,498 2,454 2,441
1,293 1,308 1,347 1,401 1,417
1Q 2015 2Q 2015 3Q 2015 4Q 2015 1Q 2016
Financial Brokerage Real Estate
Total Company average revenue per front office employee was $150,000, up 2% from 1Q 2015 driven by higher productivity
in Financial Services
Financial Services average revenue per front office employee was $167,000, up 4%, largely driven by FENICS
Real Estate Services average revenue per front office employee was $120,000, down 5%, largely driven by recent hires;
Historically, BGC’s revenue per front office employee has generally fallen after large acquisitions and significant broker hires.
As the integration of recent acquisitions continues, recently hired brokers ramp up production, and as more voice and hybrid
revenue is converted to more profitable fully electronic trading, the Company expects broker productivity to grow.
BGC’S FRONT OFFICE PRODUCTIVITY GROWTH
FRONT OFFICE HEADCOUNT
Note: The Real Estate figures are based on brokerage revenues, leasing and capital markets brokers, and exclude staff in management services and “other.” The Financial Services figures in the above table include
segment revenues from “total brokerage revenues” “data, software and post-trade”, and exclude revenues and salespeople related to Trayport. The average revenues for all producers are approximate and based on the
total revenues divided by the weighted-average number of salespeople and brokers for the period.
3,874
FRONT OFFICE PRODUCTIVITY
Yr/Yr change: Flat
147 150
635 615
Q1 2015 Q1 2016 FY 2014 FY 2015
-3%
(USD Thousands)
3,827 3,845 3,855 3,858

Date
9
Overview
FINANCIAL SERVICES
Date
10
1Q 2016 FINANCIAL SERVICES SUMMARY
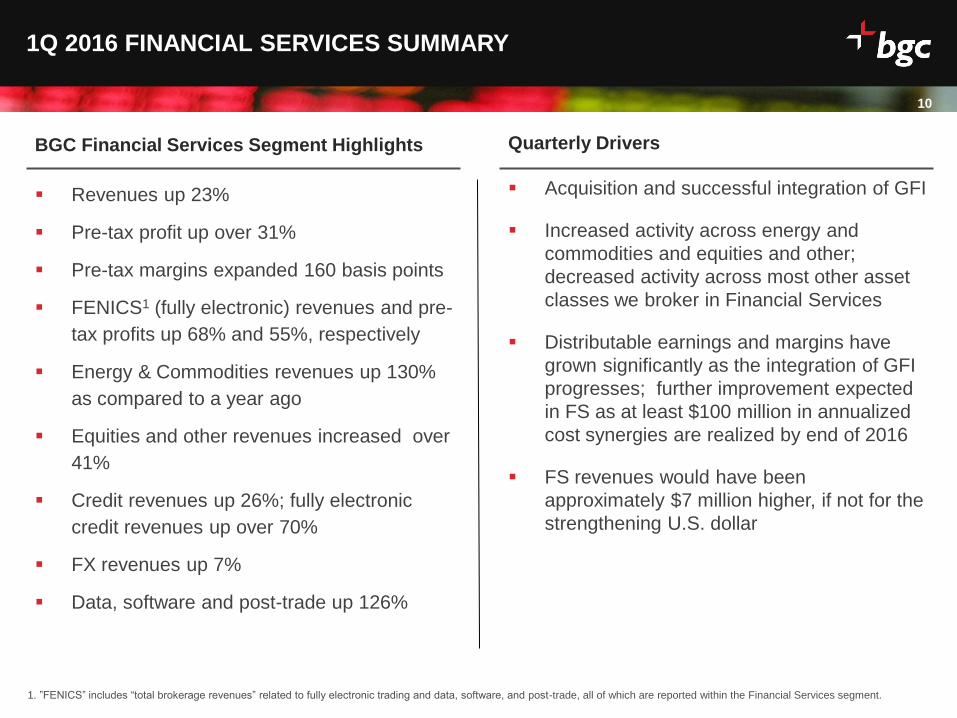
BGC Financial Services Segment Highlights
Revenues up 23%
Pre-tax profit up over 31%
Pre-tax margins expanded 160 basis points
FENICS1 (fully electronic) revenues and pre-
tax profits up 68% and 55%, respectively
Energy & Commodities revenues up 130%
as compared to a year ago
Equities and other revenues increased over
41%
Credit revenues up 26%; fully electronic
credit revenues up over 70%
FX revenues up 7%
Data, software and post-trade up 126%
Quarterly Drivers
Acquisition and successful integration of GFI
Increased activity across energy and
commodities and equities and other;
decreased activity across most other asset
classes we broker in Financial Services
Distributable earnings and margins have
grown significantly as the integration of GFI
progresses; further improvement expected
in FS as at least $100 million in annualized
cost synergies are realized by end of 2016
FS revenues would have been
approximately $7 million higher, if not for the
strengthening U.S. dollar
1. ”FENICS” includes “total brokerage revenues” related to fully electronic trading and data, software, and post-trade, all of which are reported within the Financial Services segment.

Date
11
FINANCIAL SERVICES REVENUE COMPOSITION
FINANCIAL SERVICES REVENUE BREAKOUT BY ASSET CLASS
122,011 118,517
67,175 84,527
72,941 78,020
29,404
67,497 36,215
51,205
5,451
12,317
22,519
24,619
Q1 2015 Q1 2016
$355,716
$436,702
Data, software, and post-trade
Energy & commodities
Equity & other
Credit
Foreign Exchange
Rates
+41%
+130%
+7%
+26%
-3%
1. Includes $23.3MM and $15.4MM related to the Nasdaq earnout in 1Q16 and 1Q15, respectively and $6.1MM related to Trayport for 1Q15.
+23%
% Change
+126%
+9% Other1
Total Financial
Services
Date
1Q16 INDUSTRY VOLUMES MIXED TO UP; VOLATILITY MOSTLY UP
12
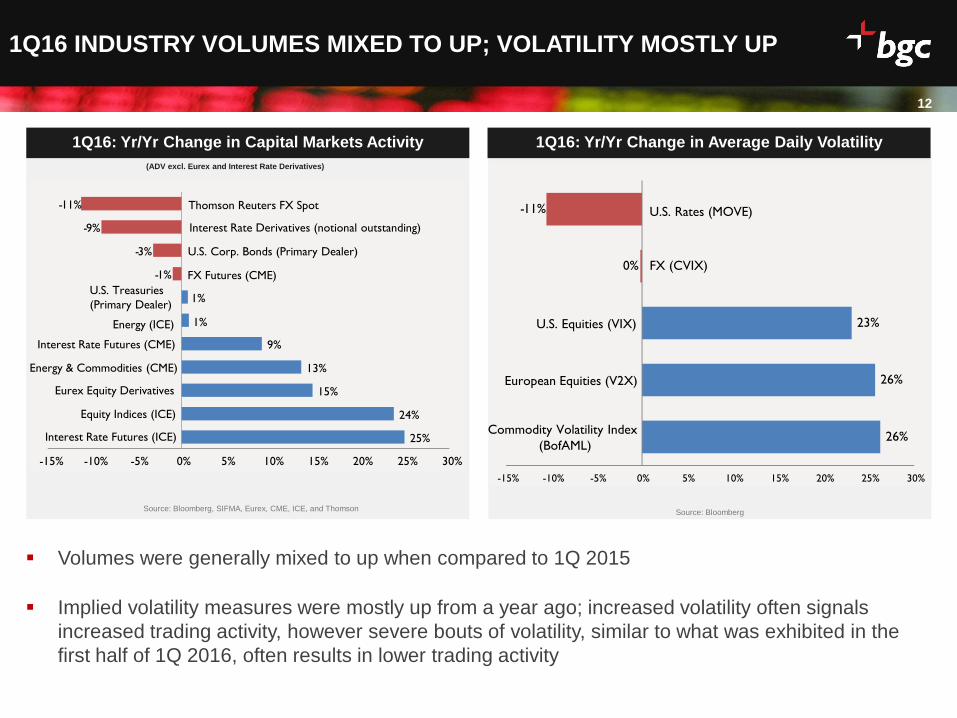
1Q16: Yr/Yr Change in Capital Markets Activity 1Q16: Yr/Yr Change in Average Daily Volatility
Volumes were generally mixed to up when compared to 1Q 2015
Implied volatility measures were mostly up from a year ago; increased volatility often signals
increased trading activity, however severe bouts of volatility, similar to what was exhibited in the
first half of 1Q 2016, often results in lower trading activity
12
Source: Bloomberg, SIFMA, Eurex, CME, ICE, and Thomson
26%
26%
23%
0%
- 11%
-15% -10% -5% 0% 5% 10% 15% 20% 25% 30%
Commodity Volatility Index
(BofAML)
European Equities (V2X)
U.S. Equities (VIX)
FX (CVIX)
U.S. Rates (MOVE)
Source: Bloomberg
(ADV excl. Eurex and Interest Rate Derivatives)
25%
24%
15%
13%
9%
1%
1%
- 1%
- 3%
- 9%
- 11%
-15% -10% -5% 0% 5% 10% 15% 20% 25% 30%
Interest Rate Futures (ICE)
Equity Indices (ICE)
Eurex Equity Derivatives
Energy & Commodities (CME)
Interest Rate Futures (CME)
Energy (ICE)
U.S. Treasuries
(Primary Dealer)
FX Futures (CME)
U.S. Corp. Bonds (Primary Dealer)
Interest Rate Derivatives (notional outstanding)
Thomson Reuters FX Spot
Date
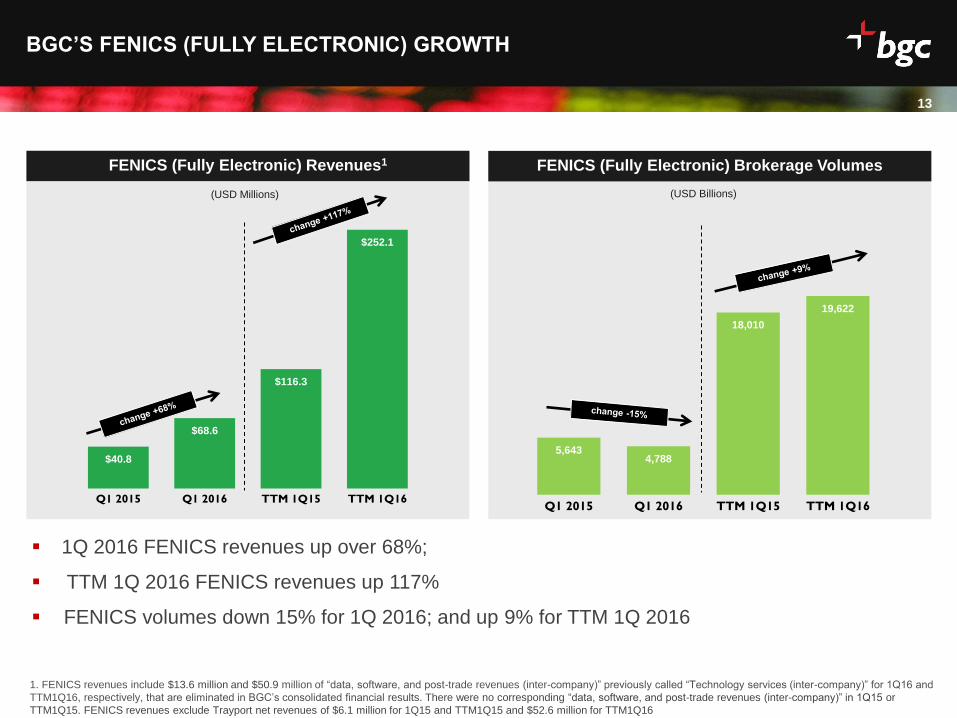
$40.8
$68.6
$116.3
$252.1
Q1 2015 Q1 2016 TTM 1Q15 TTM 1Q16
13
5,643 4,788
18,010
19,622
Q1 2015 Q1 2016 TTM 1Q15 TTM 1Q16
BGC’S FENICS (FULLY ELECTRONIC) GROWTH
13
FENICS (Fully Electronic) Revenues1
(USD Billions)
1Q 2016 FENICS revenues up over 68%;
TTM 1Q 2016 FENICS revenues up 117%
FENICS volumes down 15% for 1Q 2016; and up 9% for TTM 1Q 2016
FENICS (Fully Electronic) Brokerage Volumes
(USD Millions)
1. FENICS revenues include $13.6 million and $50.9 million of “data, software, and post-trade revenues (inter-company)” previously called “Technology services (inter-company)” for 1Q16 and
TTM1Q16, respectively, that are eliminated in BGC’s consolidated financial results. There were no corresponding “data, software, and post-trade revenues (inter-company)” in 1Q15 or
TTM1Q15. FENICS revenues exclude Trayport net revenues of $6.1 million for 1Q15 and TTM1Q15 and $52.6 million for TTM1Q16
Date
14
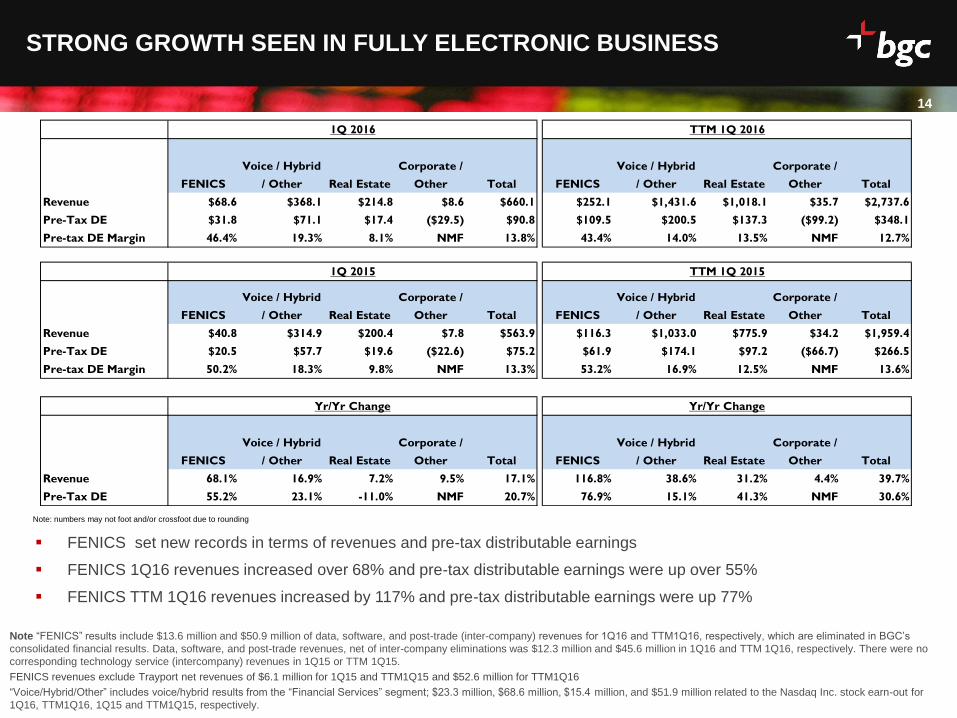
Note “FENICS” results include $13.6 million and $50.9 million of data, software, and post-trade (inter-company) revenues for 1Q16 and TTM1Q16, respectively, which are eliminated in BGC’s
consolidated financial results. Data, software, and post-trade revenues, net of inter-company eliminations was $12.3 million and $45.6 million in 1Q16 and TTM 1Q16, respectively. There were no
corresponding technology service (intercompany) revenues in 1Q15 or TTM 1Q15.
FENICS revenues exclude Trayport net revenues of $6.1 million for 1Q15 and TTM1Q15 and $52.6 million for TTM1Q16
“Voice/Hybrid/Other” includes voice/hybrid results from the “Financial Services” segment; $23.3 million, $68.6 million, $15.4 million, and $51.9 million related to the Nasdaq Inc. stock earn-out for
1Q16, TTM1Q16, 1Q15 and TTM1Q15, respectively.
FENICS set new records in terms of revenues and pre-tax distributable earnings
FENICS 1Q16 revenues increased over 68% and pre-tax distributable earnings were up over 55%
FENICS TTM 1Q16 revenues increased by 117% and pre-tax distributable earnings were up 77%
STRONG GROWTH SEEN IN FULLY ELECTRONIC BUSINESS
Note: numbers may not foot and/or crossfoot due to rounding
FENICS
Voice / Hybrid
/ Other Real Estate
Corporate /
Other Total FENICS
Voice / Hybrid
/ Other Real Estate
Corporate /
Other Total
Revenue $68.6 $368.1 $214.8 $8.6 $660.1 $252.1 $1,431.6 $1,018.1 $35.7 $2,737.6
Pre-Tax DE $31.8 $71.1 $17.4 ($29.5) $90.8 $109.5 $200.5 $137.3 ($99.2) $348.1
Pre-tax DE Margin 46.4% 19.3% 8.1% NMF 13.8% 43.4% 14.0% 13.5% NMF 12.7%
FENICS
Voice / Hybrid
/ Other Real Estate
Corporate /
Other Total FENICS
Voice / Hybrid
/ Other Real Estate
Corporate /
Other Total
Revenue $40.8 $314.9 $200.4 $7.8 $563.9 $116.3 $1,033.0 $775.9 $34.2 $1,959.4
Pre-Tax DE $20.5 $57.7 $19.6 ($22.6) $75.2 $61.9 $174.1 $97.2 ($66.7) $266.5
Pre-tax DE Margin 50.2% 18.3% 9.8% NMF 13.3% 53.2% 16.9% 12.5% NMF 13.6%
FENICS
Voice / Hybrid
/ Other Real Estate
Corporate /
Other Total FENICS
Voice / Hybrid
/ Other Real Estate
Corporate /
Other Total
Revenue 68.1% 16.9% 7.2% 9.5% 17.1% 116.8% 38.6% 31.2% 4.4% 39.7%
Pre-Tax DE 55.2% 23.1% -11.0% NMF 20.7% 76.9% 15.1% 41.3% NMF 30.6%
1Q 2016
1Q 2015
Yr/Yr Change
TTM 1Q 2015
Yr/Yr Change
TTM 1Q 2016
Date
15
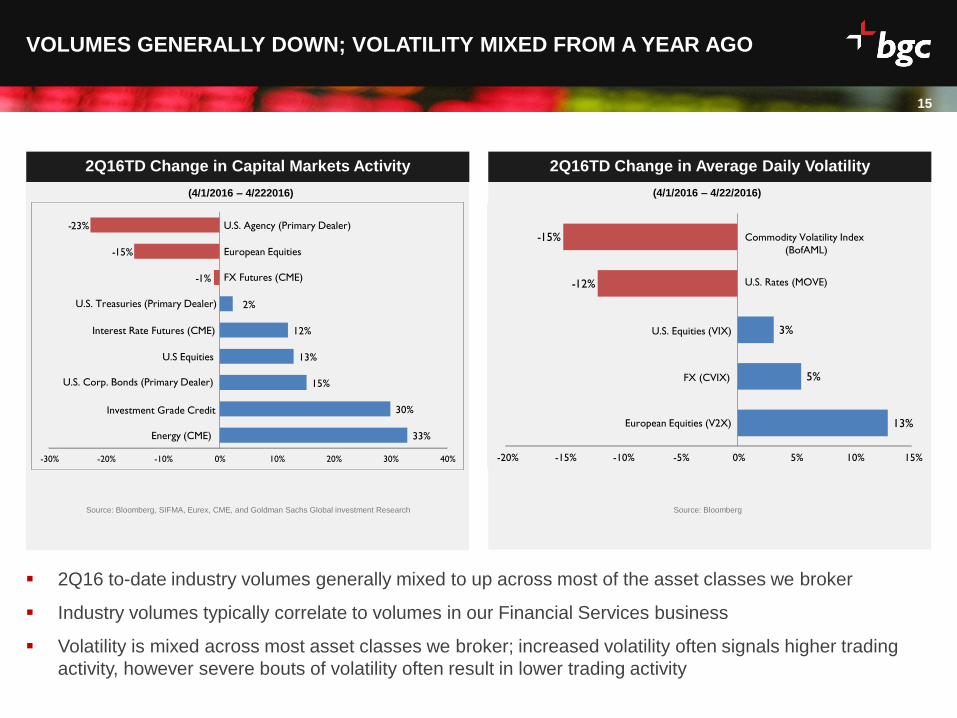
VOLUMES GENERALLY DOWN; VOLATILITY MIXED FROM A YEAR AGO
15
2Q16TD Change in Capital Markets Activity 2Q16TD Change in Average Daily Volatility
Source: Bloomberg, SIFMA, Eurex, CME, and Goldman Sachs Global investment Research
2Q16 to-date industry volumes generally mixed to up across most of the asset classes we broker
Industry volumes typically correlate to volumes in our Financial Services business
Volatility is mixed across most asset classes we broker; increased volatility often signals higher trading
activity, however severe bouts of volatility often result in lower trading activity
(4/1/2016 – 4/22/2016)
Source: Bloomberg
33%
30%
15%
13%
12%
2%
- 1%
- 15%
- 23%
-30% -20% -10% 0% 10% 20% 30% 40%
Energy (CME)
Investment Grade Credit
U.S. Corp. Bonds (Primary Dealer)
U.S Equities
Interest Rate Futures (CME)
U.S. Treasuries (Primary Dealer)
FX Futures (CME)
European Equities
U.S. Agency (Primary Dealer)
(4/1/2016 – 4/222016)
13%
5%
3%
- 12%
- 15%
-20% -15% -10% -5% 0% 5% 10% 15%
European Equities (V2X)
FX (CVIX)
U.S. Equities (VIX)
U.S. Rates (MOVE)
Commodity Volatility Index
(BofAML)

Date
16
Overview
REAL ESTATE
Date
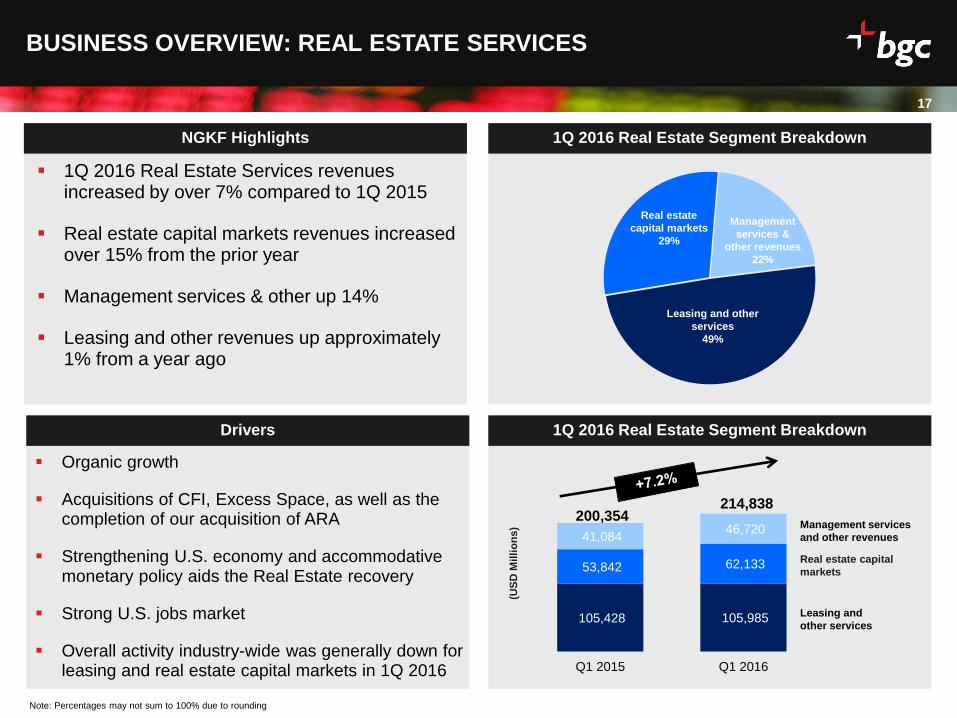
105,428 105,985
53,842 62,133
41,084 46,720
Q1 2015 Q1 2016
17
1Q 2016 Real Estate Segment Breakdown Drivers
NGKF Highlights 1Q 2016 Real Estate Segment Breakdown
BUSINESS OVERVIEW: REAL ESTATE SERVICES
1Q 2016 Real Estate Services revenues increased by over 7% compared to 1Q 2015
Real estate capital markets revenues increased over 15% from the prior year
Management services & other up 14%
Leasing and other revenues up approximately 1% from a year ago
17
Organic growth
Acquisitions of CFI, Excess Space, as well as the completion of our acquisition of ARA
Strengthening U.S. economy and accommodative monetary policy aids the Real Estate recovery
Strong U.S. jobs market
Overall activity industry-wide was generally down for leasing and real estate capital markets in 1Q 2016
Leasing and other
services
49%
Real estate
capital markets
29%
Management
services &
other revenues
22%
Management services
and other revenues
Real estate capital
markets
Leasing and
other services
Note: Percentages may not sum to 100% due to rounding
200,354 214,838
(US
D M
illi
on
s)
Date -
20,000
40,000
60,000
80,000
100,000
120,000
140,000
160,000
-
200,000
400,000
600,000
800,000
1,000,000
FY2013
TTM1Q14
TTM2Q14
TTM3Q14
FY2014
TTM1Q15
TTM2Q15
TTM3Q15
FY2015
TTM1Q16Revenue
Pre-tax Earnings
18
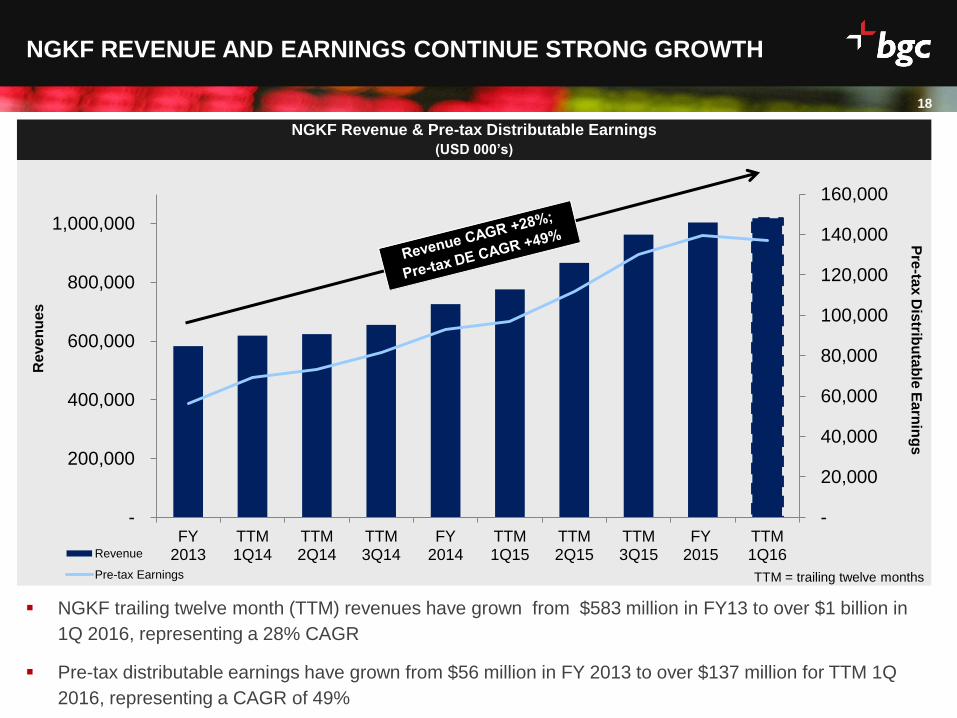
NGKF Revenue & Pre-tax Distributable Earnings
(USD 000’s)
NGKF REVENUE AND EARNINGS CONTINUE STRONG GROWTH
NGKF trailing twelve month (TTM) revenues have grown from $583 million in FY13 to over $1 billion in
1Q 2016, representing a 28% CAGR
Pre-tax distributable earnings have grown from $56 million in FY 2013 to over $137 million for TTM 1Q
2016, representing a CAGR of 49%
Re
ve
nu
es
Pre
-tax D
istrib
uta
ble
Ea
rnin
gs
TTM = trailing twelve months

Date
COMMERCIAL REAL ESTATE REMAINS AN ATTRACTIVE INVESTABLE
ASSET CLASS
0.00%
1.00%
2.00%
3.00%
4.00%
5.00%
6.00%
7.00%
8.00%
Spread Cap Rate 10yr UST Avg. Spread
U.S. Commercial RE Cap Rates vs. 10 Year U.S. Treasuries (All Commercial Property Types)
19
Spreads between U.S. commercial cap rates and UST 10yrs ended 1Q 2016 at 433 bps, well above pre-
recession low of 144 bps at 2Q 2007 and above the 10-year average spread of 372 bps
While cap rates have compressed since 2012, U.S. Treasury yields remain near historic lows leaving
spreads relatively high
Source: Moody’s Real Capital Analytics
Date
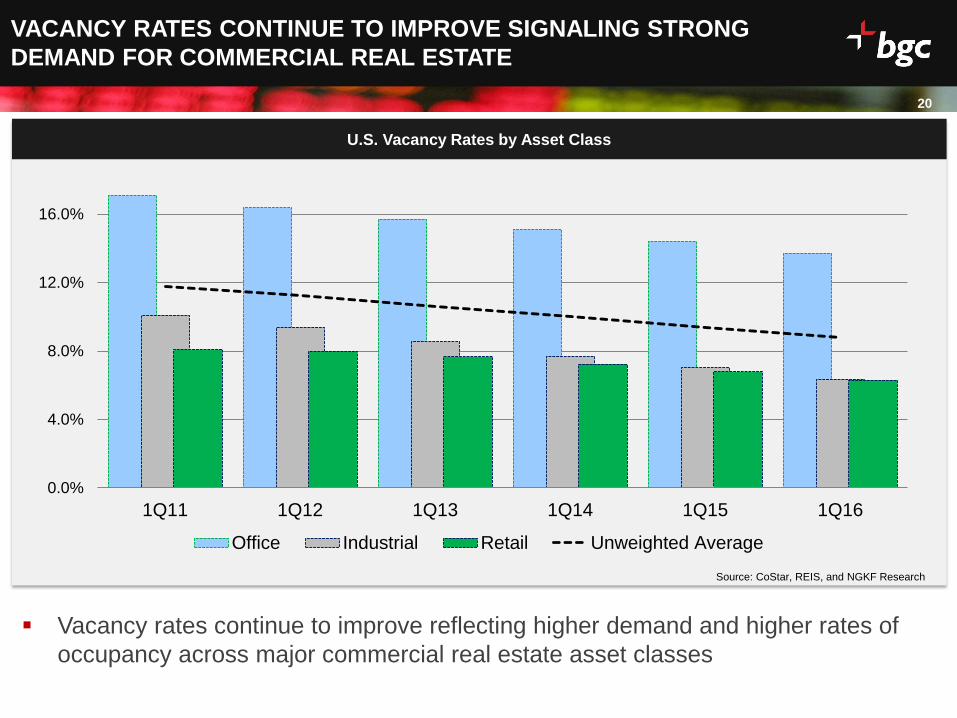
VACANCY RATES CONTINUE TO IMPROVE SIGNALING STRONG
DEMAND FOR COMMERCIAL REAL ESTATE
0.0%
4.0%
8.0%
12.0%
16.0%
20.0%
1Q11 1Q12 1Q13 1Q14 1Q15 1Q16
Office Industrial Retail Unweighted Average
Vacancy rates continue to improve reflecting higher demand and higher rates of
occupancy across major commercial real estate asset classes
Source: CoStar, REIS, and NGKF Research
20
U.S. Vacancy Rates by Asset Class

Date
21
BGC PARTNERS
OUTLOOK
Date
22
OUTLOOK COMPARISON
Outlook Compared with a Year Ago Results
BGC anticipates second quarter of 2016 distributable earnings revenues of between $645 million and $685 million, compared with $684.6 million a year earlier.
BGC expects second quarter 2016 pre-tax distributable earnings before noncontrolling interest in subsidiaries and taxes to increase by between approximately 10 percent and 29 percent and to be in the range of $85 million to $100 million, versus $77.5 million a year earlier.
BGC anticipates its effective tax rate for distributable earnings to remain
approximately 15 percent for the year.
BGC intends to update its second quarter outlook before the end of June 2016.

Date
APPENDIX
Date
24
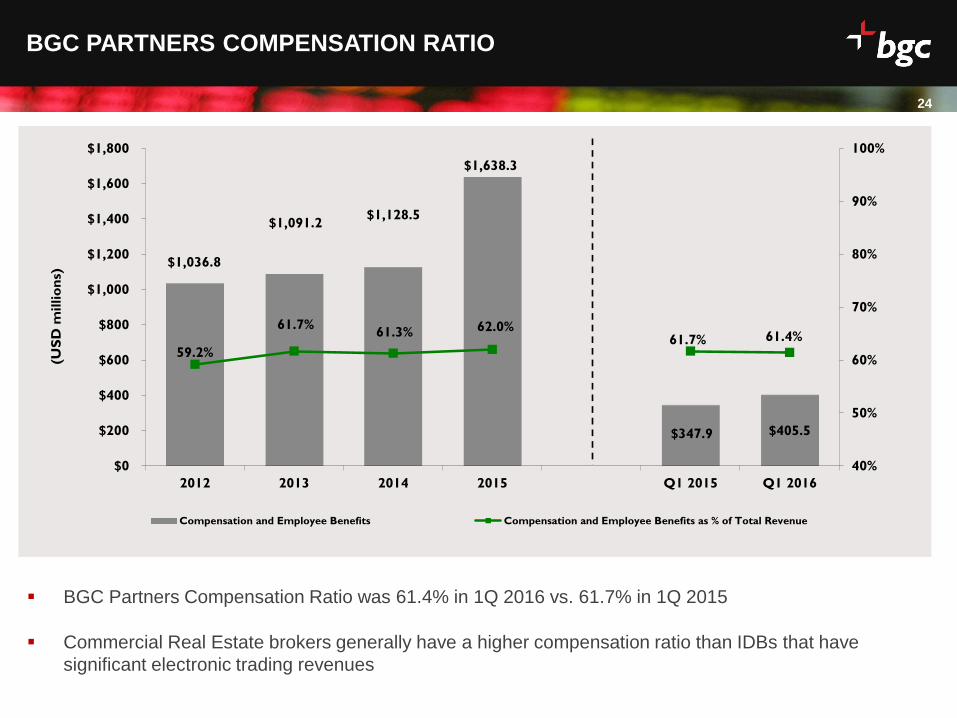
BGC PARTNERS COMPENSATION RATIO
BGC Partners Compensation Ratio was 61.4% in 1Q 2016 vs. 61.7% in 1Q 2015
Commercial Real Estate brokers generally have a higher compensation ratio than IDBs that have
significant electronic trading revenues
$1,036.8
$1,091.2 $1,128.5
$1,638.3
$347.9 $405.5
59.2%
61.7% 61.3% 62.0%
61.7% 61.4%
40%
50%
60%
70%
80%
90%
100%
$0
$200
$400
$600
$800
$1,000
$1,200
$1,400
$1,600
$1,800
2012 2013 2014 2015 Q1 2015 Q1 2016
(US
D m
illio
ns)
Compensation and Employee Benefits Compensation and Employee Benefits as % of Total Revenue
Date
25
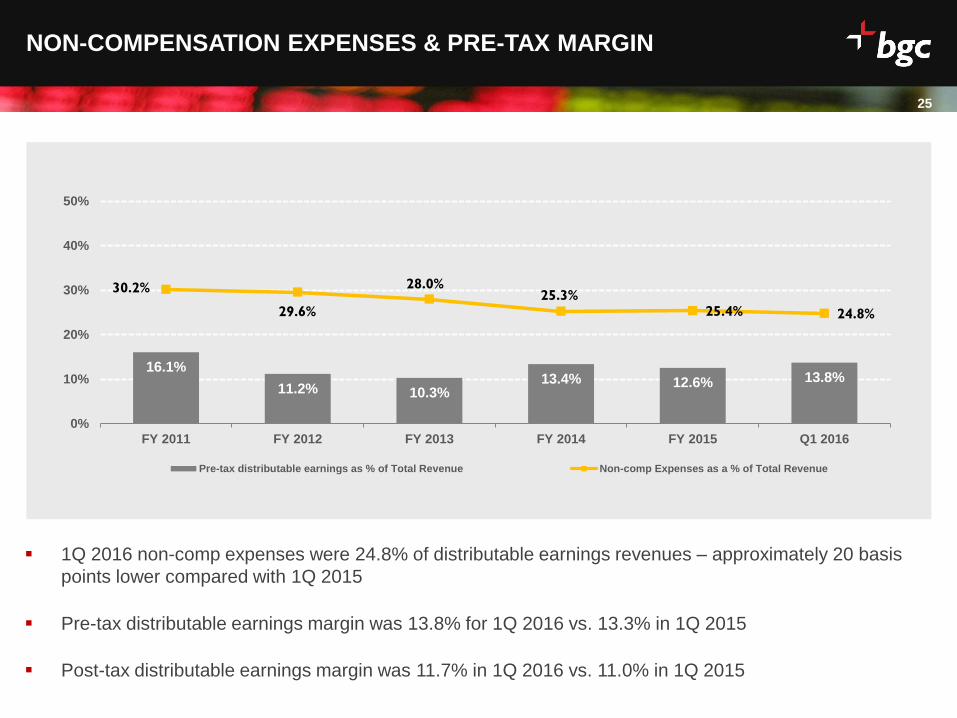
NON-COMPENSATION EXPENSES & PRE-TAX MARGIN
16.1%
11.2% 10.3% 13.4% 12.6% 13.8%
30.2%
29.6%
28.0% 25.3%
25.4% 24.8%
0%
10%
20%
30%
40%
50%
FY 2011 FY 2012 FY 2013 FY 2014 FY 2015 Q1 2016
Pre-tax distributable earnings as % of Total Revenue Non-comp Expenses as a % of Total Revenue
1Q 2016 non-comp expenses were 24.8% of distributable earnings revenues – approximately 20 basis
points lower compared with 1Q 2015
Pre-tax distributable earnings margin was 13.8% for 1Q 2016 vs. 13.3% in 1Q 2015
Post-tax distributable earnings margin was 11.7% in 1Q 2016 vs. 11.0% in 1Q 2015
Date
26
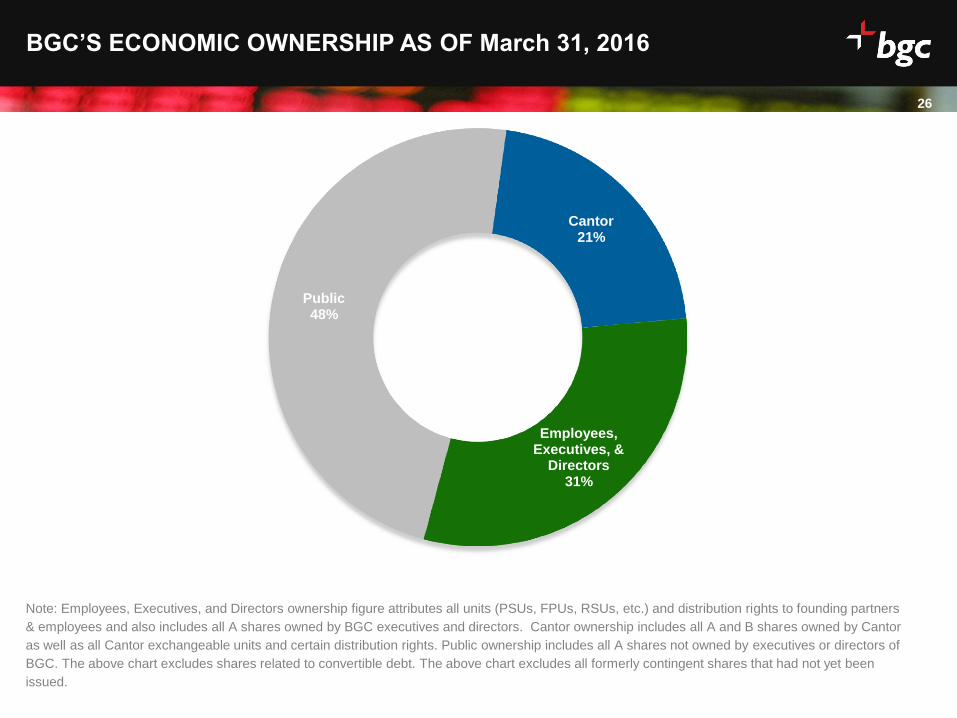
BGC’S ECONOMIC OWNERSHIP AS OF March 31, 2016
Public 48%
Cantor 21%
Employees, Executives, &
Directors 31%
Note: Employees, Executives, and Directors ownership figure attributes all units (PSUs, FPUs, RSUs, etc.) and distribution rights to founding partners
& employees and also includes all A shares owned by BGC executives and directors. Cantor ownership includes all A and B shares owned by Cantor
as well as all Cantor exchangeable units and certain distribution rights. Public ownership includes all A shares not owned by executives or directors of
BGC. The above chart excludes shares related to convertible debt. The above chart excludes all formerly contingent shares that had not yet been
issued.
Date
27
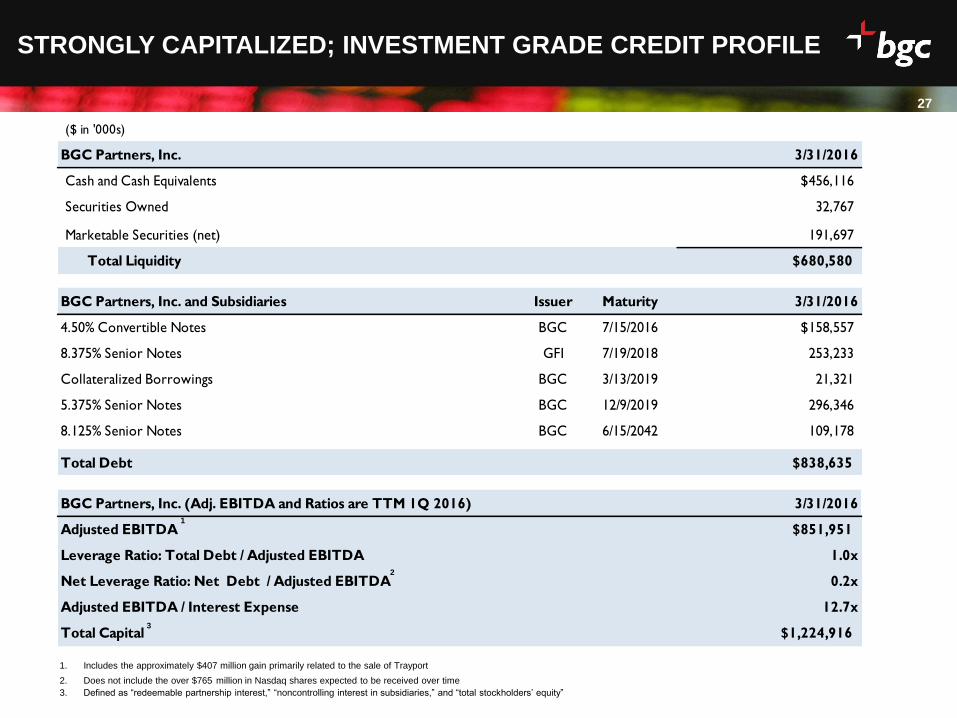
STRONGLY CAPITALIZED; INVESTMENT GRADE CREDIT PROFILE
($ in '000s)
BGC Partners, Inc. 3/31/2016
Cash and Cash Equivalents $456,116
Securities Owned 32,767
Marketable Securities (net) 191,697
Total Liquidity $680,580
BGC Partners, Inc. and Subsidiaries Issuer Maturity 3/31/2016
4.50% Convertible Notes BGC 7/15/2016 $158,557
8.375% Senior Notes GFI 7/19/2018 253,233
Collateralized Borrowings BGC 3/13/2019 21,321
5.375% Senior Notes BGC 12/9/2019 296,346
8.125% Senior Notes BGC 6/15/2042 109,178
Total Debt $838,635
BGC Partners, Inc. (Adj. EBITDA and Ratios are TTM 1Q 2016) 3/31/2016
Adjusted EBITDA $851,951
Leverage Ratio: Total Debt / Adjusted EBITDA 1.0x
Net Leverage Ratio: Net Debt / Adjusted EBITDA 0.2x
Adjusted EBITDA / Interest Expense 12.7x
Total Capital $1,224,916
2
1. Includes the approximately $407 million gain primarily related to the sale of Trayport
2. Does not include the over $765 million in Nasdaq shares expected to be received over time
3. Defined as “redeemable partnership interest,” “noncontrolling interest in subsidiaries,” and “total stockholders’ equity”
3
1
Date
28
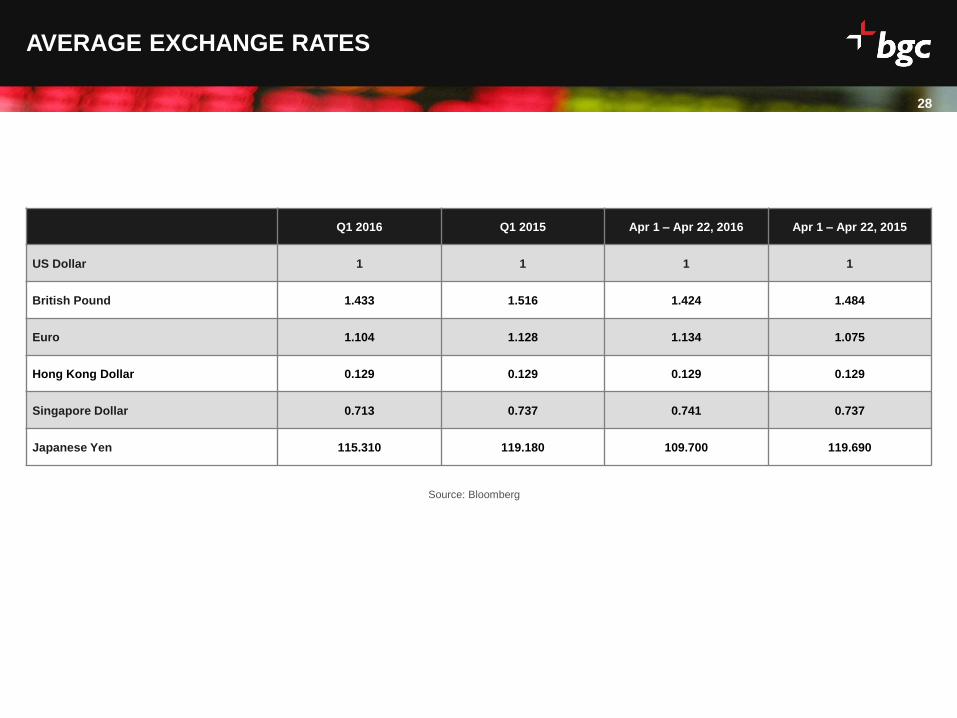
AVERAGE EXCHANGE RATES
Source: Bloomberg
28
Q1 2016 Q1 2015 Apr 1 – Apr 22, 2016 Apr 1 – Apr 22, 2015
US Dollar 1 1 1 1
British Pound 1.433 1.516 1.424 1.484
Euro 1.104 1.128 1.134 1.075
Hong Kong Dollar 0.129 0.129 0.129 0.129
Singapore Dollar 0.713 0.737 0.741 0.737
Japanese Yen 115.310 119.180 109.700 119.690
Date
29
DISTRIBUTABLE EARNINGS DEFINED
29
Distributable Earnings Defined
BGC Partners uses non-GAAP financial measures including "revenues for distributable earnings," "pre-tax distributable earnings" and "post-tax distributable earnings," which are
supplemental measures of operating performance that are used by management to evaluate the financial performance of the Company and its consolidated subsidiaries. BGC Partners
believes that distributable earnings best reflect the operating earnings generated by the Company on a consolidated basis and are the earnings which management considers available for
distribution to BGC Partners, Inc. and its common stockholders, as well as to holders of BGC Holdings partnership units during any period.
As compared with "income (loss) from operations before income taxes," "net income (loss) for fully diluted shares," and "fully diluted earnings (loss) per share," all prepared in accordance
with GAAP, distributable earnings calculations primarily exclude certain non-cash compensation and other expenses which generally do not involve the receipt or outlay of cash by the
Company, which do not dilute existing stockholders, and which do not have economic consequences, as described below. In addition, distributable earnings calculations exclude certain
gains and charges that management believes do not best reflect the ordinary operating results of BGC.
Revenues for distributable earnings are defined as GAAP revenues excluding the impact of BGC Partners, Inc.'s non-cash earnings or losses related to its equity investments. Revenues for
distributable earnings include the collection of receivables which would have been recognized for GAAP other than for the effect of acquisition accounting. Revenues for distributable
earnings also exclude certain one-time or unusual gains that are recognized under GAAP, because the Company does not believe such gains are reflective of its ongoing, ordinary
operations.
Pre-tax distributable earnings are defined as GAAP income (loss) from operations before income taxes excluding items that are primarily non-cash, non-dilutive, and non-economic, such as:
Non-cash compensation charges for items granted or issued pre-merger with respect to mergers or acquisitions by BGC Partners, Inc. This includes the merger with and into eSpeed,
Inc. and the back-end merger with GFI Group Inc.
Non-cash, non-dilutive equity-based compensation related to limited partnership unit exchange or conversion.
Allocations of net income to founding/working partner and other limited partnership units.
Non-cash asset impairment charges, if any.
Distributable earnings calculations also exclude charges related to purchases, cancellations or redemptions of partnership interests and certain unusual, one-time or non-recurring items, if
any.
“Compensation and employee benefits” expense for distributable earnings will also include broker commission payouts relating to the aforementioned collection of receivables.
BGC’s definition of distributable earnings also excludes certain gains and charges with respect to acquisitions, dispositions, or resolutions of litigation. This exclusion includes the one-time
gains related to the Nasdaq and Trayport transactions. The calculation of distributable earnings also excludes the non-cash mark-to-market gains or losses related to the shares of
Intercontinental Exchange, Inc. received in connection with the Trayport sale. Management believes that excluding these gains and charges best reflects the ongoing operating performance
of BGC.
However, because Nasdaq is expected to pay BGC in an equal amount of stock on a regular basis for a 15 year period as part of that transaction, the payments associated with BGC’s
receipt of such stock are expected to be included in the Company’s calculation of distributable earnings. To make period-to-period comparisons more meaningful, one-quarter of the annual
contingent earn-out amount, as well as gains or losses with respect to associated mark-to-market movements and/or hedging, will be included in the Company’s calculation of distributable
earnings each quarter as “other revenues.”
Investors and analysts should note that, due to the large gain recorded with respect to the Trayport sale in December, 2015, and the closing of the back-end merger with GFI in January,
2016, non-cash charges related to the amortization of intangibles with respect to acquisitions will be excluded from the calculation of pre-tax distributable earnings for periods beginning with
the first quarter of 2016. These charges were $5.0 million in the first quarter of 2016.
Date
DISTRIBUTABLE EARNINGS DEFINED (CONTINUED)
Investors and analysts should note that, due to the large gain recorded with respect to the Trayport sale in December, 2015, and the closing of the back-end merger with GFI in January, 2016,
non-cash charges related to the amortization of intangibles with respect to acquisitions will be excluded from the calculation of pre-tax distributable earnings for periods beginning with the first
quarter of 2016. These charges were approximately $5 million in the first quarter of 2016. For periods beginning with the first quarter of 2016, non-cash charges related primarily to the
amortization of GFI employee forgivable loans granted prior to the closing of the January 11, 2016 back-end merger with GFI will be excluded from the calculation of pre-tax distributable
earnings. In the first quarter of 2016, these charges were approximately $3.9 million.
Since distributable earnings are calculated on a pre-tax basis, management intends to also report "post-tax distributable earnings" and "post-tax distributable earnings per fully diluted share:"
"Post-tax distributable earnings" are defined as pre-tax distributable earnings adjusted to assume that all pre-tax distributable earnings were taxed at the same effective rate.
"Post-tax distributable earnings per fully diluted share" are defined as post-tax distributable earnings divided by the weighted-average number of fully diluted shares for the period.
BGC’s distributable earnings per share calculations assume either that:
The fully diluted share count includes the shares related to the dilutive instruments, such as the Convertible Senior Notes, but excludes the associated interest expense, net of tax, when
the impact would be dilutive; or
The fully diluted share count excludes the shares related to these instruments, but includes the associated interest expense, net of tax.
The share count for distributable earnings excludes shares expected to be issued in future periods but not yet eligible to receive dividends and/or distributions.
Each quarter, the dividend to BGC’s common stockholders is expected to be determined by the Company’s Board of Directors with reference to post-tax distributable earnings per fully diluted
share. In addition to the Company’s quarterly dividend to common stockholders, BGC Partners expects to pay a pro-rata distribution of net income to BGC Holdings founding/working partner
and other limited partnership units, as well as to Cantor for its non-controlling interest. The amount of all of these payments is expected to be determined using the above definition of pre-tax
distributable earnings per share.
The term “distributable earnings” is not meant to be an exact measure of cash generated by operations and available for distribution, nor should it be considered in isolation or as an alternative
to cash flow from operations or GAAP net income (loss.) The Company views distributable earnings as a metric that is not necessarily indicative of liquidity or the cash available to fund its
operations.
Pre- and post-tax distributable earnings are not intended to replace the Company’s presentation of GAAP financial results. However, management believes that they help provide investors
with a clearer understanding of BGC Partners’ financial performance and offer useful information to both management and investors regarding certain financial and business trends related to
the Company’s financial condition and results of operations. Management believes that distributable earnings and the GAAP measures of financial performance should be considered
together.
Management does not anticipate providing an outlook for GAAP “revenues,” “income (loss) from operations before income taxes,” “net income (loss) for fully diluted shares,” and “fully diluted
earnings (loss) per share,” because the items previously identified as excluded from “pre-tax distributable earnings” and “post-tax distributable earnings” are difficult to forecast. Management
will instead provide its outlook only as it relates to “revenues for distributable earnings,” “pre-tax distributable earnings,” and “post-tax distributable earnings.”
For more information on this topic, please see the tables in the most recent BGC financial results press release entitled “Reconciliation of Revenues Under GAAP and Distributable Earnings,”
and “Reconciliation of GAAP Income (Loss) to Distributable Earnings,” which provide a summary reconciliation between pre- and post-tax distributable earnings and the corresponding GAAP
measures for the Company in the periods discussed in this document. The reconciliations for prior periods do not include the results of GFI.
30
Date
31
ADJUSTED EBITDA DEFINED
Adjusted EBITDA Defined
BGC also provides an additional non-GAAP financial measure, “adjusted EBITDA,” which it defines as GAAP income from operations
before income taxes, adjusted to add back interest expense as well as the following non-cash items:
Employee loan amortization;
Fixed asset depreciation and intangible asset amortization;
Non-cash impairment charges;
Charges relating to grants of exchangeability to limited partnership interests;
Charges related to redemption of units;
Charges related to issuance of restricted shares; and
Non-cash earnings or losses related to BGC’s equity investments.
The Company’s management believes that this measure is useful in evaluating BGC’s operating performance compared to that of its
peers, because the calculation of adjusted EBITDA generally eliminates the effects of financing and income taxes and the accounting
effects of capital spending and acquisitions, which would include impairment charges of goodwill and intangibles created from acquisitions.
Such items may vary for different companies for reasons unrelated to overall operating performance. As a result, the Company’s
management uses these measures to evaluate operating performance and for other discretionary purposes. BGC believes that adjusted
EBITDA is useful to investors to assist them in getting a more complete picture of the Company’s financial results and operations.
Since adjusted EBITDA is not a recognized measurement under GAAP, investors should use adjusted EBITDA in addition to GAAP
measures of net income when analyzing BGC’s operating performance. Because not all companies use identical EBITDA calculations, the
Company’s presentation of adjusted EBITDA may not be comparable to similarly titled measures of other companies. Furthermore,
adjusted EBITDA is not intended to be a measure of free cash flow, because adjusted EBITDA does not consider certain cash
requirements, such as tax and debt service payments.
For a reconciliation of adjusted EBITDA to GAAP income (loss) from operations before income taxes, the most comparable financial
measure calculated and presented in accordance with GAAP, see the section of this document titled "Reconciliation of GAAP Income
(loss) to Adjusted EBITDA (and Comparison to Pre-Tax Distributable Earnings.)”
31
Date
32
RECONCILIATION OF GAAP INCOME TO ADJUSTED EBITDA
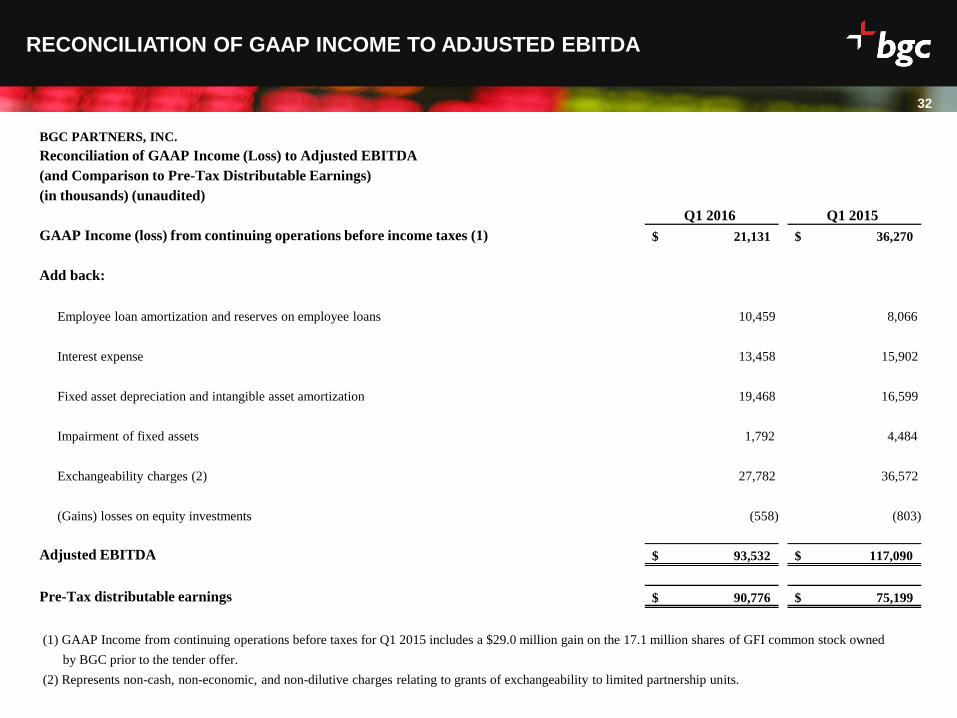
BGC PARTNERS, INC.
Reconciliation of GAAP Income (Loss) to Adjusted EBITDA
(and Comparison to Pre-Tax Distributable Earnings)
(in thousands) (unaudited)
Q1 2016 Q1 2015
GAAP Income (loss) from continuing operations before income taxes (1) 21,131 $ 36,270 $
Add back:
Employee loan amortization and reserves on employee loans 10,459 8,066
Interest expense 13,458 15,902
Fixed asset depreciation and intangible asset amortization 19,468 16,599
Impairment of fixed assets 1,792 4,484
Exchangeability charges (2) 27,782 36,572
(Gains) losses on equity investments (558) (803)
Adjusted EBITDA 93,532 $ 117,090 $
Pre-Tax distributable earnings 90,776 $ 75,199 $
(1) GAAP Income from continuing operations before taxes for Q1 2015 includes a $29.0 million gain on the 17.1 million shares of GFI common stock owned
by BGC prior to the tender offer.
(2) Represents non-cash, non-economic, and non-dilutive charges relating to grants of exchangeability to limited partnership units.
Date
33
RECONCILIATION OF INCOME UNDER GAAP TO DISTRIBUTABLE EARNINGS
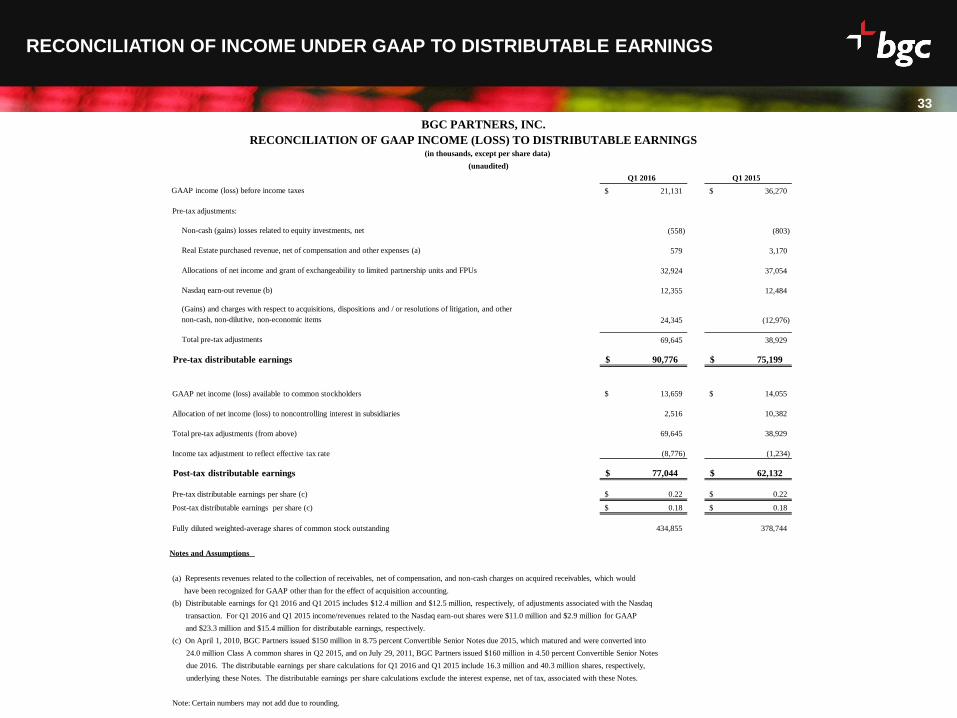
Q1 2016 Q1 2015
GAAP income (loss) before income taxes 21,131 $ 36,270 $
Pre-tax adjustments:
Non-cash (gains) losses related to equity investments, net (558) (803)
Real Estate purchased revenue, net of compensation and other expenses (a) 579 3,170
Allocations of net income and grant of exchangeability to limited partnership units and FPUs 32,924 37,054
Nasdaq earn-out revenue (b) 12,355 12,484
(Gains) and charges with respect to acquisitions, dispositions and / or resolutions of litigation, and other
non-cash, non-dilutive, non-economic items 24,345 (12,976)
Total pre-tax adjustments 69,645 38,929
Pre-tax distributable earnings 90,776 $ 75,199 $
GAAP net income (loss) available to common stockholders 13,659 $ 14,055 $
Allocation of net income (loss) to noncontrolling interest in subsidiaries 2,516 10,382
Total pre-tax adjustments (from above) 69,645 38,929
Income tax adjustment to reflect effective tax rate (8,776) (1,234)
Post-tax distributable earnings 77,044 $ 62,132 $
Pre-tax distributable earnings per share (c) 0.22 $ 0.22 $
Post-tax distributable earnings per share (c) 0.18 $ 0.18 $
Fully diluted weighted-average shares of common stock outstanding 434,855 378,744
Notes and Assumptions
(a) Represents revenues related to the collection of receivables, net of compensation, and non-cash charges on acquired receivables, which would
have been recognized for GAAP other than for the effect of acquisition accounting.
(b) Distributable earnings for Q1 2016 and Q1 2015 includes $12.4 million and $12.5 million, respectively, of adjustments associated with the Nasdaq
transaction. For Q1 2016 and Q1 2015 income/revenues related to the Nasdaq earn-out shares were $11.0 million and $2.9 million for GAAP
and $23.3 million and $15.4 million for distributable earnings, respectively.
(c) On April 1, 2010, BGC Partners issued $150 million in 8.75 percent Convertible Senior Notes due 2015, which matured and were converted into
24.0 million Class A common shares in Q2 2015, and on July 29, 2011, BGC Partners issued $160 million in 4.50 percent Convertible Senior Notes
due 2016. The distributable earnings per share calculations for Q1 2016 and Q1 2015 include 16.3 million and 40.3 million shares, respectively,
underlying these Notes. The distributable earnings per share calculations exclude the interest expense, net of tax, associated with these Notes.
Note: Certain numbers may not add due to rounding.
BGC PARTNERS, INC.
RECONCILIATION OF GAAP INCOME (LOSS) TO DISTRIBUTABLE EARNINGS (in thousands, except per share data)
(unaudited)
Date
34
34
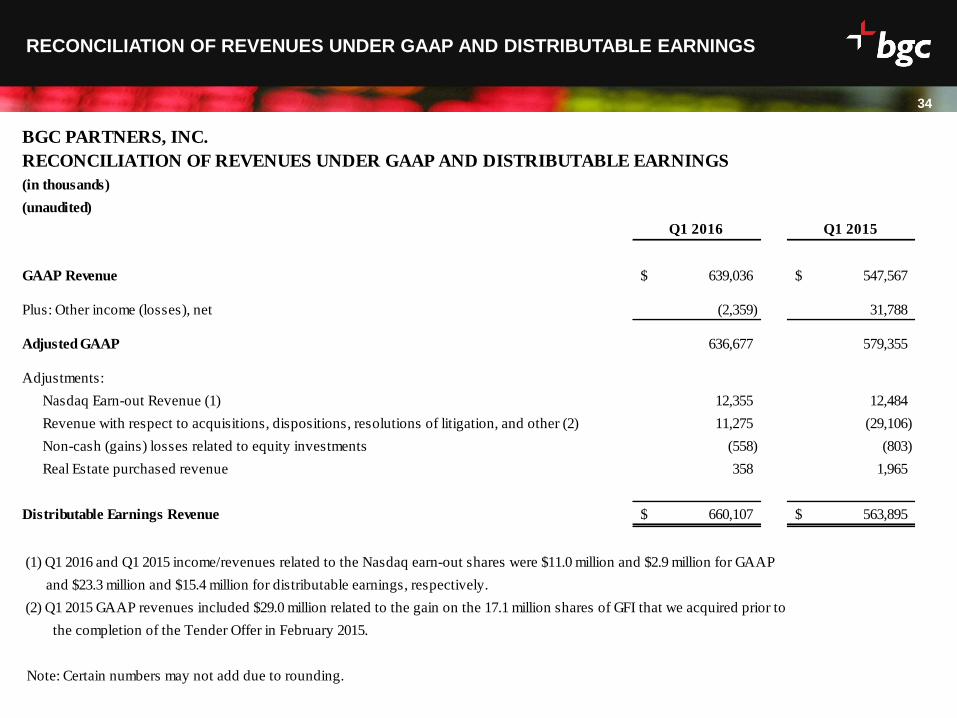
RECONCILIATION OF REVENUES UNDER GAAP AND DISTRIBUTABLE EARNINGS
BGC PARTNERS, INC.
RECONCILIATION OF REVENUES UNDER GAAP AND DISTRIBUTABLE EARNINGS
(in thousands)
(unaudited)
Q1 2016 Q1 2015
GAAP Revenue 639,036$ 547,567$
Plus: Other income (losses), net (2,359) 31,788
Adjusted GAAP 636,677 579,355
Adjustments:
Nasdaq Earn-out Revenue (1) 12,355 12,484
Revenue with respect to acquisitions, dispositions, resolutions of litigation, and other (2) 11,275 (29,106)
Non-cash (gains) losses related to equity investments (558) (803)
Real Estate purchased revenue 358 1,965
Distributable Earnings Revenue 660,107$ 563,895$
(1) Q1 2016 and Q1 2015 income/revenues related to the Nasdaq earn-out shares were $11.0 million and $2.9 million for GAAP
and $23.3 million and $15.4 million for distributable earnings, respectively.
(2) Q1 2015 GAAP revenues included $29.0 million related to the gain on the 17.1 million shares of GFI that we acquired prior to
the completion of the Tender Offer in February 2015.
Note: Certain numbers may not add due to rounding.
Date
35
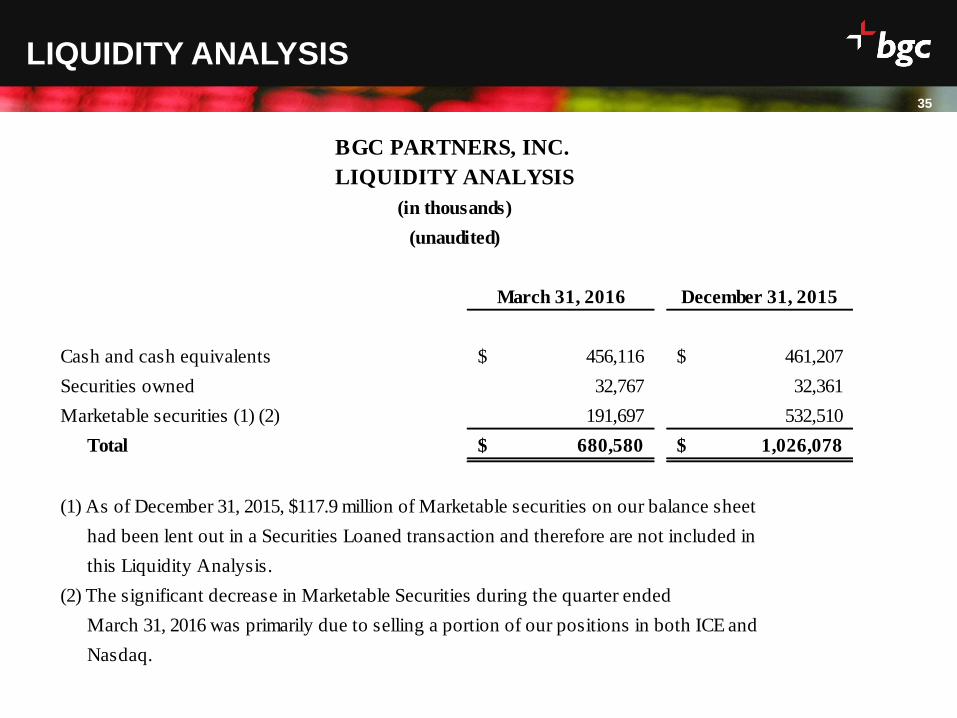
35
LIQUIDITY ANALYSIS
March 31, 2016 December 31, 2015
Cash and cash equivalents 456,116$ 461,207$
Securities owned 32,767 32,361
Marketable securities (1) (2) 191,697 532,510
Total 680,580$ 1,026,078$
(1) As of December 31, 2015, $117.9 million of Marketable securities on our balance sheet
had been lent out in a Securities Loaned transaction and therefore are not included in
this Liquidity Analysis.
(2) The significant decrease in Marketable Securities during the quarter ended
March 31, 2016 was primarily due to selling a portion of our positions in both ICE and
Nasdaq.
BGC PARTNERS, INC.
LIQUIDITY ANALYSIS
(in thousands)
(unaudited)

Date
36 36
bgcpartners.com