1q 2019 sea - bp.com · – reported oil and gas production for the quarter averaged 3.8 million...
TRANSCRIPT
FOR IMMEDIATE RELEASE
London 30 April 2019
BP p.l.c. Group resultsFirst quarter 2019Highlights Resilient earnings and cash flow, continued strategic progress• Earnings and cash flow
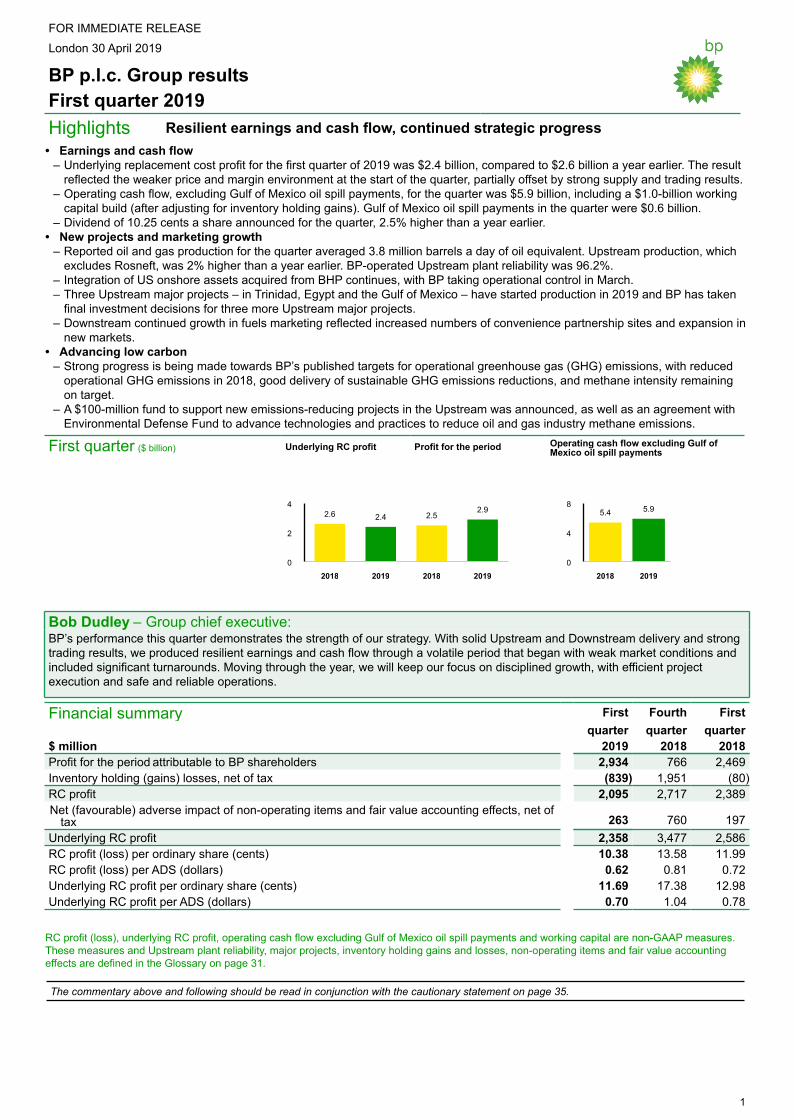
– Underlying replacement cost profit for the first quarter of 2019 was $2.4 billion, compared to $2.6 billion a year earlier. The resultreflected the weaker price and margin environment at the start of the quarter, partially offset by strong supply and trading results.
– Operating cash flow, excluding Gulf of Mexico oil spill payments, for the quarter was $5.9 billion, including a $1.0-billion workingcapital build (after adjusting for inventory holding gains). Gulf of Mexico oil spill payments in the quarter were $0.6 billion.
– Dividend of 10.25 cents a share announced for the quarter, 2.5% higher than a year earlier.• New projects and marketing growth
– Reported oil and gas production for the quarter averaged 3.8 million barrels a day of oil equivalent. Upstream production, whichexcludes Rosneft, was 2% higher than a year earlier. BP-operated Upstream plant reliability was 96.2%.
– Integration of US onshore assets acquired from BHP continues, with BP taking operational control in March. – Three Upstream major projects – in Trinidad, Egypt and the Gulf of Mexico – have started production in 2019 and BP has taken
final investment decisions for three more Upstream major projects.– Downstream continued growth in fuels marketing reflected increased numbers of convenience partnership sites and expansion in
new markets.• Advancing low carbon
– Strong progress is being made towards BP’s published targets for operational greenhouse gas (GHG) emissions, with reducedoperational GHG emissions in 2018, good delivery of sustainable GHG emissions reductions, and methane intensity remainingon target.
– A $100-million fund to support new emissions-reducing projects in the Upstream was announced, as well as an agreement withEnvironmental Defense Fund to advance technologies and practices to reduce oil and gas industry methane emissions.
1
First quarter ($ billion) Underlying RC profit Profit for the period Operating cash flow excluding Gulf ofMexico oil spill payments
4
2
0
2018 2019 2018 2019
2.6 2.4 2.52.9
8
4
0
2018 2019
5.4 5.9
Bob Dudley – Group chief executive:BP’s performance this quarter demonstrates the strength of our strategy. With solid Upstream and Downstream delivery and strongtrading results, we produced resilient earnings and cash flow through a volatile period that began with weak market conditions andincluded significant turnarounds. Moving through the year, we will keep our focus on disciplined growth, with efficient projectexecution and safe and reliable operations.
Financial summary First Fourth Firstquarter quarter quarter
$ million 2019 2018 2018Profit for the period attributable to BP shareholders 2,934 766 2,469Inventory holding (gains) losses, net of tax (839) 1,951 (80)RC profit 2,095 2,717 2,389Net (favourable) adverse impact of non-operating items and fair value accounting effects, net of
tax 263 760 197Underlying RC profit 2,358 3,477 2,586RC profit (loss) per ordinary share (cents) 10.38 13.58 11.99RC profit (loss) per ADS (dollars) 0.62 0.81 0.72Underlying RC profit per ordinary share (cents) 11.69 17.38 12.98Underlying RC profit per ADS (dollars) 0.70 1.04 0.78
RC profit (loss), underlying RC profit, operating cash flow excluding Gulf of Mexico oil spill payments and working capital are non-GAAP measures.These measures and Upstream plant reliability, major projects, inventory holding gains and losses, non-operating items and fair value accountingeffects are defined in the Glossary on page 31.
The commentary above and following should be read in conjunction with the cautionary statement on page 35.

Effects on key financial metrics of the adoption of IFRS 16 'Leases'A new IFRS standard on leases came into effect on 1 January 2019. The impact on key financial metrics for the first quarter is shownbelow.
Balance sheetAs a result of the adoption of IFRS 16, $9.6 billion of right-of-useassets and $10.3 billion of lease liabilities have been included inthe group balance sheet as at 31 March 2019. The majority ofthese were previously reported as operating leases and so werenot previously recognized on the balance sheet. The total leaseliability also includes leases that were previously classified asfinance leases under IAS 17, which totalled $0.7 billion at 31December 2018. Lease liabilities are now presented separatelyon the group balance sheet, do not form part of finance debt andare not included in net debt and gearing in the financialframework.
Income statementThe increase in depreciation from recognizing right-of-useassets and interest on the lease liability is largely offset by theabsence of operating lease expenses, resulting in no materialoverall effect on group profit measures.
Cash flowIn prior years, operating lease payments were presented asoperating cash flows* or capital expenditure*. Lease paymentsare now split into payments of principal that are presented asfinancing cash flows, and payments of interest that arepresented as operating cash flows. There were $0.6 billion oflease payments of principal included within financing cash flowsfor the first quarter of 2019. BP estimates that $0.5 billion ofthese would have been reported as operating cash outflow and$0.1 billion would have been reported as capital expenditurewithout the adoption of IFRS 16.
Impact of$ billion IFRS 16Balance sheet at 31 March 2019Fixed assets 9.6Lease liabilities 10.3Income statement for the first quarter 2019Operating lease expenses(a) ~0.6 –Depreciation, depletion and amortization 0.5 +Interest charge 0.1 +Replacement cost profit* NegligibleCash flow for the first quarter 2019Operating cash flow ~0.5 +Capital expenditure ~0.1 +Lease payments 0.6 –Free cash flow* Nil
(a) Included in production and manufacturing expenses anddistribution and administration expenses under IAS 17.
See pages 17-19, 22 and 24 for more information.
BP p.l.c. Group results First quarter 2019
2

Group headlinesResults For the first quarter, underlying replacement cost (RC) profit*was $2,358 million, compared with $2,586 million in 2018.Underlying RC profit is after adjusting RC profit* for a netcharge for non-operating items* of $252 million and net adversefair value accounting effects* of $11 million (both on a post-taxbasis). RC profit was $2,095 million for the first quarter, compared with$2,389 million in 2018.BP’s profit for the first quarter was $2,934 million, comparedwith $2,469 million for the same period in 2018. See further information on pages 4, 26 and 27.Depreciation, depletion and amortizationThe charge for depreciation, depletion and amortization was$4.5 billion in the quarter. In the same period in 2018 it was $3.9billion (prior to the adoption of IFRS 16). In 2019, we expect thefull-year charge to be around $2.5 billion higher than 2018reflecting the depreciation of the right of use assets recognizedunder IFRS 16 (expected to be offset in the income statementas operating lease expenses will no longer appear in theincome statement).Non-operating itemsNon-operating items amounted to a post-tax charge of $252million for the quarter. See further information on page 26.Effective tax rateThe effective tax rate (ETR) on RC profit or loss* for the firstquarter was 42%, compared with 36% for the same period in2018. Adjusting for non-operating items and fair valueaccounting effects, the underlying ETR* for the first quarter was40%, compared with 37% for the same period a year ago. Thehigher underlying ETR for the first quarter reflects charges foradjustments in respect of prior years. In the current environmentthe underlying ETR in 2019 is expected to be around 40%. ETRon RC profit or loss and underlying ETR are non-GAAPmeasures. DividendBP today announced a quarterly dividend of 10.25 cents perordinary share ($0.615 per ADS), which is expected to be paidon 21 June 2019. The corresponding amount in sterling will beannounced on 10 June 2019. See page 22 for furtherinformation.
Share buybacksBP repurchased 6 million ordinary shares at a cost of $50million, including fees and stamp duty, during the first quarter of2019. Our share buyback programme is expected to beweighted to the second half of 2019 and to fully offset theimpact of scrip dilution since the third quarter 2017 by the end of2019.Operating cash flow*Excluding post-tax amounts related to the Gulf of Mexico oilspill, operating cash flow* for the first quarter was $5.9 billion,including a $1.0-billion working capital* build (after adjusting forinventory holding gains* and excluding Gulf of Mexico oil spillworking capital effects). For the same period in 2018 wereported $5.4 billion (prior to the implementation of IFRS 16). Including amounts relating to the Gulf of Mexico oil spill,operating cash flow for the first quarter was $5.3 billion (after a$2.7-billion working capital build). For the same period in 2018we reported $3.6 billion (prior to the implementation of IFRS16). See page 29 for further information on Gulf of Mexico oil spillcash flows and on working capital. Capital expenditure*Organic capital expenditure* for the first quarter was $3.6 billion.We reported $3.5 billion for the same period in 2018 (prior to theimplementation of IFRS 16). Inorganic capital expenditure* for the first quarter was $2.0billion, including $1.7 billion relating to the BHP acquisition,compared with $0.4 billion for the same period in 2018. Organic capital expenditure and inorganic capital expenditureare non-GAAP measures. See page 25 for further information. Divestment and other proceedsDivestment proceeds* were $0.6 billion for the first quarter,compared with $0.2 billion for the same period in 2018. Gearing*Net debt* at 31 March 2019 was $45.1 billion, compared with$39.3 billion a year ago. Gearing at 31 March 2019 was 30.4%,compared with 30.0% at the end of 2018 and 27.8% a year ago.Net debt and gearing are non-GAAP measures. See page 22 formore information.
Brian Gilvary – Chief financial officer:Our first quarter results reflect the effects of IFRS 16 for the first time. While this impacts a number of lines across our financialstatements, our financial framework is unchanged. In particular, we have retained a measure of gearing broadly consistent with thepast, and continue to target a range of 20-30%.
* For items marked with an asterisk throughout this document, definitions are provided in the Glossary on page 31.
The commentary above contains forward-looking statements and should be read in conjunction with the cautionary statement on page 35.
BP p.l.c. Group results First quarter 2019
3
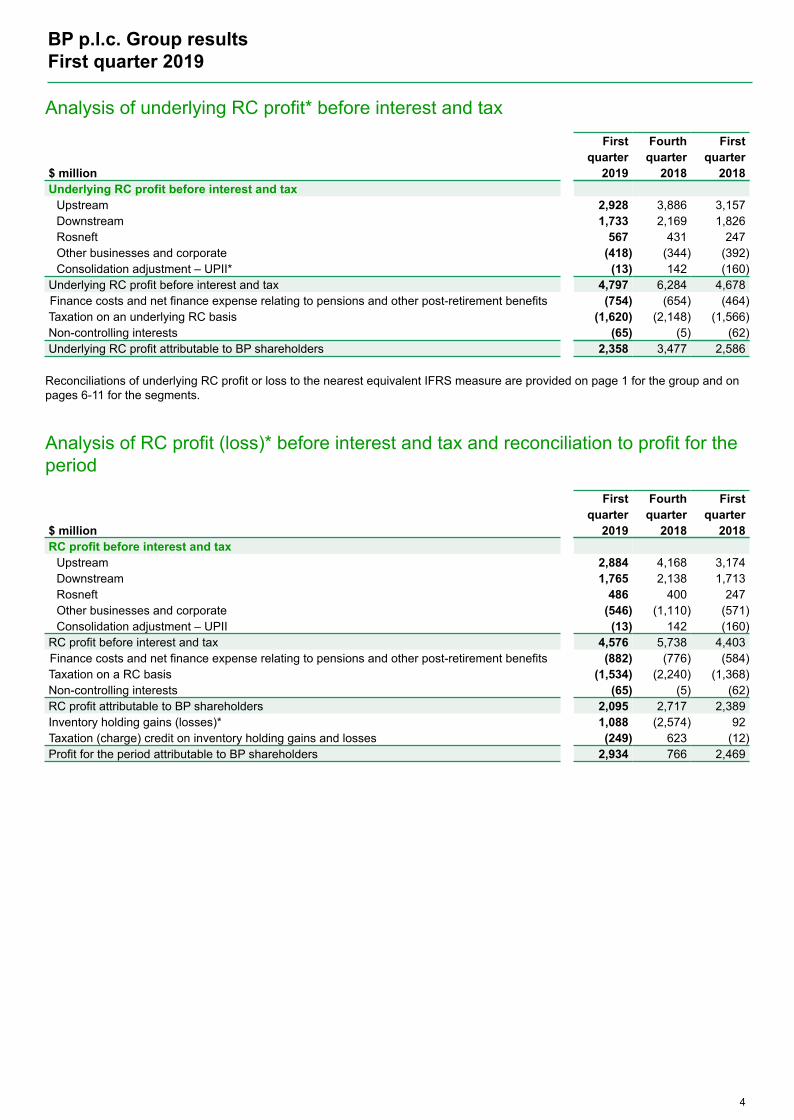
Analysis of underlying RC profit* before interest and tax
First Fourth Firstquarter quarter quarter
$ million 2019 2018 2018Underlying RC profit before interest and tax
Upstream 2,928 3,886 3,157Downstream 1,733 2,169 1,826Rosneft 567 431 247Other businesses and corporate (418) (344) (392)Consolidation adjustment – UPII* (13) 142 (160)
Underlying RC profit before interest and tax 4,797 6,284 4,678Finance costs and net finance expense relating to pensions and other post-retirement benefits (754) (654) (464)Taxation on an underlying RC basis (1,620) (2,148) (1,566)Non-controlling interests (65) (5) (62)Underlying RC profit attributable to BP shareholders 2,358 3,477 2,586
Reconciliations of underlying RC profit or loss to the nearest equivalent IFRS measure are provided on page 1 for the group and onpages 6-11 for the segments.
Analysis of RC profit (loss)* before interest and tax and reconciliation to profit for theperiod
First Fourth Firstquarter quarter quarter
$ million 2019 2018 2018RC profit before interest and tax
Upstream 2,884 4,168 3,174Downstream 1,765 2,138 1,713Rosneft 486 400 247Other businesses and corporate (546) (1,110) (571)Consolidation adjustment – UPII (13) 142 (160)
RC profit before interest and tax 4,576 5,738 4,403Finance costs and net finance expense relating to pensions and other post-retirement benefits (882) (776) (584)Taxation on a RC basis (1,534) (2,240) (1,368)Non-controlling interests (65) (5) (62)RC profit attributable to BP shareholders 2,095 2,717 2,389Inventory holding gains (losses)* 1,088 (2,574) 92Taxation (charge) credit on inventory holding gains and losses (249) 623 (12)Profit for the period attributable to BP shareholders 2,934 766 2,469
BP p.l.c. Group results First quarter 2019
4

Strategic progress Upstream Upstream production, excluding Rosneft, for the quarter was2,656mboe/d, 2% higher than a year earlier due to acquisition of theBHP assets and growth of major projects*. Upstream plantreliability* was 96.2%. Upstream unit production costs* were $7.39/boe.Constellation in the Gulf of Mexico was the first Upstream majorproject to come onstream in 2019, followed by the second stage ofthe West Nile Delta development, the Giza and Fayoum fields, inEgypt and the Angelin development offshore Trinidad. These are thefirst of five Upstream major projects expected to begin production in2019. BP has now safely brought 22 new upstream major projectsinto production since 2016, remaining on track to deliver900,000boe/d from new projects by 2021.Since the start of the year, BP has taken final investment decisionson the Atlantis Phase 3 development in the Gulf of Mexico, AzeriCentral East in Azerbaijan and Seagull in the UK North Sea. On 1 March, BPX Energy assumed full control of the BHP acquiredUS field operations. In March, BP confirmed a gas discovery, operated by Eni, in theNour North Sinai offshore prospect in the Egyptian EasternMediterranean.
DownstreamIncreased year-on-year fuels marketing earnings reflected higherpremium fuels volumes and the continued roll-out of conveniencepartnership sites. Expansion in new markets continued, includingnew sites opening in Mexico, Indonesia and China. In the quarter BP opened its first BP-branded retail site in ShandongProvince, China.BP and Lotte agreed an expansion of capacity at their joint ventureacetyls petrochemicals site in South Korea, helping to meet growingregional demand.BP also signed an agreement with Virent and Johnson Matthey toadvance the development of bio-paraxylene, a raw material for theproduction of renewable polyester.
Advancing the energy transitionBP announced progress against its near-term targets for operationalGHG emissions: 2018 operational emissions were 1.7 million tonnesCO2 equivalent (MteCO2e) lower than 2017; 2.5MteCO2esustainable GHG emissions reductions have been generatedthroughout BP’s operations since the beginning of 2016; andmethane intensity was maintained at 0.2% in 2018.
At the end of the quarter BP announced the establishment of a newinitiative under which up to $100-million will be made available overthe next three years to support projects across the Upstream todeliver new emissions reductions. BP has also entered into anagreement with Environmental Defense Fund to collaborate indevelopment of technologies and practices to accelerate reductionof methane emissions across the oil and gas industry. BP opened two dedicated electric vehicle charging stations in thequarter, the first in China, in partnership with 66i Fuel, and thesecond in the UK.
Financial frameworkFollowing the introduction of IFRS 16, the positive impacts onOperating cash flow* and Organic capital expenditure* are fullyoffset in the cash flow statement by a new line, Lease liabilitypayments. Lease payments are now included in the definition of freecash flow* as a use of cash, which means the net impact on thismeasure is zero following the adoption of IFRS 16.
Operating cash flow excluding Gulf of Mexico oil spill payments*was $5.9 billion for the first quarter of 2019. For the first quarter of2018, we reported $5.4 billion (prior to the implementation of IFRS16).
Organic capital expenditure for the first quarter of 2019 was $3.6billion. BP expects 2019 organic capital expenditure to be in therange of $15-17 billion.
Lease liability payments of principal for the first quarter of 2019were $0.6 billion.
Divestments and other proceeds were $0.6 billion for the quarter.
Gulf of Mexico oil spill payments on a post-tax basis totalled $0.6billion in the quarter. Payments for the full year are expected to bearound $2 billion on a post-tax basis.
Gearing* at the end of the quarter was 30.4%. Assuming recentaverage oil prices, and in line with expected growth in free cash flowsupported by divestment proceeds, we expect gearing to movetowards the middle of our targeted range of 20-30% in 2020. Seepage 22 for more information.
SafetyBP has introduced a new safety operating metric including tier 2 aswell as tier 1 process safety events, giving a wider view of processsafety within BP’s operations. The increase compared to the firstquarter 2018 was mainly due to a higher number of tier 2 events.
Operating metrics First quarter 2019 Financial metrics First quarter 2019(vs. First quarter 2018) (vs. First quarter 2018)
Tier 1 and tier 2 processsafety events*
28 Underlying RC profit* $2.4bn(+15) (-$0.2bn)
Reported recordable injuryfrequency*
0.16 Operating cash flow excludingGulf of Mexico oil spillpayments (post-tax)(c)
$5.9bn(-22%) (+$0.6bn)
Group production 3,822mboe/d Organic capital expenditure $3.6bn(+2.4%) (+$0.1bn)
Upstream production(excludes Rosneft segment)
2,656mboe/d Gulf of Mexico oil spillpayments (post-tax)
$0.6bn(+2.0%) (-$1.1bn)
Upstream unit productioncosts(a)
$7.39/boe Divestment proceeds* $0.6bn(-3.9%) (+$0.4bn)
BP-operated Upstream plantreliability
96.2% Gearing 30.4%(+0.3) (+2.6)
BP-operated refiningavailability*(b)
94.3% Dividend per ordinary share(d) 10.25 cents(-0.5) (+2.5%)
(a) Broadly flat with the same period in 2018 after excluding the impacts of IFRS 16 on production costs. (b) From the first quarter 2019 refining availability has changed to BP-operated refining availability to more closely align to the BP-operated
upstream plant reliability measure.(c) 1Q19 includes estimated $0.5 billion impact due to IFRS 16.(d) Represents dividend announced in the quarter (vs. prior year quarter).
The commentary above contains forward-looking statements and should be read in conjunction with the cautionary statement on page 35.
BP p.l.c. Group results First quarter 2019
5
UpstreamFirst Fourth First
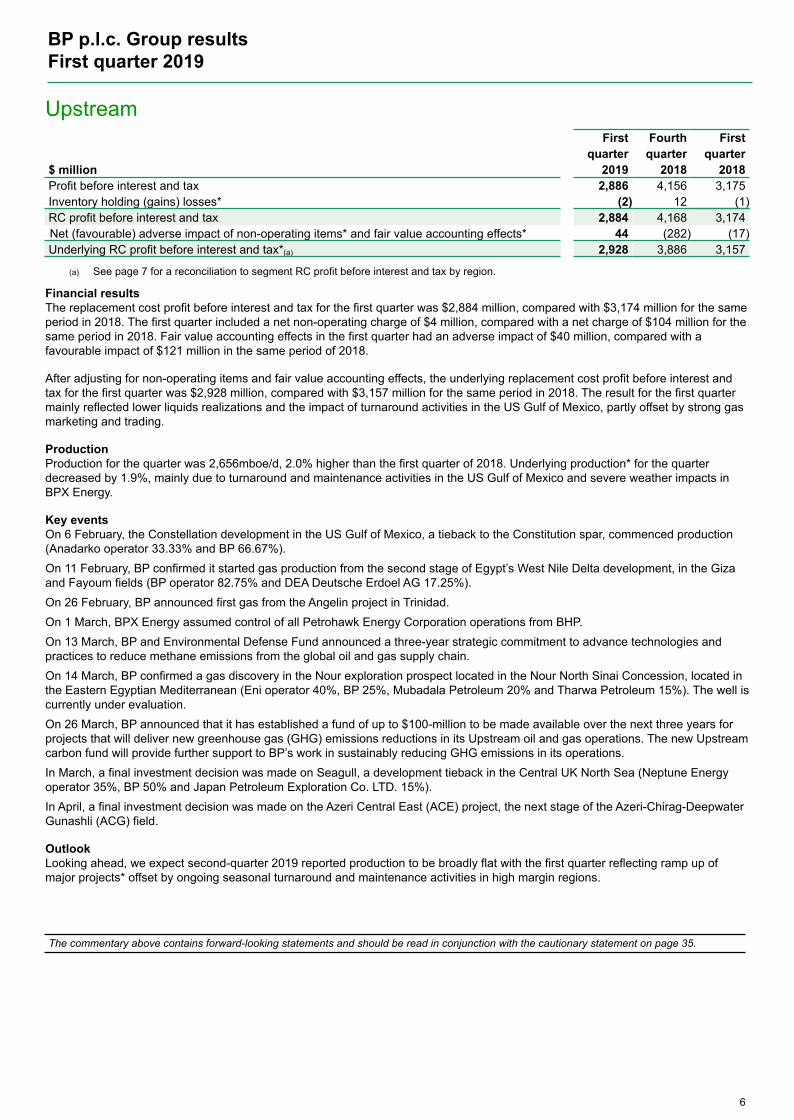
quarter quarter quarter$ million 2019 2018 2018Profit before interest and tax 2,886 4,156 3,175Inventory holding (gains) losses* (2) 12 (1)RC profit before interest and tax 2,884 4,168 3,174Net (favourable) adverse impact of non-operating items* and fair value accounting effects* 44 (282) (17)Underlying RC profit before interest and tax*(a) 2,928 3,886 3,157
(a) See page 7 for a reconciliation to segment RC profit before interest and tax by region.
Financial resultsThe replacement cost profit before interest and tax for the first quarter was $2,884 million, compared with $3,174 million for the sameperiod in 2018. The first quarter included a net non-operating charge of $4 million, compared with a net charge of $104 million for thesame period in 2018. Fair value accounting effects in the first quarter had an adverse impact of $40 million, compared with afavourable impact of $121 million in the same period of 2018.
After adjusting for non-operating items and fair value accounting effects, the underlying replacement cost profit before interest andtax for the first quarter was $2,928 million, compared with $3,157 million for the same period in 2018. The result for the first quartermainly reflected lower liquids realizations and the impact of turnaround activities in the US Gulf of Mexico, partly offset by strong gasmarketing and trading.
ProductionProduction for the quarter was 2,656mboe/d, 2.0% higher than the first quarter of 2018. Underlying production* for the quarterdecreased by 1.9%, mainly due to turnaround and maintenance activities in the US Gulf of Mexico and severe weather impacts inBPX Energy.
Key eventsOn 6 February, the Constellation development in the US Gulf of Mexico, a tieback to the Constitution spar, commenced production(Anadarko operator 33.33% and BP 66.67%).On 11 February, BP confirmed it started gas production from the second stage of Egypt’s West Nile Delta development, in the Gizaand Fayoum fields (BP operator 82.75% and DEA Deutsche Erdoel AG 17.25%).On 26 February, BP announced first gas from the Angelin project in Trinidad.On 1 March, BPX Energy assumed control of all Petrohawk Energy Corporation operations from BHP.On 13 March, BP and Environmental Defense Fund announced a three-year strategic commitment to advance technologies andpractices to reduce methane emissions from the global oil and gas supply chain.On 14 March, BP confirmed a gas discovery in the Nour exploration prospect located in the Nour North Sinai Concession, located inthe Eastern Egyptian Mediterranean (Eni operator 40%, BP 25%, Mubadala Petroleum 20% and Tharwa Petroleum 15%). The well iscurrently under evaluation. On 26 March, BP announced that it has established a fund of up to $100-million to be made available over the next three years forprojects that will deliver new greenhouse gas (GHG) emissions reductions in its Upstream oil and gas operations. The new Upstreamcarbon fund will provide further support to BP’s work in sustainably reducing GHG emissions in its operations.In March, a final investment decision was made on Seagull, a development tieback in the Central UK North Sea (Neptune Energyoperator 35%, BP 50% and Japan Petroleum Exploration Co. LTD. 15%).In April, a final investment decision was made on the Azeri Central East (ACE) project, the next stage of the Azeri-Chirag-DeepwaterGunashli (ACG) field.
OutlookLooking ahead, we expect second-quarter 2019 reported production to be broadly flat with the first quarter reflecting ramp up ofmajor projects* offset by ongoing seasonal turnaround and maintenance activities in high margin regions.
The commentary above contains forward-looking statements and should be read in conjunction with the cautionary statement on page 35.
BP p.l.c. Group results First quarter 2019
6
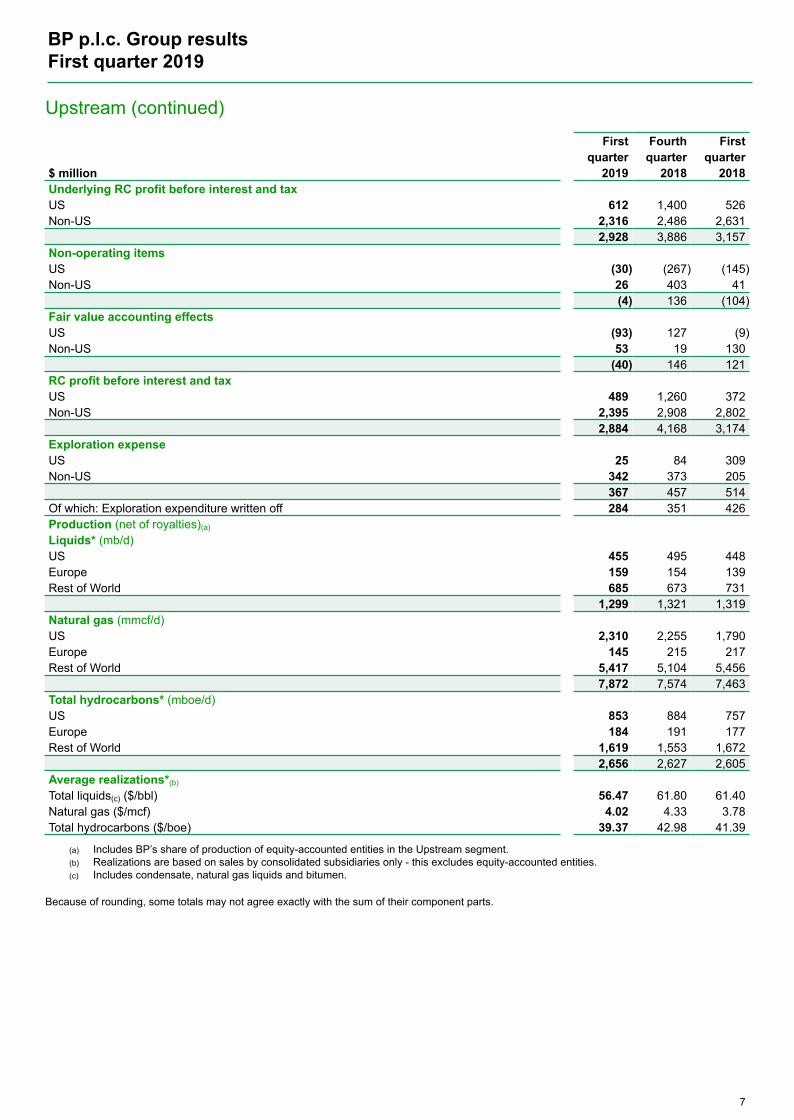
Upstream (continued)
First Fourth Firstquarter quarter quarter
$ million 2019 2018 2018Underlying RC profit before interest and taxUS 612 1,400 526Non-US 2,316 2,486 2,631
2,928 3,886 3,157Non-operating itemsUS (30) (267) (145)Non-US 26 403 41
(4) 136 (104)Fair value accounting effectsUS (93) 127 (9)Non-US 53 19 130
(40) 146 121RC profit before interest and taxUS 489 1,260 372Non-US 2,395 2,908 2,802
2,884 4,168 3,174Exploration expenseUS 25 84 309Non-US 342 373 205
367 457 514Of which: Exploration expenditure written off 284 351 426Production (net of royalties)(a)
Liquids* (mb/d)US 455 495 448Europe 159 154 139Rest of World 685 673 731
1,299 1,321 1,319Natural gas (mmcf/d)US 2,310 2,255 1,790Europe 145 215 217Rest of World 5,417 5,104 5,456
7,872 7,574 7,463Total hydrocarbons* (mboe/d)US 853 884 757Europe 184 191 177Rest of World 1,619 1,553 1,672
2,656 2,627 2,605Average realizations*(b)
Total liquids(c) ($/bbl) 56.47 61.80 61.40Natural gas ($/mcf) 4.02 4.33 3.78Total hydrocarbons ($/boe) 39.37 42.98 41.39
(a) Includes BP’s share of production of equity-accounted entities in the Upstream segment.(b) Realizations are based on sales by consolidated subsidiaries only - this excludes equity-accounted entities.(c) Includes condensate, natural gas liquids and bitumen.
Because of rounding, some totals may not agree exactly with the sum of their component parts.
BP p.l.c. Group results First quarter 2019
7

DownstreamFirst Fourth First
quarter quarter quarter$ million 2019 2018 2018Profit (loss) before interest and tax 2,811 (332) 1,782Inventory holding (gains) losses* (1,046) 2,470 (69)RC profit before interest and tax 1,765 2,138 1,713Net (favourable) adverse impact of non-operating items* and fair value accounting effects* (32) 31 113Underlying RC profit before interest and tax*(a) 1,733 2,169 1,826
(a) See page 9 for a reconciliation to segment RC profit before interest and tax by region and by business.
Financial resultsThe replacement cost profit before interest and tax for the first quarter was $1,765 million, compared with $1,713 million for the sameperiod in 2018. The first quarter includes a net non-operating charge of $4 million, compared with a charge of $53 million for the same period in2018. Fair value accounting effects had a favourable impact of $36 million in the first quarter, compared with an adverse impact of$60 million for the same period in 2018.After adjusting for non-operating items and fair value accounting effects, the underlying replacement cost profit before interest andtax for the first quarter was $1,733 million, compared with $1,826 million for the same period in 2018. Replacement cost profit before interest and tax for the fuels, lubricants and petrochemicals businesses is set out on page 9.
FuelsThe fuels business reported an underlying replacement cost profit before interest and tax of $1,292 million for the first quarter,compared with $1,398 million for the same period in 2018. The year-on-year movement was driven by lower refining margins,partially offset by a strong contribution from supply and trading and higher fuels marketing earnings.The refining result for the quarter reflects the impact of lower industry refining margins and narrower North American heavy crude oildiscounts.The fuels marketing result for the quarter primarily reflects year-on-year retail earnings growth, benefiting from higher premiumvolumes, the continued roll out of our convenience partnership model and further expansion in new markets, most notably Mexico.In the quarter we opened our first BP-branded retail station in Shandong Province, through our joint venture with Dongming. Thismarks the start of our plan to add 1,000 new sites over the next five years to our existing network in China of more than 740 sites.
LubricantsThe lubricants business reported an underlying replacement cost profit before interest and tax of $272 million for the first quarter,compared with $331 million for the same period in 2018. The result for the quarter reflects continued adverse foreign exchange ratemovements and one-off impacts related to the completion of a systems implementation.
PetrochemicalsThe petrochemicals business reported an underlying replacement cost profit before interest and tax of $169 million for the firstquarter, compared with $97 million for the same period in 2018. The result for the quarter reflects increased margin optimization anda lower level of turnaround activity. In the quarter we agreed an expansion of capacity at our joint venture petrochemicals facility in South Korea which will help us tomeet the region’s growing acetyls demand. We also continued to make progress in our commitment to a low carbon future, signingan agreement with Virent and Johnson Matthey to further advance the development of bio-paraxylene, a key raw material for theproduction of renewable polyester.
OutlookLooking to the second quarter of 2019, we expect higher industry refining margins, a similar level of North American heavy crude oildiscounts and a significantly higher level of turnaround activity.
The commentary above contains forward-looking statements and should be read in conjunction with the cautionary statement on page 35.
BP p.l.c. Group results First quarter 2019
8

Downstream (continued)First Fourth First
quarter quarter quarter$ million 2019 2018 2018Underlying RC profit before interest and tax - by regionUS 531 995 589Non-US 1,202 1,174 1,237
1,733 2,169 1,826Non-operating itemsUS 1 (109) (17)Non-US (5) (292) (36)
(4) (401) (53)Fair value accounting effects(a)
US 61 184 (121)Non-US (25) 186 61
36 370 (60)RC profit before interest and taxUS 593 1,070 451Non-US 1,172 1,068 1,262
1,765 2,138 1,713Underlying RC profit before interest and tax - by business(b)(c)
Fuels 1,292 1,624 1,398Lubricants 272 311 331Petrochemicals 169 234 97
1,733 2,169 1,826Non-operating items and fair value accounting effects(a)
Fuels 37 173 (110)Lubricants (4) (198) (3)Petrochemicals (1) (6) —
32 (31) (113)RC profit before interest and tax(b)(c)
Fuels 1,329 1,797 1,288Lubricants 268 113 328Petrochemicals 168 228 97
1,765 2,138 1,713
BP average refining marker margin (RMM)* ($/bbl) 10.2 11.0 11.7
Refinery throughputs (mb/d)US 735 691 715Europe 767 735 797Rest of World 237 240 249
1,739 1,666 1,761BP-operated refining availability* (%) 94.3 95.6 94.8
Marketing sales of refined products (mb/d)US 1,077 1,138 1,096Europe 993 1,053 1,045Rest of World 520 526 481
2,590 2,717 2,622Trading/supply sales of refined products 3,296 3,199 3,181Total sales volumes of refined products 5,886 5,916 5,803
Petrochemicals production (kte)US 601 672 499Europe 1,160 1,037 1,128Rest of World 1,299 1,259 1,391
3,060 2,968 3,018
(a) For Downstream, fair value accounting effects arise solely in the fuels business. See page 27 for further information.(b) Segment-level overhead expenses are included in the fuels business result.(c) Results from petrochemicals at our Gelsenkirchen and Mülheim sites in Germany are reported in the fuels business.
BP p.l.c. Group results First quarter 2019
9

Rosneft
First Fourth Firstquarter quarter quarter
$ million 2019(a) 2018 2018Profit before interest and tax(b)(c) 526 308 269Inventory holding (gains) losses* (40) 92 (22)RC profit before interest and tax 486 400 247Net charge (credit) for non-operating items* 81 31 —Underlying RC profit before interest and tax* 567 431 247
Financial resultsReplacement cost (RC) profit before interest and tax for the first quarter was $486 million, compared with $247 million for the sameperiod in 2018. After adjusting for a non-operating item, the underlying RC profit before interest and tax for the first quarter was $567 million. Therewere no non-operating items in the first quarter of 2018.Compared with the same period in 2018, the result for the first quarter primarily reflects favourable foreign exchange effects, partiallyoffset by the impact of lower oil prices.On 16 April 2019, Rosneft announced that the board of directors had recommended that the annual general meeting (AGM) adopts aresolution to pay dividends of 11.33 roubles per ordinary share, which would bring the total dividend for 2018 to 25.91 roubles perordinary share, which constitutes 50% of the company’s IFRS net profit. In addition to the dividend received in October 2018 inrelation to the results for the first half of 2018, BP expects to receive later this year a dividend of 21.3 billion roubles, after thededuction of withholding tax, subject to approval at the AGM.
First Fourth Firstquarter quarter quarter2019(a) 2018 2018
Production (net of royalties) (BP share)Liquids* (mb/d) 937 946 902Natural gas (mmcf/d) 1,327 1,312 1,307Total hydrocarbons* (mboe/d) 1,166 1,173 1,127
(a) The operational and financial information of the Rosneft segment for the first quarter is based on preliminary operational and financialresults of Rosneft for the three months ended 31 March 2019. Actual results may differ from these amounts.
(b) The Rosneft segment result includes equity-accounted earnings arising from BP’s 19.75% shareholding in Rosneft as adjusted for theaccounting required under IFRS relating to BP’s purchase of its interest in Rosneft and the amortization of the deferred gain relating to thedivestment of BP’s interest in TNK-BP. These adjustments increase the segment's reported profit before interest and tax, as shown in thetable above, compared with the amounts reported in Rosneft’s IFRS financial statements.
(c) BP’s adjusted share of Rosneft’s earnings after Rosneft's own finance costs, taxation and non-controlling interests is included in the BPgroup income statement within profit before interest and taxation. For each year-to-date period it is calculated by translating the amountsreported in Russian roubles into US dollars using the average exchange rate for the year to date.
BP p.l.c. Group results First quarter 2019
10

Other businesses and corporate
First Fourth Firstquarter quarter quarter
$ million 2019 2018 2018Profit (loss) before interest and tax (546) (1,110) (571)Inventory holding (gains) losses* — — —RC profit (loss) before interest and tax (546) (1,110) (571)Net charge (credit) for non-operating items* 128 766 179Underlying RC profit (loss) before interest and tax* (418) (344) (392)Underlying RC profit (loss) before interest and taxUS (155) (179) (147)Non-US (263) (165) (245)
(418) (344) (392)Non-operating itemsUS (128) (654) (148)Non-US — (112) (31)
(128) (766) (179)RC profit (loss) before interest and taxUS (283) (833) (295)Non-US (263) (277) (276)
(546) (1,110) (571)
Other businesses and corporate comprises our alternative energy business, shipping, treasury, corporate activities includingcentralized functions, and any residual costs of the Gulf of Mexico oil spill.Financial resultsThe replacement cost loss before interest and tax for the first quarter was $546 million, compared with $571 million for the sameperiod in 2018. The results included a net non-operating charge of $128 million for the first quarter, primarily relating to costs of the Gulf of Mexico oilspill, compared with a charge of $179 million for the same period in 2018.After adjusting for non-operating items, the underlying replacement cost loss before interest and tax for the first quarter was $418million, compared with $392 million for the same period in 2018.
Alternative EnergyThe net ethanol-equivalent production (which includes ethanol and sugar) for the first quarter was 14 million litres, compared with 7.6million litres for the same period in 2018. Net wind generation capacity* was 1,001MW at 31 March 2019, compared with 1,432MW at 31 March 2018. BP’s net share of windgeneration for the first quarter was 773GWh, compared with 1,217GWh for the same period in 2018. The lower production for thequarter is due to divestments in the fourth quarter of 2018.Lightsource BP announced that the Green Energy Equity Fund, managed by its Indian joint venture, EverSource Capital, ispartnering with the National Investment and Infrastructure Fund and CDC Group plc to invest a total of $330 million in AyanaRenewable Power. Ayana was launched to develop utility scale solar and wind generation projects in India.
OutlookDuring 2019, Other businesses and corporate average quarterly charges, excluding non-operating items, are expected to be around$350 million although this will fluctuate quarter to quarter.
The commentary above contains forward-looking statements and should be read in conjunction with the cautionary statement on page 35.
BP p.l.c. Group results First quarter 2019
11

Financial statements
BP p.l.c. Group results First quarter 2019
12
Group income statement
First Fourth Firstquarter quarter quarter
$ million 2019 2018 2018
Sales and other operating revenues (Note 3) 66,321 75,677 68,172Earnings from joint ventures – after interest and tax 185 236 293Earnings from associates – after interest and tax 649 425 414Interest and other income 163 295 159Gains on sale of businesses and fixed assets 89 252 105Total revenues and other income 67,407 76,885 69,143Purchases 48,272 59,019 51,512Production and manufacturing expenses 5,356 6,173 5,438Production and similar taxes (Note 5) 424 186 368Depreciation, depletion and amortization (Note 4) 4,461 3,987 3,931Impairment and losses on sale of businesses and fixed assets 96 244 91Exploration expense 367 457 514Distribution and administration expenses 2,767 3,655 2,794Profit (loss) before interest and taxation 5,664 3,164 4,495Finance costs 867 742 553Net finance expense relating to pensions and other post-retirement benefits 15 34 31Profit (loss) before taxation 4,782 2,388 3,911Taxation 1,783 1,617 1,380Profit (loss) for the period 2,999 771 2,531Attributable to
BP shareholders 2,934 766 2,469Non-controlling interests 65 5 62
2,999 771 2,531
Earnings per share (Note 6)Profit (loss) for the period attributable to BP shareholders
Per ordinary share (cents)Basic 14.54 3.83 12.40Diluted 14.47 3.80 12.33
Per ADS (dollars)Basic 0.87 0.23 0.74Diluted 0.87 0.23 0.74

Condensed group statement of comprehensive income
First Fourth Firstquarter quarter quarter
$ million 2019 2018 2018
Profit (loss) for the period 2,999 771 2,531Other comprehensive incomeItems that may be reclassified subsequently to profit or loss
Currency translation differences 989 (937) 531Cash flow hedges and costs of hedging 19 (68) (82)Share of items relating to equity-accounted entities, net of tax (50) 200 155Income tax relating to items that may be reclassified (34) 33 (90)
924 (772) 514Items that will not be reclassified to profit or loss
Remeasurements of the net pension and other post-retirement benefit liability or asset (853) (651) 865Cash flow hedges that will subsequently be transferred to the balance sheet 8 (8) 13Income tax relating to items that will not be reclassified 273 223 (265)
(572) (436) 613Other comprehensive income 352 (1,208) 1,127Total comprehensive income 3,351 (437) 3,658Attributable to
BP shareholders 3,281 (444) 3,580Non-controlling interests 70 7 78
3,351 (437) 3,658
BP p.l.c. Group results First quarter 2019
13

Condensed group statement of changes in equity
BP shareholders’ Non-controlling Total$ million equity interests equityAt 31 December 2018 99,444 2,104 101,548Adjustment on adoption of IFRS 16, net of tax(a) (329) (1) (330)At 1 January 2019 99,115 2,103 101,218
Total comprehensive income 3,281 70 3,351Dividends (1,435) (36) (1,471)Cash flow hedges transferred to the balance sheet, net of tax 5 — 5Repurchase of ordinary share capital (50) — (50)Share-based payments, net of tax 280 — 280Share of equity-accounted entities’ changes in equity, net of tax 3 — 3At 31 March 2019 101,199 2,137 103,336
BP shareholders’ Non-controlling Total$ million equity interests equityAt 31 December 2017 98,491 1,913 100,404Adjustment on adoption of IFRS 9, net of tax(b) (180) — (180)At 1 January 2018 98,311 1,913 100,224
Total comprehensive income 3,580 78 3,658Dividends (1,828) (13) (1,841)Cash flow hedges transferred to the balance sheet, net of tax 1 — 1Repurchase of ordinary share capital (120) — (120)Share-based payments, net of tax 244 — 244Transactions involving non-controlling interests, net of tax (1) — (1)At 31 March 2018 100,187 1,978 102,165
(a) See Note 1 for further information.(b) See Note 1 in BP Annual Report and Form 20-F 2018 for further information.
BP p.l.c. Group results First quarter 2019
14

Group balance sheet
31 March 31 December$ million 2019 2018(a)
Non-current assetsProperty, plant and equipment 144,625 135,261Goodwill 12,277 12,204Intangible assets 16,505 17,284Investments in joint ventures 8,701 8,647Investments in associates 19,073 17,673Other investments 1,269 1,341Fixed assets 202,450 192,410Loans 642 637Trade and other receivables 2,111 1,834Derivative financial instruments 5,265 5,145Prepayments 814 1,179Deferred tax assets 3,593 3,706Defined benefit pension plan surpluses 5,709 5,955
220,584 210,866Current assetsLoans 340 326Inventories 21,426 17,988Trade and other receivables 24,490 24,478Derivative financial instruments 3,004 3,846Prepayments 1,082 963Current tax receivable 965 1,019Other investments 134 222Cash and cash equivalents 21,256 22,468
72,697 71,310Total assets 293,281 282,176Current liabilitiesTrade and other payables 46,749 46,265Derivative financial instruments 2,340 3,308Accruals 3,924 4,626Lease liabilities 2,099 44Finance debt 11,480 9,329Current tax payable 2,348 2,101Provisions 2,332 2,564
71,272 68,237Non-current liabilitiesOther payables 13,898 13,830Derivative financial instruments 5,294 5,625Accruals 547 575Lease liabilities 8,195 623Finance debt 54,510 55,803Deferred tax liabilities 9,770 9,812Provisions 17,773 17,732Defined benefit pension plan and other post-retirement benefit plan deficits 8,686 8,391
118,673 112,391Total liabilities 189,945 180,628Net assets 103,336 101,548EquityBP shareholders’ equity 101,199 99,444Non-controlling interests 2,137 2,104Total equity 103,336 101,548
(a) Finance debt on the comparative balance sheet has been re-presented to align with the current period. See Note 1 for further information.
BP p.l.c. Group results First quarter 2019
15

Condensed group cash flow statement
First Fourth Firstquarter quarter quarter
$ million 2019 2018 2018Operating activitiesProfit (loss) before taxation 4,782 2,388 3,911Adjustments to reconcile profit (loss) before taxation to net cash provided by operating activities
Depreciation, depletion and amortization and exploration expenditure written off 4,745 4,338 4,357Impairment and (gain) loss on sale of businesses and fixed assets 7 (8) (14)Earnings from equity-accounted entities, less dividends received (589) (30) (536)Net charge for interest and other finance expense, less net interest paid 88 222 80Share-based payments 297 126 237Net operating charge for pensions and other post-retirement benefits, less contributions and
benefit payments for unfunded plans (77) (60) (202)Net charge for provisions, less payments (116) 617 144Movements in inventories and other current and non-current assets and liabilities (2,695) 778 (3,398)Income taxes paid (1,146) (1,542) (933)
Net cash provided by operating activities 5,296 6,829 3,646Investing activitiesExpenditure on property, plant and equipment, intangible and other assets (3,695) (5,962) (3,586)Acquisitions, net of cash acquired (1,795) (6,379) —Investment in joint ventures — (290) (39)Investment in associates (145) (265) (338)Total cash capital expenditure (5,635) (12,896) (3,963)Proceeds from disposal of fixed assets 235 660 85Proceeds from disposal of businesses, net of cash disposed 365 1,758 82Proceeds from loan repayments 55 619 9Net cash used in investing activities (4,980) (9,859) (3,787)Financing activities(a)
Net issue (repurchase) of shares (45) (16) (110)Lease liability payments (617) (11) (10)Proceeds from long-term financing 2,124 2,118 122Repayments of long-term financing (2,640) (1,795) (1,147)Net increase (decrease) in short-term debt 1,089 889 (349)Net increase (decrease) in non-controlling interests — — (1)Dividends paid - BP shareholders (1,435) (1,733) (1,829)
- non-controlling interests (36) (41) (13)Net cash provided by (used in) financing activities (1,560) (589) (3,337)Currency translation differences relating to cash and cash equivalents 32 (105) 145Increase (decrease) in cash and cash equivalents (1,212) (3,724) (3,333)Cash and cash equivalents at beginning of period 22,468 26,192 25,575Cash and cash equivalents at end of period 21,256 22,468 22,242
(a) Financing cash flows for the fourth and first quarters 2018 have been re-presented to align with the current period. See Note 1 for furtherinformation.
BP p.l.c. Group results First quarter 2019
16

Notes
BP p.l.c. Group results First quarter 2019
17
Note 1. Basis of preparation
The interim financial information included in this report has been prepared in accordance with IAS 34 'Interim Financial Reporting'.The results for the interim periods are unaudited and, in the opinion of management, include all adjustments necessary for a fairpresentation of the results for each period. All such adjustments are of a normal recurring nature. This report should be read inconjunction with the consolidated financial statements and related notes for the year ended 31 December 2018 included in BPAnnual Report and Form 20-F 2018.BP prepares its consolidated financial statements included within BP Annual Report and Form 20-F on the basis of InternationalFinancial Reporting Standards (IFRS) as issued by the International Accounting Standards Board (IASB), IFRS as adopted by theEuropean Union (EU) and in accordance with the provisions of the UK Companies Act 2006 as applicable to companies reportingunder IFRS. IFRS as adopted by the EU differs in certain respects from IFRS as issued by the IASB. The differences have no impacton the group’s consolidated financial statements for the periods presented. The financial information presented herein has been prepared in accordance with the accounting policies expected to be used inpreparing BP Annual Report and Form 20-F 2019, which are the same as those used in preparing BP Annual Report and Form 20-F2018 with the exception of the adoption of IFRS 16 'Leases' from 1 January 2019.
New International Financial Reporting Standards adoptedBP adopted IFRS 16 ‘Leases’, which replaced IAS 17 ‘Leases’ and IFRIC 4 ‘Determining whether an arrangement contains a lease’,with effect from 1 January 2019. Further information is included in BP Annual Report and Form 20-F 2018 - Financial statements -Note 1 Significant accounting policies, judgements, estimates and assumptions - Impact of new International Financial ReportingStandards.IFRS 16 provides a new model for lessee accounting in which the majority of leases are accounted for by the recognition on thebalance sheet of a right-of-use asset and a lease liability. Agreements that convey the right to control the use of an identified asset for a period of time in exchange for consideration areaccounted for as leases. A lease liability is recognized at the present value of future lease payments over the reasonably certainlease term. Variable lease payments that do not depend on an index or a rate are not included in the lease liability. The right-of-useasset is recognized at a value equivalent to the initial measurement of the lease liability adjusted for lease prepayments, leaseincentives, initial direct costs and any restoration obligations. The subsequent amortization of the right-of-use asset and the interestexpense related to the lease liability are recognized in the income statement over the lease term. The group recognizes the full lease liability, rather than its working interest share, for leases entered into on behalf of a jointoperation if the group has the primary responsibility for making the lease payments. If the right-of-use asset is jointly controlled by thegroup and the other joint operators, a receivable is recognized for the share of the asset transferred to the other joint operators.BP elected to apply the modified retrospective transition approach in which the cumulative effect of initial application is recognized inopening retained earnings at the date of initial application with no restatement of comparative periods’ financial information.Comparative information in the group balance sheet and group cash flow statement has, however, been re-presented to align withcurrent year presentation, showing lease liabilities and lease liability payments as separate line items. These were previouslyincluded within the finance debt and repayments of long-term financing line items respectively. Amounts presented in these line itemsfor the comparative periods relate to leases accounted for as finance leases under IAS 17.IFRS 16 introduces a revised definition of a lease. As permitted by the standard, BP elected not to reassess the existing populationof leases under the new definition and will only apply the new definition for the assessment of contracts entered into after thetransition date. On transition the standard permits, on a lease-by-lease basis, the right-of-use asset to be measured either at anamount equal to the lease liability (as adjusted for prepaid or accrued lease payments), or on a historical basis as if the standard hadalways applied. BP elected to use the historical asset measurement for its more material leases and used the asset equals liabilityapproach for the remainder of the population. BP also elected to adjust the carrying amounts of the right-of-use assets as at 1January 2019 for onerous lease provisions that had been recognized on the group balance sheet as at 31 December 2018, ratherthan performing impairment tests on transition.

Note 1. Basis of preparation (continued)The effect of the adoption of IFRS 16 on the group balance sheet is set out below.
Adjustment31 December 1 January on adoption
$ million 2018 2019 of IFRS 16Non-current assets
Property, plant and equipment 135,261 143,950 8,689Trade and other receivables 1,834 2,159 325Prepayments 1,179 849 (330)Deferred tax assets 3,706 3,736 30
Current assetsTrade and other receivables 24,478 24,673 195Prepayments 963 872 (91)
Current liabilitiesTrade and other payables 46,265 46,209 (56)Accruals 4,626 4,578 (48)Lease liabilities 44 2,196 2,152Finance debt 9,329 9,329 —Provisions 2,564 2,547 (17)
Non-current liabilitiesOther payables 13,830 14,013 183Accruals 575 548 (27)Lease liabilities 623 7,704 7,081Finance debt 55,803 55,803 —Deferred tax liabilities 9,812 9,767 (45)Provisions 17,732 17,657 (75)
Net assets 101,548 101,218 (330)
EquityBP shareholders' equity 99,444 99,115 (329)Non-controlling interests 2,104 2,103 (1)
101,548 101,218 (330)
The presentation and timing of recognition of charges in the income statement has changed following the adoption of IFRS 16. Theoperating lease expense previously reported under IAS 17, typically on a straight-line basis, has been replaced by depreciation of theright-of-use asset and interest on the lease liability. In the cash flow statement payments are now presented as financing cash flows,representing payments of principal, and as operating cash flows, representing payments of interest. Variable lease payments that donot depend on an index or rate are not included in the lease liability and will continue to be presented as operating cash flows. Inprior years, operating lease payments were principally presented within cash flows from operating activities.The following table provides a reconciliation of the group’s operating lease commitments as at 31 December 2018 to the total leaseliability recognized on the group balance sheet in accordance with IFRS 16 as at 1 January 2019.
$ millionOperating lease commitments at 31 December 2018 11,979
Leases not yet commenced (1,372)Leases below materiality threshold (86)Short-term leases (91)Effect of discounting (1,512)Impact on leases in joint operations 836Variable lease payments (58)Redetermination of lease term (252)Other (22)Total additional lease liabilities recognized on adoption of IFRS 16 9,422Finance lease obligations at 31 December 2018 667Adjustment for finance leases in joint operations (189)Total lease liabilities at 1 January 2019 9,900
BP p.l.c. Group results First quarter 2019
18

Note 1. Basis of preparation (continued)An explanation of each reconciling item shown in the table above is provided in BP Annual Report and Form 20-F 2018 - Financialstatements - Note 1 Significant accounting policies, judgements, estimates and assumptions - Impact of new International FinancialReporting Standards.The total adjustments to the group's lease liabilities at 1 January 2019 are reconciled as follows:
$ millionTotal additional lease liabilities recognized on adoption of IFRS 16 9,422Less: adjustment for finance leases in joint operations (189)Total adjustment to lease liabilities 9,233Of which – current 2,152
– non-current 7,081
BP p.l.c. Group results First quarter 2019
19
Note 2. Analysis of replacement cost profit (loss) before interest and tax andreconciliation to profit (loss) before taxation
First Fourth Firstquarter quarter quarter
$ million 2019 2018 2018Upstream 2,884 4,168 3,174Downstream 1,765 2,138 1,713Rosneft 486 400 247Other businesses and corporate (546) (1,110) (571)
4,589 5,596 4,563Consolidation adjustment – UPII* (13) 142 (160)RC profit (loss) before interest and tax* 4,576 5,738 4,403Inventory holding gains (losses)*
Upstream 2 (12) 1Downstream 1,046 (2,470) 69Rosneft (net of tax) 40 (92) 22
Profit (loss) before interest and tax 5,664 3,164 4,495Finance costs 867 742 553Net finance expense relating to pensions and other post-retirement benefits 15 34 31Profit (loss) before taxation 4,782 2,388 3,911
RC profit (loss) before interest and tax*US 771 1,487 359Non-US 3,805 4,251 4,044
4,576 5,738 4,403

Note 3. Sales and other operating revenues
First Fourth Firstquarter quarter quarter
$ million 2019 2018 2018By segmentUpstream 14,594 15,050 13,870Downstream 58,416 67,733 61,406Other businesses and corporate 356 536 343
73,366 83,319 75,619
Less: sales and other operating revenues between segmentsUpstream 6,324 8,669 6,733Downstream 586 (1,232) 482Other businesses and corporate 135 205 232
7,045 7,642 7,447
Third party sales and other operating revenuesUpstream 8,270 6,381 7,137Downstream 57,830 68,965 60,924Other businesses and corporate 221 331 111Total sales and other operating revenues 66,321 75,677 68,172
By geographical areaUS 21,848 26,890 23,613Non-US 49,618 53,540 51,240
71,466 80,430 74,853Less: sales and other operating revenues between areas 5,145 4,753 6,681
66,321 75,677 68,172
Revenues from contracts with customersSales and other operating revenues include the following in relation to revenues from contractswith customers:Crude oil 14,282 15,448 14,917Oil products 42,583 47,847 44,130Natural gas, LNG and NGLs 5,793 5,862 5,159Non-oil products and other revenues from contracts with customers 3,501 3,618 3,495
66,159 72,775 67,701
BP p.l.c. Group results First quarter 2019
20
Note 4. Depreciation, depletion and amortization
First Fourth Firstquarter quarter quarter
$ million 2019 2018 2018UpstreamUS 1,113 1,137 1,088Non-US 2,498 2,242 2,272
3,611 3,379 3,360DownstreamUS 323 240 219Non-US 383 298 302
706 538 521Other businesses and corporateUS 13 11 16Non-US 131 59 34
144 70 50Total group 4,461 3,987 3,931

Note 5. Production and similar taxes
First Fourth Firstquarter quarter quarter
$ million 2019 2018 2018US 81 99 90Non-US 343 87 278
424 186 368
BP p.l.c. Group results First quarter 2019
21
Note 6. Earnings per share and shares in issue
Basic earnings per ordinary share (EpS) amounts are calculated by dividing the profit (loss) for the period attributable to ordinaryshareholders by the weighted average number of ordinary shares outstanding during the period. During the quarter the companyrepurchased for cancellation 6 million ordinary shares for a total cost of $50 million, as part of the share buyback programme asannounced on 31 October 2017. The number of shares in issue is reduced when shares are repurchased.The calculation of EpS is performed separately for each discrete quarterly period, and for the year-to-date period. As a result, thesum of the discrete quarterly EpS amounts in any particular year-to-date period may not be equal to the EpS amount for the year-to-date period. For the diluted EpS calculation the weighted average number of shares outstanding during the period is adjusted for the number ofshares that are potentially issuable in connection with employee share-based payment plans using the treasury stock method.
First Fourth Firstquarter quarter quarter
$ million 2019 2018 2018Results for the periodProfit (loss) for the period attributable to BP shareholders 2,934 766 2,469Less: preference dividend — — —Profit (loss) attributable to BP ordinary shareholders 2,934 766 2,469
Number of shares (thousand)(a)
Basic weighted average number of shares outstanding 20,175,634 20,007,781 19,918,700ADS equivalent 3,362,605 3,334,630 3,319,783
Weighted average number of shares outstanding used to calculate diluted earnings pershare 20,281,773 20,133,087 20,030,656
ADS equivalent 3,380,295 3,355,514 3,338,442
Shares in issue at period-end 20,330,597 20,101,658 19,943,591ADS equivalent 3,388,432 3,350,276 3,323,931
(a) Excludes treasury shares and includes certain shares that will be issued in the future under employee share-based payment plans.

Note 7. Dividends Dividends payableBP today announced an interim dividend of 10.25 cents per ordinary share which is expected to be paid on 21 June 2019 to ordinaryshareholders and American Depositary Share (ADS) holders on the register on 10 May 2019. The corresponding amount in sterlingis due to be announced on 10 June 2019, calculated based on the average of the market exchange rates for the four dealing dayscommencing on 4 June 2019. Holders of ADSs are expected to receive $0.615 per ADS (less applicable fees). A scrip dividendalternative is available, allowing shareholders to elect to receive their dividend in the form of new ordinary shares and ADS holders inthe form of new ADSs. Details of the first quarter dividend and timetable are available at bp.com/dividends and details of the scripdividend programme are available at bp.com/scrip.
First Fourth Firstquarter quarter quarter
2019 2018 2018Dividends paid per ordinary share
cents 10.250 10.250 10.000pence 7.738 8.025 7.169
Dividends paid per ADS (cents) 61.50 61.50 60.00Scrip dividendsNumber of shares issued (millions) 90.1 47.5 23.4Value of shares issued ($ million) 629 322 155
BP p.l.c. Group results First quarter 2019
22
Note 8. Net debt and net debt including leases
Net debt* First Fourth Firstquarter quarter quarter
$ million 2019 2018 2018Finance debt(a) 65,990 65,132 61,540Fair value (asset) liability of hedges related to finance debt(b) 350 813 46
66,340 65,945 61,586Less: cash and cash equivalents 21,256 22,468 22,242Net debt 45,084 43,477 39,344Equity 103,336 101,548 102,165Gearing 30.4% 30.0% 27.8%
(a) The fair value of finance debt at 31 March 2019 was $67,003 million (31 December 2018 $65,259 million).(b) Derivative financial instruments entered into for the purpose of managing interest rate and foreign currency exchange risk associated with
net debt with a fair value liability position of $609 million (fourth quarter 2018 liability of $827 million and first quarter 2018 liability of $457million) are not included in the calculation of net debt shown above as hedge accounting is not applied for these instruments.
As a result of the adoption of IFRS 16 ‘Leases’, leases that were previously classified as finance leases under IAS 17 are nowpresented as ‘Lease liabilities’ on the group balance sheet and therefore do not form part of finance debt. Comparative informationfor finance debt (previously termed ‘gross debt’), net debt and gearing (previously termed 'net debt ratio') have been amended to beon a consistent basis with amounts presented for 2019. The relevant amounts for finance lease liabilities that have been excludedfrom comparative information are $667 million and $649 million for the fourth and first quarters 2018. The previously disclosedamounts for finance debt for the fourth and first quarters 2018 were $65,799 million and $62,189 million respectively. The previouslydisclosed amounts for net debt for the fourth and first quarters 2018 were $44,144 million and $39,993 million respectively. Thepreviously disclosed amounts for gearing for the fourth and first quarters 2018 were 30.3% and 28.1% respectively.
Net debt including leases* First Fourth Firstquarter quarter quarter
$ million 2019 2018 2018Net debt 45,084 43,477 39,344Lease liabilities 10,294 667 649Net partner (receivable) payable for leases entered into on behalf of joint operations (303) — —Net debt including leases 55,075 44,144 39,993

Note 9. Inventory valuation
A provision of $124 million was held against hydrocarbon inventories at 31 March 2019 ($604 million at 31 December 2018 and $54million at 31 March 2018) to write them down to their net realizable value. The net movement credited to the income statementduring the first quarter 2019 was $480 million (fourth quarter 2018 was a charge of $562 million and first quarter 2018 was a credit of$9 million).
BP p.l.c. Group results First quarter 2019
23
Note 10. Statutory accounts
The financial information shown in this publication, which was approved by the Board of Directors on 29 April 2019, is unaudited anddoes not constitute statutory financial statements. Audited financial information will be published in BP Annual Report and Form 20-F2019. BP Annual Report and Form 20-F 2018 has been filed with the Registrar of Companies in England and Wales. The report ofthe auditor on those accounts was unqualified, did not include a reference to any matters to which the auditor drew attention by wayof emphasis without qualifying the report and did not contain a statement under section 498(2) or section 498(3) of the UKCompanies Act 2006.

Additional information
BP p.l.c. Group results First quarter 2019
24
Effects on the financial statements of the adoption of IFRS 16 ‘Leases’BP adopted IFRS 16 ‘Leases’ with effect from 1 January 2019. The principal effects of the adoption are described below. BP electedto apply the modified retrospective transition approach in which the cumulative effect of initial application is recognized in openingretained earnings at the date of initial application with no restatement of comparative periods’ financial information. For furtherinformation of the effects of adoption see Financial statements - Note 1 and Note 8. Balance sheetAs a result of the adoption of IFRS 16, $9.6 billion of right-of-use assets and $10.3 billion of lease liabilities have been included in thegroup balance sheet as at 31 March 2019. Lease liabilities are now presented separately on the group balance sheet and do notform part of finance debt. Comparative information for finance debt in the group balance sheet has been re-presented to align withcurrent year presentation.
31 March 31 December$ billion 2019 2018Property, plant and equipment(a) (b) 9.6 0.5Lease liabilities(a) 10.3 0.7Finance debt 66.0 65.1
(a) Comparative information represents finance leases accounted for under IAS 17.(b) Net additions to right-of-use assets for the first quarter of 2019 were $0.9 billion.
Income statementThe presentation and timing of recognition of charges in the income statement has changed following the adoption of IFRS 16. Theoperating lease expense reported under the previous lease accounting standard, IAS 17, typically on a straight-line basis, has beenreplaced by depreciation of the right-of-use asset and interest on the lease liability. Depreciation of right-of-use assets for the firstquarter of 2019 was $0.5 billion. Interest on the group’s lease liabilities for the first quarter of 2019 was $0.1 billion. Operating leaseexpenses were previously principally included within Production and manufacturing expenses and Distribution and administrationexpenses in the income statement. It is estimated that the resulting benefit to these line items is offset, in total, by an equivalentamount in depreciation and interest charges. Therefore, there has been no material overall effect on group profit measures in the firstquarter of 2019.Cash flow statementLease payments are now presented as financing cash flows, representing payments of principal, and as operating cash flows,representing payments of interest. In prior years, operating lease payments were presented as operating cash flows and capitalexpenditure. Of the $0.6 billion of lease payments included within financing activities for the first quarter of 2019, it is estimated that$0.5 billion would have been reported as operating cash flows and $0.1 billion would have been reported as capital expenditure cashflows ignoring the effects of IFRS 16.
First Fourth Firstquarter quarter quarter
$ billion 2019 2018 2018Financing activitiesLease liability payments(a) (0.6) — —
(a) Comparative information represents finance leases accounted for under IAS 17.

Capital expenditure*
First Fourth Firstquarter quarter quarter
$ million 2019 2018 2018Capital expenditure on a cash basisOrganic capital expenditure* 3,648 4,402 3,538Inorganic capital expenditure*(a) 1,987 8,494 425
5,635 12,896 3,963
First Fourth Firstquarter quarter quarter
$ million 2019 2018 2018Organic capital expenditure by segmentUpstreamUS 982 1,048 754Non-US 1,888 2,419 2,112
2,870 3,467 2,866DownstreamUS 187 237 171Non-US 534 562 447
721 799 618Other businesses and corporateUS 9 34 7Non-US 48 102 47
57 136 543,648 4,402 3,538
Organic capital expenditure by geographical areaUS 1,178 1,319 932Non-US 2,470 3,083 2,606
3,648 4,402 3,538
(a) On 31 October 2018, BP acquired from BHP Billiton Petroleum (North America) Inc. 100% of the issued share capital of Petrohawk EnergyCorporation, a wholly owned subsidiary of BHP that holds a portfolio of unconventional onshore US oil and gas assets. As at 31 March2019, $8,520 million of the consideration had been paid, including $6,263 million during the fourth quarter 2018 and $1,732 million duringthe first quarter 2019. These amounts are included, net of cash acquired of $104 million in the fourth quarter, in inorganic capitalexpenditure. Fourth quarter 2018 also includes $1,739 million relating to the purchase of an additional 16.5% interest in the Clair field westof Shetland in the North Sea, as part of the agreements with ConocoPhillips in which ConocoPhillips simultaneously purchased BP's entire39.2% interest in the Greater Kuparuk Area on the North Slope of Alaska. First quarter 2019 and first quarter 2018 include amounts relatingto the 25-year extension to our ACG production-sharing agreement* in Azerbaijan.
BP p.l.c. Group results First quarter 2019
25

Non-operating items*
First Fourth Firstquarter quarter quarter
$ million 2019 2018(a) 2018(a)
UpstreamImpairment and gain (loss) on sale of businesses and fixed assets(b) (11) 34 26Environmental and other provisions — (35) —Restructuring, integration and rationalization costs (35) (53) 1Fair value gain (loss) on embedded derivatives — — 7Other 42 190 (138)
(4) 136 (104)DownstreamImpairment and gain (loss) on sale of businesses and fixed assets 4 (20) (14)Environmental and other provisions — (83) —Restructuring, integration and rationalization costs (2) (279) (36)Fair value gain (loss) on embedded derivatives — — —Other (6) (19) (3)
(4) (401) (53)RosneftImpairment and gain (loss) on sale of businesses and fixed assets (81) (31) —Environmental and other provisions — — —Restructuring, integration and rationalization costs — — —Fair value gain (loss) on embedded derivatives — — —Other — — —
(81) (31) —Other businesses and corporateImpairment and gain (loss) on sale of businesses and fixed assets — (6) 2Environmental and other provisions(c) (6) (575) (21)Restructuring, integration and rationalization costs 10 (112) (15)Fair value gain (loss) on embedded derivatives — — —Gulf of Mexico oil spill (115) (67) (86)Other (17) (6) (59)
(128) (766) (179)Total before interest and taxation (217) (1,062) (336)Finance costs(d) (128) (122) (120)Total before taxation (345) (1,184) (456)Taxation credit (charge) on non-operating items 93 (2) 209Total after taxation for period (252) (1,186) (247)
(a) Amounts reported as restructuring, integration and rationalization costs relate to the group's restructuring programme, originally announcedin 2014, which was completed in fourth quarter 2018.
(b) Fourth quarter 2018 includes an impairment reversal for assets in the North Sea and Angola. (c) Fourth quarter 2018 primarily reflects charges due to the annual update of environmental provisions, including asbestos-related provisions
for past operations, together with updates of non-Gulf of Mexico oil spill related legal provisions.(d) Relates to the unwinding of discounting effects relating to Gulf of Mexico oil spill payables.
BP p.l.c. Group results First quarter 2019
26
Non-GAAP information on fair value accounting effects
First Fourth Firstquarter quarter quarter
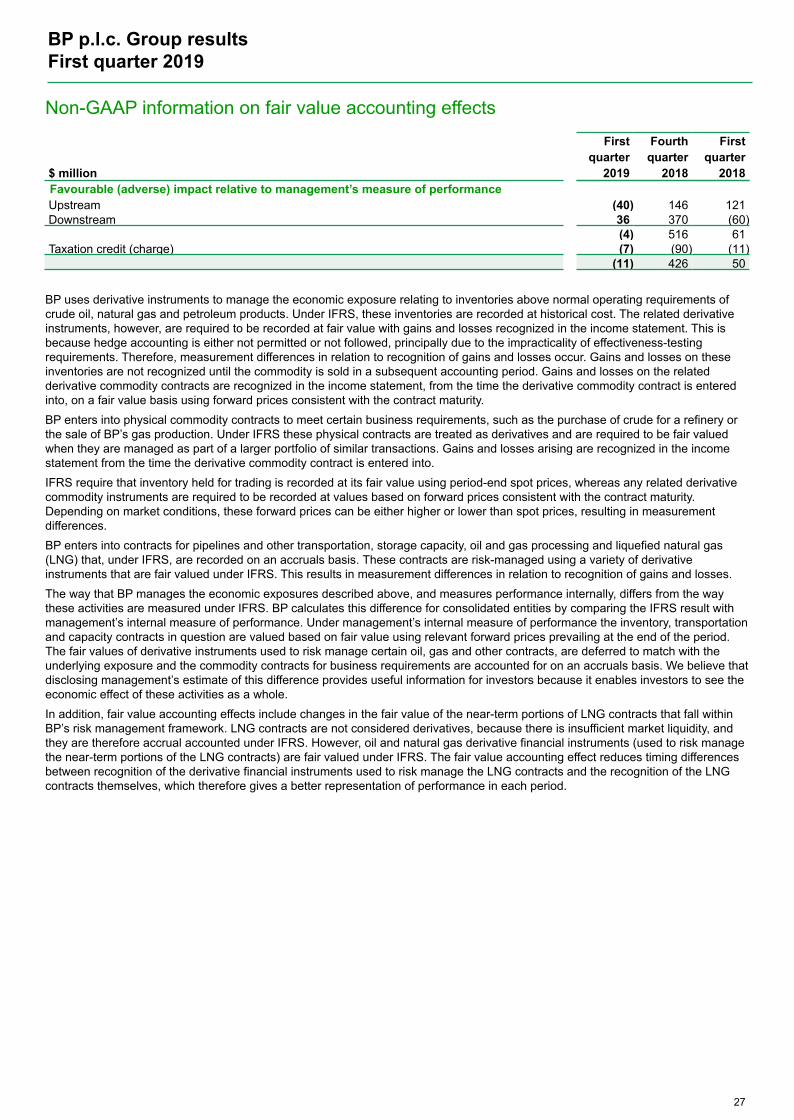
$ million 2019 2018 2018Favourable (adverse) impact relative to management’s measure of performanceUpstream (40) 146 121Downstream 36 370 (60)
(4) 516 61Taxation credit (charge) (7) (90) (11)
(11) 426 50
BP uses derivative instruments to manage the economic exposure relating to inventories above normal operating requirements ofcrude oil, natural gas and petroleum products. Under IFRS, these inventories are recorded at historical cost. The related derivativeinstruments, however, are required to be recorded at fair value with gains and losses recognized in the income statement. This isbecause hedge accounting is either not permitted or not followed, principally due to the impracticality of effectiveness-testingrequirements. Therefore, measurement differences in relation to recognition of gains and losses occur. Gains and losses on theseinventories are not recognized until the commodity is sold in a subsequent accounting period. Gains and losses on the relatedderivative commodity contracts are recognized in the income statement, from the time the derivative commodity contract is enteredinto, on a fair value basis using forward prices consistent with the contract maturity.BP enters into physical commodity contracts to meet certain business requirements, such as the purchase of crude for a refinery orthe sale of BP’s gas production. Under IFRS these physical contracts are treated as derivatives and are required to be fair valuedwhen they are managed as part of a larger portfolio of similar transactions. Gains and losses arising are recognized in the incomestatement from the time the derivative commodity contract is entered into. IFRS require that inventory held for trading is recorded at its fair value using period-end spot prices, whereas any related derivativecommodity instruments are required to be recorded at values based on forward prices consistent with the contract maturity.Depending on market conditions, these forward prices can be either higher or lower than spot prices, resulting in measurementdifferences.BP enters into contracts for pipelines and other transportation, storage capacity, oil and gas processing and liquefied natural gas(LNG) that, under IFRS, are recorded on an accruals basis. These contracts are risk-managed using a variety of derivativeinstruments that are fair valued under IFRS. This results in measurement differences in relation to recognition of gains and losses.The way that BP manages the economic exposures described above, and measures performance internally, differs from the waythese activities are measured under IFRS. BP calculates this difference for consolidated entities by comparing the IFRS result withmanagement’s internal measure of performance. Under management’s internal measure of performance the inventory, transportationand capacity contracts in question are valued based on fair value using relevant forward prices prevailing at the end of the period.The fair values of derivative instruments used to risk manage certain oil, gas and other contracts, are deferred to match with theunderlying exposure and the commodity contracts for business requirements are accounted for on an accruals basis. We believe thatdisclosing management’s estimate of this difference provides useful information for investors because it enables investors to see theeconomic effect of these activities as a whole. In addition, fair value accounting effects include changes in the fair value of the near-term portions of LNG contracts that fall withinBP’s risk management framework. LNG contracts are not considered derivatives, because there is insufficient market liquidity, andthey are therefore accrual accounted under IFRS. However, oil and natural gas derivative financial instruments (used to risk managethe near-term portions of the LNG contracts) are fair valued under IFRS. The fair value accounting effect reduces timing differencesbetween recognition of the derivative financial instruments used to risk manage the LNG contracts and the recognition of the LNGcontracts themselves, which therefore gives a better representation of performance in each period.
BP p.l.c. Group results First quarter 2019
27

Non-GAAP information on fair value accounting effects (continued)The impacts of fair value accounting effects, relative to management’s internal measure of performance, are shown in the tableabove. A reconciliation to GAAP information is set out below.
First Fourth Firstquarter quarter quarter
$ million 2019 2018 2018UpstreamReplacement cost profit (loss) before interest and tax adjusted for fair value accounting effects 2,924 4,022 3,053Impact of fair value accounting effects (40) 146 121Replacement cost profit (loss) before interest and tax 2,884 4,168 3,174DownstreamReplacement cost profit (loss) before interest and tax adjusted for fair value accounting effects 1,729 1,768 1,773Impact of fair value accounting effects 36 370 (60)Replacement cost profit (loss) before interest and tax 1,765 2,138 1,713Total groupProfit (loss) before interest and tax adjusted for fair value accounting effects 5,668 2,648 4,434Impact of fair value accounting effects (4) 516 61Profit (loss) before interest and tax 5,664 3,164 4,495
BP p.l.c. Group results First quarter 2019
28
Readily marketable inventory* (RMI)
31 March 31 December$ million 2019 2018RMI at fair value* 6,293 4,202Paid-up RMI* 2,601 1,641
Readily marketable inventory (RMI) is oil and oil products inventory held and price risk-managed by BP’s integrated supply andtrading function (IST) which could be sold to generate funds if required. Paid-up RMI is RMI that BP has paid for.We believe that disclosing the amounts of RMI and paid-up RMI is useful to investors as it enables them to better understand andevaluate the group’s inventories and liquidity position by enabling them to see the level of discretionary inventory held by IST and tosee builds or releases of liquid trading inventory.See the Glossary on page 31 for a more detailed definition of RMI. RMI, RMI at fair value, paid-up RMI and unpaid RMI are non-GAAP measures. A reconciliation of total inventory as reported on the group balance sheet to paid-up RMI is provided below.
31 March 31 December$ million 2019 2018Reconciliation of total inventory to paid-up RMIInventories as reported on the group balance sheet under IFRS 21,426 17,988Less: (a) inventories that are not oil and oil products and (b) oil and oil product
inventories that are not risk-managed by IST (15,420) (14,066)6,006 3,922
Plus: difference between RMI at fair value and RMI on an IFRS basis 287 280RMI at fair value 6,293 4,202Less: unpaid RMI* at fair value (3,692) (2,561)Paid-up RMI 2,601 1,641

Gulf of Mexico oil spill
First Fourth Firstquarter quarter quarter
$ million 2019 2018 2018Net cash provided by operating activities as per condensed group cash flow statement 5,296 6,829 3,646Exclude net cash from operating activities relating to the Gulf of Mexico oil spill on a post-tax
basis 649 272 1,714Operating cash flow, excluding Gulf of Mexico oil spill payments* 5,945 7,101 5,360
Net cash from operating activities relating to the Gulf of Mexico oil spill on a pre-tax basis amounted to an outflow of $654 million inthe first quarter of 2019. For the same period in 2018, the amount was an outflow of $1,620 million. Net cash outflows relating to theGulf of Mexico oil spill in the first quarter of 2018 include payments made under the 2012 agreement with the US government toresolve all federal criminal claims arising from the incident.
31 March 31 December$ million 2019 2018Trade and other payables (13,751) (14,201)Provisions (368) (345)Gulf of Mexico oil spill payables and provisions (14,119) (14,546)
Of which - current (2,262) (2,612)
Deferred tax asset 5,626 5,562
The provision reflects the latest estimate for the remaining costs associated with the Gulf of Mexico oil spill. The amounts ultimatelypayable may differ from the amount provided and the timing of payments is uncertain. Further information relating to the Gulf ofMexico oil spill, including information on the nature and expected timing of payments relating to provisions and other payables, isprovided in BP Annual Report and Form 20-F 2018 - Financial statements - Note 2 and pages 296 to 298 of Legal proceedings.
BP p.l.c. Group results First quarter 2019
29
Working capital* reconciliationFirst Fourth First
quarter quarter quarter$ million 2019 2018 2018Movements in inventories and other current and non-current assets and liabilities as per
condensed group cash flow statement (2,695) 778 (3,398)Adjustments to exclude movements in inventories and other current and non-current assets and
liabilities for the Gulf of Mexico oil spill 631 238 1,588Adjusted for Inventory holding gains (losses)* (Note 2)
Upstream 2 (12) 1Downstream 1,046 (2,470) 69
Working capital release (build) (1,016) (1,466) (1,740)

Realizations* and marker prices
First Fourth Firstquarter quarter quarter
2019 2018 2018Average realizations(a)
Liquids* ($/bbl)US 50.57 61.61 57.77Europe 61.78 65.07 65.81Rest of World 60.02 61.42 63.30BP Average 56.47 61.80 61.40Natural gas ($/mcf)US 2.57 3.10 2.25Europe 5.84 8.80 7.18Rest of World 4.67 4.77 4.22BP Average 4.02 4.33 3.78Total hydrocarbons* ($/boe)US 34.17 42.50 39.65Europe 58.89 61.98 60.78Rest of World 40.52 41.64 40.54BP Average 39.37 42.98 41.39Average oil marker prices ($/bbl)Brent 63.13 68.81 66.82West Texas Intermediate 54.87 59.98 62.90Western Canadian Select 44.91 25.31 36.84Alaska North Slope 64.39 69.53 67.20Mars 61.13 64.45 62.44Urals (NWE – cif) 62.91 68.02 65.27Average natural gas marker pricesHenry Hub gas price(b)
($/mmBtu) 3.15 3.65 3.01UK Gas – National Balancing Point (p/therm) 48.23 65.13 57.97
(a) Based on sales of consolidated subsidiaries only – this excludes equity-accounted entities.(b) Henry Hub First of Month Index.
BP p.l.c. Group results First quarter 2019
30
Exchange rates
First Fourth Firstquarter quarter quarter
2019 2018 2018$/£ average rate for the period 1.30 1.29 1.39$/£ period-end rate 1.31 1.27 1.41
$/€ average rate for the period 1.14 1.14 1.23$/€ period-end rate 1.12 1.14 1.24
Rouble/$ average rate for the period 66.00 66.48 56.88Rouble/$ period-end rate 65.02 69.57 57.72

Legal proceedingsThe following discussion sets out the material developments in the group’s material legal proceedings during the recent period. For afull discussion of the group’s material legal proceedings, see pages 296-298 of BP Annual Report and Form 20-F 2018.Other legal proceedingsScharfstein v. BP West Coast Products, LLC A class action lawsuit was filed against BP West Coast Products, LLC (BPWCP) inOregon State Court under the Oregon Unlawful Trade Practices Act on behalf of customers who used a debit card at ARCO gasolinestations in Oregon during the period 1 January 2011 to 30 August 2013, alleging that ARCO sites in Oregon failed to providesufficient notice of the 35 cents per transaction debit card fee. In January 2014, the jury rendered a verdict against BPWCP andawarded statutory damages of $200 per class member. On 25 August 2015, the trial court determined the size of the class to beslightly in excess of two million members. On 31 May 2016 the trial court entered a judgment against BPWCP for the amount of$417.3 million. On 31 May 2018 the Oregon Court of Appeals affirmed the trial court’s ruling. BP filed a Petition for Review to theOregon Supreme Court which was denied on 8 November 2018. In March 2019, BP and the Plaintiffs agreed to a settlement of theclass action lawsuit, subject to final court approval. This has received preliminary approval by the court and has been sent to classmembers. A hearing for final approval of the settlement is scheduled for June 2019. BP filed a petition for a writ of certiorari to the USSupreme Court at the end of March in order to preserve BP’s appeal rights pending final court approval of the settlement. BP’sprovisions for litigation and claims includes a provision for this lawsuit.
BP p.l.c. Group results First quarter 2019
31
GlossaryNon-GAAP measures are provided for investors because they are closely tracked by management to evaluate BP’s operatingperformance and to make financial, strategic and operating decisions. Non-GAAP measures are sometimes referred to as alternativeperformance measures.Capital expenditure is total cash capital expenditure as stated in the condensed group cash flow statement.
Consolidation adjustment – UPII is unrealized profit in inventory arising on inter-segment transactions.
Divestment proceeds are disposal proceeds as per the condensed group cash flow statement.
Effective tax rate (ETR) on replacement cost (RC) profit or loss is a non-GAAP measure. The ETR on RC profit or loss iscalculated by dividing taxation on a RC basis by RC profit or loss before tax. Information on RC profit or loss is provided below. BPbelieves it is helpful to disclose the ETR on RC profit or loss because this measure excludes the impact of price changes on thereplacement of inventories and allows for more meaningful comparisons between reporting periods. The nearest equivalent measureon an IFRS basis is the ETR on profit or loss for the period.
Fair value accounting effects are non-GAAP adjustments to our IFRS profit (loss). They reflect the difference between the way BPmanages the economic exposure and internally measures performance of certain activities and the way those activities aremeasured under IFRS. Further information on fair value accounting effects is provided on page 27.
Free cash flow is operating cash flow less net cash used in investing activities and lease liability payments included in financingactivities, as presented in the condensed group cash flow statement.
Gearing and net debt are non-GAAP measures. Net debt is calculated as finance debt, as shown in the balance sheet, plus the fairvalue of associated derivative financial instruments that are used to hedge foreign currency exchange and interest rate risks relatingto finance debt, for which hedge accounting is applied, less cash and cash equivalents. Gearing is defined as the ratio of net debt tothe total of net debt plus shareholders’ equity. All components of equity are included in the denominator of the calculation. BPbelieves these measures provide useful information to investors. Net debt enables investors to see the economic effect of financedebt, related hedges and cash and cash equivalents in total. Gearing enables investors to see how significant net debt is relative toequity from shareholders. The derivatives are reported on the balance sheet within the headings ‘Derivative financial instruments’.The nearest equivalent GAAP measures on an IFRS basis are finance debt and finance debt ratio. A reconciliation of finance debt tonet debt is provided on page 22.
We are unable to present reconciliations of forward-looking information for gearing to finance debt ratio, because withoutunreasonable efforts, we are unable to forecast accurately certain adjusting items required to present a meaningful comparableGAAP forward-looking financial measure. These items include fair value asset (liability) of hedges related to finance debt and cashand cash equivalents, that are difficult to predict in advance in order to include in a GAAP estimate.Hydrocarbons – Liquids and natural gas. Natural gas is converted to oil equivalent at 5.8 billion cubic feet = 1 million barrels.
Inorganic capital expenditure is a subset of capital expenditure and is a non-GAAP measure. Inorganic capital expenditurecomprises consideration in business combinations and certain other significant investments made by the group. It is reported on acash basis. BP believes that this measure provides useful information as it allows investors to understand how BP’s managementinvests funds in projects which expand the group’s activities through acquisition. Further information and a reconciliation to GAAPinformation is provided on page 25.

Glossary (continued)Inventory holding gains and losses represent the difference between the cost of sales calculated using the replacement cost ofinventory and the cost of sales calculated on the first-in first-out (FIFO) method after adjusting for any changes in provisions wherethe net realizable value of the inventory is lower than its cost. Under the FIFO method, which we use for IFRS reporting, the cost ofinventory charged to the income statement is based on its historical cost of purchase or manufacture, rather than its replacementcost. In volatile energy markets, this can have a significant distorting effect on reported income. The amounts disclosed represent thedifference between the charge to the income statement for inventory on a FIFO basis (after adjusting for any related movements innet realizable value provisions) and the charge that would have arisen based on the replacement cost of inventory. For this purpose,the replacement cost of inventory is calculated using data from each operation’s production and manufacturing system, either on amonthly basis, or separately for each transaction where the system allows this approach. The amounts disclosed are not separatelyreflected in the financial statements as a gain or loss. No adjustment is made in respect of the cost of inventories held as part of atrading position and certain other temporary inventory positions. See Replacement cost (RC) profit or loss definition below.
Liquids – Liquids for Upstream and Rosneft comprises crude oil, condensate and natural gas liquids. For Upstream, liquids alsoincludes bitumen.
Major projects have a BP net investment of at least $250 million, or are considered to be of strategic importance to BP or of a highdegree of complexity.
Net debt including leases is a non-GAAP measure. Net debt including leases is calculated as net debt plus lease liabilities, less thenet amount of partner receivables and payables relating to leases entered into on behalf of joint operations. BP believes thismeasure provides useful information to investors as it enables investors to understand the impact of the group’s lease portfolio onnet debt. The nearest equivalent GAAP measure on an IFRS basis is finance debt. A reconciliation of finance debt to net debtincluding leases is provided on page 22.
Net wind generation capacity is the sum of the rated capacities of the assets/turbines that have entered into commercial operation,including BP’s share of equity-accounted entities.
Non-operating items are charges and credits included in the financial statements that BP discloses separately because it considerssuch disclosures to be meaningful and relevant to investors. They are items that management considers not to be part of underlyingbusiness operations and are disclosed in order to enable investors better to understand and evaluate the group’s reported financialperformance. Non-operating items within equity-accounted earnings are reported net of incremental income tax reported by theequity-accounted entity. An analysis of non-operating items by region is shown on pages 7, 9 and 11, and by segment and type isshown on page 26.
Operating cash flow is net cash provided by (used in) operating activities as stated in the condensed group cash flow statement.When used in the context of a segment rather than the group, the terms refer to the segment’s share thereof.
Operating cash flow excluding working capital change is a non-GAAP measure. It is operating cash flow excluding Gulf ofMexico oil spill payments less change in working capital adjusted for inventory holding gains/losses (see below). BP believesoperating cash flow excluding working capital change is a useful measure as it allows for more meaningful comparisons betweenreporting periods. The nearest equivalent measure on an IFRS basis is net cash provided by operating activities.
Operating cash flow excluding Gulf of Mexico oil spill payments is a non-GAAP measure. It is calculated by excluding post-taxoperating cash flows relating to the Gulf of Mexico oil spill from net cash provided by operating activities as reported in thecondensed group cash flow statement. BP believes net cash provided by operating activities excluding amounts related to the Gulf ofMexico oil spill is a useful measure as it allows for more meaningful comparisons between reporting periods. The nearest equivalentmeasure on an IFRS basis is net cash provided by operating activities.
Organic capital expenditure is a subset of capital expenditure and is a non-GAAP measure. Organic capital expenditure comprisescapital expenditure less inorganic capital expenditure. BP believes that this measure provides useful information as it allowsinvestors to understand how BP’s management invests funds in developing and maintaining the group’s assets. An analysis oforganic capital expenditure by segment and region, and a reconciliation to GAAP information is provided on page 25.
We are unable to present reconciliations of forward-looking information for organic capital expenditure to total cash capitalexpenditure, because without unreasonable efforts, we are unable to forecast accurately the adjusting item, inorganic capitalexpenditure, that is difficult to predict in advance in order to derive the nearest GAAP estimate.Production-sharing agreement (PSA) is an arrangement through which an oil and gas company bears the risks and costs ofexploration, development and production. In return, if exploration is successful, the oil company receives entitlement to variablephysical volumes of hydrocarbons, representing recovery of the costs incurred and a stipulated share of the production remainingafter such cost recovery.
Readily marketable inventory (RMI) is inventory held and price risk-managed by our integrated supply and trading function (IST)which could be sold to generate funds if required. It comprises oil and oil products for which liquid markets are available andexcludes inventory which is required to meet operational requirements and other inventory which is not price risk-managed. RMI isreported at fair value. Inventory held by the Downstream fuels business for the purpose of sales and marketing, and all inventoriesrelating to the lubricants and petrochemicals businesses, are not included in RMI.
Paid-up RMI excludes RMI which has not yet been paid for. For inventory that is held in storage, a first-in first-out (FIFO) approach isused to determine whether inventory has been paid for or not. Unpaid RMI is RMI which has not yet been paid for by BP. RMI, RMI atfair value, Paid-up RMI and Unpaid RMI are non-GAAP measures. Further information is provided on page 28.
BP p.l.c. Group results First quarter 2019
32

Glossary (continued)Realizations are the result of dividing revenue generated from hydrocarbon sales, excluding revenue generated from purchasesmade for resale and royalty volumes, by revenue generating hydrocarbon production volumes. Revenue generating hydrocarbonproduction reflects the BP share of production as adjusted for any production which does not generate revenue. Adjustments mayinclude losses due to shrinkage, amounts consumed during processing, and contractual or regulatory host committed volumes suchas royalties.
Refining availability represents Solomon Associates’ operational availability for BP-operated refineries, which is defined as thepercentage of the year that a unit is available for processing after subtracting the annualized time lost due to turnaround activity andall planned mechanical, process and regulatory downtime.
The Refining marker margin (RMM) is the average of regional indicator margins weighted for BP’s crude refining capacity in eachregion. Each regional marker margin is based on product yields and a marker crude oil deemed appropriate for the region. Theregional indicator margins may not be representative of the margins achieved by BP in any period because of BP’s particular refineryconfigurations and crude and product slate.Replacement cost (RC) profit or loss reflects the replacement cost of inventories sold in the period and is arrived at by excludinginventory holding gains and losses from profit or loss. RC profit or loss for the group is not a recognized GAAP measure. BP believesthis measure is useful to illustrate to investors the fact that crude oil and product prices can vary significantly from period to periodand that the impact on our reported result under IFRS can be significant. Inventory holding gains and losses vary from period toperiod due to changes in prices as well as changes in underlying inventory levels. In order for investors to understand the operatingperformance of the group excluding the impact of price changes on the replacement of inventories, and to make comparisons ofoperating performance between reporting periods, BP’s management believes it is helpful to disclose this measure. The nearestequivalent measure on an IFRS basis is profit or loss attributable to BP shareholders. A reconciliation to GAAP information isprovided on page 1. RC profit or loss before interest and tax is the measure of profit or loss that is required to be disclosed for eachoperating segment under IFRS.
RC profit or loss per share is a non-GAAP measure. Earnings per share is defined in Note 6. RC profit or loss per share iscalculated using the same denominator. The numerator used is RC profit or loss attributable to BP shareholders rather than profit orloss attributable to BP shareholders. BP believes it is helpful to disclose the RC profit or loss per share because this measureexcludes the impact of price changes on the replacement of inventories and allows for more meaningful comparisons betweenreporting periods. The nearest equivalent measure on an IFRS basis is basic earnings per share based on profit or loss for theperiod attributable to BP shareholders.
Reported recordable injury frequency measures the number of reported work-related employee and contractor incidents thatresult in a fatality or injury per 200,000 hours worked. This represents reported incidents occurring within BP’s operational HSSEreporting boundary. That boundary includes BP’s own operated facilities and certain other locations or situations.
Solomon availability – See Refining availability definition.
Tier 1 and tier 2 process safety events – Tier 1 events are losses of primary containment from a process of greatest consequence– causing harm to a member of the workforce, damage to equipment from a fire or explosion, a community impact or exceedingdefined quantities. Tier 2 events are those of lesser consequence. These represent reported incidents occurring within BP’soperational HSSE reporting boundary. That boundary includes BP’s own operated facilities and certain other locations or situations.
Underlying effective tax rate (ETR) is a non-GAAP measure. The underlying ETR is calculated by dividing taxation on anunderlying replacement cost (RC) basis by underlying RC profit or loss before tax. Taxation on an underlying RC basis is taxation ona RC basis for the period adjusted for taxation on non-operating items and fair value accounting effects. Information on underlyingRC profit or loss is provided below. BP believes it is helpful to disclose the underlying ETR because this measure may help investorsto understand and evaluate, in the same manner as management, the underlying trends in BP’s operational performance on acomparable basis, period on period. The nearest equivalent measure on an IFRS basis is the ETR on profit or loss for the period.
We are unable to present reconciliations of forward-looking information for underlying ETR to ETR on profit or loss for the period,because without unreasonable efforts, we are unable to forecast accurately certain adjusting items required to present a meaningfulcomparable GAAP forward-looking financial measure. These items include the taxation on inventory holding gains and losses, non-operating items and fair value accounting effects, that are difficult to predict in advance in order to include in a GAAP estimate.Underlying production is production after adjusting for acquisitions and divestments and entitlement impacts in our production-sharing agreements.
Underlying RC profit or loss is RC profit or loss after adjusting for non-operating items and fair value accounting effects. UnderlyingRC profit or loss and adjustments for fair value accounting effects are not recognized GAAP measures. See pages 26 and 27 foradditional information on the non-operating items and fair value accounting effects that are used to arrive at underlying RC profit orloss in order to enable a full understanding of the events and their financial impact. BP believes that underlying RC profit or loss is auseful measure for investors because it is a measure closely tracked by management to evaluate BP’s operating performance and tomake financial, strategic and operating decisions and because it may help investors to understand and evaluate, in the same manneras management, the underlying trends in BP’s operational performance on a comparable basis, period on period, by adjusting for theeffects of these non-operating items and fair value accounting effects. The nearest equivalent measure on an IFRS basis for thegroup is profit or loss attributable to BP shareholders. The nearest equivalent measure on an IFRS basis for segments is RC profit orloss before interest and taxation. A reconciliation to GAAP information is provided on page 1.
BP p.l.c. Group results First quarter 2019
33

Glossary (continued)Underlying RC profit or loss per share is a non-GAAP measure. Earnings per share is defined in Note 6. Underlying RC profit orloss per share is calculated using the same denominator. The numerator used is underlying RC profit or loss attributable to BPshareholders rather than profit or loss attributable to BP shareholders. BP believes it is helpful to disclose the underlying RC profit orloss per share because this measure may help investors to understand and evaluate, in the same manner as management, theunderlying trends in BP’s operational performance on a comparable basis, period on period. The nearest equivalent measure on anIFRS basis is basic earnings per share based on profit or loss for the period attributable to BP shareholders.
Upstream plant reliability (BP-operated) is calculated taking 100% less the ratio of total unplanned plant deferrals divided byinstalled production capacity. Unplanned plant deferrals are associated with the topside plant and where applicable the subseaequipment (excluding wells and reservoir). Unplanned plant deferrals include breakdowns, which does not include Gulf of Mexicoweather related downtime.
Upstream unit production cost is calculated as production cost divided by units of production. Production cost does not include advalorem and severance taxes. Units of production are barrels for liquids and thousands of cubic feet for gas. Amounts disclosed arefor BP subsidiaries only and do not include BP’s share of equity-accounted entities.
Working capital - Change in working capital is movements in inventories and other current and non-current assets and liabilities asreported in the condensed group cash flow statement. Change in working capital adjusted for inventory holding gains/losses is a non-GAAP measure. It is calculated by adjusting for inventory holding gains/losses reported in the period and this therefore representswhat would have been reported as movements in inventories and other current and non-current assets and liabilities, if the startingpoint in determining net cash provided by operating activities had been replacement cost profit rather than profit for the period. Thenearest equivalent measure on an IFRS basis for this is movements in inventories and other current and non-current assets andliabilities. In the context of describing operating cash flow excluding Gulf of Mexico oil spill payments, change in working capital alsoexcludes movements in inventories and other current and non-current assets and liabilities relating to the Gulf of Mexico oil spill. Seepage 29 for further details.
BP utilizes various arrangements in order to manage its working capital including discounting of receivables and, in the supply andtrading business, the active management of supplier payment terms, inventory and collateral.
BP p.l.c. Group results First quarter 2019
34

Cautionary statement In order to utilize the ‘safe harbor’ provisions of the United States Private Securities Litigation Reform Act of 1995 (the ‘PSLRA’) andthe general doctrine of cautionary statements, BP is providing the following cautionary statement: The discussion in this resultsannouncement contains certain forecasts, projections and forward-looking statements - that is, statements related to future, not pastevents and circumstances - with respect to the financial condition, results of operations and businesses of BP and certain of theplans and objectives of BP with respect to these items. These statements may generally, but not always, be identified by the use ofwords such as ‘will’, ‘expects’, ‘is expected to’, ‘aims’, ‘should’, ‘may’, ‘objective’, ‘is likely to’, ‘intends’, ‘believes’, ‘anticipates’, ‘plans’,‘we see’ or similar expressions. In particular, the following, among other statements, are all forward looking in nature: expectationsregarding the expected quarterly dividend payment and timing of such payment; plans and expectations regarding share buybacks,including to offset the impact of dilution from the scrip program; expectations regarding the underlying effective tax rate in 2019;plans and expectations to deliver disciplined growth, efficient projects, and safe and reliable operations; expectations regarding 2019organic capital expenditure and depreciation, depletion and amortization charges; plans and expectations with respect to gearing,including for gearing to move toward the middle of the 20-30% targeted range in 2020; plans and expectations regarding Upstreamprojects including for five Upstream major projects to begin production in 2019 and to deliver 900,000 boe/d from new major projectsby 2021; plans to make available up to $100-million over the next three years to support projects across the Upstream andexpectations that the projects supported by the new $100-million initiative will deliver new emissions reductions; expectationsregarding Upstream second-quarter 2019 reported production, seasonal turnaround and maintenance activities; plans to add 1,000new BP branded retail station sites in China over the next five years; plans and expectations regarding expansion of capacity at BP’sjoint venture petrochemicals facility in South Korea; expectations regarding Downstream second-quarter 2019 refining margins,discounts for North American heavy crude oil and turnaround activity; expectations regarding the amount of the Rosneft dividend;plans and expectations regarding Lightsource BP, including for the Green Energy Equity Fund to invest a total of $330 million inAyana Renewable Power; plans and expectations regarding the Other businesses and corporate 2019 average quarterly charges;and expectations with respect to the amount of future payments relating to the Gulf of Mexico oil spill. By their nature, forward-looking statements involve risk and uncertainty because they relate to events and depend on circumstances that will or may occur inthe future and are outside the control of BP. Actual results may differ materially from those expressed in such statements, dependingon a variety of factors, including: the specific factors identified in the discussions accompanying such forward-looking statements; thereceipt of relevant third party and/or regulatory approvals; the timing and level of maintenance and/or turnaround activity; the timingand volume of refinery additions and outages; the timing of bringing new fields onstream; the timing, quantum and nature of certainacquisitions and divestments; future levels of industry product supply, demand and pricing, including supply growth in North America;OPEC quota restrictions; PSA effects; operational and safety problems; potential lapses in product quality; economic and financialmarket conditions generally or in various countries and regions; political stability and economic growth in relevant areas of the world;changes in laws and governmental regulations; regulatory or legal actions including the types of enforcement action pursued and thenature of remedies sought or imposed; the actions of prosecutors, regulatory authorities and courts; delays in the processes forresolving claims; amounts ultimately payable and timing of payments relating to the Gulf of Mexico oil spill; exchange ratefluctuations; development and use of new technology; recruitment and retention of a skilled workforce; the success or otherwise ofpartnering; the actions of competitors, trading partners, contractors, subcontractors, creditors, rating agencies and others; our accessto future credit resources; business disruption and crisis management; the impact on our reputation of ethical misconduct and non-compliance with regulatory obligations; trading losses; major uninsured losses; decisions by Rosneft’s management and board ofdirectors; natural disasters and adverse weather conditions; changes in public expectations and other changes to businessconditions; wars and acts of terrorism; cyber-attacks or sabotage; and other factors discussed elsewhere in this report, under ““Riskfactors” in BP Annual Report and Form 20-F 2018 as filed with the US Securities and Exchange Commission.
Contacts
London Houston
Press Office David Nicholas Brett Clanton+44 (0)20 7496 4708 +1 281 366 8346
Investor Relations Craig Marshall Brian Sullivanbp.com/investors +44 (0)20 7496 4962 +1 281 892 3421
BP p.l.c. Group results First quarter 2019
35