1q12 earnings conference call
TRANSCRIPT

Earnings Conference Call
1Q12
2/15 Investor Relations | 1Q12|
Content
1Q12 Events and Highlights Page 3
1Q12 Key Figures Page 4
Product and Revenue Diversification Page 5
Credit Portfolio Page 6
Credit Portfolio Profile Page 7
Credit Portfolio Quality Page 8
Hedging Desk Page 9
PINE Investimentos Page 10
Funding Page 11
Asset & Liability Management Page 12
Capital Adequacy Ratio (BIS) Page 13
2012 Guidance Page 14
3/15 Investor Relations | 1Q12|
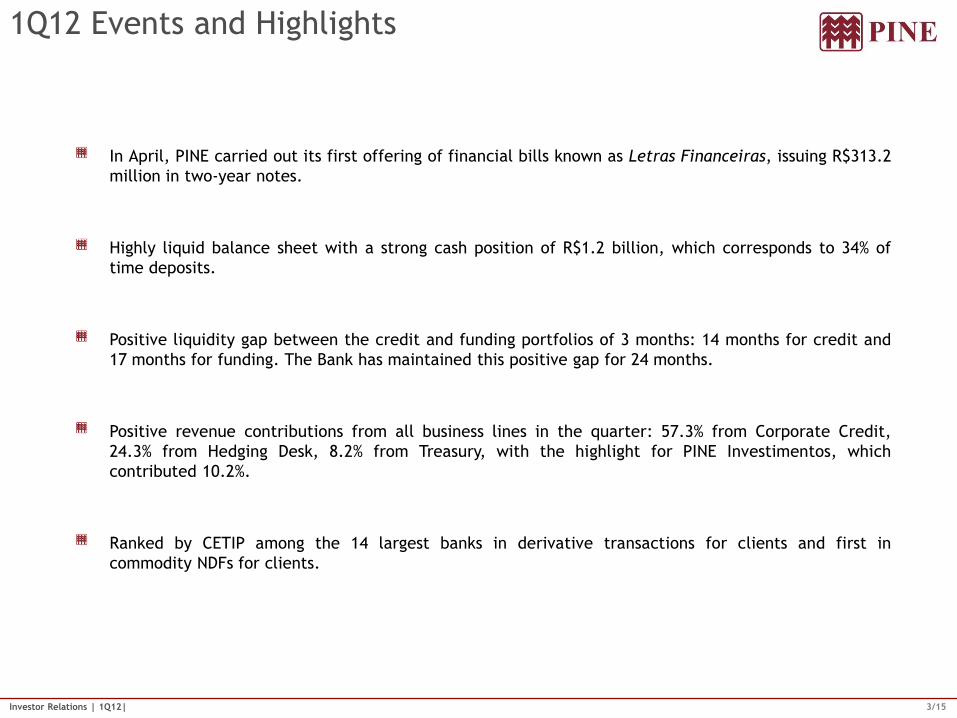
1Q12 Events and Highlights
In April, PINE carried out its first offering of financial bills known as Letras Financeiras, issuing R$313.2
million in two-year notes.
Highly liquid balance sheet with a strong cash position of R$1.2 billion, which corresponds to 34% of
time deposits.
Positive liquidity gap between the credit and funding portfolios of 3 months: 14 months for credit and
17 months for funding. The Bank has maintained this positive gap for 24 months.
Positive revenue contributions from all business lines in the quarter: 57.3% from Corporate Credit,
24.3% from Hedging Desk, 8.2% from Treasury, with the highlight for PINE Investimentos, which
contributed 10.2%.
Ranked by CETIP among the 14 largest banks in derivative transactions for clients and first in
commodity NDFs for clients.
4/15 Investor Relations | 1Q12|
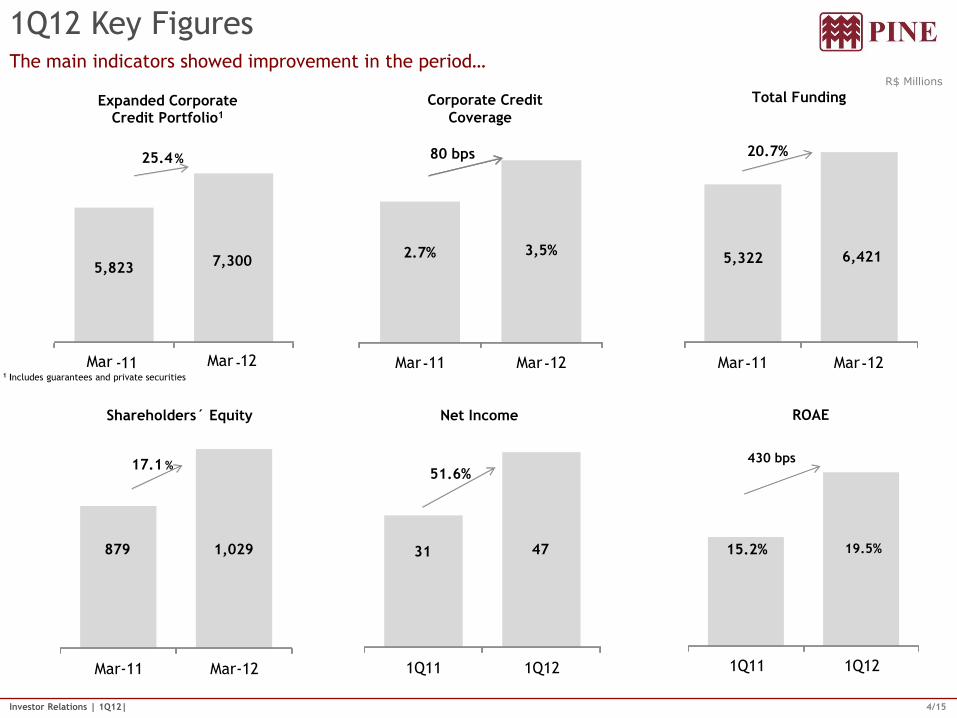
1Q12 Key Figures The main indicators showed improvement in the period…
5,823 7,300
Mar - 11 Mar - 12
Expanded Corporate Credit Portfolio1
25.4 %
1 Includes guarantees and private securities
5,322 6,421
Mar - 11 Mar - 12
Total Funding
20.7%
879 1,029
Mar - 11 Mar - 12
Shareholders´ Equity
17.1 %
31 47
1Q11 1Q12
Net Income
51.6%
15.2% 19.5%
1Q11 1Q12
430 bps
ROAE
2.7% 3,5%
Mar - 11 Mar - 12
Corporate Credit
Coverage
80 bps
R$ Millions
5/15 Investor Relations | 1Q12|
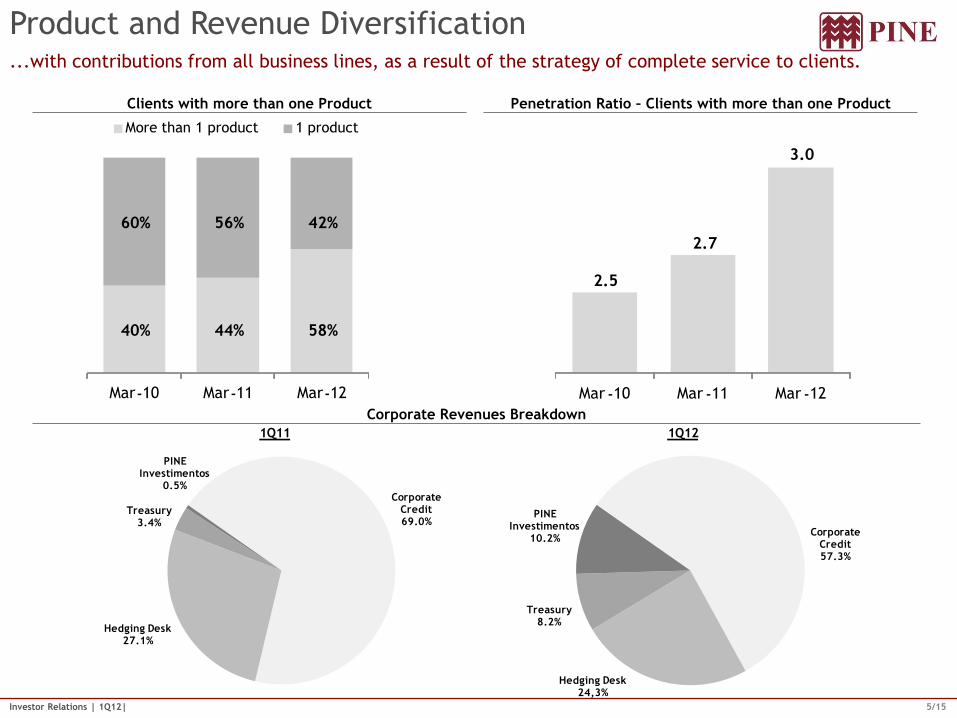
Product and Revenue Diversification ...with contributions from all business lines, as a result of the strategy of complete service to clients.
Clients with more than one Product Penetration Ratio – Clients with more than one Product
Corporate Revenues Breakdown
2.5
2.7
3.0
Mar - 10 Mar - 11 Mar - 12
40% 44% 58%
60% 56% 42%
Mar - 10 Mar - 11 Mar - 12
More than 1 product 1 product
Corporate Credit69.0%
Hedging Desk27.1%
Treasury3.4%
PINE Investimentos
0.5%
1Q11
Corporate Credit57.3%
Hedging Desk24,3%
Treasury8.2%
PINE Investimentos
10.2%
1Q12
6/15 Investor Relations | 1Q12|
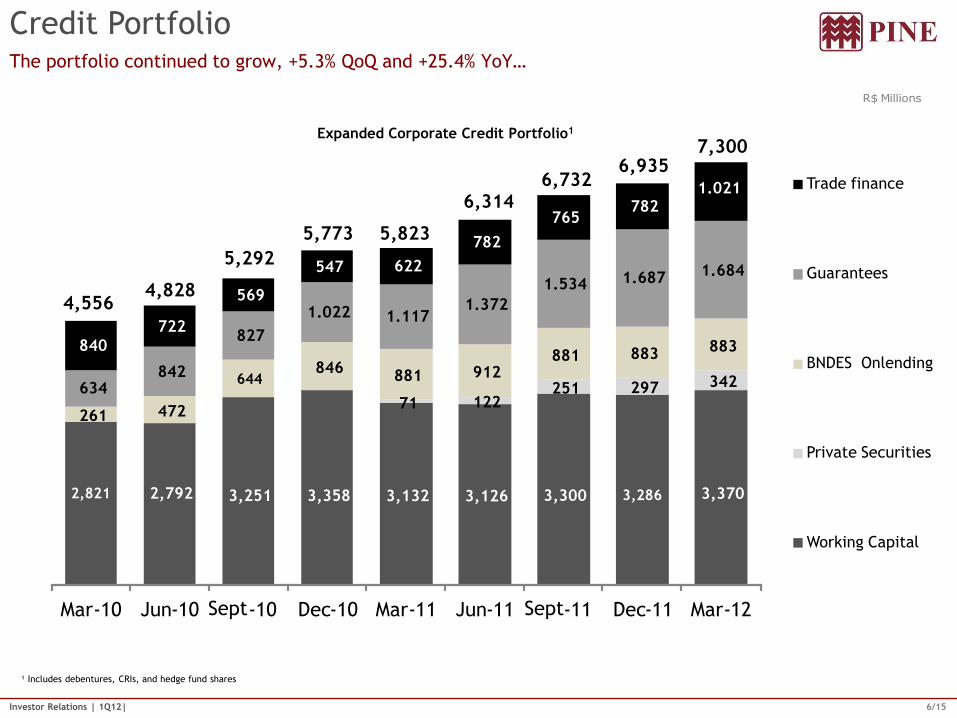
Credit Portfolio The portfolio continued to grow, +5.3% QoQ and +25.4% YoY…
¹ Includes debentures, CRIs, and hedge fund shares
R$ Millions
2,821 2,792 3,251 3,358 3,132 3,126 3,300 3,286 3,370
71 122 251 297 342
261 472
644 846
881 912 881 883 883
634 842
827
1.022 1.117 1.372
1.534 1.687 1.684
840
722
569
547 622
782
765 782
1.021
Mar - 10 Jun - 10 Sept - 10 Dec - 10 Mar - 11 Jun - 11 Sept - 11 Dec - 11 Mar - 12
Trade finance
Guarantees
BNDES Onlending
Private Securities
Working Capital
4,556 4,828
5,292
5,773 5,823
6,314 6,732
6,935 7,300
Expanded Corporate Credit Portfolio1
7/15 Investor Relations | 1Q12|
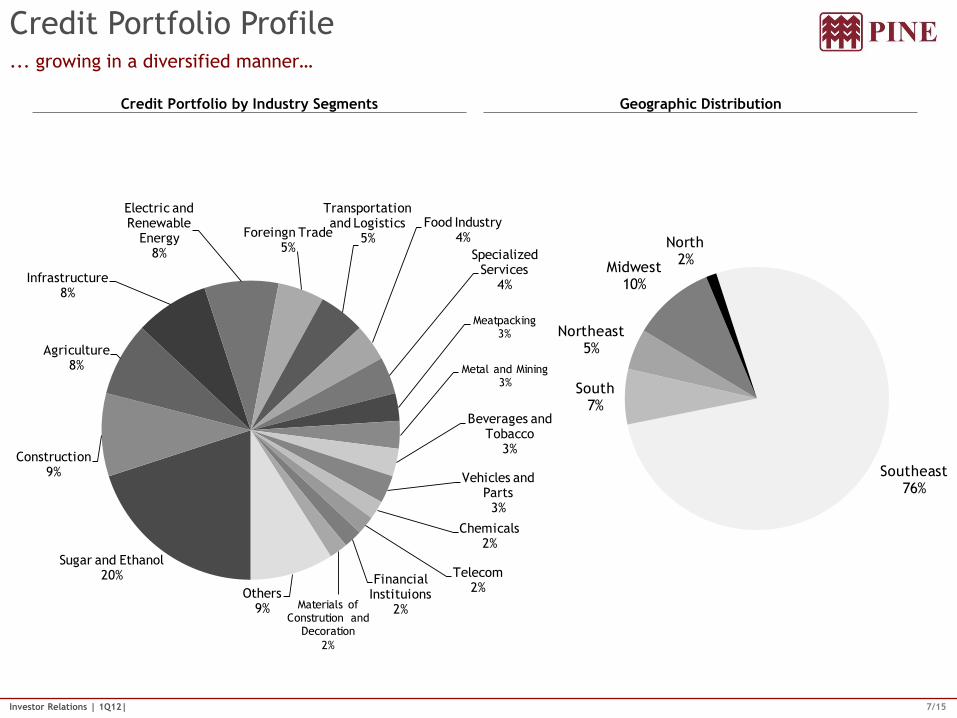
Credit Portfolio Profile
Credit Portfolio by Industry Segments Geographic Distribution
... growing in a diversified manner…
Southeast76%
South7%
Northeast5%
Midwest10%
North2%
Sugar and Ethanol20%
Construction9%
Agriculture8%
Infrastructure8%
Electric and Renewable
Energy8%
Foreingn Trade5%
Transportation and Logistics
5%
Food Industry4%
Specialized Services
4%
Meatpacking3%
Metal and Mining3%
Beverages and Tobacco
3%
Vehicles and Parts3%
Chemicals2%
Telecom2%
Financial Instituions
2%Materials of Constrution and
Decoration
2%
Others9%
8/15 Investor Relations | 1Q12|
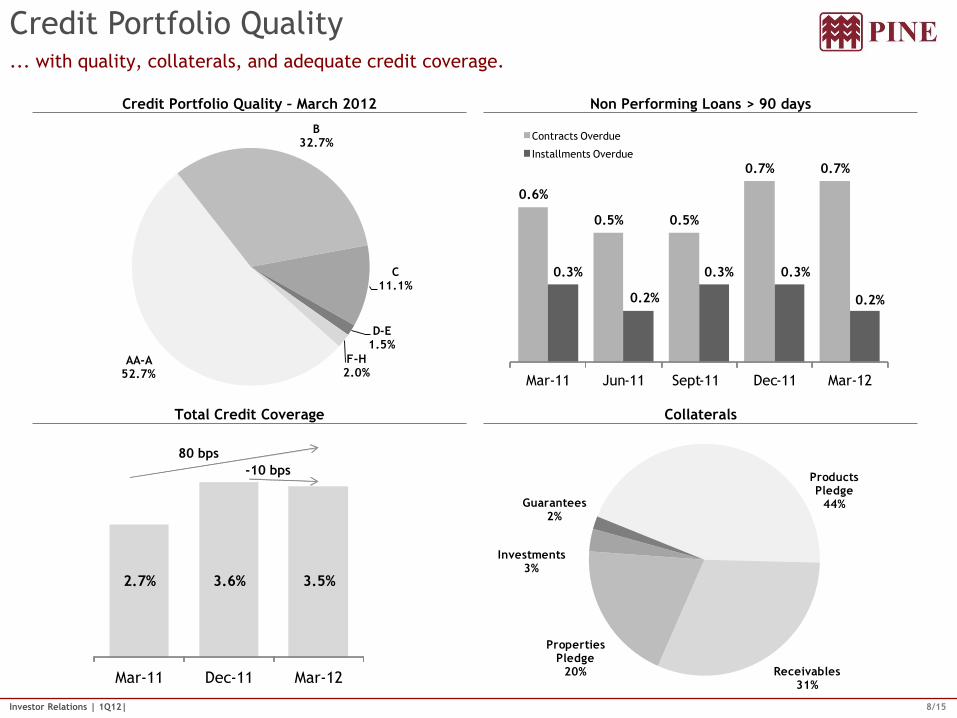
Credit Portfolio Quality
Credit Portfolio Quality – March 2012
Total Credit Coverage
Non Performing Loans > 90 days
Collaterals
... with quality, collaterals, and adequate credit coverage.
2.7% 3.6% 3.5%
Mar - 11 Dec - 11 Mar - 12
80 bps
- 10 bps
AA-A52.7%
B32.7%
C11.1%
D-E1.5%
F-H2.0%
Products Pledge
44%
Receivables31%
Properties Pledge
20%
Investments3%
Guarantees2%
0.6%
0.5% 0.5%
0.7% 0.7%
0.3%
0.2%
0.3% 0.3%
0.2%
Mar - 11 Jun - 11 Sept - 11 Dec - 11 Mar - 12
Contracts Overdue
Installments Overdue
9/15 Investor Relations | 1Q12|
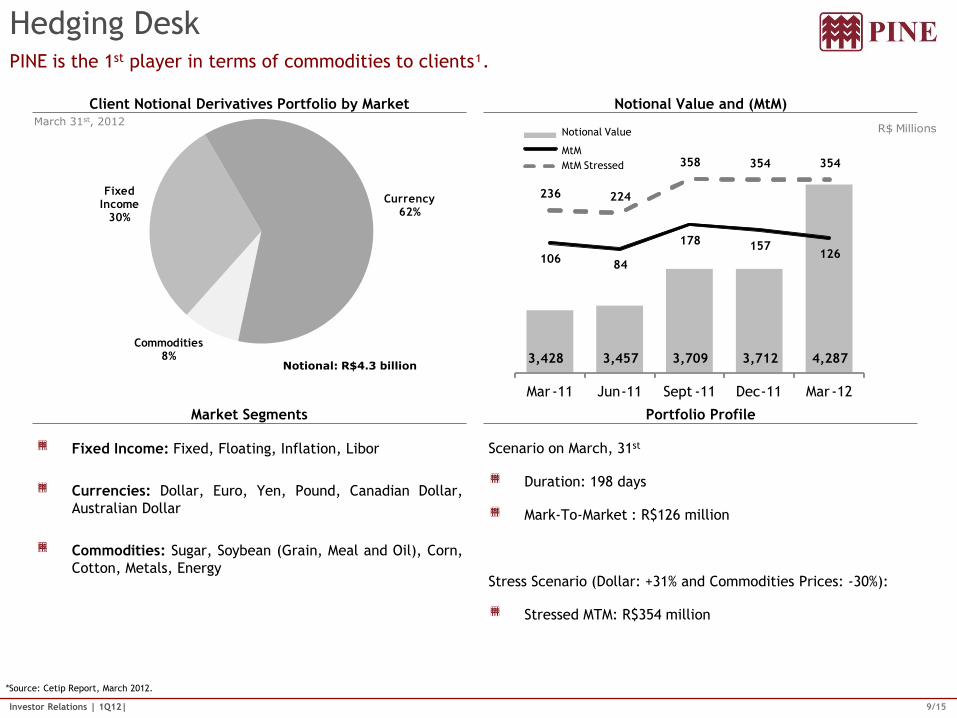
Commodities8%
Fixed Income
30%
Currency62%
Hedging Desk
Client Notional Derivatives Portfolio by Market
Market Segments
Notional Value and (MtM)
Portfolio Profile
PINE is the 1st player in terms of commodities to clients¹.
Notional: R$4.3 billion
Scenario on March, 31st
Duration: 198 days
Mark-To-Market : R$126 million
Stress Scenario (Dollar: +31% and Commodities Prices: -30%):
Stressed MTM: R$354 million
March 31st, 2012
*Source: Cetip Report, March 2012.
Fixed Income: Fixed, Floating, Inflation, Libor
Currencies: Dollar, Euro, Yen, Pound, Canadian Dollar,
Australian Dollar
Commodities: Sugar, Soybean (Grain, Meal and Oil), Corn,
Cotton, Metals, Energy
R$ Millions
3,428 3,457 3,709 3,712 4,287
106 84
178 157 126
236 224
358 354 354
Mar - 11 Jun - 11 Sept - 11 Dec - 11 Mar - 12
Notional Value
MtM
MtM Stressed
10/15 Investor Relations | 1Q12|
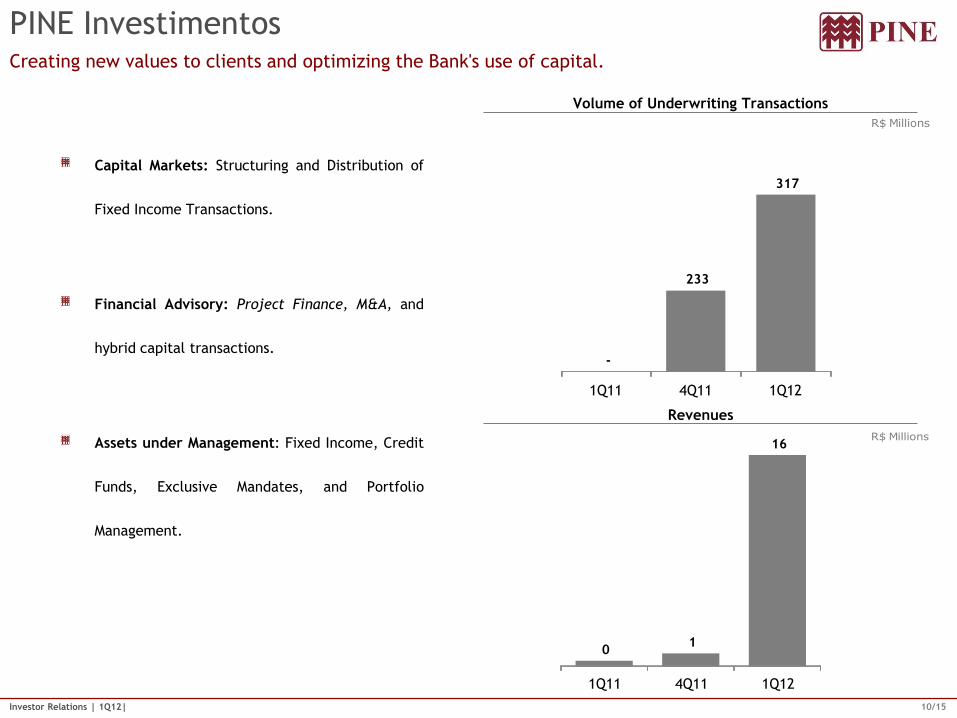
0 1
16
1Q11 4Q11 1Q12
-
233
317
1Q11 4Q11 1Q12
PINE Investimentos
Volume of Underwriting Transactions
Revenues
Creating new values to clients and optimizing the Bank's use of capital.
Capital Markets: Structuring and Distribution of
Fixed Income Transactions.
Financial Advisory: Project Finance, M&A, and
hybrid capital transactions.
Assets under Management: Fixed Income, Credit
Funds, Exclusive Mandates, and Portfolio
Management.
R$ Millions
R$ Millions

11/15 Investor Relations | 1Q12|
Funding Diverse sources of funding…
R$ Millions
1,566 1,646 1,654 1,592 1,720 1,845 1,965 2,130 2,128
1,064 1,124 1,463 1,530 1,114
1,287 1,253 1,196 1,186 85
175
198 214
218
212 228 250 281
248 201
224 320
272 210 165 106 161
50 36
46 42
41 53 66 112 31
242 453
626 829
867 898 867
867 868
-
-
-
21
33
247 256 281 291
276
203
194
194
201
220 237 246 233
239
227
200
160 282
267 310 353 276
87
151
166
158 172
102 86 250
125
448
405
413 377
435
596 814
753 841
Mar - 10 Jun - 10 Sept - 10 Dec - 10 Mar - 11 Jun - 11 Sept - 11 Dec - 11 Mar - 12
Funding Breakdown Trade Finance
Private Placements
Multilateral Lines
International Capital
Markets
Local Capital Markets
BNDES
Demand Deposits
Interbank Time Deposits
High Net Worth Individual
Time Deposits
Corporate Time Deposits
Institutional Time
Deposits
5,182
4,622
4,304
5,437 5,322
5,936
6,248 6,544 6,421
12/15 Investor Relations | 1Q12|
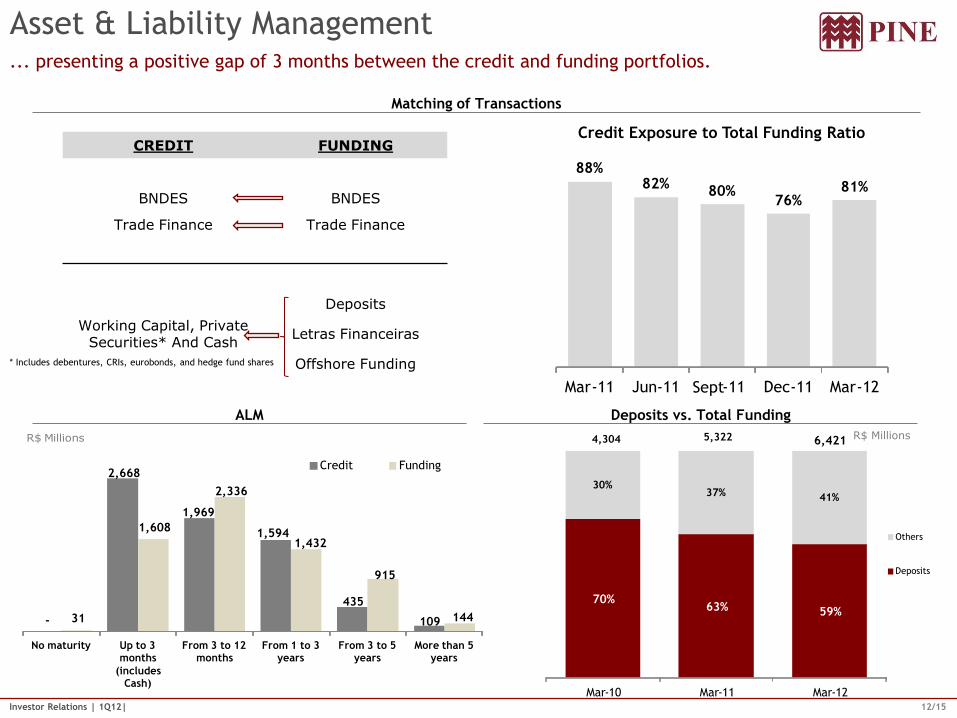
70% 63% 59%
30% 37% 41%
Mar - 10 Mar - 11 Mar - 12
Others
Deposits
5,322 4,304 6,421
Asset & Liability Management ... presenting a positive gap of 3 months between the credit and funding portfolios.
ALM Deposits vs. Total Funding
Matching of Transactions
CREDIT FUNDING
BNDES BNDES
Trade Finance Trade Finance
Deposits
Working Capital, Private Securities* And Cash
Letras Financeiras
Offshore Funding * Includes debentures, CRIs, eurobonds, and hedge fund shares
88% 82%
80% 76%
81%
Mar - 11 Jun - 11 Sept - 11 Dec - 11 Mar - 12
Credit Exposure to Total Funding Ratio
R$ Millions
-
2,668
1,969
1,594
435
109 31
1,608
2,336
1,432
915
144
No maturity Up to 3 months
(includes Cash)
From 3 to 12 months
From 1 to 3 years
From 3 to 5 years
More than 5 years
Credit Funding
R$ Millions
13/15 Investor Relations | 1Q12|
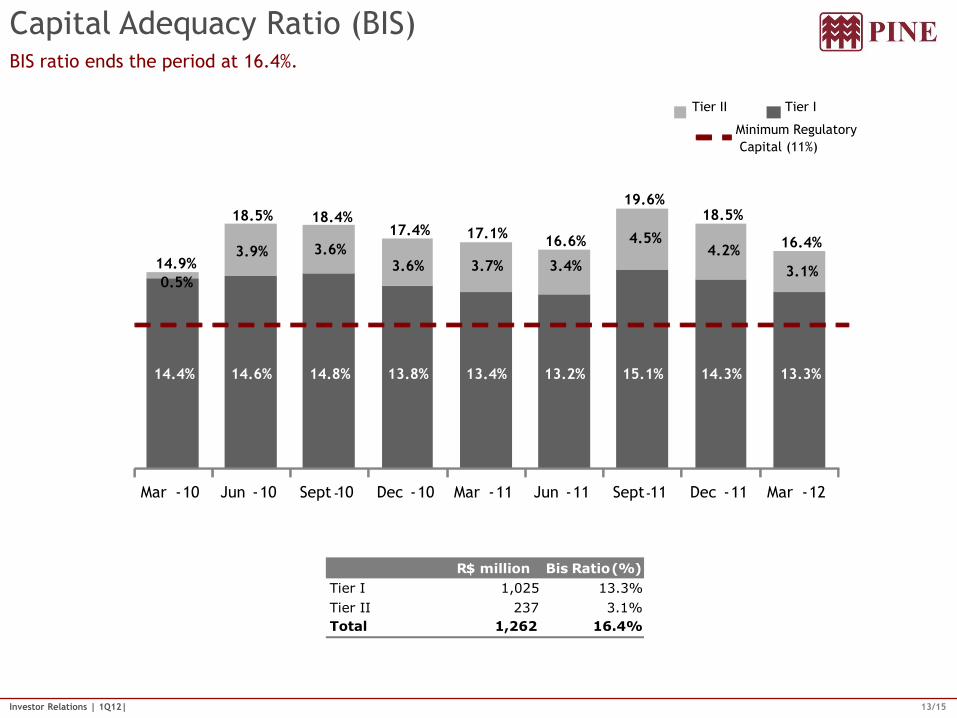
Capital Adequacy Ratio (BIS) BIS ratio ends the period at 16.4%.
14.4% 14.6% 14.8% 13.8% 13.4% 13.2% 15.1% 14.3% 13.3%
0.5%
3.9% 3.6% 3.6% 3.7% 3.4%
4.5% 4.2%
3.1%
Mar - 10 Jun - 10 Sept - 10 Dec - 10 Mar - 11 Jun - 11 Sept - 11 Dec - 11 Mar - 12
Tier II Tier I
14.9%
18.5% 18.4% 17.4% 17.1%
Minimum Regulatory
Capital (11%)
16.6%
19.6% 18.5%
16.4%
R $ million Bis R atio ( % )
Tier I 1,025 13.3%
Tier II 237 3.1%
Total 1,262 16.4%
14/15 Investor Relations | 1Q12|
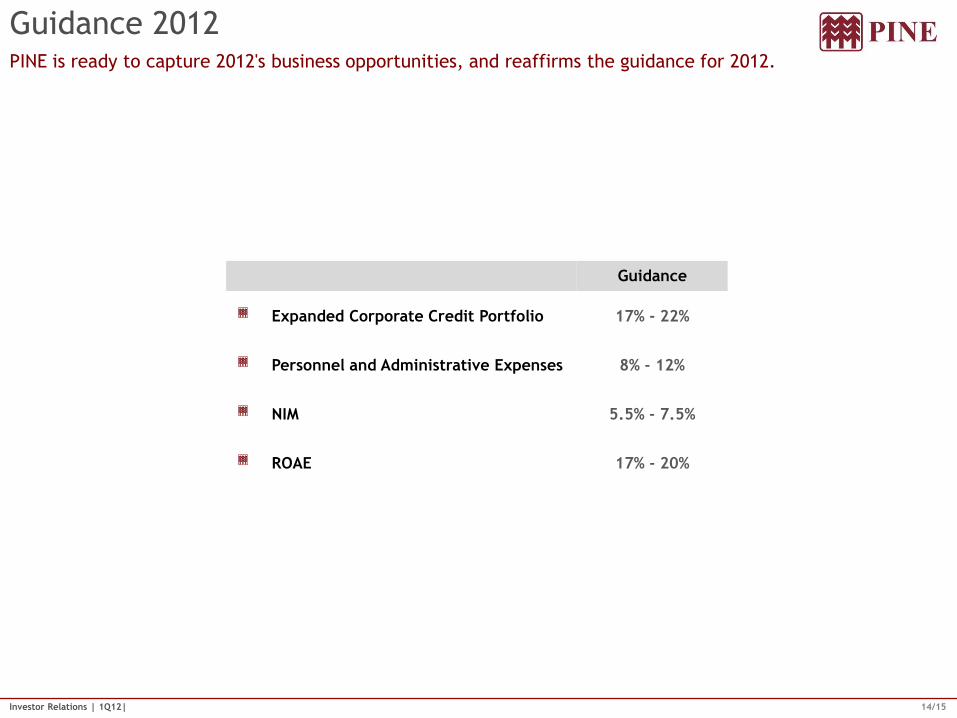
Guidance 2012 PINE is ready to capture 2012's business opportunities, and reaffirms the guidance for 2012.
Guidance
Expanded Corporate Credit Portfolio 17% - 22%
Personnel and Administrative Expenses 8% - 12%
NIM 5.5% - 7.5%
ROAE 17% - 20%
15/15 Investor Relations | 1Q12|
This presentation contains forward-looking statements relating to the prospects of the business, estimates for operating and financial results, and those related to growth prospects of PINE. These are
merely projections and, as such, are based exclusively on the expectations of PINE’s management concerning the future of the business and its continued access to capital to fund the Company’s business
plan. Such forward-looking statements depend, substantially, on changes in market conditions, government regulations, competitive pressures, the performance of the Brazilian economy and the industry,
among other factors and risks disclosed in PINE’s filed disclosure documents and are, therefore, subject to change without prior notice.
Investor Relations
Norberto Zaiet Junior
COO
Susana Waldeck
CFO
Raquel Varela
Head of Investor Relations
Alejandra Hidalgo
Investor Relations Manager
Fone: +55-11-3372-5343
www.pine.com.br/ri