1q16 conference call
TRANSCRIPT

1Q16 Earnings ReleaseR$ million
April 26, 2016

2
Highlights
Net Revenues - Car Rental Division (R$ million) Net Revenues - Fleet Rental Division (R$ million)
310.1 339.7
1Q15 1Q16
148.9 158.4
1Q15 1Q16
186.3 202.5
1Q15 1Q16
100.3 103.0
1Q15 1Q16
Consolidated EBIT (R$ million) Consolidated Net Income (R$ million)
Utilization rate evolution – Car Rental# Rented cars – Car Rental
66.3%
69.0%70.7% 71.1%
73.4%
1Q15 2Q15 3Q15 4Q15 1Q16
43,025 42,250 42,709
45,277 47,139
1Q15 2Q15 3Q15 4Q15 1Q16

3
Net Revenues (R$ million)
# Daily Rentals (thousands)
Car Rental
802.2 980.7 1,093.7 1,163.5 1,284.4 1,258.0
310.1 339.7
2010 2011 2012 2013 2014 2015 1Q15 1Q16
10,734 12,794 13,749 14,242 15,416 15,566
3,812 4,242
2010 2011 2012 2013 2014 2015 1Q15 1Q16
Volume growth of 11.3% even in an adverse macro sce nario

Average daily rental evolution and utilization rate Car Rental
4
Competitive and commercial intelligence to stimulat e demand and increase utilization rate
78.0779.68
82.36
84.85
87.71
84.56 85.2683.61
2010 2011 2012 2013 2014 2015 1Q15 1Q16
Average daily rental – In R$
69.1%
68.9%
70.8%
66.8%
69.9%
69.3%66.3%
73.4%
2010 2011 2012 2013 2014 2015 1Q15 1Q16
Utilization rate

5
Car Rental network evolution
# of car rental locations (Brazil and abroad)
3 new corporate locations were added to the network
234 247 272 286 304 320 323
181 202 202 193 172 174 17261 47 50 63 64 70 70476 496 524 542 540 564 565
2010 2011 2012 2013 2014 2015 1Q16
+3
Localiza´s branches - Brazil Franchisees´ branches - Brazil Fr anchisses´ branches - abroad

361.1455.0
535.7 575.9 571.9 608.5
148.9 158.4
2010 2011 2012 2013 2014 2015 1Q15 1Q16
8,0449,603 10,601 10,844 10,363 10,901
2,746 2,746
2010 2011 2012 2013 2014 2015 1Q15 1Q16
6
Net Revenues (R$ million)
# Daily Rentals (thousands)
Fleet Rental
0.0%
6.4% increase in net revenues due to higher average renta l rate

Purchases (includes accessories) Used c ar sales net revenues
Cars purchased Cars sold
7
Net investmentFleet Expansion* (quantity)
Net Investment in Fleet (R$ million)
9,178 2,0117,103
18,649
308.4 98.8588.5 278.9
* It does not include theft / crashed cars.
9,183
465.0
(273)
233.5
65,934 59,950 58,655
69,744 79,804
64,032
10,640 6,989
47,285 50,772 56,644
62,641 70,621
64,305
17,449 16,348
2010 2011 2012 2013 2014 2015 1Q15 1Q16
1,910.4 1,776.5 1,618.8
2,026.2
2,483.2 2,278.4
349.0 255.2
1,321.9 1,468.1 1,520.0 1,747.3
2,018.2 2,044.9
543.9 544.6
2010 2011 2012 2013 2014 2015 1Q15 1Q16
(6,809) (9,359)
(194.9) (289.4)
Fleet was adjusted after the summer vacation peak of demand

8
End of period fleetQuantity
61,445 64,688 65,086 70,717 77,573 76,755 71,343 68,901
26,615 31,629 32,104 32,809 34,312 33,948 33,500 32,228 10.652 12,958 14,545 14,233 13,339 13,992 13,272 14,037 98,712
109,275 111,735 117,759 125,224 124,695 118,115 115,166
2010 2011 2012 2013 2014 2015 1Q15 1Q16
Car Rental Fleet Rental Franchising
RAC Productivity:• Rented fleet increased 9.6%
• Fleet reduction of 3.1%

1,175.3 1,450.0 1,646.7 1,758.9 1,874.0 1,883.1 463.1 502.4
1,321.9 1,468.1 1,520.0 1,747.3 2,018.2 2,044.9
543.9 544.6
2,497.2 2,918.1 3,166.7
3,506.2 3,892.2 3,928.0
1,007.0 1,047.0
2010 2011 2012 2013 2014 2015 1Q15 1Q16
9
Consolidated net revenuesR$ million
Rental Used car sales
Good level of sales with 6.8% increase in average car sales price in 1Q16 x 1Q15
17,449
16,071 15,738 15,047
16,348
1Q15 2Q15 3Q15 4Q15 1Q16
# Cars sold
31.22 31.1031.98
33.23 33.34
1Q15 2Q15 3Q15 4Q15 1Q16
Average price of cars sold

10
Consolidated EBITDA R$ million
649.5821.3 875.6 916.5 969.8 934.8
245.0 258.4
2010 2011 2012 2013 2014 2015 1Q15 1Q16
(*)From 2012 on, accessories and freight of new car s have been accounted directly in the cost line, im pacting EBITDA but reducing depreciation costs.(**) It considers the new appropriation criteria of the overhead, which is also appropriated to Semino vos.
Divisions 2010* 2011* 2012 2013 2014** 2015 1Q15 1Q16
Car Rental 45.3% 46.9% 40.9% 36.8% 38.7% 31.8% 34.4% 34.5%
Fleet Rental 68.0% 68.6% 66.4% 65.5% 60.0% 62.2% 59.3% 64.5%
Rental Consolidated 52.3% 53.8% 49.3% 46.5% 45.3% 41.7% 42. 5% 44.1%
Used Car Sales 2.6% 2.8% 4.2% 5.7% 6.0% 7.3% 8.8% 6.8%
EBITDA increased R$13.4 million in the 1Q16 x 1Q15

11
Average depreciation per car (in R$)
Car Rental
Higher depreciation reflects the expectation of low er new car prices increases
1,536 1,684 1,896 1,452
1,270
622 836
2010 2011 2012 2013 2014 2015 1Q16
2,076
IPI Effect
3,972
*
* Annualized
3,510 4,133
4,311
4,592 4,202 3,935 4,175
2010 2011 2012 2013 2014 2015 1Q16
1.097
Efeito IPI
5.408*
* Annualized
Fleet Rental

12
*2012 EBIT was impacted by R$144.5 million of additional dep reciation related to IPI (sales tax) reduction.
Consolidated EBIT R$ million
Divisions 2010 2011 2012 2013 2014 2015 1Q15 1Q16
Car Rental 38.5% 38.8% 23.7% 32.8% 36.2% 34.3% 38.7% 35.6%
Fleet Rental 46.2% 45.6% 36.9% 45.1% 44.3% 48.9% 43.3% 50.3%
Consolidated 41.0% 41.1% 28.3% 37.1% 38.8% 39.1% 40.2% 40.3%
EBIT grew R$16.2 million in 1Q16 x 1Q15
482.1595.7
465.8
652.1726.7 735.5
186.3 202.5
2010 2011 2012 2013 2014 2015 1Q15 1Q16
610.3*

250.5 291.6
240.9
384.3 410.6 402.4
100.3 103.0
2010 2011 2012 2013 2014 2015 1Q15 1Q16
13
* Pro forma 2012 net income excluding additional depreciation related to the IPI tax reduction, net of income tax.
Consolidated net incomeR$ million
336.3*
Reconciliation EBITDA x Net income 2010 2011 2012 2013 2 014 2015 1Q15 1Q16 Var. R$ Var. %
Consolidated EBITDA 649.5 821.3 875.6 916.5 969.8 934.8 245.0 258.4 13.4 5.5%
Cars depreciation (146.3) (201.5) (232.4) (229.0) (207.4) (163.6) (49.9) (46.3) 3.6 -7.2%
Cars additional depreciation – IPI effect - - (144.5) - - - - - - -
Other property depreciation and amortization (21.1) ( 24.1) (32.9) (35.4) (35.7) (35.7) (8.8) (9.6) (0.8) 9.1%
Financial expenses, net (130.1) (179.0) (138.7) (110.6) (151.1) (202.7) (48.0) (67.7) (19.7) 41.0%
Income tax and social contribution (101.5) (125.1) (13 5.3) (157.2) (165.0) (130.4) (38.0) (31.8) 6.2 -16.3%
Income tax and social contribution – IPI effect - - 49. 1 - - - - - - -
Net income of the period 250.5 291.6 240.9 384.3 410.6 402.4 100.3 103.0 2.7 2.7%
Net income increased 2.7% despite the R$19.7 millio n increase in financial expenses

14
Free cash flow - FCFFree cash flow - R$ million 2010 2011 2012 2013 2014 2015 1Q16
Ope
ratio
nsEBITDA 649.5 821.3 875.6 916.5 969.8 934.8 258.4
Used car sale revenue, net from taxes (1,321.9) (1,468.1) (1,520.0) (1,747.3) (2,018.2) (2,044.9) (544.6)
Depreciated cost of cars sold (*) 1,203.2 1,328.6 1,360.2 1,543.8 1,777.0 1,769.1 477.3
(-) Income tax and social contribution (57.8) (83.0) (100.9) (108.5) (113.1) (110.7) (28.8)
Change in working capital 54.5 (83.9) 37.1 2.9 (27.1) (30.0) (8.8)
Cash generated by rental operations 527.5 514.9 652.0 607.4 588.4 518.3 153.5
Cap
ex -
Ren
ewal
s
Used car sale revenue, net from taxes 1,321.9 1,468.1 1,520.0 1,747.3 2,018.2 2,036.3 232.8
Fleet renewal investment (1,370.1) (1,504.5) (1,563.3) (1,819.7) (2,197.7) (2,278.4) (255.2)
Net investment for fleet renewal (48.2) (36.4) (43.3) (72.4) (179.5) (242.1) (22.4)
Fleet renewal – quantity 47,285 50,772 56,644 62,641 70,621 64,032 6,989
Investment, other property and intangibles investm ents (50.6) (59.9) (77.8) (47.5) (46.3) (29.7) (5.0)
Free cash flow from operations, net of fleet renewa l capex 428.7 418.6 530.9 487.5 362.6 246.5 126.1
Cap
ex -
Gro
wth Fleet growth (investment) (540.3) (272.0) (55.5) (209.4) (286.8) 8.6 311.8
Change in accounts payable to car suppliers 111.3 32.7 (116.9) 89.7 334.4 (121.2) (255.6)
Fleet growth (429.0) (239.3) (172.4) (119.7) 47.6 (112.6) 56.2
Fleet increase / (reduction) – quantity 18,649 9,178 2,011 7,103 9,183 (273) (9,359)
Free cash flow after growth, and before interest an d new HQ (0.3) 179.3 358.5 367.8 410.2 133.9 182.3
Cap
ex –
HQ
Investment in the construction of the new HQ (0.5) (3.1) (2.4) (6.5) (55.7) (123.3) (3.6)
Marketable securities – new HQ - - - - (92.6) 92.6 -
New headquarters construction (0.5) (3.1) (2.4) (6.5) (148.3) (30.7) (3.6)
Free cash flow before interest (0.8) 176.2 356.1 361.3 261.9 103.2 178.7
Free cash flow
(*) without the technical discounts reduction up to 2010
15
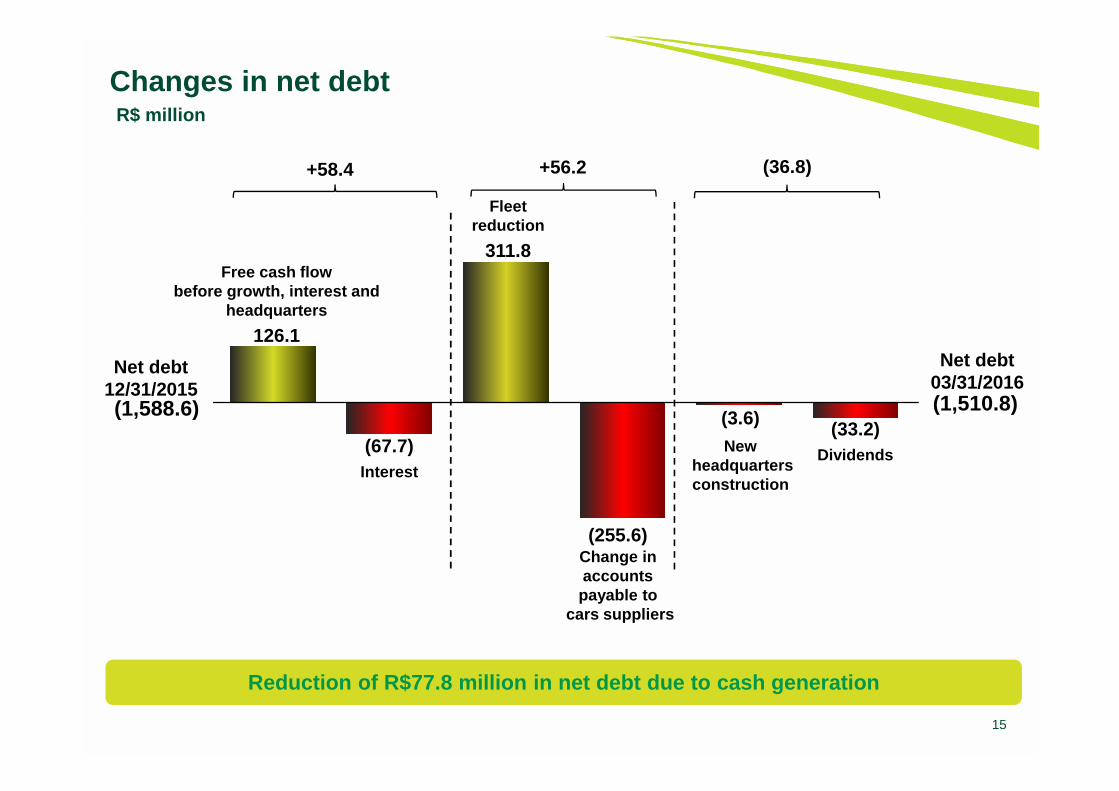
(1,510.8)
Net debt03/31/2016
Free cash flowbefore growth, interest and
headquarters
126.1
(1,588.6)
Net debt12/31/2015
(33.2)Dividends
(3.6)New
headquarters construction
(67.7)Interest
Changes in net debt R$ million
Reduction of R$77.8 million in net debt due to cash gener ation
Fleetreduction
311.8
(255.6)Change in accounts payable to
cars suppliers
+58.4 +56.2 (36.8)

16
Debt maturity profile (principal)R$ million
Comfortable debt profile and strong cash position
As of March 31, 2016
264.1 468.6
252.6 619.5
770.0 672.5
2016 2017 2018 2019 2020 2021Cash
1,610.8
2016
1,604.8

17
Debt - ratiosNet debt vs. Fleet value
BALANCE AT THE END OF PERIOD 2010(*) 2011 2012 2013 2014 2015 1Q16
Net debt / Fleet value 52% 51% 48% 48% 40% 44% 45%
Net debt / EBITDA(**) 2.0x 1.7x 1.4x 1.5x 1.4x 1.7x 1.5x
Net debt / Equity 1.4x 1.2x 0.9x 1.0x 0.8x 0.8x 0.8x
EBITDA / Net financial expenses 5.0x 4.6x 6.3x 8.3x 6.4x 4.6x 3.8x
(*) 2010 ratios based on USGAAP financial statemen ts(**) Annualized
Net debt Fleet value
Comfortable debt ratios
1,281.1 1,363.4 1,231.2 1,332.8 1,322.3 1,588.6 1,510.8
2,446.7 2,681.7 2,547.6 2,797.9 3,296.3 3,642.7 3,372.2
2010 2011 2012 2013 2014 2015 1Q16

18
ROIC versus cost of debt after taxes
The Company presented a positive spread of 5.7p.p.despite the adverse scenario and a significant incr ease in the interest rate
7.3%8.6%
6.3% 6.0%8.0%
9.5% 10.2%
16.9% 17.1% 16.1% 16.5% 17.5% 17.0%15.9%
2010 2011 2012 2013 2014 2015 1Q16
ROIC
Cost of debt
after taxes
9.6p.p. 8.5p.p. 9.5p.p.9.8p.p. 10.5p.p.
7.5p.p.5.7p.p.
2010 to 2014 ROIC considered income tax rate of 30.0%2015 and 1Q16 ROIC considered income tax rate of 24.5%
Annualized

Thank You!
The material presented is a presentation of general backgro und information about LOCALIZA as of the date of the presenta tion. It is information in summaryform and does not purport to be complete. It is not intended to be relied upon as advice to potential investors. No represen tation or warranty, express orimplied, is made concerning, and no reliance should be place d on, the accuracy, fairness, or completeness of the informa tion presented herein.
This presentation contains statements that are forward-lo oking within the meaning of Section 27A of the Securities Act of 1933 and Section 21E of theSecurities Exchange Act of 1934. Such forward-looking stat ements are only projections and are not guarantees of future performance. Investors are cautionedthat any such forward-looking statements are and will be, as the case may be, subject to many risks, uncertainties and fac tors relating to the operations andbusiness environments of LOCALIZA and its subsidiaries tha t may cause the actual results of the companies to be material ly different from any future resultsexpressed or implied in such forward-looking statements.
Although LOCALIZA believes that the expectations and assum ptions reflected in the forward-looking statements are rea sonable based on informationcurrently available to LOCALIZA’s management, LOCALIZA ca nnot guarantee future results or events. LOCALIZA expressl y disclaims a duty to update any ofthe forward-looking statement.
Securities may not be offered or sold in the United States unl ess they are registered or exempt from registration under th e Securities Act of 1933.
This presentation does not constitute an offer, invitation or solicitation of an offer to subscribe to or purchase any securities. Neither this presentation nor anythingcontained herein shall form the basis of any contract or commitment whatsoever.
www.localiza.com/ri
Email: [email protected]
Tel: 55 31 3247-7024
Disclaimer