1q18 results presentation - bbva
TRANSCRIPT

1Q18 Results April 27th 2018 / 1
1Q18 Results April, 27th 2018

1Q18 Results April 27th 2018 / 2
Disclaimer
This document is only provided for information purposes and does not constitute, nor should it be interpreted as, an offer to sell or exchange or acquire, or an invitation for offers to buy securities issued by any of the aforementioned companies. Any decision to buy or invest in securities in relation to a specific issue must be made solely and exclusively on the basis of the information set out in the pertinent prospectus filed by the company in relation to such specific issue. No one who becomes aware of the information contained in this report should regard it as definitive, because it is subject to changes and modifications.
This document contains or may contain forward looking statements (in the usual meaning and within the meaning of the US Private Securities Litigation Reform Act of 1995) regarding intentions, expectations or projections of BBVA or of its management on the date thereof, that refer to or incorporate various assumptions and projections, including projections about the future earnings of the business. The statements contained herein are based on our current projections, but the actual results may be substantially modified in the future by various risks and other factors that may cause the results or final decisions to differ from such intentions, projections or estimates. These factors include, without limitation, (1) the market situation, macroeconomic factors, regulatory, political or government guidelines, (2) domestic and international stock market movements, exchange rates and interest rates, (3) competitive pressures, (4) technological changes, (5) alterations in the financial situation, creditworthiness or solvency of our customers, debtors or counterparts. These factors could cause or result in actual events differing from the information and intentions stated, projected or forecast in this document or in other past or future documents. BBVA does not undertake to publicly revise the contents of this or any other document, either if the events are not as described herein, or if such events lead to changes in the information contained in this document.
This document may contain summarised information or information that has not been audited, and its recipients are invited to consult the documentation and public information filed by BBVA with stock market supervisory bodies, in particular, the prospectuses and periodical information filed with the Spanish Securities Exchange Commission (CNMV) and the Annual Report on Form 20-F and information on Form 6-K that are filed with the US Securities and Exchange Commission.
Distribution of this document in other jurisdictions may be prohibited, and recipients into whose possession this document comes shall be solely responsible for informing themselves about, and observing any such restrictions. By accepting this document you agree to be bound by the foregoing restrictions.

1Q18 Results April 27th 2018 / 3
Quarterly evolution (%)
CET1 fully-loaded – BBVA Group
Strong Results in the Quarter
Quarterly evolution (€m)
1,199 1,107 1,143
70
1,340
1,123
1,192
1Q17 2Q17 3Q17 4Q17 1Q18
Net Attributable Profit
11.01% 11.10% 11.20% 11.34% 11.47%
Mar.17 Jun.17 Sep.17 Dec.17 * Mar.18 *
+13 bps
+46 bps
(*) Data proforma includes IFRS9 full impact (-31bps) and +57 bps from corporate transactions (sale of BBVA Chile and RE Assets to Cerberus)
Ex- TEF impairment
Proforma Proforma

1Q18 Results April 27th 2018 / 4
1Q18 Highlights
01 Strong core revenue growth
02 Efficiency improvement
04 Sound risk indicators
05 Strong capital position
06 Focus on shareholder value
Efficiency 48.9% -106 bps vs. 12M17 (constant)
CoR 0.85% -6 bps vs. 1Q17
NPL ratio
4.4% -50 bps vs. 1Q17
CET 1 FL (Proforma)
11.47% +13 bps vs. 4Q17
NII + Fees (€ constant)
+9.4% vs. 1Q17
TBV/Share + Shareholders remuneration
(1) % of total sales YtD, # of transactions
Mobile customers
19.3m +43% Mar-18 vs. Mar-17
03 Outstanding trend in digital sales and customers
Digital Sales
37% Mar-18(1)
(2) Includes Other Comprehensive Income
Coverage ratio
73% +214 bps vs. 1Q17
ROE (2)
11.9% Mar-18
ROTE (2)
14.6% Mar-18
5.55 5.58
-0.14 0.15
5.69 5.73
Dec-17 Mar-18
+3.2 %
IFRS9 impact
Dividends

1Q18 Results April 27th 2018 / 5
1Q18 Profit & Loss
BBVA Group (€m) 1Q18 % % constant
Net Interest Income 4,288 -0.8 9.3
Net Fees and Commissions 1,236 1.1 9.8
Net Trading Income 410 -40.6 -38.5
Other Income & Expenses 162 11.2 19.1
Gross Income 6,096 -4.5 4.2
Operating Expenses -2,979 -5.0 3.2
Operating Income 3,117 -4.0 5.1
Impairment on Financial Assets -823 -12.9 -5.2
Provisions and Other Gains and Losses -58 -75.5 -75.4
Income Before Tax 2,237 8.3 20.1
Income Tax -611 6.5 17.3
Net Income 1,626 9.0 21.1
Non-controlling Interest -286 -2.2 15.8
Net Attributable Profit 1,340 11.8 22.3
Change
1Q18/1Q17

1Q18 Results April 27th 2018 / 6
4Q17 impacted by higher income from CPI linkers in Turkey
Strong Core Revenue Growth
Net Interest Income (€m constant)
Net Fees and Commissions (€m constant)
Net Trading Income (€m constant)
Gross Income (€m constant)
3,925 4,045 4,122 4,401
4,288
1Q17 2Q17 3Q17 4Q17 1Q18
1,126 1,128 1,180 1,183 1,236
1Q17 2Q17 3Q17 4Q17 1Q18
+4.5%
-2.6 %
667
350 332
541 410
1Q17 2Q17 3Q17 4Q17 1Q18
5,853 5,751 5,819 6,159 6,096
1Q17 2Q17 3Q17 4Q17 1Q18
-1.0 %
+9.3% +9.8%
+4.2% +204 €m
CNCB disposal
Good trend maintained, remarkable Spain and Turkey
CNCB disposal in 1Q17 and higher results from FX hedges in 4Q17
Supported by core revenues

1Q18 Results April 27th 2018 / 7
Efficiency Improvement
Positive jaws & significant efficiency improvement
Efficiency Ratio (€ constant)
Group Operating Jaws (YtD (%); (€ constant))
52.8%
49.9%
48.9%
12M16 12M17 3M18
-106 bps
4,761 5,187
5,686
2,863 2,887 2,979
1Q16 1Q17 1Q18
Gross Income ex-NTI
Operating Expenses
8.9%
9.6%
0.8% 3.2%

1Q18 Results April 27th 2018 / 8
Positive jaws in all geographies
Operating Jaws Breakdown (YoY (%); (€ constant))
Spain*
-4.7% -0.3%
GrossIncome ex-NTI
Operatingexpenses
USA
13.0%
7.3%
GrossIncome ex-NTI
Operatingexpenses
Mexico
6.3%
4.8%
GrossIncome ex-NTI
Operatingexpenses
Turkey South America ex-Vza
17.3%
8.6%
GrossIncome ex-NTI
Operatingexpenses
14.5%
9.3%
GrossIncome ex-NTI
Operatingexpenses
(*) Spain includes banking and non-core real-estate activities.
INFLATION
1.4% Average 12m
INFLATION
2.0% Average 12m
INFLATION
6.1% Average 12m
INFLATION
11.2% Average 12m
INFLATION
8.2% Average 12m

1Q18 Results April 27th 2018 / 9
Outstanding trend of digital sales in all markets (% of total sales YtD, # of transactions)
SPAIN USA(*)
24.1
41.8
Mar-17 Mar-18
MEXICO
22.4
46.2
Mar-17 Mar-18
16.1
19.8
Mar-17 Mar-18
TURKEY
31.0
38.7
Mar-17 Mar-18
SOUTH AMERICA
21.5
36.7
Mar-17 Mar-18
GROUP
Strong growth across markets
Figures have been restated due to change in the inclusion of some products
(*) Excludes ClearSpend Debit cards
13.7
31.1
Mar-17 Mar-18
1Q18 Results April 27th 2018 / 10
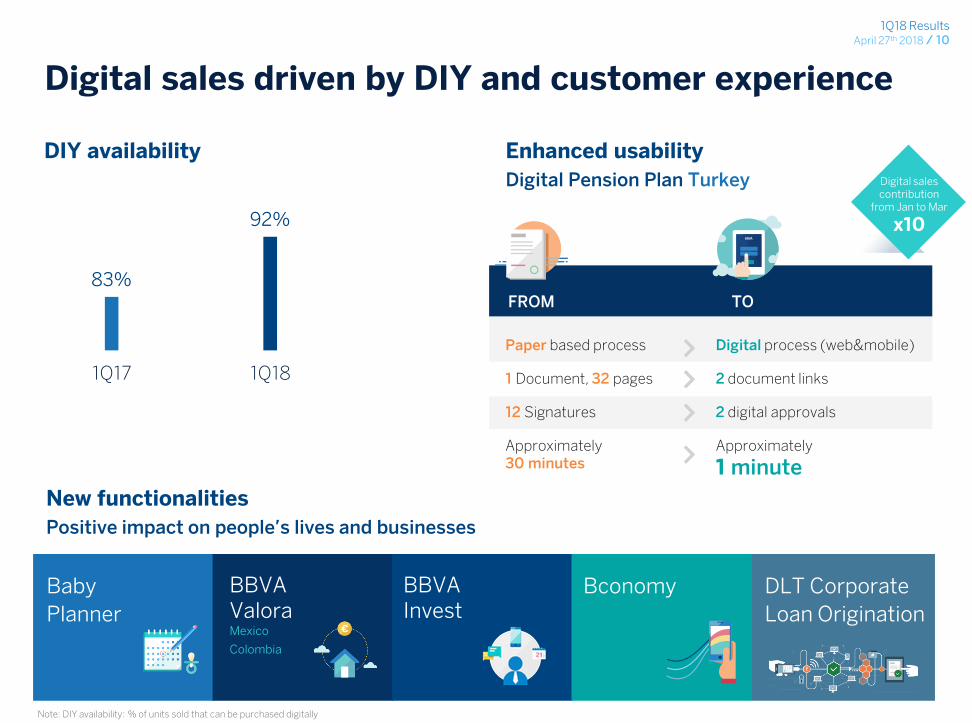
Digital sales driven by DIY and customer experience
Digital Pension Plan Turkey
FROM TO
Paper based process
1 Document, 32 pages
12 Signatures
Approximately 30 minutes
Digital process (web&mobile)
2 document links
2 digital approvals
Approximately
1 minute
DIY availability Enhanced usability
New functionalities
Positive impact on people’s lives and businesses
83%
92%
1Q17 1Q18
Baby
Planner
BBVA Valora Mexico
Colombia
BBVA Invest
Bconomy DLT Corporate
Loan Origination
Note: DIY availability: % of units sold that can be purchased digitally
Digital sales contribution
from Jan to Mar
x10

1Q18 Results April 27th 2018 / 11
1Q17 1Q182017 1Q18
Digital sales boost total sales and improve efficiency
Express Personal Loan New Production USA (Monthly average production, units, % of total units)
29%
10%
Digital sales
Click&Pay Lines of Credit Small Business Spain (YtD units, % of total units)
Total sales increase
+33%
59% 5%
Migration to more efficient channels
Digital sales
Non-Digital sales
Non-Digital sales
+325%
+16%
x15
+47%
Digital sales
Digital sales
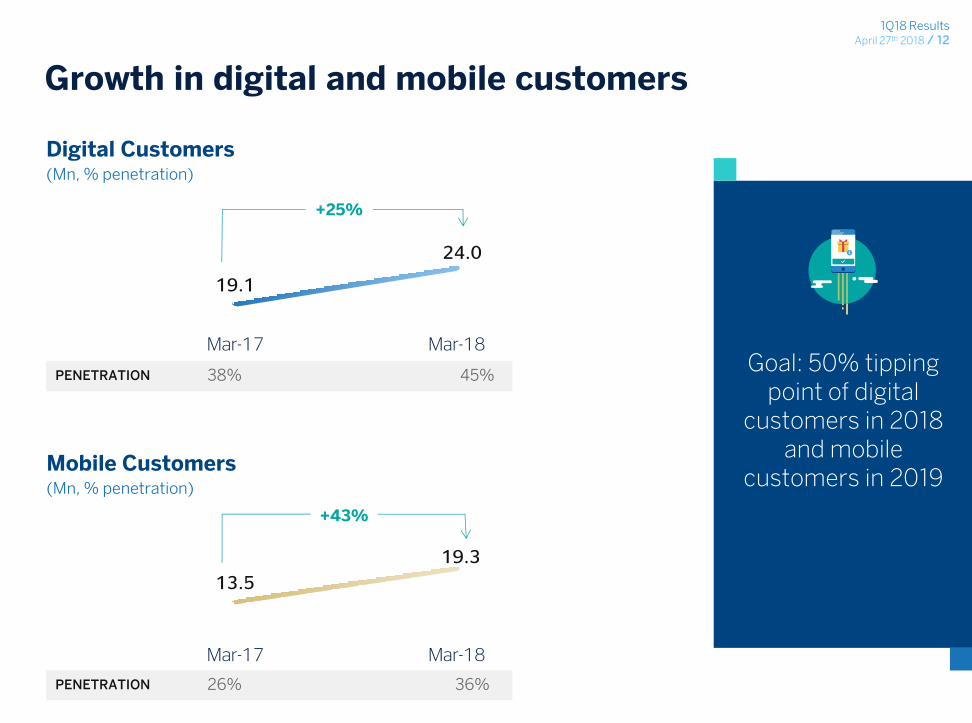
1Q18 Results April 27th 2018 / 12
19.1
24.0
Mar-17 Mar-18
13.5
19.3
Mar-17 Mar-18
+25%
PENETRATION 38% 45%
Growth in digital and mobile customers
Mobile Customers (Mn, % penetration)
26% 36%
+43%
PENETRATION
Goal: 50% tipping point of digital
customers in 2018 and mobile
customers in 2019
Digital Customers (Mn, % penetration)

1Q18 Results April 27th 2018 / 13
Non Digital Digital
Non Digital DigitalNon Digital DigitalNon Digital Digital
Non Digital DigitalNon Digital Digital
Mexico Turkey South America**
Digital customers are more loyal and engaged
Attrition rate (Last 12M)
(*) Group: Spain, USA, Mexico , Turkey, Argentina, Colombia and Peru
(**) South America: data of attrition in Argentina, Colombia and Peru
Note: Attrition rate calculated based on change in customers from Mar17 to Mar18, excluding new customers during this period
Group* Spain USA
-57% -43% -23%
-76% -55% -42%
Significant mobile interactions increase Spain (# Customers monthly interactions)
x2 1 x
every 2days
~1 x per week
<1 x per month
May.16 Mar.18
Web (
Branch
App

1Q18 Results April 27th 2018 / 14
Sound risk indicators1
Asset quality improvement
Total Impairments2 (Financial Assets and RE) (€m constant)
NPLs (€bn)
926 931 963 1,047 800
1Q17 2Q17 3Q17 4Q17 1Q18
-23.6%
-13.6 %
0.9% 0.9% 0.9% 0.9%
0.8%
0.9% 0.9% 0.9% 1.0%
0.8% 0.7%
0.9%
1.1%
1Q17 2Q17 3Q17 4Q17 1Q18
Cost of risk
YtD (%)
NPL & Coverage ratios (%)
23.2 22.4 20.9 20.5
19.5
1Q17 2Q17 3Q17 4Q17 1Q18
- 3.7 € bn
- 1.0 € bn
71% 71% 72% 65% 73%
4.9% 4.8% 4.6% 4.6% 4.4%
1Q17 2Q17 3Q17 4Q17 1Q18
Coverage
NPL(3)
(1) Data as of 1Q18 under IFRS9 standards, 2017 figures under IAS 39
(2) Ex- Telefónica impairment in 4Q17 (3) NPL ratio exclude repos in Spain
Cost of risk
Cost of risk & RE assets impairments

1Q18 Results April 27th 2018 / 15
11.08% 11.34% 11.47%
-31 bps
+57 bps
+37 bps
-15 bps -9 bps
Dec.17 IFRS9 fullimpact
CorporateTransactions*
Dec.17proforma
NetEarnings
Dividendaccrual
Others** Mar.18proforma
Strong capital position
CET1 fully-loaded - BBVA Group Evolution (%, bps)
+13 bps
(*) Sale of BBVA Chile and RE Assets to Cerberus. (**) Others includes RWAs, mark to market of the AFS portfolio, FX impact, AT1 coupons, among others.
High quality capital Leverage ratio fully-loaded (%)
European Peer Group: BARC, BNPP, CS, CMZ, DB, HSBC, ISP, LBG, RBS, SAN, SG, UBS, UCI, CASA. European Peer Group figures as of December 2017. BBVA figures of March 2018
6.4% 4.9%
European Peer Group Average
#1
AT1 and Tier 2 buckets already covered Mar-18, Fully loaded (%)
AT1 Tier 2
1.65% 2.55%

1Q18 Results April 27tH 2018 / 16
Business Areas

1Q18 Results April 27th 2018 / 17
Spain Banking Activity
Key Ratios
2.04 2.00 2.01
1.92 1.93 1.94
0.11 0.07 0.07
1Q17 4Q17 1Q18
53% 50%
57%
6.0%
5.5% 5.4%
0.38% 0.32%
0.17%
1Q17 4Q17 1Q18
Customer Spread (%)
51.2
54.9
51.5
59.2 60.3
57.5
3M17 12M17 3M18
Efficiency ratios (%, €) Asset Quality ratios1
Loans: Quarterly evolution impacted by seasonality. Growth in high profitable segments
Customer spread: Slight improvement thanks to a more profitable loan portfolio and a successful price management
Core revenue growth (+1.1% yoy): sound growth in mutual funds and banking service fees
Costs continue to go down and efficiency improves
Asset quality: NPLs down -€456 Mn qoq and CoR better than expected due to provision releases.
Profit & Loss Δ (%) Δ (%)
(€m) 1Q18 vs 1Q17 vs 4Q17
Net Interest Income 921 -1.6 -2.7
Net Fees and Commissions 412 7.8 6.4
Net Trading Income 167 -26.0 3.3
Other Income & Expenses 97 -27.6 n.s.
Gross Income 1,596 -4.8 10.3
Operating Expenses -823 -4.2 -1.4
Operating Income 773 -5.4 26.4
Impairment on Financial
Assets (net)-70 -57.4 -49.1
Provisions (net) and other
gains (losses)-87 -32.5 10.9
Income Before Tax 616 17.7 55.9
Income Tax -178 18.4 133.8
Net Attributable Profit 437 17.3 37.3
(1) Data as of 1Q18 under IFRS9 standards, 2017 figures under IAS 39 (2) NPL ratio exclude repos
Customer spread
Yield on loans
Cost of deposits
C/I ex NTI
C/I
Coverage
NPL2
CoR (YtD)
(1) Performing loans under management. (2) Includes mutual funds, pension funds and other off balance sheet funds. Note: Activity excludes repos
128.8
40.8
63.0
Cust. Funds
€ bn 232.6
Demand Deposits
Time Deposits
Off-BS Funds2
+17.9%
-36.5%
+9.7%
YoY 0.7%
Activity (Mar-18)
21.4
9.9
15.5
76.6
22.0
12.9
5.0
Lending
Mortgages
Very small business
Public sector
Other commercial
Consumer
Corporates + CIB
€ bn 163.3
YoY -2.4%
-4.3%
+37.7%
-15.7%
+4.9%
+11.4%
3.5%
1
YtD
-2.4% YtD
-1.8%
Rest
-9.5%

1Q18 Results April 27th 2018 / 18
Non Core Real Estate
Net exposure (€bn)
3.7
1.7 1.3
5.6
4.7 4.8
9.3
6.4 6.1
Mar-17 Dec-17 Mar-18
-14.6%
-63.7%
Net attributable profit (€m)
Real Estate owned assets
RE developer loans
Cerberus deal to reduce almost entirely our exposure to REOs. Transaction expected to be closed in 3Q18
Significant reduction in net losses in 1Q18, in line with expectations
-106
-216
-27
1Q17 4Q17 1Q18
-34.1%
-75.0%

1Q18 Results April 27th 2018 / 19
1.3% 1.2% 1.2%
4.9
10.4
2.1 7.1
20.1
7.8
Lending
37.4
15.4
5.8
Cust. Funds
USA
(1) Performing loans under management. Note: Activity excludes repos
Key Ratios
Customer Spread (%)
Efficiency ratios (%, constant €)
Asset Quality ratios1
€ bn 58.5
Demand Deposits
Time Deposits
Others
+0.8%
+25.1%
-3.9%
YoY +5.7%
Activity (Mar-18) (constant €)
Mortgages
Consumer
SMEs
Public Sector
€ bn 52.5
YoY +1.6%
+19.4%
-6.6%
+2.8%
-4.2%
1
Coverage
NPL
CoR (YtD)
Profit & Loss Δ (%) Δ (%)
(constant €m) 1Q18 vs 1Q17 vs 4Q17
Net Interest Income 524 15.0 3.6
Net Fees and Commissions 148 -2.4 1.1
Net Trading Income 24 -14.6 -22.6
Other Income & Expenses 3 n.s. -88.9
Gross Income 699 11.8 -1.1
Operating Expenses -435 7.3 -3.2
Operating Income 264 20.0 2.4
Impairment on Financial
Assets (net)-20 -67.9 -52.7
Provisions (net) and other
gains (losses)8 n.s. n.s.
Income Before Tax 251 64.3 27.2
Income Tax -56 37.3 -51.3
Net Attributable Profit 195 74.1 137.0
3.88 4.16
4.31
3.51 3.75 3.86
0.37 0.41 0.45
1Q17 4Q17 1Q18
Customer spread
Yield on loans
Cost of deposits
0.49% 0.43%
0.16%
1Q17 4Q17 1Q18
106% 104% 98%
NOTE: BTS business has been reclassified from USA to Mexico
64.8 64.3 62.2
67.9 66.9 64.5
3M17 12M17 3M18
C/I ex NTI
C/I
YtD
-0.2%
(1) Data as of 1Q18 under IFRS9 standards, 2017 figures under IAS 39
NII growth at mid teens
Focus on growing the consumer book (+13.5% yoy)
Customer spread continues to increase thanks to low deposit Betas
Positive jaws and efficiency improvement
CoR much better than expected thanks to provision releases and a positive IFRS9 macro adjustment
Upward trend in profitability
Other commercial
+13.5%
YtD
-1.1%
CIB -10.0%
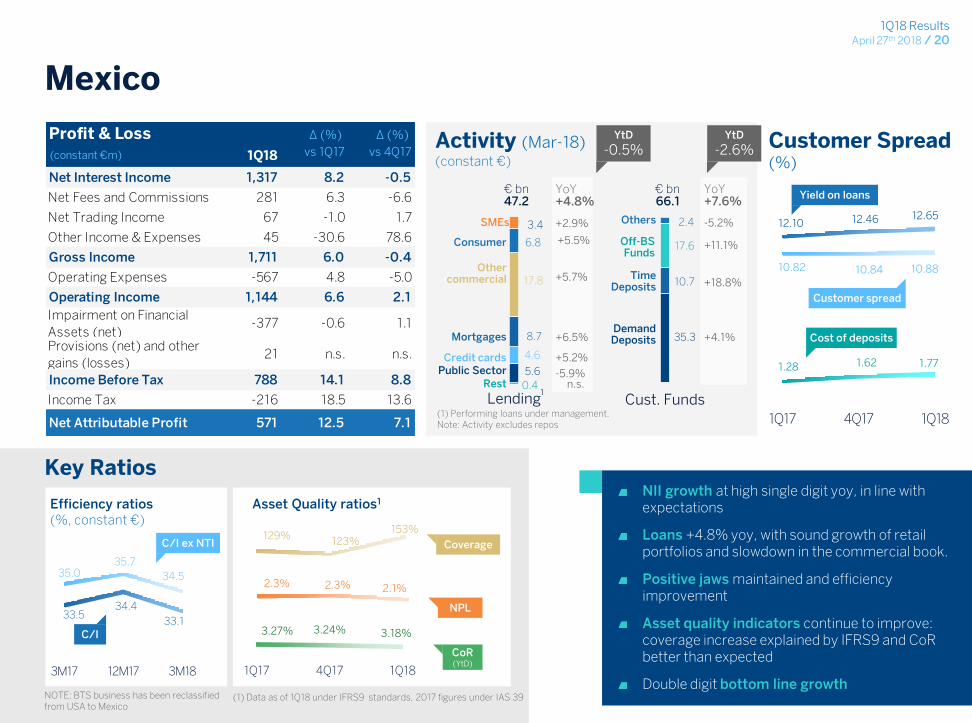
1Q18 Results April 27th 2018 / 20
0.4
5.6
4.6
8.7
17.8
6.8
3.4
Lending
35.3
10.7
17.6
2.4
Cust. Funds
Mexico
(1) Performing loans under management. Note: Activity excludes repos
Key Ratios
Customer Spread (%)
Efficiency ratios (%, constant €)
Asset Quality ratios1
€ bn 66.1
Demand Deposits
Time Deposits
Others
+4.1%
+18.8%
-5.2%
YoY +7.6%
Activity (Mar-18) (constant €)
Mortgages
Consumer
Other commercial
Rest Public Sector
Credit cards
€ bn 47.2
YoY +4.8%
-5.9%
+5.2%
n.s.
+5.7%
+2.9%
+6.5%
1
Coverage
NPL
CoR (YtD)
NOTE: BTS business has been reclassified from USA to Mexico
C/I ex NTI
Profit & Loss Δ (%) Δ (%)
(constant €m) 1Q18 vs 1Q17 vs 4Q17
Net Interest Income 1,317 8.2 -0.5
Net Fees and Commissions 281 6.3 -6.6
Net Trading Income 67 -1.0 1.7
Other Income & Expenses 45 -30.6 78.6
Gross Income 1,711 6.0 -0.4
Operating Expenses -567 4.8 -5.0
Operating Income 1,144 6.6 2.1
Impairment on Financial
Assets (net)-377 -0.6 1.1
Provisions (net) and other
gains (losses)21 n.s. n.s.
Income Before Tax 788 14.1 8.8
Income Tax -216 18.5 13.6
Net Attributable Profit 571 12.5 7.1
Off-BS Funds
+11.1%
33.5 34.4
33.1
35.0 35.7
34.5
3M17 12M17 3M18
C/I
129% 123%
153%
3.27% 3.24% 3.18%
1Q17 4Q17 1Q18
2.3% 2.3% 2.1%
(1) Data as of 1Q18 under IFRS9 standards, 2017 figures under IAS 39
NII growth at high single digit yoy, in line with expectations
Loans +4.8% yoy, with sound growth of retail portfolios and slowdown in the commercial book.
Positive jaws maintained and efficiency improvement
Asset quality indicators continue to improve: coverage increase explained by IFRS9 and CoR better than expected
Double digit bottom line growth
YtD
-0.5% YtD
-2.6%
SMEs
+5.5%
12.10 12.46 12.65
10.82 10.84 10.88
1.28 1.62 1.77
1Q17 4Q17 1Q18
Customer spread
Yield on loans
Cost of deposits
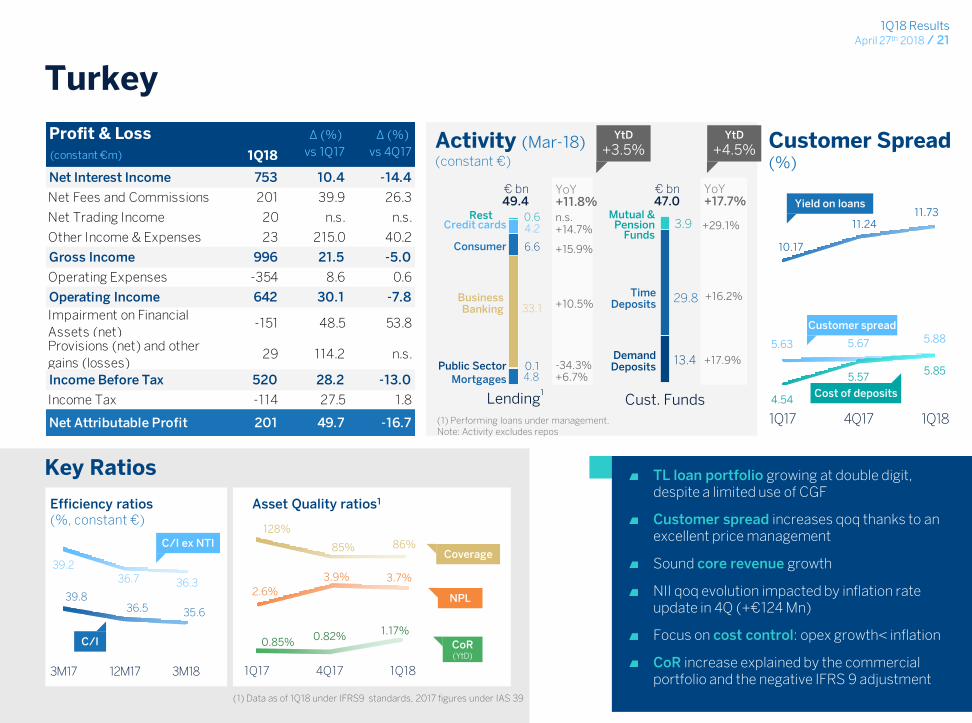
1Q18 Results April 27th 2018 / 21
Turkey
Key Ratios
Customer Spread (%)
Efficiency ratios (%, constant €)
Asset Quality ratios1
Coverage
NPL
CoR (YtD)
C/I ex NTI
C/I
Profit & Loss Δ (%) Δ (%)
(constant €m) 1Q18 vs 1Q17 vs 4Q17
Net Interest Income 753 10.4 -14.4
Net Fees and Commissions 201 39.9 26.3
Net Trading Income 20 n.s. n.s.
Other Income & Expenses 23 215.0 40.2
Gross Income 996 21.5 -5.0
Operating Expenses -354 8.6 0.6
Operating Income 642 30.1 -7.8
Impairment on Financial
Assets (net)-151 48.5 53.8
Provisions (net) and other
gains (losses)29 114.2 n.s.
Income Before Tax 520 28.2 -13.0
Income Tax -114 27.5 1.8
Net Attributable Profit 201 49.7 -16.7
39.8 36.5 35.6
39.2
36.7 36.3
3M17 12M17 3M18
128%
85% 86%
0.85% 0.82%
1.17%
1Q17 4Q17 1Q18
2.6%
3.9% 3.7%
(1) Data as of 1Q18 under IFRS9 standards, 2017 figures under IAS 39
13.4
29.8
3.9
Cust. Funds
4.8 0.1
33.1
6.6
4.2 0.6
Lending
(1) Performing loans under management. Note: Activity excludes repos
€ bn 47.0
Demand Deposits
Time Deposits
+17.9%
YoY +17.7%
Activity (Mar-18) (constant €)
Mortgages
Consumer
Business Banking
Rest
Public Sector
Credit cards
€ bn 49.4
YoY +11.8%
-34.3%
+14.7% n.s.
+10.5%
+15.9%
+6.7%
1
Mutual & Pension
Funds
YtD
+3.5% YtD
+4.5%
+16.2%
+29.1%
TL loan portfolio growing at double digit, despite a limited use of CGF
Customer spread increases qoq thanks to an excellent price management
Sound core revenue growth
NII qoq evolution impacted by inflation rate update in 4Q (+€124 Mn)
Focus on cost control: opex growth< inflation
CoR increase explained by the commercial portfolio and the negative IFRS 9 adjustment
10.17
11.24 11.73
5.63 5.67 5.88
4.54
5.57 5.85
1Q17 4Q17 1Q18
Yield on loans
Cost of deposits
Customer spread

1Q18 Results April 27th 2018 / 22
15.73
13.11 12.70
3.76 3.93 4.01
6.32 6.60 6.72
6.91 6.57 6.75
1Q17 4Q17 1Q18
South America
Key Ratios
Customer Spread (%)
Efficiency ratios (%, constant €)
Asset Quality ratios1
Coverage
NPL
CoR (YtD)
C/I ex NTI
C/I
47.3
44.6 44.8
52.8
49.9 50.0
3M17 12M17 3M18
96% 89% 93%
3.3% 3.4% 3.6%
1.49%
1.32% 1.37%
1Q17 4Q17 1Q18
Profit & Loss Δ (%) Δ (%)
(constant €m) 1Q18 vs 1Q17 vs 4Q17
Net Interest Income 792 14.7 3.1
Net Fees and Commissions 163 10.6 -4.4
Net Trading Income 112 15.1 -7.5
Other Income & Expenses 12 n.s. n.s.
Gross Income 1,079 15.4 2.5
Operating Expenses -484 9.4 3.8
Operating Income 595 20.7 1.4
Impairment on Financial
Assets (net)-167 2.2 65.5
Provisions (net) and other
gains (losses)-11 -27.6 -67.9
Income Before Tax 417 32.6 -7.6
Income Tax -128 37.8 -0.1
Net Attributable Profit 210 33.4 -9.5
NOTE: Venezuela 1Q18 figures in current €
(1) Data as of 1Q18 under IFRS9 standards, 2017 figures under IAS 39
Sound growth in all P&L lines
Loan growth accelerating to double digit, supported mainly by Argentina and Colombia
Positive operating jaws
CoR better than expectations
5.6
14.6
12.5
12.6
3.1
Lending
8.2
10.5
14.3
13.4
11.8
Cust. Funds
(1) Performing loans under management Note: Activity excludes repos
€ bn 58.3
+39.5%
YoY +7.9%
Activity (Mar-18) (constant €)
€ bn 48.4
YoY +11.7%
+73.9%
+4.3%
+10.0%
+10.8%
1
Chile
Argentina
Colombia
Peru
Others
Chile
Argentina
Colombia
Peru
Others
+5.5%
+9.2%
+1.8%
+7.1%
-2.4%
YtD
+1.6% YtD
+1.5%
1Q18 Results April 27th 2018 / 23
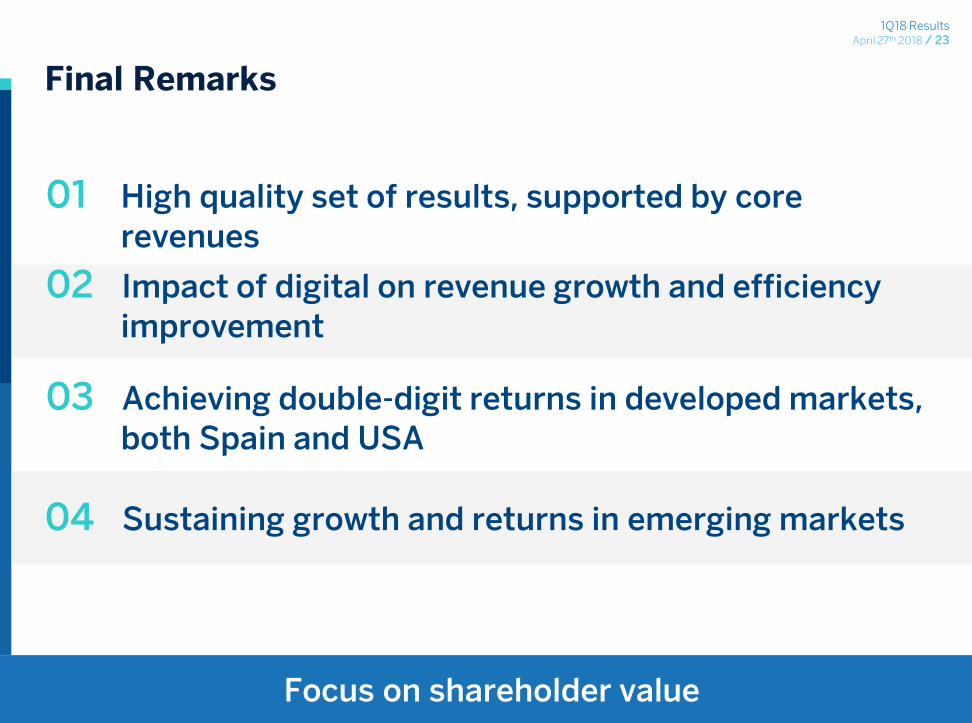
Final Remarks
Focus on shareholder value
01 High quality set of results, supported by core revenues
02 Impact of digital on revenue growth and efficiency improvement
03 Achieving double-digit returns in developed markets,
both Spain and USA
04 Sustaining growth and returns in emerging markets
1Q18 Results April 27tH 2018 / 24
Customer Spread by Country
ALCO Portfolio and Liquidity Coverage Ratios (LCRs)
Capital and RWA
TBV per Share and Dividends evolution
Net Attributable Profit Evolution
Gross Income Breakdown
P&L Accounts by Business Unit
Annex 01
04
07
02
03
06
05

1Q18 Results April 27th 2018 / 25
Customer Spread by Country
01

1Q18 Results April 27th 2018 / 26
Customer Spreads: Quarterly Evolution
(1) Foreign currency
Note: USA ex NY Business Activity
Average (€)
1Q17 2Q17 3Q17 4Q17 1Q18
Spain 1.92% 1.94% 1.93% 1.93% 1.94%
Yield on Loans 2.04% 2.02% 2.00% 2.00% 2.01%
Cost of Deposits -0.11% -0.08% -0.08% -0.07% -0.07%
USA 3.51% 3.67% 3.76% 3.75% 3.86%
Yield on Loans 3.88% 3.99% 4.12% 4.16% 4.31%
Cost of Deposits -0.37% -0.33% -0.36% -0.41% -0.45%
Mexico MXN 12.10% 12.02% 11.81% 12.05% 12.06%
Yield on Loans 13.70% 13.78% 13.68% 14.02% 14.20%
Cost of Deposits -1.60% -1.77% -1.87% -1.98% -2.14%
Mexico FC1 3.46% 3.62% 3.47% 3.68% 3.93%
Yield on Loans 3.49% 3.66% 3.53% 3.76% 4.02%
Cost of Deposits -0.04% -0.05% -0.07% -0.08% -0.09%
Turkey TL 5.51% 5.24% 4.89% 4.90% 4.94%
Yield on Loans 13.15% 13.48% 13.75% 14.06% 14.55%
Cost of Deposits -7.65% -8.25% -8.86% -9.16% -9.62%
1Q17 2Q17 3Q17 4Q17 1Q18
Turkey FC1 3.73% 3.74% 3.88% 4.04% 4.16%
Yield on Loans 5.63% 5.76% 5.95% 6.14% 6.45%
Cost of Deposits -1.90% -2.02% -2.07% -2.10% -2.29%
Argentina 15.73% 14.72% 13.47% 13.11% 12.70%
Yield on Loans 21.18% 19.97% 18.63% 18.77% 19.29%
Cost of Deposits -5.46% -5.24% -5.16% -5.65% -6.59%
Chile 3.76% 4.16% 3.31% 3.93% 4.01%
Yield on Loans 6.42% 6.71% 5.47% 6.27% 6.41%
Cost of Deposits -2.67% -2.55% -2.15% -2.34% -2.40%
Colombia 6.32% 6.52% 6.78% 6.60% 6.72%
Yield on Loans 12.08% 11.94% 11.62% 11.37% 11.31%
Cost of Deposits -5.76% -5.42% -4.84% -4.77% -4.60%
Peru 6.91% 6.91% 6.80% 6.57% 6.75%
Yield on Loans 8.23% 8.32% 8.17% 7.90% 7.92%
Cost of Deposits -1.32% -1.41% -1.37% -1.33% -1.17%
1Q18 Results April 27th 2018 / 27
ALCO Portfolio and Liquidity Coverage Ratios (LCRs)
02
1Q18 Results April 27th 2018 / 28
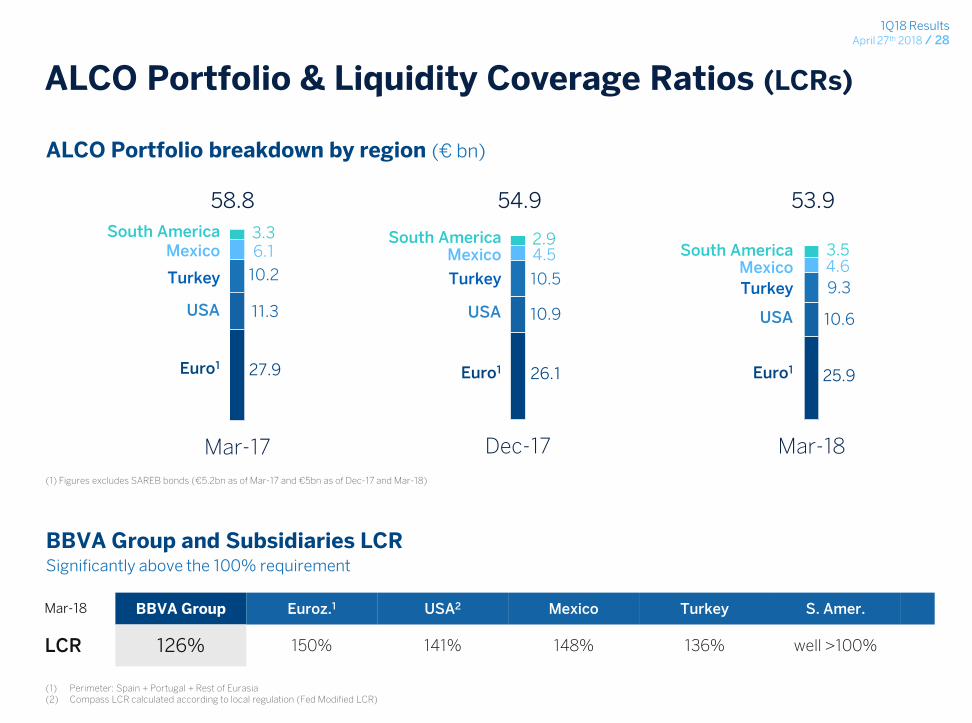
ALCO Portfolio & Liquidity Coverage Ratios (LCRs)
26.1
10.9
10.5
4.5 2.9
Dec-17
27.9
11.3
10.2
6.1 3.3
Mar-17
25.9
10.6
9.3
4.6 3.5
Mar-18
54.9
USA
Turkey
Mexico South America
Euro1
USA
Turkey
Mexico South America
58.8
ALCO Portfolio breakdown by region (€ bn)
53.9
USA
Turkey
Mexico South America
(1) Figures excludes SAREB bonds (€5.2bn as of Mar-17 and €5bn as of Dec-17 and Mar-18)
BBVA Group and Subsidiaries LCR Significantly above the 100% requirement
Euro1 Euro1
BBVA Group Euroz.1 USA2 Mexico Turkey S. Amer.
LCR 126% 150% 141% 148% 136% well >100%
(1) Perimeter: Spain + Portugal + Rest of Eurasia (2) Compass LCR calculated according to local regulation (Fed Modified LCR)
Mar-18

1Q18 Results April 27th 2018 / 29
Capital and RWA
03 Capital Base
Risk-Weighted Assets by Business Area

1Q18 Results April 27th 2018 / 30
Evolution of phased-in capital ratios (%)
11.6 11.7 11.1
1.2 1.3 1.7
2.4 2.5 2.5
Mar-17 Dec-17 Mar-18
CET1
Tier 2
Additional Tier 1
15.5 15.4
11.0 11.1 10.9
1.5 1.7 1.7
2.5 2.5 2.5
Mar-17 Dec-17 Mar-18
Evolution of fully-loaded capital ratios (%)
15.3 15.1
Capital Base
15.3 15.0
CET1
Tier 2
Additional Tier 1
Total capital Ratio Total capital Ratio
11.5%
pro-forma including corporate
transactions*
(*) Sale of BBVA Chile and RE Assets to Cerberus.

1Q18 Results April 27th 2018 / 31
Risk-Weighted Assets by Business Area
Breakdown by business area and main countries (€m) Mar-17 Dec-17 Mar-18
Banking activity in Spain 110,862 108,093 103,229
Non core Real Estate Activity 10,776 9,692 9,272
United States 64,847 58,688 57,262
Turkey 70,408 62,768 60,936
Mexico 50,244 44,941 47,769
South America 58,086 55,975 55,718
Argentina 9,250 9,364 8,679
Chile 14,476 14,431 14,730
Colombia 13,296 12,299 12,921
Peru 16,753 14,879 14,634
Venezuela 924 1,516 1,436
Rest of South America 3,387 3,485 3,319
Rest of Eurasia 14,413 15,150 14,907
Corporate Center 10,038 6,379 7,753
BBVA Group 389,674 361,686 356,847
Phased-in RWA

1Q18 Results April 27th 2018 / 32
TBV per Share and Dividends Evolution
04

1Q18 Results April 27th 2018 / 33
Shareholder’s Return: TBV per Share and Dividends
5.88 5.82 5.79 5.69
5.55 5.58
0.08 0.21 0.30 0.30 IFRS9 impact -0.14
0.15
5.96 6.03 6.09 5.99 5.69 5.73
Mar-17 Jun-17 Sep-17 Dec-17 01/01/2018 Mar-18
Shareholder Remuneration TBV
TBV per Share & Shareholder Remuneration (€ per Share)

1Q18 Results April 27th 2018 / 34
Net Attributable Profit Evolution
05

1Q18 Results April 27th 2018 / 35
Group – Net Attributable Profit
(€m)
1,199
-104
65 80 83
63 67 8 53
-173
1,340
3M17 €m FXEffect
BankingactivitySpain
Non core RE USA Mexico Turkey Rest ofEurasia
SouthAmerica
Corp. Centre 3M18 €m
YoY (%) (constant €)
17.3 -75.0 74.1 12.5 49.7 19.4 33.4 n.s.
BUSINESSES +418 €m
1Q18 Results April 27th 2018 / 36
Gross Income Breakdown
06
1Q18 Results April 27th 2018 / 37
26%
11%
16%
28%
17%
2%
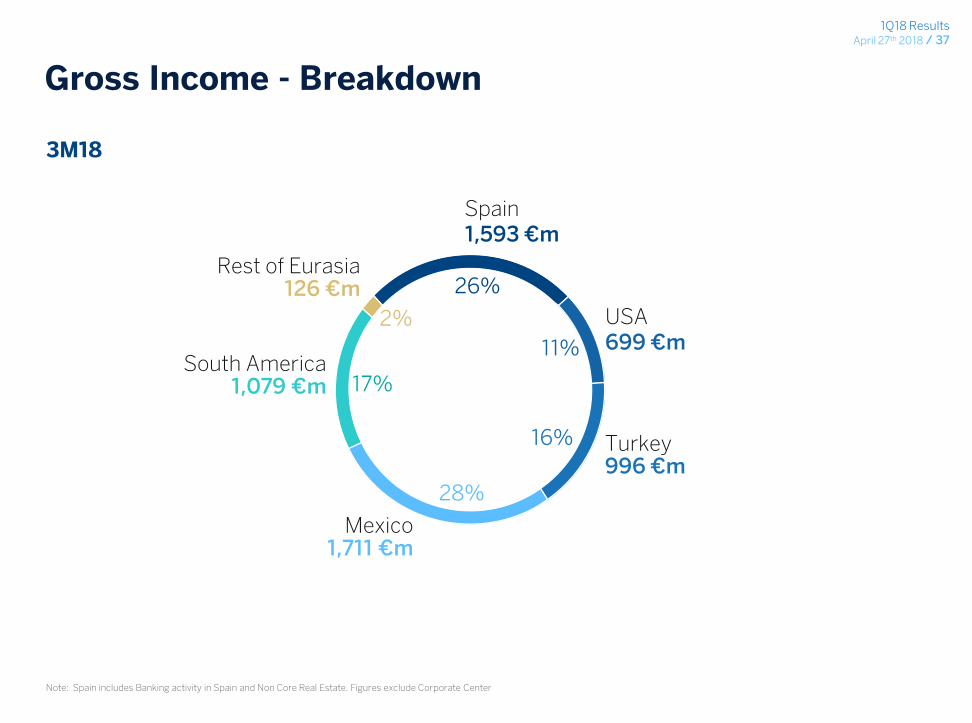
3M18
Note: Spain includes Banking activity in Spain and Non Core Real Estate. Figures exclude Corporate Center
Spain 1,593 €m
USA 699 €m
Turkey 996 €m
Mexico 1,711 €m
South America 1,079 €m
Rest of Eurasia 126 €m
Gross Income - Breakdown
1Q18 Results April 27th 2018 / 38
P&L Accounts by Business Unit
07 Total Spain: Banking Activity + Non Core Real Estate
Non Core Real Estate
Rest of Eurasia
Corporate Centre

1Q18 Results April 27th 2018 / 39
Total Spain (€m) 1Q18 1Q18 vs 1Q17 1Q18 vs 4Q17
Net Interest Income 927 -1.8 -4.4
Net Fees and Commissions 412 7.4 6.6
Net Trading Income 167 -25.7 3.6
Other Income & Expenses 86 -15.6 n.s.
Gross Income 1,593 -3.8 10.0
Operating Expenses -843 -4.7 -1.9
Operating Income 750 -2.7 27.3
Impairment on Financial Assets (net) -125 -26.0 -17.0
Provisions (net) and other gains (losses) -40 -81.3 -88.5
Income Before Tax 584 51.2 564.4
Income Tax -173 45.4 n.s.
Net Attributable Profit 410 54.2 302.7
Change (%)
Total Spain – Profit & Loss

1Q18 Results April 27th 2018 / 40
Non Core Real Estate - Profit & Loss
Non Core Real Estate (€m) 1Q18 1Q18 vs 1Q17 1Q18 vs 4Q17
Net Interest Income 7 -27.9 -70.7
Net Fees and Commissions 0 -71.3 n.s.
Net Trading Income 1 n.s. 296.0
Other Income & Expenses -11 -65.2 -48.6
Gross Income -3 -84.6 n.s.
Operating Expenses -20 -21.1 -17.4
Operating Income -24 -49.6 1.7
Impairment on Financial Assets (net) -55 1,271.7 343.3
Provisions (net) and other gains (losses) 47 n.s. n.s.
Income Before Tax -32 -76.9 -89.7
Income Tax 5 -83.8 -94.4
Net Attributable Profit -27 -75.0 -87.7
Change (%)
1Q18 Results April 27th 2018 / 41
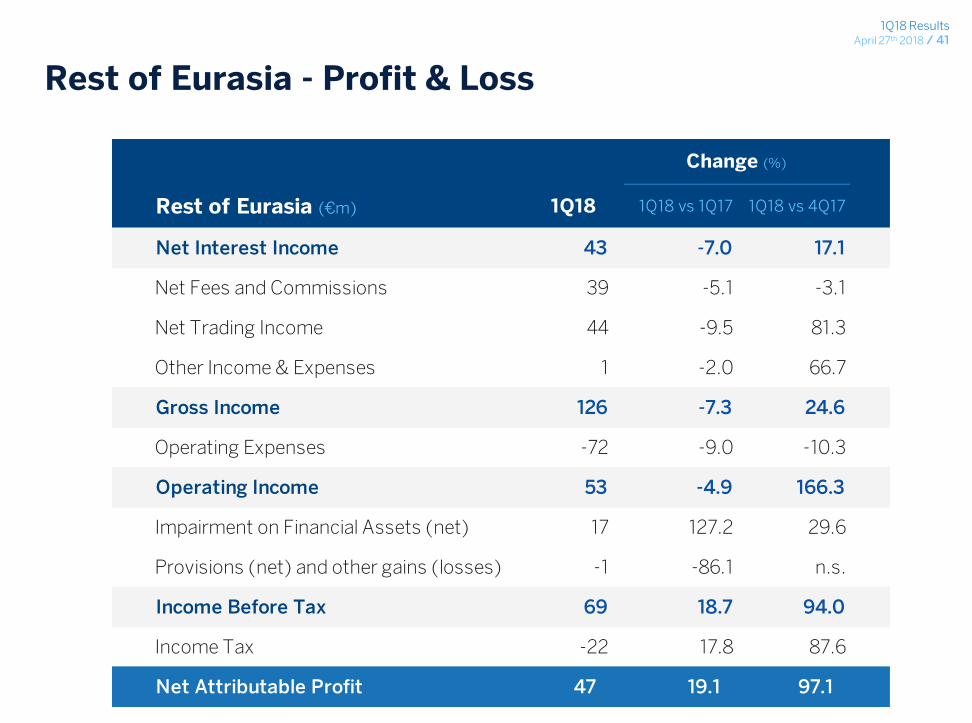
Rest of Eurasia - Profit & Loss
Rest of Eurasia (€m) 1Q18 1Q18 vs 1Q17 1Q18 vs 4Q17
Net Interest Income 43 -7.0 17.1
Net Fees and Commissions 39 -5.1 -3.1
Net Trading Income 44 -9.5 81.3
Other Income & Expenses 1 -2.0 66.7
Gross Income 126 -7.3 24.6
Operating Expenses -72 -9.0 -10.3
Operating Income 53 -4.9 166.3
Impairment on Financial Assets (net) 17 127.2 29.6
Provisions (net) and other gains (losses) -1 -86.1 n.s.
Income Before Tax 69 18.7 94.0
Income Tax -22 17.8 87.6
Net Attributable Profit 47 19.1 97.1
Change (%)

1Q18 Results April 27th 2018 / 42
Corporate Centre - Profit & Loss
Corporate Center (€m) 1Q18 1Q18 vs 1Q17 1Q18 vs 4Q17
Net Interest Income -68 -38.5 -17.9
Net Fees and Commissions -7 47.5 -63.5
Net Trading Income -24 n.s. n.s.
Other Income & Expenses -7 -75.5 n.s.
Gross Income -106 n.s. n.s.
Operating Expenses -224 7.3 -1.2
Operating Income -330 137.6 134.4
Impairment on Financial Assets (net) 0 n.s. -100.0
Provisions (net) and other gains (losses) -63 813.3 305.1
Income Before Tax -393 171.1 -69.3
Income Tax 98 351.2 32.1
Net Attributable Profit -295 141.3 -75.2
Net Attributable Profit (ex-Telefonica
Impairment)-295 141.3 319.7
Change (%)

1Q18 Results April 27th 2018 / 43
1Q18 Results April, 27th 2018