1st e-mobility power system integration symposium | berlin...
TRANSCRIPT
Development of a Model for Power Grids Based on the Cellular Approach for an Optimum Integration of
Electric Charging Infrastructure
Julia Vopava, Bernd Thormann, Thomas Kienberger Chair of Energy Network Technology
Montanuniversitaet Leoben Austria
Abstract—The increasing number of charging stations for electric vehicles and renewable energy in power grids cause a decrease of supply security and grid stability. A model which regionalises an area with a cellular based approach can simplify complex grids to identify optimum installation sites and minimise a possible expansion of power grids. Furthermore, preliminary results from the project “move2grid”, which uses this approach, are presented.
power grid, electric vehicles, renewable energy, cellular approach, load flow analysis
I. INTRODUCTION
In order to achieve the energy and climate policy objectives concerning CO2 emissions, the Austrian government started political initiatives the “Energy Strategy” and the “National Development Plan for Electric Mobility Austria“ to support the implementation of sustainable and innovative energy and mobility systems [1]. Based on these initiatives the grid operators are working to improve their grids to incorporate higher loads.
Power grids developed historically and are characterised by a central source of electrical energy produced by large scale nuclear, fossil or hydroelectric power plants. Thus they are designed for a load flow direction from the high to medium to low voltage level. The complex grid structure of the most grids make modelling and load flow calculations with annual load profiles very time-consuming. Today more and more of renewable energy is fed in the medium voltage level and often causes a turnaround of the load flow in present grids. The result is a decrease of supply security and grid stability [2].
In this overall context, the integration of an increasing number of electric vehicles in existing grid infrastructure represent a new challenge. The overlap of the electric vehicle charging demand with the peak load of households and the interaction with renewable energy plants with fluctuating energy supply need to be considered. An important point is to secure the energy supply for the charging process on the right voltage level without causing overloads. Therefore, for grid operators it is challenging to
identify the optimum installation sites for charging stations [1].
In order to localise the optimum installation sites for charging stations or renewable energy plants, a model which simplifies the complex grid and reduces the calculation time, is necessary. Such a model based on the cellular approach was developed for the distribution grid of Leoben (Styria, Austria) which has approximately 30.000 inhabitants, as part of the Austrian federal funding agency (FFG) research project “move2grid”. The focus of this project is on energy related issues of mobility (traffic simulation and locations of charging stations), energy (distribution network and local potentials), business models and processes, as well the overall system and the interactions that take place.
This paper explains the cellular approach on a simplified level to create a better understanding for the development of a model based on this approach. Afterwards, the method is applied on an example power grid with a medium voltage level. The aim is to design a simplified power grid model with sufficient accuracy. Afterwards, possible charging stations and photovoltaic potentials are implemented into the grid model. After description of the model, the strength and limitations of the approach chosen are explained. Then, the preliminary results for the integration of charging stations in the power grid model are presented. Finally, the further strategy within the project “move2grid” are explained.
II. METHODOLOGY
A. The cellular approach
The cellular approach method for grid infrastructure for power, heat and gas grids, is a flexible analysis method with the primary objective of simplifying complex grid structures. It represents a compromise between accuracy and calculation time. In the first step, the energy system is divided into energy cells. For this step, parameters like topography, population and grid infrastructure are considered. Within each of these cells, consumption, production and storage will be identified and classified. The cell size depends on the task at hand. This means one cell can be defined as single-family house or as region. In the
1st E-Mobility Power System Integration Symposium | Berlin, Germany | 23 October, 2017
next step, the time resolved data of all consumers, producers and storage units within a cell is aggregated to an energy node. For the case of incomplete data, it is possible to use standard load profiles from the BDEW [3] and synthetic load profiles from the Austrian regulation agency (e-control) [4] to aggregate annual load profiles without a substantial loss in accuracy. Finally, all energy nodes are connected according to the existing grid infrastructure. [5] [6]
B. Development of a model for the power grid
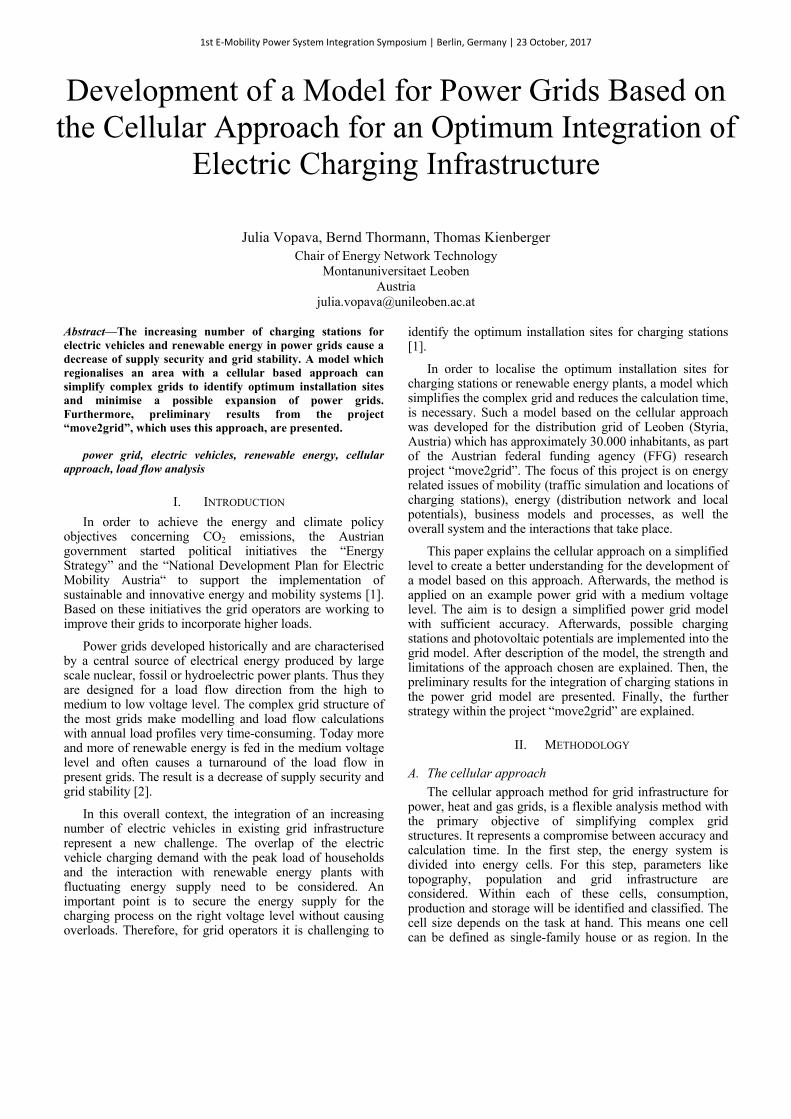
A flow diagram of the general development steps for designing a simplified grid model based on the cellular approach can be found in Figure 1. In step 1, the cell classification in consideration of the grid topology is made. The cell classification for this task is seen in Figure 2. Based on the cell classification and the original plan of the power grid, all electrical equipment (transformers, consumers, producers, storage units) and cables are identified and classified. Figure 2 shown in the top right corner contains examples for the identification of consumer, producer and storage units on the level of local grid transformers.
Figure 1. Methodology for the development of a model for power grids
Figure 2. Cell classfification Leoben, Austria
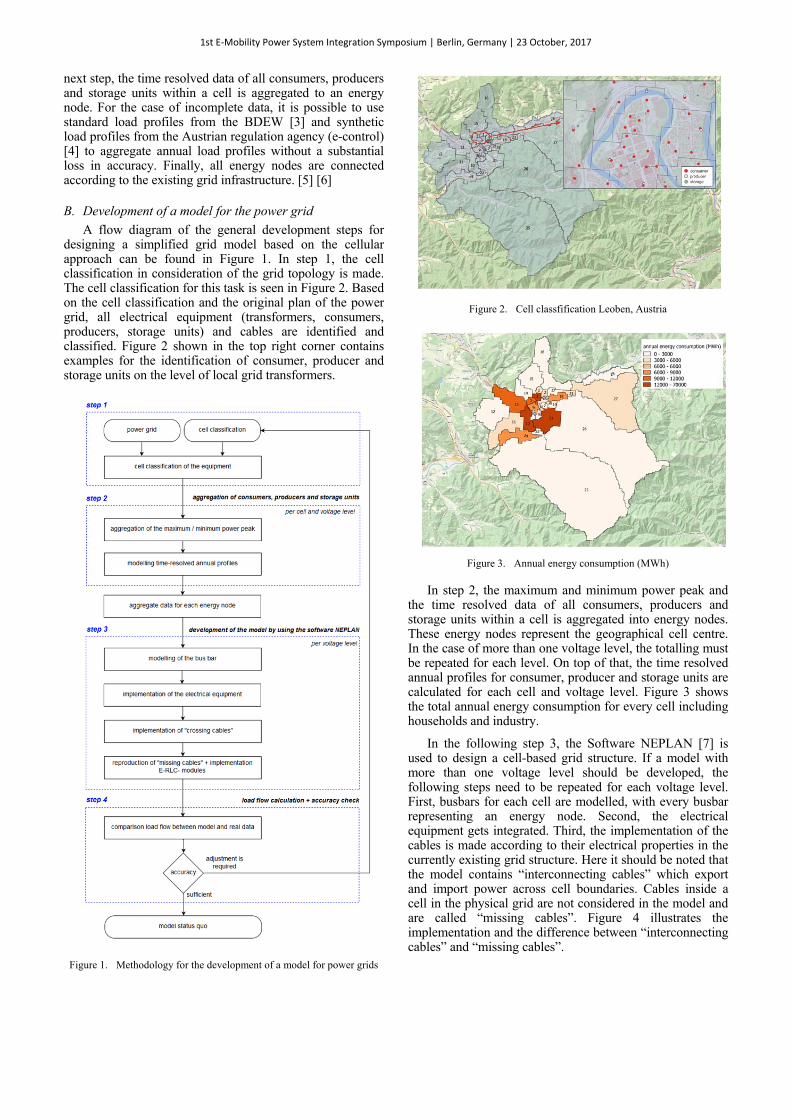
Figure 3. Annual energy consumption (MWh)
In step 2, the maximum and minimum power peak and the time resolved data of all consumers, producers and storage units within a cell is aggregated into energy nodes. These energy nodes represent the geographical cell centre. In the case of more than one voltage level, the totalling must be repeated for each level. On top of that, the time resolved annual profiles for consumer, producer and storage units are calculated for each cell and voltage level. Figure 3 shows the total annual energy consumption for every cell including households and industry.
In the following step 3, the Software NEPLAN [7] is used to design a cell-based grid structure. If a model with more than one voltage level should be developed, the following steps need to be repeated for each voltage level. First, busbars for each cell are modelled, with every busbar representing an energy node. Second, the electrical equipment gets integrated. Third, the implementation of the cables is made according to their electrical properties in the currently existing grid structure. Here it should be noted that the model contains “interconnecting cables” which export and import power across cell boundaries. Cables inside a cell in the physical grid are not considered in the model and are called “missing cables”. Figure 4 illustrates the implementation and the difference between “interconnecting cables” and “missing cables”.
1st E-Mobility Power System Integration Symposium | Berlin, Germany | 23 October, 2017
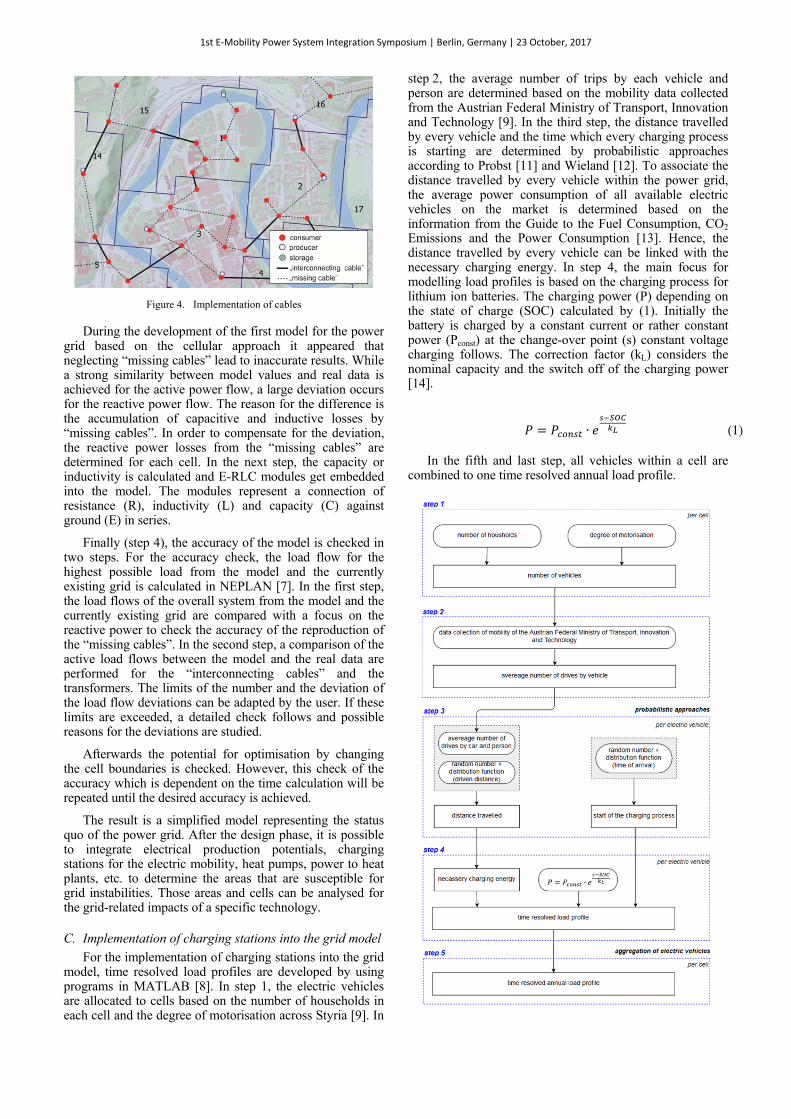
Figure 4. Implementation of cables
During the development of the first model for the power grid based on the cellular approach it appeared that neglecting “missing cables” lead to inaccurate results. While a strong similarity between model values and real data is achieved for the active power flow, a large deviation occurs for the reactive power flow. The reason for the difference is the accumulation of capacitive and inductive losses by “missing cables”. In order to compensate for the deviation, the reactive power losses from the “missing cables” are determined for each cell. In the next step, the capacity or inductivity is calculated and E-RLC modules get embedded into the model. The modules represent a connection of resistance (R), inductivity (L) and capacity (C) against ground (E) in series.
Finally (step 4), the accuracy of the model is checked in two steps. For the accuracy check, the load flow for the highest possible load from the model and the currently existing grid is calculated in NEPLAN [7]. In the first step, the load flows of the overall system from the model and the currently existing grid are compared with a focus on the reactive power to check the accuracy of the reproduction of the “missing cables”. In the second step, a comparison of the active load flows between the model and the real data are performed for the “interconnecting cables” and the transformers. The limits of the number and the deviation of the load flow deviations can be adapted by the user. If these limits are exceeded, a detailed check follows and possible reasons for the deviations are studied.
Afterwards the potential for optimisation by changing the cell boundaries is checked. However, this check of the accuracy which is dependent on the time calculation will be repeated until the desired accuracy is achieved.
The result is a simplified model representing the status quo of the power grid. After the design phase, it is possible to integrate electrical production potentials, charging stations for the electric mobility, heat pumps, power to heat plants, etc. to determine the areas that are susceptible for grid instabilities. Those areas and cells can be analysed for the grid-related impacts of a specific technology.
C. Implementation of charging stations into the grid model
For the implementation of charging stations into the grid model, time resolved load profiles are developed by using programs in MATLAB [8]. In step 1, the electric vehicles are allocated to cells based on the number of households in each cell and the degree of motorisation across Styria [9]. In
step 2, the average number of trips by each vehicle and person are determined based on the mobility data collected from the Austrian Federal Ministry of Transport, Innovation and Technology [9]. In the third step, the distance travelled by every vehicle and the time which every charging process is starting are determined by probabilistic approaches according to Probst [11] and Wieland [12]. To associate the distance travelled by every vehicle within the power grid, the average power consumption of all available electric vehicles on the market is determined based on the information from the Guide to the Fuel Consumption, CO2 Emissions and the Power Consumption [13]. Hence, the distance travelled by every vehicle can be linked with the necessary charging energy. In step 4, the main focus for modelling load profiles is based on the charging process for lithium ion batteries. The charging power (P) depending on the state of charge (SOC) calculated by (1). Initially the battery is charged by a constant current or rather constant power (Pconst) at the change-over point (s) constant voltage charging follows. The correction factor (kL) considers the nominal capacity and the switch off of the charging power [14].
∙ (1)
In the fifth and last step, all vehicles within a cell are combined to one time resolved annual load profile.
1st E-Mobility Power System Integration Symposium | Berlin, Germany | 23 October, 2017
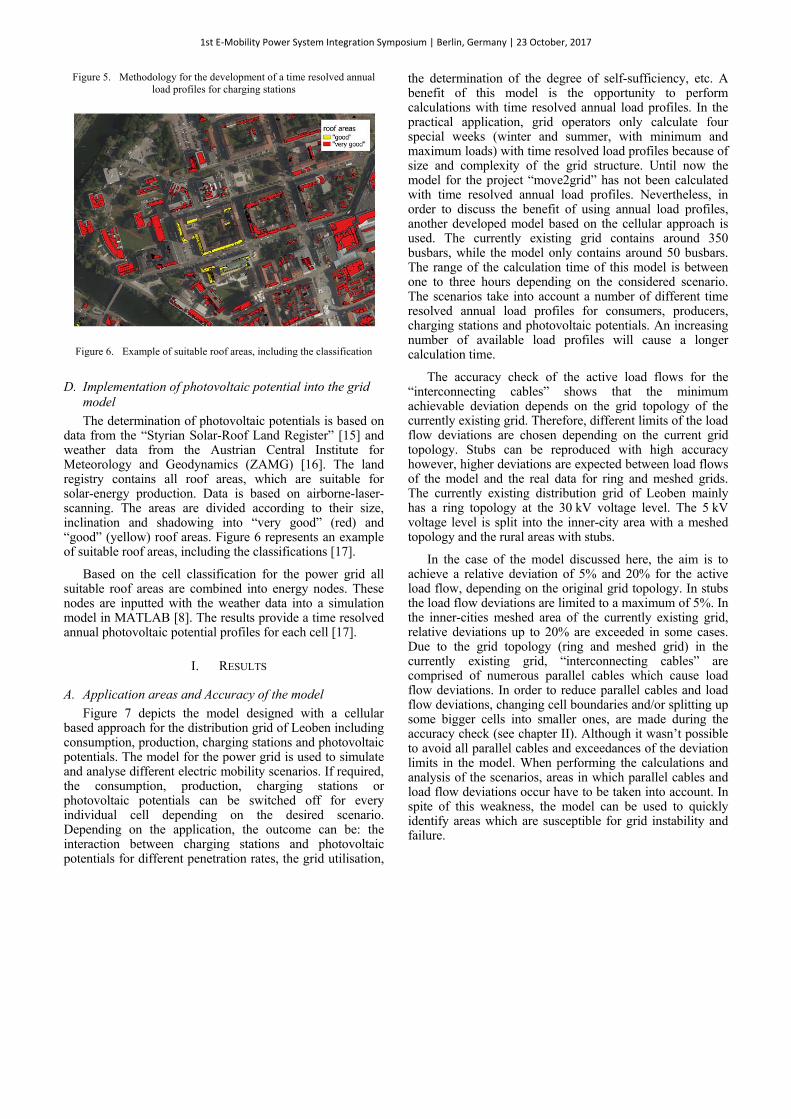
Figure 5. Methodology for the development of a time resolved annual load profiles for charging stations
Figure 6. Example of suitable roof areas, including the classification
D. Implementation of photovoltaic potential into the grid model
The determination of photovoltaic potentials is based on data from the “Styrian Solar-Roof Land Register” [15] and weather data from the Austrian Central Institute for Meteorology and Geodynamics (ZAMG) [16]. The land registry contains all roof areas, which are suitable for solar-energy production. Data is based on airborne-laser-scanning. The areas are divided according to their size, inclination and shadowing into “very good” (red) and “good” (yellow) roof areas. Figure 6 represents an example of suitable roof areas, including the classifications [17].
Based on the cell classification for the power grid all suitable roof areas are combined into energy nodes. These nodes are inputted with the weather data into a simulation model in MATLAB [8]. The results provide a time resolved annual photovoltaic potential profiles for each cell [17].
I. RESULTS
A. Application areas and Accuracy of the model
Figure 7 depicts the model designed with a cellular based approach for the distribution grid of Leoben including consumption, production, charging stations and photovoltaic potentials. The model for the power grid is used to simulate and analyse different electric mobility scenarios. If required, the consumption, production, charging stations or photovoltaic potentials can be switched off for every individual cell depending on the desired scenario. Depending on the application, the outcome can be: the interaction between charging stations and photovoltaic potentials for different penetration rates, the grid utilisation,
the determination of the degree of self-sufficiency, etc. A benefit of this model is the opportunity to perform calculations with time resolved annual load profiles. In the practical application, grid operators only calculate four special weeks (winter and summer, with minimum and maximum loads) with time resolved load profiles because of size and complexity of the grid structure. Until now the model for the project “move2grid” has not been calculated with time resolved annual load profiles. Nevertheless, in order to discuss the benefit of using annual load profiles, another developed model based on the cellular approach is used. The currently existing grid contains around 350 busbars, while the model only contains around 50 busbars. The range of the calculation time of this model is between one to three hours depending on the considered scenario. The scenarios take into account a number of different time resolved annual load profiles for consumers, producers, charging stations and photovoltaic potentials. An increasing number of available load profiles will cause a longer calculation time.
The accuracy check of the active load flows for the “interconnecting cables” shows that the minimum achievable deviation depends on the grid topology of the currently existing grid. Therefore, different limits of the load flow deviations are chosen depending on the current grid topology. Stubs can be reproduced with high accuracy however, higher deviations are expected between load flows of the model and the real data for ring and meshed grids. The currently existing distribution grid of Leoben mainly has a ring topology at the 30 kV voltage level. The 5 kV voltage level is split into the inner-city area with a meshed topology and the rural areas with stubs.
In the case of the model discussed here, the aim is to achieve a relative deviation of 5% and 20% for the active load flow, depending on the original grid topology. In stubs the load flow deviations are limited to a maximum of 5%. In the inner-cities meshed area of the currently existing grid, relative deviations up to 20% are exceeded in some cases. Due to the grid topology (ring and meshed grid) in the currently existing grid, “interconnecting cables” are comprised of numerous parallel cables which cause load flow deviations. In order to reduce parallel cables and load flow deviations, changing cell boundaries and/or splitting up some bigger cells into smaller ones, are made during the accuracy check (see chapter II). Although it wasn’t possible to avoid all parallel cables and exceedances of the deviation limits in the model. When performing the calculations and analysis of the scenarios, areas in which parallel cables and load flow deviations occur have to be taken into account. In spite of this weakness, the model can be used to quickly identify areas which are susceptible for grid instability and failure.
1st E-Mobility Power System Integration Symposium | Berlin, Germany | 23 October, 2017
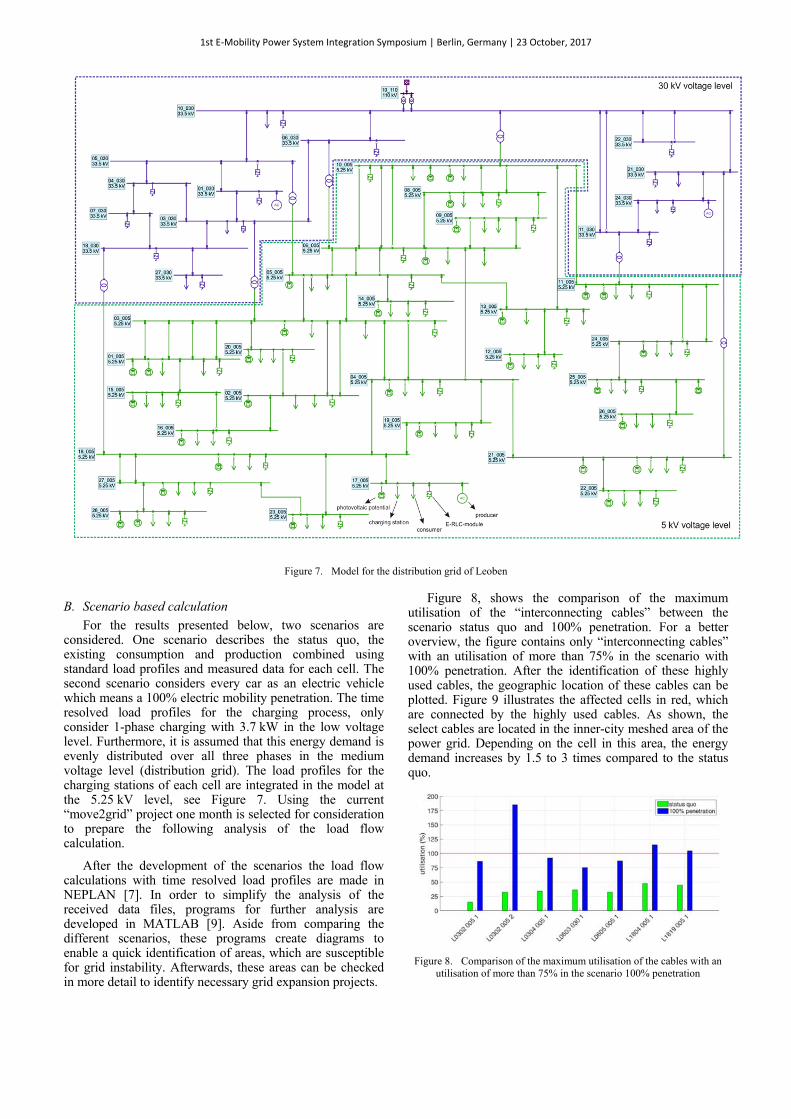
Figure 7. Model for the distribution grid of Leoben
B. Scenario based calculation
For the results presented below, two scenarios are considered. One scenario describes the status quo, the existing consumption and production combined using standard load profiles and measured data for each cell. The second scenario considers every car as an electric vehicle which means a 100% electric mobility penetration. The time resolved load profiles for the charging process, only consider 1-phase charging with 3.7 kW in the low voltage level. Furthermore, it is assumed that this energy demand is evenly distributed over all three phases in the medium voltage level (distribution grid). The load profiles for the charging stations of each cell are integrated in the model at the 5.25 kV level, see Figure 7. Using the current “move2grid” project one month is selected for consideration to prepare the following analysis of the load flow calculation.
After the development of the scenarios the load flow calculations with time resolved load profiles are made in NEPLAN [7]. In order to simplify the analysis of the received data files, programs for further analysis are developed in MATLAB [9]. Aside from comparing the different scenarios, these programs create diagrams to enable a quick identification of areas, which are susceptible for grid instability. Afterwards, these areas can be checked in more detail to identify necessary grid expansion projects.
Figure 8, shows the comparison of the maximum utilisation of the “interconnecting cables” between the scenario status quo and 100% penetration. For a better overview, the figure contains only “interconnecting cables” with an utilisation of more than 75% in the scenario with 100% penetration. After the identification of these highly used cables, the geographic location of these cables can be plotted. Figure 9 illustrates the affected cells in red, which are connected by the highly used cables. As shown, the select cables are located in the inner-city meshed area of the power grid. Depending on the cell in this area, the energy demand increases by 1.5 to 3 times compared to the status quo.
Figure 8. Comparison of the maximum utilisation of the cables with an
utilisation of more than 75% in the scenario 100% penetration
1st E-Mobility Power System Integration Symposium | Berlin, Germany | 23 October, 2017
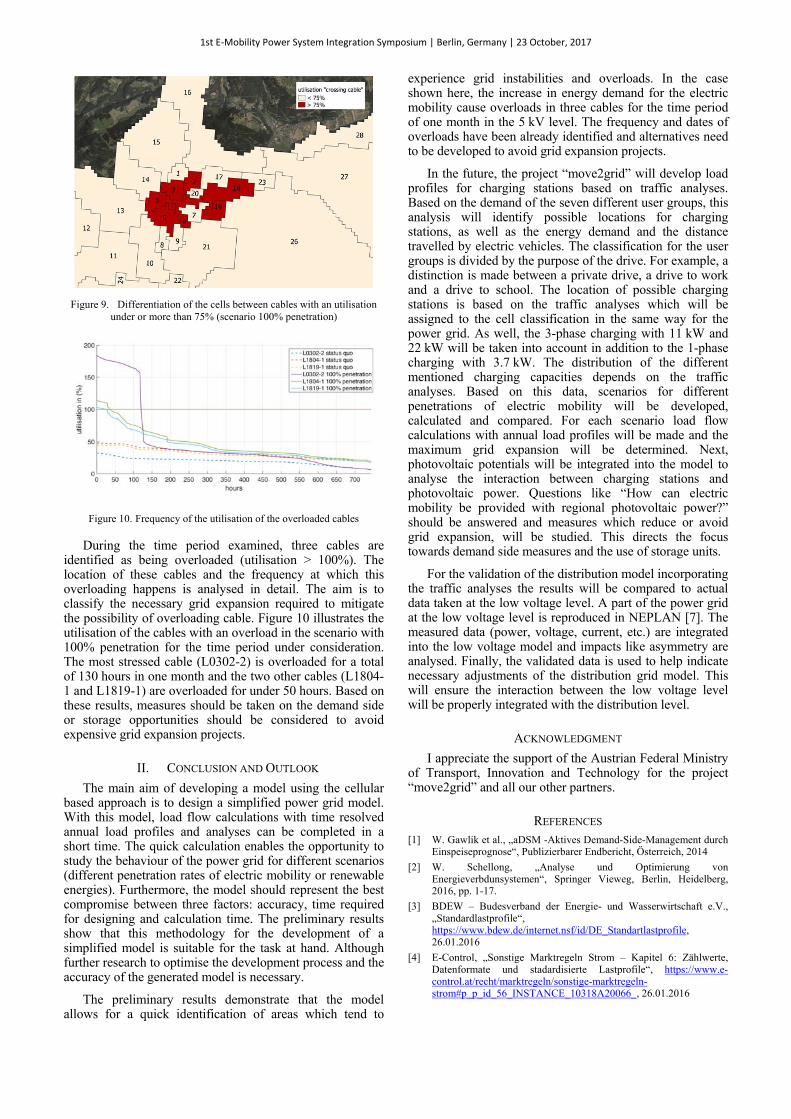
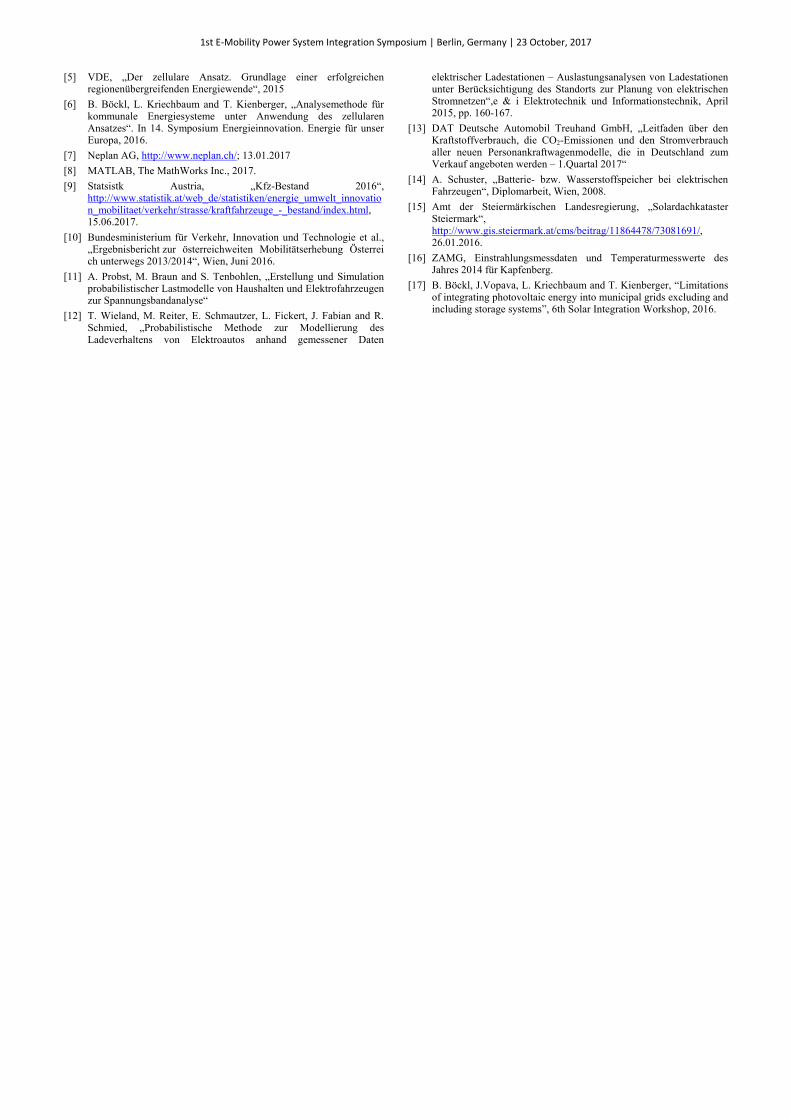
Figure 9. Differentiation of the cells between cables with an utilisation
under or more than 75% (scenario 100% penetration)
Figure 10. Frequency of the utilisation of the overloaded cables
During the time period examined, three cables are identified as being overloaded (utilisation > 100%). The location of these cables and the frequency at which this overloading happens is analysed in detail. The aim is to classify the necessary grid expansion required to mitigate the possibility of overloading cable. Figure 10 illustrates the utilisation of the cables with an overload in the scenario with 100% penetration for the time period under consideration. The most stressed cable (L0302-2) is overloaded for a total of 130 hours in one month and the two other cables (L1804-1 and L1819-1) are overloaded for under 50 hours. Based on these results, measures should be taken on the demand side or storage opportunities should be considered to avoid expensive grid expansion projects.
II. CONCLUSION AND OUTLOOK
The main aim of developing a model using the cellular based approach is to design a simplified power grid model. With this model, load flow calculations with time resolved annual load profiles and analyses can be completed in a short time. The quick calculation enables the opportunity to study the behaviour of the power grid for different scenarios (different penetration rates of electric mobility or renewable energies). Furthermore, the model should represent the best compromise between three factors: accuracy, time required for designing and calculation time. The preliminary results show that this methodology for the development of a simplified model is suitable for the task at hand. Although further research to optimise the development process and the accuracy of the generated model is necessary.
The preliminary results demonstrate that the model allows for a quick identification of areas which tend to
experience grid instabilities and overloads. In the case shown here, the increase in energy demand for the electric mobility cause overloads in three cables for the time period of one month in the 5 kV level. The frequency and dates of overloads have been already identified and alternatives need to be developed to avoid grid expansion projects.
In the future, the project “move2grid” will develop load profiles for charging stations based on traffic analyses. Based on the demand of the seven different user groups, this analysis will identify possible locations for charging stations, as well as the energy demand and the distance travelled by electric vehicles. The classification for the user groups is divided by the purpose of the drive. For example, a distinction is made between a private drive, a drive to work and a drive to school. The location of possible charging stations is based on the traffic analyses which will be assigned to the cell classification in the same way for the power grid. As well, the 3-phase charging with 11 kW and 22 kW will be taken into account in addition to the 1-phase charging with 3.7 kW. The distribution of the different mentioned charging capacities depends on the traffic analyses. Based on this data, scenarios for different penetrations of electric mobility will be developed, calculated and compared. For each scenario load flow calculations with annual load profiles will be made and the maximum grid expansion will be determined. Next, photovoltaic potentials will be integrated into the model to analyse the interaction between charging stations and photovoltaic power. Questions like “How can electric mobility be provided with regional photovoltaic power?” should be answered and measures which reduce or avoid grid expansion, will be studied. This directs the focus towards demand side measures and the use of storage units.
For the validation of the distribution model incorporating the traffic analyses the results will be compared to actual data taken at the low voltage level. A part of the power grid at the low voltage level is reproduced in NEPLAN [7]. The measured data (power, voltage, current, etc.) are integrated into the low voltage model and impacts like asymmetry are analysed. Finally, the validated data is used to help indicate necessary adjustments of the distribution grid model. This will ensure the interaction between the low voltage level will be properly integrated with the distribution level.
ACKNOWLEDGMENT
I appreciate the support of the Austrian Federal Ministry of Transport, Innovation and Technology for the project “move2grid” and all our other partners.
REFERENCES [1] W. Gawlik et al., „aDSM -Aktives Demand-Side-Management durch
Einspeiseprognose“, Publizierbarer Endbericht, Österreich, 2014
[2] W. Schellong, „Analyse und Optimierung von Energieverbdunsystemen“, Springer Vieweg, Berlin, Heidelberg, 2016, pp. 1-17.
[3] BDEW – Budesverband der Energie- und Wasserwirtschaft e.V., „Standardlastprofile“, https://www.bdew.de/internet.nsf/id/DE_Standartlastprofile, 26.01.2016
[4] E-Control, „Sonstige Marktregeln Strom – Kapitel 6: Zählwerte, Datenformate und stadardisierte Lastprofile“, https://www.e-control.at/recht/marktregeln/sonstige-marktregeln-strom#p_p_id_56_INSTANCE_10318A20066_, 26.01.2016
1st E-Mobility Power System Integration Symposium | Berlin, Germany | 23 October, 2017
[5] VDE, „Der zellulare Ansatz. Grundlage einer erfolgreichen regionenübergreifenden Energiewende“, 2015
[6] B. Böckl, L. Kriechbaum and T. Kienberger, „Analysemethode für kommunale Energiesysteme unter Anwendung des zellularen Ansatzes“. In 14. Symposium Energieinnovation. Energie für unser Europa, 2016.
[7] Neplan AG, http://www.neplan.ch/; 13.01.2017
[8] MATLAB, The MathWorks Inc., 2017.
[9] Statsistk Austria, „Kfz-Bestand 2016“, http://www.statistik.at/web_de/statistiken/energie_umwelt_innovation_mobilitaet/verkehr/strasse/kraftfahrzeuge_-_bestand/index.html, 15.06.2017.
[10] Bundesministerium für Verkehr, Innovation und Technologie et al., „Ergebnisbericht zur österreichweiten Mobilitätserhebung Österreich unterwegs 2013/2014“, Wien, Juni 2016.
[11] A. Probst, M. Braun and S. Tenbohlen, „Erstellung und Simulation probabilistischer Lastmodelle von Haushalten und Elektrofahrzeugen zur Spannungsbandanalyse“
[12] T. Wieland, M. Reiter, E. Schmautzer, L. Fickert, J. Fabian and R. Schmied, „Probabilistische Methode zur Modellierung des Ladeverhaltens von Elektroautos anhand gemessener Daten
elektrischer Ladestationen – Auslastungsanalysen von Ladestationen unter Berücksichtigung des Standorts zur Planung von elektrischen Stromnetzen“,e & i Elektrotechnik und Informationstechnik, April 2015, pp. 160-167.
[13] DAT Deutsche Automobil Treuhand GmbH, „Leitfaden über den Kraftstoffverbrauch, die CO2-Emissionen und den Stromverbrauch aller neuen Personankraftwagenmodelle, die in Deutschland zum Verkauf angeboten werden – 1.Quartal 2017“
[14] A. Schuster, „Batterie- bzw. Wasserstoffspeicher bei elektrischen Fahrzeugen“, Diplomarbeit, Wien, 2008.
[15] Amt der Steiermärkischen Landesregierung, „Solardachkataster Steiermark“, http://www.gis.steiermark.at/cms/beitrag/11864478/73081691/, 26.01.2016.
[16] ZAMG, Einstrahlungsmessdaten und Temperaturmesswerte des Jahres 2014 für Kapfenberg.
[17] B. Böckl, J.Vopava, L. Kriechbaum and T. Kienberger, “Limitations of integrating photovoltaic energy into municipal grids excluding and including storage systems”, 6th Solar Integration Workshop, 2016.
1st E-Mobility Power System Integration Symposium | Berlin, Germany | 23 October, 2017