2 0 0 7 a u s t r a l i a n n at i o n a l children’s ... · 2007 australian national...
TRANSCRIPT

Children’s Nutrition and Physical Activity Survey
2 0 0 7 a u s t r a l i a n n a t i o n a l
m a i n f i n d i n g s

2007 Australian National Children’s Nutrition and Physical Activity Survey- Main Findings ISBN: 1-74186-756-8 Online ISBN: 1-74186-757-6 Publications Number: P3 - 4592
Copyright Statements:
Paper-based publications (c) Commonwealth of Australia 2008 This work is copyright. Apart from any use as permitted under the Copyright Act 1968, no part may be reproduced by any process without prior written permission from the Commonwealth. Requests and inquiries concerning reproduction and rights should be addressed to the Commonwealth Copyright Administration, Attorney-General’s Department, Robert Garran Offices, National Circuit, Barton ACT 2600 or posted at http://www.ag.gov.au/cca
Internet sites (c) Commonwealth of Australia 2008 This work is copyright. You may download, display, print and reproduce this material in unaltered form only (retaining this notice) for your personal, non-commercial use or use within your organisation. Apart from any use as permitted under the Copyright Act 1968, all other rights are reserved. Requests and inquiries concerning reproduction and rights should be addressed to Commonwealth Copyright Administration, Attorney-General’s Department, Robert Garran Offices, National Circuit, Barton ACT 2600 or posted at http://www.ag.gov.au/cca

i
2007 australian national CHildrEn’s nutrition and PHysiCal aCtivity survEy
Prepared by Commonwealth scientific industrial research organisation (Csiro) Preventative Health national research flagship, and the university of south australia
Children’s Nutrition andPhysical Activity Survey
2 0 0 7 a u s t r a l i a n n a t i o n a l
m a i n f i n d i n g s

ii
2007 australian national CHildrEn’s nutrition and PHysiCal aCtivity survEy
forEword
it is a pleasure to present this landmark report into the eating and exercise habits of our nation’s children.
the 2007 australian national Children’s nutrition and Physical activity survey is the first survey of its kind, and has been funded jointly by government and industry, through the australian food and grocery Council. it is also the first to address both dietary intake and exercise.
the report provides important information to help governments, health professionals and the food and beverage industry to understand changes in our children’s eating and exercise habits.
Just as importantly, it provides the information needed for public and private sectors to work together to develop targeted strategies to address a range of health concerns in children. it also sets a benchmark against which to measure the impact of health strategies.
our primary producers and food processors provide australian families with a diverse range of clean, safe and nutritious food. the food industry plays a vital role in providing families with choices that encourage good life-long eating habits in children. these habits, together with regular physical activity, are essential for a healthy australia.
this report provides evidence on which the australian government can build informed policy. it will underpin the direction of the food regulatory environment to encourage innovation, allowing the food industry to respond effectively to the changing needs and expectations of consumers.
The Hon Nicola Roxon MP minister for Health and ageing
Mr Geoff Starr Chairman, australian food and grocery Council
The Hon Tony Burke MP minister for agriculture, fisheries and forestry
iii
2007 australian national CHildrEn’s nutrition and PHysiCal aCtivity survEy
tablE of ContEnts
foreword ii
Contents iii
list of tables iv
list of figures vi
abbreviations vii
acknowledgements viii
Executive summary x
main findings 1
1 Introduction 3
� Methodology 4
2.1 sample design 4
2.2 survey methodology 4
2.3 survey methodology issues 8
3 Demographic Characteristics 9
3.1 Caregivers 9
3.2 Children 10
3.3 Households 10
4 Food and Nutrients 11
4.1 food and drinks 11
4.2 nutrients 14
4.3 nutritional supplements 26
5 Physical and Sedentary Activities �7
5.1 national Physical activity guidelines 27
5.2 Pedometer steps 28
5.3 screen time 31
6 Body size and shape 35
6.1 body mass index 35
6.2 waist girth 36
6.3 Height and weight 37
7 Linking nutrition, activity, and body size 39
8 Conclusion 4�
9 References 43

iv
2007 australian national CHildrEn’s nutrition and PHysiCal aCtivity survEy
Table 1: demographic characteristics of Children’s survey caregivers (unweighted data), 2007 9
Table �: demographic characteristics of Children’s survey children (unweighted data), 2007 10
Table 3: incomes of households in Children’s survey (unweighted data), 2007 10
Table 4: mean daily consumption (g) of major food groups1, Children’s survey, 2007 12
Table 5: Proportion (%) of total dietary energy intake (including energy from fermentable fibre) obtained from major food groups1, Children’s survey, 2007 13
Table 6: median intake of energy (kJ, including energy from fermentable fibre) compared with estimated energy requirements (EEr), and proportions outside the upper and lower bounds of EEr by age and gender, Children’s survey, 2007 15
Table 7: mean intake1 of macronutrients and total moisture/fluid by age group and gender, Children’s survey, 2007 16
Table 8: mean percentage contribution of macronutrients to energy intake, by age group and gender, Children’s survey, 20071,2 17
Table 9: mean intake1 of micronutrients and caffeine by age group and gender, Children’s survey 2007 19
Table 10: Proportion (%) of children meeting estimated average requirements (Ear) for selected nutrients using estimate of usual nutrient intakes derived from 2 days of intake data collected by 24-hour recall at both CaPi and follow-up Cati, Children’s survey, 2007 21
Table 11: methodology to compare intakes with the dietary guidelines for Children and adolescents 23
Table 1�: Proportion (%) of children meeting the serve recommendations of the Australian Guide to Healthy Eating based on the dietary guidelines1,2 25
Table 13: Percentage of children1 who consumed at least one supplement on the day of the interview, by age group and gender, Children’s survey, 2007 26
Table 14: Proportion (%) of children1 who met the physical activity guidelines using four different methods of interpreting the guidelines, Children’s survey, 2007 28
Table 15: mean number of steps taken per day by boys and girls aged 5–8, 9–13 and 14–16 years, and the percentage reaching or exceeding recommended thresholds 28
Table 16: Physical activity level (Pal, in multiples of resting metabolic rate, or mEts), moderate to vigorous physical activity (mvPa) and vigorous physical activity (vPa) on school days, weekends in school time, and on holidays. values are shown as means. 29
list of tablEs

v
2007 australian national CHildrEn’s nutrition and PHysiCal aCtivity survEy
Table 17: mean for Pal (mEts) and the mean time children spent participating in moderate to vigorous activity (mvPa minutes per day)1 29
Table 18: Proportion (%) of children who met the screen time guidelines using four different methods of interpreting the guidelines, Children’s survey, 2007 31
Table 19: mean number of minutes engaged in screen time, television viewing, video game playing and computer use by age group and gender, Children’s survey, 20071 32
Table �0: mean number of minutes engaged in screen time, television viewing, video game playing and computer use on school days, weekends in school time, and on holidays, Children’s survey, 2007 33
Table �1: Proportion (%) of children classified as underweight, normal weight, overweight and obese by age and gender, Children’s survey, 20071 35
Table ��: mean waist girths (cm) and proportion (%) of children with waist girths >50% of height by age and gender, Children’s survey, 20071 36
Table �3: mean height (cm) by age and gender1, Children’s survey, 2007 37
Table �4: mean weight (kg) by age and gender1, Children’s survey, 2007 38
Table �5: mean Pal for underweight, normal weight, overweight and obese boys and girls aged 9–13 years and 14–16 years1,2, Children’s survey, 2007 39
Table �6: Energy intake (total kJ, including energy from fermentable fibre) by physical activity level (Pal) for children aged 9–16 years,1 Children’s survey, 2007 40
Table �7: mean energy intake (total kJ, including energy from fermentable fibre) by weight status1 for all children2 in the Children’s survey, 2007 41

vi
2007 australian national CHildrEn’s nutrition and PHysiCal aCtivity survEy
Figure 1: mean one-day energy intake (including energy from fermentable fibre) of boys and girls, Children’s survey, 2007 14
Figure �: the percentage of boys and girls who were engaged in mvPa across the course of the day on school days and non-school days 29
Figure 3: age – and gender-related patterns in mvPa and some of its components [free play, sport, and active transport (at)] 30
Figure 4: age – and gender-related patterns in screen time and its components (television, computers and video games) 32
Figure 5: the percentage of boys and girls who are engaged in screen time across the course of the day on school days and non-school days 34
list of figurEs

vii
2007 australian national CHildrEn’s nutrition and PHysiCal aCtivity survEy
ACMA australian Communication and media authority
AGHE australian guide to Healthy Eating
AI adequate intake
ABS australian bureau of statistics
BMI body mass index
BMR basal metabolic rate
CAPI Computer assisted Personal interview
CATI Computer assisted telephone interview
CSIRO Commonwealth scientific and industrial research organisation
DCITA department of Communications, information technology and the arts
DoHA department of Health and ageing
EAR Estimated average requirement
EER Estimated Energy requirement
EI Energy intake
FSANZ food standards australia and new Zealand
g grams
ISAK international society for the advancement of Kinanthropometry
kJ kilojoules
MARCA multimedia activity recall for Children and adolescents
mg milligrams
MVPA moderate to vigorous Physical activity
NRVs nutrient reference values
NHMRC national Health and medical research Council
PAL Physical activity level
RDD random digit dialling
RDI recommended dietary intake
RE retinol Equivalents
SD standard deviation
μg micrograms
VPA vigorous Physical activity
abbrEviations
viii
2007 australian national CHildrEn’s nutrition and PHysiCal aCtivity survEy
CSIRO PREVENTATIVE HEALTH NATIONAL RESEARCH FLAGSHIP
Professor lynne Cobiac (moved to flinders university at the beginning of 2007) bsc, Phd, mba (adv), Post grad dip nut diet
dr Jane bowen, bsc, bnut&diet (Hons), Phd
ms Jill burnett, bsc, dip nut & diet, dipEd
ms Julie syrette, bsc
mr James dempsey, binftech(Eng)
mr shane bailie, dip it (software dev)
dr Carlene wilson, ba (Hons) Phd mba maPs
ms ingrid flight, ba, mPH
mr norm good, dip it
Prof ian saunders, ba (Hons) dipmathstats Phd
UNIVERSITy OF SOUTH AUSTRALIA
Professor timothy olds, ba(Hon), bspsc(dist), Phd(syd), Phd(unsw)
dr James dollman, bs, msc, dipEd, Phd
mr tim Kupke, bappsc, bHlthsc (Hons)
I–VIEw PTy LTD
ms Kylie brosnan, bbus, dip mrsa
mr daniel Pole, ba
ms mary Plumridge
acknowledgement is given to dr michelle miller and ms alison yaxley of flinders university for analyses of food and nutrient intakes.
STEERING GROUP
Members:
ms Jenny bryant, first assistant secretary, Population Health division, department of Health and ageing
mr andrew stuart, former first assistant secretary, Population Health division, department of Health and ageing
ms margaret lyons, former first assistant secretary, Population Health division, department of Health and ageing
mr richard souness, general manager, food Policy and safety branch, department of agriculture, fisheries and forestry
mr dick wells, Chief Executive officer, australian food and grocery Council
aCKnowlEdgEmEnts
The project team implemented all aspects of the �007 Australian National Children’s Nutrition and Physical Activity Survey. The members of the project team were:

ix
2007 australian national CHildrEn’s nutrition and PHysiCal aCtivity survEy
Associate members of the Steering Group were:
ms Jennifer mcdonald, former assistant secretary, Population Health division, department of Health and ageing
ms Cath Peachey, acting assistant secretary, Population Health division, department of Health and ageing
dr geoffrey annison, australian food and grocery Council
dr david roberts, australian food and grocery Council
steering group Project officer: ms Caroline arthur, acting director nutrition section, department of Health and ageing.
FOOD COMPOSITION TEAM
FSANZ:
ms Janis baines, ba (Hons, Chemistry), msc (Human nutrition), section manager, food composition, Evaluation and modelling section, fsanZ
dr Judy Cunningham, bsc (food tech), Phd food Composition studies
ms renee sobolewski, bappsc (Human nutrition)
mr Charles wannop, database support, it Contractor millpost technologies Pty ltd
THE TECHNICAL REFERENCE GROUP
Professor a. stewart truswell, ao, md, dsC, frCP, fraCP, fPHn, Emeritus Professor of Human nutrition, university of sydney
Professor Katrine baghurst, bsc, Phd, adjunct Professor, department of medicine, university of adelaide
Professor Jennie brand-miller, bsc (Hons), (food tech), Phd, faifst, fnsa, Professor of Human nutrition, university of sydney
ms ingrid Coles-rutishauser, bsc (nutrition), msc (Epidemiology), rPHnutr, Coles and rutishauser Consultants
Professor wendy brown, bsc (Hons), graddip Phys Ed, msc, Phd, fasmf, Professor of Physical activity and Health, school of Human movement studies, university of Queensland
Professor robert newton, bHms (Hons), mHms, Phd, aEP, CsCsd, faaEss, foundation Professor, Exercise and sport science, Edith Cowan university
Professor martin silink, am, mb, bsc (Hons), md, fraCP, Professor of Paediatric Endocrinology, university of sydney
dr ann Cowling, Phd
ms Janis baines, ba (Hons, Chemistry), msc (Human nutrition), section manager, food composition, Evaluation and modelling section, fsanZ
dr amanda lee, manager nutrition and Physical activity, Health Promotion unit, Queensland Health
THERAPEUTIC GOODS ADMINISTRATION
mr shaun flor Elf technical manager, listed medicines and Communication section, office of Complementary medicines, tga

x
2007 australian national CHildrEn’s nutrition and PHysiCal aCtivity survEy
overview
The �007 Australian National Children’s Nutrition and Physical Activity Survey (Children’s Survey) was commissioned by the Department of Health and Ageing, the Department of Agriculture, Fisheries and Forestry, and the Australian Food and Grocery Council.
the objective of the Children’s survey was to assess food and nutrient intake, physical activity participation and to measure weight, height and waist circumference in a sample of children aged 2–16 years randomly selected from across australia. data were collected on two occasions from 4,487 participants or their caregivers from february to august 2007. a computer assisted personal interview (CaPi) was conducted in the child’s home and this was followed 7–21 days later by a computer assisted telephone interview (Cati).
Children were categorised into four age groups, 2–3 years, 4–8 years, 9–13 years and 14–16 years to align with the age bands in Nutrient Reference Values for Australia and New Zealand. this allowed for comparison against the dietary level recommendations listed in the publication, including Estimated Energy requirement (EEr), Estimated average requirement (Ear) and adequate intake (ai) where applicable for energy, macronutrients, water, vitamins and minerals.
the Children’s survey is the first national survey to undertake measurements of food and activity patterns in the same group of people and will provide the opportunity to explore interactions between these factors.
ExECutivE summary
1
2007 australian national CHildrEn’s nutrition and PHysiCal aCtivity survEy
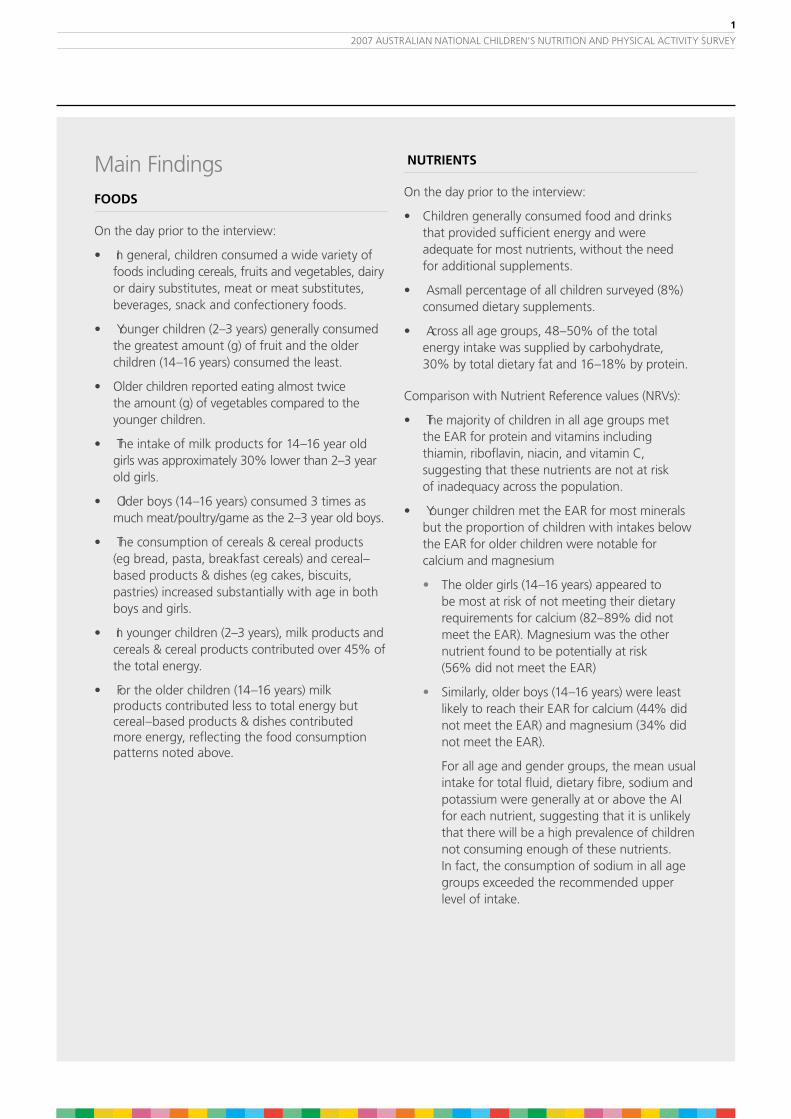
main findingsFOODS
on the day prior to the interview:
• in general, children consumed a wide variety of foods including cereals, fruits and vegetables, dairy or dairy substitutes, meat or meat substitutes, beverages, snack and confectionery foods.
• younger children (2–3 years) generally consumed the greatest amount (g) of fruit and the older children (14–16 years) consumed the least.
• older children reported eating almost twice the amount (g) of vegetables compared to the younger children.
• the intake of milk products for 14–16 year old girls was approximately 30% lower than 2–3 year old girls.
• older boys (14–16 years) consumed 3 times as much meat/poultry/game as the 2–3 year old boys.
• the consumption of cereals & cereal products (eg bread, pasta, breakfast cereals) and cereal–based products & dishes (eg cakes, biscuits, pastries) increased substantially with age in both boys and girls.
• in younger children (2–3 years), milk products and cereals & cereal products contributed over 45% of the total energy.
• for the older children (14–16 years) milk products contributed less to total energy but cereal–based products & dishes contributed more energy, reflecting the food consumption patterns noted above.
NUTRIENTS
on the day prior to the interview:
• Children generally consumed food and drinks that provided sufficient energy and were adequate for most nutrients, without the need for additional supplements.
• a small percentage of all children surveyed (8%) consumed dietary supplements.
• across all age groups, 48–50% of the total energy intake was supplied by carbohydrate, 30% by total dietary fat and 16–18% by protein.
Comparison with nutrient reference values (nrvs):
• the majority of children in all age groups met the Ear for protein and vitamins including thiamin, riboflavin, niacin, and vitamin C, suggesting that these nutrients are not at risk of inadequacy across the population.
• younger children met the Ear for most minerals but the proportion of children with intakes below the Ear for older children were notable for calcium and magnesium
• the older girls (14–16 years) appeared to be most at risk of not meeting their dietary requirements for calcium (82–89% did not meet the Ear). magnesium was the other nutrient found to be potentially at risk (56% did not meet the Ear)
• similarly, older boys (14–16 years) were least likely to reach their Ear for calcium (44% did not meet the Ear) and magnesium (34% did not meet the Ear).
for all age and gender groups, the mean usual intake for total fluid, dietary fibre, sodium and potassium were generally at or above the ai for each nutrient, suggesting that it is unlikely that there will be a high prevalence of children not consuming enough of these nutrients. in fact, the consumption of sodium in all age groups exceeded the recommended upper level of intake.

�
2007 australian national CHildrEn’s nutrition and PHysiCal aCtivity survEy
DIETARy PRACTICES & GUIDELINES
• the majority (90%) of children were breastfed for a period during their infancy.
• non-observance was greatest for dietary guidelines relating to vegetables, saturated fat and sugar for all age groups as well as fruit and dairy intake for those 9 years and over.
PHySICAL ACTIVITy
• the majority of children aged 9–16 years met the guidelines for moderate to vigorous physical activity. on any given day, there was a 69% chance that any given child would get at least 60 minutes of moderate to vigorous physical activity.
• on average, children aged 5–16 years took approximately 11,800 steps per day.
• few children aged 9–16 years met the guidelines for electronic media use. on any given day, there was only a 33% chance that any given child would not exceed 120 minutes of screen time.
• adolescent girls achieved lower levels of physical activity than boys and fewer girls aged 14–16 years complied with the physical activity guidelines than boys.
HEIGHT AND wEIGHT
• the majority of children (72%) were found to be a healthy weight for their height. of the remaining, 5% were underweight, 17% overweight and 6% obese.
LINKING NUTRITION, ACTIVITy AND BODy SIZE
• underweight and obese children tended to have a lower physical activity level (Pal) than children of normal weight.
• obese children tended to report lower energy intakes than children of normal weight.
• there was found to be no clear association between reported energy intake and level of physical activity.

3
2007 australian national CHildrEn’s nutrition and PHysiCal aCtivity survEy
The �007 Australian National Children’s Nutrition and Physical Activity Survey (Children’s Survey) was commissioned by the Department of Health and Ageing, the Department of Agriculture, Fisheries and Forestry, and the Australian Food and Grocery Council.
the Commonwealth scientific and industrial research organisation (Csiro) Preventative Health national research flagship and the university of south australia conducted the survey with i-view Pty ltd undertaking the survey fieldwork. the project team acknowledges the contribution of flinders university towards analysis of the dietary data.
Prior to this survey the last national nutrition and physical activity surveys were conducted in 1995 (australian bureau of statistics 1998) and 1985 (department of Community services and Health 1988, 1989), respectively. the intervening years have seen significant changes in the australian food supply and eating habits, an increasing use of technologies that facilitate sedentary behaviour such as video games and the internet; along with a changing family life and structure. all of these factors are likely to impact on what children eat, what physical activity they are involved in, and their bodyweight. the Children’s survey was undertaken in recognition of the need to have national data on children’s weight status, dietary intake and activity levels for monitoring purposes. this information is also important for assessing the nutritional adequacy and the physical activity participation of the children surveyed.
the Children’s survey measured dietary intakes of food and beverages, use of supplements during the previous 24 hours, selected food habits, height, weight and bmi, waist circumference, time spent in physical activity and sedentary activity (screen time), number of steps taken daily and demographic characteristics. these data were gathered on children aged 2–16 years (n = 4,487) between 22 february 2007 and 30 august 2007.
the south australian department of Health contributed towards a booster sample (n = 400) of south australian children. Ethics approval was obtained from the nHmrC registered Ethics Committees of Csiro and university of south australia.
Households with children were randomly selected using random digit dialling (rdd) from all australian states and territories in metropolitan, rural and remote areas. the number of children included from each state was proportional to the population of children in that state or territory. the data were collected at a face-to-face home visit (computer-assisted personal interview, CaPi) and a subsequent telephone interview (computer-assisted telephone interview, Cati) conducted 7–21 days after the CaPi.
food, beverage and supplement intakes were collected for all participants using a standardised, computer-based, 24-hour recall methodology during the CaPi and the Cati. a 24 hour recall involves children recollecting all food, beverages and supplements consumed in the previous 24 hours from midnight to midnight. in collaboration with food standards australia new Zealand (fsanZ), the food and beverage intake data were translated to daily nutrient intake data using the most recent australian nutrient composition database (ausnut 2007). food habit questions were asked of each child and/or carer during the CaPi in relation to usual consumption of fruits, vegetables, type of milk, use of salt and earlier infant feeding practices.
Physical activity was measured in two ways. use of time was measured in children aged 9–16 years using a validated computerised 24-hour recall during the CaPi and the Cati. Children recalled a total of four days. Pedometers were also used to measure the average number of steps taken daily over 6 days by children aged 5–16 years. weight, height and waist circumference were measured for all participants during the CaPi.
1. introduCtion

4
2007 australian national CHildrEn’s nutrition and PHysiCal aCtivity survEy
2.1 sample design the survey sample was randomly selected firstly by postcode (stratified by state/territory and capital city/rest of state), and secondly by households within selected postcodes using random digit dialling (rdd) of telephone numbers. this survey was not designed to collect information on representative samples of children living in remote areas or on those children of indigenous origin. Consequently, postcodes corresponding to these areas were excluded from the initial sampling frame.
Eligible households with children aged 2–16 years were identified and asked to participate in the survey. one child from each selected household was the designated “study child”.
there was an agreed quota of 1,000 children (50% boys and 50% girls) for the following age groups: 2–3 years, 4–8 years, 9–13 years and 14–16 years. the base national sample in south australia was supplemented by 400 to allow more detailed estimates for that state. a total of 4,487 children completed the entire survey. the sampling, selection and recruitment methodology are comprehensively reported in the user guide and should be considered when interpreting data.
2.2 survey methodologythe sampling methodology was adopted to provide at least 500 boys and 500 girls from across australia in each of the age and gender groups covered by the nutrient reference values (nrvs) to allow sufficient numbers to make statistical comparisons of intakes with recommendations.
the south australian department of Health contributed towards a booster sample (n = 400) for south australian children.
the data were collected at a face-to-face interview in the participant’s home (CaPi) and a subsequent telephone interview (Cati) conducted 7–21 days after the CaPi. food intake and activity levels can vary markedly over different types of days eg weekdays vs weekend days and school vs non-school days. in order to capture intakes and activity patterns that would represent all types of days, the CaPi and the Cati were collected on different day types when feasible. attempts were made to collect information on school and non-school days (including holidays) in proportion to the number of such days that occurred over the sampling period. for more information see the user guide.
FOOD AND NUTRIENTS
food, beverage and supplement intakes were collected for all participants using a standardised, computer-based, three-pass 24-hour recall methodology during the CaPi and the Cati. further details are available in the user guide.
all interviewers were trained in conducting 24-hour recalls. to assist with estimating the amounts of foods and beverages consumed, standard measuring cups and spoons were provided, along with a food model booklet that had life-size diagrams and drawings depicting different serving sizes of foods and different sized food containers to assist the participants and the interviewers in the dietary recall. dietitians checked all of the 24-hour recalls for their content and whether or not they appeared a reasonable consumption pattern. any unusual intakes were queried and modified if appropriate.
2. mEtHodology

5
2007 australian national CHildrEn’s nutrition and PHysiCal aCtivity survEy
in collaboration with fsanZ, a food coding system was developed to reflect the current food supply but also to maintain comparability with the food groups used in the 1995 national nutrition survey (abs 1998). additional food groups were added for infant foods and formulae and dietary supplements. in addition the food, beverage and supplement intake data were translated to daily nutrient intake data using the most recent australian nutrient composition database. the user guide provides more detailed information on this process.
nutrient intake data estimated in the Children’s survey include: energy, total carbohydrates, starch, sugars, dietary fibre, protein, total fat, saturated fat, monounsaturated fat, polyunsaturated fat, alpha-linolenic acid, linoleic acid, long chain omega-3 fatty acids, cholesterol, alcohol, total vitamin a, pre-formed and provitamin a, thiamin, riboflavin, total niacin equivalents, preformed niacin, vitamin C, d, E, total folate, dietary folate equivalents, potassium, sodium, phosphorus, calcium, magnesium, iron, zinc, iodine and caffeine. the intakes of the following nutrients are not included in this main findings report: alpha-linolenic and linoleic acid, long chain omega-3 fatty acids, cholesterol, pre-formed and provitamin a, or preformed niacin. time and place of consumption of foods and drinks were also recorded and will be reported separately.
nutrient data derived from supplements are excluded from the analyses for this main findings report as the initial focus is to determine the nutrients provided to children by consumption of food and beverages alone. later analyses are likely to include total nutrients from supplements as well as foods, and beverages.
COMPARISON wITH FOOD GUIDELINES AND DIETARy RECOMMENDATIONS
reported mean food and nutrient intakes are based on the CaPi data only (i.e. one day of data, table 4, table 5, table 7, table 8, table 9). However, when comparing food and nutrition intake with recommendations or guidelines, an estimate of usual intake is needed and in which case both the CaPi and Cati dietary intake data were used (table 6, table 10, table 12). the software package, C-sidE, v 1.0, iowa state university, suitable for estimating intake distribution was used for this purpose. details of the analyses are provided in the user guide.
to estimate the prevalence of potentially inadequate nutrient intakes in population groups the usual nutrient intakes of children can be compared with recommended nutrient intakes established by nHmrC (nHmrC 2006). these are only estimates of potential dietary intake inadequacy as individual requirements for each nutrient can be quite variable and this report has not included nutrients provided by dietary supplements. to definitively determine whether children are consuming sufficient amounts of nutrients to meet their own individual and specific requirements would require measures of nutrient status such as blood or serum biochemical tests, which is beyond the scope of this survey.
the Estimated average requirement (Ear) is the daily nutrient intake level estimated to meet the needs of half of the children in their particular life stage and gender group. the percentage of children whose usual nutrient intakes are less than the Ear provides an estimate of the prevalence of potential intake inadequacy in each age and gender group. if there is a large percentage of children with usual intakes below the Ear for a particular nutrient, it is indicative that a number of children may not be consuming sufficient amounts of that nutrient to meet their requirements, but as noted above it is not definitive.
when setting the nrvs, Ears could not be determined for all nutrients due to limited scientific evidence being available. adequate intakes (ais) were established instead, often but not always, based on the median intake reported in the 1995 national nutrition survey and assuming that they had a sufficient intake. an ai is defined as the average daily nutrient intake level based on observed or experimentally-determined approximations of estimates of nutrient intake by a group (or groups) of apparently healthy people that are assumed to be adequate. Comparisons of the nutrient intakes of the Children’s survey participants with ais cannot be used to determine the prevalence of potential nutrient intake inadequacy. unlike the Ear, the proportion of children having intakes less than the ai, does not estimate the prevalence of potentially inadequate intakes. However, if the mean usual intake of children for a nutrient is at or above the ai, or if more than 50% of children have usual intakes at or greater than the ai, it implies a low prevalence of inadequate intakes.

6
2007 australian national CHildrEn’s nutrition and PHysiCal aCtivity survEy
for more information on the nrvs and specific micro-and macronutrients see:Ê www.nhmrc.gov.au/publications/
synopses/n35syn.htm
the Dietary Guidelines for Children and Adolescents in Australia (nHmrC 2003) and the Australian Guide to Healthy Eating (smith et al 1998) provide some specific food and nutrition recommendations. the dietary intakes from the Children’s survey were compared against a combination of food and nutrient guidelines or recommended intakes.
for some foods, in order to make comparisons with guidelines, the number of serves of foods consumed by children were calculated using firstly the food sub-groups and secondly the serving sizes outlined in the Australian Guide to Healthy Eating (smith et al 1998). where a number of serves of foods has been calculated for this report, such data should be considered as indicative only as some foods may have been inadvertently missed and a more detailed analysis is warranted. However, the major types of foods will have been included and so should provide a reasonable estimate at the population level.
FOOD HABITS AND OTHER qUESTIONS
food habit questions were asked of each child and/or caregiver during the CaPi in relation to their usual consumption of fruits, vegetables, type of milk, use of salt and iodised salt and earlier infant feeding practices. the only data from these questions presented in this main findings report are whether or not the survey participants had ever been breast fed. Encouraging mothers to breastfeed is one of the Dietary Guidelines for Children and Adolescents in Australia (nHmrC 2003). data from the remaining questions will be presented separately.
PHySICAL ACTIVITy
Physical activity was measured in two ways. use of time was measured in children aged 9–16 years with a previously validated computerised 24-hour recall using the multimedia activity recall for Children and adolescents (marCa) (ridley et al 2006). Each child recalled four days (48 hours) worth of activity, two days prior to the CaPi and two days prior to the Cati. Children reported everything they did in the previous 48 hours in time-slices as fine as 5 minutes. Each activity reported was linked to an energy cost (ridley & olds 2008).
total energy expenditure was calculated based on reported activities. this is expressed as a physical activity level (Pal) which is a multiple of resting metabolic rate, or the amount of energy a child would expend if he or she was to sit still all day.
in order to determine the overall daily activity patterns of children, it is necessary to take into account both physically active and sedentary behaviours.
activity data collected as part of the Children’s survey include each child’s Pal and the number of minutes per day spent in the following categories: moderate to vigorous physical activity (mvPa), vigorous activity level, organised sport and play, free play, active transport, out of school hours screen time, total screen time, television, video games, computer use, passive transport, non–screen sedentary behaviour and sleep. the number of minutes spent in these activities was calculated for each child on each of the four sampled days. the average daily number of minutes children spent in mvPa and average screen time are included in this report. mvPa is usually defined as any activity which requires at least three times as much energy as the child uses when sitting quietly. in practice, this amounts to anything at or above a brisk walk. screen time refers to the amount of time children spent watching television including videos and digital versatile discs (dvds), playing computer games on games consoles or on personal computers, and using computers for other purposes.
Children aged 5–16 years wore a pedometer (new lifestyles (nl) 1000), a device which counts steps, for up to seven consecutive days. this is considered to be a more objective measure of physical activity. Children who recorded at least six days of measurements and had the pedometer off for no more than four hours during waking hours on any day (for example, for bathing or contact sports) were included in the analysis. the average number of steps completed in the six- or seven-day period was calculated for each child.
COMPARISON wITH NATIONAL PHySICAL ACTIVITy GUIDELINES
the average amount of time the children spent in some of the physical and sedentary activities were compared to the department of Health and ageing’s National Physical Activity Guidelines for children and adolescents (doHa 2004a, doHa 2004b) which also include some guidelines for the maximum amount of entertainment screen time recommended.

7
2007 australian national CHildrEn’s nutrition and PHysiCal aCtivity survEy
Currently there are no national guidelines for children regarding the recommended number of steps to be taken daily. Comparisons have been made in this report using published criteria.
Anthropometry
weight, height and waist circumference were measured for all participants during the CaPi. more information on the instruments used can be found in the user guide.
body mass index (bmi, weight in kilograms divided by the square of height in metres) is the most commonly used index of weight for height in children. it has been widely used as an estimate of fatness.
weight status
Children are categorised into weight classes (underweight, normal weight, overweight and obese) according to international standards of age- and sex-specific bmi cut-offs (Cole et al. 2007). these cut-offs, which are based on combined international datasets, are designed to correspond to adult values of 25 kg.m–2 (for overweight) and 30 kg.m–2 (for obesity). the percentage of children falling into each weight class was calculated.
there are no generally agreed cut-offs for waist girth, but it has been suggested that abdominal fatness is excessive in school-aged children when the ratio of waist girth to height exceeds 50% (ashwell 2005).
Demographics
demographic information about the households of the participants included in the Children’s survey was collected at the CaPi, including information about the children and the parents or up to two caregivers. the general term caregiver is used in this report to denote adults who are present in the household and who take responsibility for the study child. data on where the caregivers and children were born, whether they were of indigenous origin, whether or not another language was spoken at home, the number of caregivers in the households and the household annual incomes are presented in table 1, table 2, and table 3.
Population weights
the survey was conducted on 4,487 children and weights were applied to each individual’s response to more closely reflect the whole australian child population. Population weights were added as appropriate for stratified sampling with non-proportional sampling used in recruitment. weights for age, gender and region (state/territory and Capital city/rest of state) were used. refer to the user guide for additional information.
Population weights were applied to all of the results tables for nutrients and to all of the activity and anthropometric data.
Population weights were not applied to table 1, table 2, and table 3. these 3 tables provide an indication of how the characteristics of the households who were actually surveyed compare to the characteristics of the australian population provided in the latest australian bureau of statistics Census data (abs website). Population weights also were not applied to those tables when analyses were performed on a subset of the total sample, n = 368. refer to the user guide for more information.
VALID SELF-REPORTS
the determination of the ratio of energy intake (Ei) to basal metabolic rate (bmr) (Ei:bmr) helps to identify dietary recalls which are potentially of poor validity or, as this is more usually described, to determine the number of potential under-reporters.
a very low Ei to bmr ratio can theoretically be used to exclude participants from the Children’s survey on the basis that such low intakes could be due to under-reporting, not being representative of usual intakes and /or not being sustainable over the long term.
Cut-off limits have been established to identify implausibly low intakes. the goldberg cut-off Ei/bmr of 0.87 (abs 1998, goldberg et al 1991) using an estimated Pal 1.55 was used for all age groups. this calculation revealed that less than 2% of the younger children (2–8 years) appeared to have potentially invalid self-reports of dietary intakes. Parents assisted children with their dietary recalls at this age. in the older age groups, 5–6% of children aged between 9–13 years and 8%–16 % of the older children (14–16 years) had potentially implausibly low intakes respectively.

8
2007 australian national CHildrEn’s nutrition and PHysiCal aCtivity survEy
Equally, participants may over-report both their food intake and their physical activity but there has been no attempt to identify potential over-reporters. for this main findings report, no dietary intakes were excluded on the basis of their Ei:bmr ratio. including reported intakes from children who appear to have implausibly low energy intake or who have provided records of poor validity, can lead to an overestimate of the proportion in the population with nutritionally inadequate intakes (mackerras & rutishauser 2005). additional analyses needs to be undertaken in the future to determine the impact of these potentially implausibly low intakes on the estimates of possible inadequate nutritional intakes.
2.3 survey methodology issuesthe rdd method is a time and cost effective approach to recruitment and has been previously used to generate survey samples for population health studies. However, when this method is combined with a quota system three important methodological issues should be considered.
firstly, rdd with a quota affects the probability of selection of children. one child per eligible household was randomly selected to take part in this survey. it is desirable to have each child in the total sample frame have an equal chance of selection in the sample drawn. However, with rdd and household sampling, children who are the only child or who have fewer siblings aged 2–16 years have more chance of selection than children living with a larger number of siblings aged 2–16 years. furthermore, the application of the pre-determined age quotas (1,000 for each age group, ie 2–3 years, 4–8 years, 9–13 years and 14–16 years) were disproportionate to the population across each of these age groups. Consequently, children aged 2–3 years and 14–16 years had a higher chance of selection, compared to those aged 4–8 years or 9–13 years.
secondly, it was not possible to gather demographic information on those who refused to participate and those who were excluded because of the quota system. this information is needed to estimate any potential non-response bias. it is not possible to demonstrate non-response bias in this survey.
thirdly, to obtain a representative sample of the population, the rdd method relies on accessing current telephone number information and should have as complete coverage as possible.
it is estimated that at least 95% of australian households have a land line (abs 2003), with some households choosing to replace a land line connection with a mobile phone (aCma 2008). Portability of telephone numbers as people move across geographic locations can result in recruitment outside the selected postcodes. an advantage of rdd is that silent, unlisted and recently listed numbers can be included by chance.
data were collected between february and august 2007, resulting in limited information on variance of intakes with changing seasons.
9
2007 australian national CHildrEn’s nutrition and PHysiCal aCtivity survEy
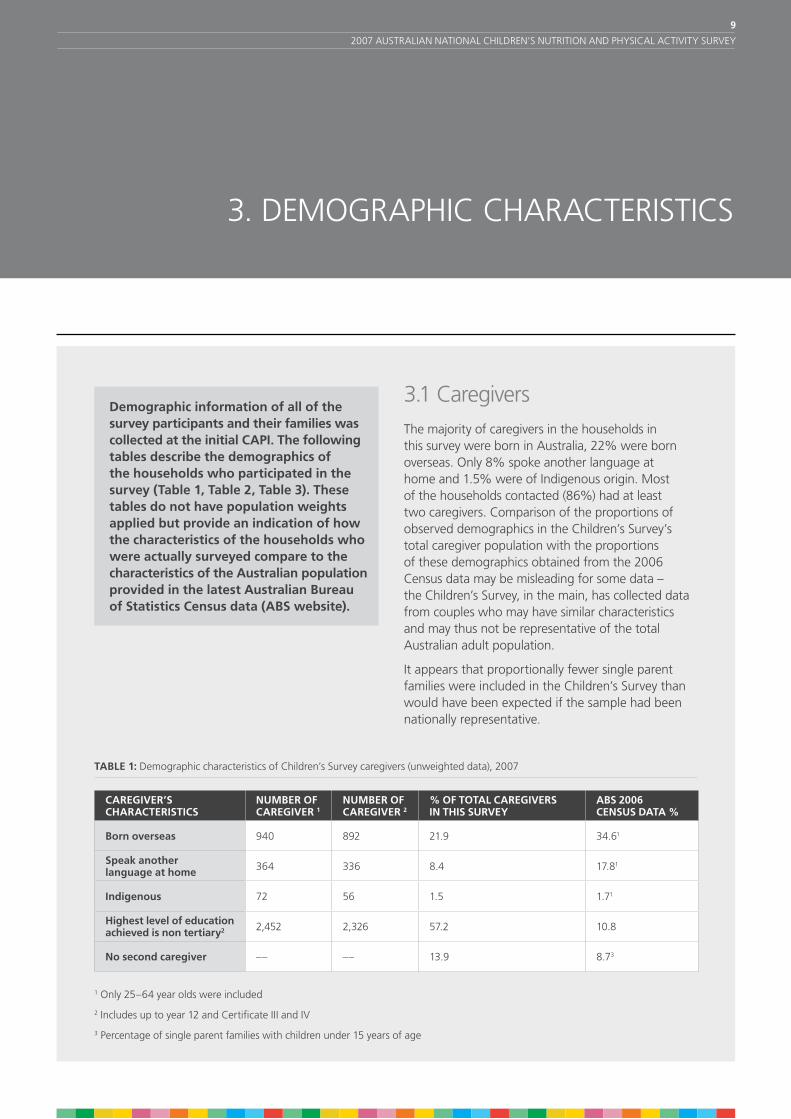
Demographic information of all of the survey participants and their families was collected at the initial CAPI. The following tables describe the demographics of the households who participated in the survey (Table 1, Table �, Table 3). These tables do not have population weights applied but provide an indication of how the characteristics of the households who were actually surveyed compare to the characteristics of the Australian population provided in the latest Australian Bureau of Statistics Census data (ABS website).
3.1 Caregiversthe majority of caregivers in the households in this survey were born in australia, 22% were born overseas. only 8% spoke another language at home and 1.5% were of indigenous origin. most of the households contacted (86%) had at least two caregivers. Comparison of the proportions of observed demographics in the Children’s survey’s total caregiver population with the proportions of these demographics obtained from the 2006 Census data may be misleading for some data – the Children’s survey, in the main, has collected data from couples who may have similar characteristics and may thus not be representative of the total australian adult population.
it appears that proportionally fewer single parent families were included in the Children’s survey than would have been expected if the sample had been nationally representative.
3. dEmograPHiC CHaraCtEristiCs
TABLE 1: demographic characteristics of Children’s survey caregivers (unweighted data), 2007
CAREGIVER’S CHARACTERISTICS
NUMBER OF CAREGIVER 1
NUMBER OF CAREGIVER �
% OF TOTAL CAREGIVERS IN THIS SURVEy
ABS �006 CENSUS DATA %
Born overseas 940 892 21.9 34.61
Speak another language at home 364 336 8.4 17.81
Indigenous 72 56 1.5 1.71
Highest level of education achieved is non tertiary� 2,452 2,326 57.2 10.8
No second caregiver –– –– 13.9 8.73
1 only 25–64 year olds were included
2 includes up to year 12 and Certificate iii and iv
3 Percentage of single parent families with children under 15 years of age

10
2007 australian national CHildrEn’s nutrition and PHysiCal aCtivity survEy
3.2 Children
TABLE �: demographic characteristics of Children’s survey children (unweighted data), 2007
CHILDREN’S CHARACTERISTICS NUMBER OF CHILDREN PERCENT OF CHILDREN IN SURVEy
ABS �006 CENSUS DATA %
Born overseas 289 6.4 11.41
Speak another language at home 297 6.6 14.21,2
Indigenous 134 3.0 4.33
Medical Conditions (at least one) 920 20.5 ––
1 based on abs Census data 2006, 0–14 year olds2 speaks other language (including whether or not speak English as well),
excluding those whose language and proficiency in English is not stated3 based on abs Census data 2006, 2–16 year olds
3.3 Households
TABLE 3: incomes of households in Children’s survey (unweighted data), 2007
HOUSEHOLD CHARACTERISTICS NUMBER OF HOUSEHOLDS
PERCENT OF HOUSEHOLDS
ABS �006 CENSUS DATA1 %
$1500 or more per week ($78,000 or more per year) 2,023 45.1 28.32
$600 – $1499 per week ($31,�00 – $77,999 per year) 1,728 38.5 39.73
$1– $599 per week ($1–$31,199 per year) 481 10.7 16.84
Don’t know 138 3.1 14.55
Other (no income, negative income, refused) 117 2.6 0.7 6
1 these abs figures excluded couple family with no children and were reported as different categories, therefore only closest comparison can be made
2 income > $1700 per week3 income $650–$1699 per week4 income $1–$649 per week5 Partial income or all income not stated6 negative or nil income
the comparisons with abs data indicate that there may be differences in the demographic characteristics between the survey participants and the rest of the australian population. to help correct for this, population weights have been applied but some bias may still remain after weighting.
11
2007 australian national CHildrEn’s nutrition and PHysiCal aCtivity survEy
4.1 food and drinksthe food and drinks that children consume provide essential nutrients important for health, normal growth and development as well as physical and mental wellbeing. the occasions where food and drinks are consumed also provide an important opportunity for social and cultural interactions in family, school and other settings.
Children can also obtain nutrients from supplements but these are not included in this current report. see table 13 for frequency of supplement consumption in the Children’s survey.
all food and drinks that children reported consuming over the 24-hour period prior to the interview were totalled and assigned to major types of foods or major food groups.
for each of the age and gender groups for the Children’s survey, the mean intakes of the major food groups are shown in table 4, with population weights applied to the data.
Key findings
on the day prior to the interview:
• milk products and dishes were generally consumed in the greatest quantities.
• younger children (2–3 years) generally consumed the greatest amount (g) of fruit and the older children (14–16 years) consumed the least.
• older children reported eating almost twice the amount (g) of vegetables compared to the younger children.
• the intake of milk products for 14–16 year old girls was approximately 30% lower than the youngest girls (2–3 years).
• meat, poultry and game intakes increased as the age groups of the children increased, particularly in boys.
• older boys (14–16 years) consumed three times as much meat/poultry/game as the younger boys (2–3 years).
• the consumption of cereals & cereal products (eg bread, pasta, breakfast cereals) and cereal–based products & dishes (eg cakes, biscuits, pastries) increased substantially with increasing age for both boys and girls.
FOOD AND ENERGy
foods provide us with the energy (kJ) we need for daily living. the percentage contribution of the major food groups to total energy intake is presented in table 5.
Key findings
on the day prior to the interview:
• in younger children (2–3 years), milk & dairy products and cereals & cereal products contributed over 45% of the total energy.
• for the older children (14–16) milk & dairy products contributed less to total energy but cereal–based products & dishes contributed more energy, reflecting the food consumption patterns noted above.
4. food and nutriEnts

1�
2007 australian national CHildrEn’s nutrition and PHysiCal aCtivity survEy
TABLE 4: mean daily consumption (g) of major food groups1, Children’s survey, 2007
AGE GROUP (yEARS)
� – 3 4 – 8 9 – 13 14 – 16
BOyS gram (g)
Non-Alcoholic Beverages 700.7 998.4 1443.5 1665.8
Cereals & Cereal Products 152.8 190.0 243.5 268.2
Cereal-Based Products & Dishes 62.6 96.1 139.3 199.5
Fats & Oils 7.1 7.6 6.7 7.8
Fish & Seafood Products & Dishes 10.6 13.2 17.0 13.2
Fruit Products & Dishes 185.8 174.7 156.5 133.4
Egg Products & Dishes 5.2 9.7 7.4 9.4
Meat, Poultry & Game Products & Dishes 60.8 92.8 129.4 182.4
Milk Products & Dishes 434.4 362.5 411.9 445.9
Dairy Substitutes 21.4 7.0 7.5 10.7
Soup 15.0 15.6 23.8 31.6
Seed & Nut Products & Dishes 2.0 2.8 2.9 4.5
Savoury Sauces & Condiments 12.0 15.8 31.8 35.1
Vegetable Products & Dishes 95.0 109.5 161.0 202.8
Legume & Pulse Products & Dishes 5.9 7.7 8.7 11.7
Snack Foods 4.4 11.7 15.2 15.9
Sugar Products & Dishes 14.1 19.7 20.4 20.2
Confectionery & Cereal Bars 10.9 19.2 27.4 28.2
Alcoholic Beverages 0.3 0.1 0.1 4.5
Special Dietary Foods 1.2 1.9 2.1 6.9
Miscellaneous 5.1 2.8 5.9 3.6
Infant Formulae & Foods 10.2 0.2 0.1 0.2
GIRLS gram (g)
Non-Alcoholic Beverages 686.9 876.9 1234.6 1448.8
Cereals & Cereal Products 145.5 168.2 181.7 193.9
Cereal-Based Products & Dishes 58.6 94.8 134.4 131.4
Fats & Oils 6.7 7.4 6.6 7.1
Fish & Seafood Products & Dishes 11.9 12.1 13.5 14.6
Fruit Products & Dishes 170.6 171.6 157.9 135.0
Egg Products & Dishes 6.8 7.6 6.7 9.4
Meat, Poultry & Game Products & Dishes 63.0 73.4 108.3 101.4
Milk Products & Dishes 416.3 319.7 312.2 287.3
Dairy Substitutes 16.9 11.0 4.2 6.7
Soup 13.3 25.2 37.4 34.6
Seed & Nut Products & Dishes 2.7 2.1 3.5 4.3
Savoury Sauces & Condiments 10.5 15.0 26.0 30.6
Vegetable Products & Dishes 95.5 113.0 151.0 178.9
Legume & Pulse Products & Dishes 7.0 6.6 4.1 8.2
Snack Foods 5.3 9.2 12.2 12.0
Sugar Products & Dishes 10.5 18.0 24.7 15.6
Confectionery & Cereal Bars 10.8 18.7 22.6 25.1
Alcoholic Beverages 0.2 0.1 0.3 22.0
Special Dietary Foods 0.4 3.1 0.4 1.7
Miscellaneous 5.2 4.7 3.3 4.7
Infant Formulae & Foods 9.2 0.2 0.7 0.0
1 one day food intake data collected at personal interview, population weights applied

13
2007 australian national CHildrEn’s nutrition and PHysiCal aCtivity survEy
TABLE 5: Proportion (%) of total dietary energy intake (including energy from fermentable fibre) obtained from major food groups1,
Children’s survey, 2007
Age group (years)
� – 3 4 – 8 9 – 13 14 – 16
BOyS % of total energy
Non-Alcoholic Beverages 4.9 6.1 7.3 7.3
Cereals & Cereal Products 22.7 23.0 22.7 21.6
Cereal-Based Products & Dishes 12.1 14.9 16.3 18.6
Fats & Oils 2.9 2.6 1.8 1.8
Fish & Seafood Products & Dishes 1.3 1.3 1.4 0.9
Fruit Products & Dishes 7.7 5.6 3.7 2.8
Egg Products & Dishes 0.6 0.9 0.6 0.6
Meat, Poultry & Game Products & Dishes 8.4 10.4 11.1 13.0
Milk Products & Dishes 24.4 17.7 15.5 14.1
Dairy Substitutes 0.8 0.2 0.2 0.2
Soup 0.5 0.4 0.6 0.6
Seed & Nut Products & Dishes 0.8 0.8 0.7 0.9
Savoury Sauces & Condiments 0.9 1.0 1.5 1.6
Vegetable Products & Dishes 4.8 5.1 6.3 6.6
Legume & Pulse Products & Dishes 0.4 0.5 0.4 0.5
Snack Foods 1.4 3.1 3.2 2.8
Sugar Products & Dishes 1.6 1.8 1.8 1.7
Confectionery & Cereal Bars 3.1 4.5 4.9 4.1
Alcoholic Beverages 0.0 0.0 0.0 0.1
Special Dietary Foods 0.1 0.1 0.1 0.3
Miscellaneous 0.3 0.2 0.1 0.1
Infant Formulae & Foods 0.5 0.0 0.0 0.0
GIRLS % of total energy
Non-Alcoholic Beverages 4.6 5.6 6.8 7.6
Cereals & Cereal Products 21.5 22.0 20.2 19.8
Cereal-Based Products & Dishes 12.1 16.1 18.4 17.5
Fats & Oils 3.0 2.9 2.1 2.2
Fish & Seafood Products & Dishes 1.6 1.4 1.2 1.4
Fruit Products & Dishes 7.8 6.0 4.5 3.9
Egg Products & Dishes 0.8 0.8 0.6 0.8
Meat, Poultry & Game Products & Dishes 8.7 9.4 11.0 9.9
Milk Products & Dishes 23.9 17.2 14.9 13.8
Dairy Substitutes 0.7 0.4 0.1 0.2
Soup 0.5 0.8 1.0 0.9
Seed & Nut Products & Dishes 1.0 0.7 1.0 1.1
Savoury Sauces & Condiments 0.9 0.9 1.6 1.6
Vegetable Products & Dishes 5.2 5.8 6.4 8.2
Legume & Pulse Products & Dishes 0.5 0.4 0.3 0.4
Snack Foods 1.7 2.6 3.0 2.9
Sugar Products & Dishes 1.5 1.8 2.0 1.8
Confectionery & Cereal Bars 3.1 4.9 4.8 5.2
Alcoholic Beverages 0.0 0.0 0.0 0.5
Special Dietary Foods 0.0 0.2 0.0 0.1
Miscellaneous 0.3 0.3 0.2 0.2
Infant Formulae & Foods 0.6 0.0 0.0 0.0
1 one day food intake data collected at personal interview, population weights applied

14
2007 australian national CHildrEn’s nutrition and PHysiCal aCtivity survEy
4.2 nutrientsfood and beverages provide a variety of nutrients that can be classified as either macronutrients or micronutrients.
MACRONUTRIENTS AND wATER
macronutrients are present in foods and drinks in relatively large amounts (gram, g) and are the key sources of energy, as well as providing dietary components essential for normal physiological processes. they include protein, carbohydrate, fat and dietary fibre.
Carbohydrate, fat and protein are the major dietary contributors to energy intake. it is necessary to obtain energy from our food and drinks to carry out the basic functions of everyday living including breathing, the normal functioning of our heart, brain and other key organs, to carry out digestion and to perform physical activity. the energy obtained from food and drinks, as well as estimates of energy intake are measured and reported in kilojoules (kJ).
dietary carbohydrate is comprised mainly of starch and sugars. total starch and total sugar intakes are presented in this main findings report. total sugars, such as lactose, sucrose and fructose are comprised of those naturally present in our foods and those added during processing and preparation. the amounts of total sugars in the Children’s survey presented in the following tables do not distinguish between the different types of sugar in the diet.
fat in our diet consists of three major types – saturated, monounsaturated and polyunsaturated.
a small amount of energy can be obtained from fermentable dietary fibre and this has been included in the total energy.
alcohol can also contribute to total calorific intake.
water or moisture is present in both food and drink but on its own, without any added dietary components such as sugar, it does not contribute to energy intake.
macronutrient intakes are presented in this main findings report as the mean or average for age and gender groups (table 7) and the mean contribution to total dietary energy intake (table 5) and these have been obtained from one day of intake collected from the 24-hour recall undertaken during the CaPi.
when nutrient intakes have been compared against recommended intakes, two days of intake data have been utilised to obtain an estimate of usual intake. see table 6.
ENERGy
average daily intake data for the age and gender groups of participants in the Children’s survey are based on one day of intake (CaPi) and are presented in figure 1.
Key findings
• the reported average daily energy intake was similar for younger boys and girls aged 2–3 years, averaging 6,166 kJ, including energy from fermentable fibre.
• Energy intakes increased with increasing age of the children, and the differences between boys and girls became more marked in the older age groups.
• boys aged 14–16 years had the highest energy intake at 11,818 kJ/day compared to 8,608 kJ/day for girls of the same age.
COMPARISON wITH ENERGy REqUIREMENTS
the nHmrC estimated energy requirements (EEr) provide a range of suggested requirements needed for children, with variation in energy requirements as a consequence of differences in age, gender, body size and physical activity. the usual energy intakes using intake data from the CaPi and the Cati of children in this survey were compared with both the lower and upper bounds of the ranges of the EEr (table 6).
FIGURE 1: mean one-day energy intake (including energy from fermentable fibre) of boys and girls, Children’s survey, 2007 (24-hour recall taken at CaPi, population weights applied)
6,290
7,740
9,837
11,818
6,043
7,030
8,333 8,608
0
2,000
4,000
6,000
8,000
10,000
12,000
14,000
2-3 y rs 4-8 y rs 9-13 y rs 14-16 y rs
kJ
Boys GirlsMean energy intake
Age group
6,290
7,740
9,837
11,818
6,043
7,030
8,333 8,608
0
2,000
4,000
6,000
8,000
10,000
12,000
14,000
2-3 y rs 4-8 y rs 9-13 y rs 14-16 y rs
kJ
Boys GirlsMean energy intake
Age group

15
2007 australian national CHildrEn’s nutrition and PHysiCal aCtivity survEy
Key findings
• the majority (more than 90%) of children younger than nine years reported consuming sufficient energy to meet the lower bound of the range for EEr.
• around 20% of older (14–16) boys’ estimated usual intake was not sufficient to meet the lower bound of the range for EEr.
• between 38–50% of older (13–16) girls’ estimated usual intake was not sufficient to meet the lower bound of the range for EEr.
• by contrast, reporting higher energy intakes than the upper bound was more common in the very young children aged 3–4 years.
RATIO OF ENERGy INTAKE TO BMR
it is well known that under-reporting of intakes can occur. the energy intake (Ei) to basal metabolic (bmr) ratio can be used as an indicator of under-reporting. the mean Ei:bmr was 1.8 for all 2–3 year olds, 1.7 for all 4–8 years, 1.6 and 1.5 for 9–13 year old boys and girls respectively; and 1.6 and 1.4 for the older (14–16 years) boys and girls respectively. this may reflect under-reporting in the older girls.
TABLE 6: median intake of energy (kJ, including energy from fermentable fibre) compared with estimated energy requirements (EEr), and proportions outside the upper and lower bounds of EEr by age and gender, Children’s survey, 2007
BOyS
years EER (kJ) Median usual intake (kJ)
Proportion consuming less than the lower bound of the EER range (%)
Proportion consuming more than the upper bound of the EER range (%)
� 4,400 5924 5 –3 4,900–6,900 6539 3 364 5,200–7,300 7221 2 475 5,500–7,800 7511 3 406 5,800–8,200 7472 4 257 6,100–8,700 7860 4 238 6,400–9,200 8320 5 269 6,800–9,700 8906 4 2910 7,300–10,400 8981 8 1611 7,700–11,000 9807 4 191� 8,200–11,600 10485 8 2713 8,700–12,400 10725 3 914 9,300–13,200 11050 19 1815 9,900–14,000 11918 21 2316 10,300–14,700 12115 19 13
GIRLS
� 4,200 5721 6 –3 4,500–6,400 6172 1 394 4,800–6,800 6471 6 405 5,100–7,200 6461 4 206 5,400–7,600 6845 4 217 5,700–8,100 7578 2 328 6,000–8,600 7506 4 129 6,400–9,100 7679 16 1610 6,700–9,500 8215 12 1911 7,000–10,000 8650 13 231� 7,400–10,600 8187 28 713 7,800–11,100 8293 38 714 8,100–11,500 8380 43 315 8,200–11,700 8735 38 616 8,400–11,900 8395 50 2

16
2007 australian national CHildrEn’s nutrition and PHysiCal aCtivity survEy
Table 7: mean intake1 of macronutrients and total moisture/fluid by age group and gender, Children’s survey, 2007
AGE GROUP (yEARS)Unit � – 3 4 – 8 9 – 13 14 – 16
BOyS
Energy (kJ) 6156.6 7586.6 9645.8 11598.3
Energy – including fermentable fibre) (kJ) 6290.2 7740.4 9837.3 11818.5
Moisture� (g) 1481.0 1745.6 2335.9 2673.7
MacronutrientsProtein (g) 60.6 74.3 95.2 121.1
Total fat3 (g) 51.6 64.4 81.0 99.7
Saturated fat (g) 24.4 29.3 36.4 44.2
Monounsaturated fat (g) 17.1 22.2 28.3 35.4
Polyunsaturated fat (g) 6.2 8.1 10.3 12.8
Cholesterol (mg) 163.1 214.9 265.1 333.8
Total carbohydrate4 (g) 193.4 237.0 302.6 351.4
Total sugars (g) 102.0 116.7 145.9 163.1
Total starch (g) 89.6 118.1 153.7 184.8
Alcohol (g) 0.0 0.0 0.0 0.1
Fibre (g) 16.7 19.2 23.9 27.5
GIRLS
Energy (kJ) 5918.4 6885.8 8166.6 8436.0
Energy – including fermentable fibre (kJ) 6042.6 7030.0 8332.7 8608.5
Moisture� (g) 1432.0 1584.0 2002.5 2213.3
MacronutrientsProtein (g) 59.4 65.5 79.5 81.6
Total fat3 (g) 50.5 59.1 70.4 73.1
Saturated fat (g) 23.5 26.5 31.3 31.7
Monounsaturated fat (g) 17.1 20.6 24.7 26.2
Polyunsaturated fat (g) 6.1 7.7 9.3 10.0
Cholesterol (mg) 171.5 187.4 224.2 225.1
Total carbohydrate4 (g) 182.9 215.7 253.2 260.6
Total sugars (g) 95.6 105.9 124.4 126.3
Total starch (g) 85.6 107.7 126.2 131.3
Alcohol (g) 0.0 0.0 0.0 0.4
Fibre (g) 15.5 18.0 20.7 21.5
TOTAL CHILDREN
Energy (kJ) 6038.1 7245.0 8922.4 10056.6
Energy – including fermentable fibre (kJ) 6167.0 7394.1 9101.4 10253.5
Moisture� (g) 1456.6 1666.9 2172.8 2449.3
MacronutrientsProtein (g) 60.0 70.0 87.5 101.9
Total fat3 (g) 51.0 61.8 75.8 86.7
Saturated fat (g) 23.9 28.0 33.9 38.1
Monounsaturated fat (g) 17.1 21.4 26.6 30.9
Polyunsaturated fat (g) 6.2 7.9 9.8 11.4
Cholesterol (mg) 167.3 201.5 245.1 280.8
Total carbohydrate4 (g) 188.2 226.6 278.5 307.1
Total sugars (g) 98.8 111.5 135.4 145.2
Total starch (g) 87.6 113.0 140.3 158.7
Alcohol (g) 0.0 0.0 0.0 0.2
Fibre (g) 16.1 18.6 22.3 24.6
1 one-day nutrient intake data from food and beverages only (no supplements) collected at CaPi, population weights applied2 fluids derived from food and beverages3 the sum of the three fatty acid subtotals is less than the total fat value due to the contribution of the non-fatty acid components in the
triglyceride unit such as the glycerol backbone, possible phosphate groups and sterols4 for some foods, data for total carbohydrates includes a contribution from glycogen, sugar alcohols and oligosaccharides where the levels
of these carbohydrates are known. for these foods, the sum of the total sugars and starch will not equal the total carbohydrate value
17
2007 australian national CHildrEn’s nutrition and PHysiCal aCtivity survEy
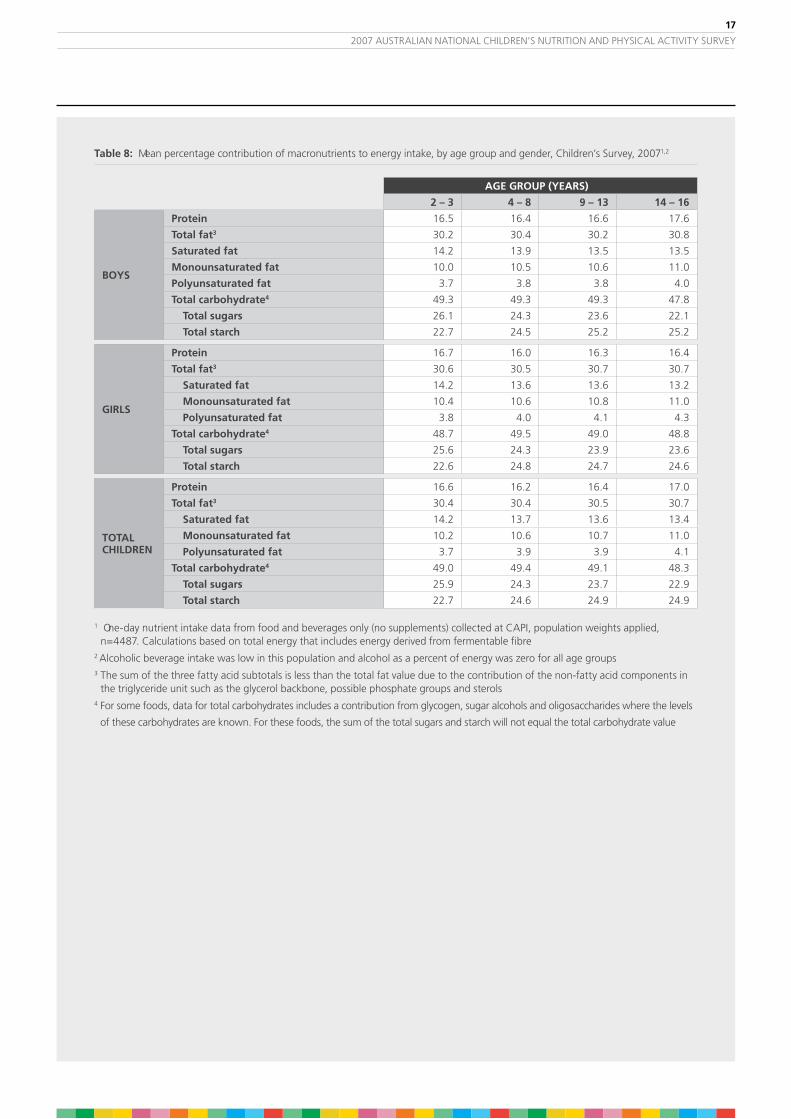
Table 8: mean percentage contribution of macronutrients to energy intake, by age group and gender, Children’s survey, 20071,2
AGE GROUP (yEARS)
� – 3 4 – 8 9 – 13 14 – 16
BOyS
Protein 16.5 16.4 16.6 17.6
Total fat3 30.2 30.4 30.2 30.8
Saturated fat 14.2 13.9 13.5 13.5
Monounsaturated fat 10.0 10.5 10.6 11.0
Polyunsaturated fat 3.7 3.8 3.8 4.0
Total carbohydrate4 49.3 49.3 49.3 47.8
Total sugars 26.1 24.3 23.6 22.1
Total starch 22.7 24.5 25.2 25.2
GIRLS
Protein 16.7 16.0 16.3 16.4
Total fat3 30.6 30.5 30.7 30.7
Saturated fat 14.2 13.6 13.6 13.2
Monounsaturated fat 10.4 10.6 10.8 11.0
Polyunsaturated fat 3.8 4.0 4.1 4.3
Total carbohydrate4 48.7 49.5 49.0 48.8
Total sugars 25.6 24.3 23.9 23.6
Total starch 22.6 24.8 24.7 24.6
TOTALCHILDREN
Protein 16.6 16.2 16.4 17.0
Total fat3 30.4 30.4 30.5 30.7
Saturated fat 14.2 13.7 13.6 13.4
Monounsaturated fat 10.2 10.6 10.7 11.0
Polyunsaturated fat 3.7 3.9 3.9 4.1
Total carbohydrate4 49.0 49.4 49.1 48.3
Total sugars 25.9 24.3 23.7 22.9
Total starch 22.7 24.6 24.9 24.9
1 one-day nutrient intake data from food and beverages only (no supplements) collected at CaPi, population weights applied, n=4487. Calculations based on total energy that includes energy derived from fermentable fibre
2 alcoholic beverage intake was low in this population and alcohol as a percent of energy was zero for all age groups3 the sum of the three fatty acid subtotals is less than the total fat value due to the contribution of the non-fatty acid components in
the triglyceride unit such as the glycerol backbone, possible phosphate groups and sterols4 for some foods, data for total carbohydrates includes a contribution from glycogen, sugar alcohols and oligosaccharides where the levels
of these carbohydrates are known. for these foods, the sum of the total sugars and starch will not equal the total carbohydrate value

18
2007 australian national CHildrEn’s nutrition and PHysiCal aCtivity survEy
Key findings
• Carbohydrates contributed just less than half of total energy. the proportion contributed by carbohydrates was similar for all age groups (48–49.5%).
• of the carbohydrates consumed, starch and sugars contributed to total energy intake in varying proportions. in the younger age group (2–3 years), there was more energy coming from sugars (25.6–26.1%) than starch (22.6–22.7%), but this situation was reversed in the older age groups such that for the 14–16 year old children, starch (24.6–25.2%) contributed more to total energy than dietary sugars (22.1–23.6%).
• total dietary fat contributed 30.2–30.8% of total energy intake over the day. saturated fat contributed more to total energy (13.2–14.2%) than monounsaturated (10.0–11.0%) and polyunsaturated fat (3.7–4.3%).
• dietary protein contributed between 16.0–17.6% of total energy with boys aged 14–16 years having the highest protein intakes.
• the average intake of fibre was lowest in the younger children 2–3 years and increased in each successive age group. the lowest intake was in girls aged 2–3 (15.5g/day) and highest in boys aged 14–16 years (27.5g/day).
• Estimated fluid intakes (total from beverages and foods) ranged from 1.4–1.5 l/day for children aged 2–3 years, reaching up to 2.2–2.7 l/day for the older (14–16 years) children.
MICRONUTRIENTS
micronutrients are required and present in foods and drinks in relatively small amounts (milligrams, mg or micrograms, µg) and provide dietary components that are essential for normal physiological processes.
micronutrients are presented in this report as the mean intakes derived from one day of intake collected from the 24-hour recall completed at the CaPi.
the nHmrC established a set of Nutrient Reference Values (nrvs) for planning and assessing diets for australia and new Zealand (nHmrC 2006). Estimates of usual intake are needed for comparison with nrvs. the usual nutrient intake data, derived from only food and beverages, excluding supplements, were compared to the estimated average requirements (Ear) or the adequate intake (ai) where an Ear did not exist.
Estimated usual intakes were calculated from a 24-hour recall collected at both the CaPi and the Cati, using statistical modelling software (C-sidE, v 1.0, iowa state university).

19
2007 australian national CHildrEn’s nutrition and PHysiCal aCtivity survEy
TABLE 9: mean intake1 of micronutrients and caffeine by age group and gender, Children’s survey 2007
AGE GROUP (yEARS)Unit � – 3 4 – 8 9 – 13 14 – 16
BOyS
Vitamin A (RE) (mcg) 691.9 692.8 781.2 928.8Thiamin (mg) 1.5 1.7 2.1 2.5Riboflavin (mg) 2.4 2.4 2.8 3.3Niacin equivalents (mg) 32.7 39.9 49.9 63.0Total Folate (mcg) 371.6 398.9 442.4 497.3Folate equivalents (mcg) 442.2 471.9 519.1 578.5Vitamin C (mg) 87.7 102.9 121.0 149.6Vitamin D (mcg) 3.3 3.0 3.4 4.0Vitamn E (mg) 4.2 5.2 6.7 8.3Calcium (mg) 829.8 841.8 988.5 1143.4Phosphorous (mg) 1135.5 1284.1 1581.0 1916.9Magnesium (mg) 230.8 263.0 332.1 385.1Iron (mg) 8.3 10.5 13.6 16.3Zinc (mg) 8.0 9.7 12.0 15.3Potassium (mg) 2283.3 2497.5 3127.0 3696.3Iodine (mcg) 128.1 125.0 153.1 174.8Sodium (mg) 1691.1 2229.2 2889.6 3672.0Caffeine (mg) 3.4 8.5 19.7 46.8
GIRLS
Vitamin A (RE) (mcg) 622.2 685.2 710.9 744.4Thiamin (mg) 1.4 1.6 1.7 1.7Riboflavin (mg) 2.3 2.2 2.2 2.3Niacin equivalents (mg) 31.6 35.0 41.4 41.9Total Folate (mcg) 352.8 365.8 379.9 380.9Folate equivalents (mcg) 419.8 435.7 442.9 440.5Vitamin C (mg) 79.8 89.6 113.4 129.0Vitamin D (mcg) 3.1 2.7 2.7 2.8Vitamn E (mg) 4.3 5.1 6.1 6.7Calcium (mg) 780.2 747.4 791.6 826.0Phosphorous (mg) 1096.9 1158.2 1332.8 1380.1Magnesium (mg) 221.8 239.0 277.7 295.8Iron (mg) 7.8 9.2 10.8 11.1Zinc (mg) 7.6 8.3 9.9 10.0Potassium (mg) 2195.8 2284.0 2656.0 2822.2Iodine (mcg) 123.0 111.5 121.1 118.8Sodium (mg) 1657.9 2089.8 2489.7 2623.5Caffeine (mg) 3.3 7.7 18.7 36.4
TOTAL CHILDREN
Vitamin A (RE) (mcg) 657.2 689.1 746.8 838.9Thiamin (mg) 1.5 1.7 1.9 2.1Riboflavin (mg) 2.4 2.3 2.5 2.8Niacin equivalents (mg) 32.2 37.5 45.8 52.7Total Folate (mcg) 362.2 382.8 411.8 440.6Folate equivalents (mcg) 431.1 454.2 481.8 511.2Vitamin C (mg) 83.7 96.4 117.3 139.6Vitamin D (mcg) 3.2 2.8 3.1 3.4Vitamn E (mg) 4.3 5.1 6.4 7.5Calcium (mg) 805.1 795.8 892.2 988.6Phosphorous (mg) 1116.3 1222.7 1459.6 1655.2Magnesium (mg) 226.3 251.3 305.5 341.5Iron (mg) 8.0 9.8 12.2 13.8Zinc (mg) 7.8 9.0 11.0 12.7Potassium (mg) 2239.8 2393.4 2896.6 3270.2Iodine (mcg) 125.6 118.4 137.4 147.5Sodium (mg) 1674.6 2161.3 2694.0 3160.8Caffeine (mg) 3.4 8.1 19.2 41.7
1 one day nutrient intake data from food and beverages only (no supplements) collected at CaPi, population weights applied

�0
2007 australian national CHildrEn’s nutrition and PHysiCal aCtivity survEy
Key findings
on the day prior to the interview:
• in general, the mean of the micronutrients tended to increase from the youngest to the oldest age groups for both boys and girls. this increase in nutrient intake is related, at least in part, to increasing quantities of foods consumed and higher energy intakes that occur with increasing age. with more food being consumed, more micronutrients are likely to be present in the diet.
• the differences in micronutrient intakes between boys and girls in the younger age groups (2–3 years) were relatively small. However, the differences in intakes between boys and girls were more pronounced in the 14–16 year olds with these older boys consuming greater amounts of micronutrients compared to girls.
intakes of sodium, iodine and caffeine were estimated for the first time in a national survey.
on the day prior to the interview:
• sodium intakes ranged from 1,658 to 3,672 mg/day, increasing with the age of the children being surveyed.
• iodine intakes did not increase consistently across the age groups as most of the other micronutrients did.
• Estimated caffeine intake was low in the youngest children but increased in the 14–16 year olds to a mean of 47 mg for boys and 36 mg for girls.
ESTIMATED AVERAGE REqUIREMENTS
the Ear is the average daily nutrient intake level that is estimated to meet the nutrient requirements of half of the children in each of the age and gender groups.
the proportions of children in each age group having usual intakes greater than the Ear (ie the percentage of children meeting the Ears for select nutrients) are shown in table 10.
the proportions of each age group having usual intake estimates less than the Ear can be used to estimate the prevalence of potentially inadequate intakes.
Key findings
• the majority of children in all age groups met the estimated average requirements for all of the assessed nutrients, with the exception of calcium. this indicates that children are unlikely to be at risk of inadequacy for these nutrients across the surveyed population.
• younger children met the Ear for most minerals but the proportion of children with intakes below the Ear for older children were notable for calcium.
• the older girls (12–16 years) appeared to be most at risk of not meeting their dietary requirements for calcium (82–89% did not meet the Ear). dairy foods are one of the richest dietary sources of calcium and the intake of these foods was relatively low for girls of this age.
• other nutrients also appear to be potentially at risk in the older girls (14–16 years) – magnesium (56% did not meet the Ear). magnesium is found in both plant and animal sources – vegetables, nuts, unrefined cereals and some shellfish.

�1
2007 australian national CHildrEn’s nutrition and PHysiCal aCtivity survEy
TABLE 10: Proportion (%) of children1 meeting estimated average requirements (Ear) for selected nutrients using estimate of usual nutrient intakes derived from 2 days of intake data collected by 24-hour recall at both CaPi and follow-up Cati, Children’s survey, 2007
PROPORTION (%)
BOyS
�–3 years 4–8 years 9–13 years 14–16 years
Protein 100 100 100 100
Vitamin A retinol equivalent 100 99 96 79
Thiamin 100 100 100 99
Riboflavin 100 100 100 100
Niacin equivalent 100 100 100 100
Folate (dietary folate equivalents) 100 100 99 86
Vitamin C 97 99 99 98
Calcium 99 93 65, 502 56
Phosphorus 100 100 95 99
Magnesium 100 100 99 66
Iron 100 100 100 99
Zinc 100 100 100 87
Iodine 95 95 96 95
GIRLS
�–3 years 4–8 years 9–13 years 14–16 years
Protein 100 100 100 100
Vitamin A retinol equivalent 100 99 91 86
Thiamin 100 100 99 95
Riboflavin 100 100 99 98
Niacin equivalent 100 100 100 100
Folate (dietary folate equivalents) 100 99 89 71
Vitamin C 96 99 99 99
Calcium 99 85 45, 112 18
Phosphorus 100 100 81 86
Magnesium 100 100 90 44
Iron 99 100 98 89
Zinc 100 100 100 98
Iodine 91 91 91 74
ALL CHILDREN
�–3 years 4–8 years 9–13 years 14–16 years
Protein 100 100 100 100
Vitamin A retinol equivalent 100 99 94 83
Thiamin 100 100 100 97
Riboflavin 100 100 100 99
Niacin equivalent 100 100 100 100
Folate (dietary folate equivalents) 100 100 94 79
Vitamin C 96 99 99 99
Calcium 99 89 55, 312,3 38
Phosphorus 100 100 88 93
Magnesium 100 100 94 55
Iron 99 100 99 94
Zinc 100 100 100 93
Iodine 93 93 94 85
1 Population weights applied2 Ears exist for 9–11 years and for 12–13 years. 65% and 45% for boys and girls respectively represents the proportion
of children who met the Ear for 9–11 year olds; 50% boys and 11% girls met the Ear for the 12–13 year olds3 assuming that the age of the children in this group was evenly distributed, then 43% of the children met the Ear for calcium
��
2007 australian national CHildrEn’s nutrition and PHysiCal aCtivity survEy
ADEqUATE INTAKES
if Ears could not be determined for nutrients due to limited scientific evidence being available, adequate intakes (ais) were established instead, often but not always based on the median intake reported in the 1995 national nutrition survey and assuming that they had a sufficient intake.
an ai is defined as the average daily nutrient intake level based on observed or experimentally determined approximations of estimates of nutrient intake by a group (or groups) of apparently healthy people that are assumed to be adequate.
Comparisons of the nutrient intakes of the Children’s survey participants with ais cannot be used to determine the prevalence of potential nutrient intake inadequacy.
unlike the Ear, the proportion of children having intakes less than the ai, does not estimate the prevalence of potentially inadequate intakes. However, if the mean usual intake of children for a nutrient is at or above the ai, or if more than 50% of children have usual intakes at or greater than the ai, it implies a low prevalence of inadequate intakes. if the ai is based on median intakes, this assessment of children’s intake is made with less confidence.
Key findings
• for all age and gender groups the mean usual intake for total fluid, dietary fibre, sodium and potassium were generally at or above the ai for each nutrient, suggesting that it is unlikely that there will be a high prevalence of children not consuming enough of these nutrients.
• the estimated usual intakes of vitamin E and d were considerably less than the ai for both nutrients. whilst these findings may suggest that a significant number of children may not be consuming sufficient amounts of vitamin E and d, a definitive conclusion cannot be reached. the primary source of vitamin d is exposure to sunlight and this was not measured in this survey. in addition, the accuracy of vitamin E data may be limited by the lack of australian food composition data. therefore, the results for vitamin E and d do not necessarily indicate a prevalence of inadequate intake within the surveyed population.
FOOD GUIDE AND DIETARy GUIDELINES
the Dietary Guidelines for Children and Adolescents (nHmrC 2003) and the Australian Guide to Healthy Eating (smith et al 1988) provide a basis for evaluating the eating patterns of australian children as measured in the Children’s survey. in order to make comparisons with the recommendations, the following operational definitions were used and calculations were made from the weighted average of food and nutrient data from the two 24-hour recalls.
Criteria used for judging eating patterns of children in the Children’s survey to meet the recommendations of the Dietary Guidelines of Children and Adolescents in Australia (nHmrC 2003) and the Australian Guide to Healthy Eating (smith et al 1988) are indicated in table 11.

�3
2007 australian national CHildrEn’s nutrition and PHysiCal aCtivity survEy
TABLE 11: methodology to compare intakes with the dietary guidelines for Children and adolescents
DIETARy GUIDELINE INDICATOR/OPERATIONAL DEFINITION
Encourage and support breastfeeding
mother recalled/reported “ever breastfeeding” her child during infancy (food habits question asked of caregiver /parent during CaPi)
Children and adolescents need sufficient nutritious foods to grow and develop normally
due to the qualitative nature of this guideline, has been interpreted as the sum of all of the other dietary guidelines, listed below. i.e. children were considered to have met this guideline if they met the remaining guidelines.
Eat plenty of fruit meeting the age specific recommendations for fruit intake in the agHE. age groups in the agHE differ to those for the Children’s survey, the following serves for each age group were used:
(2–3 yrs = 1 serve) no guidelines in agHE
4–8 yrs = 1 serve
9–13 yrs = 1 serve
14–16 yrs = 3 serves
one serve of fruit calculated to be 150g of fruit ± juice
based on 2 days intake data, estimating usual intakes.
Eat plenty of vegetables, including legumes
meeting the age specific recommendations for vegetable intake in the agHE. age groups in the agHE differ to those for the Children’s survey, the following serves for each age group were used:
(2–3 yrs = 2 serves) no guidelines in agHE
4–8 yrs = 2 serves
9–13 yrs = 3 serves
14–16 yrs = 4 serves
one serve of vegetables was calculated to be 75 g of vegetables as specified in agHE ± potato
based on 2 days intake data, estimating usual intakes, average of consumers and non-consumers for entire age and gender group.
Eat plenty of cereals (including breads, rice, pasta and noodles), preferably wholegrain
meeting the age specific recommendations for cereal intake in the agHE. age groups in the agHE differ to those for the Children’s survey, the following serves for each age group were used:
(2–3 yrs = 3 serves) no guidelines in agHE
4–8 yrs = 3 serves
9–13 yrs = 4 serves
14–16 yrs = 4 serves
one serve of cereals was calculated to be 60 grams (2 slices) of bread, 40 g breakfast cereals, 180 g of rice pasta, as specified in agHE
based on 2 days intake data, estimating usual intakes, average of consumers and non-consumers for entire age and gender group.
Include lean meat, fish, poultry and/or alternatives
meeting the age specific Ear for protein, iron and zinc. based on 2 days intake data, estimating usual intake.
Include milks, yoghurts, cheese and/or alternatives
meeting the age specific Ear for calcium. based on 2 days intake data, estimating usual intake.
Choose water as a drink fluid intake greater than the age-specific ai for total water which included all fluids from food and beverages.
Limit saturated fat and moderate total fat intake
less than 10% of total energy intake as saturated fat (one day CaPi intake utilised).
Choose foods low in salt more than the age-specific ai for sodium.
Consume only moderate amounts of sugars and foods containing added sugars
dietary guidelines report that up to 15–20% of total energy supplied by total sugars is not incompatible with a healthy diet. less than 20% of total energy intake as sugars.
(one day CaPi intake utilised).

�4
2007 australian national CHildrEn’s nutrition and PHysiCal aCtivity survEy
Key findings
the following are the highlights of the comparison of eating patterns with the Dietary Guidelines for Children and Adolescents in Australia as shown in table 12.
• non-compliance was greatest for guidelines relating to saturated fat, sugar and vegetables, as well as fruit and dairy for those 9 years and over.
• most australian children had been breastfed at least sometime during their infancy.
• there are no national guidelines recommending specific numbers of foods for children 2–3 years of age. for this initial analyses, the recommendations for the 4–7 years were used for the 2–3 year olds but these intake levels could be too high a target for the very young children.
• a large proportion of children did not meet the recommendations for fruit serves, especially the older children in whom only 1–2 % appeared to consume 3 serves of fruit if juice was not included in the count as a fruit serve. Compliance increased to 19–25% in this group if juice was included as a fruit serve.
• only about one-quarter of children in the younger age groups and 1–11% of the older age groups met the guideline for vegetable intake. if potatoes are excluded from the count as a vegetable, compliance is considerably worse due to the relatively high consumption of potato compared with other vegetables.
• 20–50% of boys 4 years and over but only 2–10% of girls consumed the recommended three to four serves of cereal types (bread, pasta, rice, breakfast cereals). these children were however, eating significant amounts of cereals in other products that may be higher in fat and sugar and are not traditionally included in the cereal grouping (cakes, biscuits, pastries etc).
• the older girls (12–16 years) appeared to be most at risk of not meeting their dietary requirements for calcium (82–89% did not meet the Ear). this is likely to reflect the substantial decline in milk intake through childhood and replacement with sweetened beverages.
• Close to half of children in all age groups met the ai for fluid/water intake, suggesting consumption may be adequate.
• a minority of children met the guidelines for limiting saturated fat intake, and having a moderate intake of sugar.
• all children met the recommendation for sodium intake and consumed greater than the ai level. in fact, the consumption of sodium in all age groups exceeded the recommended upper level of intake.

�5
2007 australian national CHildrEn’s nutrition and PHysiCal aCtivity survEy
TABLE 1�: Proportion (%) of children meeting the serve recommendations of the australian guide to Healthy Eating based on the dietary guidelines1,2
BOyS (%) - AGE SHOwN IN yEARS
Dietary Guideline Parameter� �–3 4–8 9–13 14–16
Encourage, support breastfeeding Ever been breast fed 93 90 92 91
Eat plenty of fruits ≥1–3 serves/d excluding juice (70)3 63 50 2
≥1–3 serves/d including juice (90) 95 89 25
Eat plenty of vegetables ≥2–4 serves/d excluding potatoes (5) 4 2 2
≥2–4 serves/d including potatoes (12) 22 17 11
Eat plenty of cereals ≥3–4 serves/day (6) 30 20 50
include lean meat, fish, poultry and/or alternatives %>Ear for protein, iron, zinc 100 100 100 87–100
include milks, yoghurts, cheese and/or alternatives %>Calcium Ear 99 93 65, 504 56
Choose water as a drink %>fluid ai 57 63 56 44
limit saturated fat and moderate total fat intake <10% energy from saturated fat 15 19 19 20
Choose foods low in salt >sodium ai 100 100 100 100
Consume only moderate amounts of sugars %<20% energy from total sugars 20 31 35 41
GIRLS (%)
Encourage, support breastfeeding Ever been breast fed 93 89 88 93
Eat plenty of fruits ≥1–3 serves/d excluding juice (66) 59 52 1
≥1–3 serves/d including juice (89) 92 91 19
Eat plenty of vegetables ≥2–4 serves/d excluding potatoes (6) 1 2 0
≥2–4 serves/d including potatoes (16) 22 11 1
Eat plenty of cereals ≥3–4 serves/day (4) 10 3 2
include lean meat, fish, poultry and/or alternatives %>Ear for protein, iron, zinc 99–100 100 98–100 89–100
include milks, yoghurts, cheese and/or alternatives %>Calcium Ear 99 85 45, 114 18
Choose water as a drink %>fluid ai 49 45 57 47
limit saturated fat and moderate total fat intake <10% energy from saturated fat 17 20 19 25
Choose foods low in salt >sodium ai 100 100 100 100
Consume only moderate amounts of sugars %<20% energy from total sugars 23 27 32 37
ALL CHILDREN
Encourage, support breastfeeding Ever been breast fed 93 89 90 92
Eat plenty of fruits ≥1–3 serves/d excluding juice (68) 61 51 1
≥1–3 serves/d including juice (90) 93 90 24
Eat plenty of vegetables ≥2–4 serves/d excluding potatoes (5) 3 2 0
≥2–4 serves/d including potatoes (14) 22 14 5
Eat plenty of cereals ≥3–4 serves/day (5) 20 11 25
include lean meat, fish, poultry and/or alternatives %>Ear for protein, iron, zinc 99–100 100 99–100 93–100
include milks, yoghurts, cheese and/or alternatives %>Calcium Ear 99 89 55, 314,5 38
Choose water as a drink %>fluid ai 53 54 57 46
limit saturated fat and moderate total fat intake <10% energy from saturated fat 16 19 19 22
Choose foods low in salt >sodium ai 100 100 100 100
Consume only moderate amounts of sugars %<20% energy from total sugars 21 29 33 39
1 all weighted, 2-day data, except for % of total energy as fat and sugar which has been calculated with CaPi data only2 information on how intake data were operationalised to compare against guidelines are outlined in table 113 no national recommendations or guidelines available for this age group, percentage in brackets ( ) calculated based on
recommendations for the 4–7 year olds4 Ears exist for 9–11 years and for 12–13 years. 65% and 45% for boys and girls respectively represents proportion of children who
met the Ear for 9–11 year olds; 50% boys and 11% girls met the Ear for the 12–13 year olds5 assuming the age of the children in this group was evenly distributed, then 43% of the children was calculated to meet the Ear for calcium

�6
2007 australian national CHildrEn’s nutrition and PHysiCal aCtivity survEy
4.3 nutritional supplements a small percentage (7.9%) of children consumed supplements on the CaPi day of interview. multivitamin and or mineral supplements were most commonly consumed followed by oil and single vitamin supplements. there was a higher percentage (9.5%) of younger children (2–8 years) who took a supplement compared to the older children (6.7% of those aged 9–13 and 6.1% of the 14–16 year olds).
TABLE 13: Percentage of children1 who consumed at least one supplement on the day of the interview, by age group and gender, Children’s survey, 2007
AGE GROUP (yEARS)� – 3 4 – 8 9 – 13 14 – 16
BOySDid not consume 92.7 90.2 93.7 96.2Consumed at least one supplement 7.3 9.8 6.3 3.8
GIRLSDid not consume 88.1 91.0 92.8 91.4Consumed at least one supplement 11.9 9.0 7.2 8.6
TOTAL CHILDREN
Did not consume 90.4 90.6 93.3 93.9Consumed at least one supplement 9.6 9.4 6.7 6.1
1 Population weights applied

�7
2007 australian national CHildrEn’s nutrition and PHysiCal aCtivity survEy
5. PHysiCal and sEdEntary aCtivitiEs
There is little doubt about the benefits of physical activity for the cardiovascular, metabolic, skeletal and psychological health of children. However, there is concern that children may be getting less physical activity than they did in previous decades, although the evidence is limited (Dollman, Norton & Norton, �005), and that many may not be getting enough physical activity for optimal health.
as a result of these concerns, in 2005 the department of Health and ageing issued the australia’s Physical activity recommendations for 5–12 years old and 12–18 years old (doHa 2004a, doHa 2004b).
in order to determine the overall daily activity patterns of children, it is necessary to take into account both physically active and sedentary behaviours.
5.1 national Physical activity guidelines
the department of Health and ageing recommends that children aged 5–18 years accumulate at least 60 minutes, and up to several hours, of moderate to vigorous physical activity (mvPa) every day.
Four criteria may be used to assess observance of the guidelines (Olds et al. �007):
(1) a child meets the guidelines if he or she accumulates at least 60 minutes of mvPa on each of the four days sampled (all days method);
(2) a child meets the guidelines if he or she accumulates at least 60 minutes of mvPa on most (i.e. three or four) of the four days sampled (most days method);
(3) a child meets the guidelines if he or she accumulates at least 60 minutes of mvPa per day when averaged across the four days sampled (four-day average method); or
(4) the level of observance of the guidelines in the population is the probability that a randomly chosen child on a randomly chosen day will accumulate at least 60 minutes of mvPa on that day (Child x day method).
Each of these methods yields different estimates of the prevalence of meeting the guidelines, and all are given in this report.
table 14 shows the percentage of children who complied with the physical activity guidelines using the four different methods.
Key findings
• by most methods, the majority of children aged 9–16 years met the guidelines for mvPa. on any given day, there was a 69% chance that any given child would get at least 60 minutes of moderate to vigorous physical activity
• girls met the guidelines less often than boys, and there was a drop-off with age, which is very marked in older girls.

�8
2007 australian national CHildrEn’s nutrition and PHysiCal aCtivity survEy
TABLE 14: Proportion (%) of children1 who met the physical activity guidelines using four different methods of interpreting the guidelines, Children’s survey, 2007
BOyS GIRLS ALL CHILDREN
AGE (yEARS) 9–13 14–16 9–16 9–13 14–16 9–16 9–13 14–16 9–16
All Days Method 46 25 38 33 13 25 40 19 32
Most Days Method 74 53 66 60 33 50 68 43 58
4 Day Average Method 94 77 87 86 59 75 90 68 82
Child x Day Method 80 64 74 71 51 64 76 58 69
1Population weights applied
5.2 Pedometer stepsChildren aged 5–16 years wore a pedometer, a device which counts steps, for up to seven consecutive days. Children who recorded at least six days of measurements, and had the pedometer off for no more than four hours during waking hours on any day (for example, for bathing or contact sports), were included in the analysis. the average number of steps completed in the six- or seven-day period was calculated for each child.
there are no generally recognised guidelines as to how many steps children should take each day, but two common recommendations are that:
(1) boys get at least 13,000 steps each day, and girls at least 11,000 steps (Presidential Council on fitness and sport 2002); or
(2) boys get at least 15,000 steps each day, and girls 12,000 steps (tudor-locke et al. 2002)
table 15 shows the percentage of 5–16 year old children surveyed who met these two sets of guidelines.
Key findings
• in general, children aged 5–16 years took approximately 11,800 steps per day.
• girls were more likely to meet the daily step guidelines than boys (recalling that the cut-offs are less stringent for girls).
• the percentage meeting the daily step guidelines decreased with age, particularly in 14–16 year old girls.
TyPE OF DAy
in the Children’s survey, 386 participants reported their activities on one school day, one weekend day during school time, and one holiday. table 16 shows the difference in total daily energy expenditure, which is also known as “physical activity level” or Pal. Pal is measured in multiples of resting metabolic rate (mEts), the amount of energy a child would use if he or she was to sit still all day. on holidays, children had energy expenditures which were 4–6% lower, and accumulated 13–19 minutes per day less mvPa, and 12–17 minutes per day less vigorous physical activity (vPa) than on school days or weekend days.
TABLE 15: mean number of steps taken per day by boys and girls aged 5–8, 9–13 and 14–16 years1, and the percentage reaching or exceeding recommended thresholds
BOyS GIRLS
AGE (yEARS) 5–8 9–13 14–16 5–8 9–13 14–16
Number of steps 13,815 12,961 10,877 12,086 10,875 9,313
% above threshold 1� 55 46 26 66 49 26
% above threshold �3 32 24 13 50 33 16
1 Population weights applied2 threshold 1 = 13,000 steps for boys, and 11,000 steps for girls (Presidential Council on fitness and sport 2002)3 threshold 2 = 15,000 steps for boys, and 12,000 steps for girls (tudor–locke et al. 2002)

�9
2007 australian national CHildrEn’s nutrition and PHysiCal aCtivity survEy
TABLE 16: Physical activity level (Pal, in multiples of resting metabolic rate, or mEts), moderate to vigorous physical activity (mvPa) and vigorous physical activity (vPa) on school days, weekends in school time, and on holidays. values are shown as means.
SCHOOL DAyS wEEKENDS HOLIDAyS
PAL (METs) 1.68 1.64 1.58
MVPA (minutes/day) 125 131 112
VPA (minutes/day) 50 45 33
note: this is only for 386 children who reported activities on one school day, one weekend day during school term and one holiday. not population weighted.
TIME OF DAy
activity patterns varied in characteristic ways across the day. the patterns were very different at different times on school days and non-school days. figure 2 shows the percentage of boys and girls who were engaged in mvPa at various times on school and non-school days.
Key findings
• on school days, there were strong spikes of mvPa before school, and at recess, lunch and after school.
• on non-school days, activity peaked between about 11am and 5pm, with a decline for lunch.
• there was almost always a greater percentage of active boys than girls.
FIGURE �: the percentage of boys (filled circles) and girls (open circles) who were engaged in mvPa across the course of the day on school days (left panel) and non–school days (right panel).
AGE AND GENDER-RELATED PATTERNS IN SPORT, FREE PLAy AND ACTIVE TRANSPORT
across the ages 9–16 years, there were clear age and gender-related patterns in both the quantity and the type of physical activity adolescents undertook (table 17).
TABLE 17: mean for Pal (mEts) and the mean time children spent participating in moderate to vigorous activity (mvPa minutes per day)1
BOyS GIRLS ALL CHILDREN
AGE GROUP (yEARS) 9–13 14–16 9–16 9–13 14–16 9–16 9–13 14–16 9–16
PAL (METs) 1.76 1.65 1.72 1.64 1.55 1.61 1.70 1.60 1.66
MVPA (minutes/day) 159 116 142 129 83 112 144 100 127
1 Population weights applied

30
2007 australian national CHildrEn’s nutrition and PHysiCal aCtivity survEy
AMOUNT OF PHySICAL ACTIVITy
figure 3 shows age and gender-related trends in mvPa and some of its components (free play, sport and active transport).
Key findings
• girls reported lower levels of mvPa than boys.
• the overall amount of mvPa decreased by about 10 minutes/day with each year of age.
MIx OF ACTIVITIES
the mix of physical activities also varied with age and gender (figure 3).
Key findings
• boys and girls experienced similar amounts of free play (unorganised games such as playground games and “mucking around”) and active transport.
• boys spent more time playing sports (rule-governed games such as basketball or football), and hence accumulated more mvPa.
• the decrease in mvPa with age was mainly the result of a rapid decrease in free play.
• Participation in organised sport peaked around the ages of 11–13, and then declined, while active transport rose and plateaued after the age of 13.
FIGURE 3: age and gender-related patterns in mvPa and some of its components [free play, sport, and active transport (at)]. the filled circles represent boys and the open circles represent girls.

31
2007 australian national CHildrEn’s nutrition and PHysiCal aCtivity survEy
5.3 screen time“screen time” refers to the amount of time children spent watching television including videos and digital versatile disc (dvds), playing computer games on a games console or on personal computers, and using computers for other purposes. screen time was calculated for 9–16 year olds from the marCa self-reports. the total amount of screen time reported each day was added up.
NatioNal Physical activity GuideliNes FOR SCREEN TIME
the National Physical Activity Guidelines recommend that 5–18 year olds accumulate no more than 2 hours of screen time a day for entertainment (i.e. excluding educational purposes) (doHa 2004a, doHa 2004b). in the Children’s survey, we calculated the total amount of out-of-school-hours screen time, assuming that all in-school screen time was for educational purposes. while this way of interpreting the guidelines may miss some non-educational screen time at school, it will also miss some educational screen time out of school (for example, using the internet for homework).
as with physical activity, four criteria may be used to assess observance of the guidelines (olds et al. 2007):
(1) a child meets the guidelines if he or she accumulates no more than 2 hours of screen time on each of the four days sampled (all days method);
(2) a child meets the guidelines if he or she accumulates no more than 2 hours of screen time on most (i.e. three or four) of the four days sampled (most days method);
(3) a child meets the guidelines if he or she accumulate no more than 2 hours of screen time when averaged across the four days sampled (four-day average method); or
(4) the level of observance of the guidelines in the population is the probability that a randomly chosen child on a randomly chosen day will accumulate no more than 2 hours of screen time on that day (Child x day method).
table 18 shows the percentage of children who complied with the screen time guidelines using the four different methods.
Key findings
• levels of observance of screen time guidelines were low.
• few children aged 9–16 years met the guidelines for electronic media use. on any given day, there was only a 33% chance that any given child would get no more than 120 minutes of screen time.
• girls met the guidelines more often than boys; and younger children more often than older children.
TABLE 18: Proportion (%) of children who met the screen time guidelines using four different methods of interpreting the guidelines, Children’s survey, 20071
BOyS GIRLS ALL CHILDREN
Age (years) 9–13 14–16 9–16 9–13 14–16 9–16 9–13 14–16 9–16
All Days Method 5 4 4 10 8 9 7 6 7
Most Days Method 16 10 13 25 23 24 20 17 19
4 d Average Method 19 12 16 28 28 28 24 20 22
Child x Day Method 30 24 28 39 39 39 35 31 33
1 Population weights applied

3�
2007 australian national CHildrEn’s nutrition and PHysiCal aCtivity survEy
TABLE 19: mean number of minutes engaged in screen time, television viewing, video game playing and computer use by age group and gender, Children’s survey, 20071
BOyS GIRLS ALL CHILDREN
Age 9–13 14–16 9–16 9–13 14–16 9–16 9–13 14–16 9–16Screen (minutes/day) 233 272 248 194 205 198 214 239 223
Television (minutes/day) 157 159 158 149 144 147 153 152 153
Video games (minutes/day)
55 60 57 21 15 18 38 38 38
Computer (minutes/day)
21 52 33 24 47 33 22 50 33
1 Population weights applied
AMOUNT OF SCREEN TIME
• boys accumulated about 50 minutes more screen time each day than girls (table 19).
• screen time rose rapidly until around the ages of 13–14, peaking at over 4 hours per day for boys and 3.5 hours per day for girls, and then declined (figure 4).
FIGURE 4: shows age and gender-related patterns in screen time and its components (television, computers and video games). the filled circles represent boys and the open circles represent girls.
VARIABILITy IN SCREEN TIME PATTERNS
like physical activity, screen time patterns varied according to day type (school day, weekend or holiday), time of day, and with age and gender.
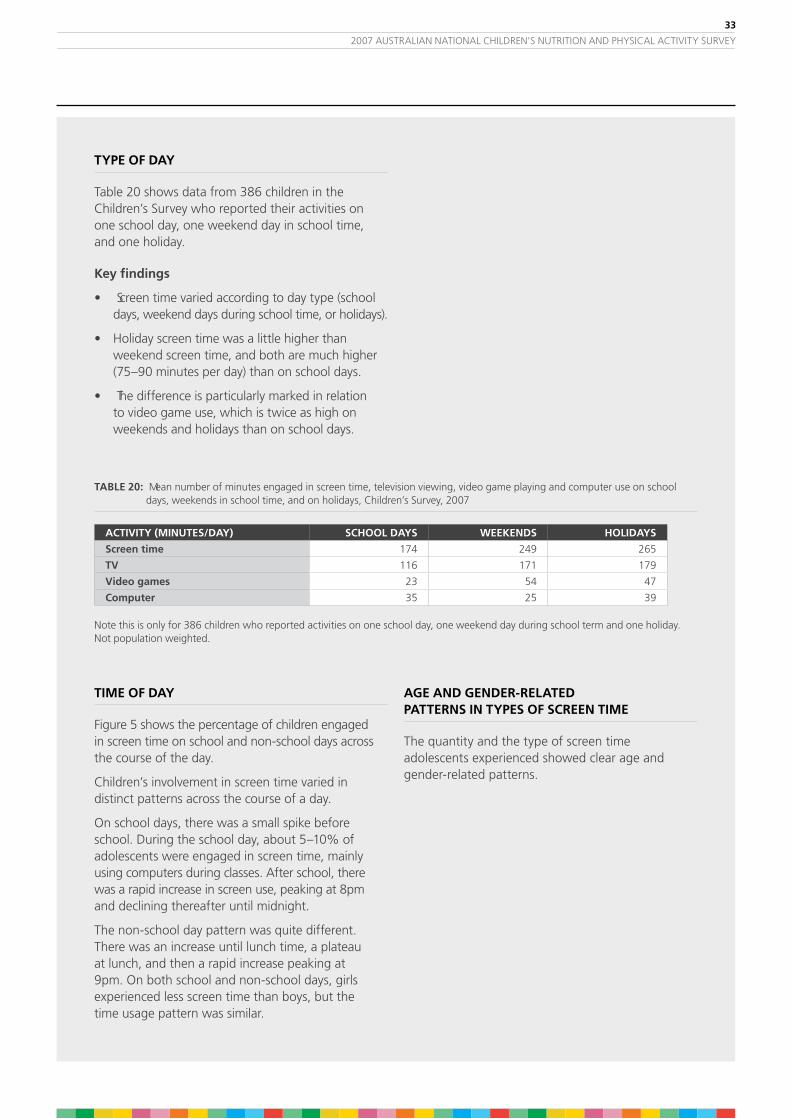
33
2007 australian national CHildrEn’s nutrition and PHysiCal aCtivity survEy
TABLE �0: mean number of minutes engaged in screen time, television viewing, video game playing and computer use on school days, weekends in school time, and on holidays, Children’s survey, 2007
ACTIVITy (MINUTES/DAy) SCHOOL DAyS wEEKENDS HOLIDAyS
Screen time 174 249 265
TV 116 171 179
Video games 23 54 47
Computer 35 25 39
note this is only for 386 children who reported activities on one school day, one weekend day during school term and one holiday. not population weighted.
TIME OF DAy
figure 5 shows the percentage of children engaged in screen time on school and non-school days across the course of the day.
Children’s involvement in screen time varied in distinct patterns across the course of a day.
on school days, there was a small spike before school. during the school day, about 5–10% of adolescents were engaged in screen time, mainly using computers during classes. after school, there was a rapid increase in screen use, peaking at 8pm and declining thereafter until midnight.
the non-school day pattern was quite different. there was an increase until lunch time, a plateau at lunch, and then a rapid increase peaking at 9pm. on both school and non-school days, girls experienced less screen time than boys, but the time usage pattern was similar.
AGE AND GENDER-RELATED PATTERNS IN TyPES OF SCREEN TIME
the quantity and the type of screen time adolescents experienced showed clear age and gender-related patterns.
TyPE OF DAy
table 20 shows data from 386 children in the Children’s survey who reported their activities on one school day, one weekend day in school time, and one holiday.
Key findings
• screen time varied according to day type (school days, weekend days during school time, or holidays).
• Holiday screen time was a little higher than weekend screen time, and both are much higher (75–90 minutes per day) than on school days.
• the difference is particularly marked in relation to video game use, which is twice as high on weekends and holidays than on school days.
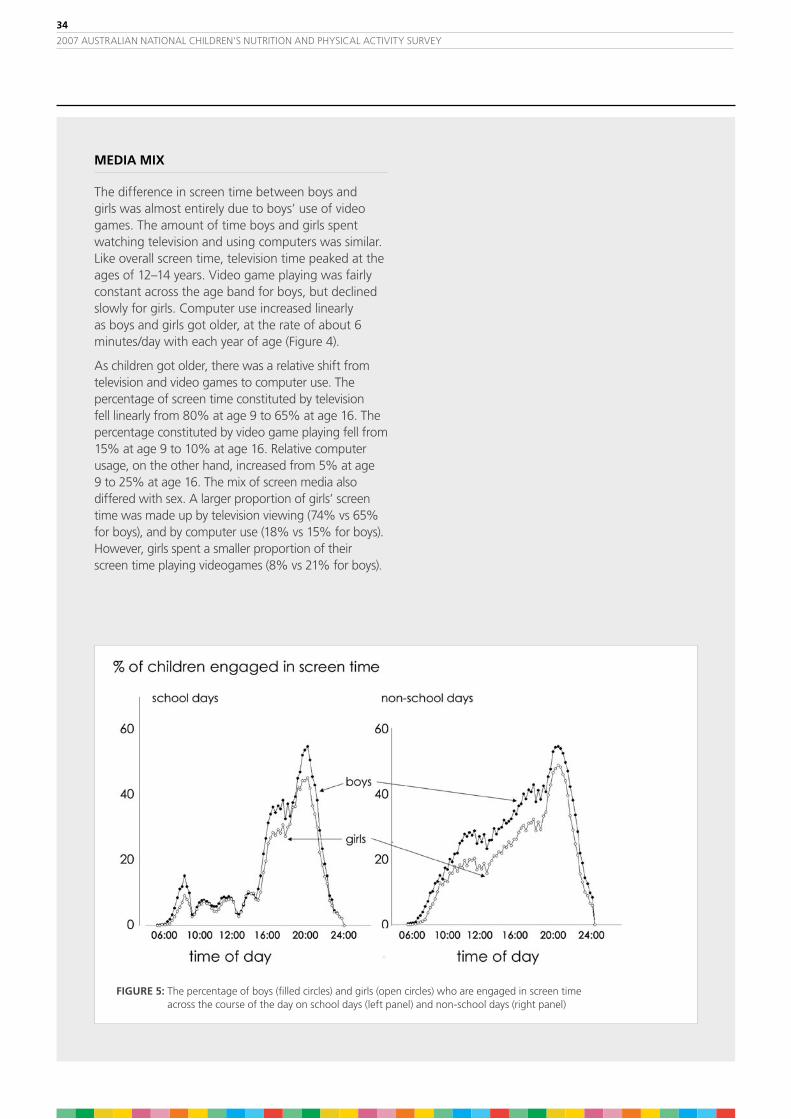
34
2007 australian national CHildrEn’s nutrition and PHysiCal aCtivity survEy
MEDIA MIx
the difference in screen time between boys and girls was almost entirely due to boys’ use of video games. the amount of time boys and girls spent watching television and using computers was similar. like overall screen time, television time peaked at the ages of 12–14 years. video game playing was fairly constant across the age band for boys, but declined slowly for girls. Computer use increased linearly as boys and girls got older, at the rate of about 6 minutes/day with each year of age (figure 4).
as children got older, there was a relative shift from television and video games to computer use. the percentage of screen time constituted by television fell linearly from 80% at age 9 to 65% at age 16. the percentage constituted by video game playing fell from 15% at age 9 to 10% at age 16. relative computer usage, on the other hand, increased from 5% at age 9 to 25% at age 16. the mix of screen media also differed with sex. a larger proportion of girls’ screen time was made up by television viewing (74% vs 65% for boys), and by computer use (18% vs 15% for boys). However, girls spent a smaller proportion of their screen time playing videogames (8% vs 21% for boys).
FIGURE 5: the percentage of boys (filled circles) and girls (open circles) who are engaged in screen time across the course of the day on school days (left panel) and non-school days (right panel)

35
2007 australian national CHildrEn’s nutrition and PHysiCal aCtivity survEy
6.1 body mass indexbody mass index (bmi), which is weight in kilograms divided by the square of height in metres, is the most commonly used index of weight for height in children. it has been widely used as an estimate of fatness.
PREVALENCE OF UNDERwEIGHT, NORMAL wEIGHT, OVERwEIGHT AND OBESITy
table 21 shows the prevalence of overweight and obesity in boys and girls aged 2–16 years using international standard cut-offs to categorise children into one of the following: underweight, normal weight for height, overweight and obese (Cole et al 2007).
Key findings
• across all age groups, about 5% of the children surveyed could be classified as underweight.
• 72% of the children were classified as having a normal weight.
• 17% of the children were classified as overweight.
• 6% of the children were classified as obese.
6. body siZE and sHaPE
TABLE �1:
Proportion (%) of children classified as underweight, normal weight, overweight and obese by age and gender, Children’s survey, 20071
BOyS GIRLS
AGE GROUP (yEARS) �–3 4–8 9–13 14–16 �–16 �–3 4–8 9–13 14–16 �–16
underweight 5 4 6 5 5 4 4 5 5 5
normal 74 78 69 71 73 78 75 65 72 72
overweight 17 13 18 19 17 14 15 23 16 18
obese 4 5 7 6 5 4 6 7 7 6
1 Population weights applied

36
2007 australian national CHildrEn’s nutrition and PHysiCal aCtivity survEy
6.2 waist girthin adults, there are clear associations between abdominal fatness and risk factors for cardiovascular and metabolic disease, independent of overall levels of fatness. abdominal fatness is often assessed by measuring waist girth. some studies have shown that waist girth in children is increasing faster than other girths — that is, children are changing shape as well as getting fatter (dollman & olds, 2006).
there are no generally agreed cut-offs for waist girth, but it has been suggested that abdominal fatness is excessive in school-aged children (and adults) when the ratio of waist girth to height exceeds 50% (ashwell 2005). table 22 shows the percentage of surveyed children in each age group who exceed this cut-off and the mean waist girths for children of different ages.
Key findings
• on average, about one child in six has a waist girth greater than the recommended ratio.
TABLE ��: mean waist girths (cm) and proportion (%) of children with waist girths >50% of height by age and gender, Children’s survey, 20071
BOyS GIRLS
AGE GROUP (yEARS) �–4� 5–8 9–13 14–16 �–4 5–8 9–13 14–16
waist girth (cm) 51.6 57.8 67.7 76.5 51.1 56.6 68.7 73.7
% > 50% na3 16 18 13 na 14 18 13
1 Population weights applied2 note: re use of different age groups as there are no guidelines for those younger than 53 na = not applicable

37
2007 australian national CHildrEn’s nutrition and PHysiCal aCtivity survEy
TABLE �3: mean height (cm) by age and gender1, Children’s survey, 2007
AGE GROUP (yEARS)
� – 3 4 – 8 9 – 13 14 – 16
cm
BOyS
mean 96.5 119.9 150.2 173.1
10%ile 89.2 106.0 135.6 161.2
25%ile 92.7 111.2 142.4 167.6
50%ile 96.5 120.2 149.1 173.9
75%ile 100.4 128.1 157.4 178.9
90%ile 103.3 133.6 165.5 184.1
GIRLS
mean 95.4 119.1 149.7 164.6
10%ile 87.8 105.4 134.6 156.1
25%ile 90.8 110.5 141.6 160.5
50%ile 95.6 118.4 150.1 164.5
75%ile 99.8 127.6 158.2 168.2
90%ile 102.8 133.0 164.0 173.1
TOTALCHILDREN
mean 95.9 119.5 150.0 169.0
10%ile 88.1 105.5 135.2 157.9
25%ile 91.5 110.9 142.0 162.9
50%ile 96.1 119.5 149.7 168.1
75%ile 100.1 127.8 157.9 175.0
90%ile 103.0 133.4 164.6 180.9
1 Population weights applied
6.3 Height and weightthere was an increase in the weight and height measurements with the increase in age groups of the children surveyed, as expected as part of normal physical development.
Key findings
• average height increased from 96.5 cm for 2–3 year olds to 173.1 cm for 14–16 years for boys and from 95.4 cm to 164.6 cm for the same age groups for girls (table 23).
• average weight increased with age from 15.8 kg for 2–3 year olds to 65.1 kg for 14–16 years for boys and from 15.1 kg to 60.2 kg for the same age groups for girls (table 24).

38
2007 australian national CHildrEn’s nutrition and PHysiCal aCtivity survEy
TABLE �4: mean weight (kg) by age and gender1, Children’s survey, 2007
AGE GROUP (yEARS)
� – 3 4 – 8 9 – 13 14 – 16
kg
BOyS
mean 15.8 24.3 44.0 65.1
10%ile 13.1 17.6 30.1 49.2
25%ile 14.2 19.8 34.7 56.3
50%ile 15.7 23.3 41.8 63.7
75%ile 17.1 27.3 51.2 72.3
90%ile 18.5 31.4 60.1 82.9
GIRLS
mean 15.2 23.9 45.4 60.2
10%ile 12.5 17.4 30.1 47.6
25%ile 13.5 19.2 35.0 52.7
50%ile 14.9 22.4 43.8 58.0
75%ile 16.6 26.7 52.8 65.6
90%ile 18.0 32.1 61.9 73.9
TOTALCHILDREN
mean 15.5 24.1 44.7 62.7
10%ile 12.7 17.5 30.1 48.2
25%ile 13.8 19.5 34.9 53.9
50%ile 15.3 22.8 42.5 60.6
75%ile 16.8 27.1 52.1 69.3
90%ile 18.2 31.9 61.2 79.9
1 Population weights applied

39
2007 australian national CHildrEn’s nutrition and PHysiCal aCtivity survEy
7. linKing nutrition, aCtivity, and body siZE
The Children’s Survey was designed to measure both energy intake and energy expenditure in the same individual and in most cases on at least one common day. whilst it is recognized that energy intake and expenditure are both short term measures, this survey allows us to look at associations between these energy measures and weight or body size.
Children’s weight and body size is a result of a lifetime’s balance or in some cases, an imbalance, of energy intake (energy from food) compared to energy output (expenditure or activity). thus the short-term measures of intake and activity over 1–4 days may not necessarily have any relationship to the longer term measure of weight or body size. nevertheless it is of interest to note if there are any differences in intake and expenditure according to weight status.
PHySICAL ACTIVITy LEVEL (PAL) AND wEIGHT STATUS
the Pals of children of normal weight may provide useful information of the levels of physical activity compatible with sustaining a healthy weight. the nrvs quoted a Pal above 1.75 to be compatible with a healthy lifestyle for adults, but its relevance for adolescence and young children is uncertain.
Key findings
• underweight and obese children tended to have lower Pals than those children of normal weight (table 25).
Table �5: mean Pal for underweight, normal weight, overweight and obese boys and girls aged 9–13 years and 14–16 years1,2 Children’s survey, 2007
BOyS GIRLS
Age group (years) 9–13 14–16 9–13 14–16
Underweight 1.67 1.58 1.59 1.52
Normal weight 1.78 1.66 1.65 1.56
Overweight 1.75 1.65 1.67 1.56
Obese 1.66 1.55 1.53 1.49
1 using international obesity task force cut-offs (Cole et al 2007)2 Population weights applied

40
2007 australian national CHildrEn’s nutrition and PHysiCal aCtivity survEy
PHySICAL ACTIVITy LEVEL (PAL) AND ENERGy INTAKE
it might be expected that the more active children, ie those with a higher Pal or higher energy expenditure might also have a higher energy intake. there is no clear guideline on what is classified as low, medium or high Pal for children but for the purposes of this initial analyses, a low Pal was defined as < 1.5 and a high Pal was ≥ 2.
However, the actual number of children who had a Pal ≥ 2 was quite small and it would be expected that intakes and activity would be quite variable over individual days and therefore energy intake and energy expenditure would not always balance.
Key findings
• there was no clear association between reported energy intake and level of physical activity (table 26).
TABLE �6: Energy intake (total kJ, including energy from fermentable fibre) by physical activity level (Pal) for children aged 9–16 years,1 Children’s survey, 2007
BOyS GIRLS
Age group 9–13 years 14–16 years 9–13 years 14–16 years
Low PAL� 9630 11802 8493 8256
Moderate PAL3 9752 11501 8284 9025
High PAL4,5 10430 14009 8035 8541
1 Population weights applied 2 Pal < 1.5 3. Pal 1.5–1.994 Pal ≥ 2 5 limited numbers

41
2007 australian national CHildrEn’s nutrition and PHysiCal aCtivity survEy
TABLE �7: mean energy intake (total kJ, including energy from fermentable fibre) by weight status1 for all children2 in the Children’s survey, 2007
AGE GROUP (yEARS)
� – 3 4 – 8 9 – 13 14 – 16 all ages
BOyS
underweight 6224.1 6529.8 8822.6 11448.1 8382.9
normal 6323.8 7810.4 9986.5 12034.7 9157.3
overweight 6308.3 7674.6 9934.6 11904.7 9336.6
obese 5669.1 7784.0 9008.6 9181.5 8389.0
GIRLS
underweight 5419.5 6577.9 9293.6 9109.5 8018.9
normal 5996.5 7132.9 8348.2 8817.5 7694.0
overweight 6125.5 6855.8 8248.0 8030.5 7592.6
obese 7149.3 6467.5 7825.6 7435.3 7266.5
TOTAL CHILDREN
underweight 5910.5 6554.2 9028.8 10305.0 8214.6
normal 6156.2 7486.6 9208.7 10449.7 8448.6
overweight 6225.5 7245.5 9017.8 10163.6 8451.1
obese 6437.4 7104.4 8405.3 8244.7 7807.0
1 using international obesity task force cut–offs (Cole et al 2007)2 Population weights applied
wEIGHT STATUS AND ENERGy INTAKE
Energy intakes may vary with weight status. However the mean intakes of energy estimated from one day’s intake (CaPi) should not be interpreted as causing children to be either under or overweight. it has been reported that there is a higher probability that overweight individuals underreport energy intakes compared to normal weight individuals.
Key findings
• obese children tended to report lower energy intakes than those children of normal weight (table 27).

4�
2007 australian national CHildrEn’s nutrition and PHysiCal aCtivity survEy
8. ConClusion
The results of the �007 Australian National Children’s Nutrition and Physical Activity Survey provide a snapshot of key health indicators of Australian children, namely nutrient intakes, body measurements and physical activity levels.
notwithstanding australia having a world class food supply producing an abundance of wholesome food, some children’s intake of fruit, vegetables, cereal and dairy products is below dietary recommendations.
in addition, despite australians being proud of their achievements as an international sporting nation, the survey highlighted concerns around older children’s physical activity levels.
the net result is that significant levels of micronutrient deficiency were detected in the children and the levels of underweight, overweight and obesity are a concern. both need to be addressed given their association with poor health outcomes.
the report demonstrates the importance of collecting up-to-date comprehensive food intake and activity data to establish a sound evidence base for the development and evaluation of government policies and industry innovation.
the outcomes of the survey provide a platform for collaborative action by the Commonwealth and state and territory governments, the food industry and nutrition and physical activity experts to promote a healthier lifestyle by improving children’s food intake and encouraging increased physical activity participation.
43
2007 australian national CHildrEn’s nutrition and PHysiCal aCtivity survEy
ashwell, m (2005), ‘waist to height ratio and the ashwell® shape chart could predict the health risks of obesity in adults and children in all ethnic groups’, Nutrition & Food Science, vol. 35, no. 5, pp. 359–364.
australian bureau of statistics (abs), 2006 Census of Population and Housing Australia (Australia), cat. no. 2068.0 – 2006 Census tables, viewed 11 June 2008, <www.abs.gov.au>.
australian bureau of statistics (abs) (2003), Household Telephone Connections, Queensland, cat. no. 8159.3, abs, Canberra.
australian bureau of statistics (abs) (1998), National Nutrition Survey Nutrient Intakes and Physical Measurements Australia 1995, cat. no. 4805.0, abs, Canberra.
australian Communications and media authority (aCma) (2008), Telecommunications Today, Report 5: Consumer choice and preference in adopting services, Commonwealth of australia.
Cole, tJ, flegal, Km, nicholls, df, et al. (2007), ‘body mass index cut-offs to define thinness in children and adolescents’ [published online ahead of print Jun 25, 2007], British Medical Journal, 335:194. doi:10.1136/bmj.39238.39444.55.
department of Community services and Health (1988), National dietary survey of schoolchildren (10–15 years): 1985 No. 1 Foods consumed, agPs, Canberra.
department of Community services and Health (1989), National dietary survey of schoolchildren (10–15 years): 1985 No. 2 Nutrient Intakes, agPs, Canberra.
department of Health and ageing (doHa) (2004a), Australia’s Physical Activity Recommendations for 5–12 year olds, Commonwealth of australia.
department of Health and ageing (doHa) (2004b), Australia’s Physical Activity Recommendations for 12–18 year olds, Commonwealth of australia.
department of Health and ageing (2008), National Children’s Nutrition and Physical Activity Survey User Guide 2007, agPs, Canberra.
dollman, J, norton, K & norton, l (2005), ‘Evidence for secular trends in children’s physical activity behaviour’, British Journal of Sports Medicine, vol. 39, pp. 892–897.
dollman, J & olds, ts (2006), ‘secular changes in fatness and fat distribution in australian children matched for body size’, International Journal of Pediatric Obesity, vol. 1, no. 2, pp. 109–113.
goldberg, gr, et. al., (1991) ‘Critical evaluation of energy intake data using fundamental principles of energy physiology: 1. derivation of cut-off limits to identify under-recording’. European Journal of Clinical Nutrition vol. 55, pp. 569–581.
mackerras, d & rutishauser, i (2005), ’24-Hour national dietary survey data: how do we interpret them most effectively?’, Public Health Nutrition, vol. 8, no. 6, pp. 657–665.
ministry of Health (moH) (2003), NZ Food: NZ Children. Key results of the 2002 National Nutrition Survey. wellington: ministry of Health.
national Health and medical research Council (nHmrC) (2003), Food for Health, Dietary Guidelines for children and adolescents in Australia. Canberra: Commonwealth of australia.
national Health and medical research Council (nHmrC) (2006), Nutrient Reference Values for Australia and New Zealand, agPs Canberra, viewed 10 June 2008, <www.nhmrc.gov.au>.
9. rEfErEnCEs

44
2007 australian national CHildrEn’s nutrition and PHysiCal aCtivity survEy
olds, t, ridley, K, wake, m, Hesketh, K, waters, E, Patton, g. & williams, J (2007), ‘How should activity guidelines for young people be operationalised?’, International Journal of Behavioral Nutrition and Physical Activity, 4: 43 doi:10.1186/1479–5868–4–4.
President’s Council on Physical fitness and sports (2002), The Presidential Active Lifestyle Award (PALA), washington, dC: PCPfs.
ridley, K, & olds, t (2008), ‘assigning energy costs to activities in children: a review and synthesis’, Medicine and Science in Sports and Exercise (accepted for publication).
ridley, K, olds, t, & Hill, a (2006), ‘the multimedia activity recall for Children and adolescents (marCa): development and evaluation’, International Journal of Behavioral Nutrition and Physical Activity, 3:10 doi:10.1186/1479–5868–3–10.
smith, a, Kellett, E, schmerlaib, y (1998), Australian Guide to Healthy Eating. Canberra: department of Health and family services, viewed 11 June 2008, <www.health.gov.au>.
tudor-locke, C, Pangrazi, rP, Corbin, CP, rutherford, wJ, vincent, sd, raustorp, a, tomson, lm, & Cuddihy, tf (2004), ‘bmi-referenced standards for recommended pedometer-determined steps/day for children’, Preventive Medicine, vol. 38, no. 6, pp. 857–864.

45
2007 australian national CHildrEn’s nutrition and PHysiCal aCtivity survEy