2 - 1 copyright © 2001 by harcourt, inc.all rights reserved. balance sheet income statement...
TRANSCRIPT
2 - 1
Copyright © 2001 by Harcourt, Inc. All rights reserved.
Balance sheetIncome statementStatement of cash flowsAccounting income vs. cash flowMVA and EVAPersonal taxesCorporate taxes
CHAPTER 2Accounting and Finance

2 - 2
Copyright © 2001 by Harcourt, Inc. All rights reserved.
Balance Sheet: Assets
Cash 7,282 57,600AR 632,160 351,200Inventories 1,287,360 715,200 Total CA 1,926,802 1,124,000Gross FA 1,202,950 491,000Less: Deprec. 263,160 146,200 Net FA 939,790 344,800Total Assets 2,866,592 1,468,800
2000 1999
2 - 3
Copyright © 2001 by Harcourt, Inc. All rights reserved.
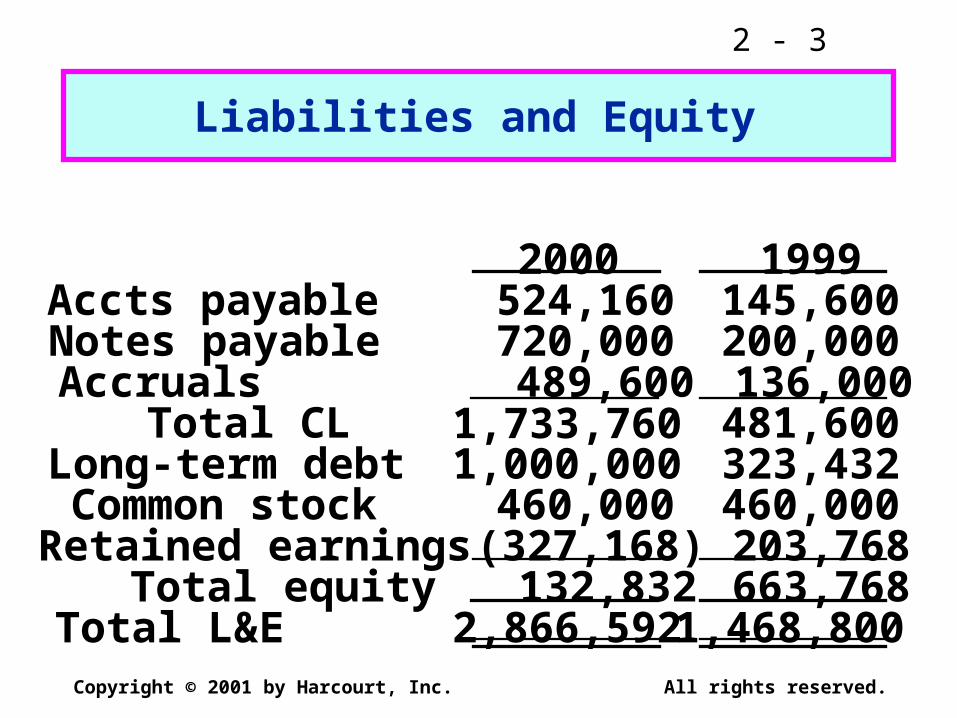
Liabilities and Equity
2000 1999Accts payable 524,160 145,600Notes payable 720,000 200,000Accruals 489,600 136,000 Total CL 1,733,760 481,600Long-term debt 1,000,000 323,432Common stock 460,000 460,000Retained earnings (327,168) 203,768 Total equity 132,832 663,768Total L&E 2,866,592 1,468,800
2 - 4
Copyright © 2001 by Harcourt, Inc. All rights reserved.
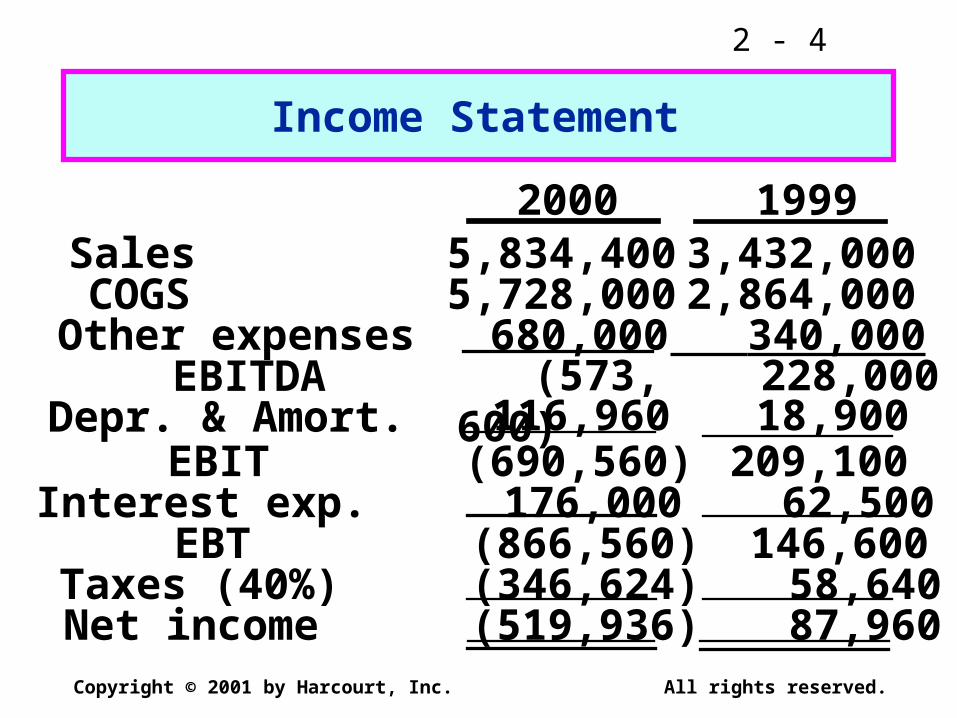
Income Statement
Sales 5,834,400 3,432,000COGS 5,728,000 2,864,000Other expenses 680,000 340,000 EBITDA (573,600) 228,000Depr. & Amort. 116,960 18,900 EBIT (690,560) 209,100Interest exp. 176,000 62,500 EBT (866,560) 146,600Taxes (40%) (346,624) 58,640Net income (519,936) 87,960
2000 1999
2 - 5
Copyright © 2001 by Harcourt, Inc. All rights reserved.
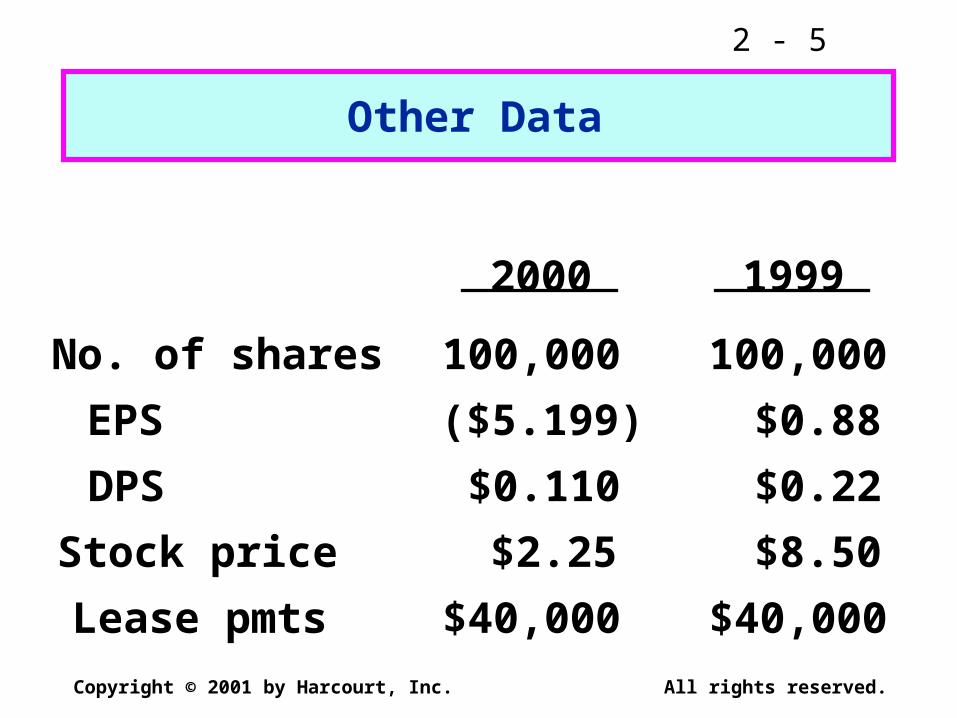
Other Data
No. of shares 100,000 100,000
EPS ($5.199) $0.88
DPS $0.110 $0.22
Stock price $2.25 $8.50
Lease pmts $40,000 $40,000
2000 1999
2 - 6
Copyright © 2001 by Harcourt, Inc. All rights reserved.
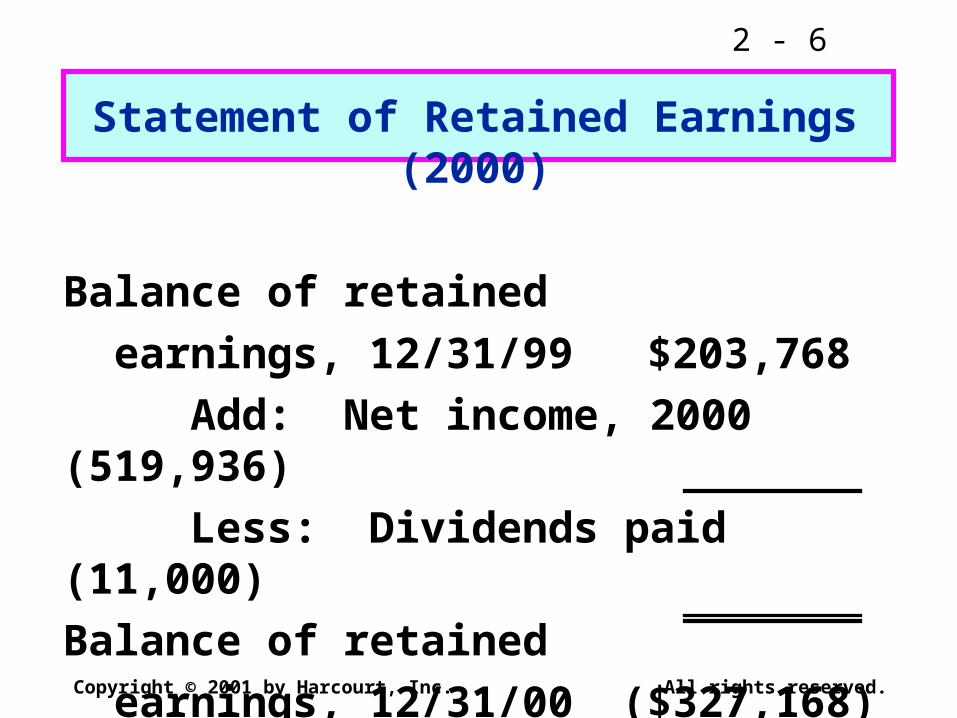
Statement of Retained Earnings (2000)
Balance of retained
earnings, 12/31/99 $203,768
Add: Net income, 2000 (519,936)
Less: Dividends paid (11,000)
Balance of retained
earnings, 12/31/00 ($327,168)
2 - 7
Copyright © 2001 by Harcourt, Inc. All rights reserved.
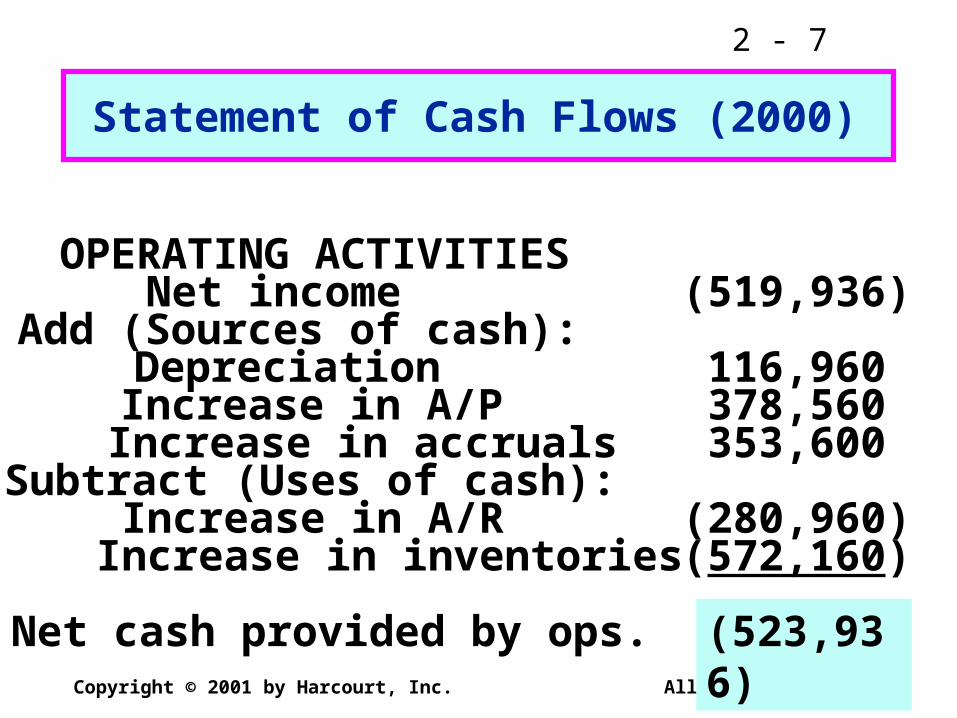
(523,936)
Statement of Cash Flows (2000)
OPERATING ACTIVITIES Net income (519,936)Add (Sources of cash): Depreciation 116,960 Increase in A/P 378,560 Increase in accruals 353,600Subtract (Uses of cash): Increase in A/R (280,960) Increase in inventories (572,160)
Net cash provided by ops.

2 - 8
Copyright © 2001 by Harcourt, Inc. All rights reserved.
L-T INVESTING ACTIVITIES Investment in fixed assets (711,950)
FINANCING ACTIVITIES Increase in notes payable 520,000 Increase in long-term debt 676,568 Payment of cash dividends (11,000) Net cash from financing 1,185,568
NET CHANGE IN CASH (50,318)
Plus: Cash at beginning of year 57,600Cash at end of year 7,282

2 - 9
Copyright © 2001 by Harcourt, Inc. All rights reserved.
Net cash from operations = -$523,936, mainly because of negative NI.
The firm borrowed $1,185,568 to meet its cash requirements.
Even after borrowing, the cash account fell by $50,318.
What can you conclude about D’Leon’s financial condition from its
statement of CFs?

2 - 10
Copyright © 2001 by Harcourt, Inc. All rights reserved.
Did the expansion create additional net operating profit after taxes
(NOPAT)?
NOPAT = EBIT(1 – Tax rate)
NOPAT00 = -$690,560(1 – 0.4)
= -$690,560(0.6)= -$414,336.
NOPAT99 = $125,460.

2 - 11
Copyright © 2001 by Harcourt, Inc. All rights reserved.
What effect did the expansion have onnet operating working capital
(NOWC)?
NOWC = –Currentassets
Non-interestbearing CL
NOWC00 = ($7,282 + $632,160 + $1,287,360)
– ($524,160 + $489,600)= $913,042.
NOWC99 = $842,400.
2 - 12
Copyright © 2001 by Harcourt, Inc. All rights reserved.
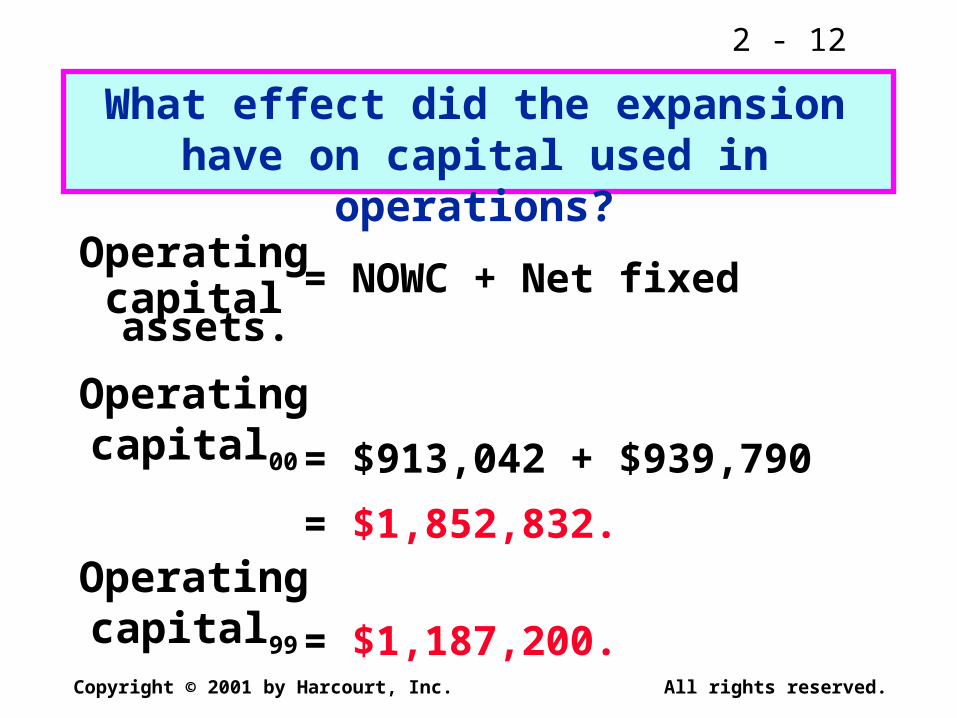
What effect did the expansion have on capital used in operations?
Operatingcapital = NOWC + Net fixed assets.
= $913,042 + $939,790
= $1,852,832.
= $1,187,200.
Operatingcapital00
Operatingcapital99

2 - 13
Copyright © 2001 by Harcourt, Inc. All rights reserved.
What is your initial assessment of the expansion’s effect on operations?
2000 1999
Sales $5,834,400 $3,432,000
NOPAT ($414,336) $125,460
NOWC $913,042 $842,400
Operating capital $1,852,832 $1,187,200
Net Income ($519,936) $87,960

2 - 14
Copyright © 2001 by Harcourt, Inc. All rights reserved.
What effect did the company’s expansion have on its net cash flow
and operating cash flow?
NCF00 = NI + DEP = ($519,936) + $116,960= ($402,976).
NCF99 = $87,960 + $18,900 = $106,860.OCF00 = NOPAT + DEP
= ($414,336) + $116,960= ($297,376).
OCF99 = $125,460 + $18,900= $144,360.

2 - 15
Copyright © 2001 by Harcourt, Inc. All rights reserved.
What was the free cash flow (FCF) for 2000?
FCF = NOPAT – Net capital investment
= -$414,336 – ($1,852,832 – $1,187,200)
= -$414,336 – $665,632
= -$1,079,968.
Is negative free cash flow always a bad
sign?
2 - 16
Copyright © 2001 by Harcourt, Inc. All rights reserved.
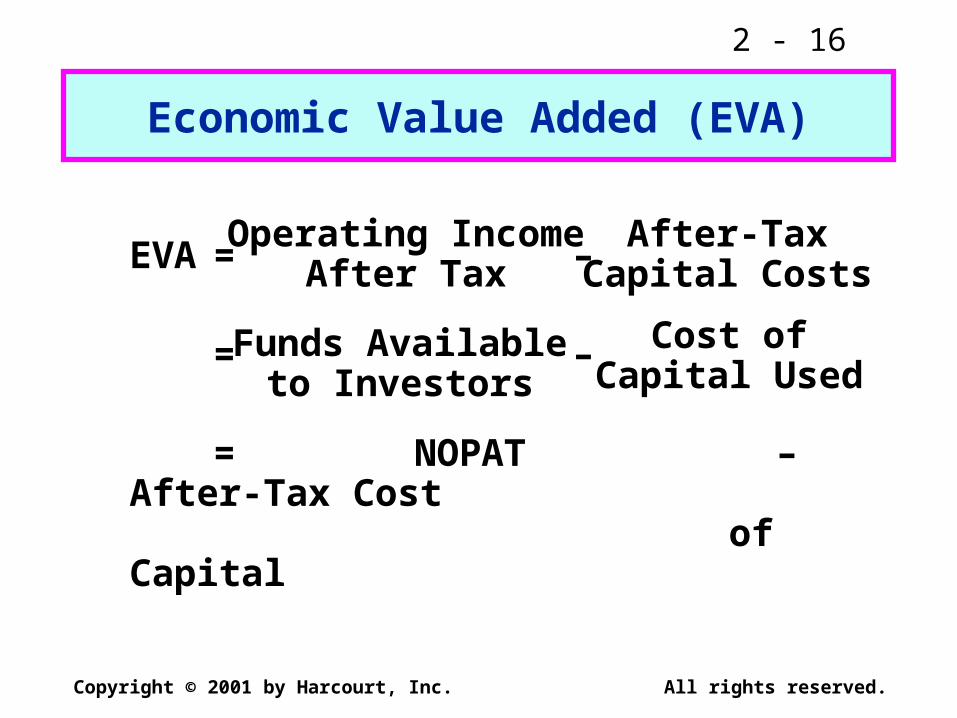
Economic Value Added (EVA)
EVA = –
= –
= NOPAT – After-Tax Cost of Capital
Operating IncomeAfter Tax
After-TaxCapital Costs
Funds Availableto Investors
Cost ofCapital Used

2 - 17
Copyright © 2001 by Harcourt, Inc. All rights reserved.
In order to generate positive EVA, a firm has to more than just cover operating costs. It must also provide a return to those who have provided the firm with capital.
EVA takes into account the total cost of capital, which includes the cost of equity.
EVA Concepts

2 - 18
Copyright © 2001 by Harcourt, Inc. All rights reserved.
What is the company’s EVA?Assume the firm’s after-tax cost of
capital was 11% in 1999 and 13% in 2000.
EVA00 = NOPAT – (A-T cost of capital)(Capital)= -$414,336 – (0.13)($1,852,832)= -$414,336 – $240,868= -$655,204.
EVA99 = $125,460 – (0.11)($1,187,200)= $125,460 – $130,592= -$5,132.

2 - 19
Copyright © 2001 by Harcourt, Inc. All rights reserved.
Would you conclude that the expansion increased or
decreased MVA?
MVA = – Market value
of equityEquity capital
supplied
During the last year stock price has decreased 73%, so market value of equity has declined. Consequently, MVA has declined.

2 - 20
Copyright © 2001 by Harcourt, Inc. All rights reserved.
Company Market Value AddedMicrosoft $328,257 millionGeneral Electric $285,320 millionIntel $166,902 millionWal-Mart Stores $159,444 millionCoca-Cola $157,536 millionMerck $153,170 millionPfizer $148,245 millionCisco Systems $135,650 millionLucent Technologies $127,265 millionBristol-Myers Squibb $119,350 million
Leading Creators of Wealth in the U. S.Market Value Added in 1999
2 - 21
Copyright © 2001 by Harcourt, Inc. All rights reserved.
Probably not.
A/P increased 260% over the past year, while sales increased by only 70%.
If this continues, suppliers may cut off D’Leon’s trade credit.
Does D’Leon pay its suppliers on time?
2 - 22
Copyright © 2001 by Harcourt, Inc. All rights reserved.
No, the negative NOPAT and decline in cash position shows that D’Leon is spending more on its operations than it is taking in.
Does it appear that D’Leon’s sales price exceeds its cost per unit sold?

2 - 23
Copyright © 2001 by Harcourt, Inc. All rights reserved.
1. The company offers 60-day credit terms. The improved terms are matched by its competitors, so sales remain constant.
What effect would each of these actions have on D’Leon’s cash
account?
A/R would Cash would
2 - 24
Copyright © 2001 by Harcourt, Inc. All rights reserved.
2. Sales double as a result of thechange in credit terms.
Short run: Inventory and fixed assets to meet increased sales. A/R , Cash . Company may have to seek additional financing.
Long-run: Collections increase and the company’s cash position would improve.

2 - 25
Copyright © 2001 by Harcourt, Inc. All rights reserved.
D’Leon financed its expansion with external capital.
D’Leon issued long-term debt which reduced its financial strength and flexibility.
How did D’Leon finance its expansion?

2 - 26
Copyright © 2001 by Harcourt, Inc. All rights reserved.
Would D’Leon have required external capital if they had broken even in
2000 (Net Income = 0)?
YES, the company would still have to finance its increase in assets.

2 - 27
Copyright © 2001 by Harcourt, Inc. All rights reserved.
No effect on physical assets.Fixed assets on balance sheet
would decline.Net income would decline.Tax payments would decline.Cash position would improve.
What happens if D’Leon depreciates its fixed assets over 7 years (as opposed
to the current 10 years)?

2 - 28
Copyright © 2001 by Harcourt, Inc. All rights reserved.
Other policies that affect financial statements
Inventory valuation methods.
Capitalization of R&D expenses.
Policies for funding the company’s retirement plan.
2 - 29
Copyright © 2001 by Harcourt, Inc. All rights reserved.
Does the company’s positive stock price ($2.25), in the face of large
losses, suggest that investors are irrational?
NO, it means that investors expect things to get better in the future.

2 - 30
Copyright © 2001 by Harcourt, Inc. All rights reserved.
Why did the stock fall after the dividend was cut?
Management was “signaling” that the firm’s operations were in trouble.
The dividend cut lowered expectations for future cash flows, which caused the stock price to decline.
2 - 31
Copyright © 2001 by Harcourt, Inc. All rights reserved.
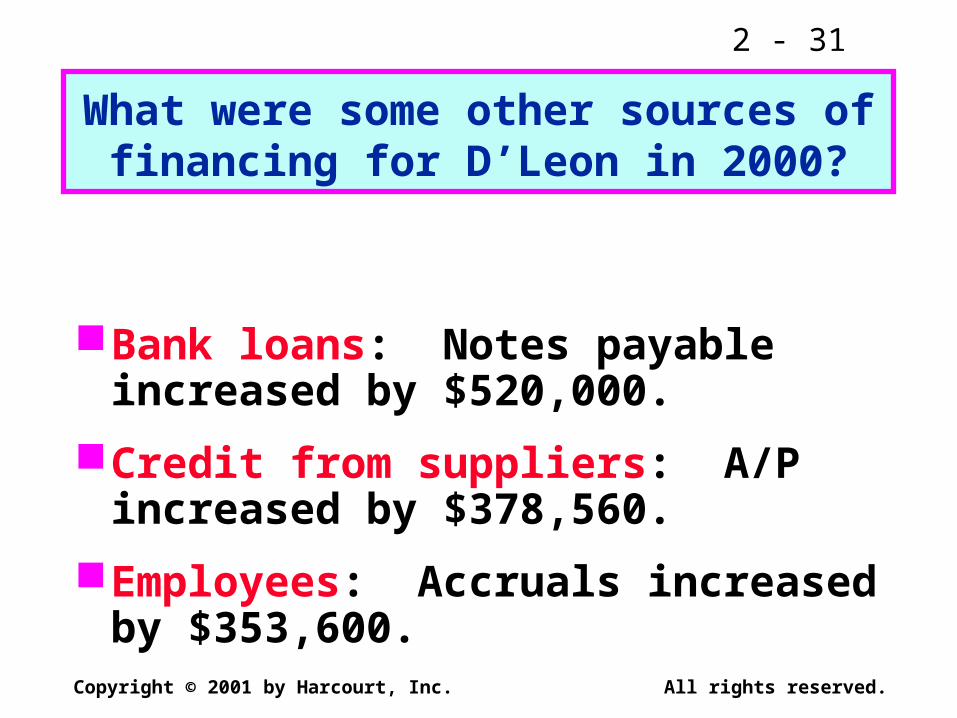
What were some other sources of financing for D’Leon in 2000?
Bank loans: Notes payable increased by $520,000.
Credit from suppliers: A/P increased by $378,560.
Employees: Accruals increased by $353,600.
2 - 32
Copyright © 2001 by Harcourt, Inc. All rights reserved.
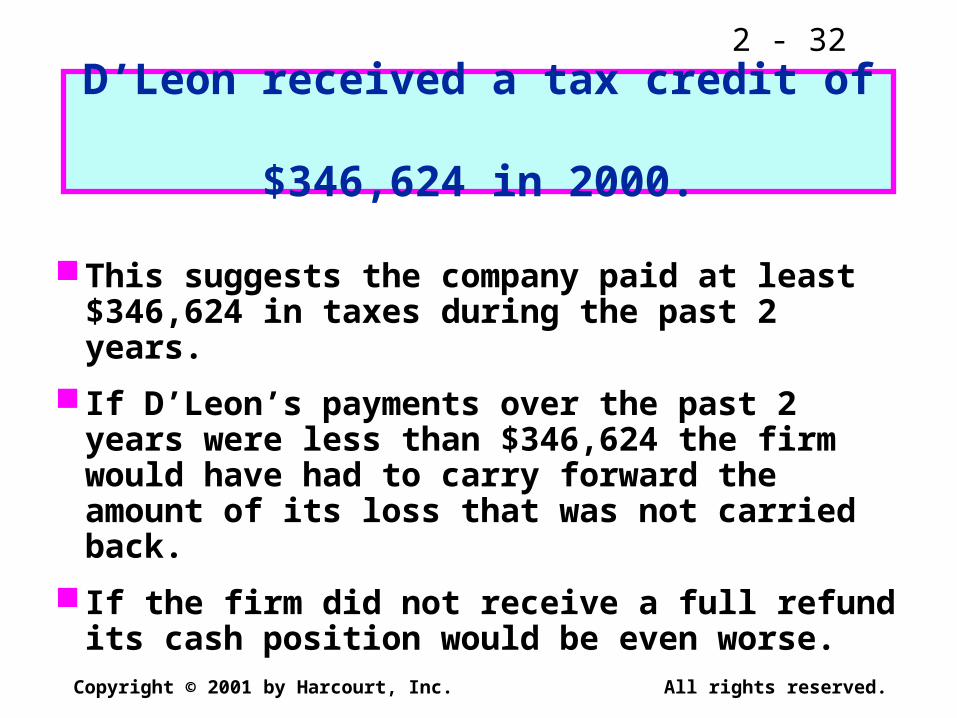
D’Leon received a tax credit of $346,624 in 2000.
This suggests the company paid at least $346,624 in taxes during the past 2 years.
If D’Leon’s payments over the past 2 years were less than $346,624 the firm would have had to carry forward the amount of its loss that was not carried back.
If the firm did not receive a full refund its cash position would be even worse.

2 - 33
Copyright © 2001 by Harcourt, Inc. All rights reserved.
INCOME TAXES

2 - 34
Copyright © 2001 by Harcourt, Inc. All rights reserved.
April 2000 Single Individual Tax Rates
Taxable Income Tax on Base Rate*
0 - 25,750 0 15%25,750 - 62,450 3,862.50 28%62,450 - 130,250 14,138.50 31%130,250 - 283,150 35,156.50 36%Over 283,150 90,200.50 39.6%
*Plus this percentage on the amount over the bracket base.

2 - 35
Copyright © 2001 by Harcourt, Inc. All rights reserved.
Assume your salary is $45,000, and you received $3,000 in dividends. You are single, so your personal exemption is $2,750 and your itemized deductions are $4,850.
On the basis of the information above and the April 2000 tax rate schedule, what is your tax liability?
2 - 36
Copyright © 2001 by Harcourt, Inc. All rights reserved.
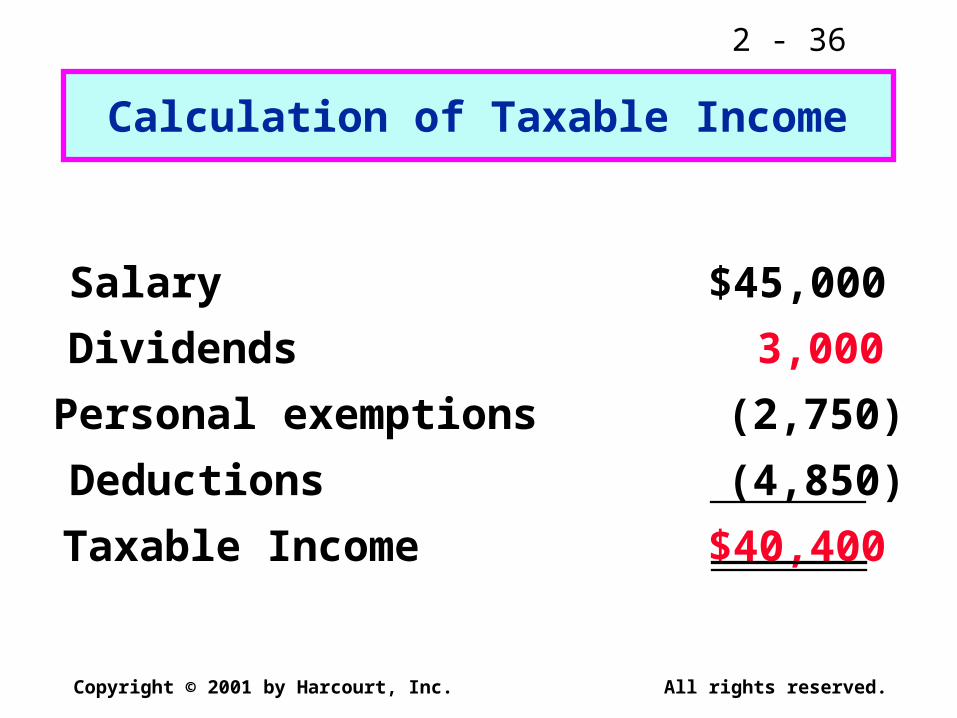
Calculation of Taxable Income
Salary $45,000
Dividends 3,000
Personal exemptions (2,750)
Deductions (4,850)
Taxable Income $40,400
2 - 37
Copyright © 2001 by Harcourt, Inc. All rights reserved.
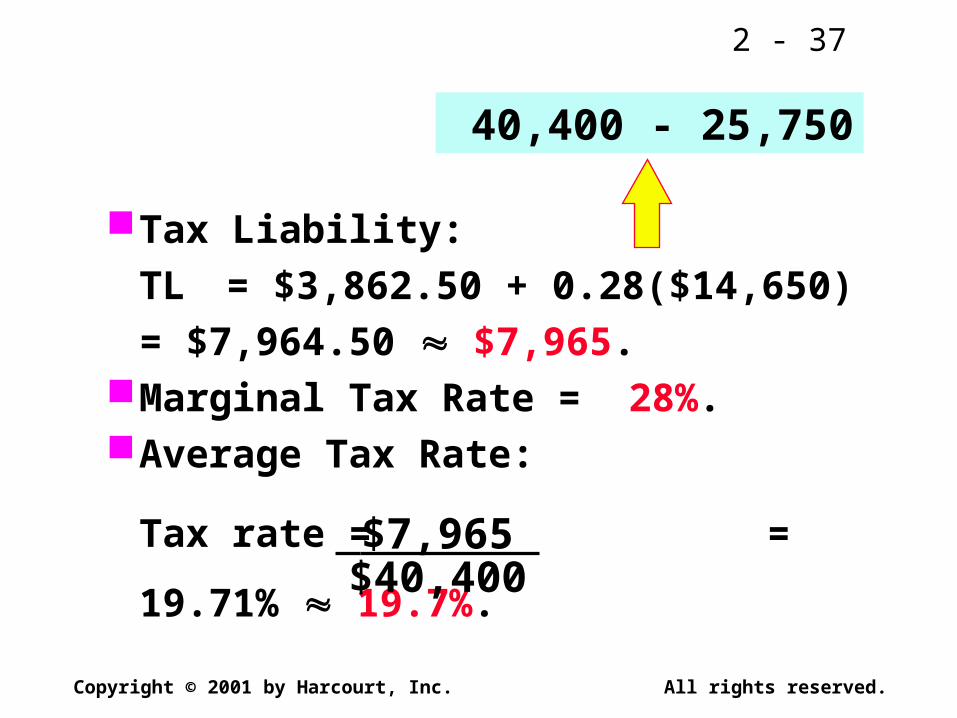
Tax Liability:
TL = $3,862.50 + 0.28($14,650)
= $7,964.50 $7,965.Marginal Tax Rate = 28%.Average Tax Rate:
Tax rate = = 19.71% 19.7%.
40,400 - 25,750
$7,965 $40,400

2 - 38
Copyright © 2001 by Harcourt, Inc. All rights reserved.
January 2000 Corporate Tax Rates
Taxable Income Tax on Base Rate*
0 - 50,000 0 15%50,000 - 75,000 7,500 25%75,000 - 100,000 13,750 34%100,000 - 335,000 22,250 39%
Over 18.3M 6.4M 35%
*Plus this percentage on the amount over the bracket base.
... ... ...
2 - 39
Copyright © 2001 by Harcourt, Inc. All rights reserved.
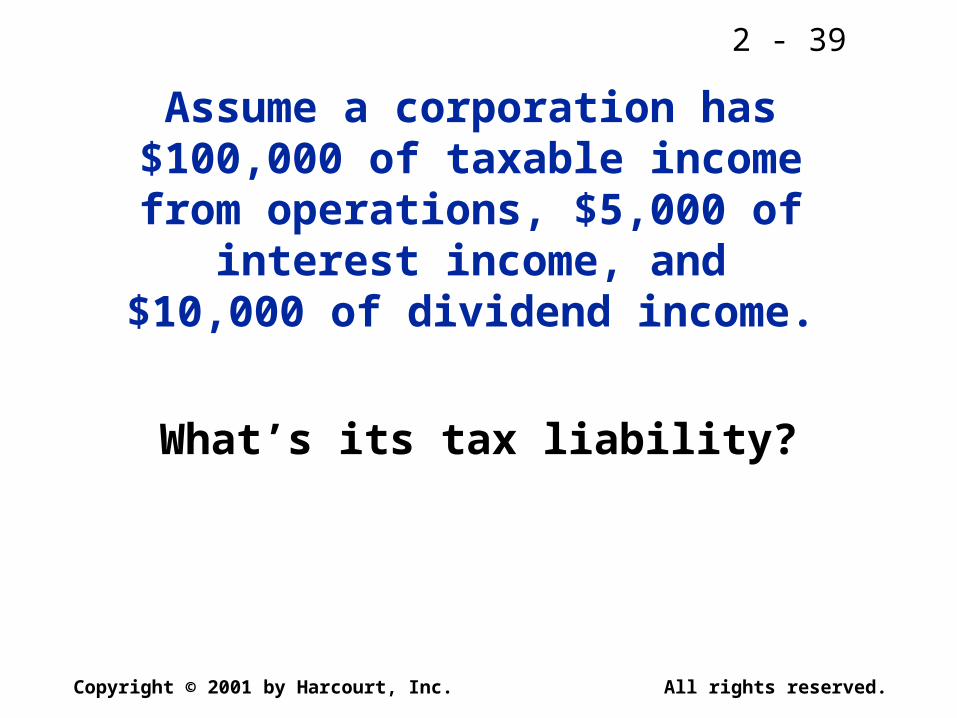
Assume a corporation has $100,000 of taxable income from
operations, $5,000 of interest income, and $10,000 of dividend
income.
What’s its tax liability?
2 - 40
Copyright © 2001 by Harcourt, Inc. All rights reserved.
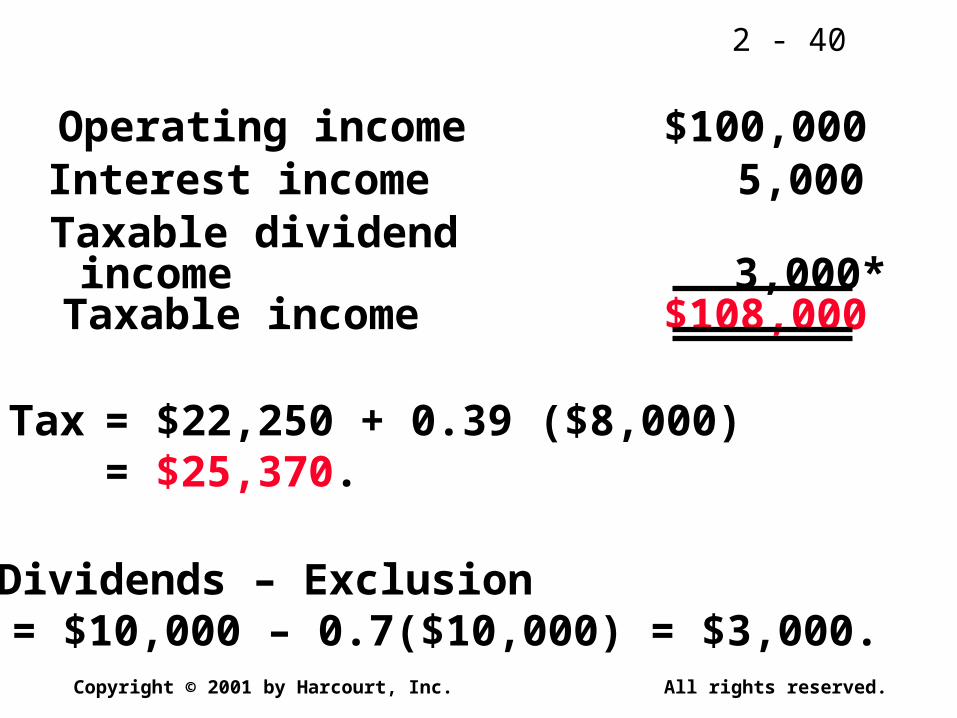
Operating income $100,000Interest income 5,000Taxable dividendincome 3,000*Taxable income $108,000
Tax = $22,250 + 0.39 ($8,000)= $25,370.
*Dividends – Exclusion = $10,000 – 0.7($10,000) = $3,000.
2 - 41
Copyright © 2001 by Harcourt, Inc. All rights reserved.
State and local government bonds (munis) are generally exempt from federal taxes.
Taxable vs. Tax-Exempt Bonds

2 - 42
Copyright © 2001 by Harcourt, Inc. All rights reserved.
Exxon bonds at 10% vs. California muni bonds at 7%.
T = Tax rate = 28%.After-tax interest income:
Exxon = 0.10($5,000) – 0.10($5,000)(0.28)
= 0.10($5,000)(0.72) = $360.
CAL = 0.07($5,000) – 0 = $350.

2 - 43
Copyright © 2001 by Harcourt, Inc. All rights reserved.
Solve for T in this equation:
Muni yield = Corp Yield(1 – T)
7.00% = 10.0%(1 – T)
T = 30.0%.
At what tax rate would you be indifferent to muni vs. corp?
2 - 44
Copyright © 2001 by Harcourt, Inc. All rights reserved.
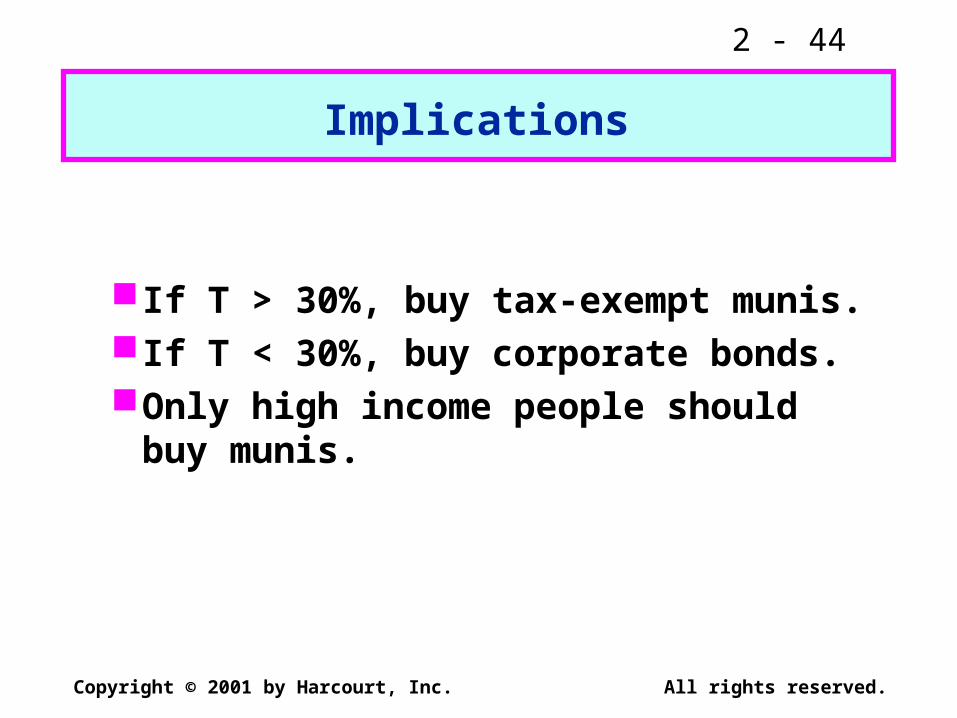
If T > 30%, buy tax-exempt munis.If T < 30%, buy corporate bonds.Only high income people should
buy munis.
Implications