2. 10. 2008, herľany modelling of the nsrf 2007-2013 impact to the slovak economy – possible...
TRANSCRIPT

2. 10. 2008, 2. 10. 2008, HerľanyHerľany
Modelling of the NSRF Modelling of the NSRF 2007-2013 impact to the 2007-2013 impact to the Slovak economy Slovak economy – possible alternatives– possible alternatives
Viliam Páleník, Marek RadvanskýViliam Páleník, Marek Radvanský
Institute for Economic Research SASInstitute for Economic Research SAS

2. 10. 2008, Herľany2. 10. 2008, Herľany
MotivationMotivation
Significant delay of NSRF funds Significant delay of NSRF funds spending for years 2007-13spending for years 2007-13
IER SAS as an NSRF evaluatorIER SAS as an NSRF evaluator Use of existing methodologyUse of existing methodology Problem of time changes in Structural Problem of time changes in Structural
funds spending on macroeconomic funds spending on macroeconomic effectseffects
2. 10. 2008, Herľany2. 10. 2008, Herľany
Presentation structurePresentation structure
MethodologyMethodology Model HERMIN for Slovak economyModel HERMIN for Slovak economy
Modelling of the NSRF 2007-2013 impact to the Slovak economy – possible alternatives

2. 10. 2008, 2. 10. 2008, HerľanyHerľany
Model HERMIN for Model HERMIN for Slovak economy Slovak economy

2. 10. 2008, Herľany2. 10. 2008, Herľany
HERMIN – basic HERMIN – basic characteristiccharacteristic Basic methodologyBasic methodology
Bradley, Modesto, Sisvilla – Rivero (1995)Bradley, Modesto, Sisvilla – Rivero (1995) Econometric models ISWExxQx and ECM-ISWExxQxEconometric models ISWExxQx and ECM-ISWExxQx
Econometric model:Econometric model: YearlyYearly Demand – supply oriented (CD, CES)Demand – supply oriented (CD, CES) Sectoral disaggregatedSectoral disaggregated Small open economy – relation with foreign countriesSmall open economy – relation with foreign countries

2. 10. 2008, Herľany2. 10. 2008, Herľany
Model relations describing Model relations describing aggregate supply aggregate supply Industrial sectorIndustrial sector
Output = f1(World Demand, Domestic Demand, Competitiveness, time) Employment = f2(Output, Relative Factor Prices, time) Investment = f3(Output, Relative Factor Prices, time) Capital Stock = Investment + (1-d) Capital Stockt-1 Output Price = f4(World Price * Exchange Rate, Unit Labour Costs) Wage Rate = f5(Output Price, Tax Wedge, Unemployment, Productivity) Competitiveness = National/World Relative Production Cost and Prices
Sector of market servicesSector of market services Output = f6(World Demand, Domestic Demand)Output = f6(World Demand, Domestic Demand) Employment = f7(Employment = f7(Output, Relative Factor Prices, time)) Investment = f8(Output, Relative Factor Prices, time)Investment = f8(Output, Relative Factor Prices, time) Capital Stock = Capital Stock = Investment + (1-d) Capital Stockt-1
Output price = Derived from Unit Labour CostsOutput price = Derived from Unit Labour Costs Wage inflation = Derived from wage inflation in the industrial sector Wage inflation = Derived from wage inflation in the industrial sector

2. 10. 2008, Herľany2. 10. 2008, Herľany
Model relations describing Model relations describing aggregate supply IIaggregate supply II
Agriculture and non-market services sector:Agriculture and non-market services sector: exogenous, driving variables.exogenous, driving variables.
Job offer and unemploymentJob offer and unemployment Population growth = f9(Natural growth, Migration)Population growth = f9(Natural growth, Migration) Job offer = f10(Population, Measure of participation of Job offer = f10(Population, Measure of participation of
labour force)labour force) Unemployment = Labour force – Total unemployment Unemployment = Labour force – Total unemployment Migration = f11(Relative expected wages)Migration = f11(Relative expected wages)

2. 10. 2008, Herľany2. 10. 2008, Herľany
Model relations of aggregate Model relations of aggregate demand (absorption) and income demand (absorption) and income distributiondistribution Aggregate demand (absorption)Aggregate demand (absorption)
Consumption = f12(Disposable household income)Consumption = f12(Disposable household income) Home demand = Private and public consumption + Investments + Home demand = Private and public consumption + Investments +
Change of stocksChange of stocks Balance of foreign trade = Total output – Home demandBalance of foreign trade = Total output – Home demand
Incomes distributionIncomes distribution Prices of public sector expenditures = f13(Output prices, Import prices, Prices of public sector expenditures = f13(Output prices, Import prices,
Measure of indirect taxation)Measure of indirect taxation) Income = Total output Income = Total output Disposable household income = Income + Transfers – Direct taxes Disposable household income = Income + Transfers – Direct taxes Balance of an account = Balance of foreign trade + Incomes of foreign Balance of an account = Balance of foreign trade + Incomes of foreign
factorsfactors Public debt = Public sector expenditures – Measure of taxation * Tax Public debt = Public sector expenditures – Measure of taxation * Tax
base base Public debt = (1 + Interest rate) DebtPublic debt = (1 + Interest rate) Debtt-1t-1 + Public debt + Public debt

2. 10. 2008, Herľany2. 10. 2008, Herľany
Industry sectorIndustry sector Industrial sectorIndustrial sector
Raw materials mining (C)Raw materials mining (C) Industrial production (D) Industrial production (D) Civil engineering (F). Civil engineering (F).
log(OTlog(OT1,t1,t) = b1 + b2*log(WD) = b1 + b2*log(WDtt) + b3*log(ULCMAN) + b3*log(ULCMANt t / PMAN/ PMANtt) + ) + b4*log(PDEUb4*log(PDEUt t / PDSKK/ PDSKKtt) + b5*TREND + b6*log(DD) + b5*TREND + b6*log(DDtt)) OTOT1,t1,t - industrial sector production- industrial sector production WDWDtt - foreign demand- foreign demand ULCMANULCMANtt- unit labour costs- unit labour costs PMANPMANtt - price level in industrial sector- price level in industrial sector PDEUPDEUtt - price deflator EU25 (HDP) - price deflator EU25 (HDP) PDSKKPDSKKtt - Slovak price deflator (GDP)- Slovak price deflator (GDP) TRENDTREND - trend component (time, for 1994 = 0)- trend component (time, for 1994 = 0) DDDDtt - domestic demand- domestic demand

2. 10. 2008, Herľany2. 10. 2008, Herľany
Market services sectorMarket services sector
Market services sectorMarket services sector Production of electricity, gas and water (E)Production of electricity, gas and water (E) Wholesale, retail, repairs (G) Wholesale, retail, repairs (G) Hotels and restaurants (H)Hotels and restaurants (H) Transport, storage, post and telecommunications (I)Transport, storage, post and telecommunications (I) Financial factoring (J) Financial factoring (J) Real estates, leasing and commercial activities (K) Real estates, leasing and commercial activities (K)
log(OTlog(OT2,t2,t) = b1 + b2*log(WD) = b1 + b2*log(WDtt) + b3*log(DD) + b3*log(DDtt)) OTOT2,t, 2,t, - production in market services sector- production in market services sector WDWDtt - foreign demand- foreign demand DDDDtt - domestic demand- domestic demand

2. 10. 2008, Herľany2. 10. 2008, Herľany
Non-market services sectorNon-market services sector
Non-market services sectorNon-market services sector Public administration and defence, compulsory social insurance Public administration and defence, compulsory social insurance
(L)(L) Educational system (M)Educational system (M) Health care and social aid (N)Health care and social aid (N) Other social and personal services (O)Other social and personal services (O) Household activities (P) Household activities (P) Extraterritorial organisations and associations (Q)Extraterritorial organisations and associations (Q)
log(OTlog(OT3,t3,t) = b1 + b2* log(DD) = b1 + b2* log(DDtt )+ b3*TREND )+ b3*TREND OTOT3,t, 3,t, - production in non-market services sector- production in non-market services sector DDDDtt - domestic demand- domestic demand

2. 10. 2008, Herľany2. 10. 2008, Herľany
Use of ISWE – HERMIN Use of ISWE – HERMIN modelmodel Basic scenario and its derivation in quantity of physical Basic scenario and its derivation in quantity of physical
infrastructure and human capital infrastructure and human capital NSRF – change of physical infrastructure and human NSRF – change of physical infrastructure and human
capital stockscapital stocks Direct or indirect affecting onto production functions changesDirect or indirect affecting onto production functions changes
Cumulative multiplicator – ratio of cumulative increases Cumulative multiplicator – ratio of cumulative increases of GDP to cumulative increase of the NSRFof GDP to cumulative increase of the NSRF
2. 10. 2008, 2. 10. 2008, HerľanyHerľany
Modelling of the NSRF 2007-2013 impact to the Slovak economy – possible alternatives
2. 10. 2008, Herľany2. 10. 2008, Herľany
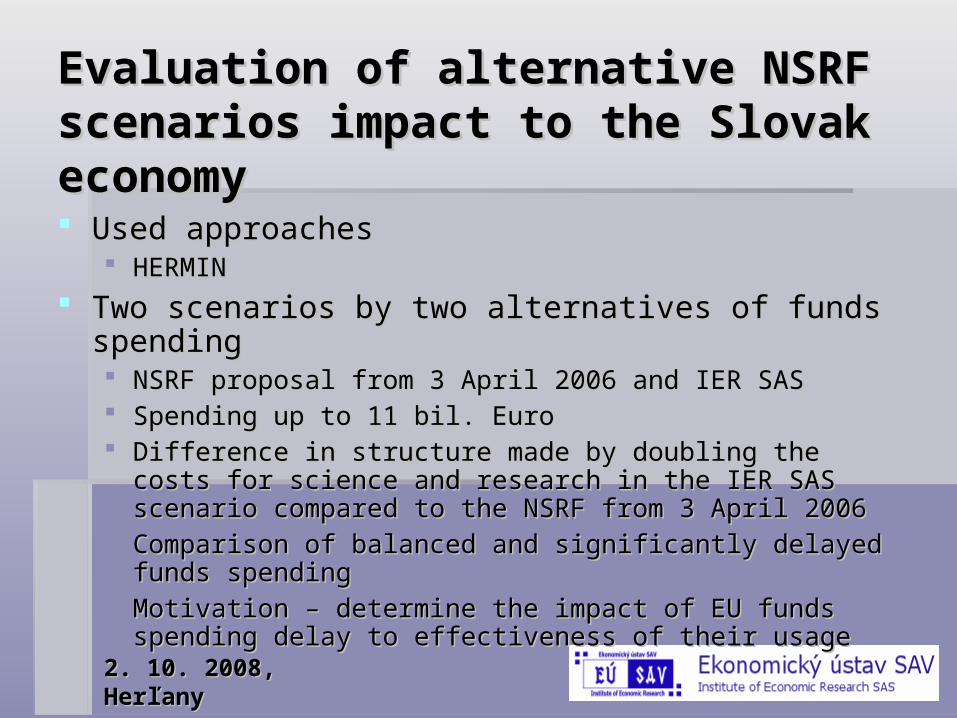
Evaluation of alternative NSRF Evaluation of alternative NSRF scenarios impact to the Slovak scenarios impact to the Slovak economyeconomy Used approachesUsed approaches
HERMINHERMIN
Two scenarios by two alternatives of funds spendingTwo scenarios by two alternatives of funds spending NSRF proposal from 3 April 2006 and IER SASNSRF proposal from 3 April 2006 and IER SAS Spending up to 11 bil. EuroSpending up to 11 bil. Euro Difference in structure made by doubling the costs for science Difference in structure made by doubling the costs for science
and research in the IER SAS scenario compared to the NSRF and research in the IER SAS scenario compared to the NSRF from 3 April 2006from 3 April 2006
Comparison of balanced and significantly delayed funds Comparison of balanced and significantly delayed funds spendingspending
Motivation – determine the impact of EU funds spending delay to Motivation – determine the impact of EU funds spending delay to effectiveness of their usageeffectiveness of their usage

2. 10. 2008, Herľany2. 10. 2008, Herľany
Financial allocations proposal Financial allocations proposal MCRD SR from 3 April 2006MCRD SR from 3 April 2006
40 mil. EurERDFFinancial consultancy, controlling... 80 mil. Eur
40 mil. EurERDFPreparation, direction, monitoring...Technical assistance
480 mil. EurESFSupport of employment growth and social inclusion1 152 mil. Eur
672 mil. EurESFModern education for knowledge economyHuman resources
and education
268 mil. EurERDFHealthcare modernization
768 mil. EurERDFResearch and development
384 mil. EurERDFInformatization 1 996 mil. Eur
576 mil. EurERDFSupport of competitiveness of manufacturers and services.Innovation,
informatization and knowledge
economy
1 603 mil. EurERDFLocal infrastructure
1 712 mil. EurKF
16 mil. EurERDFEnvironmental infrastructure
1 712 mil. EurKF
6 402 mil. Eur
1 359 mil. EurERDFTransport infrastructure
Infrastructure and regional
accessibility
Scenario MCRD - SP
Scenario MCRD - SpP
EC contribution
FundSpecific priority (SpP)Strategic priority
(SP)

2. 10. 2008, Herľany2. 10. 2008, Herľany
Suggestion of allocation by IER Suggestion of allocation by IER SASSAS
40 mil. EurERDFFinančné riadenie, kontrola... 80 mil. Eur
40 mil. EurERDFPríprava, riadenie, monitorovanie... ŠF a KFTechnická pomoc
480 mil. EurESFPodpora rastu zamestnanosti a sociálnej inklúzie
1 152 mil. Eur
672 mil. EurESFModerné vzdelávanie pre znalostnú spoločnosťĽudské zdroje a vzdelávani
e
268 mil. EurERDFModernizácia zdravotníctva
1 468 mil. EurERDFVýskum a vývoj
384 mil. EurERDFInformatizácia spoločnosti 2 696 mil. Eur
576 mil. EurERDFPodpora konkurencieschopnosti podnikov a služieb...Inovácie,
informatizácia a
znalostná ekonomika
1 153 mil. EurERDFLokálna infraštruktúra
1 712 mil. EurKF
16 mil. EurERDFEnviromentálna infraštruktúra a ochrana životného prostredia
1 712 mil. EurKF
5 702 mil. Eur
1 109 mil. EurERDFDopravná infraštruktúra
Infraštruktúra a regionálna dostupnosť
Scenár EU SAV - SP
Scenár EU SAV – ŠP
Príspevok ES
FondŠpecifická priorita (ŠP)Strategická
priorita (SP)
2. 10. 2008, Herľany2. 10. 2008, Herľany
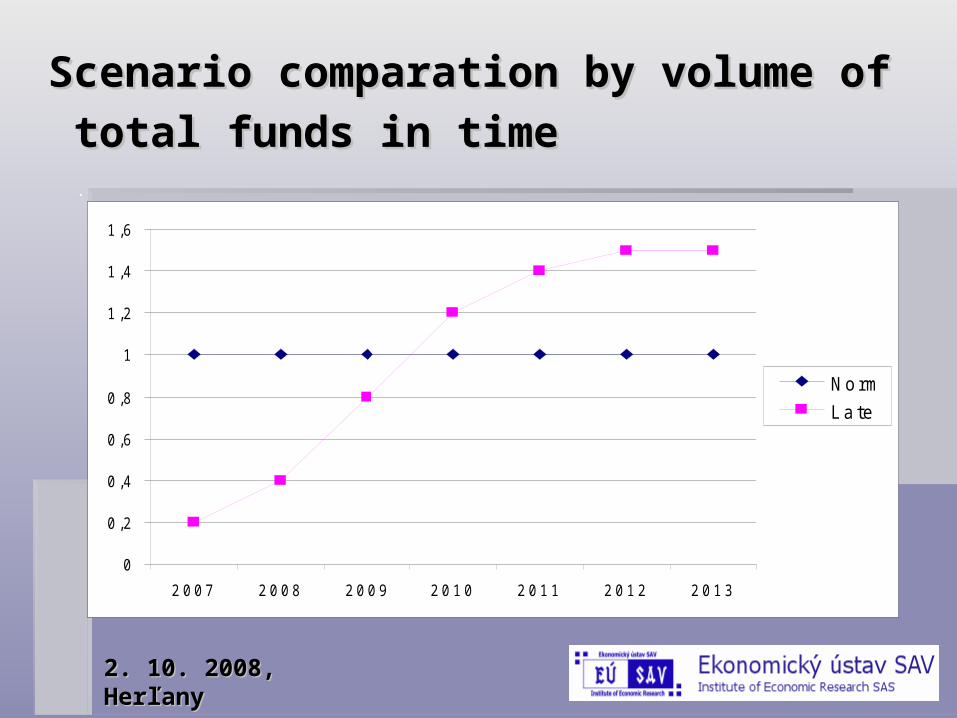
Scenario comparation by volume of Scenario comparation by volume of
total funds in time total funds in time
0
0 ,2
0 ,4
0 ,6
0 ,8
1
1 ,2
1 ,4
1 ,6
2 0 0 7 2 0 0 8 2 0 0 9 2 0 1 0 2 0 1 1 2 0 1 2 2 0 1 3
Norm
Late

2. 10. 2008, Herľany2. 10. 2008, Herľany
Changes in GDP growth compared Changes in GDP growth compared
to baseline scenario to baseline scenario
A bsolútne odchýlky K u m ulatívne odchýlky
S cenár M V R R apr í l 2006
Optim alizovaný scenár
S cenár M V R R apr í l 2006
Optim alizovaný scenár
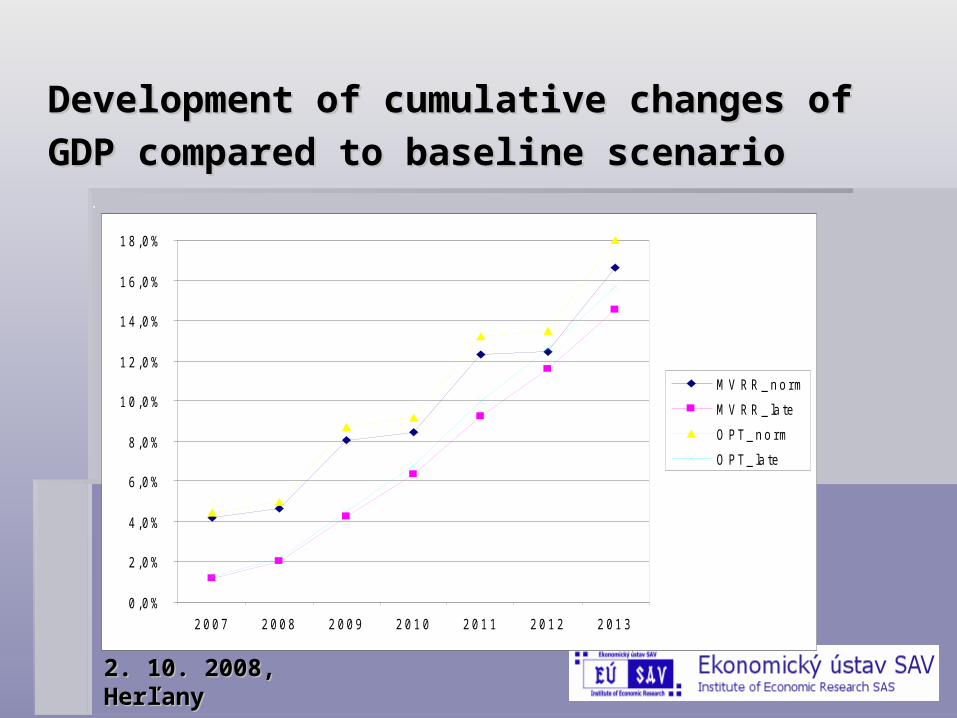
N orm al Late N orm al Late N orm al Late N orm al Late 2007 4,0% 1,3% 4,3% 1,3% 4,2% 1,2% 4,4% 1,3% 2008 0,4% 0,9% 0,5% 0 ,9% 4,6% 2,1% 5,0% 2,2% 2009 3,5% 2,2% 3,7% 2,4% 8,1% 4,2% 8,7% 4,5% 2010 0,4% 2,1% 0,5% 2,3% 8,5% 6,4% 9,2% 6,8% 2011 3,6% 2,8% 3,9% 3,1% 12,3% 9,3% 13,2% 10,0% 2012 0,1% 2,2% 0,2% 2,4% 12,4% 11,6% 13,5% 12,5% 2013 3,9% 2,7% 4,1% 2,9% 16,6% 14,5% 18, 0% 15,7%
2. 10. 2008, Herľany2. 10. 2008, Herľany
Development of cumulative changes of Development of cumulative changes of
GDP compared to baseline scenarioGDP compared to baseline scenario
0,0%
2,0%
4,0%
6,0%
8,0%
10,0%
12,0%
14,0%
16,0%
18,0%
2007 2008 2009 2010 2011 2012 2013
MV RR_norm
MV RR_late
OPT_norm
OPT_late

2. 10. 2008, Herľany2. 10. 2008, Herľany
Changes in unemployment rate in Changes in unemployment rate in
evaluated scenariosevaluated scenarios
A bsolútne odchýlky M iera nezam es tnanos ti
S cenár M V R R apr íl 2006
Optim alizovaný scenár
S cenár M V R R apr íl 2006
Optim alizovaný scenár
N orm al Late N orm al Late N orm al Late N orm al Late 2007 0,0% 0,0% 0,0% 0,0% 16,3% 16,2% 16,3% 16,2% 2008 1,3% 0,2% 1,4% 0,3% 14,4% 15,4% 14,3% 15,4% 2009 0,9% 0,4% 1,0% 0,4% 14,0% 14,5% 13,9% 14,5% 2010 2,2% 1,0% 2,4% 1,0% 11,5% 12,8% 11,4% 12,7% 2011 1,7% 1,4% 1,9% 1,5% 11,0% 11,3% 10,9% 11,2% 2012 3,1% 2,1% 3,4% 2,3% 8,9% 9,9% 8,6% 9,8% 2013 2,5% 2,5% 2,7% 2,7% 8,9% 8,9% 8,7% 8,7%

2. 10. 2008, Herľany2. 10. 2008, Herľany
Changes in total growth of Changes in total growth of
productivity rate productivity rate
A bsolútne odchýlky K u m ulatívne odchýlky
S cenár M V R R apr íl 2006
Optim alizovaný scenár
S cenár M V R R apr íl 2006
Optim alizovaný scenár
N orm al Late Norm al Late N orm al Late N orm al Late 2007 4,1% 1,3% 4,4% 1,3% 4,2% 1,2% 4,5% 1,3% 2008 -1,2% 0,6% -1,2% 0,6% 3,1% 1,8% 3,3% 1,9% 2009 3,9% 2,1% 4,2% 2,2% 7,0% 3,8% 7,5% 4,0% 2010 -1,2% 1,4% -1,2% 1,5% 5,7% 5,2% 6,2% 5,6% 2011 4,3% 2,3% 4,5% 2,5% 10,1 % 7,5% 10,9% 8,1% 2012 -1,5% 1,4% -1,5% 1,5% 8,5% 9,0% 9,3% 9,7% 2013 4,7% 2,2% 4,9% 2,4% 13,5% 11,3% 14,5% 12,2%

2. 10. 2008, Herľany2. 10. 2008, Herľany
Cumulative CSF Cumulative CSF
multiplicatormultiplicator K u m ulatívny podiel C S F na H D P K u m ulatívny C S F m ultiplikátor
S cenár M V R R apr íl 2006
Optim alizovaný scenár
S cenár M V R R apr í l 2006
Optim alizovaný scenár
N orm al Late N orm al Late N orm al Late N orm al Late 2007 6,9% 1,3% 6,6% 1,3% 0,60 0,92 0,67 0,96 2008 6,4% 2,4% 6,1% 2,4% 0,66 0,87 0,74 0,92 2009 5,8% 4,5% 5,8% 4,5% 0,88 0,91 0,97 0,97 2010 5,6% 6,3% 5,5% 6,2% 1,02 0,96 1,13 1,02 2011 5,2% 6,8% 5,3% 6,8% 1,26 1,09 1,38 1,17 2012 4,9% 6,9% 5,1% 6,8% 1,44 1,23 1,57 1,33 2013 4,6% 6,4% 4,9% 6,4% 1,69 1,42 1,83 1,54

2. 10. 2008, Herľany2. 10. 2008, Herľany
ConclusionsConclusions
Late allocation of NSRR funding has major Late allocation of NSRR funding has major economic influenceeconomic influence
Decrease of long/term multiplicative effects Decrease of long/term multiplicative effects (infrastructure, education)(infrastructure, education)
In model case in late allocation is possible to In model case in late allocation is possible to reach maximum only 85% of potential productreach maximum only 85% of potential product
Significantly lesser positive influence on Significantly lesser positive influence on development of unemploymentdevelopment of unemployment

2. 10. 2008, Herľany2. 10. 2008, Herľany
ConclusionsConclusions
Late allocation of NSRF brings new risks Late allocation of NSRF brings new risks Cumulation of greater amounts of fund Cumulation of greater amounts of fund
volume on shorter period markedly decreases volume on shorter period markedly decreases effectivity of appliance of these fundseffectivity of appliance of these funds
Markedly increase risk of lesser allocation of Markedly increase risk of lesser allocation of funds in periodfunds in period
Possible lack of capacities to sudden increase Possible lack of capacities to sudden increase of funds allocation (human, technical)of funds allocation (human, technical)
2. 10. 2008, Herľany2. 10. 2008, Herľany
Institute for Economic ResearchInstitute for Economic Research Slovak Academy of SciencesSlovak Academy of Sciences www.ekonom.sav.skwww.ekonom.sav.sk
[email protected]@savba.sk [email protected]@savba.sk