2 agricultural innovation systems and rural development in india and china - chunhui ye
DESCRIPTION
agricultureTRANSCRIPT

Agricultural Innovation Systems and Rural Transformation in
India and China
Prof. Ye Chunhui(based on a paper by R. Raina, G. Shulin, Y. Chunhui, T. Qui, Y. Xiao)
23/24-7-2012 SIID India-China team

Key Messages• URGENT ATTENTION TO INNOVATION AND DEVELOPMENT –
FOCUS ON PRODUCTIVITY, RESPONSIVENESS AND RESILIENCE • SPECIFIC INTERVENTIONS TO STRENGTHEN THE LINKAGES
(BACKWARD AND FORWARD ) IN THE LOCAL ECONOMY • INVESTMENTS IN LOCATION-SPECIFIC DECENTRALIZED
INNOVATION CAPACITIES AND INCENTIVES
- The usual recommendation to move farmers into non-farm urban jobs, enhance capital investments and supply of technologies will not work.
- Rural transformation in India and China needs institutional reform to enable decentralized agricultural innovation capacities.
23/24-7-2012 SIID India-China team

India-China: poverty amidst plenty
• India-China: 49-51% of global chronic poverty, 55 % of global extreme poverty (McKay and Baulch, 2004)
• India-China – PERSISTENT RURAL poverty (Glauben et al, 2012; Planning Commission, 2010)
- Regional differentiation – higher dependence on agrarian incomes
• India – higher probability to remain poor for longer
23/24-7-2012 SIID India-China team

Persistent problem – structural un-employment continues
Feature of the economy
China (%)1980 2010
India (%) 1980 2010
1 Growth rate-GDP 7.8 9.58
5.6 8.37
2 Share of agriculture in GDP
30 10
36 19
3 Agriculture- value added per worker
191 525
313 468
4 Share of industry in GDP
48 47
25 26
5 Rural population in total(Source: World Bank, WDI), CSO)
80 55
77 70
23/24-7-2012 SIID India-China team

Inclusion??
• Re-distribution – with increased expenditure or flagship programmes for the poor
• Public sector mandates to target rural areas and backward regions
• New private and public-private partnerships and investments in industry – extractive and manufacturing
• Attempts to enable and promote pro-poor knowledge and technology generation
23/24-7-2012 SIID India-China team
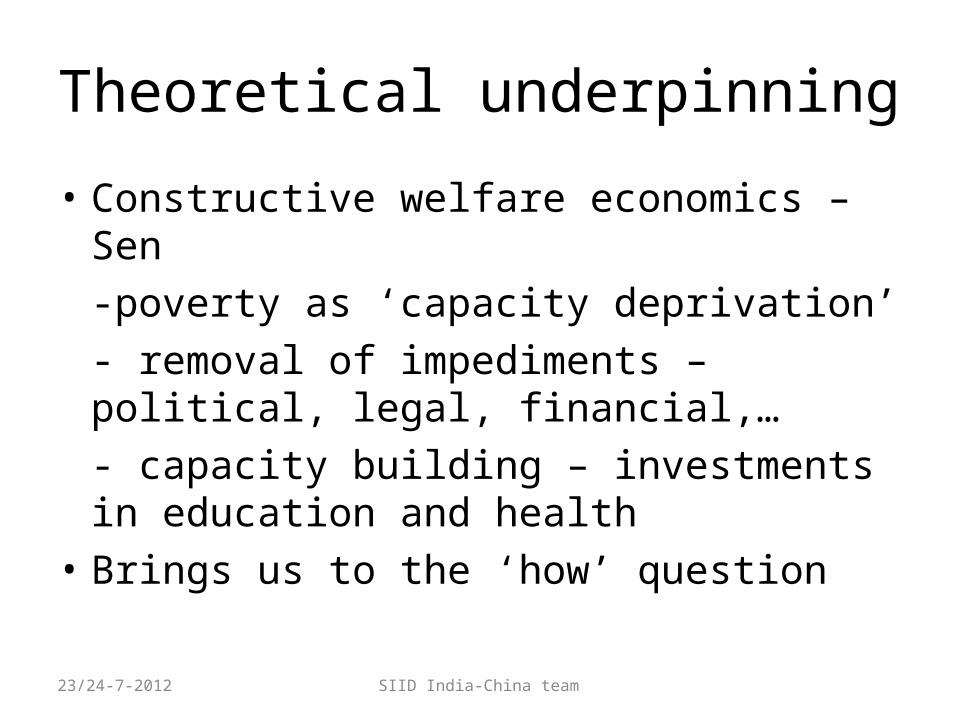
Theoretical underpinning
• Constructive welfare economics – Sen-poverty as ‘capacity deprivation’- removal of impediments – political, legal, financial,…- capacity building – investments in education and health
• Brings us to the ‘how’ question
23/24-7-2012 SIID India-China team

How?
• Understand inclusion – through evidence of exclusion - How do capacity deprivation, financial and political impediments, access to health care and education exist? How have they evolved?
• Understand innovation systems –through analysis of innovation system components- How do peoples capacities, their eco-systems, production systems and knowledge requirements enter the innovation system components of R&D, demand, intermediary, enterprise, and policy? How are they addressed?
23/24-7-2012 SIID India-China team

Agricultural/Rural Resources-theories on ‘how’ to mobilize
• Nurkse (1951) – idle labour in peasant households – use for capital formation in rural economy
• Lewis (1954), Fie and Ranis (1964) – resource transfer – surpluses – from agriculture to industry
• Schultz (1963), Mellor (1976) – rapid growth in agriculture through technological change- leading economic role of modern agriculture
23/24-7-2012 SIID India-China team

Major differences in agricultureSl.No.
Agricultural production features China1980 2010
India 1980 2010
1. Foodgrain production growth rate (%) 8.38 2.9
5.88 2.27(1980-90) (2000-10)
2. Agrl GDP-Regional growth rates (%)
East: 17.48 4.6Central:13.98 4.3West:14.43 5.7
North Western Region3.39 2.85Eastern Region1.3 1.76Central Region2.06 2.70Southern Region1.82 1.78(1980-90) (2000-06)
3. Irrigated area (m.ha) 44.88 59.26 38.72 63.20
4. Gross cropped area (m.ha) 117.23 109.87 172.63 195.10
5. Fertilizer use (m.tonnes NPK) 12.69 54.60 5.51 26.48
6. Mechanization (no. of tractors) 2.61 m 21.78 m 0.075 0.5 m
7. Fruit and vegetable processing (value Billion US$)
23.8 4.76
8. Agricultural trade (constant US $ 1999-2000) (Billion US$)ExportsImports
10.59 121.96 4.37 49.41 6.22 72.55
2.87 31 17 14
23/24-7-2012 SIID India-China team

23/24-7-2012 SIID India-China team
Crop Area (Million Hectares)
Production (Million tonnes)
Yield (Kg/hectare)
Area under Irrigation (%)
1960-61
1980-81
2000-01
2008-09
1960-61
1980-81
2000-01
2008-09
1960-61
1980-81
2000-01
2008-09
1960-61
1980-81
2000-01
2007-08
Food grain
115.58
126.67
121.05
122.83
82.02
129.59
196.81 234.47
710 1023
1626
1909
19.1
29.7
43.4
46.8
Rice 34.13 40.15
44.71
45.54 34.58
53.63 84.98 99.18 1013
1336
1901
2178
36.8
40.7
53.6
56.9
Wheat 12.93 22.28
25.73
27.75 11.00
36.31 69.68 80.68 851 1630
2708
2907
32.7
76.5
88.1
90.9
Coarse cereals
44.96 41.78
30.26
27.45 23.74
29.02 31.08 40.04 528 695 1027
1459
7.7 9.2 12.5
14.2
Total Pulses
23.56 22.46
20.35
22.09 12.70
10.63 11.08 14.57 539 473 544 659 8.0 9.0 12.5
16.2
Major Oilseeds
13.77 17.6
22.77
27.56 6.98 9.37 18.44 27.72 507 532 810 1006
3.3 14.5
23.0
27.1
Cotton 7.61 7.82
8.53 9.41 5.60 7.01 9.52 22.28 125 152 190 403 12.7
27.3
34.3
35.1
Sugarcane
2.42 2.67
4.32 4.42 110.00
154.25
295.96 285.03
45549
57844
68577
64553
69.3
81.2
92.1
93.5
All-India Area, Production and Yield of Major Crops and proportion of area Irrigated over time (Source:: Agricultural Statistics at a glance)

All-China Area, Production and Yield along with coverage under Irrigation
Crop Area (Million Hectares) Production (Million tonnes) Yield (Kg/hectare)
1961-62
1980-81
2000-01
2008-09
1961-62
1980-81
2000-01
2008-09
1961-62
1980-81
2000-01
2008-09
Food grain
121.62
117.23
106.08
108.99
154.41
320.56
452.64
530.82
1270 2734 4267 4870
Rice 26.94 33.88 28.81 29.63 62.99 139.91
177.58
195.10
2338 4130 6163 6585
Wheat 24.08 28.84 24.66 24.29 16.67 55.21 93.87 115.12
692 1914 3806 4739
Major Oilseed
s
4.15 7.93 14.63 13.65 2.00 7.69 28.65 31.54 482 970 1919 2311
Cotton 3.50 5.19 4.81 4.95 0.75 2.71 5.32 6.38 214 550 1091 1288
Sugarcane
0.15 0.48 1.25 1.70 3.44 22.81 75.66 115.59
22357 47562 60625 68093
Sugar Crops
0.24 0.92 1.65 1.88 3.78 29.11 86.55 122.77
15958 31566 52321 65303
a
23/24-7-2012 SIID India-China team

Fertilizer consumption- States in India(Kg./ha. NSA)
State 1995-96 2000-01 2005-06 2008-09 Andhra Pradesh 134.26 160.54 203.61 239.71Assam 12.48 34.59 49.26 62.09Bihar 74.19* 125.32 178.98 Chhattisgarh 46.09 67.36 80.74Jujarat 74.74 70.22 111.07 140.71Haryana 121.16 152.13 166.72 201.62Himachal Pradesh 30.53 37.50 48.75 60.58Jammu & Kashmir 47.55 58.28 81.31 93.34Jharkhand 67.61 55.72 Karnataka 78.33 109.76 117.34 147.28Kerala 66.31 57.31 57.00 89.41Madhya Pradesh 42.87 39.07 47.13 70.77Maharashtra 64.42 75.18 84.52 113.69Orissa 24.57 40.52 57.33 61.64 Punjab 162.97 166.69 210.06 221.42Rajasthan 32.66 34.57 36.29 48.85Tamil Nadu 120.53 151.94 183.67 216.54Uttar Pradesh 106.2 118.93* 140.37 156.31Uttaranchal 94.24 123.31West Bengal 94.48 119.02 127.50 157.69India 74.38 88.93 104.50 128.58
23/24-7-2012 SIID India-China team
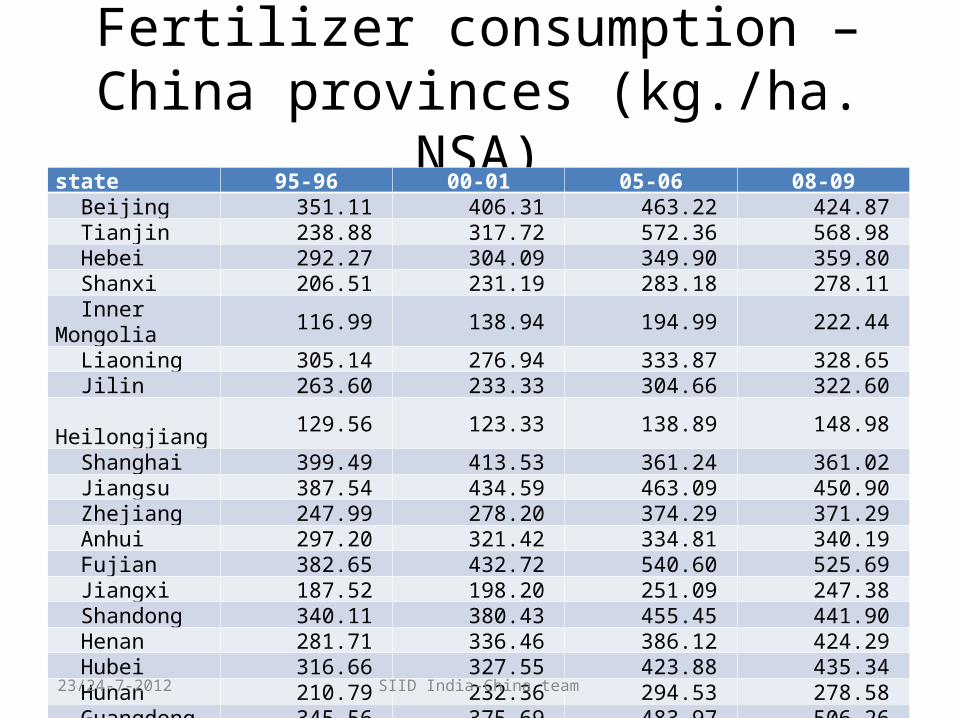
Fertilizer consumption –China provinces (kg./ha. NSA)
state 95-96 00-01 05-06 08-09 Beijing 351.11 406.31 463.22 424.87 Tianjin 238.88 317.72 572.36 568.98 Hebei 292.27 304.09 349.90 359.80 Shanxi 206.51 231.19 283.18 278.11 Inner Mongolia 116.99 138.94 194.99 222.44 Liaoning 305.14 276.94 333.87 328.65 Jilin 263.60 233.33 304.66 322.60 Heilongjiang 129.56 123.33 138.89 148.98 Shanghai 399.49 413.53 361.24 361.02 Jiangsu 387.54 434.59 463.09 450.90 Zhejiang 247.99 278.20 374.29 371.29 Anhui 297.20 321.42 334.81 340.19 Fujian 382.65 432.72 540.60 525.69 Jiangxi 187.52 198.20 251.09 247.38 Shandong 340.11 380.43 455.45 441.90 Henan 281.71 336.46 386.12 424.29 Hubei 316.66 327.55 423.88 435.34 Hunan 210.79 232.36 294.53 278.58 Guangdong 345.56 375.69 483.97 506.26 23/24-7-2012 SIID India-China team

Fertilizer (kg/ha. NSA) Guangxi 224.61 267.33 379.14 382.05
Hainan 208.80 309.74 564.77 549.80
Chongqing 0.00 204.17 261.88 266.30
Sichuan 198.97 221.49 244.28 256.21
Guizhou 141.08 150.51 180.25 173.82
Yunnan 190.40 202.37 260.38 264.35
Tibet 128.89 129.93 188.84 195.66
Shaanxi 241.77 302.64 375.80 399.36
Gansu 151.44 179.19 209.09 206.67
Qinghai 116.94 136.11 139.21 157.56
Ningxia 184.07 244.14 287.57 283.69
Xinjiang 249.90 244.70 286.36 319.27
CHINA 251.22 273.21 323.87 330.26
23/24-7-2012 SIID India-China team

23/24-7-2012 SIID India-China team
HaryanaOrissa
Punjab
Rajasthan
Andhra Pradesh
Bihar
Gujarat
Karnataka
Madhya Pradesh MaharashtraTamil Nadu
Uttar Pradesh
West Bengal
0.00
10.00
20.00
30.00
40.00
50.00
60.00
70.00
80.00
90.00
100.00
0.00 50.00 100.00 150.00 200.00 250.00
Fertilizer Consumption - 2006-09 (Kg/Hectare)
To
tal a
rea
un
der
5 m
ajo
r C
rop
s an
d F
ruit
s &
Veg
etab
les
in G
CA
- 2
006-
09 (
%)
Andhra Pradesh Bihar Gujarat Haryana Karnataka
Madhya Pradesh Maharashtra Orissa Punjab Rajasthan
Tamil Nadu Uttar Pradesh West Bengal All india All india
State-wise proportion of area under dominant crops and fertilizer use ((Source: DES, 2010; Beiintemma et al, 2008)

Evidence of exclusion – Agricultural Innovation
• Eastern India and Western China• Slowing down of yield growth rates-major cereals• Incremental response to inputs – limited• Public and private supply of modern inputs• Rainfed agriculture/ drylands/ mountain
ecosystems poor and neglected• Resource extraction and degradation- high• Global trade vs. domestic markets• Gender relationships – neglected• Agricultural markets- poorly developed
23/24-7-2012 SIID India-China team

The Excluded Rural in India: Diversity within a common Development Framework
23-24/7/2012 SIID team China-India
5 Rural MSME Clusters
2 Agricultural Innovation cases
Rainfed Agriculture (MP & AP)
North Eastern States
Plantation Sysfems
Inclusive Agri Biotech Hyd Rice

Agricultural Innovation - India • From secondary data – the rainfed farming states ,
plantations and Northeastern states• From district level comparative analysis – 2 states – AP
and MP – 2 districts Low-Low and Low-High (rainfall and irrigation) intensity
• From case analyses – Private groundwater sharing project (Kadiri, Anantapur – AP), Chetna organics (Adilabad- AP), pulse production systems in tribal villages (Dewas – MP), organic kodu rice systems (East Nimad – MP), Hybrid rice, Agri-biotech for Drylands, Water use and governance –NorthEastern states, e-auctions and cardamom markets- South India.
23/24-7-2012 SIID India-China team

Sampling through mapping Mapping the diversity: The “Five Rural Chinas”
Source: OECD 2009: 72-74
23-24/7/2012 SIID team China-India
1 , The rural
poor
The West provinces Population
28%
2 , The rural with strong
outmigration
The Middle, such as An’hui
44%
3 , The rural dependent on
grain production
The northeast provinces
11%
4 , The rural diversified
The costal provinces: Shandong, Zhejiang, Fijian, Guangdong
15%
5 , The peri-urban rural
Beijing, Tianjun, Jiangsu
2%
• Mapping/structuring modes/patterns/factors creates a value for conditional generalization and comparison
12
3
4
5

Agricultural Innovation - China
• From secondary data –
• County level comparative analyses – Anhui and Zhejiang province.
• Case analyses – Farmers Co-operatives, Fruit production and marketing,
23/24-7-2012 SIID India-China team

Agricultural Administration and R&D – India and China
• Decreasing share of public investment• Focused on irrigated monocrop-cereals• Mainly public sector R&D and extension- accounting for nearly 50 % of global developing
country agricultural research expenditure• Limited contextual understanding • Limited investment and support for rainfed,
mountain ecosytems.
23/24-7-2012 SIID India-China team

Key differences- AIS
• India• Central government –leading
agricultural innovation• Land – ownership , tenancy and
reverse tenancy increasing• R&D institutes under Central or
State governments• Extension under state
governments• Export oriented production -• Civic space active in local
agriculture – limited state support
• China• Provincial governments– leading
agricultural innovation• Land – on lease from the state
(more equal access to land)• Half the R&D institutes under
County/Township governments• Extension under
County/Township and provincial governments
• Domestic markets oriented production
• Private corporate sector – with state support and finance
23/24-7-2012 SIID India-China team

Features of inclusive agricultural innovation systems- Indian and
Chinese cases• Farmer’s autonomous grouping
-seeking an appropriate problem articulation and solution-- ownership of institutional change - changing role – from farmer to trader/processor/input producer,-entrepreneurship skills – developed with experience, through training, expert assistance.
• The state and its responsiveness- demand for or support for technology or legal and institutional changes supported- responding to needs – articulated by farmers, consumers, etc.-local government ownership and support for increased participation of farmers in production and distribution activities.
23/24-7-2012 SIID India-China team
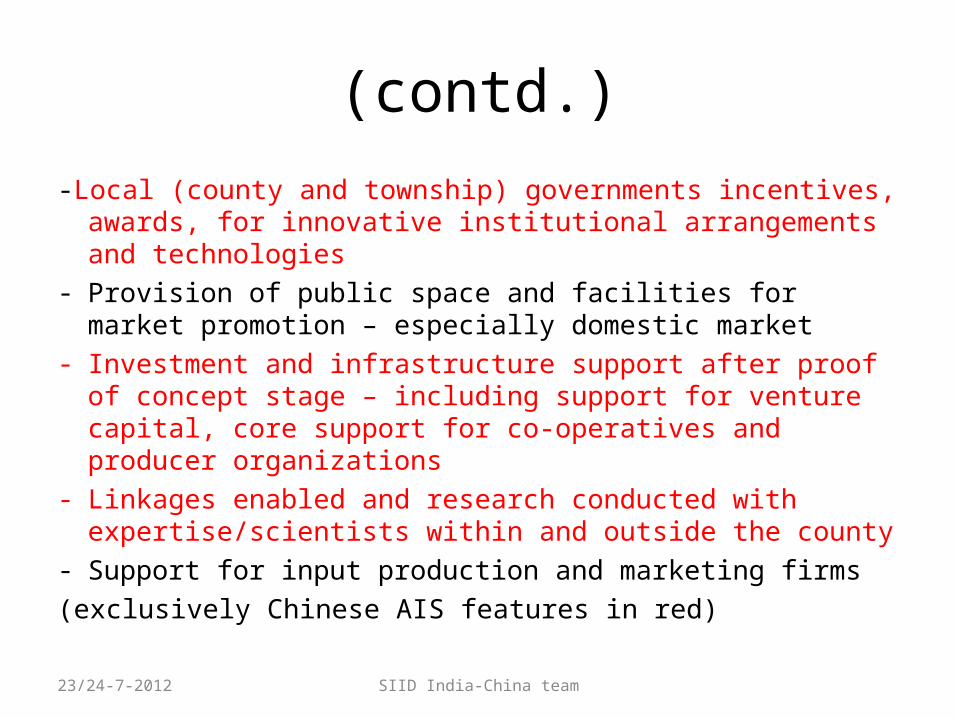
(contd.)
-Local (county and township) governments incentives, awards, for innovative institutional arrangements and technologies
- Provision of public space and facilities for market promotion – especially domestic market
- Investment and infrastructure support after proof of concept stage – including support for venture capital, core support for co-operatives and producer organizations
- Linkages enabled and research conducted with expertise/scientists within and outside the county
- Support for input production and marketing firms(exclusively Chinese AIS features in red)
23/24-7-2012 SIID India-China team
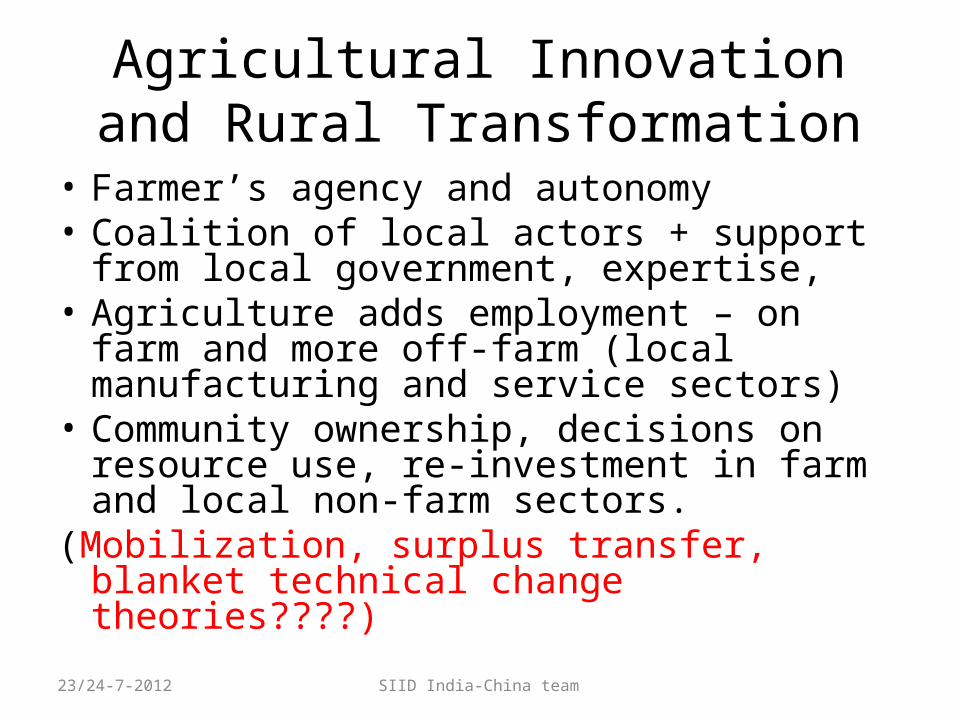
Agricultural Innovation and Rural Transformation
• Farmer’s agency and autonomy• Coalition of local actors + support from local
government, expertise,• Agriculture adds employment – on farm and
more off-farm (local manufacturing and service sectors)
• Community ownership, decisions on resource use, re-investment in farm and local non-farm sectors.
(Mobilization, surplus transfer, blanket technical change theories????)
23/24-7-2012 SIID India-China team

Crucial interventionsPolicy goal –
• Productive and sustainable agriculture, employing and creating incomes in farm and off-farm occupations
Policy instruments - • Creation of decentralized innovation capacities and governance in
agriculture• Evidence and communication on exclusion or drivers of exclusion• Public investment in critical infrastructure, fiscal decentralization and local
knowledge and accountability• Cutting edge science and technology • Support for legal and institutional changes to reform drivers of exclusion
23/24-7-2012 SIID India-China team

Limitations
• Innovation systems – limited engagement with development economics, politics, social and cultural features of agriculture
• Inadequate understanding of forms and magnitudes of exclusion and new challenges
• Size and complexity of Indian and Chinese agriculture – secondary data analysis and case studies are not enough
• Administrative and R&D changes contingent upon political willingness.
23/24-7-2012 SIID India-China team