2 chemical, mechanical, mineralogical and microstructural
TRANSCRIPT
Suitability of Sarawak and Gladstone Fly Ash to ProduceGeopolymers: A Physical, Chemical, Mechanical,Mineralogical and Microstructural Analysis
Author
Leong, Hsiao Yun, Ong, Dominic Ek Leong, Sanjayan, Jay G, Nazari, Ali
Published
2016
Journal Title
Ceramics International
Version
Accepted Manuscript (AM)
DOI
https://doi.org/10.1016/j.ceramint.2016.03.046
Copyright Statement
© 2016 Elsevier Ltd and Techna S.r.l. Published by Elsevier Ltd. Licensed under the CreativeCommons Attribution-NonCommercial-NoDerivatives 4.0 International Licence (http://creativecommons.org/licenses/by-nc-nd/4.0/) which permits unrestricted, non-commercial use,distribution and reproduction in any medium, providing that the work is properly cited.
Downloaded from
http://hdl.handle.net/10072/375784
Griffith Research Online
https://research-repository.griffith.edu.au

1
Suitability of Sarawak and Gladstone fly ash to produce geopolymers: A physical, 1
chemical, mechanical, mineralogical and microstructural analysis 2
3
Hsiao Yun Leonga, Dominic Ek Leong Onga, Jay G. Sanjayanb and Ali Nazarib* 4
5
a) Research Centre for Sustainable Technologies, Faculty of Engineering, Science & Computing, Swinburne 6
University of Technology Sarawak Campus, 93350 Kuching, Sarawak, Malaysia. 7
b) Centre for Sustainable Infrastructure, Faculty of Science, Engineering and Technology, Swinburne 8
University of Technology, PO Box 218, Hawthorn Victoria 3122, Australia. 9
* Corresponding author, Email: [email protected]; Tel: +61 3 9214 8370 10
11
Abstract 12
Two types of fly ash sourced from Sarawak, Malaysia and Gladstone, Australia reflect 13
differences in chemical compositions, mineral phase and particle size distributions. In this 14
paper, the Sarawak fly ash was used to produce geopolymer in comparison to the well-15
developed Gladstone fly ash-based geopolymer. Characteristics of fly ash and mixtures 16
proportions affecting compressive strength of the geopolymers were investigated. It is found 17
that the variations of both fly ash types on particle size distributions, chemical compositions, 18
morphology properties and amorphous phase correspond to the compressive strength. The 19
results obtained show that after 7 days, geopolymer using Sarawak fly ash has lower 20
compressive strength of about 55 MPa than geopolymer using Gladstone fly ash with strength 21
of about 62 MPa. In comparison with Gladstone fly ash-based geopolymer, it showed that 22
Sarawak fly ash-based geopolymer can be a potential construction material. Moreover, the 23
production of Sarawak fly ash-based geopolymer aids to widen the application of Sarawak fly 24
ash from being treated as industrial waste consequently discharging into the ash pond. 25
26
2
Keywords: Sarawak fly ash; Gladstone fly ash; Geopolymer; Compressive strength; 27
Morphology 28
29
1. Introduction 30
Use of fly ash has been widely researched for making geopolymer concrete, a possible 31
alternative to ordinary Portland cement (OPC) concrete. The term ‘geopolymer’ was 32
introduced by Davidovits in 1979 [1]. Geopolymer has been known to exhibit ceramic-like-33
properties as it comprises alumino-silicate materials such as fly ash in alkaline environment. 34
High emission levels of CO2 during the manufacturing of OPC have become an issue since 35
this level of emissions is considered a threat to the existing global climate. The low carbon 36
footprint of geopolymer, which is approximately 80% lower than OPC [2], has shown that 37
geopolymer can be an attractive alternative construction material to OPC. The superior 38
properties of geopolymer such as better acid resistance and long durability have been 39
reported [3]. Geopolymer also shows better performance at elevated temperature as compared 40
to OPC concrete [4]. 41
Properties of fly ash can be varied due to its origin, resources or coal type [5]. Fly ash 42
sourced from different places may have different chemical compositions, mineralogy, 43
morphology, particle size distributions or unburned carbon content [6]. Both chemical and 44
physical properties of fly ash can effectively influence the performance of geopolymer. 45
The particle size distribution of fly ash plays an important role on the strength 46
development of geopolymer [7]. Fly ash with higher amount of small particle size has been 47
found to exhibit excellent compressive strength [8]. In the alkali activation, small particles are 48
more active than larger particles [9]. The reactivity of fly ash is proportionally to the particle 49
size smaller than 10µm rather than the particle size greater than 45 µm [10]. The former 50
particle size increases the compressive strength while the latter particle size decreases the 51
compressive strength. It is known that the morphology is affected by fly ash particle size [11]. 52

3
Small particle appears to have smoother surface than large particle [12]. The reduction of 53
particle size improves the workability of the mixture [8]. The formation of irregular grains in 54
fly ash could be due to the incomplete combustion process [11]. Fly ash consists of 55
crystalline phase and amorphous phase has been reported [13, 14]. The amorphous phase of 56
fly ash may be useful for the industry characterisation [14]. The most common phases in fly 57
ash such as quartz and mullite are important to the strength development. However, high 58
content of mullite and quartz decrease the reactivity of fly ash [1]. 59
In Sarawak, few coal fired power stations are planned to be constructed within the 60
development masterplan of Sarawak Corridor of Renewable Energy (SCORE). The 61
production of Sarawak fly ash will increase in tandem with the development. Despite being 62
use on the construction of major dams in Sarawak such as Bengoh Dam, Murum Dam and 63
Bakun Dam, most of the Sarawak fly ash is still being treated as industrial waste and dumped 64
into the ash pond nearby. From the environmental point of view, the widening of Sarawak fly 65
ash application can effectively reduce the land for disposal, moreover, lowering the risk of 66
ground contamination due to improper management of discharged fly ash. From the 67
construction material point of view, the development of Sarawak fly ash-based geopolymer 68
provides an alternative to the ordinary Portland cement-based concrete. The world’s first 69
building using geopolymer for structural purpose in Australia has proven the potential use of 70
geopolymer [15]. Therefore, it shows the significance of benchmarking of Sarawak fly ash 71
against the well-developed Gladstone fly ash-based for producing geopolymer. 72
In this paper, two different types of fly ash, namely Sarawak fly ash (SFA) from Malaysia 73
and Gladstone fly ash (GFA) from Australia have been used to fabricate geopolymer. Study 74
of geopolymer using GFA has been well reported by other researchers [16-20]. As the 75
research around SFA is very limited, the study of geopolymer made of SFA in comparison to 76
GFA can effectively identify the factors influencing the difference of their compressive 77
4
strength for future in-depth studies on geopolymer using SFA. It is postulated that the 78
geopolymers produced by GFA and SFA may behave very differently in their respective 79
strength capabilities. 80
81
2. Background of the Fly Ashes 82
2.1. Sarawak fly ash (Malaysia) 83
In Sarawak, Sejingkat Power Station and Mukah Power Station are the two main coal-84
fired power stations that are used to generate electricity. Sejingkat Power Station is located in 85
the Sarawak State capital of Kuching in Malaysia. The coal is mainly supplied from the 86
hinterland. Approximately 1 million tons of coal is utilized for the combustion and the daily 87
production of coal ashes is estimated about 1,400 tons. The combustion of coal is carried out 88
in 2 boilers operating independently. The first or older boiler has a capacity to generate 2 89
units x 50 MW of electricity, while the second or newer boiler has a capacity to generate 90
slightly more electricity at 2 units x 55 MW. The combustion temperature of coal is set at 540 91
C. The cooling system utilized water pumped from river and the flow rate of the cooling 92
system is about 10,275 m3/hr. The by-product of the power plant, fly ash, is efficiently 93
captured by the electrostatic precipitator (approximately 99 %) and only 1 % of the fly ash is 94
discharged to the environment through the 120 m chimney. The captured fly ash is disposed 95
into two ash ponds nearby. The coal used for the combustion is classified as sub-bituminous. 96
The geological age of the coal ranges from Miocene to Miocene-Pliocene. In this research, 97
the Sarawak fly ash is sourced from Sejingkat Power Station. 98
2.2. Gladstone fly ash (Australia) 99
Another fly ash used in this research is the Gladstone fly ash. GFA is sourced from 100
Gladstone Power Station. This power station is situated at Gladstone, Queensland, Australia. 101
It is the largest power station in Queensland, which generates electricity of 1,680 MW by 6 102
5
boilers. The combustion temperature of coal is 540 C. The cooling water is pumped from 103
Auckland inlet and the flow rate of the cooling system is about 51,840 m3/hr [21]. It is 104
estimated that 4 million tons of coal is used for the combustion annually [22]. The coal is 105
supplied from the mining field at Central Queensland. In this region, the coal is classified as 106
bituminous coal with the coal age ranged from Permian, Triassic, Jurassic and Cretaceous 107
[23]. This fly ash is chosen for comparison because there are already a relatively large 108
number of publications associated to GFA and hence, it would be easier to develop 109
benchmarks against GFA [24]. 110
111
3. Experimental works 112
3.1. Materials 113
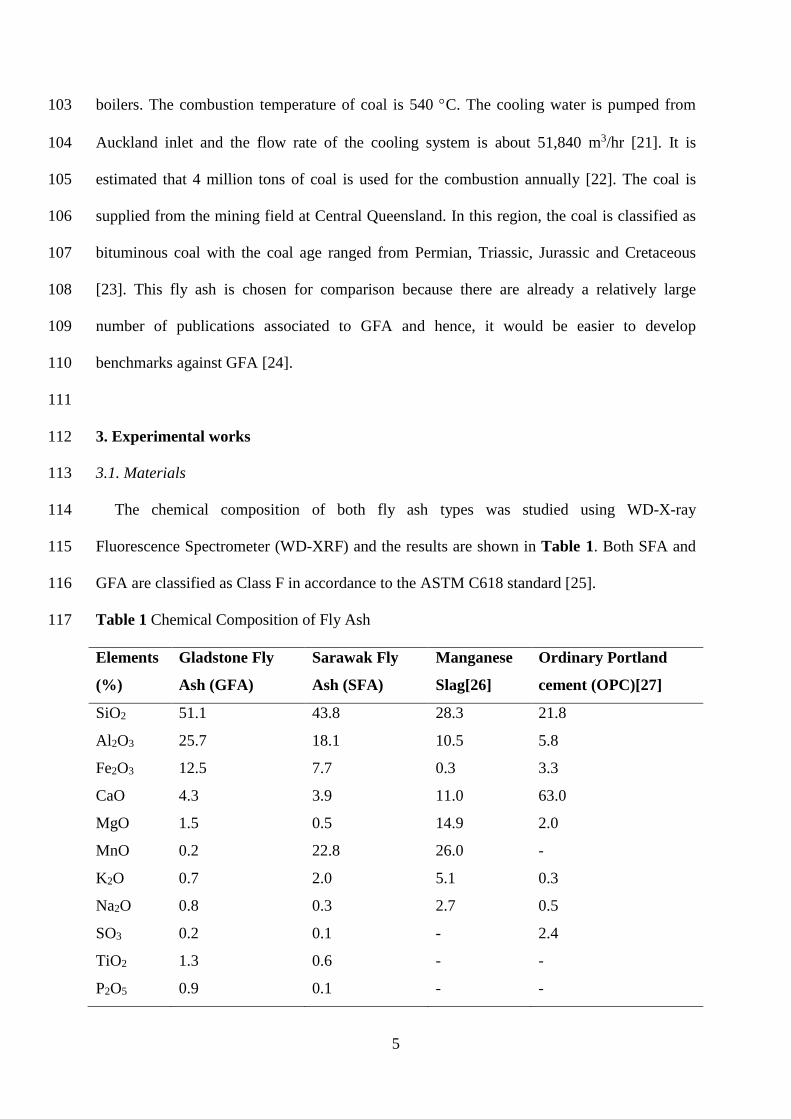
The chemical composition of both fly ash types was studied using WD-X-ray 114
Fluorescence Spectrometer (WD-XRF) and the results are shown in Table 1. Both SFA and 115
GFA are classified as Class F in accordance to the ASTM C618 standard [25]. 116
Table 1 Chemical Composition of Fly Ash 117
Elements
(%)
Gladstone Fly
Ash (GFA)
Sarawak Fly
Ash (SFA)
Manganese
Slag[26]
Ordinary Portland
cement (OPC)[27]
SiO2 51.1 43.8 28.3 21.8
Al2O3 25.7 18.1 10.5 5.8
Fe2O3 12.5 7.7 0.3 3.3
CaO 4.3 3.9 11.0 63.0
MgO 1.5 0.5 14.9 2.0
MnO 0.2 22.8 26.0 -
K2O 0.7 2.0 5.1 0.3
Na2O 0.8 0.3 2.7 0.5
SO3 0.2 0.1 - 2.4
TiO2 1.3 0.6 - -
P2O5 0.9 0.1 - -
6
LOI 0.6 0.5 - 1.0
118
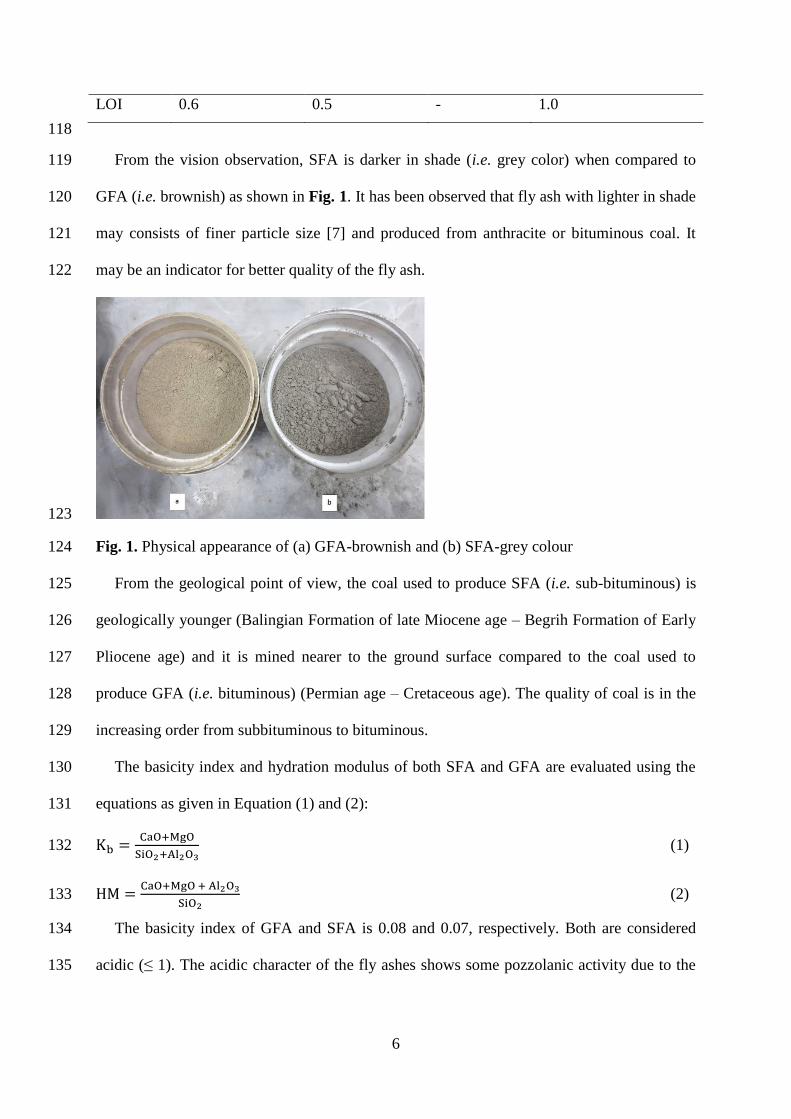
From the vision observation, SFA is darker in shade (i.e. grey color) when compared to 119
GFA (i.e. brownish) as shown in Fig. 1. It has been observed that fly ash with lighter in shade 120
may consists of finer particle size [7] and produced from anthracite or bituminous coal. It 121
may be an indicator for better quality of the fly ash. 122
123
Fig. 1. Physical appearance of (a) GFA-brownish and (b) SFA-grey colour 124
From the geological point of view, the coal used to produce SFA (i.e. sub-bituminous) is 125
geologically younger (Balingian Formation of late Miocene age – Begrih Formation of Early 126
Pliocene age) and it is mined nearer to the ground surface compared to the coal used to 127
produce GFA (i.e. bituminous) (Permian age – Cretaceous age). The quality of coal is in the 128
increasing order from subbituminous to bituminous. 129
The basicity index and hydration modulus of both SFA and GFA are evaluated using the 130
equations as given in Equation (1) and (2): 131
Kb =CaO+MgO
SiO2+Al2O3 (1) 132
HM =CaO+MgO + Al2O3
SiO2 (2) 133
The basicity index of GFA and SFA is 0.08 and 0.07, respectively. Both are considered 134
acidic (≤ 1). The acidic character of the fly ashes shows some pozzolanic activity due to the 135
7
high presence of SiO2 [28]. The hydraulicity of acidic fly ash in the presence of alkaline 136
solution is weaker in comparison to basic fly ash. 137
From the hydration moduli obtained, it implies the hydraulicity of both fly ashes is very 138
low. The self-cementing properties are very poor due to the lack of CaO content. Being 139
different from Portland cement and Class C type fly ash, it does not harden in the presence of 140
water. Consequently, alkaline activator is essentially needed to activate both fly ashes. 141
3.2. Sample Preparation 142
In this paper, the alkaline solution used for the experiment was 8M sodium hydroxide 143
(NaOH) solution, which was prepared from the NaOH pellet with 97% purity, and sodium 144
silicate (Na2SiO3) with Na2O=14.7% and SiO2=29.4%. Washed sand was selected as 145
aggregate in the experiments. Two kinds of sand conditions were prepared: (a) without 146
saturated surface dry (SSD) condition and (b) with SSD condition in accordance to the 147
Australian standard AS1141.5 [29]. 148
The original moisture of sand at room temperature was 9%. However, the water absorption 149
of the sand was only 1% and it is thought that this amount of water would be absorbed into 150
the sand particles, namely absorbed water. Therefore, sample with and without SSD 151
condition would be differed by moisture of 8%. This moisture level is believed to have 152
contributed to the free moisture on the surfaces of the sand particles. From vision observation, 153
the free moisture is therefore making the appearances of the sand particles shiny. As the 154
absorbed water is not considered when the liquid/ash ratio is evaluated, the sample with and 155
without SSD condition would be differed by the free moisture. The effect of SSD on 156
compressive strength is being investigated here-in-after. 157
The materials were mixed according to proportions shown in Table 2. The ratio of fly ash 158
to sand used for these series of experiments was 1: 2 by mass ratio, whereas the ratio of 159
Na2SiO3/ NaOH was 2.5 by mass ratio. Different ratios of liquid to ash were used on GFA 160

8
and SFA in order to achieve similar workability. It is found that the mixture becomes very 161
viscous and difficult to flow when the ratio of liquid to ash on SFA is similar as for GFA. 162
Fly ash and sand was premixed using a mortar mixer. Then, Na2SiO3 and NaOH solutions 163
were added into the mixture and further mixing took place for another 5 minutes. The mixture 164
was casted into cube moulds measuring 50 mm × 50 mm × 50 mm. The moulds were 165
vibrated on the vibrating table to dissipate air bubbles from within samples. The moulds were 166
then sealed with plastic sheet and placed into the curing box to be heat-cured in the oven at 167
60⁰C for 24 hours. After 24 hours of curing, the samples were taken out from the oven and 168
demoulded. The samples were then tested for compressive strength (i.e. strength after 1 day). 169
The remaining samples were cured at room temperature until the date of strength test (i.e. 170
strength after 7 days). 171
3.3. Tests 172
X-Ray Diffraction (XRD) test was carried out using (Bruker AXS D8 Advance XRD) to 173
determine the phase component of the tested ashes. The test was operated with CuKα 174
radiation at a scanning rate of 0.02 time per step over a 2Ɵ range scanned from 10 to 90 steps. 175
The results obtained from this test were qualitative in nature. 176
The particle size distributions (PSD) of the fly ashes were obtained using Laser Particle 177
Size Analyser (CILAS 1190). The morphology of the fly ashes was studied using the 178
Scanning Electron Microscopy (SEM) (ZEISS SUPRA 40 VP SEM). 179
Loss on Ignition (LOI) test was conducted using the Muffle Furnace. The fly ash was 180
heated in the furnace at 1100 C with temperature increase rate of 3.33 C/min. Subsequently, 181
the temperature was decreased to 110 C and samples were cooled in the furnace for 2 hours. 182
The weight of the sample was measured before placing into the furnace and after the test 183
finished. 184
Table 2 Details of geopolymer samples 185

9
Group Sample Ash/ sand ratio Na2SiO3/NaOH ratio Liquid/ash ratio
Sand without
SSD
GFA 1:2 2.5 0.51
SFA 1:2 2.5 0.61
Sand with
SSD
GFA 1:2 2.5 0.35
SFA 1:2 2.5 0.45
Note: Sample of sand with and without SSD condition differs by free moisture of 8%. 186
The workability of the sample was measured using the flow table in accordance to the 187
ASTM-C1537 standard [30]. The compressive strength test was carried out in accordance to 188
the ASTM-C109/C109M standard [31]. Three samples from each mix were tested for the 189
strength and the average value was reported as the compressive strength of the corresponding 190
mixture. 191
192
4. Results and Discussions 193
4.1. Compressive Strength 194
The compressive strengths of geopolymer using GFA and SFA were determined after 1 195
day and 7 days of curing as shown in Fig. 2. The test results show that the compressive 196
strength of GFA geopolymer was generally higher than SFA geopolymer. The highest 197
compressive strength was obtained on GFA samples after 7 days (i.e. 62 MPa) and SFA 198
samples after 7 days (i.e. 55 MPa). Factors affecting the strength of SFA and GFA 199
geopolymers are discussed in the following section. 200

10
201
Fig. 2. Compressive strength of geopolymer using GFA and SFA 202
4.2. Chemical Composition 203
As presented in Table 1, the chemical compositions of GFA and SFA are rather similar 204
but different in proportions. The major components of both GFA and SFA are SiO2, Al2O3 205
and Fe2O3, followed by CaO, MgO and K2O. Other components present in small quantities. 206
Basically, all the elements on GFA are higher than SFA with the exception of K2O and MnO. 207
It is important to note that SFA contains relatively large quantities of MnO. As compared 208
to the other fly ashes or OPC, MnO content in SFA is similar to manganese slag as presented 209
in Table 1. The influence of MnO content on the quality of fly ash is assessed with regard to 210
the quality index as given in Equation (1): 211
Ia =CaO+0.5MgO + Al2O3 +CaS
SiO2+MnO (1) 212
The large quantities of MnO content in SFA significantly reduce the quality of fly ash by 2 213
times as compared to GFA, i.e. 0.6 for GFA and 0.3 for SFA. High amount of MnO content 214
reduces the geopolymer strength as it has poorer hydraulicity and high porous structure. It 215
also inhibits the early strength development [32]. The reason of high MnO content can be 216
most likely attributed to the existence of pyrite and illite minerals bound to the original coal 217
11
and should be removed during pre-combustion coal cleaning [33]. The Mn compound is 218
predominantly deposited in larger fly ash particle size and the amount increases with the 219
particle size. The particle size distribution of SFA as discussed in the following section is 220
shown to agree well to this statement. 221
High amount of unburned carbon content hinder the geopolymerisation reaction. Besides, 222
it may affect the workability and strength capability [5]. However, the LOI values of GFA 223
and SFA in this research were found to be 0.57% and 0.49%, respectively. The results 224
indicate that both fly ash types have very low unburnt carbon content and hence, the effect of 225
LOI on geopolymer strength can be neglected. 226
4.3. Mineralogy 227
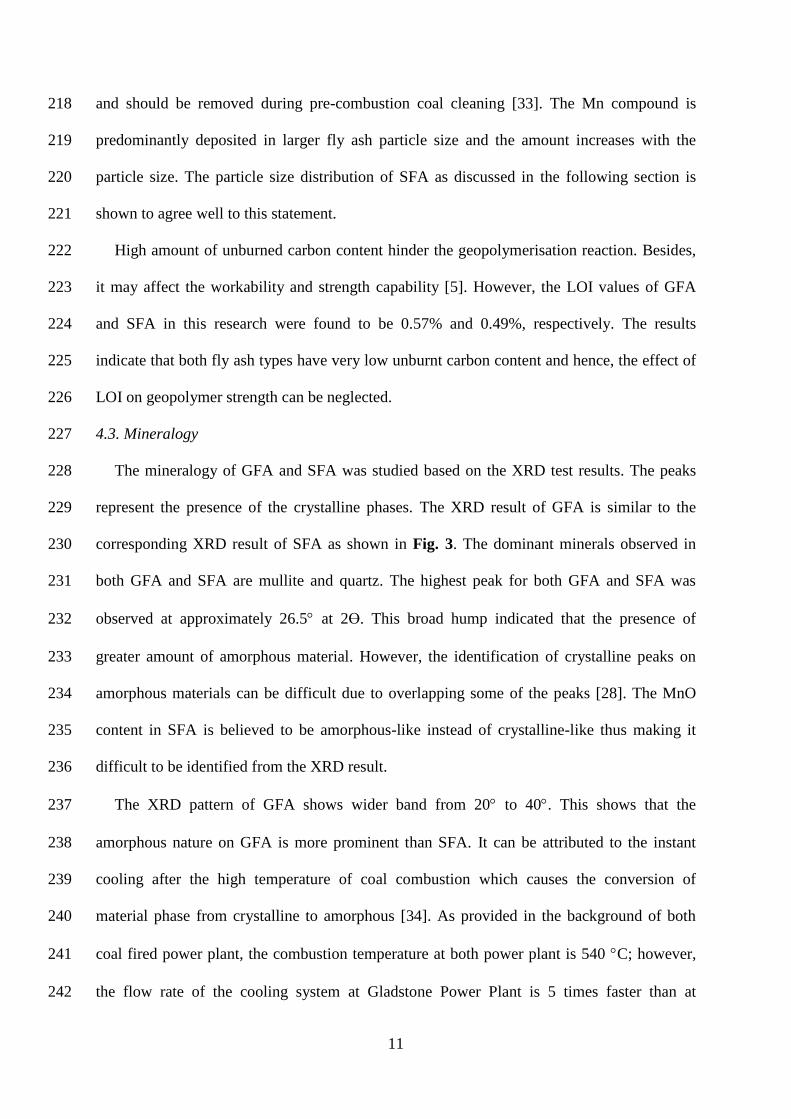
The mineralogy of GFA and SFA was studied based on the XRD test results. The peaks 228
represent the presence of the crystalline phases. The XRD result of GFA is similar to the 229
corresponding XRD result of SFA as shown in Fig. 3. The dominant minerals observed in 230
both GFA and SFA are mullite and quartz. The highest peak for both GFA and SFA was 231
observed at approximately 26.5 at 2Ɵ. This broad hump indicated that the presence of 232
greater amount of amorphous material. However, the identification of crystalline peaks on 233
amorphous materials can be difficult due to overlapping some of the peaks [28]. The MnO 234
content in SFA is believed to be amorphous-like instead of crystalline-like thus making it 235
difficult to be identified from the XRD result. 236
The XRD pattern of GFA shows wider band from 20 to 40. This shows that the 237
amorphous nature on GFA is more prominent than SFA. It can be attributed to the instant 238
cooling after the high temperature of coal combustion which causes the conversion of 239
material phase from crystalline to amorphous [34]. As provided in the background of both 240
coal fired power plant, the combustion temperature at both power plant is 540 C; however, 241
the flow rate of the cooling system at Gladstone Power Plant is 5 times faster than at 242
12
Sejingkat Power Plant. The mineral matter is quenched into the particle after the combustion 243
of coal and therefore, the particle tends to behave more spherical to rounded shape with 244
glassy exterior surface [35]. The greater flow rate ensures the combustion is cooled at a faster 245
rate thus the temperature gradient is greater. This quenching associates with the instant 246
cooling, controls the growth and the agglomeration of particles. More amorphous content can 247
be quenched into the fly ash particles and thus, as a result of better amorphous nature of fly 248
ash. Consequently, GFA shows richer amorphous phase than SFA and enhances the strength 249
development. More amorphous silica and alumina can be dissolved from GFA and contribute 250
to the geopolymerisation and therefore, form stronger geopolymer structure. 251
252 Fig. 3. Result of X-ray diffraction (XRD) on GFA and SFA 253
4.4. Particle Size Distribution 254
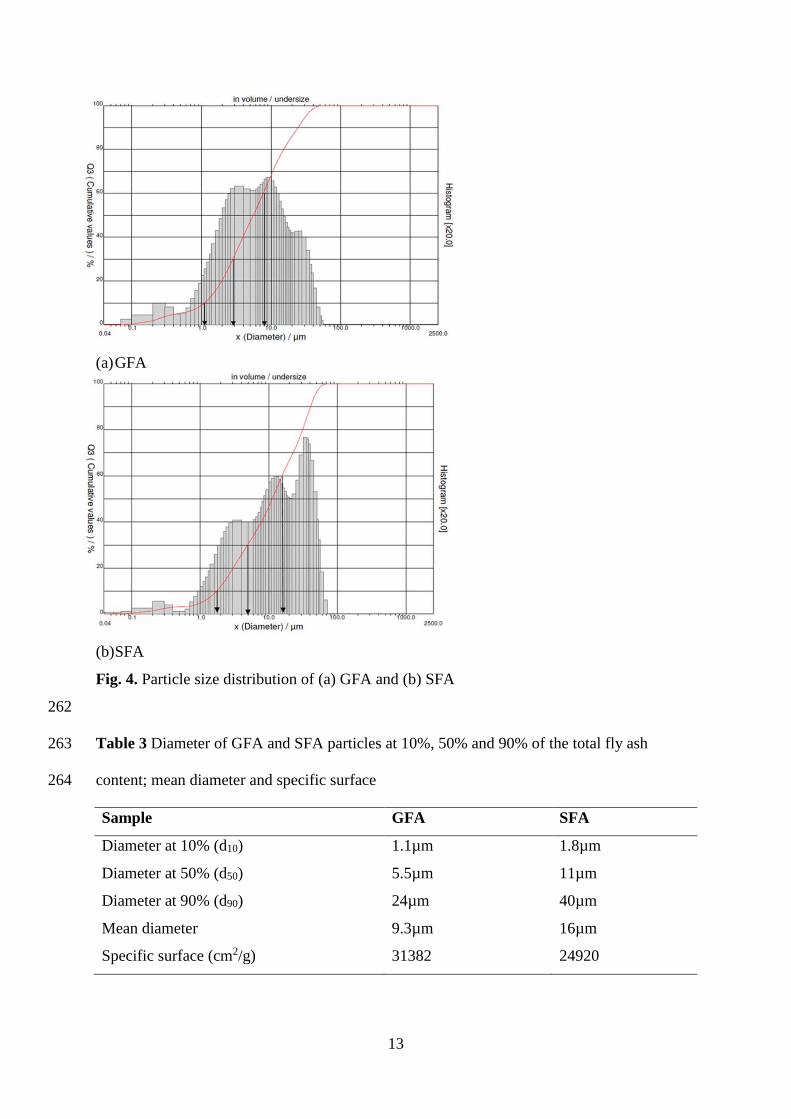
The results of the particle size distribution on GFA and SFA are presented in Fig. 4. Table 255
3 shows the test results of particle diameter at 10% (d10), 50% (d50) and 90% (d90), and the 256
mean diameter. Both GFA and SFA show broad distribution pattern in their respective 257
particle size distribution plots. However, GFA particles are observed to be approximately two 258
times smaller than SFA. For GFA, it is predominantly smaller than 24 µm whereas SFA is 259
predominantly smaller than 40 µm, both comprising 90% of the total fly ashes. The mean 260
particle diameter of GFA is 9.3 µm whereas SFA is 16 µm. 261
13
(a) GFA
(b) SFA
Fig. 4. Particle size distribution of (a) GFA and (b) SFA
262
Table 3 Diameter of GFA and SFA particles at 10%, 50% and 90% of the total fly ash 263
content; mean diameter and specific surface 264
Sample GFA SFA
Diameter at 10% (d10) 1.1µm 1.8µm
Diameter at 50% (d50) 5.5µm 11µm
Diameter at 90% (d90) 24µm 40µm
Mean diameter 9.3µm 16µm
Specific surface (cm2/g) 31382 24920
14
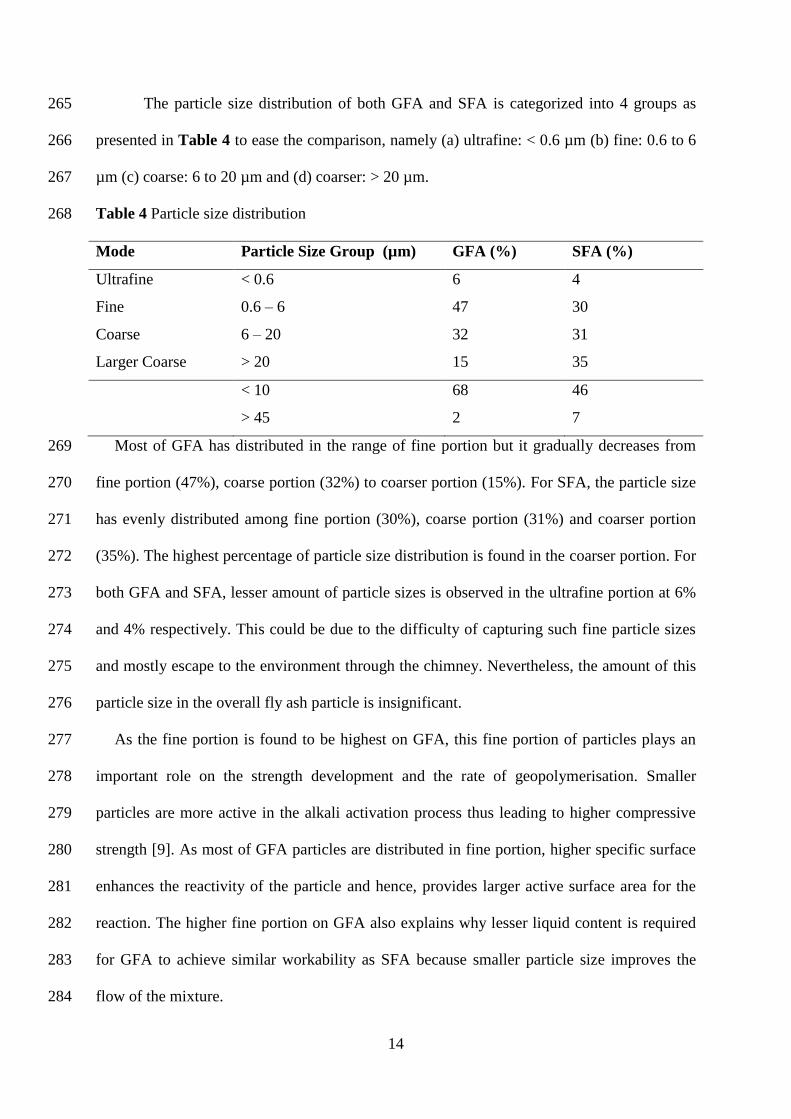
The particle size distribution of both GFA and SFA is categorized into 4 groups as 265
presented in Table 4 to ease the comparison, namely (a) ultrafine: < 0.6 µm (b) fine: 0.6 to 6 266
µm (c) coarse: 6 to 20 µm and (d) coarser: > 20 µm. 267
Table 4 Particle size distribution 268
Mode Particle Size Group (µm) GFA (%) SFA (%)
Ultrafine < 0.6 6 4
Fine 0.6 – 6 47 30
Coarse 6 – 20 32 31
Larger Coarse > 20 15 35
< 10 68 46
> 45 2 7
Most of GFA has distributed in the range of fine portion but it gradually decreases from 269
fine portion (47%), coarse portion (32%) to coarser portion (15%). For SFA, the particle size 270
has evenly distributed among fine portion (30%), coarse portion (31%) and coarser portion 271
(35%). The highest percentage of particle size distribution is found in the coarser portion. For 272
both GFA and SFA, lesser amount of particle sizes is observed in the ultrafine portion at 6% 273
and 4% respectively. This could be due to the difficulty of capturing such fine particle sizes 274
and mostly escape to the environment through the chimney. Nevertheless, the amount of this 275
particle size in the overall fly ash particle is insignificant. 276
As the fine portion is found to be highest on GFA, this fine portion of particles plays an 277
important role on the strength development and the rate of geopolymerisation. Smaller 278
particles are more active in the alkali activation process thus leading to higher compressive 279
strength [9]. As most of GFA particles are distributed in fine portion, higher specific surface 280
enhances the reactivity of the particle and hence, provides larger active surface area for the 281
reaction. The higher fine portion on GFA also explains why lesser liquid content is required 282
for GFA to achieve similar workability as SFA because smaller particle size improves the 283
flow of the mixture. 284

15
The Coefficient of Uniformity (Cu) and Coefficient of Curvature (Cc) were also used to 285
compare the uniformity of particle sizes and the gradation of the particle size distribution 286
curve for GFA and SFA as given in Equations (4) and (5). 287
Cu =d60
d10 (4) 288
Cc =d30²
d60 x d10 (5) 289
It was found that the Cu for GFA is 7.3, which is lower than SFA with a value of 9.4. 290
Higher Cu value represents the particle size distribution being more non-uniform and contains 291
wider ranges of particle sizes. However, the higher amount of fine particles in GFA enhances 292
the filler effect. This in turn suggests that GFA has capability of more closely packed 293
particles than SFA and therefore, lesser voids and higher strength potential. The structure 294
formed tends to be more compact and rigid. 295
Cc value indicates the degree of curvature of the particle size distribution plot. Both GFA 296
and SFA have a Cc value of approximately 1, which is within the range of 1 to 3. Therefore, 297
both fly ash particle size distributions are classified as well-graded. 298
4.5. Scanning Electron Microscopy 299
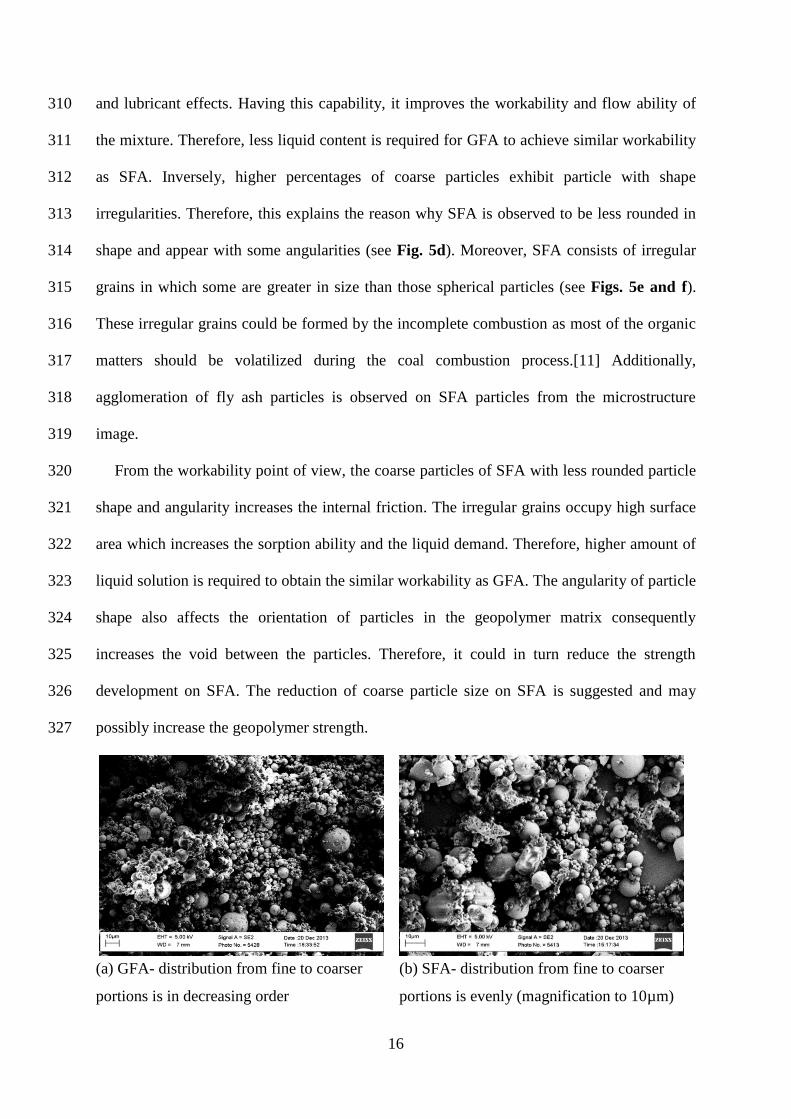
As shown in the SEM micrographs, the fly ash particles of GFA are observed to be 300
predominantly smaller than SFA (see Fig. 5a and b). The distribution of both types of fly ash 301
are generally heterogenous and non-uniform as observed under the microsrope. Distinct 302
distribution of particle size between large particles and small particles are obvious on GFA. 303
For SFA, the particle sizes are evenly distributed. This observation is consistent to the results 304
of the PSD. 305
The morphology of ultrafine and fine particles are basically presented in smooth spheres 306
and they are rounded in nature [12]. GFA has higher percentage of ultrafine and fine portion, 307
which explains its morphology consisting of smooth spherical particles with less irregular 308
grains (see Fig. 5c). Fly ash with smooth spherical particle shape enhances the ball bearing 309
16
and lubricant effects. Having this capability, it improves the workability and flow ability of 310
the mixture. Therefore, less liquid content is required for GFA to achieve similar workability 311
as SFA. Inversely, higher percentages of coarse particles exhibit particle with shape 312
irregularities. Therefore, this explains the reason why SFA is observed to be less rounded in 313
shape and appear with some angularities (see Fig. 5d). Moreover, SFA consists of irregular 314
grains in which some are greater in size than those spherical particles (see Figs. 5e and f). 315
These irregular grains could be formed by the incomplete combustion as most of the organic 316
matters should be volatilized during the coal combustion process.[11] Additionally, 317
agglomeration of fly ash particles is observed on SFA particles from the microstructure 318
image. 319
From the workability point of view, the coarse particles of SFA with less rounded particle 320
shape and angularity increases the internal friction. The irregular grains occupy high surface 321
area which increases the sorption ability and the liquid demand. Therefore, higher amount of 322
liquid solution is required to obtain the similar workability as GFA. The angularity of particle 323
shape also affects the orientation of particles in the geopolymer matrix consequently 324
increases the void between the particles. Therefore, it could in turn reduce the strength 325
development on SFA. The reduction of coarse particle size on SFA is suggested and may 326
possibly increase the geopolymer strength. 327
(a) GFA- distribution from fine to coarser
portions is in decreasing order
(b) SFA- distribution from fine to coarser
portions is evenly (magnification to 10µm)

17
(magnification to 10µm)
(c) GFA- smooth sphere and rounded in
shape (magnification to 20µm)
(d) SFA- less rounded in shape and appear
with some angularities (magnification to
20µm)
(e) SFA- irregular grain (magnification to
10µm)
(f) SFA- irregular grains in which some
are greater in size than those spherical
particles (magnification to 20µm)
Fig. 5. SEM on GFA and SFA 328
4.6. Liquid to ash ratio 329
It is observed that SFA requires higher ratio of liquid to ash but the compressive strength 330
obtained is lower than GFA. Although higher amount of alkaline solution should be able to 331
leach more silica and alumina from the fly ash and consequently enhances the 332
geopolymerisation process, it is not the case as observed on SFA performance. It could be 333
due to higher usage of alkaline solution that may obstruct the water evaporation and the 334
structure formation [36]. Other than that, fly ash with mostly amorphous phase enhances the 335
leaching capability of SiO2 and Al2O3 [37]. It is believed that the better amorphous phase of 336
18
GFA than SFA demonstrates greater leaching capability and enhances the geopolymerisation 337
between the alkaline solution and fly ash, thus increasing the compressive strength. 338
4.7. Sand with SSD condition 339
It is worth mentioning that the effect of sand condition on geopolymer strength is 340
significant as shown in Fig. 6. For samples using sand without SSD condition, the strength 341
increments from 1 day to 7 days were 4% and 3% for GFA and SFA respectively. As free 342
moisture exists in sand without SSD condition, it weakens the concentration of alkaline 343
solution. Additionally, this free moisture is not involved in the chemical reaction of 344
geopolymer because the geopolymerisation is activated by the alkaline solution, unlike 345
cement the strength development is built up through water hydration. Therefore, it is believed 346
that the free moisture in the samples have evaporated when subjected to heat drying in the 347
oven. This will subsequently weaken the matrix formed and cause a decrease in strength. 348
The strength increments of samples using sand with SSD condition after 1 day to 7 days 349
were 17% for GFA and 31% for SFA. As free moisture is eliminated from sand with SSD 350
condition, the actual concentration of alkaline solution is completely used for the 351
geopolymerisation thus higher compressive strength can be obtained. 352
The strength increments for samples using sand with SSD condition from those samples 353
without SSD condition after 1 day were 15% and 14% for GFA and SFA samples whereas it 354
was found to be 29% and 45% after 7 days respectively. The strength increment of SFA 355
samples was approximately 16% higher than GFA sample after 7 days. 356

19
357
Fig. 6. Strength increment of geopolymer using sand with and without SSD condition 358
Both compressive strengths of GFA and SFA have been observed to increase with curing 359
age. This observation could be due to some unreacted fly ash particles, which earlier on did 360
not manage to undergo geopolymerisation during heat curing in oven that continued to react 361
with the alkaline solution when being cured at room temperature. Also, it could be due to the 362
reaction on the reactive fine particle size of fly ash which consequently improved the bonds 363
in geopolymer over the curing age [38]. 364
The strength increments of SFA over the curing age were observed to be 14% higher than 365
GFA. This suggested that the rate of geopolymerisation for SFA samples was initially slower 366
and mainly developed its strength with the curing age. SFA which has relatively larger 367
particle size may need longer period for dissolution of fly ash particles to build up the 368
strength. Therefore, better strength development was observed at later stage. 369
370
5. Conclusions 371
Fly ash from Sarawak (SFA) was used to assess its potential in making geopolymer and 372
the results were compared with Gladstone fly ash (GFA) from Australia. The results obtained 373
from the experiments showed that SFA-based geopolymer developed lower compressive 374

20
strength (55 MPa) than geopolymer using GFA (62 MPa) after 7 days. The factors affecting 375
SFA geopolymer obtained lower compressive strength than GFA are listed as below: 376
1. SFA and GFA behave very differently in nature. Besides the different color (brownish on 377
GFA whereas grey on SFA), all the chemical elements on GFA are higher than SFA with 378
the exception of K2O and MnO. The large quantities of MnO content on SFA reduce the 379
quality index of fly ash by 2 times as compared to GFA, i.e. 0.6 for GFA and 0.3 for 380
SFA. 381
2. The effect of LOI on geopolymer strength can be neglected due to low LOI content on 382
both fly ashes (<1%). 383
3. GFA shows better amorphous phase than SFA. The faster flow rate of cooling system at 384
Gladstone Power Plant than Sejingkat Power Station (approx. 5 times) enhances the 385
amorphous nature of GFA. 386
4. The PSD of GFA is predominantly smaller than 24 µm whereas SFA is predominantly 387
smaller than 40µm, both comprising 90% of the total fly ashes. The finer particles on 388
GFA have better ability to have more closely packed particles to enhance the filler effect 389
and better reactivity. It also acts as ‘nucleation sites’ to develop strength. 390
5. The morphology studies show that SFA has been observed to be less rounded in shape 391
and appear with some angularities whereas GFA has been observed to consist mainly of 392
smooth spherical particles and less irregular grains. The former type increases the liquid 393
demand for workability but reduces the strength development; inversely, the latter type 394
increases the ball bearing and lubricant effect for workability also enhancing the strength 395
development. 396
6. SFA samples have higher strength increment of approx. 14% than GFA samples over the 397
curing age. It has suggested that the geopolymerisation of SFA was initially slower and 398
the strength development was built up at later stage. 399
21
This paper shows that Sarawak fly ash can be a potential construction material for 400
producing Sarawak fly ash-based geopolymer. With benchmarking against the well-401
developed Gladstone fly ash-based geopolymer, factors that influence the strength capability 402
of Sarawak fly ash-based geopolymer can be effectively improved to achieve the desired 403
strength performance. 404
405
Acknowledgments 406
The first author would like to express her sincere gratitude to the Centre for Sustainable 407
Infrastructure (Hawthorn Campus) and Swinburne Sarawak Research Centre for Sustainable 408
Technologies for giving her the opportunity to travel to Melbourne to conduct the 409
experiments. The authors would like to also acknowledge the financial support from the 410
Melbourne Sarawak Research Collaboration Scheme. The assistance, guidance and support 411
rendered by Mr. Brian Lynch and Ms. Chandani Tennakoon during the collaboration project 412
are gratefully acknowledged. 413
414
References 415
[1] Davidovits J. Geopolymer Chemistry and Application 3rd ed. France: Institute Geopolymer 2008. 416 [2] Duxson P, Provis JL, Lukey GC, Deventer JSJv. The role of inorganic polymer technology in the 417 development of ‘green concrete’. Cem Con Res. 2007;37:1590-7. 418 [3] Ariffin MAM, Bhutta MAR, Hussin MW, Tahir MM, Aziah N. Sulfuric acid resistance of blended ash 419 geopolymer concrete. Constr Build Mater. 2013;43:80-6. 420 [4] Hussin MW, Bhutta MAR, Azreen M, Ramadhansyah PJ, Mirza J. Performance of blended ash geopolymer 421 concrete at elevated temperatures. Mater Struct. 2015;48:709-20. 422 [5] Ferna´ndez-Jime´nez A, Palomo A. Characterisation of fly ashes. Potential reactivity as alkaline cements. 423 Fuel. 2003;82:2259–65. 424 [6] Vassilev SV, Vassileva CG. A new approach for the classification of coal fly ashes based on their origin, 425 composition, properties, and behaviour. Fuel. 2007;86:1490–512. 426 [7] Chindaprasirta P, Homwuttiwong S, Sirivivatnanon V. Influence of fly ash fineness on strength, drying 427 shrinkage and sulfate resistance of blended cement mortar. Cem Con Res. 2004;34:1087–92. 428 [8] Chatterjee AK. Indian Fly Ashes: Their Characteristics and Potential for Mechanochemical Activation for 429 Enhanced Usability. J Mater Civ Eng. 2011;23:783-8. 430 [9] Komljenovi M, Baˇsˇcarevi Z, Bradi´c V. Mechanical and microstructural properties of alkali-activated fly 431 ash geopolymers. J Hazard Mater. 2010;181:35–42. 432 [10] Mehta PK. Influence of Fly Ash Characteristic on the Strength of Portland-Fly Ash Mixtures. Cem Con 433 Res. 1985;15:669-74. 434 [11] Smith RD, Campbell JA, Nielson KK. Characterization and Formation of Submicron Particles in Coal-435 Fired Plants. Atmos Environ. 1978;13:607-17. 436 [12] Linak WP, Miller CA, Seames WS, Wendt JOL, Ishinomori T, Endo Y, et al. On Trimodal Particle Size 437 Distributions in FLy Ash from Pulverized Coal Combustion. Proc Combust Inst. 2002;29:441–7. 438

22
[13] Chancey RT, Stutzman P, Juenger MCG, Fowler DW. Comprehensive phase characterization of crystalline 439 and amorphous phases of a Class F fly ash. Cem Con Res. 2010;40:146–56. 440 [14] Ibáñez J, Font O, Moreno N, Elvira JJ, Alvarez S, Querol X. Quantitative Rietveld analysis of the 441 crystalline and amorphous phases in coal fly ashes. Fuel 2013;105:314–7. 442 [15] Institute G. World’s First Public Building with Structural Geopolymer Concrete. 2013. 443 [16] Tennakoon C, Nazari A, Sanjayan JG, Sagoe-Crentsil K. Distribution of oxides in fly ash controls strength 444 evolution of geopolymers. Constr Build Mater. 2014;71:72–82. 445 [17] Bakharev T. Geopolymeric materials prepared using Class F fly ash and elevated temperature curing. Cem 446 Con Res. 2005;35: 1224 – 32. 447 [18] Bakharev T. Thermal behaviour of geopolymers prepared using class F fly ash and elevated temperature 448 curing. Cem Con Res. 2006;36:1134–47. 449 [19] Kong DLY, Sanjayan J, Sagoe-Crentsil K. Comparative Performance of Geopolymers made with 450 Metakaolin and Fly Ash after Exposure to Elevated Temperature. Cem Con Res. 2007;37:1583-9. 451 [20] Kong DLY, Sanjayan JG. Damage behavior of geopolymer composites exposed to elevated temperatures. 452 Cem Con Compos. 2008;30:986–91. 453 [21] Smart A, Aspinall A. Water and the Electricity Generation Industry. 2009. 454 [22] Gladstone N. The Process: Gladstone Power Station. 2008. 455 [23] Australia AG-G. Australian Coal In-situ Resources. 2012. 456 [24] Giasuddin HM, Sanjayan JG, Ranjith PG. Strength of geopolymer cured in saline water in ambient 457 conditions. Fuel 2013;107:34-9. 458 [25] ASTM-C618. Standard Specification for Coal Fly Ash and Raw or Calcined Natural Pozzolan for Use in 459 Concrete. 2005. 460 [26] Rai A, Prabakar J, Raju CB, Morchalle RK. Metallurgical Slag as a Component in Blended Cement. Constr 461 Build Mater. 2002;16:489–94. 462 [27] Sutan NM, Yakub I, Hamdan S. Physicochemical Characterization of Polymer Composite Cement Systems. 463 WIT Trans Built Env. 2014. 464 [28] Allahverdi A, Ahmadnezhad S. Mechanical activation of silicomanganese slag and its influence on the 465 properties of Portland slag cement. Powder Technol. 2014;251:41–51. 466 [29] AS1141.5. Method for Sampling and Testing Aggregates: Particle Density and Water Absorption of Fine 467 Aggregate. Australian Standard; 2000. 468 [30] ASTM-C1437. Standard Test Method for Flow of Hydraulic Cement Mortar. ASTM International2013. 469 [31] ASTM-C109/C109M. Standard Test Method for Compressive Strength of Hydraulic Cement 470 Mortars(Using 2-in. or [50-mm] Cube Specimens). ASTM International; 2005. 471 [32] Pera J, Ambroise J, Chabannet M. Properties of Blast Furnace Slags Containing High Amounts of 472 Manganese Cem Con Res. 1999;29:171–7. 473 [33] Juda-Rezler K, Kowalczyk D. Size Distribution and Trace Elements Contents of Coal Fly Ash from 474 Pulverized from Boilers. Pol J Environ Stud. 2013;22:25-40. 475 [34] Itskos G, Itskos S, Koukouzas N. Size fraction characterization of highly-calcareous fly ash. Fuel Process 476 Technol. 2010;91:1558–63. 477 [35] Joshi RC, Lohtia RP. Fly Ash in Concrete Production, Properties and Uses. The Netherlands: Gordon and 478 Breach Science Publishers; 1997. 479 [36] Chindaprasirt P, Chareerat T, Sirivivatnanon V. Workability and strength of coarse high calcium fly ash 480 geopolymer. Cem Con Compos. 2007;29:224-9. 481 [37] Sukmak P, Horpibulsuk S, Shen S-L, Chindaprasirt P, Suksiripattanapong C. Factors influencing strength 482 development in clay–fly ash geopolymer. Constr Build Mater. 2013;47:1125–36. 483 [38] Choi SJ, Lee SS, Monteiro PJM. Effect of Fly Ash Fineness on Temperature Rise, Setting, and Strength 484 Development of Mortar. J Mater Civ Eng. 2012;24:499-505. 485
486 Highlights 487
Geopolymer produces lower carbon footprint and this leads to cleaner production. 488
Strength of geopolymer made using fly ash from Malaysia and Australia are studied. 489
Both types of fly ash vary in chemical contents, mineral phase and particle size. 490
Geopolymer made using Malaysia fly ash show lower strength but has great potential. 491