2. life cycle inventory - united states environmental · pdf file · 2015-05-142....
TRANSCRIPT

Application of LCA to Nanoscale Technology: Li-ion Batteries for Electric Vehicles ▌pg. 32
2. Life-Cycle Inventory
Quantification of the life-cycle inventory (LCI) is the second phase of an LCA study. A product system
is made up of multiple processes needed to produce, use, and dispose, recycle, or reuse the product. As
presented in Figure 2-1, each process consists of an inventory of input and output flows.
Process
Materials
Energy
ResourcesWaste
Product
Inputs Outputs
Figure 2-1. Process Input and Output Flows
Accordingly, an LCI of a product system consists of a set of inventories for processes throughout the life
cycle of the product – from upstream materials extraction, to materials processing, product manufacture,
product use, and then end-of-life. Figure 1-4 presents the Generic Process Flow Diagram illustrating the
key processes that were modeled for this LCA study.
Section 2 presents a detailed description of the LCI data collection methodology, data sources, and
limitations and uncertainties for each life-cycle stage. Detailed LCI data could not be presented due to
confidentiality and data licensing restrictions.
2.1 Upstream Materials Extraction and Processing Stage
The materials extraction and materials processing (ME&P) stages, or stages A and B in Figure 1-4, are
―upstream‖ of the Li-ion battery component and product manufacturing stages. We obtained LCI data
from our project partners (i.e., primary data) for the components manufacture and product manufacture
stages (stages C and D), and we relied on secondary data sources for the upstream stages. The secondary
data included LCI data available in the GaBi4 LCA software tool, as well as published studies.
The materials included in the inventory for the ME&P stages were identified as those materials used to
produce the Li-ion battery components - both primary and ancillary materials (i.e., solvents and process
materials). Accordingly, the following section first describes the bill of materials (BOM) for the batteries,
which reflects the key components and materials used to manufacture the batteries. Next, based on the
BOM, we describe the upstream LCI data sources and limitations.
2.1.1 Bill of Materials
Bills of materials for the batteries in this study are presented in Table 2-1. The table presents the range in
weight for each component (kg) on a kWh of battery capacity basis, and corresponding percentage of total
mass for the battery chemistries assessed in this study. The quantities are based on primary data collected
from battery manufacturers under confidentiality agreements. In addition, data from two secondary
sources were incorporated to mask the confidential data. However, because these sources are public, it
was necessary to present a range in mass for each component to protect the confidential data.

Application of LCA to Nanoscale Technology: Li-ion Batteries for Electric Vehicles ▌pg. 33
Table 2-1. Bill of Materials for Li-ion Batteries Assessed (Total Mass: 10-12 kg)
Component Percent Mass (%) \1
Anode 15 – 24
Copper foil (collector) 1 – 12
Battery grade graphite/carbon 8 – 13
Polymer <1 – 0
Auxiliary solvent \2 <1 – 6
Cathode 29 – 39
Aluminum (collector) 4 – 9
Lithium-ion material 22 – 31
Polymer/other <1 – 3
Auxiliary solvent \2 <1 – 11
Separator 2 – 3
Polymer 2 – 3
Cell Casing 3 – 20
Aluminum casing and polymer pouch 3 – 20
Electrolyte 8 – 15
Carbonate solvents 7 – 13
Lithium hexafluorophosphate (LiPF6) 1 – 2
BMS 2
Copper wiring 1
Steel 1
Printed wire board <1
Battery Pack Casing/Housing 17 – 23
Polypropylene/polyethylene terephthalate/steel 17 – 23
Passive Cooling System \2
17 – 20
Steel and aluminum 17 – 20
Total 100
Notes: \1
Percentage mass for these components was calculated by dividing the mass of each component by the total mass of the battery pack. \2
Auxiliary solvent and cooling system were not included in total mass of battery pack since they are not typically included when calculating energy density.
In addition to the components presented above, we also assessed the single-walled carbon nanotube
(SWCNT) as an anode component. As discussed in Section 1, nanomaterials such as SWCNTS are being
researched and developed to improve the energy density and ultimate performance of the batteries. In
fact, both of our battery partners are currently researching the use of nano-based anodes for manufacture
of the battery cells. Therefore, based on laboratory data and research from Arizona State University, LCI
data for SWCNT anodes were also obtained, and are described in Section 2.1.2.
2.1.2 Methodology and Data Sources
Based on the BOM data for each battery chemistry, and information provided by the battery
manufacturers and published studies, we identified the corresponding upstream materials required to
manufacture each component. The key studies we relied on for secondary data included:
Contribution of Li-ion Batteries to the Environmental Impact of Electric Vehicles (Notter
et. al, 2010). This study used a detailed life-cycle inventory of a Li-ion battery (manganese oxide
spinel) and a rough LCA of the use stage. The LCI data used for the study were primarily
ecoinvent data, modeling data, and mass data from a Kokam Co. battery cell (for the
manufacturing stage).

Application of LCA to Nanoscale Technology: Li-ion Batteries for Electric Vehicles ▌pg. 34
Life-Cycle Environmental Assessment of Lithium-Ion and Nickel Metal Hydride Batteries
for Plug-in Hybrid and Battery Electric Vehicles (Majeau-Bettez et. al., 2011). This study is
a cradle-through-use LCA of three Li-ion battery chemistries for EVs. The batteries assessed
included nickel metal hydride (NiMH), nickel cobalt manganese lithium-ion (NCM), and iron
phosphate lithium-ion (LFP). The study relied primarily on ecoinvent 2.2 data and secondary
data from various literature sources.
Comparative Environmental Life-Cycle Assessment of Conventional and Electric Vehicles
(Hawkins et. al, under review). This study, which is currently undergoing peer review before
publication, provides a comparison between conventional vehicles using internal combustion
engines and electric vehicles using two battery chemistries (Li-NCM and Li-FePO4). The LCI
data for the study relies on a combination of LCI databases (e.g., the Greenhouse Gases,
Regulated Emissions, and Energy Use in Transportation (GREET) Model), other secondary data
sources, and information from vehicle manufacturers obtained through personal communication.
Data for the upstream stages were provided on a mass per kWh basis, which was then converted to a per
kilometer basis (as described in Section 2.3). Below we describe the materials and data sources in detail
for each component, and summarize the information in Table 2-2. The manufacturing processes for the
components are described in detail in Section 2.2. Note that some materials names were left generic to
protect confidential information.
Anode: The anode consists of the negative electrode of the battery. Anodes are typically
composed of a powdered graphite material, which is combined with a binder and coated on
copper foil (Gaines and Cuenca, 2000; Electropedia, 2011). For this study, we used data for a
battery grade graphite material from Notter et al. (2010) and copper foil input-output data
fromGaBi4. For the binder, we used data for a polymer material, which was also from GaBi4.
During the anode manufacturing process, a solvent is also typically used to develop the slurry
anode paste, which is then coated on the foil and dried. Because the solvent is an ancillary
material that does not become part of the battery cell, it may be recovered and reused. The
organic solvent material data were also obtained from GaBi4.
For battery-grade graphite, we assumed production takes place in China. We also assumed a
shipping distance of 7,300 mile (11,800 km) by oceangoing vessel from Shenzen to Long Beach,
followed by domestic transport of 95% by mass, at an average distance of 260 miles (418 km) in
a for-hire truck; and 5% by mass, at an average distance of 853 miles (1373 km) in railcars (U.S.
BLS, 1997).
Cathode: The cathode is the positive electrode, and is composed of metal oxides (Gaines and
Cuenca, 2000). The battery chemistries used by the battery manufacturers in this partnership
include a lithium-manganese oxide (LiMnO2)-like material, whose exact chemical makeup
remains confidential, and lithium-nickel-cobalt-manganese-oxide (LiNi0.4Co0.2Mn0.4O2; Li-NCM).
In order to further protect confidential information, and to have a comparison point to another
frequently used cathode material, we also modeled lithium-iron phosphate (LiFePO4) battery
chemistry. LCI data for the for the LiMnO2 were slightly modified from those of the lithium
manganese oxide spinel in Notter et al. (2010), whereas the data for the other two active material
chemistries were largely obtained from the Majeau-Bettez et al. (2011) study.
Similar to the anode, the cathode material is combined with a binder material and mixed in a
slurry paste with solvent before it is coated onto a collector composed of aluminum foil. Data for

Application of LCA to Nanoscale Technology: Li-ion Batteries for Electric Vehicles ▌pg. 35
the aluminum foil came from the European Aluminum Association (EAA, 2008) via GaBi4, and
data for the manufacture of the solvent were obtained from GaBi4. The same polymer material
used for the binder in the anode was also used for the cathode.
For the transportation of the cathode active material, we assumed production occurs in Japan
(Lowe et al., 2010), resulting in a transportation distance of 6,000 mile (9,700 km) between
Tokyo, Japan, to Long Beach, CA. In addition, we assumed a domestic transport of 95% by
mass, at an average distance of 260 miles (418 km) in a for-hire truck, and assumed 5% by mass,
at an average distance of 853 miles (1373 km) in railcars (BLS, 1997).
Separator: The separator is another layer in the battery cell made from polyolefin. This
component keeps the anode and cathode foils separated in the battery cell after they are wound
together. Upstream data for the separator were obtained from GaBi4. Data for the manufacture
of the separator itself were taken from Notter et al. (2010).
Cell Casing: The casing encloses the anode, cathode, and separator. The casing is made from
aluminum. Although older battery pack casings were made of steel, they have shifted to
aluminum, due to its lighter weight and resulting energy efficiency gains (Gaines and Cuenca,
2000). A polypropylene resin pouch is also used to enclose the components before they are
placed in the aluminum casing. Upstream data for the aluminum casing came from the EAA
(2008) via GaBi4, and data for the resin pouch were obtained directly from GaBi4.
Electrolyte: The electrolyte solution acts as a conductor of lithium-ions between the anode and
cathode. Electrolyte is composed of lithium salt and organic solvents (Gaines and Cuenca, 2000).
For this study we used lithium hexaflourophosphate (LiPF6) as the lithium salt, and ethylene
carbonate as the organic solvent. Other electrolyte materials, including alternative organic
carbonates, were excluded due to a lack of data on upstream production. LCI data for the
materials processing stage were obtained from Notter et al. (2010). Upstream materials
extraction data were obtained from GaBi4, except for the lithium salt, which were obtained from
a combination of data from GaBi4 and Notter et al. (2010).
For the transportation of the LiPF6 and ethylene carbonate, domestic production was assumed,
given the fact that the United States is the largest producer of lithium compounds and ethylene
oxide (USGS, 2000; IARC 2008). Accordingly, we assumed domestic transport (i.e., 95% by
mass, at an average distance of 260 miles (418 km) in a for-hire truck, and 5% by mass, at an
average distance of 853 miles (1373 km) in railcars (BLS, 1997). Transport by water and other
modes were excluded.
Battery Management System: The battery management system (BMS) includes the electronic
circuits, software, and internal/external connections and wires used to operate the battery. The
BMS consists of approximately 10% printed wire (circuit) boards, 40% steel, and 50% copper by
weight (Majeau-Bettez et. al., 2011). Upstream data for the BMS were obtained from GaBi4.
Battery Pack Casing/Housing: The battery cells and BMS are combined into a battery pack.
Due to the importance of keeping the battery pack as lightweight as possible, while maintaining a
rigid structure and not being susceptible to corrosion, the pack casing is typically made of
lightweight plastics. For this study, polypropylene and polyethylene terephthalate plastic
materials were assumed for the pack casing, based on submitted primary data from manufacturers
and the Majeau-Bettez et al. (2011) study. Steel was assumed to be a likely battery pack housing
material based on input from the stakeholders, as well as submitted primary data. Upstream data

Application of LCA to Nanoscale Technology: Li-ion Batteries for Electric Vehicles ▌pg. 36
for all materials were obtained from the National Renewable Energy Laboratory‘s U.S. LCI
database, via GaBi4.
Passive Cooling System: Passive cooling systems are important to prevent overheating of the
battery pack (Gaines and Cuenca, 2000). The cooling system is composed of steel and aluminum
sheet metal (Hawkins et. al., in review). Upstream data for the materials were obtained from the
EAA (2008) for aluminum, and the U.S. LCI for steel, via GaBi4.
Table 2-2. Upstream Materials and Corresponding Components and Data Sources
Component
(Stage C)
Material Name Data Source for Processing (Stage B)
Data Source for Extraction (Stage A)
Anode Battery grade graphite Notter et. al., 2010 GaBi4
Copper foil (collector) GaBi4 GaBi4
Cathode Aluminum (collector) EAA/GaBi4 \1 EAA/GaBi4
\1
Lithium manganese oxide (LiMnO2 battery)
Notter et. al., 2010 (modified to account for a LiMnO2 process from a LiMn2O4)
GaBi4
Lithium-nickel cobalt manganese oxide (Li-NCM battery)
Majeau-Bettez et. al., 2011
Lithium iron phosphate (LiFePO4 battery)
Majeau-Bettez et. al., 2011
Lithium chloride extraction NA Notter et. al., 2010
Anode and Cathode
Polymer (binder) GaBi4 GaBi4
Auxiliary solvent \2 GaBi4 GaBi4
Separator Polyolefin GaBi4 GaBi4
Casing Aluminum GaBi4 GaBi4
Polypropylene resin (pouch material)
USLCI/GaBi4 USLCI/GaBi4
Electrolyte Lithium hexaflourophosphate (LiPF6)
Notter et. al., 2010 GaBi4
Ethyl carbonate Notter et. al., 2010 GaBi4
Lithium fluoride Notter et. al., 2010 GaBi4
Phosphorus pentachloride Notter et. al., 2010 GaBi4
Lithium chloride extraction NA Notter et. al., 2010
BMS Copper wiring GaBi4 GaBi4
Steel USLCI/GaBi4 USLCI/GaBi4
Printed wire board GaBi4 GaBi4
Pack Housing Polyethylene terephthalate GaBi4 GaBi4
Passive Cooling System
Steel USLCI/GaBi4 USLCI/GaBi4
Aluminum EAA/GaBi4 EAA/GaBi4
Notes: \1 EAA: European Aluminum Association;
\2 Auxiliary solvent is only used in the manufacturing and not
included in the final product.
Transportation
In order to estimate transportation distances and impacts, assumptions are made with respect to where the
raw materials will likely be obtained throughout the supply chain. Overall, the LCA assumed that raw
materials were obtained from where they are typically produced. For instance, we assumed that the basic
lithium salts would come from Chile, cobalt and nickel would come from the Congo, battery-grade
graphite would come from China, and the cathode active material would be obtained from Japan. Other,

Application of LCA to Nanoscale Technology: Li-ion Batteries for Electric Vehicles ▌pg. 37
more common basic inputs were assumed to be globally sourced. Much of the transportation data were
already included in GaBi4 processes.
In addition, materials and products produced or shipped domestically would be transported 95% by mass,
at an average distance of 260 miles (418 km) in a for-hire truck, and 5% by mass, at an average distance
of 853 miles (1373 km) in railcars) (BLS, 1997). The distance estimates are based on the U.S. Bureau of
Labor Statistics "Hazmat Shipment by Mode of Transportation" (transtats.bls.gov).
Single-Walled Carbon Nanotube (SWCNT) Anodes
Engineered nanomaterials possess unique electrical and mechanical properties that make them well suited
for application in electrochemical cells. Specifically, the large surface area to weight ratio, superior
charge densities, and tunable surface properties exhibited by many nanomaterials are promising avenues
toward improved battery performance. Recent research efforts have focused on a variety of materials
including: Ge nanowires (Chan et al, 2008), Si nanowire anodes (Chan et al, 2008), and free-standing
single-walled carbon nanotube (SWCNT) anodes (Landi et al, 2009). However, the life-cycle
environmental profiles of nano-enabled technologies are poorly understood, and existing LCA methods
are insufficient for at least two reasons:
1. Life-cycle inventory (LCI) data describing nano-manufacturing processes are lacking,
proprietary, or may not be descriptive of commercial scale burdens (Theis et al. 2011; Gutowski
et al, 2010; Seager 2009), and
2. The eventual use-phase performance of nano-enabled energy technologies remains unknown, and
available data are obtained at laboratory-scale (Wender et al, 2011).
The inherent uncertainty in manufacturing and use phases makes comprehensive LCA (e.g., cradle-to-
cradle) of nano-enabled technologies problematic. Of all of the materials that are the object of study in
Li-ion battery applications, SWCNTs may have received the most attention from industrial ecologists (in
terms of environmental data). Nonetheless, while previous cradle-to-gate analyses have called attention
to the energy intensity of SWCNT manufacturing processes (Ganter et al, 2010; Healy et al, 2008), these
studies do not reflect functional improvements in the use-phase, nor do they account for potential gains in
manufacturing efficiency associated with returns to scale and experience in the future (Gutowski et al,
2010). Therefore, assessment of developing SWCNT-enabled technologies requires novel approaches to
LCA that are prospective, rather than retrospective, such that environmentally problematic processes and
technologies can be identified and mitigated early in product development cycles.
To explore potential life-cycle environmental impacts of SWCNT-enabled lithium ion batteries, this
analysis combines scenario development, thermodynamic modeling, and use-phase performance
bounding. Because no commercial data exist for SWCNT anode manufacturing, SWCNT anode LCI data
were measured at laboratory scale per unit weight of SWCNT produced (Wender et al, 2011; Ganter et al,
2010). The energy requirements per unit mass of SWCNT produced by laser vaporization are similar to
SWCNTs produced by the high pressure carbon monoxide (HiPCO) process (Healy et al, 2008). The
HiPCO process, first reported in the literature in 1999 and patented (applied) in 2004, has potential for
commercial-scale production because it is a continuous-flow process with recycled exhaust gasses
(Smalley et al, 2004; Bronikowski et al, 1999). Over this time period, the electrical energy required per
gram of SWCNT was reduced by more than an order of magnitude (Gutowski et al, 2010). Based upon
idealized thermodynamic modeling of SWCNT manufacturing via the HiPCO process, this analysis
projects three scenarios of improved electrical energy utilization into the near future, as shown below in
Figure 2-2.

Application of LCA to Nanoscale Technology: Li-ion Batteries for Electric Vehicles ▌pg. 38
Figure 2-2. Historical Reductions in Electrical Energy Consumption of SWCNT Manufacturing via
the HiPCO Process and Scenarios for Improvement (Wender, under review)
Note: The figure is on a log-scale because reductions in energy consumption may span several orders of magnitude.
Experience with other emergent technologies suggests it is reasonable to assume that the eventual energy
consumption of SWCNT manufacturing will continue to fall as production volumes increase.
Nonetheless, the most conservative scenario (topmost dashed line) projects 2004 SWCNT manufacturing
data assuming no improvements in energy efficiency, while the lowest dashed line represents the most
ambitious scenario of process improvement (a continuation of gains at approximately the current pace).
Historically, improvements in energy utilization are driven by gains in the yield of SWCNT relative to the
amount of carbon input. At present, the yields are small (on the order of 10-3
per mass), while the
stoichiometric ideal is roughly 0.2 grams SWCNT per gram CO, which suggests that there remains
significant potential for improvement. However, recent advances have demonstrated that SWCNT yields
can be improved through novel catalysts (Schauerman et al, 2009). This rapidly changing technological
backdrop demonstrates the challenge of LCA for nanotechnologies.
In addition to improvements in manufacturing, nanotechnologies are rapidly moving forward in terms of
use-phase performance. This analysis provides boundaries on the performance of SWCNT in Li-ion
batteries, based on their theoretical limit and existing laboratory measurements. At best, theoretical
performance limit provides a lower boundary (e.g., the smallest impact per functional unit); while, at
worst the upper limit (e.g., the most impact per functional unit) is set by current laboratory measurements.
At present, specific capacities of SWCNT anodes under laboratory conditions are approximately 400
mAh/g (Landi et al, 2009), while the theoretical limit is roughly 1100 mAh/g (Landi et al, 2008). At a
constant cell voltage of 3.6 V (corresponding to graphite-anode Li ion battery, Linden and Reddy, 2002),
the energy density of SWCNT anodes will be between 1.44 Wh/g and 3.96 Wh/g (which is at least three
times the 0.5 Wh/g capacity of conventional graphite anodes). Coupling these performance boundaries
with the energy estimates discussed above allows manufacturing inventory data to be reported with
respect to total kWh of storage capacity in the battery (Figure 2-3). The sample calculation below was
used to provide a best-case scenario for the manufacturing energy use based on historical data.

Application of LCA to Nanoscale Technology: Li-ion Batteries for Electric Vehicles ▌pg. 39
High performance scenario:
Figure 2-3. Range of Energy Requirements for SWCNT Anodes (per kWh battery storage capacity) (Wender, under review)
Note: Based on historical SWCNT manufacturing data, and two scenarios of manufacturing improvements and
SWCNT anode performance.
If current laboratory data are used to model SWCNT manufacturing impacts, the extraordinary energy
requirements of SWCNT manufacturing are prohibitively high, even if battery capacity is modeled at the
theoretical limit (see calculation above). Gains due to energy use efficiency and lighter anode weight
during the use stage are insignificant when compared to the manufacturing impacts. Conversely, if the
electrical energy requirements of SWCNT manufacturing decrease as discussed above, SWCNT-anode
lithium ion batteries could become competitive (e.g., the best case scenario line) on an environmental
basis. This analysis reflects both the challenge and value of prospective LCA, in that it can lead to
reorientation of the laboratory research agenda toward pathways with decreased environmental burden.
Specifically, our analysis concludes that laboratory research of SWCNT-enabled technologies should
focus on lowering the energy intensity of nano-manufacturing processes, in tandem with improving
technology performance, as the significant energy consumption of SWCNT manufacturing drives the
environmental profile of the technology.
2.1.3 Limitations and Uncertainties
Upstream data for the materials used in the Li-ion battery cell and pack were only obtained from
secondary data sources. These sources mainly included LCI data available in GaBi4, as well as literature
sources with published LCI data, including Notter et al. (2010), Majeau-Bettez et al. (2011), and Hawkins
et al. (under review). When specific detail about a chemical or material was not available, or was not
provided by a manufacturer due to confidentiality issues, we applied a proxy, or modified the available
LCI data. For example, for the foil material for the electrodes we used copper and aluminum sheet LCI

Application of LCA to Nanoscale Technology: Li-ion Batteries for Electric Vehicles ▌pg. 40
data, even though this was not specified by the manufacturers. Another example is the LiMnO2 battery
chemistry. Due to confidentiality issues, the manufacturer indicated that they were producing something
stoichiometrically similar to LiMnO2 but provided little additional detail related to the chemical or
physical state of the active material. The chemistry is likely a modification of LiMnO2, and possibly a
mixed metal oxide. As such, the production process may differ from the LiMnO2 we are using as a proxy,
which is based on a modification of the Notter et al. (2010) LiMn2O4 spinel-based process.
Battery-specific subsystem data were highly limited, and in some cases were not sufficient for inclusion.
Although the cooling system was modeled as fixed across battery chemistries, the type of cooling system
has an impact on cell spacing, and can also differ based on cathode chemistry. Differences in the cooling
system type influence battery cell, pack, and module design, and thus have an impact on the overall bill of
materials for the battery pack. The simplified modeling choice was driven by the large data gaps in these
across-chemistry distinctions. The battery management system was also modeled as fixed across battery
type and chemistry, despite indications that there may be substantial differences obscured by this
simplification. Secondary data for the mechanical subsystem were not available, so this component was
not considered in the analysis.
For the SWCNT anode, LCI data were obtained from laboratory data from Arizona State University,
because commercial data for the nanotechnology are not yet available. The LCI data are based on
small/laboratory-scale data. As a result, the energy efficiency should improve as the technology becomes
commercialized, and the manufacturing process for the SWCNTs is improved and reaches greater
economies of scale (see section 2.1.2). The eventual impact of such economies of scale is subject to
substantial uncertainty. In addition, there is the possibility that laser-vaporization will not be the
dominant mode for producing SWCNTs in the future. Other manufacturing processes may be less
energy-intensive during production.
The limitations and uncertainties associated with the ME&P stages are primarily due to the fact that some
of these inventories were unobtainable, and others were derived from secondary sources and are not
tailored to the specific goals and boundaries of the study. Because the secondary data may be based on a
limited number of facilities and have different geographic and temporal boundaries, they do not
necessarily represent current industry practices in the geographic and temporal boundaries defined for the
study (see Section 1). These limitations and uncertainties are common to LCA, which strives to evaluate
the life-cycle environmental impacts of entire product systems and is, therefore, limited by resource
constraints that do not allow the collection of original, measured data for every unit process within a
product life cycle.
As noted previously, assumptions were made with respect to the distance and mode of transportation.
Because many of the materials used in the production of lithium-ion batteries are globally-sourced but
fairly rare, actual transportation outcomes can vary drastically depending on discovery rates, mining
technology, trade agreements, and other technical or geopolitical characteristics.
Secondary data sets from EIA, U.S. LCI, and GaBi4 were also applied for all of the fuels and electricity
used in the upstream extraction, manufacturing, and transportation processes. These datasets attempt to
estimate national average inputs and outputs for particular processes. As a result, they do not contain
information relevant to regional fuel and electricity production, which, as our grid sensitivity analysis
presented in Section 3.4 shows, can vary significantly.

Application of LCA to Nanoscale Technology: Li-ion Batteries for Electric Vehicles ▌pg. 41
2.2 Manufacturing Stage
The manufacture of Li-ion battery packs that are placed into vehicles generally follows four key steps,
including: (i) manufacture of the battery cell components (Stage C in Figure 1-4); (ii) manufacture of the
battery cell (Stage D in Figure 1-4); (ii) manufacture of other battery pack components, including the
BMS, passive cooling system, and housing (Stage C in Figure 1-4); and (iv) assembly of the battery pack
(Stage D in Figure 1-4). Below we describe the manufacturing process in detail, and next describe the
LCI data collection methodology, sources, and limitations for this stage.
2.2.1 Manufacturing Process
Figure 2-4 illustrates the manufacturing process for the anode electrode, cathode electrode, and battery
cell. As shown in the figure, manufacture of the electrodes follows a similar process. First, the electrode
powder is combined with a binder and mixed into a slurry paste with solvent. Next, the slurry paste is
coated onto the collector (copper for anode and aluminum for cathode) and dried to remove the solvent,
which is recycled and reused. Once dried of the solvent, the foil sheets are compressed and adjusted for
thickness and then slit and cut to the correct width (Gaines and Cuenca, 2000). The anode electrode is
typically 14 m thick and the cathode 20 m thick (Gaines and Cuenca, 2000).
The anode and cathode electrodes are then layered in between a separator and rolled. The separator is a
porous polyethylene film coated with a slurry consisting of a copolymer, dibutyl phthalate, and silica
dissolved in acetone (Notter, et al., 2010). The slurry is then heated and dried to leave a porous film
(Gaines and Cuenca, 2000; Notter, et al., 2010).
Once the three layers (anode, cathode, and separator) are wound together--either cylindrically or
prismatically--they are wrapped, placed within a polypropylene resin pouch, and then placed in a thin
aluminum casing. Aluminum is used as a cell casing material because of its light weight and strength.
Next, the battery cell is filled with an electrolyte solution, which is pre-mixed from a supplier (Gaines and
Cuenca, 2000). The manufacture of the electrolyte solution generally involves mixing of the lithium salt,
organic solvent, and other chemicals (described above). Electrolyte solutions differ based on the type of
battery in which they are being used, such that a high energy-density battery will contain a different set of
organic carbonates and other solvents than a high power-density battery.

Application of LCA to Nanoscale Technology: Li-ion Batteries for Electric Vehicles ▌pg. 42
Mix graphite
paste/slurry
Coat paste/
slurry on
Copper foil
Compress for
thickness
control
Slit/cut to
size
Anode - Electrode Coating
Wind anode,
separator, cathode
layers
Insert into cases
(cylindrical or
prismatic)
Fill with
electrolyte
Attach insulators,
seals, valves, safety
devices, etc.
Seal caseCharge using
a cycler
Condition and
test
Dry in oven -
solvent
removal/
recovery
Separator
Anode
powder
Cathode
powder
Battery Cell Assembly and Formation
Casing Electrolyte
Key
Material purchased by battery manufacturer
Process undertaken by battery manufacturer
Collector
Binder
Collector Mix cathode
paste/slurry
Coat paste/
slurry on
Aluminum foil
Compress for
thickness
control
Slit/cut to
size
Cathode - Electrode Coating
Dry in oven -
solvent
removal/
recovery
Component purchased by battery manufacturer
Solvent refining and resale
(ancillary material)
Solvent refining and resale
(ancillary material)
Binder
Figure 2-4. Typical Manufacturing Process for Lithium-ion Battery Cells Sources: Gaines, L.; Cuenca, R. Cost of Li-ion Batteries for Vehicles, Argonne National Laboratory, Center for Transportation Research (CTR), May 2000.
Electropedia, Battery and Energy Technologies, Lithium Ion Battery Manufacturing (http://www.mpoweruk.com/battery_manufacturing.htm accessed on June 7, 2010).

Application of LCA to Nanoscale Technology: Li-ion Batteries for Electric Vehicles ▌pg. 43
After the battery cell casing is sealed, it is charged and tested. The individual cells are then assembled
with the BMS and housing to form the battery pack. The battery pack typically has a casing that contains
all of the cells and BMS. The battery pack is then combined with the cooling system and placed into the
vehicle in a supportive metal or plastic housing.
Solvent-less Manufacturing Process
It is important to note that one battery manufacturing partner uses a proprietary solvent-free
manufacturing process. Conventional lithium-ion battery manufacturing processes typically use a
significant amount of N-methyl-pyrrolidone (NMP) solvent, though some have moved to the use of
water-based methods. As noted previously, Zackrisson et al. (2010) found that it was environmentally
preferable to use water as a solvent, instead of NMP, in the slurry for casting the cathode and anode of
lithium-ion batteries for PHEVs.
2.2.2 Methodology and Data Sources
LCI data for the components and product manufacturing stage were obtained using a combination of
primary and secondary data. Data collection forms were distributed to partners to collect primary data for
the processes associated with manufacturing the battery cell (i.e., anode, cathode, battery cell, casing,
battery pack, and housing manufacture). The data forms were developed by Abt Associates Inc. and
approved by the partnership. The collection form sought brief process descriptions; primary and ancillary
material inputs; utility inputs (e.g., electricity, fuels, water); air, water, and waste outputs; and product
outputs.
LCI data, including ancillary and utility data, were collected on a per energy capacity (kWh/charge cycle)
basis and a per mass (kg) basis. All data were converted to a per battery basis, using information about
specific energy (kWh/kg) and the mass of one battery (kg). In addition, the partnership assumed that the
anticipated lifetime of the battery is the same as the anticipated lifetime of the vehicle for which it is used
(10 years).5 Therefore, we assumed one battery per vehicle. Multiple data sets were collected for some
processes. These data were aggregated to generate a composite inventory for each process that protects
the confidentiality of the individual data points.
The primary data were combined with secondary data for each of the components (except the electrolyte
solution) to address data gaps, and to protect the confidentiality of the primary data provided by our
partners. Secondary data from two key studies were incorporated with detailed inventory data: Notter et.
al (2010), and Majeau-Bettez et al. (2011). Although this study models electricity inputs from the U.S.
power grid for the manufacture of the batteries produced by the partnership (i.e., Li-MnO2 and Li-NCM),
the data for the Li-FePO4 battery production was based on the Canadian electricity grid, because this
battery chemistry is primarily produced in Canada (Phostech Lithium, 2012). In addition, secondary data
were obtained for the passive cooling system from a third study (Hawkins et al., under review). As
discussed above, data for the mechanical subsystem were not available, so this component was not
included and modeled in the LCA. Table 2-3 summarizes the data sources for the processes in the
manufacturing stage.
5 Most Li-ion battery systems are expected to achieve a service life of 10 years. However, the service life may vary
depending on several factors, such as temperature, charging regime, and depth and rate of discharge. These
factors are affected by the demands a vehicle and driver place on the battery.

Application of LCA to Nanoscale Technology: Li-ion Batteries for Electric Vehicles ▌pg. 44
Table 2-3. Manufacturing Stage Processes and Data Sources
Process Data source
Anode electrode Primary; Majeau-Bettez et. al., 2011
Cathode electrode Primary; Majeau-Bettez et. al., 2011
Separator Notter et. al., 2010
Casing Primary; Majeau-Bettez et. al., 2011
Electrolyte Primary
Battery cell Primary; Majeau-Bettez et. al., 2011
Battery management system Majeau-Bettez et. al., 2011
Housing Primary; Majeau-Bettez et. al., 2011
Passive cooling system Hawkins et. al., under review
Mechanical subsystem None
As noted above, LCI data were obtained on a mass per kWh basis. However, to model results for a
battery pack placed in a PHEV-40 and EV, research was conducted on the estimated size of the battery
pack for each type of vehicle (see Table 1-1). Accordingly, the data were scaled to account for a 40kWh
battery pack in the EVs, and an 11.6 kWh battery pack in the PHEVs (Barnes, 2009).
We assumed a transportation distance of 444 miles by truck--the average domestic shipping distance of
automobiles and components in 2002 (U.S. BTS, 2006).
2.2.3 Limitations and Uncertainties
Limitations and uncertainties related to the data collection process include the fact that companies were
self-selected, which could lead to selection bias (i.e., those companies that are more advanced in terms of
environmental protection might be more willing to supply data than those that are less progressive in this
regard). Companies providing data also may have a vested interest in the project outcome, which could
result in biased data being provided. The employment of the Core Group as reviewers in this project was
intended to help identify and reduce any such bias (e.g., manufacturers or recyclers checking to ensure
that other submitter data is consistent with industry norms). In addition, as noted above, to address data
gaps and protect confidential information, it was necessary to combine multiple sets of secondary data
with primary data for many of the components. As a result, inconsistencies between the materials linking
the secondary and primary datasets introduced some uncertainty. An example of this was the matching of
the modified Notter et al. (2010) lithium manganese oxide spinel process with the primary manufacturing
information of the manufacturer whose manganese oxide cathode active material was incompletely
characterized.
Other specific limitations and uncertainties of the study associated with the manufacturing stage LCI data
include the following:
No data were available for the actual foil fabrication process for the cathode. For this inventory,
the wire drawing process was used as a proxy.
No specific data on the battery cell container production process were available; accordingly, this
process was inventoried with metal sheet rolling as a proxy.
We assumed all components scale linearly into the battery pack to meet energy density
requirements for PHEVs (11.6 kWh) and EVs (40 kWh) (see Table 1-1).
The BMS process inventory data, obtained from Majeau-Bettez et al. (2011), was modified
slightly. Specifically, the mass breakdown by Schexnayder et al., estimated that the BMS

Application of LCA to Nanoscale Technology: Li-ion Batteries for Electric Vehicles ▌pg. 45
represented about 4% of the battery mass, and circuit boards and wires each constituted about half
of this mass. However, based on discussions with the partnership, this may overestimate the
relative importance of the BMS. Instead, our analysis assumed the BMS is about 2% by mass
relative to the whole battery pack, with integrated circuits accounting for about 10% of the BMS
mass; copper wires (both for internal and external cabling) representing 50% of the BMS mass;
and a stainless steel container representing 40% of the mass (Majeau-Bettez et al., 2011).
The study did not adjust for differences in battery pack due to different chemistries (e.g., LiFePO4
versus LiMnO2), when in reality there are differences in the pack to account for differences in
performance between the battery types (e.g., the amount of heat emitted when used).
There were discrepancies in energy use data reported between manufacturers: one battery
manufacturer reported energy and fuel use, and the other only reported material inputs. As a
result, we assumed that the second manufacturer used energy at approximately the average rate of
the other two processes. It is possible that this assumption is significantly different from actual
energy use. Because the solvent-less and solvent-based manufacturing processes are so
mechanistically different, averaging of this sort is highly uncertain.

Application of LCA to Nanoscale Technology: Li-ion Batteries for Electric Vehicles ▌pg. 46
2.3 Use Stage
Although the focus of the LCA study is on Li-ion batteries, given the fact that the purpose of the batteries
is to provide energy for transportation in the use stage, the study includes an assessment of impacts
resulting from the vehicles in which the batteries are placed (EVs and PHEVs), in the use phase only. As
described in Section 1, as part of the use stage analysis, we assessed two types of vehicles, as follows:
Plug-in hybrid electric vehicles (PHEVs) can charge its battery by plugging in to a grid-
provided electricity system, as well as use gasoline to power the battery (similar to a hybrid-
electric vehicle). As a result, PHEVs can consume both engine fuel and electricity from the
power grid. PHEVs are typically categorized according to their all-electric range (AER), which is
the maximum distance that can be travelled without using the internal combustion engine. This
LCA focused on PHEVs with a 40-mile range (PHEV-40). PHEV-40s require batteries with
higher energy density, similar to EVs.
Electric vehicles (EVs) are entirely powered by batteries that are charged with electricity from
the power grid. EVs have no internal combustion engine.
We also provide a qualitative assessment of internal combustion engine vehicles (ICEVs) in the use stage
for one impact category (i.e., greenhouse gas emissions). These vehicles have a battery, but the battery is
not used to increase vehicle efficiency. ICEV batteries are typically made with a lead-acid chemistry, and
are only used to start the internal combustion engine. The ICEVs only consume engine fuel.
Below we provide an overview of the methodology applied to estimate LCI data for the use stage for the
batteries and vehicles.
2.3.1 Energy and Consumption Estimates
As noted previously, the LCI data for the use stage are a function of the amount and type of energy
consumed to operate the vehicle. Accordingly, below we describe (i) the amount of energy consumed
during vehicle use, which depends on vehicle efficiency, and (ii) the types of energy consumed.
Vehicle Efficiency
The Argonne National Laboratory developed the Powertrain System Analysis Toolkit (PSAT) to model
fuel economy and performance for a number of different vehicle types: ―PSAT is a ‗forward-looking‘
model that simulates fuel economy and performance in a realistic manner — taking into account transient
behavior and control system characteristics (Argonne, 2007).‖ PSAT has been recognized by
government, academic, and industry organizations as a reliable simulation tool. By using simulated data
and keeping non-power train characteristics (e.g., drag coefficient, frontal area, wheel radius, etc.)
constant across vehicle types, differences in energy efficiency can be attributed to differences in the
power train, rather than other vehicle characteristics.
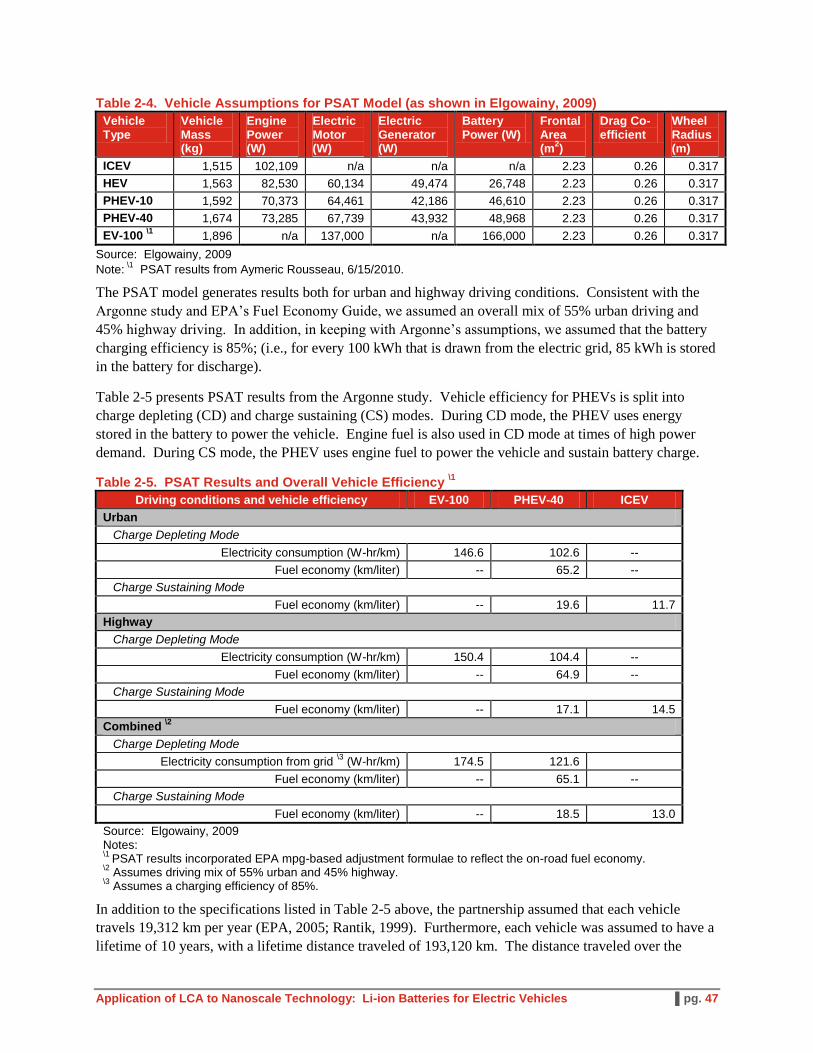
This LCA used PSAT simulation data to estimate vehicle efficiency. Specifically, vehicle efficiencies are
based on a 2009 Argonne study that focused on the greenhouse gas emissions of PHEVs (Elgowainy,
2009). Table 2-4 shows the assumptions made in the Argonne study, which reflect a model year 2015
mid-size passenger car.
Application of LCA to Nanoscale Technology: Li-ion Batteries for Electric Vehicles ▌pg. 47
Table 2-4. Vehicle Assumptions for PSAT Model (as shown in Elgowainy, 2009)
Vehicle Type
Vehicle Mass (kg)
Engine Power (W)
Electric Motor (W)
Electric Generator (W)
Battery Power (W)
Frontal Area (m
2)
Drag Co-efficient
Wheel Radius (m)
ICEV 1,515 102,109 n/a n/a n/a 2.23 0.26 0.317
HEV 1,563 82,530 60,134 49,474 26,748 2.23 0.26 0.317
PHEV-10 1,592 70,373 64,461 42,186 46,610 2.23 0.26 0.317
PHEV-40 1,674 73,285 67,739 43,932 48,968 2.23 0.26 0.317
EV-100 \1
1,896 n/a 137,000 n/a 166,000 2.23 0.26 0.317
Source: Elgowainy, 2009
Note: \1
PSAT results from Aymeric Rousseau, 6/15/2010.
The PSAT model generates results both for urban and highway driving conditions. Consistent with the
Argonne study and EPA‘s Fuel Economy Guide, we assumed an overall mix of 55% urban driving and
45% highway driving. In addition, in keeping with Argonne‘s assumptions, we assumed that the battery
charging efficiency is 85%; (i.e., for every 100 kWh that is drawn from the electric grid, 85 kWh is stored
in the battery for discharge).
Table 2-5 presents PSAT results from the Argonne study. Vehicle efficiency for PHEVs is split into
charge depleting (CD) and charge sustaining (CS) modes. During CD mode, the PHEV uses energy
stored in the battery to power the vehicle. Engine fuel is also used in CD mode at times of high power
demand. During CS mode, the PHEV uses engine fuel to power the vehicle and sustain battery charge.
Table 2-5. PSAT Results and Overall Vehicle Efficiency \1
Driving conditions and vehicle efficiency EV-100 PHEV-40 ICEV
Urban
Charge Depleting Mode
Electricity consumption (W-hr/km) 146.6 102.6 --
Fuel economy (km/liter) -- 65.2 --
Charge Sustaining Mode
Fuel economy (km/liter) -- 19.6 11.7
Highway
Charge Depleting Mode
Electricity consumption (W-hr/km) 150.4 104.4 --
Fuel economy (km/liter) -- 64.9 --
Charge Sustaining Mode
Fuel economy (km/liter) -- 17.1 14.5
Combined \2
Charge Depleting Mode
Electricity consumption from grid \3
(W-hr/km)
174.5 121.6
Fuel economy (km/liter) -- 65.1 --
Charge Sustaining Mode
Fuel economy (km/liter) -- 18.5 13.0
Source: Elgowainy, 2009 Notes: \1
PSAT results incorporated EPA mpg-based adjustment formulae to reflect the on-road fuel economy. \2
Assumes driving mix of 55% urban and 45% highway. \3
Assumes a charging efficiency of 85%.
In addition to the specifications listed in Table 2-5 above, the partnership assumed that each vehicle
travels 19,312 km per year (EPA, 2005; Rantik, 1999). Furthermore, each vehicle was assumed to have a
lifetime of 10 years, with a lifetime distance traveled of 193,120 km. The distance traveled over the

Application of LCA to Nanoscale Technology: Li-ion Batteries for Electric Vehicles ▌pg. 48
lifetime of the vehicle is used to put life-cycle impacts in terms of the functional unit (km traveled).
Li-ion batteries were also assumed to have a lifetime of 10 years, resulting in one battery needed per
vehicle lifetime. The number of batteries per vehicle enters into the upstream materials processing and
manufacturing LCI as a scalar multiplier.
PHEV Methods
Estimating fuel and electricity consumption for PHEVs involves uncertainty regarding the amount of
energy drawn from the power grid and the amount drawn from engine fuel. Unlike other vehicle types,
PHEVs can draw energy from two sources: 1) engine fuel (e.g., gasoline), and 2) electricity from the
power grid. The ratio of engine fuel to electricity depends both on user habits, such as how often drivers
charge the battery, and vehicle performance, such as the distance that can be traveled on one charge cycle
(all-electric range, or AER). More frequent charging and greater AERs lead to greater electricity
consumption and less engine fuel consumption.
Utility Factor and Overall Efficiency
Vehicle miles traveled (VMT) for PHEVs are commonly split into CD and CS modes, as presented in
Table 2-5 above. While the percent of VMT in CD and CS mode for a given vehicle will vary according
to driver habits, standard methods have been developed to estimate the percent of VMT spent in each
mode. These methods rely on utility factors (UFs), which represent the percent of VMTs likely to be
driven in CD mode as a function of the AER. Commonly used UFs, as described in SAE International
standards SAE J1711 and J2841, are based on the 2001 National Highway Transportation Survey (NHTS)
prepared by the Bureau of Transportation Statistics.
As shown in Table 2-5, the PSAT model estimates fuel economy and electricity consumption for PHEVs
in both CD and CS mode. These baseline energy efficiencies can be combined by using the UF to
determine the overall electricity consumption and fuel economy, as follows:
Overall electricity consumption (Whr/km) = UF * (ECcd)
Overall fuel economy (km/liter) = UF/FEcd + (1 - UF) / FEcs
Where:
UF is the utility factor (percent of VMT in CD mode)
ECcd is the electricity consumption in charge depleting mode (Whr/km)
FEcd is the fuel economy in charge depleting mode (km/liter)
FEcs is the fuel economy in charge sustaining mode (km/liter)
Note that the PHEVs modeled during this PSAT analysis use a blended CD mode to increase overall
efficiency. In a blended CD mode, the engine turns on under high power demand to preserve battery
charge and increase overall efficiency. As a result, fuel consumption during CD mode is not zero. Also
note that overall electricity consumption and fuel economy are only meaningful when viewed together;
the implications of high fuel economy in conjunction with high electricity consumption are different than
the implications of high fuel economy in conjunction with low electricity consumption.
In addition, there are some potential disadvantages to using 2001 NHTS data as a basis for the UF. In
particular, the data are 10 years old, and it is likely that driving habits have changed over the last decade.
There are also several assumptions inherent in the UF derivations that could impact the UF (e.g., PHEVs

Application of LCA to Nanoscale Technology: Li-ion Batteries for Electric Vehicles ▌pg. 49
will be charged once per day, and will be driven the same distances as the average car). These limitations
and uncertainties are addressed further in Section 2.3.3.
EV Methods
EVs only draw energy from the power grid, so unlike PHEVs, it is not necessary to combine different
modes of operation to derive overall energy consumption. This is equivalent to the scenario in which the
UF is equal to 1 (100% of VMT in CD mode). EV electricity consumption can be calculated directly with
PSAT results.
ICEV Methods
HEVs and ICEVs only draw energy from engine fuel, and so it is not necessary to combine different
modes of operation to derive overall energy consumption. This is equivalent to the scenario in which the
UF is equal to zero (zero percent of VMT in CD mode). HEV and ICEV fuel consumption can also be
calculated directly with PSAT results.
Energy Consumption Estimates
Table 2-6 presents electricity and engine fuel consumption estimates (items [5] and [6], respectively) in
terms of the functional unit (km). These figures represent point estimates for energy consumption. It is
important to note that there are uncertainties surrounding both vehicle performance (items [1] through [3])
and the utility factor (item [4]).
Table 2-6. Energy Consumption Estimates Based on PSAT Results and Overall Vehicle Efficiency\1
Calculation Parameter
Vehicle/Battery Type
Li-ion
EV
Li-ion
PHEV-40
gasoline ICE \2
Gasoline ICEV
Charge Depleting Mode
[1] Electricity consumption (AC W-hr/km) 174.5 121.6 n/a
[2] Fuel economy (km/liter) n/a 65.1 n/a
Charge Sustaining Mode
[3] Fuel economy (km/liter) n/a 18.5 13.0
Weighted Energy Consumption Estimates
[4] Utility Factor 1 0.628 0
[4]*[1]=[5] Weighted electricity consumption from grid (AC W-hr/km) 174.5 76.39
\3 -
[4]/[2]+(1-[4])/[3]=[6] Weighted fuel consumption (liter/km) - 0.030 0.077
Notes: \1
Values have not been adjusted to represent on-road performance. \2
ICEV: Internal Combustion Engine Vehicle \3
Using EPA’s New Fuel Economy MPGe calculation methods (33.7 kWh/gallon), the electricity use of the PHEV-40 is equivalent to 0.0086 liters/km of gasoline consumption.

Application of LCA to Nanoscale Technology: Li-ion Batteries for Electric Vehicles ▌pg. 50
Energy Sources
As noted previously, LCI inputs and outputs also depend on the type of energy consumed. To this end,
the following section provides an overview of factors that affect the power grid mix, and this study‘s
approach to modeling the power grid mix and calculating LCIA impacts associated with electricity
production in the use stage.
Factors that Affect the Power Grid Mix
The power grid mix varies with a number of factors, including the time of year, geographic region, and
time of day. In addition, the power grid mix changes over the years, as new power-generating facilities
come online and old facilities go offline (Elgowainy, 2009). As is shown in Figure 2-5, the geographic
distribution of electric power plants differs by plant type (EIA, 2010a).
Figure 2-5. Distribution of Electric Power Plants by Type (EIA, 2010a)
North American power plants are connected together in a grid to allow for the bulk transmission of
power. For oversight and practical purposes, the grid is divided into eight regions, per the North
American Electric Reliability Corporation (NERC), as presented in Figure 2-6.

Application of LCA to Nanoscale Technology: Li-ion Batteries for Electric Vehicles ▌pg. 51
Figure 2-6. North American Electric Reliability Corporation Regions (NERC, 2011)
Key: Florida Reliability Coordinating Council (FRCC); Midwest Reliability Organization (MRO); Northeast Power
Coordinating Council (NPCC); Reliability First Corporation (RFC); Southeast Electric Reliability Corporation (SERC);
Southwest Power Pool Regional Entity (SPP); Texas Reliability Entity (TRE); Western Electricity Coordinating Council
(WECC)
Temporal (hourly) Variation
The power grid mix also varies throughout the day, as additional generating units are dispatched to meet
increased demand during peak periods. In the summer, energy demand is typically at its peak during the
late afternoon and early evening as a result of air conditioning. Energy demand is typically at its lowest
overnight when businesses are closed, lights are off, and air-conditioning is at its lowest (Elgowainy,
2009). The type of generating units that are dispatched vary according to the load; the most economical
units are dispatched first, and the least economical are dispatched last. Furthermore, some types of
generating units, such as hydroelectric and nuclear power plants, are not as responsive to short-term
changes in demand, and generate a more constant output than other types of generating units. Other types
of generating units, such as simple-cycle gas and oil fired turbines, can be deployed quickly to meet
hourly changes in demand (Elgowainy, 2009).
Load Profile and Charging
U.S. EIA data, U.S. LCI data, and GaBi electricity datasets are all based on an average mix of electricity
generation for different regions. Marginal, rather than average, electricity generation considers impacts
from the standpoint of the addition of marginal increments of demand, such that the applicable fuel
mixture is that which provides these additional marginal increments of electricity above and beyond the
fuels that would have been used in the absence of the new demand. In such a case, the use of an average
grid mix would mischaracterize the impact of the new technology on the overall environmental burden of
the system. With the increase in use of electric cars, it will likely change the make-up of the grid from its
current mix. So, it is important to consider the ―marginal‖ generation, instead of solely focusing on the
―average‖ generation.
The time of day that drivers charge their vehicles plays a large role in determining the marginal load that
is placed on the power grid. Therefore, it is critical to understand when drivers will typically charge their

Application of LCA to Nanoscale Technology: Li-ion Batteries for Electric Vehicles ▌pg. 52
vehicles, and to associate these charging times with the corresponding power grid mix profiles. A recent
Argonne study simulated the marginal power grid mix in the year 2020 attributable to vehicle charging in
four regions of the United States:
New England Independent System Operator (NE ISO),
New York Independent System Operator (NY ISO),
State of Illinois, and
Western Electric Coordinating Council (WECC) (Elgowainy, 2010):
The same study further simulated the marginal power grid mix under three charging scenarios. In each
scenario it was assumed that the vehicles were charged once at the end of a day (Elgowainy, 2010):
Unconstrained charging, where charging begins within the hour that the last trip ended,
Constrained charging, where charging begins 3 hours after the hour in which the last trip ended,
and
Smart charging, where charging is monitored to fill valleys in the daily utility demand profile.
The daily charge cycles that resulted from these three scenarios is shown in Figure 2-7.
Figure 2-7. Typical Hourly Charging Pattern for All Three Charging Scenarios (week runs from Monday through Sunday) (Elgowainy, 2010)
2.3.2 Methodology and Data Sources
Below we discuss the LCI methodology and data sources for the base-case grid mix, including the
average U.S. power grid mix, gasoline production, and vehicle emissions data sources. Next we discuss
the data source for the grid mix sensitivity analysis and conversion of the data into the functional unit.
Average U.S. Power Grid Mix
In order to calculate the life-cycle impacts associated with a power grid mix, the mix must be connected
with an inventory of inputs and outputs for each type of electricity plant. We used three data sources to

Application of LCA to Nanoscale Technology: Li-ion Batteries for Electric Vehicles ▌pg. 53
construct the average grid mix:
The U.S. Energy Information Administration (EIA) Electric Power Annual Report: the EIA
compiles a yearly dataset that documents the domestic production, consumption, and trade of
electricity broken down in a number of different categories. We used the 2010 report to
determine the most recent known distribution of electricity generation by fuel type (EIA, 2010c).
U.S. LCI National Data: NREL compiled inventory data for electricity generation as part of the
U.S. Life-Cycle Inventory (USLCI). The data are national in scope, and mainly draw on data
from the Emissions & Generation Resource Integrated Database (eGRID). This database is based
on available plant-specific data for all U.S. electricity generating plants that provide power to the
electric grid and report data to the U.S. government. eGRID integrates many different federal
data sources on power plants and power companies, from three different federal agencies: EPA,
EIA, and the Federal Energy Regulatory Commission (FERC). We used the USLCI data to
model bituminous coal, natural gas, fuel oil, nuclear, and biomass-based electricity generation.
PE Fuel-Specific Data: PE International derived U.S.-specific data for electricity production by
fuel type. The data were compiled by PE International in 2002, are national in scope, and were
last reviewed in 2006. We used these data to model lignite, hydro, and wind-derived electricity
generation.
Gasoline Production
Gasoline is produced from crude oil, through a complex system of refining processes. The specific
processes used at any given refinery depend on the physical-chemical characteristics of the crude oil and
the desired products, both of which vary. As a result, no two refineries are exactly alike (EPA, 1995a).
Furthermore, gasoline formulations vary seasonally; winter grades of gasoline have higher vapor pressure
to allow the engine to start in cold weather, whereas summer grade gasoline has lower vapor pressure to
reduce emissions (EIA, 2010b).
While the exact LCI associated with the production of gasoline varies due to a number of factors, it is
possible to develop an average, or representative LCI. We used a process for U.S. average gasoline
production and delivery at the consumer that was built by PE International. The dataset represents a
mass-weighted average refinery for the United States, and covers the whole supply chain, from crude oil
extraction, transportation to refineries, and processing of crude oil, to produce automobile-grade gasoline.
Vehicle Emissions
As is noted in the Argonne WTW PHEV analysis, the emission rates during the vehicle's operation will
deteriorate over time. It is reasonable to assume that the rate of deterioration is constant; therefore, the
data of the lifetime mileage midpoint for a typical model year (MY) vehicle should be applied for the
simulation. Since, on average, the midpoint for U.S. light-duty vehicles is about five years, the fuel
economy values will be based on a MY five years earlier than the calendar year targeted for simulation
(Elgowainy, 2009). Two sources provide vehicle emissions data:
GREET: The GREET model provides emission data for conventional gasoline ICEV, HEVs,
and PHEVs. In this study, we used the GREET emissions from PHEVs as our basic model.
Emissions included in GREET are shown in Table 2-7.
PE: Through the GaBi professional database, PE International provides vehicle emissions for
European vehicles. We use the Euro 4 vehicle model, with an engine that is smaller than 1.4
liters in displacement, to complement the GREET dataset. Emissions included in the GaBi
datasets are also shown in Table 2-7.

Application of LCA to Nanoscale Technology: Li-ion Batteries for Electric Vehicles ▌pg. 54
Table 2-7. Emissions Captured by GaBi and GREET
Emission GREET GaBi
Carbon monoxide
Carbon dioxide
Carbon dioxide (w/C in VOC and CO)
Methane
Nitrous oxide
Nitrogen oxides
NMVOC
VOC exhaust
VOC evaporation
Sulfur dioxide \1
Sulfur oxides
Toluene
Xylene
Ammonia
Benzene
Particulate matter 2.5 (aerodynamic diameter <= 2.5 micrometers)
Particulate matter 2.5 exhaust
Particulate matter 10 exhaust
GHG
Notes: \1
SO2 emissions depend on a free variable specifying the sulfur concentration (ppm) in the gasoline.
In situations where both GREET and GaBi characterized emissions (e.g., carbon monoxide), we used the
GREET emission factor. Note that this study only considered gasoline engine fuel. Use of other engine
fuels, such as ethanol, diesel, and biodiesel, were not modeled in this study.
Sensitivity Analysis Marginal Grid-Mix Data
As part of the sensitivity analysis, we built on Argonne‘s study by incorporating the results of the
simulation described in Section 2.3.1. Accordingly, we considered changes in the grid-mix resulting from
unconstrained versus smart charging scenarios for three grid types (WECC, IL, and ISO-NE), as
presented in Table 2-8.
Table 2-8. Marginal Electricity Generation Mix in 2020 for Two Charging Scenarios and Three Regions (Source: Elgowainy et al. 2010) \1
Charging scenario Unconstrained Charging (%) Smart Charging (%)
Fuel Technology WECC IL ISO-NE WECC IL ISO-NE
Coal Utility boiler/IGCC 0.7 67.2 0 13.7 99.5 0
Natural gas Utility boiler 7.1 0.7 -0.5 5.9 0 0.1
Combined cycle 87.2 22.6 102 75.6 0 94.7
Combust. turbine 5.3 8.8 23.1 4.2 0 3.7
Residual oil Utility boiler 0 1.2 -23.9 0 0 1.3
Nuclear n/a -0.2 0.4 0 0.5 0 0
Biomass Utility boiler/IGCC -0.2 0 -0.1 0.1 0 0.2
Other Renewable 0 -0.9 -0.6 0 0.5 0
Total \2
100 100 100 100 100 100
Notes: \1
IGCC – integrated gasification combined cycle; IL – Illinois; ISO-NE – Independent System Operator - New England; WECC – Western Electricity Coordinating Council \2
Figures may not sum to 100, due to rounding.

Application of LCA to Nanoscale Technology: Li-ion Batteries for Electric Vehicles ▌pg. 55
Functional Unit Conversion
As noted previously, although the data were collected on a mass per kWh basis, the functional unit
applied for this study is on a per distance (kilometers driven) basis. Accordingly, the LCI data were
multiplied by the battery capacity, and then divided by the total distance driven over the lifetime of the
battery.
2.3.3 Limitations and Uncertainties
As described in Section 1.2.2, the service provided by the Li-ion batteries in the use stage is through the
vehicles into which they are placed. Although the use stage analysis of this study assessed impacts from
vehicles that use Li-ion batteries (PHEVs and EVs), the full life-cycle impacts of these vehicles were not
assessed. Accordingly, differences between varying components used for PHEVs versus EVs were not
considered (e.g., glider and drive train). Ideally, a full LCA of Li-ion batteries for electric vehicles would
include an assessment of the vehicles as well, not just the batteries. However, resource limitations
prevented the partnership from conducting a full LCA of the vehicles. Because of this, care must be taken
not to interpret the study results as representing those for the full life-cycle of a PHEV or EV vehicle.
To address this limitation, our study relied on the PSAT to model fuel economy and performance, as it
keeps the non-power train characteristics (e.g., drag coefficient, frontal area, wheel radius) constant across
vehicle types (see Table 2-4). In addition, key assumptions were made with respect to the vehicle
lifetime, total driving distance per year, and driving mix between highway and urban roads. The vehicle
fuel/electricity estimates were based largely on the Elgowainy et al. (2009) study.
One weakness that this creates in the model is the fact that there are likely to be differences in functional
battery lifetimes. The key assumption the partnership made was that the vehicle lifetime of 10 years is
equal to the battery lifetime across all chemistries. However, it is anticipated that the use of certain
chemistries, such as lithium iron phosphate, will result in many more battery cycles than lithium
manganese oxide spinel or lithium nickel cobalt manganese. Given the uncertainty with respect to this
assumption, it is addressed in the sensitivity analysis in Section 3.4.
Below we summarize additional limitations and uncertainties with the use stage LCI data:
Differences in battery weight as a result of material choice and engineering, as well as variance in
capacity, is a substantial source of uncertainty. Heavier batteries will tend to reduce the use stage
efficiency of the vehicle. A number of studies have looked at material choices in automobiles
and found substantial energy savings and GHG reductions possible with the use of lighter weight
metals, such as aluminum and high-strength steel (Stodolsky et al., 1995; Kim et al., 2010).
Findings from a study by Shiau et al. (2009) indicate that the impacts of battery weight are
measurable on life-cycle GHG emissions. Although there are differences in the weight of the
battery based on the chemistry (e.g., Li-FePO4 is heavier than a Li-MnO2-type battery), we did
not model differences in use-stage vehicle efficiency across battery chemistries.
The study assessed the impact of different grid mixes (i.e., ones that are more coal-centric to ones
using more natural gas and renewables) on the global warming potential impact category (see
Figure 3-1). However, we did not assess how changes to the grid over time would affect the other
impact categories.
Data for more recent fuel-specific electricity generation were not available (U.S. LCI data were
from the early 2000s); newer facilities will have different emission profiles.
Fully-speciated tailpipe emissions for PHEV-40 vehicles were not used; some likely VOC

Application of LCA to Nanoscale Technology: Li-ion Batteries for Electric Vehicles ▌pg. 56
components were still aggregated into the non-methane VOC block. This has the potential to
affect a number of categories, including human toxicity potential.
The study assumed linear scaling between PHEV and EV battery capacities, based on the energy
capacity required. It also assumed linear scaling for battery subsystem requirements.
2.4 End-of-Life Stage
As these Li-ion batteries for electric vehicles reach the end of their useful life over the next decade, they
will comprise an increasing percentage of the battery waste stream. The following section describes the
key recycling processes assessed as part of this study, background on the current and future trends with
respect to the generation, recovery, and disposal of Li-ion batteries, the methodology used to collect EOL
LCI data, and the results and limitations of the data collected.
2.4.1 Recycling Processes Modeled
Although there are currently limited regulations related to the disposal of Li-ion batteries, there is
incentive to collect the batteries for recycling, due to the value of the recovered metals. Rechargeable Li-
ion batteries contain cobalt, nickel, lithium, and other organic chemicals and plastics. The composition
varies, depending on the battery manufacturer (Xu et al., 2010). Historically, battery recycling focused on
recovering cobalt, as its value has risen significantly in response to increased demand from the battery
sector (Elliot, 2004). However, the use of cobalt in batteries is projected to decline as battery technology
evolves and other metals are used instead of cobalt (Elliot, 2004; Gaines, 2009).
In addition to cobalt, battery recyclers may also recover lithium, nickel, and other materials. The use of
lithium, in particular, is expected to increase, due to increased demand for Li-ion batteries in electric
vehicles. As of 2007, batteries accounted for 25% of lithium resource consumption; this amount is
projected to increase significantly (Gaines, 2009). Figure 2-8 presents an upper-end estimate of the
potential growth of lithium demand, which underscores the importance of curtailing the extraction of
virgin lithium to preserve valuable resources and reduce the environmental impact.
Figure 2-8. Upper-End Potential Effect of Recycling on Lithium Demand (Gaines, 2009)
Figure 2-9 shows the major EOL disposition options for Li-ion batteries used in electric vehicles. The
schematic shows that consistent with current practice, pre- and post-consumer batteries will be collected
for recycling. Although there are multiple recovery and recycling options, the figure illustrates those that
were assessed as part of the study. As described above, some waste from the recycling process will be

Application of LCA to Nanoscale Technology: Li-ion Batteries for Electric Vehicles ▌pg. 57
landfilled (estimated as <3% of the battery weight). The recovered metal will be further refined and used
for steel production or other applications. In addition, non-metals (e.g., plastics) may be refined and
recovered for use in new products.
Post-Consumer
Lithium-Ion
Battery Landfill (MSW)
Collection and
Sorting
Hydrometallurgical
Recovery Process
Pyrometallurgical
(High-Temperature)
Recovery Process
Non-metal
Processing
(e.g. plastic
recycling)
Battery Recovery
Processing of
Recovered Metals
Direct Recycling
Process
Pre-Consumer
Lithium-Ion
Battery
Figure 2-9. Generic Process Flow Diagram for End-of-Life (EOL) Management for Li-ion Batteries
Sources: EPA, DfE/ORD Li-ion Batteries and Nanotechnology for Electric Vehicles Partnership; Olapiriyakul, 2008.
There are several recycling processes that may be used to recover materials from the batteries. In this
study, we assessed the (1) hydrometallurgical process, (2) high-temperature or pyrometallurgical process,
and (3) direct recycling process; each process is described below.
Hydrometallurgical Recovery Process: The hydrometallurgical recycling process can be
applied to a variety of lithium battery chemistries. Under this process, the batteries are first
collected, inspected, and sorted by chemistry. Next, the batteries are fed via a conveyer belt to a
hammer mill to remove the paper and plastic. Once prepared, the batteries are processed in a
tank, using a feed of alkali process solution (lithium brine) to further shred the cells. The
materials are then separated to recover the scrap metal and remove any other non-metallic
materials (Toxco, 2010). Four streams result from this process, including:
1. Copper cobalt product: mixture of copper, aluminum, and cobalt.
2. Cobalt filter cake: mixture of cobalt and carbon.
3. Li-ion fluff: mixture of plastics and some steel.
4. Lithium brine: dissolved electrolyte and lithium salts (Toxco, 2009).
The copper cobalt product and cobalt filter cake, which comprise about 60% of the battery feed,
are sold for further processing to metal refiners. The Li-ion fluff (about 30% of battery feed) is
either disposed or sold to steel refiners. The fluff may contain as much as 65% steel, depending
on the battery feed. Finally, the brine undergoes further processing, where it is recovered as
lithium carbonate (Toxco, 2009; Toxco 2010).
Pyrometallurgical (High-Temperature) Recovery Process: Pyrometallurgical recovery relies
on a high-temperature smelting process to recover the metals and other materials. This process
allows recycling of a variety of end-of-life (EOL) lithium-ion batteries based on different
chemistries. Under this process, the unsorted and untreated EOL batteries are fed into a high

Application of LCA to Nanoscale Technology: Li-ion Batteries for Electric Vehicles ▌pg. 58
temperature smelter, where the scrap is heated to temperatures of 1,250 degrees Celsius in an
oxygen environment. (Depending on battery weight and size, some batteries may be dismantled
by considering the process efficiency and the environmental impacts.) Through the smelter
process, the metal oxides are converted to their metallic form, a molten metal alloy (e.g.,
containing cobalt and nickel). The metal alloy is further refined for use as new battery cathode
material. The slag generated by the smelting process contains lithium. Lithium may also be
valorized either by recovering when the recovery process is economically feasible and
environmental friendly compared to the natural lithium extraction methods, or by its use in
concrete applications (Umicore, 2009). The slag is also suitable to be used in road construction or
other applications (Umicore, 2009; Olapiriyakul, 2008).
Direct Recycling Process: Under the direct recycling process, the battery components are first
separated using physical and chemical processes to recover the metals and other materials. Next,
to generate materials suitable for reuse in battery applications, some of the recovered materials
may need to undergo a purification or reactivation process. The direct recycling process, which is
still in the pilot stage, may allow for a higher percentage of recovered battery materials. In
addition, the process typically requires a lower temperature and energy usage (Gaines, 2010).
Once the batteries reach their end-of-life, it may be possible to refurbish them so they may be used for
other applications. For example, cells from a lithium battery for vehicles could conceivably be
refurbished and used for computers or other types of electronics (Partnership, 2010). Another option
currently being researched and tested is to rejuvenate the battery cells with new electrolyte. As battery
cells age, the electrolyte materials break down, and contaminants are deposited on the electrodes. Under
a recent patent by General Motors, the company has developed a technology to treat the cells to remove
the contaminants and replace the electrolyte solution. Ideally, under this method the cells could be reused
in the vehicle itself (Harris, 2010). To date, however, refurbishment and rejuvenation options are not well
defined, and additional research into testing and safety standards are being conducted. Once Li-ion
batteries are disposed of on a large scale, the percentage of batteries that undergo refurbishment can be
expected to rise (Partnership, 2010).
2.4.2 Methodology and Data Sources
LCI data for each recycling process were provided by three recyclers participating in the partnership. LCI
data were provided on a mass basis. Accordingly, the data were converted to a per kilometer basis, by
dividing the mass of the battery by the total distance driven over the life-time of the vehicle (193,201
kilometers), and assuming that amount as the input to the end-of-life stage.
In addition to the LCI data, the recyclers also provided a range in the recovery of the materials present in
the Li-ion battery (see Table 2-9). Because some battery recycling technologies specifically designed for
electric vehicles are still under development, there is uncertainty about the actual amount of material that
will be recovered once the recycling processes are fully operational, and larger volumes of batteries are
recycled. The recovery rates presented in Table 2-9 are based on currently achievable yields.
Recovery and reuse in this case does not specifically denote reuse in lithium-ion battery applications.
Rather, it is reuse in any application as a useful input, ranging from reuse of cathode active material to use
as filler in construction materials. The primary benefit modeled is the displacement of virgin material
from the industrial supply chain. For example, if recycling method A produces 0.1 kg of lithium
carbonate from 1 kg of battery, the impacts of the actual recycling of this kilogram are partially offset by
the benefit of one less tenth of a kilogram of virgin lithium carbonate in the system. This is, by our own

Application of LCA to Nanoscale Technology: Li-ion Batteries for Electric Vehicles ▌pg. 59
admission, a simplistic method of modeling the benefits of recycling and does not take into account a full
counterfactual scenario. There are a number of considerations that complicate the picture, including the
economics of the secondary market, acceptance of recycled material by OEMs, and uncertainty
surrounding the true baseline (i.e., what is the appropriate counterfactual scenario to battery recycling?).
However, we believe that this simple method gives a good first-cut approximation of the benefits of
lithium-ion battery recycling.
Table 2-9. Range of Recovery and Reuse in EOL
Material Percent Recovered
Cobalt 60–99.9%
Nickel 60–99.9%
Iron 60–90%
Copper 80–99.9%
Carbon 70–99%
Lithium 80–90%
Manganese 60–90%
Separator 75–99.9%
Aluminum 70–99%
Steel 90–99.9%
Electrolyte 70–90%
PWB \1 80–99%
Plastics 55–99.9%
Note: \1
PWB = printed wire board
2.4.3 Limitations and Uncertainties
Similar to the manufacturing stage, data for the EOL stage were primarily obtained from battery
recyclers. Accordingly, limitations and uncertainties related to the data collection process include the fact
that companies were self-selected, which could lead to selection bias (i.e., those companies that are more
advanced in terms of environmental protection might be more willing to supply data than those that are
less progressive in that regard). Companies providing data also may have a vested interest in the project
outcome, which could result in biased data being provided. The employment of the Core Group as
reviewers in this project was intended to help identify and reduce any such bias (e.g., manufacturers or
recyclers checking to ensure that other submitter data is in line with industry norms).
Furthermore, the data provided by the recyclers were based on current recycling processes. However,
given the fact that Li-ion batteries for vehicles are a nascent market and many batteries have not reached
the end of their useful life, most of the recycling processes currently do not recycle large volumes of Li-
ion batteries for vehicles. The recyclers who participated in this study all noted that they are retrofitting
their current processes in anticipation of a larger volume of Li-ion batteries for vehicles. To this end, LCI
data for the direct recycling process were based on pilot data provided by the recycling company.
Assumptions about the disposition percentages may not truly represent the actual dispositions. For
example, our analysis currently assumes that all of the batteries will be recovered for recycling, regardless
of the chemistry or vehicle type. Furthermore, there is uncertainty with respect to the percentage recovery
of materials in Li-ion batteries. Our analysis assumed a best-case scenario of the recovery for the
materials in the Li-ion battery, which is assessed further in the sensitivity analysis in Section 3.4. Some
credit was also given to reuse of materials in batteries themselves, but in some cases the analysis also
gave credit to reuse in other applications. In addition, the analysis assumed no further refinement/
purification is needed before the direct displacement of virgin materials. Such assumptions are likely to
be optimistic, especially in the first years of significant EV and PHEV-40 battery recovery.

Application of LCA to Nanoscale Technology: Li-ion Batteries for Electric Vehicles ▌pg. 60
Finally, although primary data were obtained from the recyclers, secondary data from GaBi4 were used
for the eventual disposition of some waste products from the recycling process into a landfill. The landfill
processes used are for generic industrial waste, and do not represent the specific metal and plastic mix
associated with Li-ion battery waste.
2.5 LCI Summary
The LCIs for each life-cycle stage for the Li-ion batteries in electric vehicles are the combinations of the
upstream, manufacturing, and EOL data described in the preceding sections. Figure 2-10 presents a
summary of the LCI data collected for each process in the Generic Process Flow Diagram for Li-ion
Batteries for Electric Vehicles. As presented in the figure, primary data (obtained directly from a battery
manufacturer or recycler) were obtained for the component manufacture, product manufacture, and EOL
stages (Stages C, D, and F in the diagram). Secondary data were needed to supplement data gaps and
protect confidential data. These data were primarily obtained from the following studies:
Contribution of Li-ion Batteries to the Environmental Impact of Electric Vehicles (Notter et al,
2010).
Life-Cycle Environmental Assessment of Lithium-Ion and Nickel Metal Hydride Batteries for
Plug-in Hybrid and Battery Electric Vehicles (Majeau-Bettez et al., 2011).
Comparative Environmental Life-Cycle Assessment of Conventional and Electric Vehicles
(Hawkins et al., under review).
LCI data available within GaBi4 were also used for upstream materials and fuel inputs, as the scope of the
project and resources were limited to collecting primary data from the product manufacture and recycling
stages. These datasets included EAA (2008), NREL‘s U.S.LCI, and proprietary GaBi processes
developed by PE International. For the use stage, LCI data for the gasoline process were also obtained as
a GaBi proprietary process. However, the power grid data relied on a combination of EIA (Energy
Information Administration) and U.S. LCI data, as follows:
The EIA data were used to understand the make-up of the grid by fuel type (e.g., proportion of
coal, natural gas, and renewables);
The U.S. LCI provided inventory data for each of these energy sources.
Although LCI data for most of the components and processes were identified through primary or
secondary sources, below we highlight key uncertainties, limitations, and assumptions with respect to the
data:
Limited primary data for battery cell and pack manufacture were available, which required
reliance on additional secondary sources of data, to address data gaps and protect the
confidentiality of the data.
The same size BMS and other pack sub-systems was assumed across chemistries, when in reality
there may be differences.
It was assumed that all components scale linearly into the battery pack, to meet capacity
requirements for PHEVs and EVs.
There is uncertainty with respect to the actual lifetime of batteries in automobiles. In addition,
there may be differences in lifetime across chemistries. LiFePO4 batteries may have a longer
useful life than other battery chemistries, due to their ability to weather a greater number of
charge-discharge cycles.

Application of LCA to Nanoscale Technology: Li-ion Batteries for Electric Vehicles ▌pg. 61
In the use stage, changes in the grid over time, from more coal-centric sources to ones using more
natural gas and renewables, will influence the LCI data and impacts in this stage. Although data
on current grid mixes were available, the study did not seek to obtain data on how the mix of the
grid would change over time.
LCI data were based on current recycling processes, which do not recycle large volumes of Li-ion
batteries for vehicles at present. Recovery and eventual disposition of materials will be better
characterized as the volume of battery waste increases and markets for recovered/recycled
materials emerge.
The recovery of the materials and credit for reuse was assumed using a best-case scenario.
To address some of these limitations, we conducted a sensitivity analyses on some of the key
assumptions, including the life-time of the battery, grid and charging assumptions, and the recovery
of the materials. This is discussed in detail in Section 3.4.
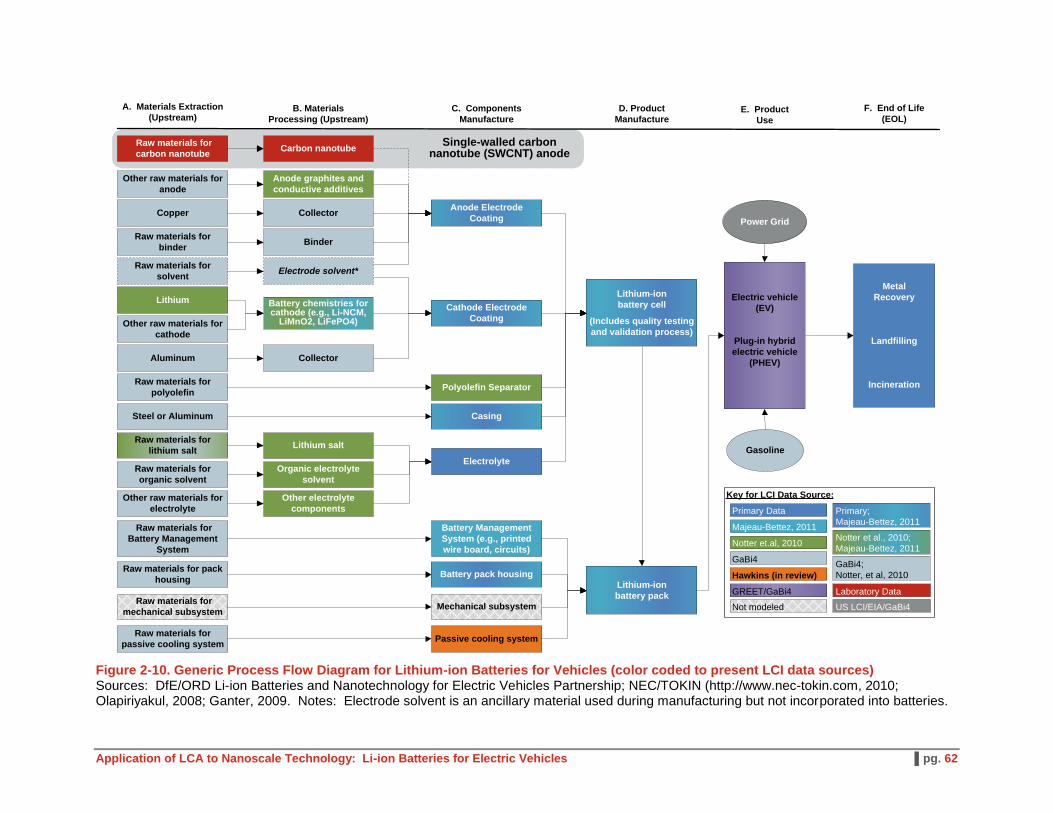
Application of LCA to Nanoscale Technology: Li-ion Batteries for Electric Vehicles ▌pg. 62
A. Materials Extraction
(Upstream)B. Materials
Processing (Upstream)
C. Components
Manufacture
D. Product
Manufacture
Anode Electrode
Coating
Cathode Electrode
Coating
Electrolyte
Casing
Lithium salt
Carbon nanotube
CollectorCopper
Lithium Battery chemistries for cathode (e.g., Li-NCM,
LiMnO2, LiFePO4)
Aluminum
Raw materials for
carbon nanotube
Other raw materials for
cathode
Polyolefin SeparatorRaw materials for
polyolefin
Other raw materials for
anode
Organic electrolyte
solvent
Raw materials for
lithium salt
Raw materials for
organic solvent
Lithium-ion
battery cell
(Includes quality testing
and validation process)
Lithium-ion
battery pack
E. Product
Use
Electric vehicle
(EV)
Plug-in hybrid
electric vehicle
(PHEV)
F. End of Life
(EOL)
Metal
Recovery
Landfilling
Incineration
Single-walled carbon nanotube (SWCNT) anode
Anode graphites and
conductive additives
BinderRaw materials for
binder
Other electrolyte
components
Other raw materials for
electrolyte
Steel or Aluminum
Power Grid
Gasoline
Battery pack housing
Battery Management
System (e.g., printed
wire board, circuits)
Mechanical subsystem
Passive cooling system
Raw materials for pack
housing
Raw materials for
Battery Management
System
Raw materials for
mechanical subsystem
Raw materials for
passive cooling system
Electrode solvent*
Hawkins (in review)
Laboratory Data
Notter et.al, 2010
Primary Data
Majeau-Bettez, 2011
Primary;
Majeau-Bettez, 2011
Notter et al., 2010;
Majeau-Bettez, 2011
Not modeled
GaBi4;
Notter, et al, 2010
GaBi4
Raw materials for
solvent
Collector
US LCI/EIA/GaBi4
GREET/GaBi4
Key for LCI Data Source:
Figure 2-10. Generic Process Flow Diagram for Lithium-ion Batteries for Vehicles (color coded to present LCI data sources) Sources: DfE/ORD Li-ion Batteries and Nanotechnology for Electric Vehicles Partnership; NEC/TOKIN (http://www.nec-tokin.com, 2010; Olapiriyakul, 2008; Ganter, 2009. Notes: Electrode solvent is an ancillary material used during manufacturing but not incorporated into batteries.